1. Introduction
The World Health Organization (WHO) defines eHealth as the electronic transfer of health resources and health care. This definition encompasses three main areas: (1) delivery and exchange of health information for health professionals and consumers through the Internet and telecommunications; (2) use of information technology and eCommerce to improve public health through education and training; and (3) practical use of electronic commerce (eBusiness) in the management of health systems.
Internet and new communication technologies offer a new framework for the dissemination of information, interaction and collaboration between institutions, health professionals and users [
1]. eHealth, therefore, provides new methodologies for the use of health resources such as information, money and medicines, in order to improve and streamline these resources [
2].
Nowadays a form of eHealth is already in operation in developed countries for monitoring both sick and healthy patients, employing telematic equipment to log physiological signals. This equipment is mostly confined to hospitals, intensive care units (ICUs), primary and outpatient care. However, eHealth is an emerging and a promising field with great perspectives, e.g., telemedicine, which allows professionals to monitor individuals or groups of people, such as athletes, the disabled, patients with chronic illnesses, or the elderly. Also, in the case of risk groups or sectors of the population with disadvantaged economic and social situations, telemonitoring has a huge potential for analyzing pandemics, possible birth defects, phobias and other possibilities. A study about the role of eHealth in optimizing preventive care in the primary care setting has been recently published [
3].
Currently, there is increasing interest in eHealth applications as the medical field is one of the most fertile areas for the use of such technology [
4,
5]. There are many different electronic devices based on System-on-Chip that allow a patient or a group of patients to be monitored by gathering information on their biosignals in order to keep a check on their well-being [
6]. Through the FP7 (Seventh Framework Programme) and H2020 (Horizon 2020) [
7] the European Commission has funded several projects aimed at eHealth monitoring. Among different them, the most important for our purposes are eHealthMonitor, aimed at developing a platform for individualized personal healthcare services [
8], and iCARDEA, aimed at designing an intelligent platform for personalized remote monitoring of cardiac patients with electronic implant devices [
9]
Other Spanish national projects, like Telemac, HELP or METABO [
10,
11] have been developed in order to monitor patients with COPD (Chronic Obstructive Pulmonary Disease), Parkinson’s disease or diabetes. By using several sensors, they have monitored different subjects, tracking and controlling treatments, lifestyle, physiology or physical activity, with the aim of providing and improving the information and necessary control over a disease, and ensuring a better quality-of-life for the patient, as well as increased life expectancy. The results have been positive, as monitoring has improved treatments and consequently the quality-of-life of patients [
11], although the cost of these systems is high.
This paper aims to provide and evaluate a system that facilitates communication between medical professionals and patients or athletes. A telemonitoring system based on an eHealth sensor board [
12] has been implemented and provides follow-up on athletes and measures vital physiological parameters, such as pulse, blood pressure, electrocardiogram, electromyogram, oxygen saturation in blood, airflow, skin galvanic response, position, temperature and the parameters of interest for follow-up on athlete training or the patient. In addition, a database with a data model that fulfills all the requirements of protection and data safety has been designed and hosted by a web server, where the physiological data provided by authorized personnel are stored for use at any given time [
13]. Also, a data fusion procedure was used to send a unified information and estimate the most probable state of the patients. This work was aimed at monitoring sports activities, but it could be used in other more complex scenarios, such as the case of developing countries with few economic resources and technology. Finally, a WiFi-based network using different sensor devices has been measured in order to evaluate the network requirements for a complete sport team (although it could also be applied for any other medical application with multiple patients).
The rest of this paper is organized as follows: the
Section 1 shows an introduction about the problem that this paper solves.
Section 2 describes the multisensor eHealth monitoring system (architecture of the multisensor system and its calibration, database and data model and the multisensor cloud data fusion).
Section 3 shows the performance of the proposed system when working with several athletes and we compare our system with other works. Finally,
Section 4 presents the conclusion of this paper and some future works.
2. eHealth Monitoring System
In this section, we show how the eHealth monitoring system is implemented. This section is divided into two subsections: the first one explains the system-on-chip platform used to develop our monitoring system. Finally, the last subsection exposes the multisensor cloud data fusion technique used to determine the athlete’s fatigue status.
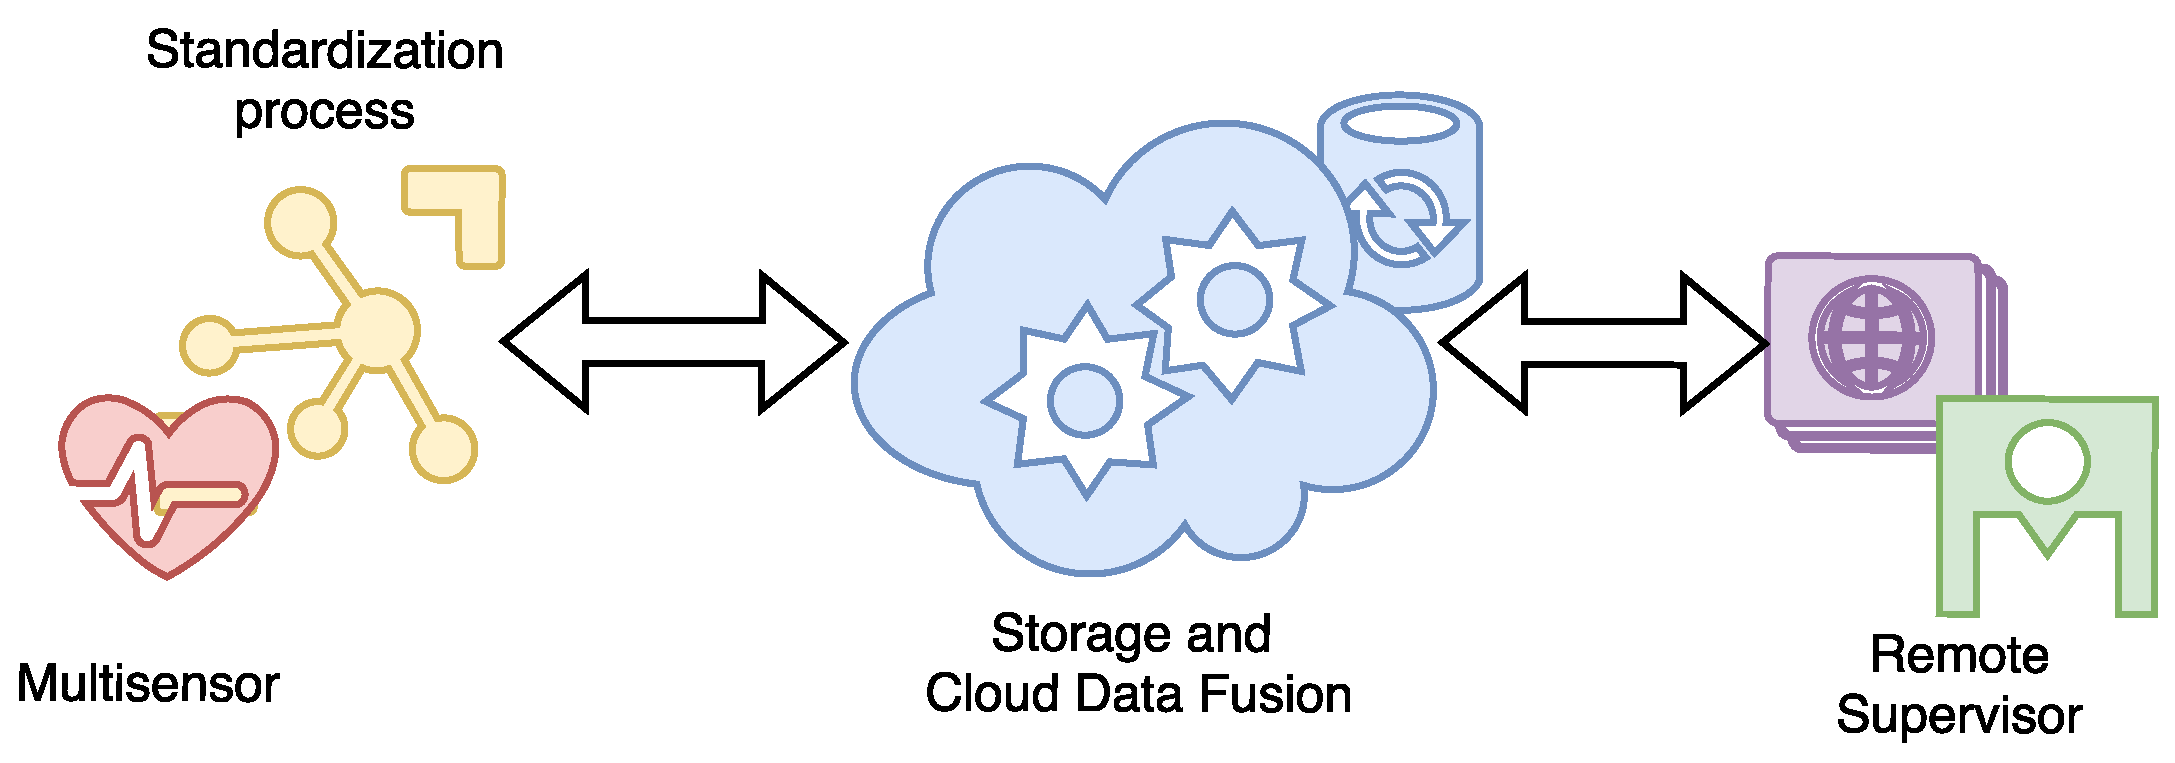
Our system is based on a distributed architecture (see
Figure 1), where physiological data of a person are collected by several sensors, next a System-on-Chip platform joins the information and makes a standardization process, then these data are sent to Cloud to be processed. The Cloud system stores the received data and makes a data fusion process in order to know the athlete’s fatigue status at every moment. These information will be sent through secure protocols (e.g., HTTPS) to remote supervisors in order to check the state of the monitored user.
2.1. Multisensor System-on-Chip Platform
The use of System-on-Chip (SoC) platforms is widespread in monitoring applications. In order to develop our eHealth monitoring system, we have used an SoC platform, named Raspberry Pi (RPi), and an interface stage for the different sensors. The RPi platform is based on Broadcom BCM2835 System on a Chip, including an ARM1176JZF-S 700 MHz processor, a Graphic Processing Unit (GPU) and 512 MB of RAM, with a SD slot card memory [
12]. We installed in the RPi a WiFi adapter TP-Link TL-WN725N with IEEE 802.11 b/g/n standard.
The sensor interface is the eHealth Cooking Hacks monitoring shield, which allows physiological and medical applications to be conducted. This shield can connect different sensors, such as pulse and oxygen saturation in blood sensor (SPO2), airflow sensor (spirometer-based), body temperature sensor (PTC), electrocardiogram sensor (ECG), galvanic skin response sensor (skin conductance) (GSR), electromyography sensor (EMG), blood pressure (sphygmomanometer) sensor, and position sensor (accelerometer).
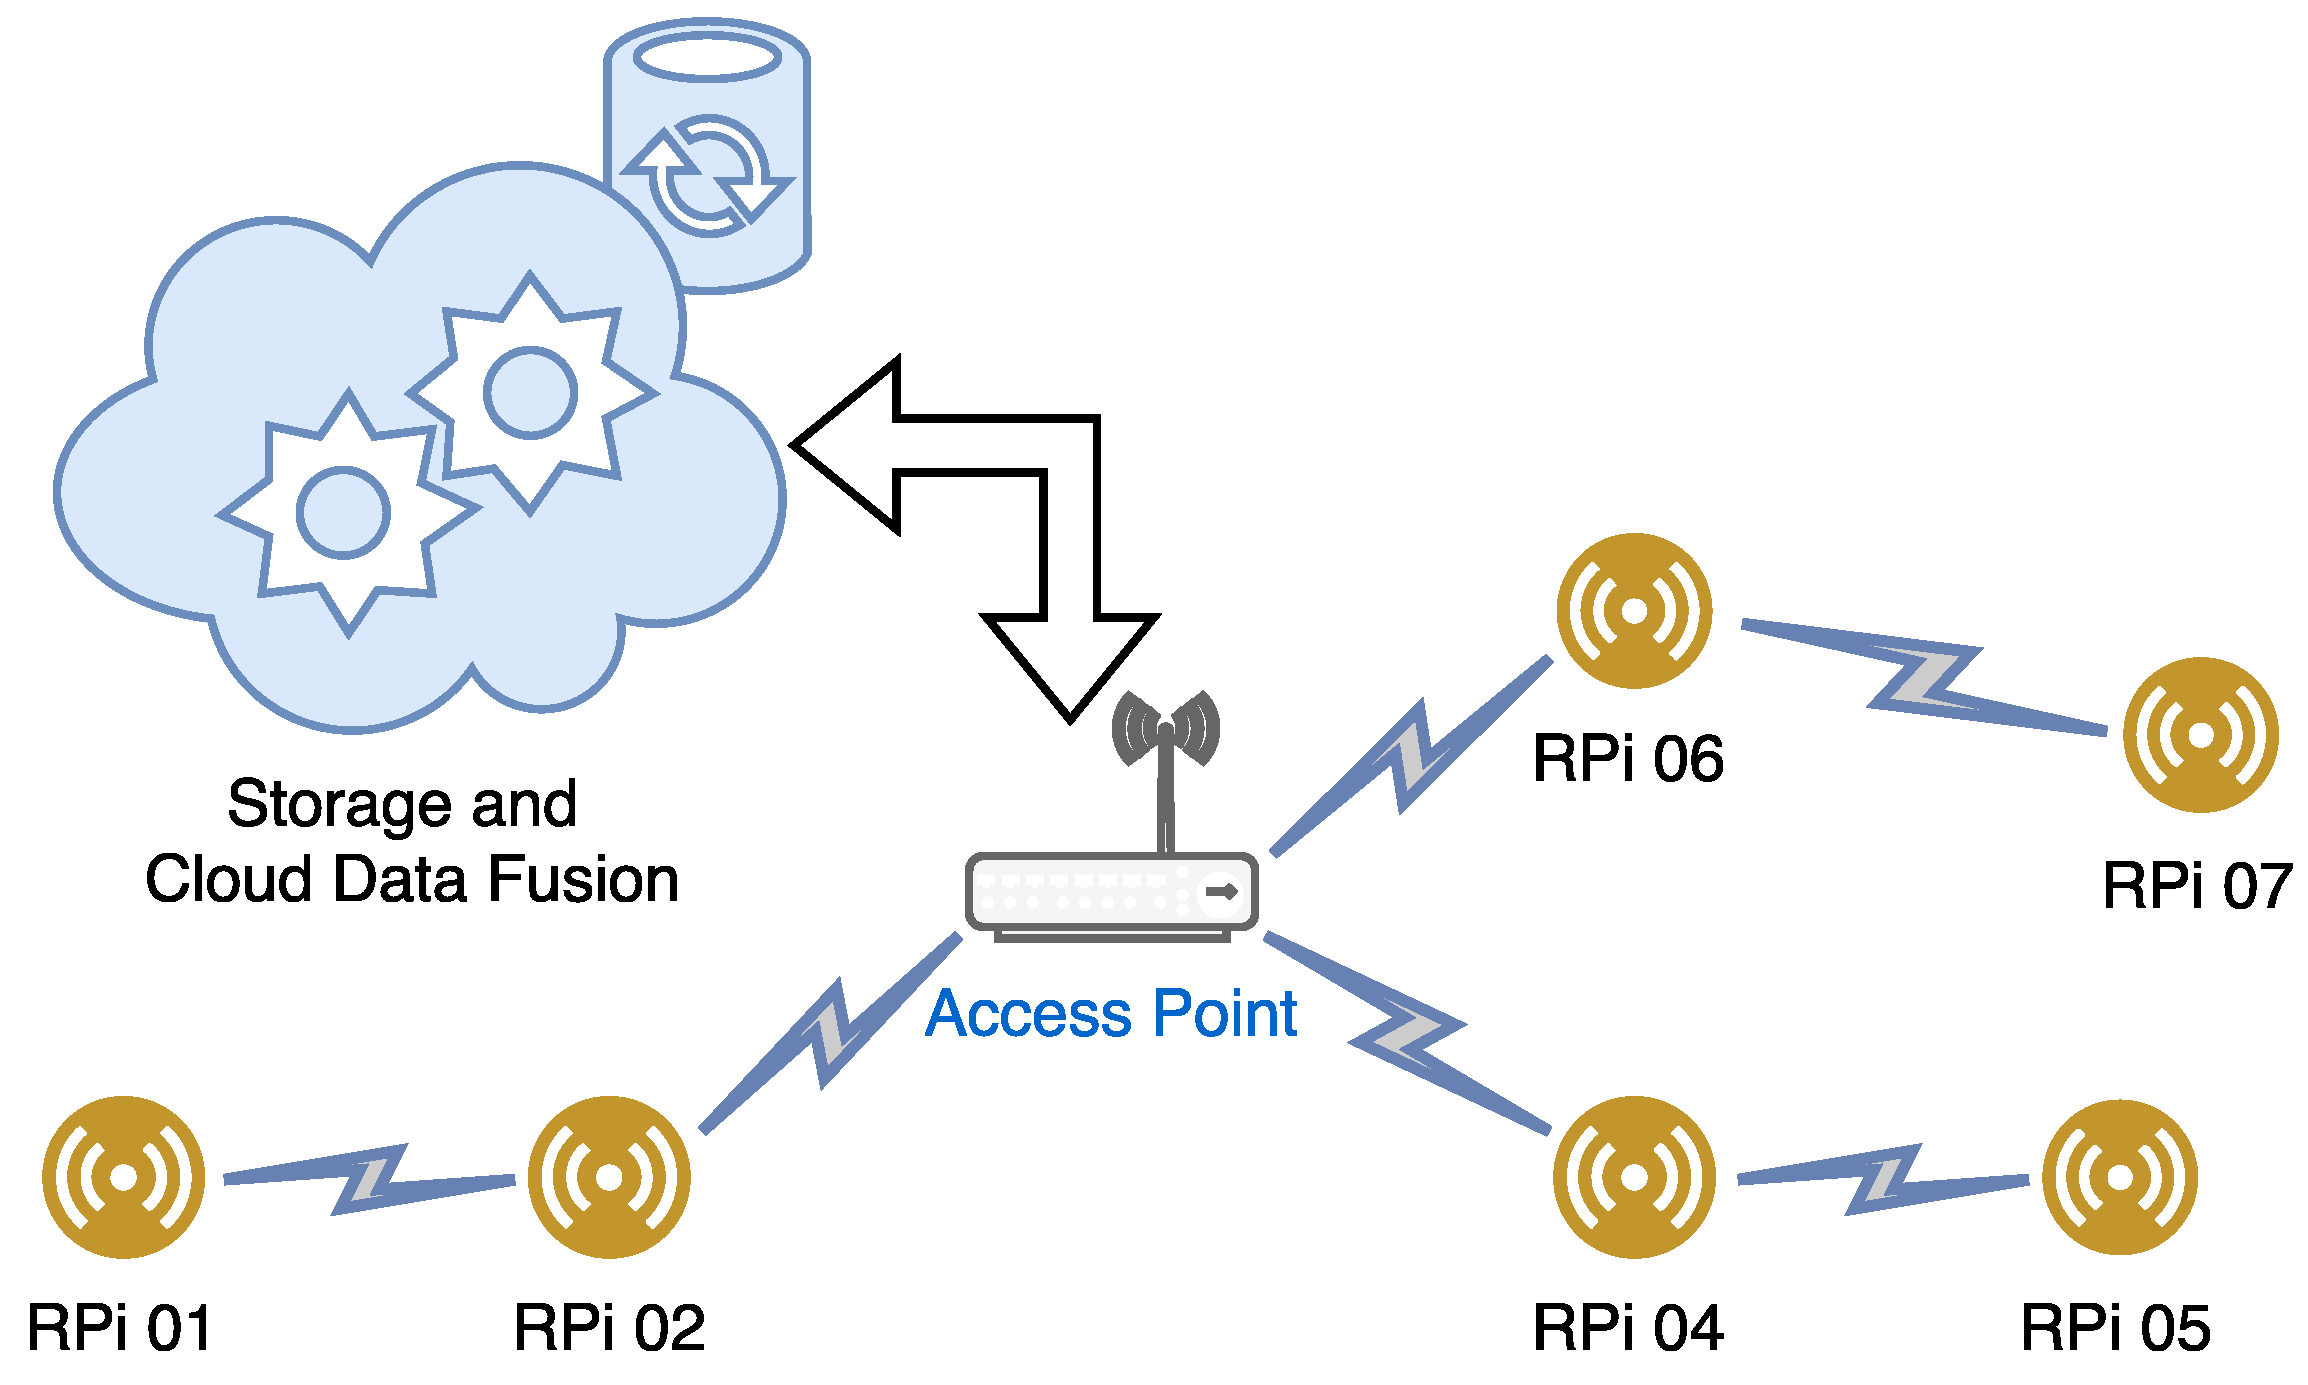
We installed in the RPi a Raspbian Operating System [
12], which is a GNU/Linux version optimized for RPi hardware, based on a Debian distribution. These nodes are in charge of carrying out the standardization process. This process is necessary because it is very important that the data arrive as uniform as possible to be able to perform fusion tasks in real time in the cloud. These RPi hardware are connected to our cloud system using an infrastructure connection with APs (Access Points) or with wireless mesh network. This type of partial mesh network (see an example in
Figure 2) introduces self-organization and self-configuration in the proposed system, which can reduce installation overhead. The ability to self-configure enables dynamic distribution of workloads, particularly in the event that a few nodes should fail. This in turn contributes to fault-tolerance and reduced maintenance costs. In order to implement the wireless mesh network, we used the Babel routing protocol, which is loop free, proactive and based on a distance vector algorithm. Babel is implemented in the Quagga routing software suite [
14], with GPL license.
We also configured a Cloud-based system, called ThingSpeak [
15], in order to gather the information from the different sensors into one system, connected to the Internet. This system allows storing and automatic synchronization of the information from the different biosensors on each patient being monitored. Also allows data processing for data fusion with a Matlab interface.
Also a PHP (Hypertext Preprocessor) webserver with MySQL database [
16] was installed in another computer. This computer connects the patient information with the processed biosensing information coming from the IoT system.A PHP script on the server poses the appropriate query to ThingSpeak database in order to gather the biosensors’ data, process, and then record and store these data on the database with the corresponding patient data. This information is available to authorized personnel. The database has been implemented on a Relation-Entity (R-E) scheme.
2.2. Multisensor Cloud Data Fusion
As we can see in the previous subsection, our proposal is based on a multisensor network, but this does not mean that all sensors provide the same valid information to determine the correct state of the athlete. There are always some sensors that provide more important information to know the state of the athlete. It is true that, data integration of sensors provides better results than working only with the information of each one separately [
17]. For these reasons, we have to select a suitable method to perform a correct data fusion.
Our multi-sensor data fusion algorithm is based on the Dempster–Shafer inference theory of evidence [
18]. This method is used when the sum of information, provided by the data sources (sensors), cannot be associated with 100% of the probability of success. This algorithm captures and combines certainty using the Dempster’s rule, which finds the intersection or conjunction of events identified by information sources and their associated probabilities [
19]. There are three important functions in Dempster-Shafer theory: the
function (
m), the
function (
), and the
function (
).
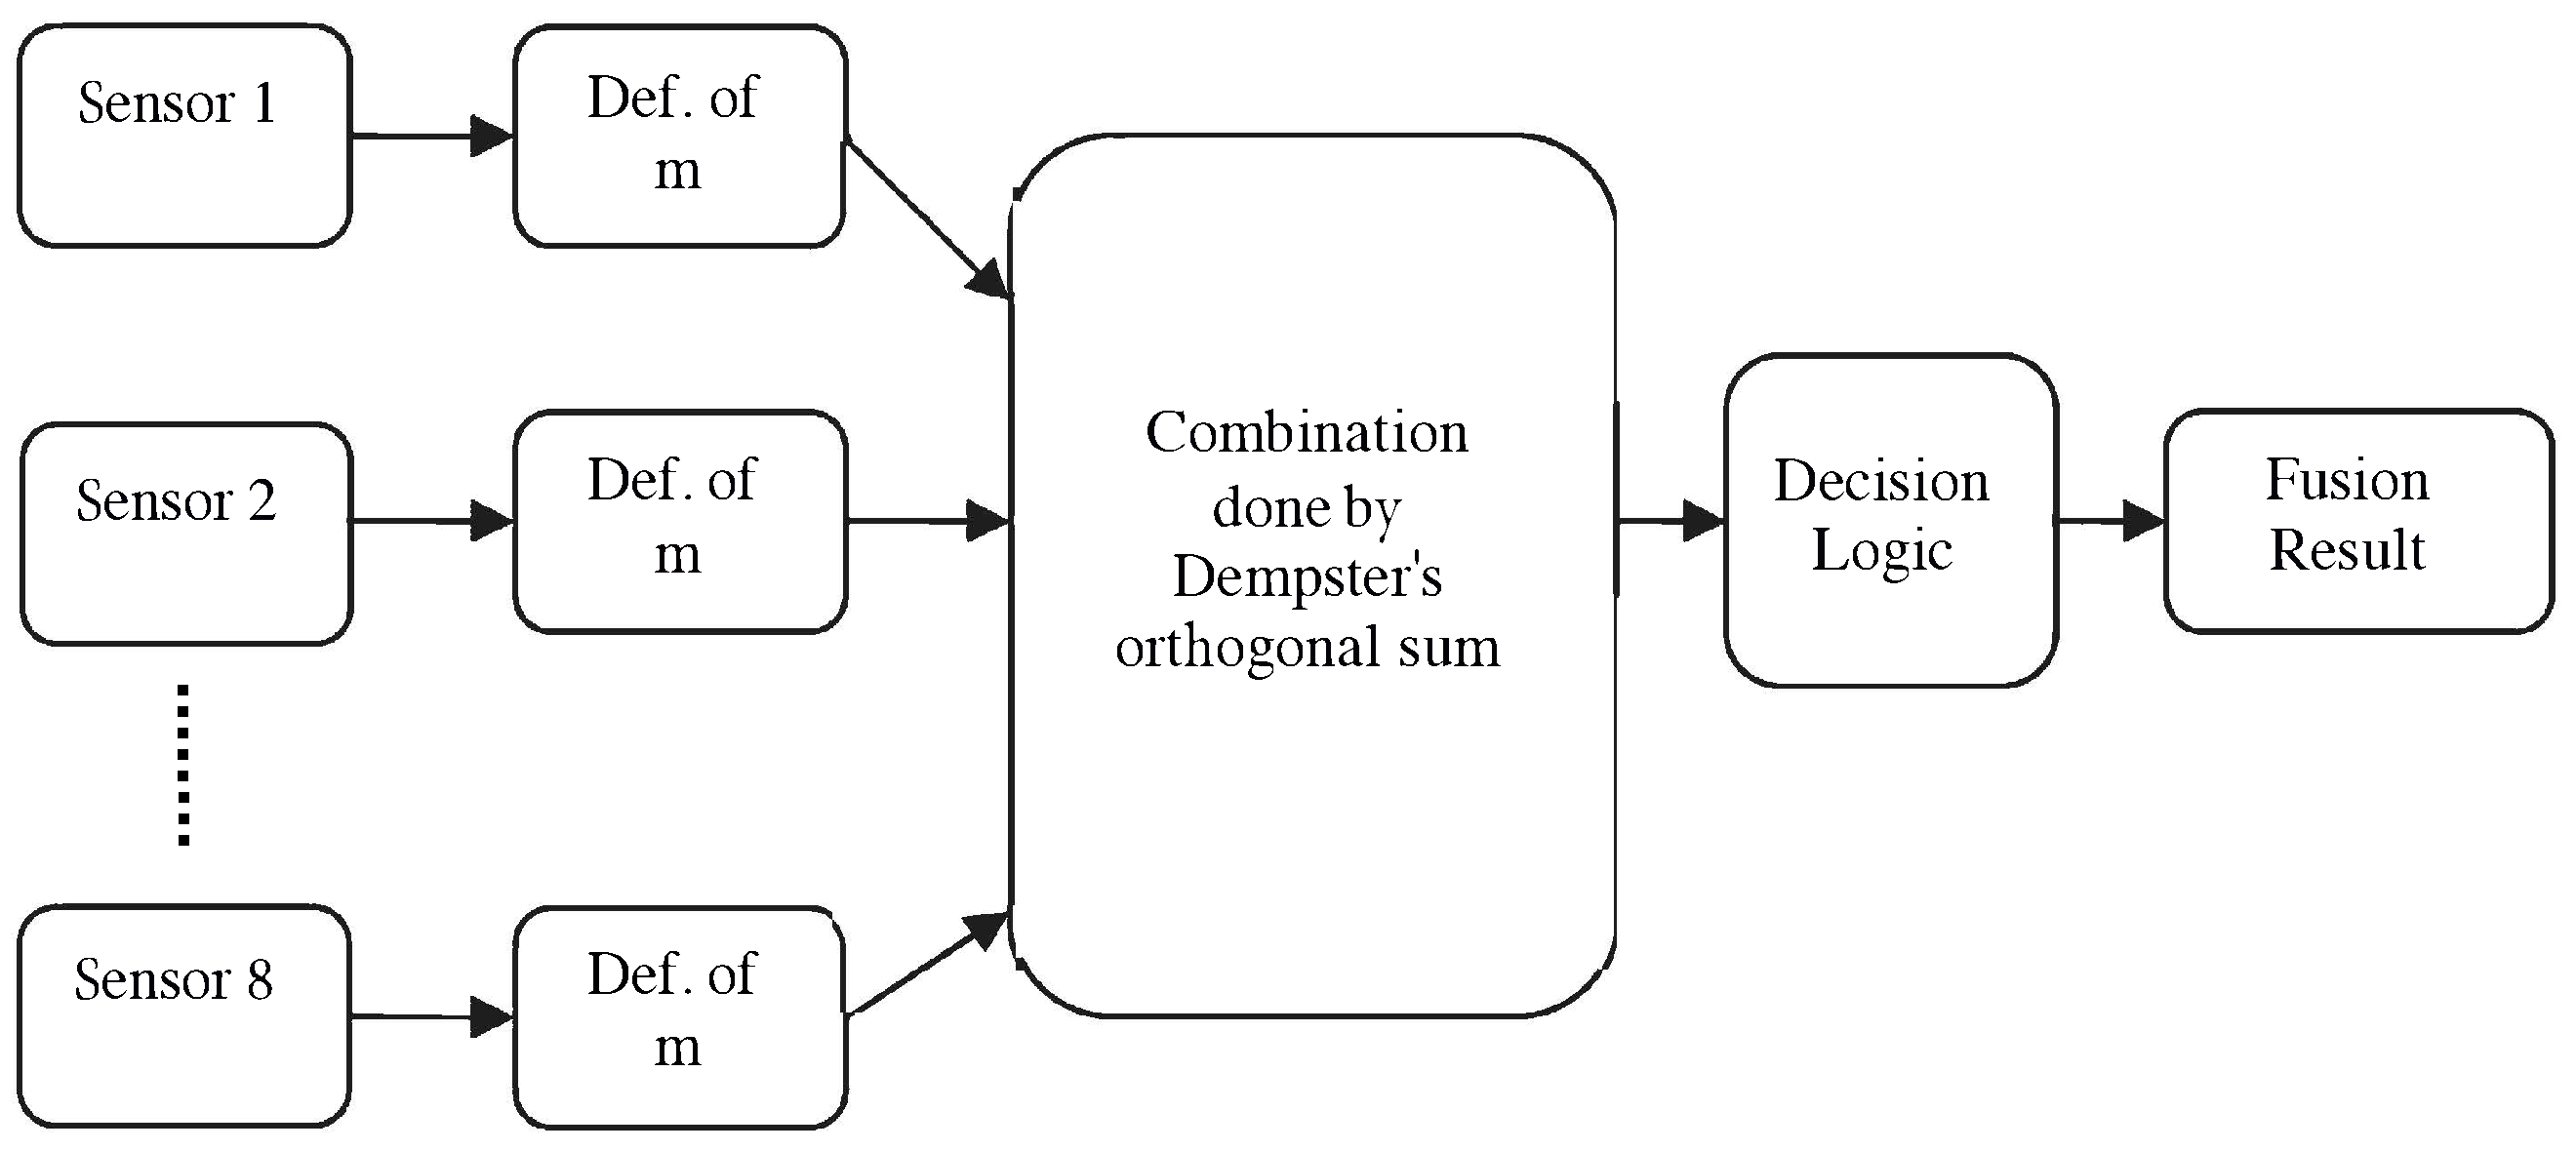
Being use our data fusion algorithm, our system will be able to determine the state of fatigue and/or events (denoted as D) related to monitoring process in athletes. As we can see in the previous subsection, our system has 8 sensors. The information of sensor
i is represented by
, which assigns values to each of the subsets of the discernment set D (set of events considered), ignoring how these values are divided into the subset (see
Figure 3).
The combination is done by Dempster’s orthogonal sum, for 8 sources is:
where
A,
, …,
are subsets of
D and
k is:
Also the definition of two parameters like
belief and
plausibility, defined as for all the athletes (set
A):
and
Defining as the set of states to evaluate, we can establish the final decision according to the following criteria:
Maximum credibility rule: the most probable state is the one with more credibility,
Maximum plausibility rule: the most probable state is the one with more plausibility,
In our system, we have defined five states (, , , and ), where fatigue increases according to the state. The state corresponds to the rest state and is associated to high fatigue state. Our system works with instant values and with a moving average with four minutes window. The use of these values allow the system to know the status of the athlete in real time and also evaluate their recovery phase, a very important aspect in athletes.
Table 1 shows a health-status classification in terms of the pulsioxymeter ranges, the thermometer ranges, the GSR device ranges and the air exhalation sensor ranges (in terms of breathing amplitude and breathing rate). After a measurement session with three athletes, the interval values obtained for eight parameters in each state (
) are shown in
Table 2. Depending on the optimum values of the parameters, each
value is obtained by considering a mapping function limited to 1 [
20].
According to the Dempster-Shafer’s model described, the average values of the measured parameters, shown in
Table 2, establish the maximum plausibility at the fatigue state
with a value of 0.93.
3. System Performance
In this section we are going to show the behavior of our system when we have a network bigger than three athletes. Moreover, we have done a comparison between related work and our proposal, where we show the main features of each work and their differences with the proposed eHealth monitoring system.
3.1. Test Bench
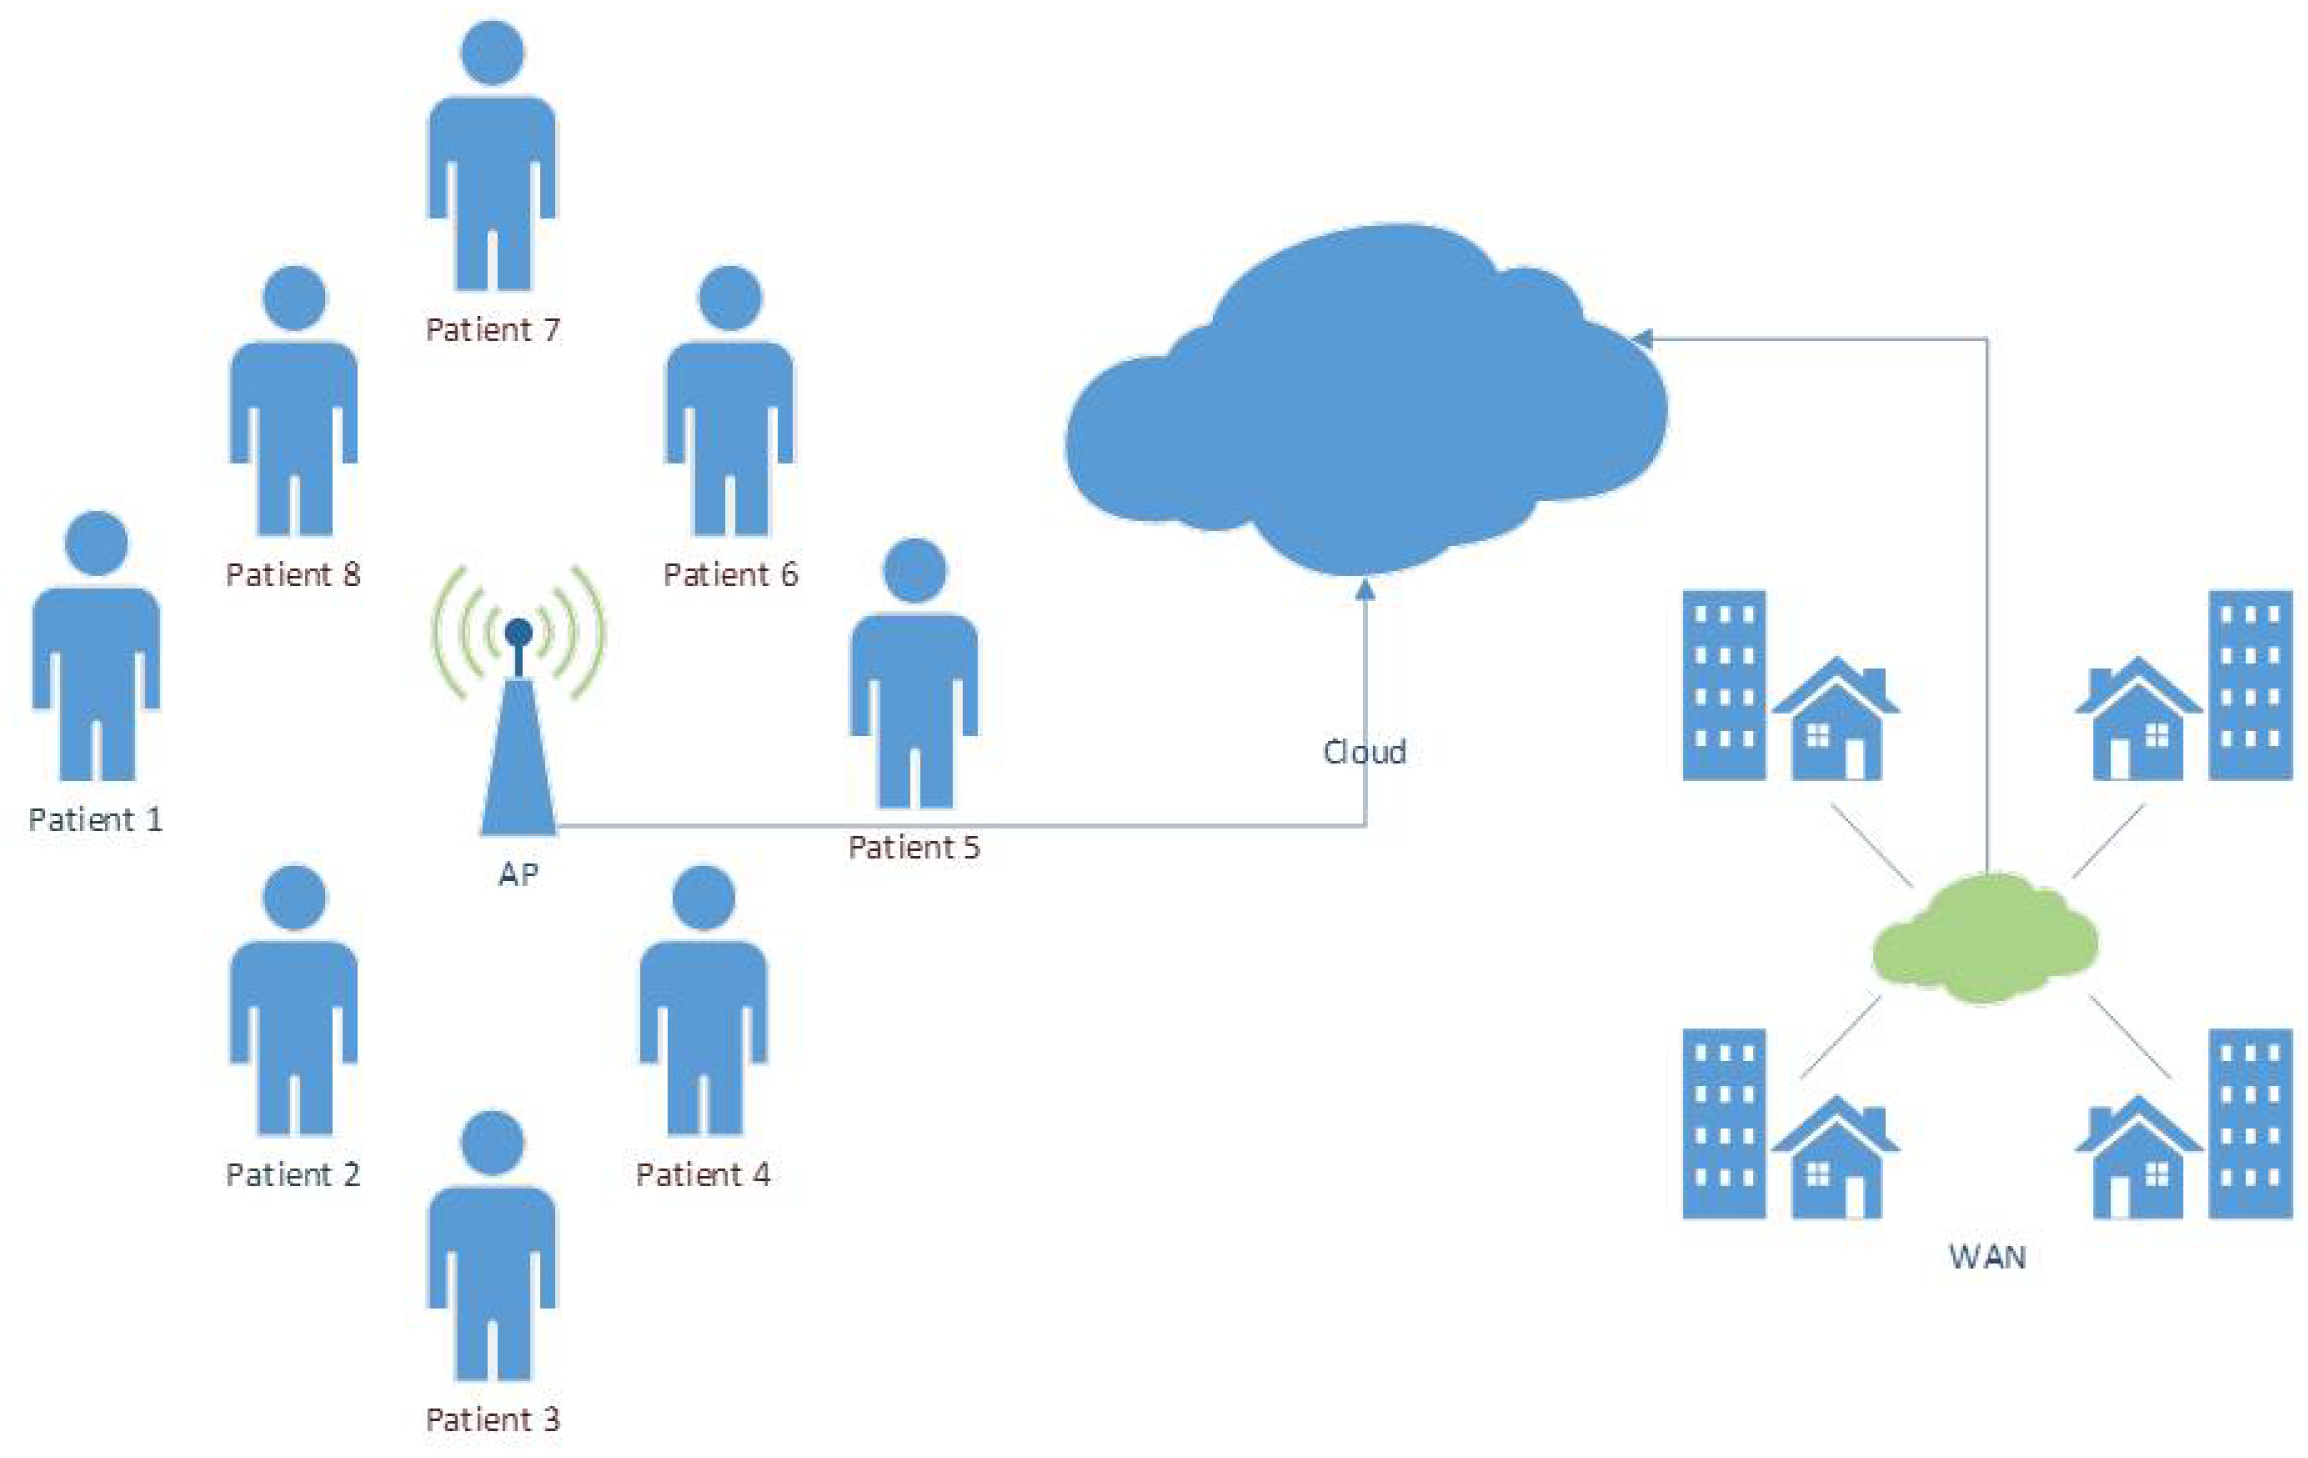
In order to check the performance of our system, we have simulated a network with 8 athletes, and all of them are connected to an AP. This AP connects to the cloud all the users for saving data and making the data fusion process. Finally, the cloud have a secure web server, which show the information processed in the cloud to the doctors, coaches, etc. The architecture of the network is shown in
Figure 4. All patients or athletes send information to a private cloud, which can be accessed from external networks. Access is protected through a user authentication based on RADIUS and the information use HTTPS. In this way, we ensure that only registered users can access information and the encrypted information travels securely across the network.
In this test we have used Riverbed Modeler as network simulator [
21]. Riverbed Modeler Suite is a set of tools for designing, modeling and simulating local and global networks, computer systems, applications and distributed systems. This software gives end users—designers and engineers—a graphical environment for performance evaluation and creation of event simulation networks. This software can be used for different tasks, including model creation, testing communication protocols, interaction protocol analysis, network optimization and also it is possible to implement using packet validation of analytical models. This means that the user can create separate models of network nodes and packet formats to define their own components and sequence statistics simulations and their own characteristic servers [
22].
The data sent by the nodes (RPi) are the data collected in the previous section. We have selected several periods, where we can observe various states of fatigue. Here, we show the key values measured for the network undertaken to evaluate the performance of the monitoring system when eight patients or athletes were monitored over one hour period, as previously mentioned. These values enable us to make an estimation of the technological resources needed to implement the system.
3.2. Load
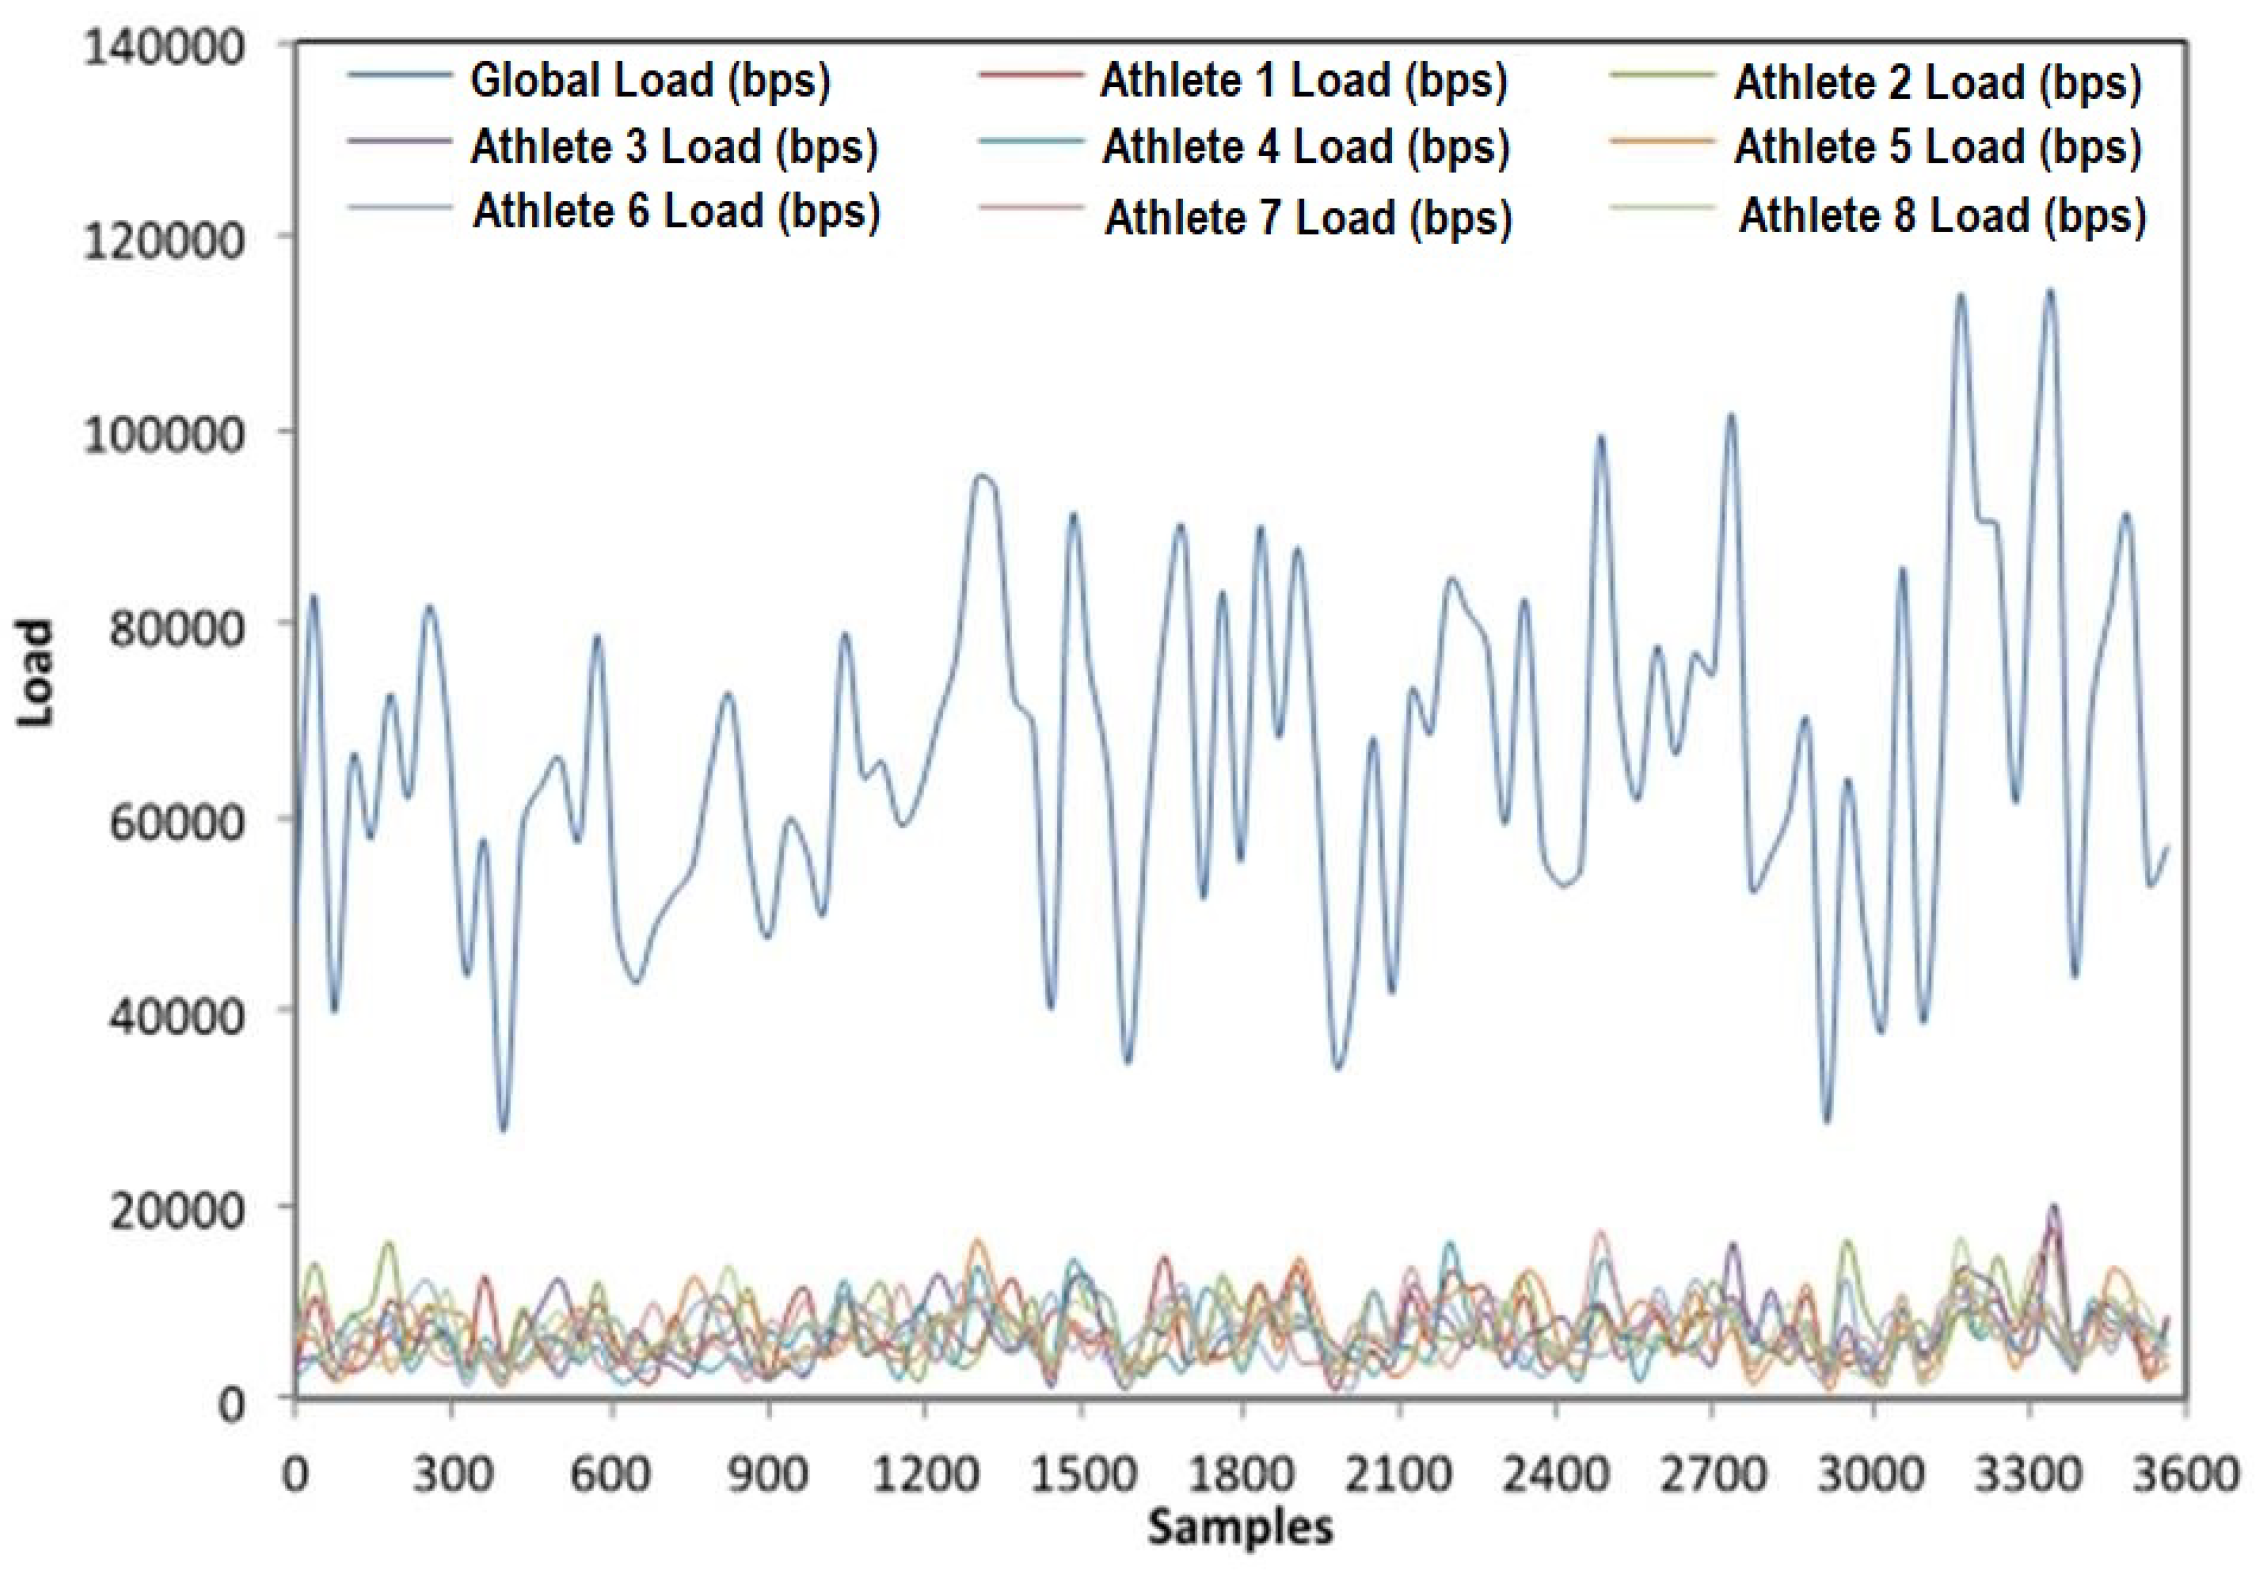
Load represents the total load (in bits/s) submitted to wireless LAN layers by all higher layers in all WLAN nodes in the network. In this case we can see that the simulated network provides an average global load of approximately 65,000 bps for all patients.
The average load of each patient is approximately 7000 bps. This statistic represents the total data traffic received by the entire WLAN station from the higher layers of the MACs that are accepted and queued for transmission. This statistic does not include any higher layer data, which are rejected without queuing due to full queue or large size of the data packet. Any data traffic that is relayed by the Access Point (AP) from its source to its destination within the Basic Service Set (BSS) is counted twice for this statistic, since such data packets are double-loads for the BSS, as both the source node and the AP have to contend for their transmission via shared medium.
Figure 5 shows the traffic data load in the network for each athlete and the global load, made up from all the contributions.
In
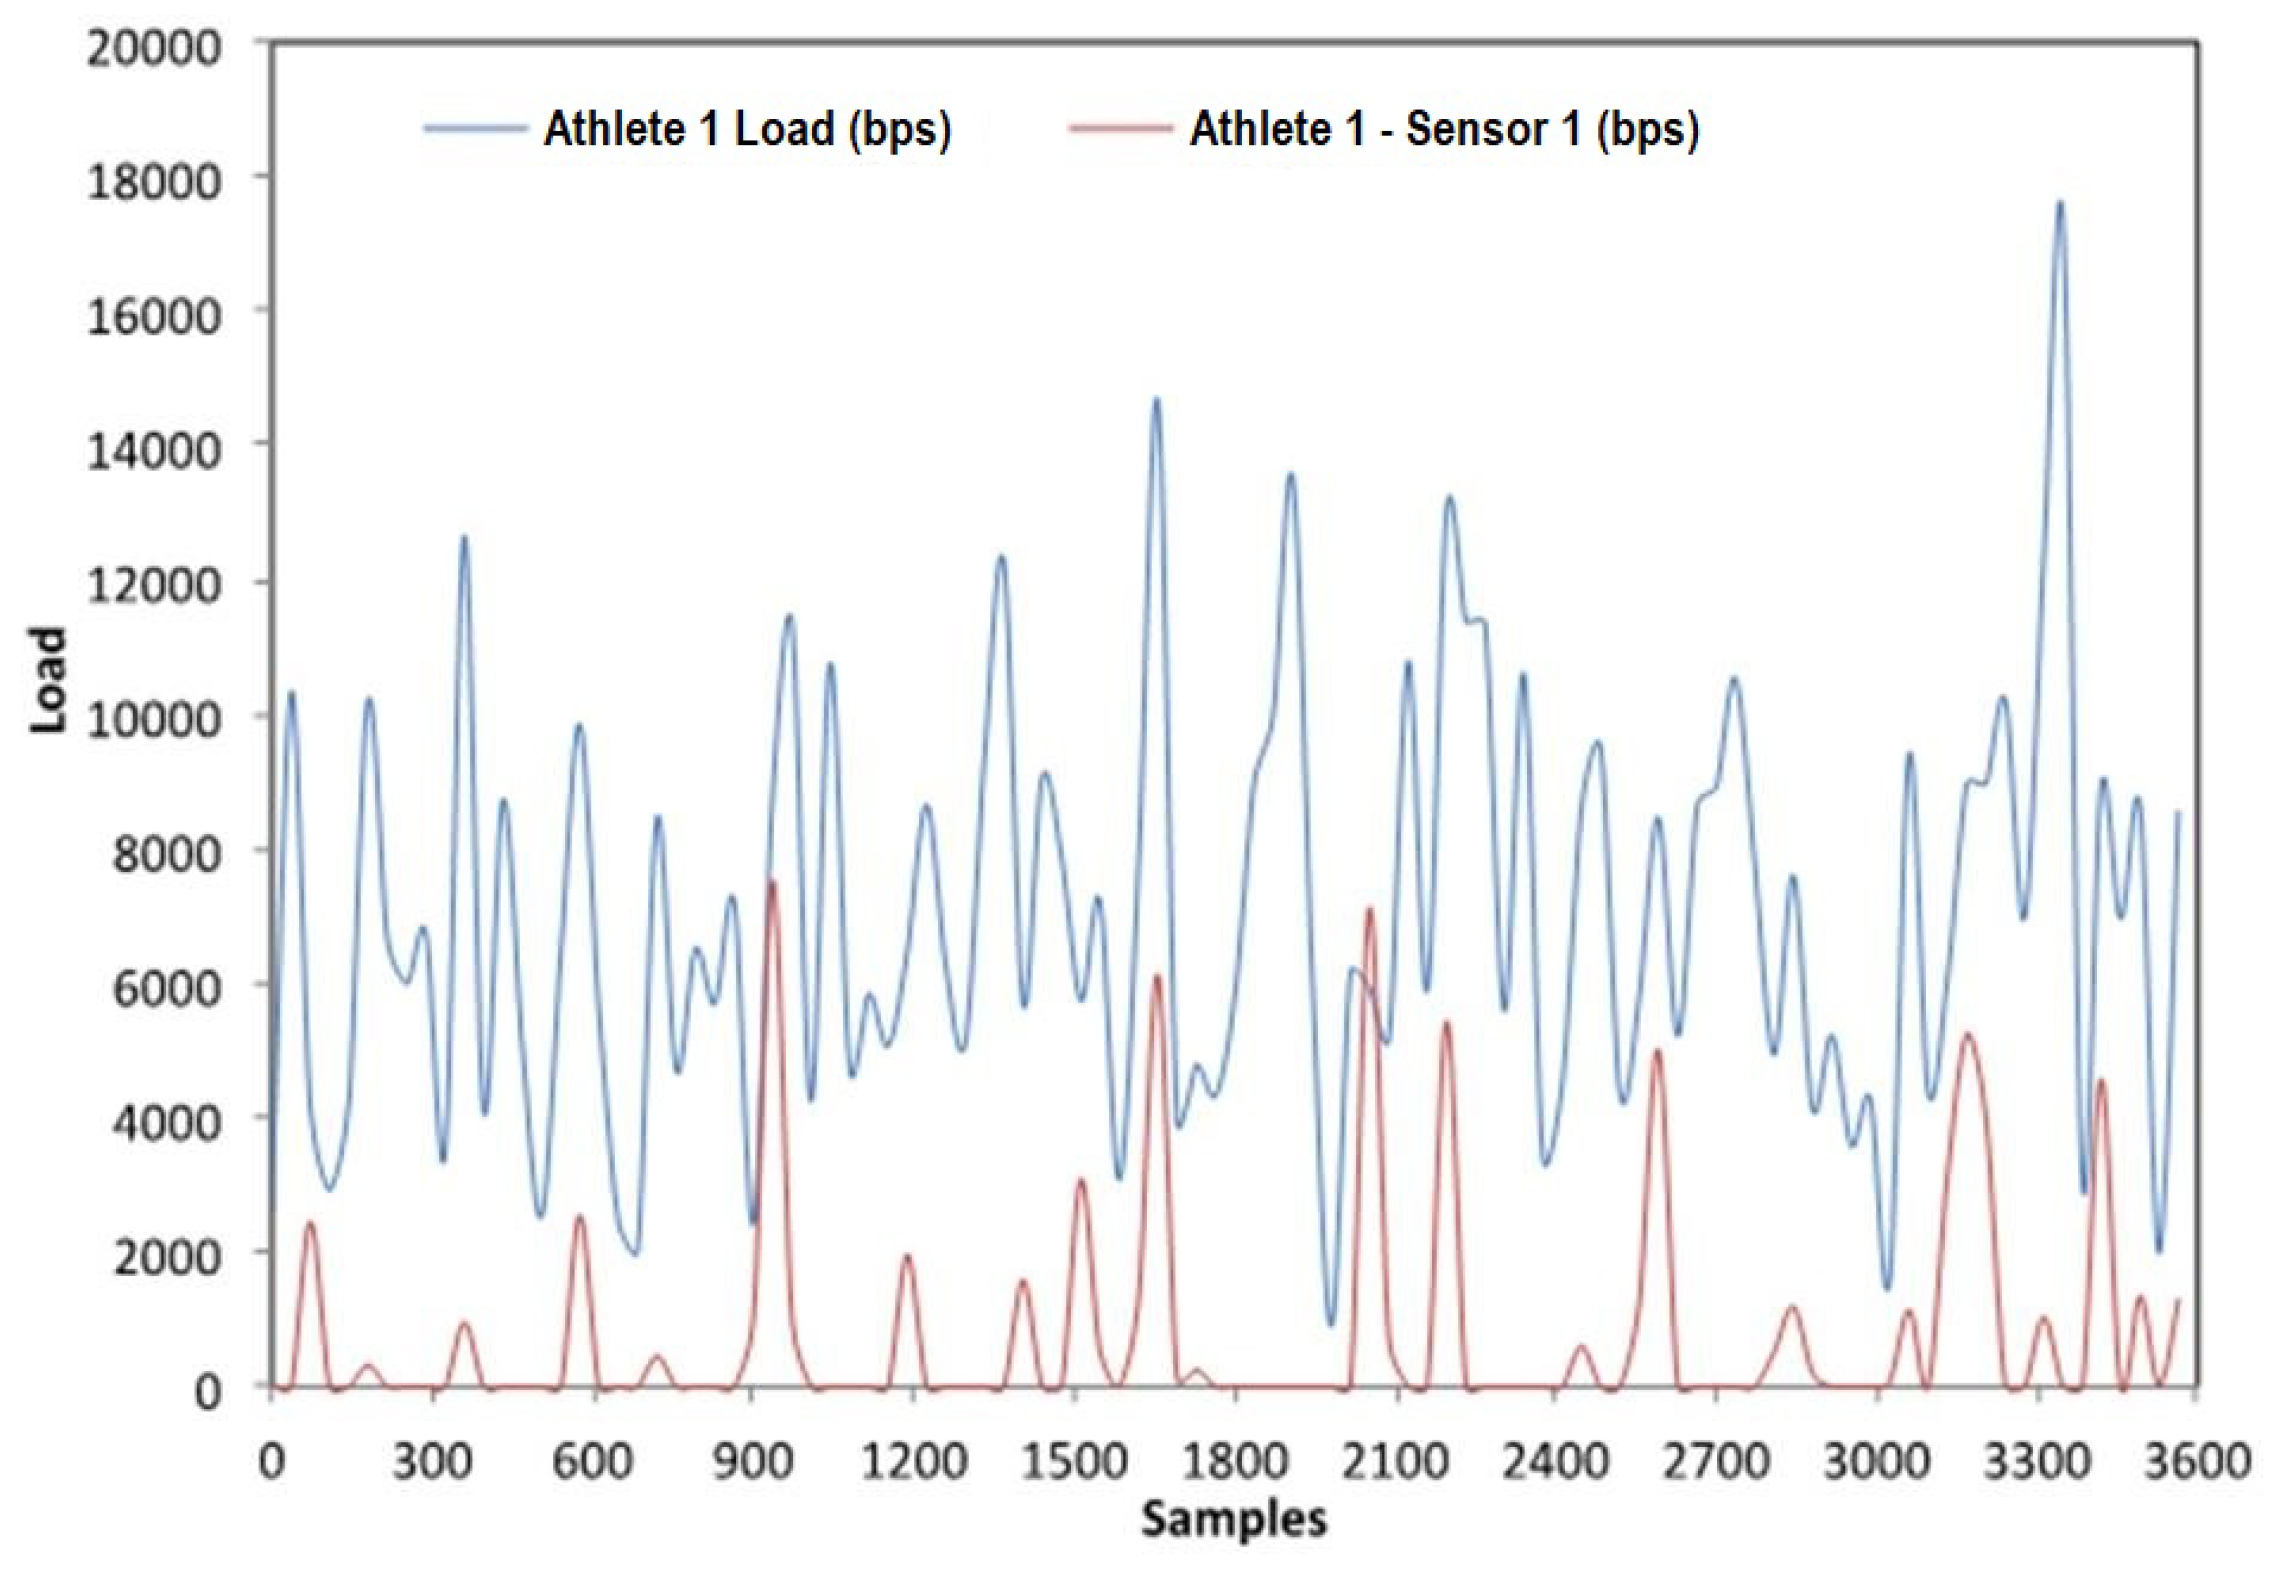
Figure 6, we can observe the load provided by our system to a patient and the load provided by one of the sensors that is monitoring that patient. As we can see the average patient load is around 7000 bps with many peaks. These peaks in traffic are because each sensor is sampling at various times and so several sensors may be sending information producing traffic peaks. However, as we can see, there are times when the sensors are not picking or sending information, but are in standby mode to save energy. In all cases, the information captured or sent is low.
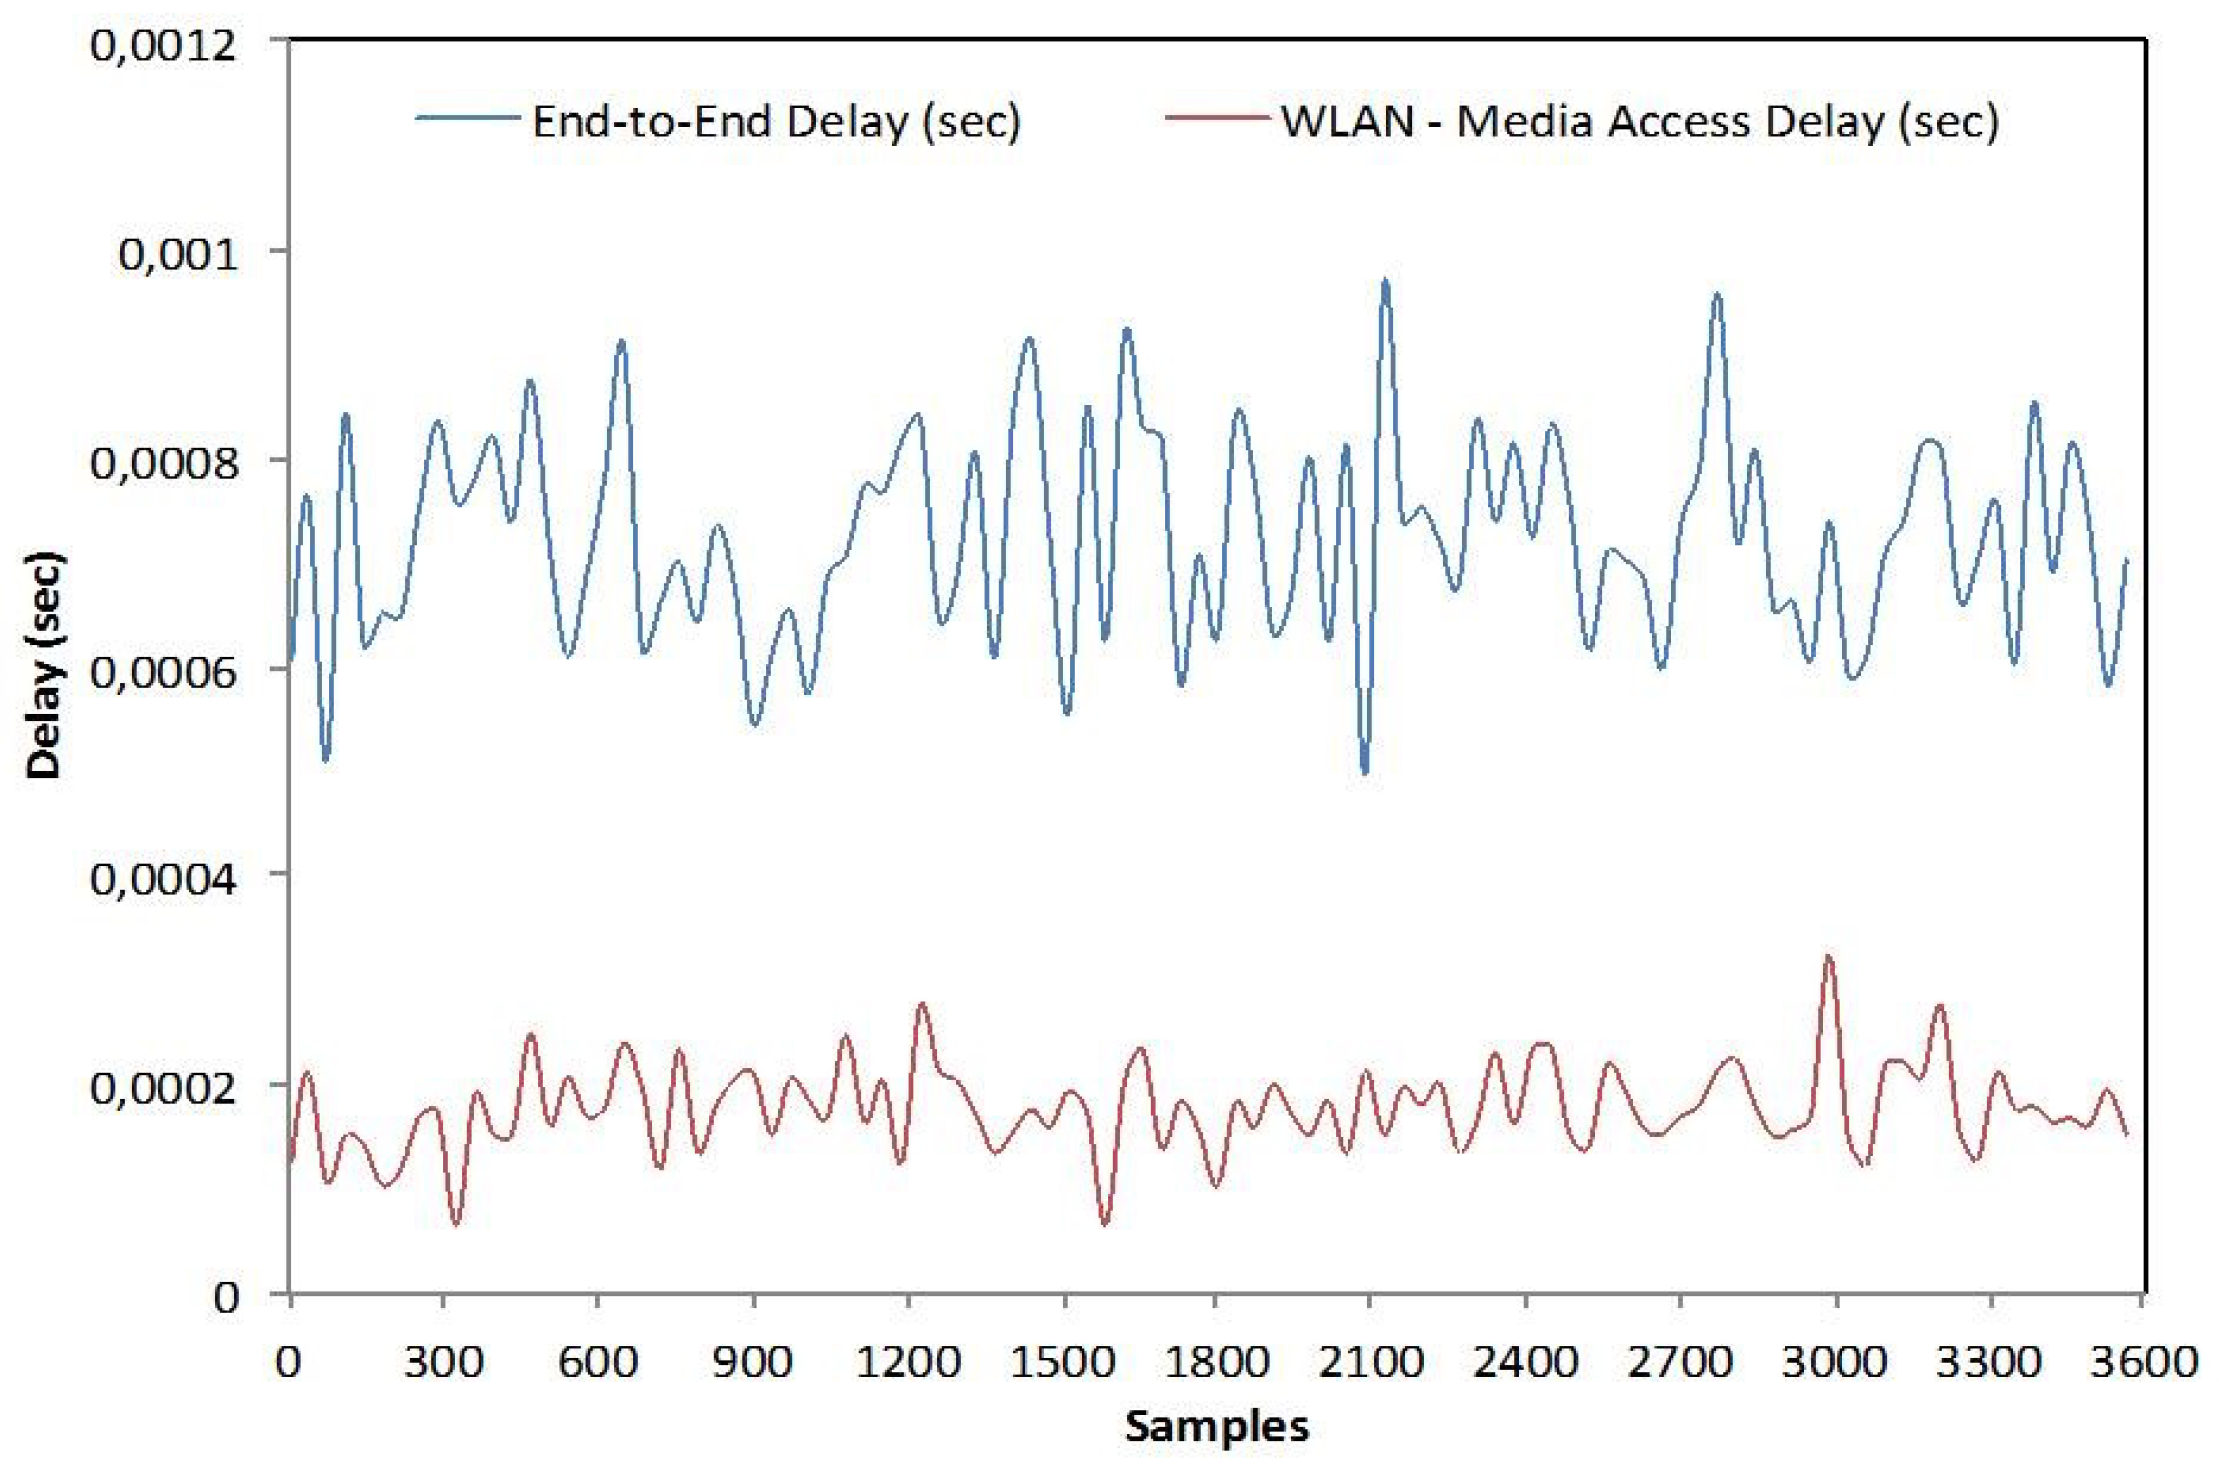
Figure 7 shows the end-to-end delay and WLAN-Media Access Delay. The end-to-end delay represents the delay of data received by traffic sinks across all nodes. In this case, we can see that this delay is lower than 1 millisecond in all samples, so suggesting that there is an acceptable delay period for real time monitoring of patients.
WLAN - Media access delay represents the global statistic for total queuing and contention delays of the data, management, and delayed request frames transmitted by all WLAN MACs in the network. For each frame, this delay is calculated as the duration from the time when it is inserted into the transmission queue, which is arrival time for higher layer data packages and creation time for all other frame types, to the time when the frame is sent to the physical layer for the first time. Hence, it also includes the period for successful Reset To Send/Clear To Send (RTS/CTS) exchange, backoff periods and collision delays. This delay should be less than the previous one as it is calculated on layer 2. For this reason, the average value is 0.00018 s, as we can see in
Figure 7.
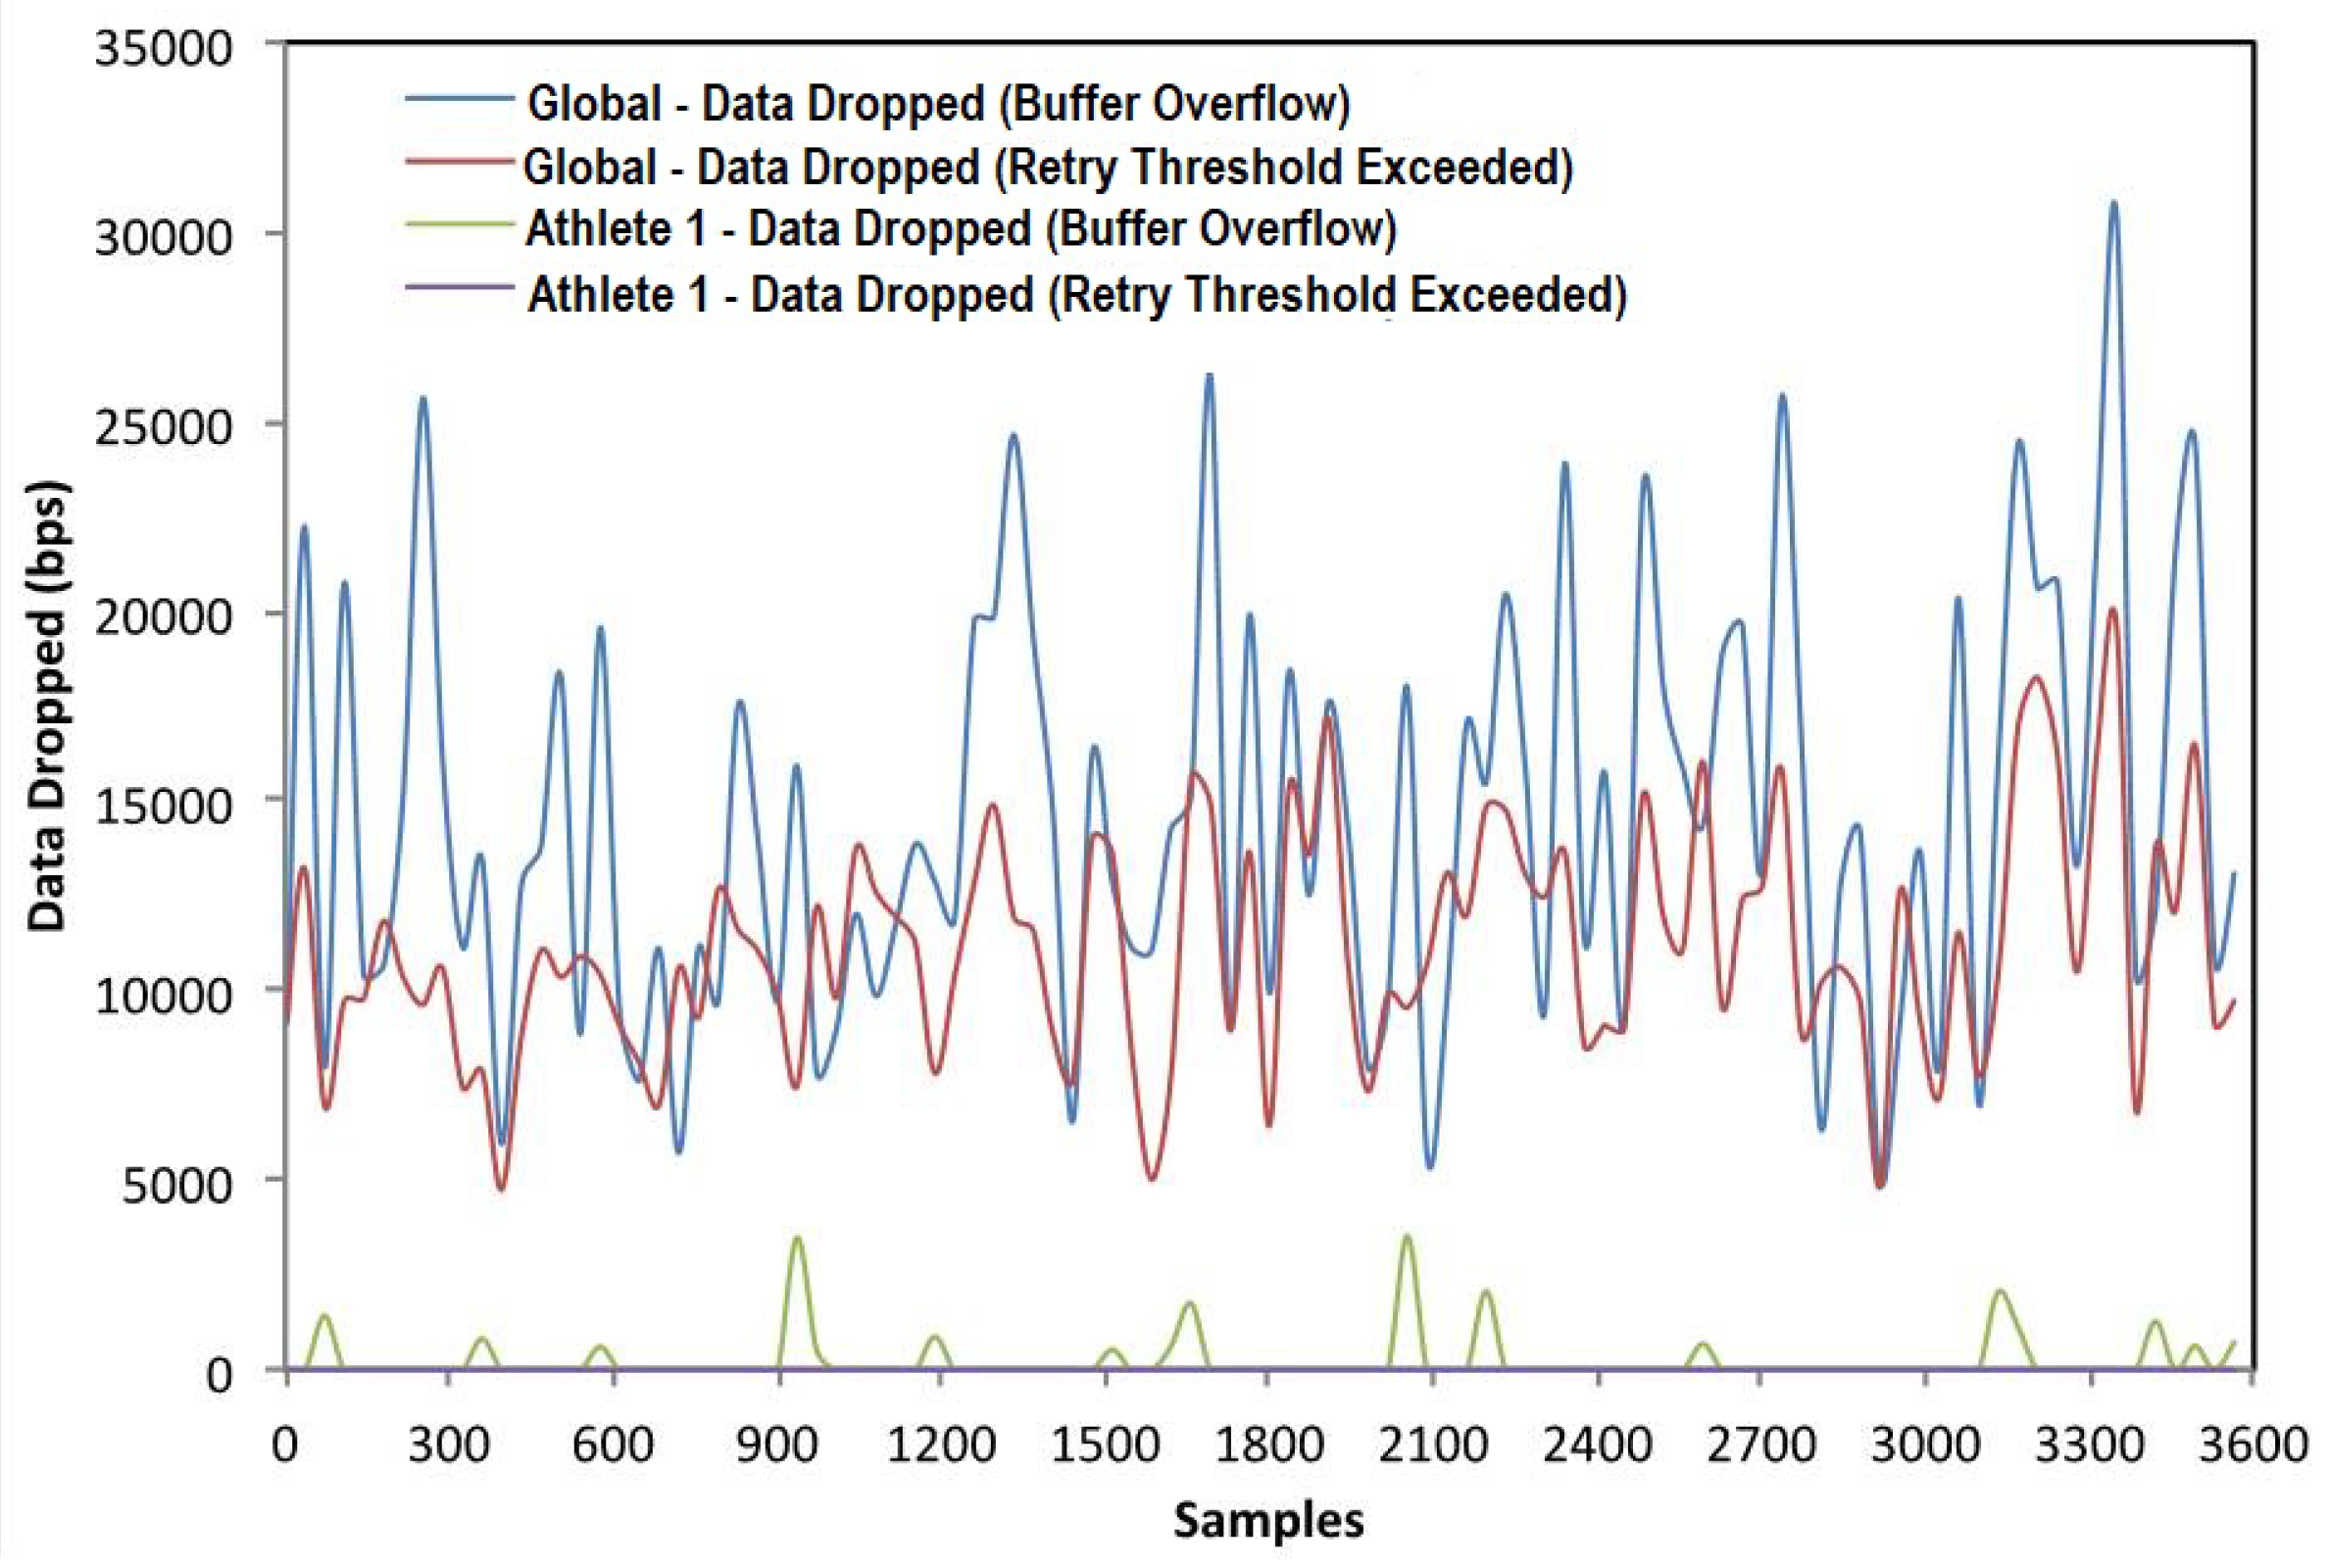
3.3. Data Drop
Data drop represents the higher layer data traffic dropped by the all the WLAN MACs in the network as a result of consistently failing retransmissions. On the one hand, data dropped by buffer overflow is due to: (a) full higher layer data buffer, or (b) the size of the higher layer package, which is greater than the maximum allowed data size defined in the IEEE 802.11 standard. On the other hand, data dropped by the retry threshold exceeded the number of the higher layer packages that are dropped because the MAC could not receive any ACKs for retransmitting those packages or their fragments, and the packages’ short or long retry counts reached the MAC’s short retry limit or long retry limit, respectively.
In
Figure 8, we show the data dropped by the global network formed by eight patients. We can see that the average data dropped by buffer overflow is 14,475 bps and 11,145 bps in the case of average data dropped by the exceeded retry threshold. These data decrease. If we focus our attention on one patient, in this case the average data dropped by buffer overflow is around 230 bps and there is no data dropped through exceeding the retry threshold.
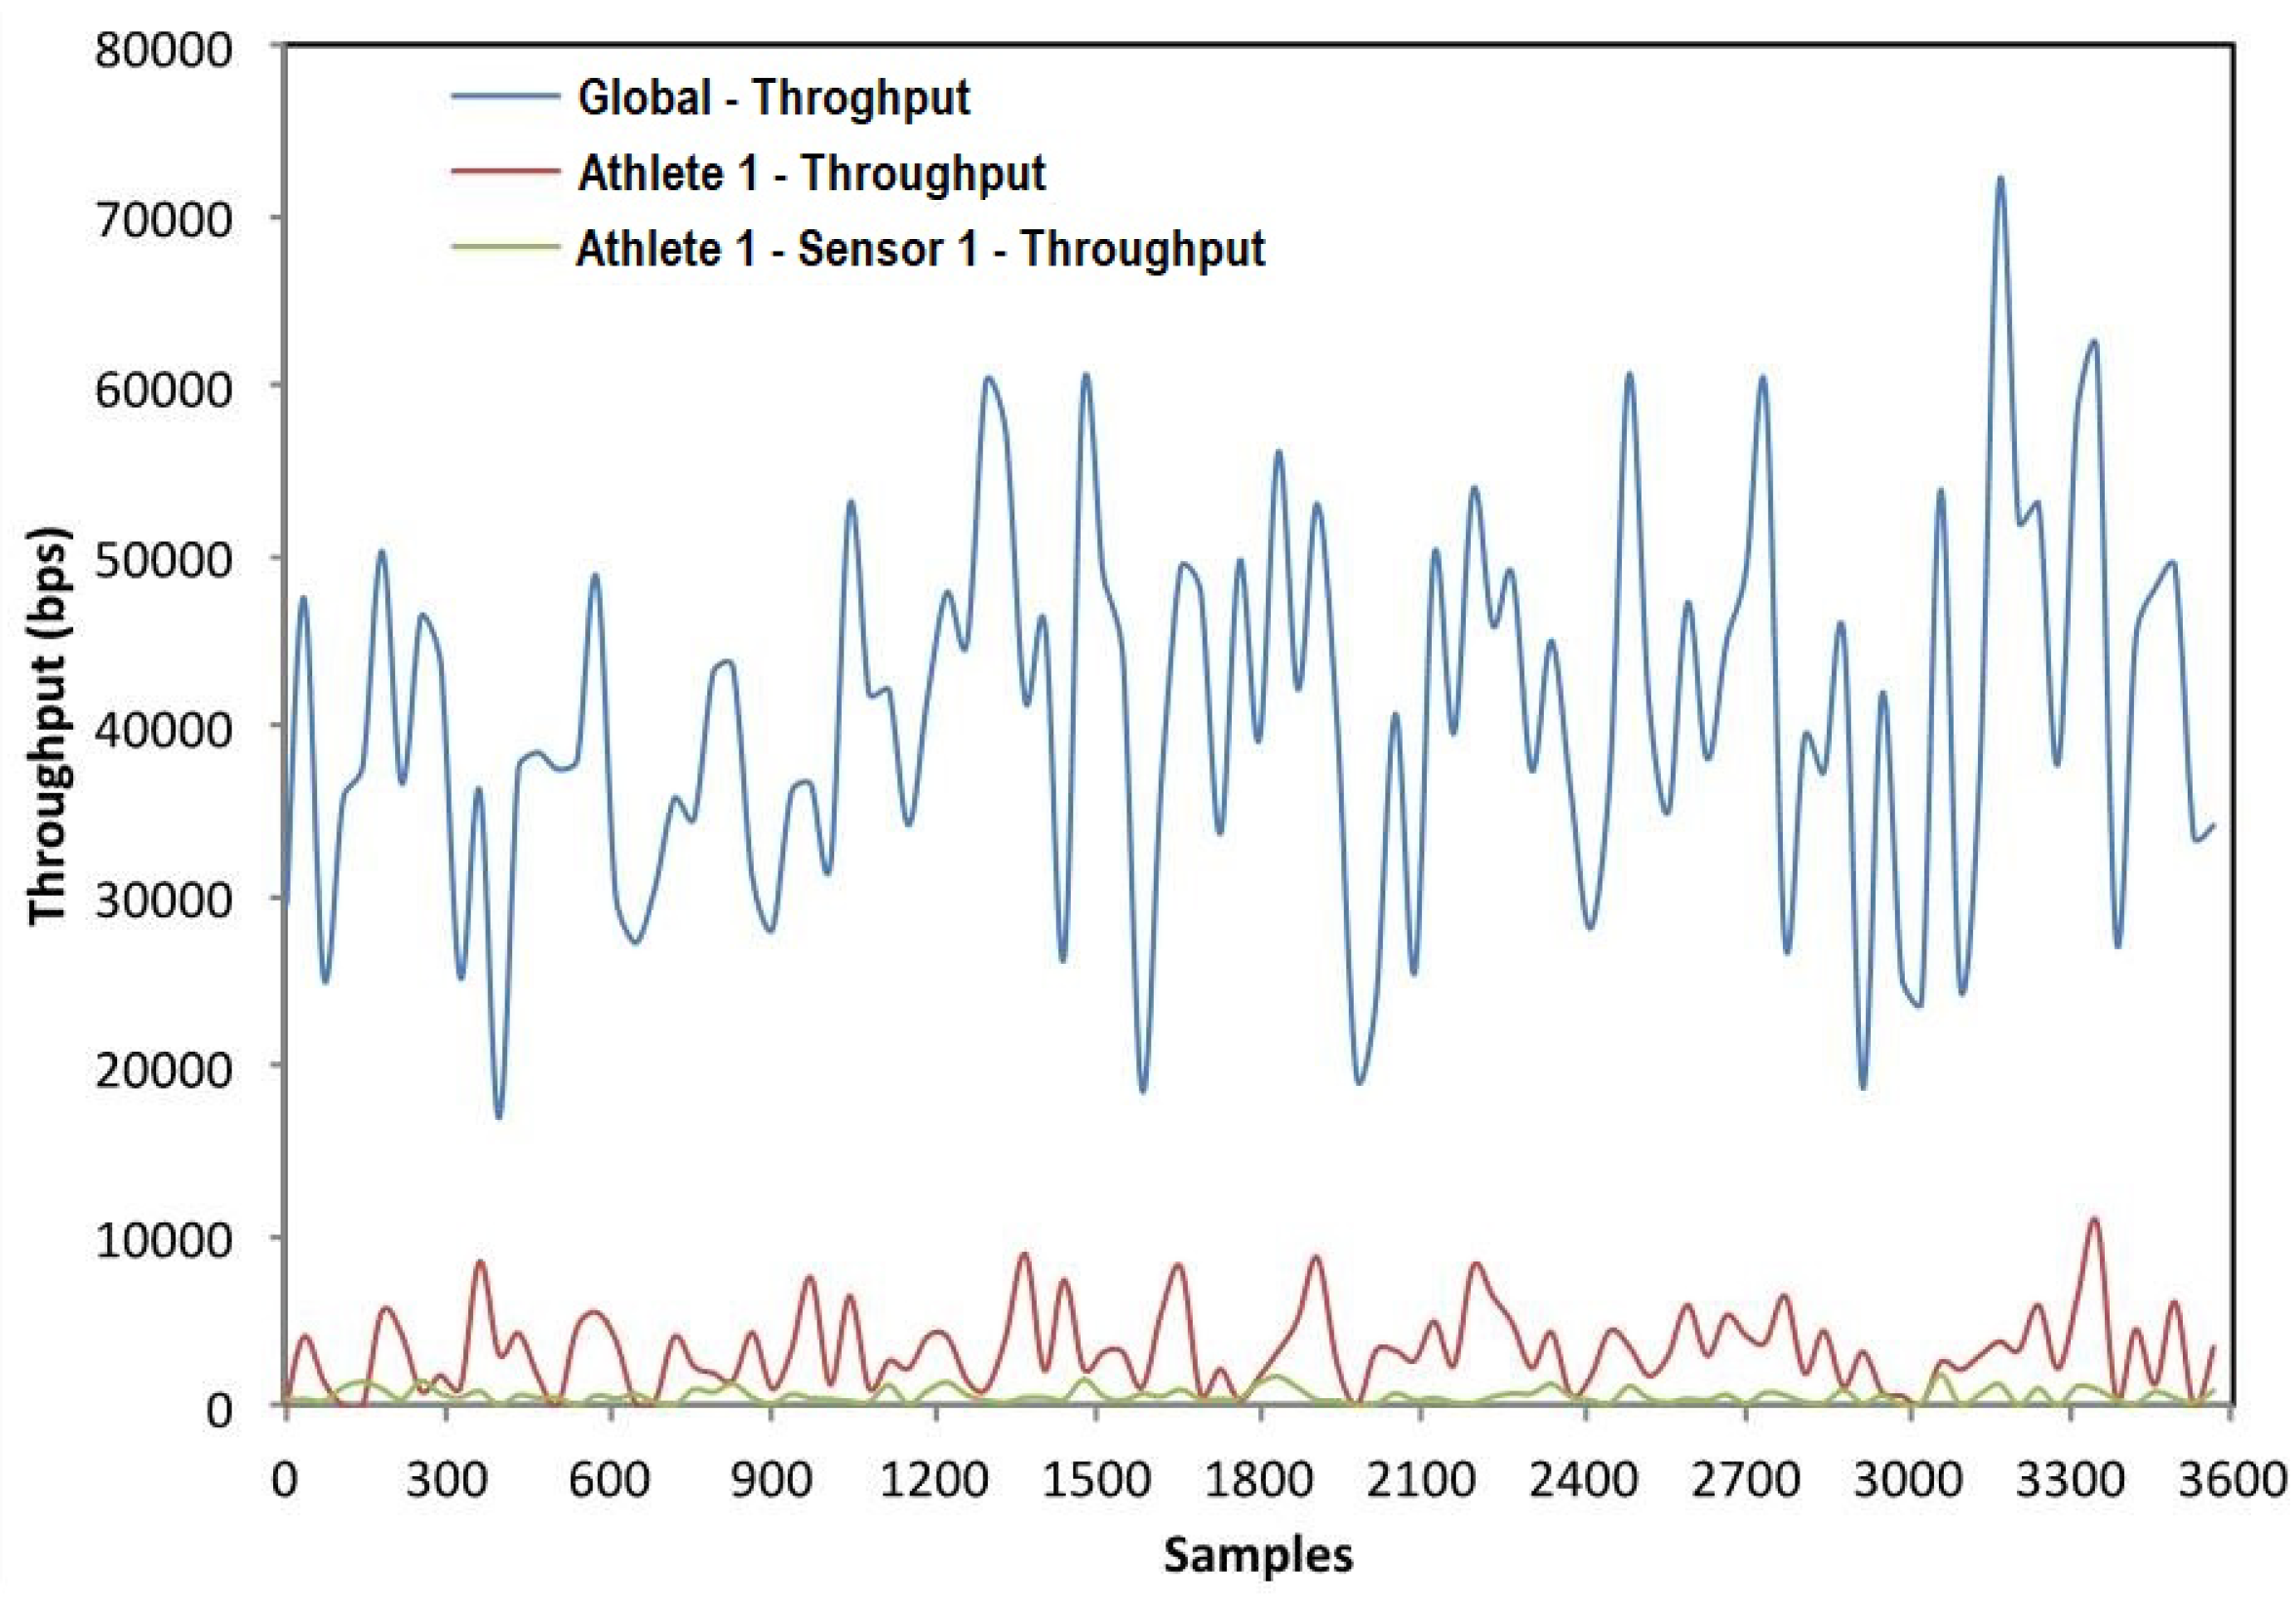
3.4. Throughput
Throughput represents the total number of bits (in bits/s) forwarded from wireless LAN layer to higher layers in all WLAN nodes of the network (
Figure 9). In our case, we represented this information for the global network, using one patient and one sensor node. The average throughput for the network simulated is 40,450 bps. This throughput decreases when we focus on one patient, in this case being approximately 3220 bps. Finally for one sensor node the average throughput is 546 bps.
3.5. Comparison between Other Sports Monitoring Systems
In this section, we compare our system with other sports monitoring systems implemented on the literature (see
Table 3). We have made a comparison taking into account general aspects of the systems. In this case, we have studied: if the systems are or not oriented to be implemented in teams, which are the wireless technology used and if they can make a multi-hop topology, what parameters could measure, their scalability, if the systems use some kind of security, it they are based on cloud technologies and finally the cost of the systems.
According to
Table 3, our system is able to measure 7 parameters followed by the work [
24], which can measure 4 parameters. Our system has to take into account some important parameters like GSR and EMG in order to know in a better way the evolution process of an athlete. Our system is oriented to work with one athlete, but there would not be any problem to monitor several users at the same time because as we have seen in the previous section, the amount of data sent to the cloud is small. For this reason, the network technology and server’s capacity is enough to work without problems. This is an important feature because when we are working with personal information, privacy is factor. Our system is cloud based, so the updating process of the data is automatic and therefore the specialists can always consult all the data collected. Finally, we can see that our system, along with [
26], is cost-effective. This is an important characteristic in order to implement these types of systems without having a high budget.
Table 3 shows the comparison of our system with other solutions. Our system presented in this paper stands out because it can measure 7 parameters, it uses security to send the information, it could be implemented in teams due to its easy scalability and cost-effective. Finally, its management through the cloud facilitates its integration across platforms.
4. Conclusions and Future Work
In this work, we have designed, implemented and analyzed a monitoring system for physiological parameters. This system is based on a distributed architecture, where physiological data of a person are collected by several sensors; next, a Raspberry Pi joins the information and makes a standardization process; then, these data are sent to the Cloud to be processed. Our Cloud system stores the received data and makes a data fusion process in order to indicate the athlete’s fatigue status at every moment. This system has been tested in collaboration with a small group of voluntary tri-athletes. A network simulation has been performed to plan a monitoring network for a bigger group of athletes. Finally, we have found that this system is useful for medium-term monitoring of the sports activities. The technology employed in implementing the system is cost-effective.
In this study, we have focused on checking valid physiological parameters for athletes, for patients, the elderly, etc. These physiological parameters can be analyzed in order to assess training and the physical capacity of sportsmen and women. Their follow-up is important during training so as to prevent overload and injury during the sports season. The parameters analyzed allow us to undertake a timed follow-up, which presents no inconvenience to the athletes and allows us to send the data obtained by telematics means. Moreover, the introduction of new parameters is possible using this system and the decision to do so depends on the needs of the final application.
The performance of an e-Health board has been tested within this system, monitoring the activity of a small group of tri-athletes. From the obtained results, we can see that the e-Health equipment provides a register/logging of the different physiological constants and other bioparameters of interest to monitor sports activity. The sensors employed present normal functioning within the desired and expected parameters and they are equivalent to the obtained from standard devices. Besides, we have added a data fusion algorithm based on Dempster-Shafer inference to determine the state of fatigue in athletes from the normalized data of the sensors. This algorithm is implemented on the cloud in order to reduce the time processing of each RPi and in case of a team monitoring to perform a data combination at the team level. The fact of having the whole process of merging data in the cloud allows us a greater scalability of the system. The communication layer works properly and allows the interchange of information among the athletes, the trainer and the medical doctor/s (if required). Therefore, the system fulfills the required communication protocols in order to safeguard the data and security system and to avoid intrusions.
Having said that and with these results, the functionality of the system is valid, as, besides analyzing the validity of the system in terms of how the network functions, based on throughput and delay, and assessing the overall quantity of erroneous bits in the simulation, it is also valid in terms of how the different sensors function. We believe that when this system is used during the training session of a sportsman/woman, either indoor or outdoor, the data that the trainer or medic receives on blood pressure, cardiac rhythm, oxygen pressure, sweating, temperature, ECG (EMG would have to be undertaken on finishing the training because it cannot be done at the same time as ECG) will allow him or her to obtain information on the physical activity that the athlete is undertaking at that moment, and, therefore, to assess whether the effort load is appropriate or not for that particular athlete. The EMG analysis can also provide him or her with information on muscular activity.
In this context, the eHealth system fulfills the necessary requirements for the study of the athlete’s activity, as well as improving the communication between the athlete, trainer and doctor (if there is one) through the information gathered in the cloud.
One limitation of the designed system is that the loss of data that occasionally takes place in some samples of the most critical sensors (as it is in ECG). As we have mentioned above, this can be solved by using a SoC platform with several cores in the processor (for example using RADXA Roca Pro platform with 4 cores at 1.6 GHz or the improved version of the RPi, i.e., RPi 2, that also provides 4 cores at 900 MHz). This will provide a quicker and more simultaneous sampling, using all the sensors. In this case, the platform used is cheaper than the latter proposed one.
This designed system could be used for simultaneously monitoring groups of patients. From the evaluation of the simulation performance, we can conclude that the system functions well with low network resources. We estimate that for the 8 athletes/patients network, the use of a WiFi 802.11n network with 1 Mbps would be sufficient. In the sports application proposed, these sampling periods for the 8 patients/athletes used in this study would be sufficient to describe and follow up the evolution of athletes during training sessions. The designed system has been used by sports professionals who have validated its use and functioning for sports teams with few resources that need to optimize and control the performance of their athletes.
Finally, the use of an SoC platform with several cores in the processor and the use of multithread programming could improve the use of several sensors at the same time and improve the performance in order to enlarge the number of athletes/patients.

 ,
, 


