Response Optimization of a Chemical Gas Sensor Array using Temperature Modulation


Multisensor System and Pattern Recognition Research Group (GISM), Electronic Engineering Program, Universidad de Pamplona, Km 1 Vía Bucaramanga, Pamplona 543050, Colombia
*
Author to whom correspondence should be addressed.
Electronics 2018, 7(4), 54; https://doi.org/10.3390/electronics7040054
Submission received: 13 March 2018
/
Revised: 17 April 2018
/
Accepted: 17 April 2018
/
Published: 21 April 2018
Abstract
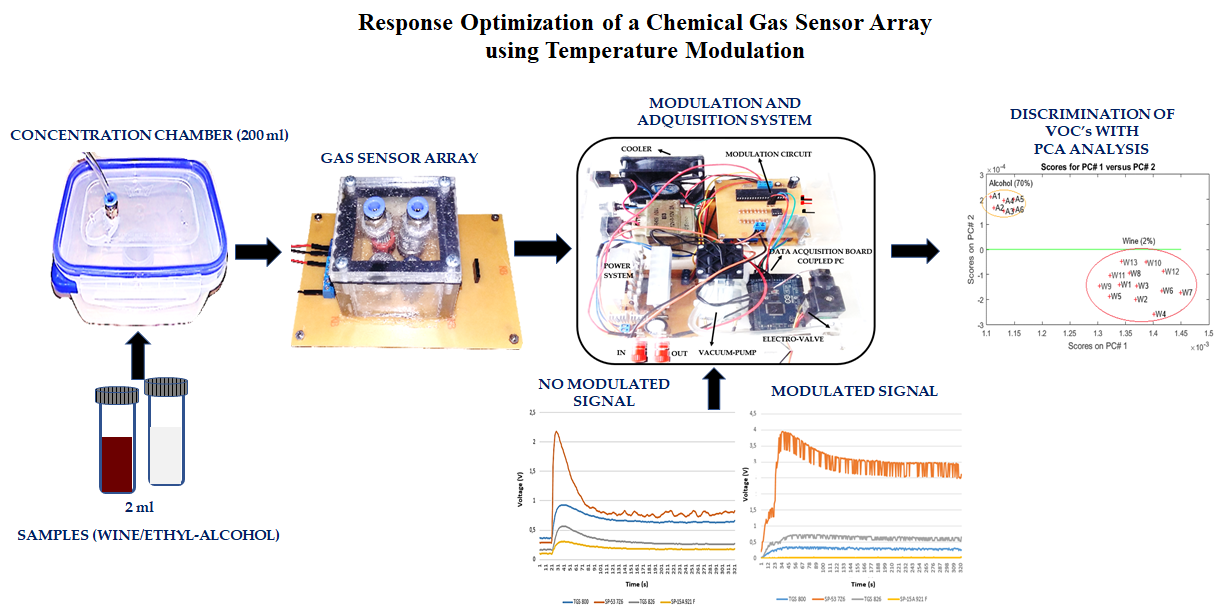
:This paper consists of the design and implementation of a simple conditioning circuit to optimize the electronic nose performance, where a temperature modulation method was applied to the heating resistor to study the sensor’s response and confirm whether they are able to make the discrimination when exposed to different volatile organic compounds (VOC’s). This study was based on determining the efficiency of the gas sensors with the aim to perform an electronic nose, improving the sensitivity, selectivity and repeatability of the measuring system, selecting the type of modulation (e.g., pulse width modulation) for the analytes detection (i.e., Moscatel wine samples (2% of alcohol) and ethyl alcohol (70%)). The results demonstrated that by using temperature modulation technique to the heating resistors, it is possible to realize the discrimination of VOC’s in fast and easy way through a chemical sensors array. Therefore, a discrimination model based on principal component analysis (PCA) was implemented to each sensor, with data responses obtaining a variance of 94.5% and accuracy of 100%.

1. Introduction
Different studies related to the electronic noses have had a rise in many fields. These have been used to monitor odors in the food industry in order to determine the products’ quality and control the fact that some of these can generate toxic substances, which are harmful for human consumption [1]. Other applications such as disease detection, toxic gases monitoring, and environmental control are aspects of current research. As such, it is important to know what applications and advances about electronic noses could be useful [2].
Currently, all these applications have been made following the same pattern (i.e., using sensitive, selective and repetitive sensors), which will be effective when they detect a sample of a volatile compound [3]. In previous studies conducted by different researchers, for example, the research group headed by Polese has made a study entitled, “Self-Adaptive Thermal Modulation of Gas Sensors” [4]. Other studies in different institutions have done some projects that apply temperature modulation through metal-oxide sensors [5,6,7,8,9]. On the other hand, some works have been focused on researching frequency spectrum analysis in order to improve the gas sensor performance, discriminating odors of similar response under noisy conditions, and modulation techniques using processing methods such as: cluster analysis, principal components, and neural networks, where a signal from a device for data acquisition was acquired and afterwards the gas sensor response was analyzed [10,11]. The work done by Anindita and Kanak about “A Temperature Modulation Circuit for Metal Oxide Semiconductor Gas Sensor” was taken as reference in this research in order to try to apply equivalent procedures, but obtaining different results [12]. Recent studies of thermal modulation of metal-oxide sensors have been realized through a low power operation system to increase the selectivity and monitoring of Volatile Organic Compounds (VOC’s) [13,14,15]. Thus, there is another report for the analysis of a n-type metal oxide sensor approach that utilized the combined rapid modulation of a nanowire different Field Effect Transistor (FET) sensor [16]. Alphasense Company recommends the use of temperature pulsing on their sensors to enhance the performance of the devices, providing increased sensitivity [17]. Additionally, a suspended microheater structure using graphene and a micro-electro-mechanical System (MEMS) was used, which was designed to reduce the energy consumption reached 1 mW [18].
Nowadays, the eNose company has been working to optimize the response of MEMS sensor through heater element production using temperature variations in the order of ±50 °C between. For data analysis, when a cycling technique is applied, each sensor will generate a dimensional matrix of time versus thermal cycle and response value. A combination of different sensors will form a fourth dimension in the multiway data [19].
1.1. Gas Sensor
1.1.1. Tin Oxide Sensor
A tin oxide gas sensor containing oxygen in clean air is adsorbed on the surface of the sensing material on the crystal structure [20]. When the sensing material is heated to high temperatures (around 400 °C), and in the presence of reducing gases, free electrons flow easily through the conduction band of tin oxide particles. Furthermore, the pure oxygen air is absorbed by the particles of tin oxide surface and traps free electrons due to high electron affinity, forming a potential barrier in the conduction band. This potential barrier restricts the flow of electrons causing an increase in electrical resistance [21]. When a sensor is exposed to an atmosphere, for example, with reducing gases, CO, CO2, etc., tin oxide surface absorbs gas molecules, producing an oxidation reaction between the gas and the absorbed oxygen, which decreases the potential barrier and thus reduces the electrical resistance. The relationship between the sensor resistance and gas concentration deoxidized can be expressed by the following experimental equation and is valid for a certain range of concentration of a gas:
where R is the electrical resistance, A and α are constants and [C] the gas concentration [22,23]. Tin dioxide sensors are characterized by having a good selectivity, repeatability and accuracy. Also, they can detect up to 20 gases at low concentrations, but the principal disadvantage of them is that they are very sensitive to moisture and this could generate drifts in the response. Another possible failure is that they might present contamination of active layer when is applied any volatile compound in high concentration, which avoid that they can be recovered due to saturations. Energy consumption of the gas sensors is one of the most important factors to be analyzed, in order to make an implementation of this device through powered systems modulated sources and to reduce the consumption.
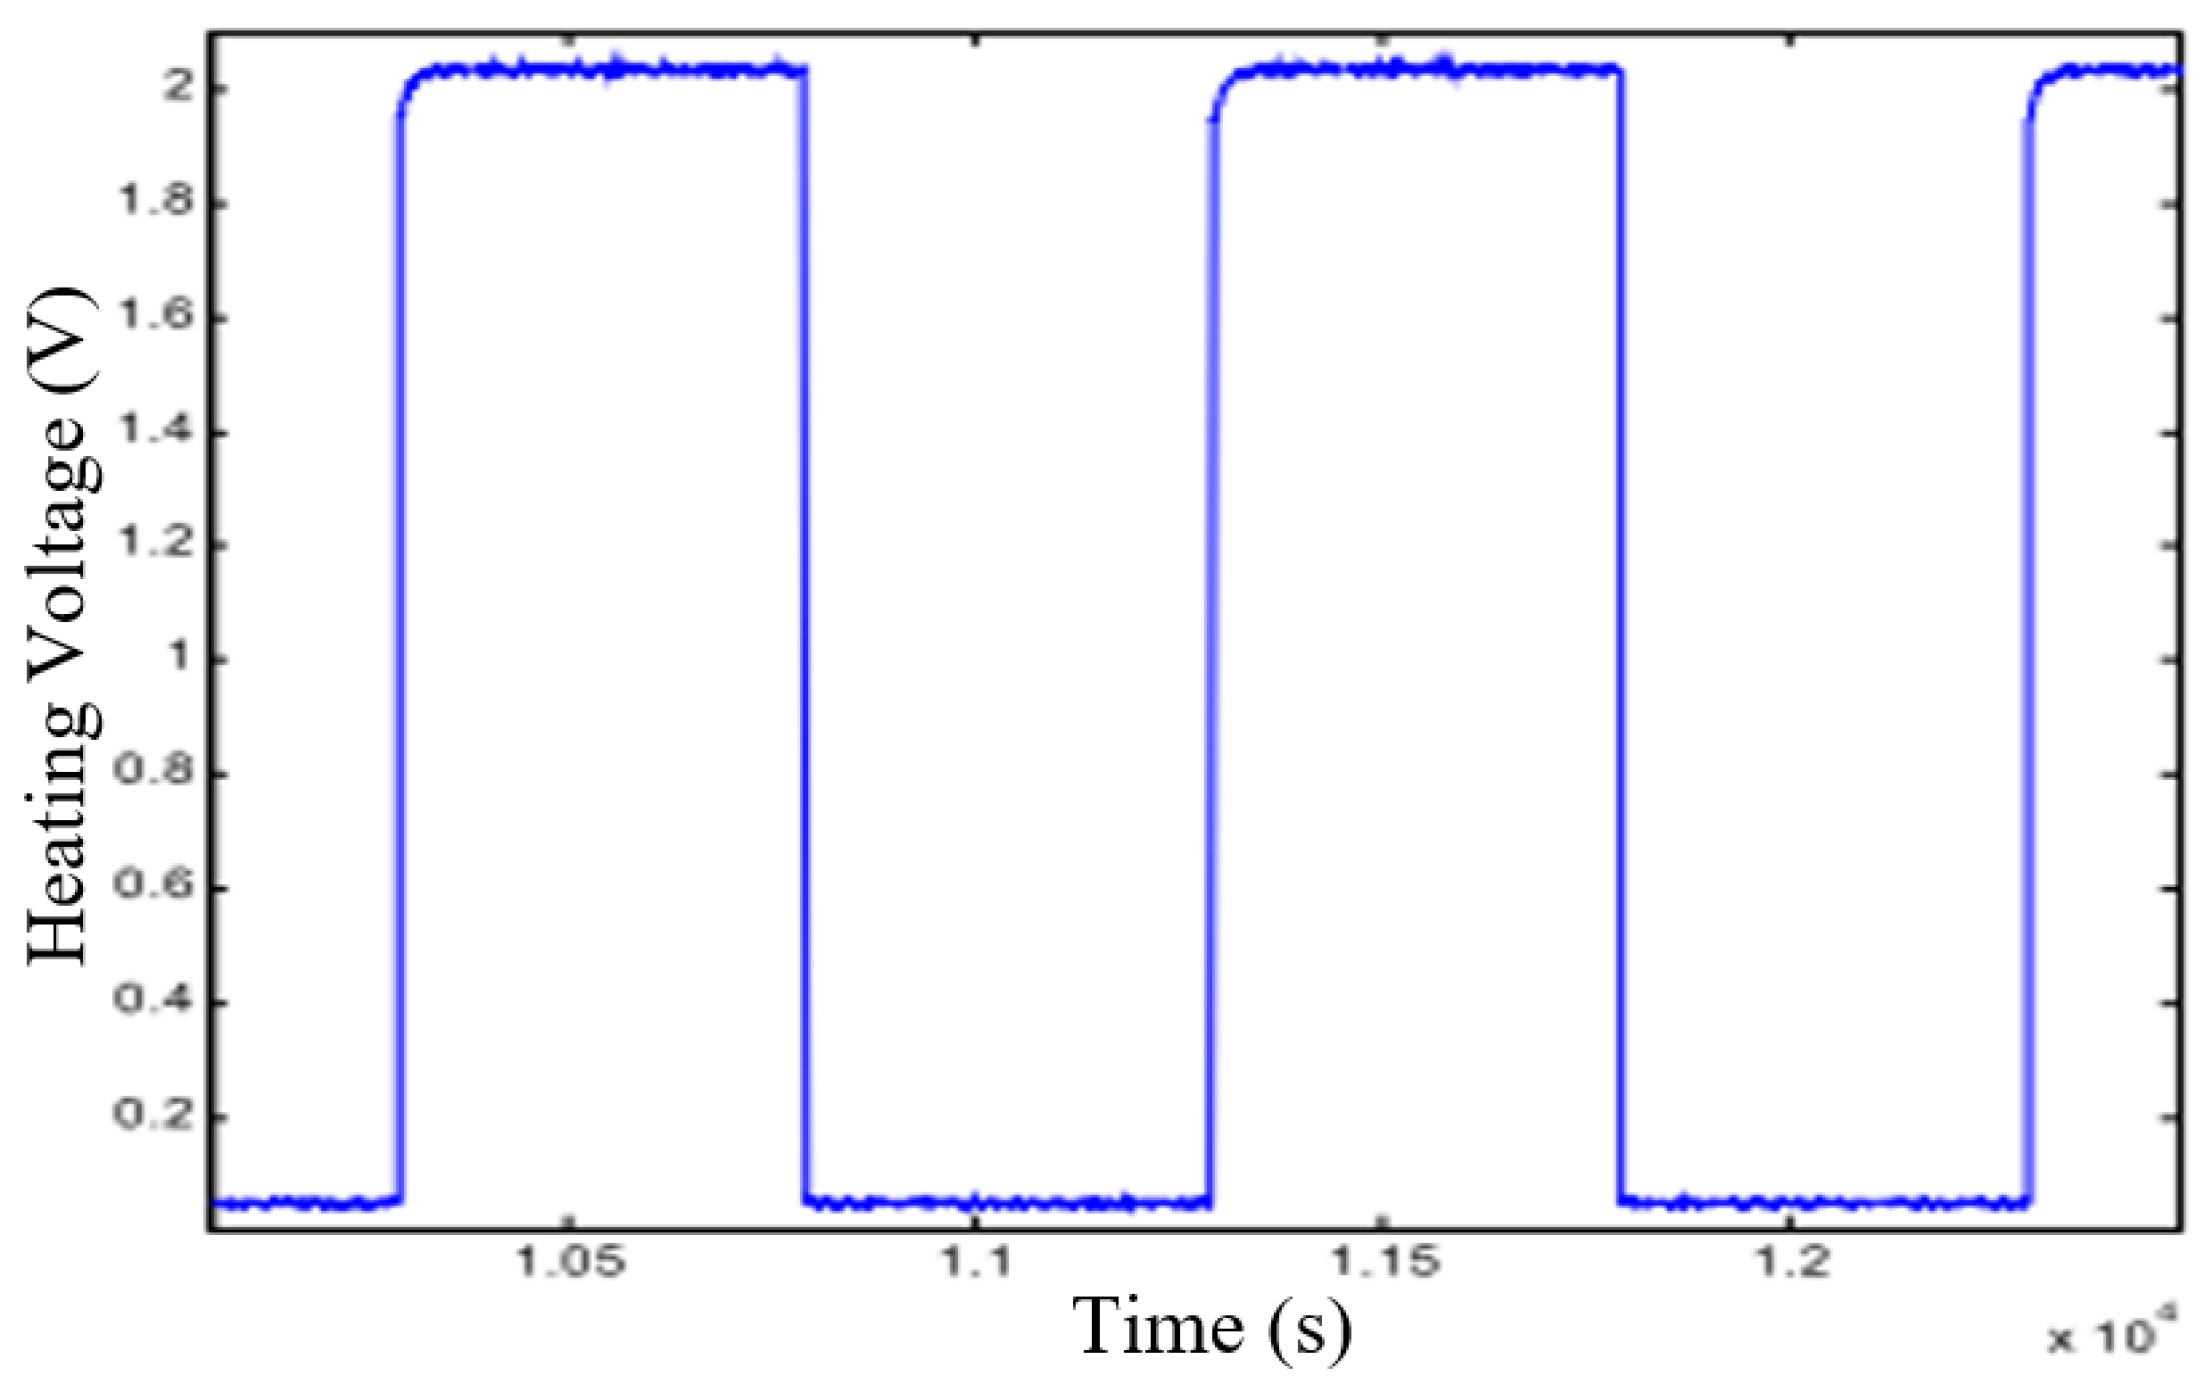
Typically, gas sensor consumption is around 400 mW (e.g., FIS SP-53) when a continuous signal is applied to the heater resistor (e.g., FIS Inc. and Figaro Engineering Inc.) [24,25].
Figure 1 shows the establishment time of the step-type signal applied to the sensor heater.
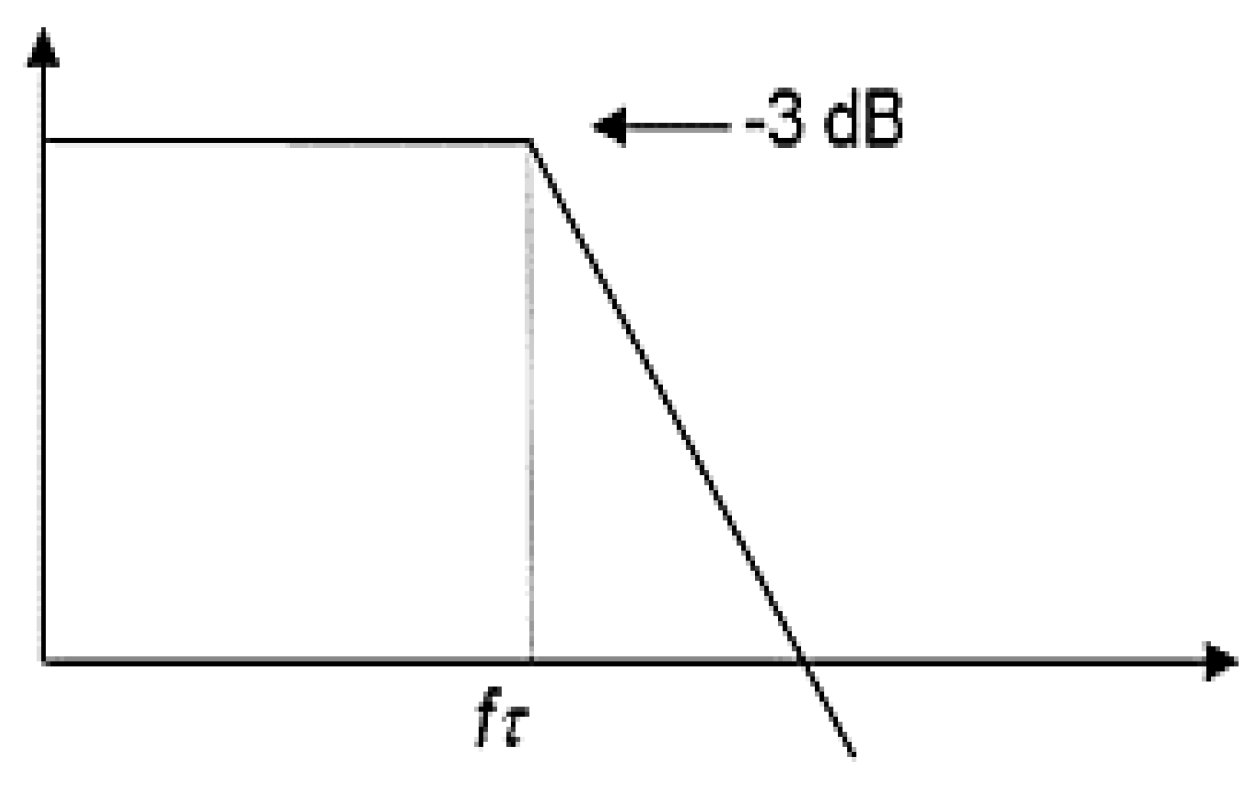
The time constant of first order marks the width of the frequency range to be modulated. Thus, the lower response time will imply a higher cutoff frequency of the system, which is directly generated by temperature modulation.
Figure 2 shows a bode diagram with an asymptotic module of this system, which the attenuation is above the cutoff frequency.
Several studies have used information from the dynamic response of a sensor thermally modulated to identify and quantify gases [26,27].
In our particular case, temperature modulation can alter the kinetics of the reactions occurring on the sensor surface in the presence of gases to be detected.
It is shown that using of dynamic response can reduce drift effects. Although the results are promising, only few studies have been done in selecting frequencies to be used in the sensors. A thorough study of the behavior of the sensors could be applied in a wide range of frequencies.
2. Materials and Methods
This study was made using a conditioning and measurement systems, which were applied to develop an electronic nose, composed by four commercial gas sensors. Each sensor is very sensitive to different volatiles; in this work, we have selected commercial gas sensors with the aim to make the system more robust and selective (i.e., capable of detecting any volatiles from the response of each individual sensor).
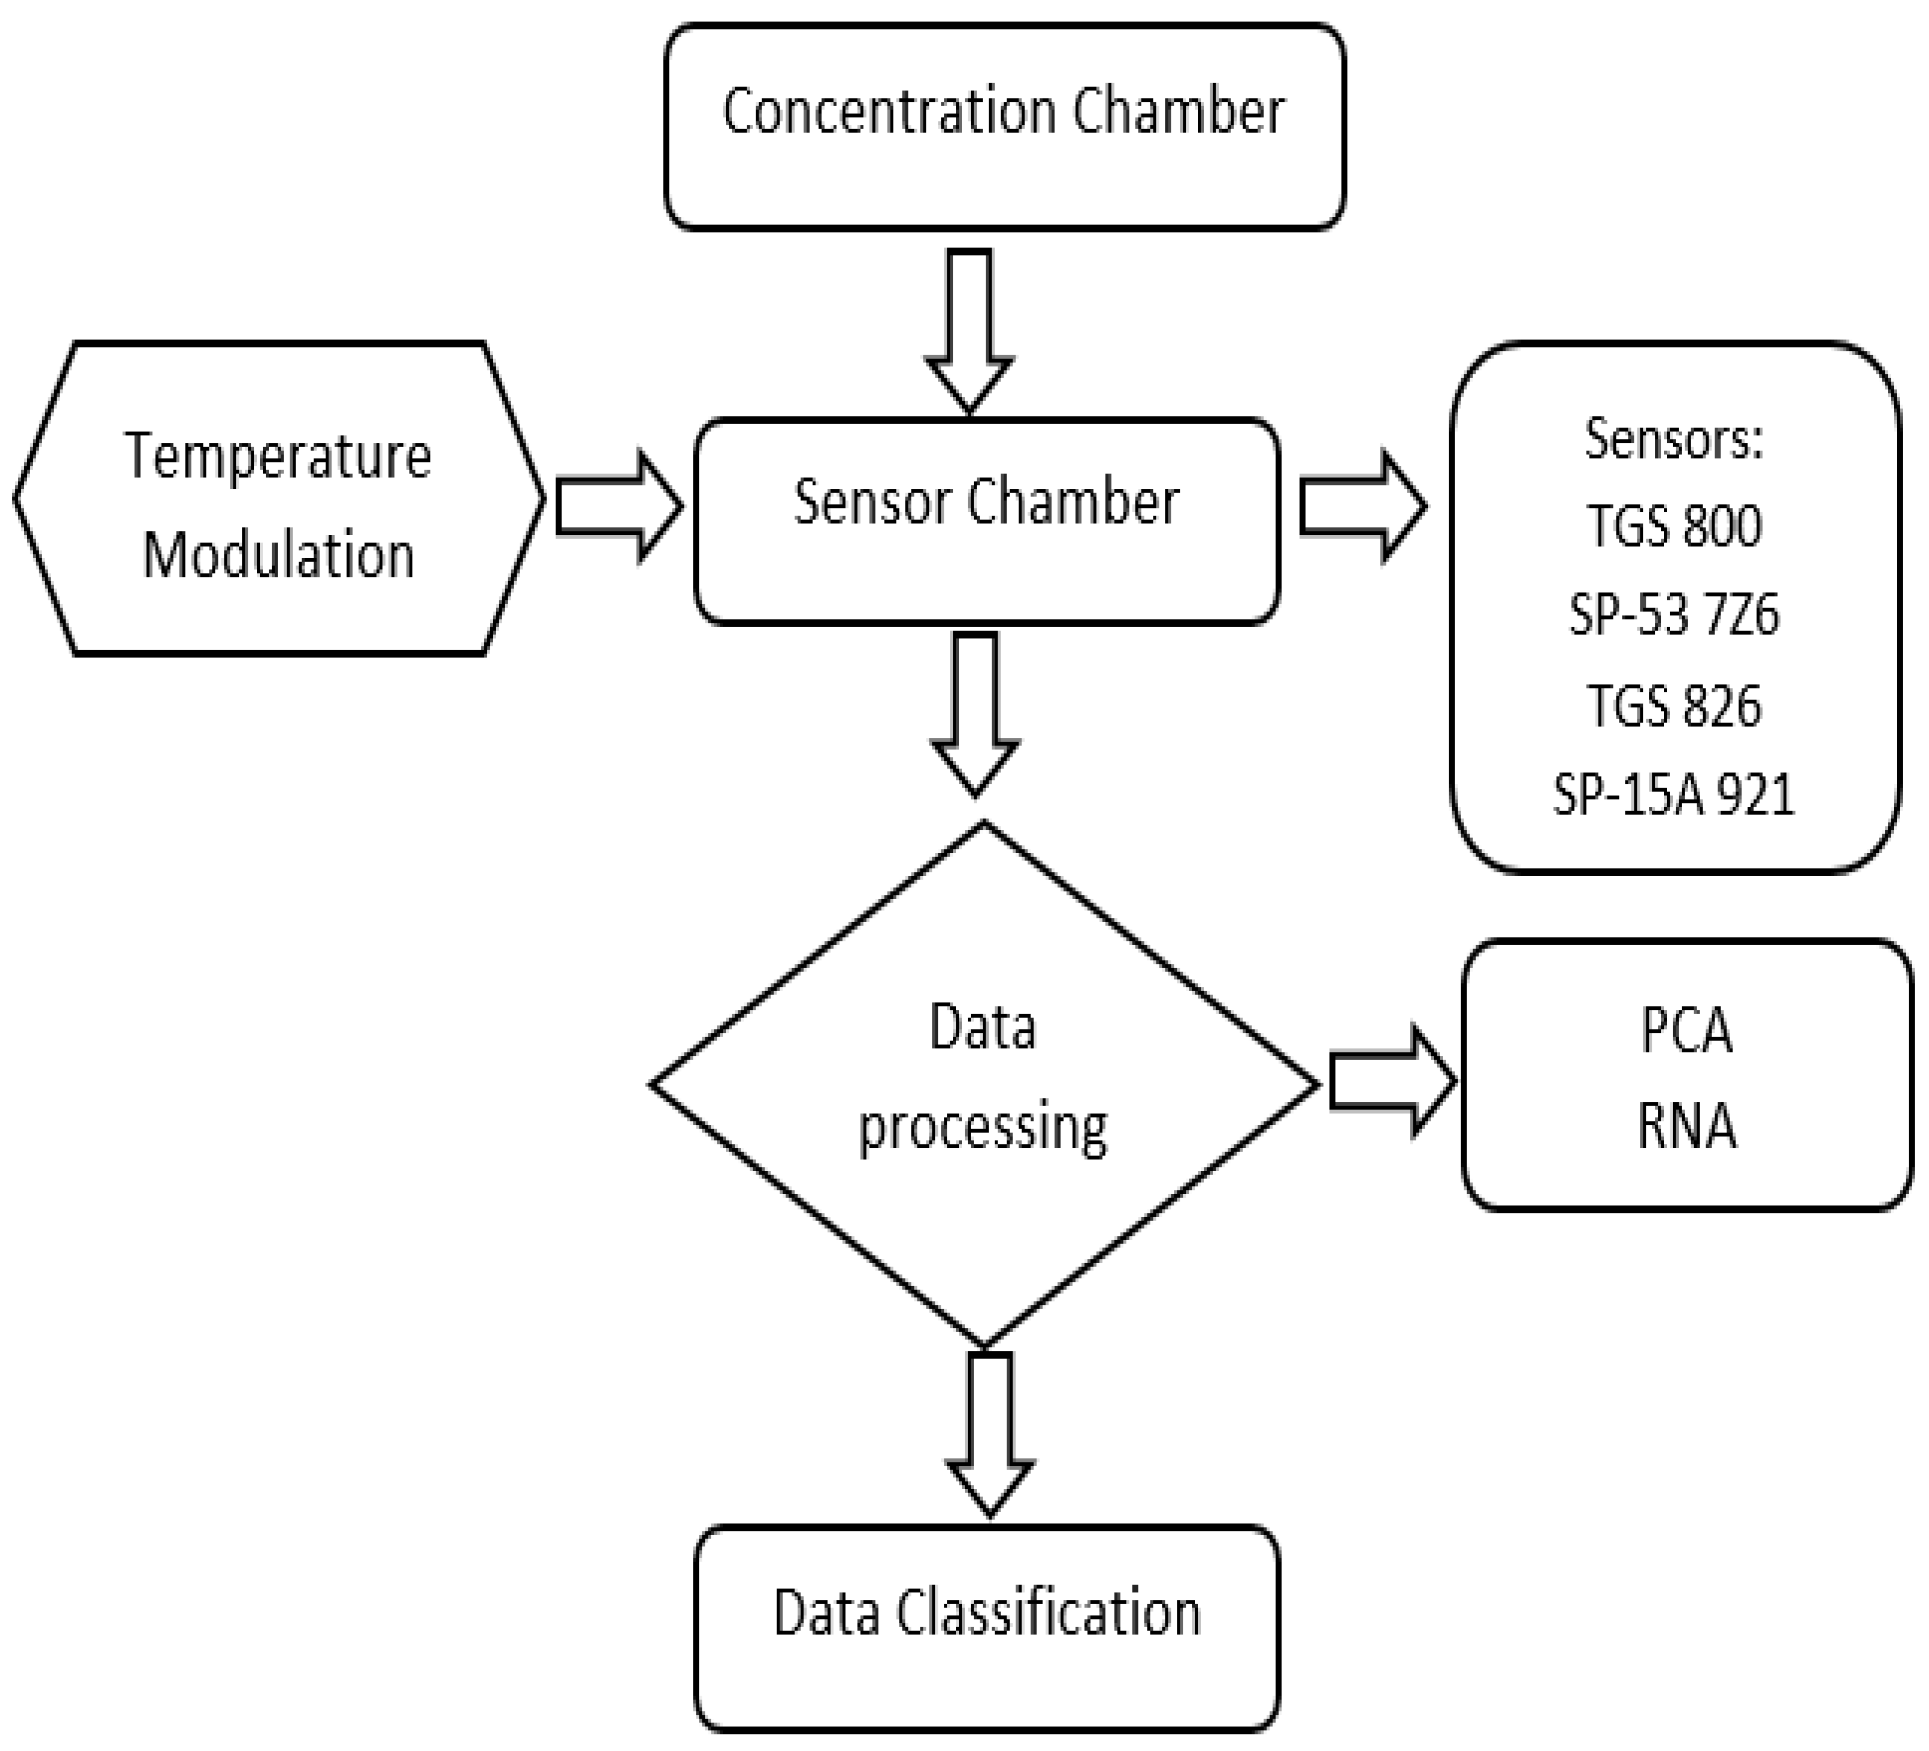
Figure 3 illustrates a block diagram of the classification process using the electronic nose, to which the modulation method was applied.
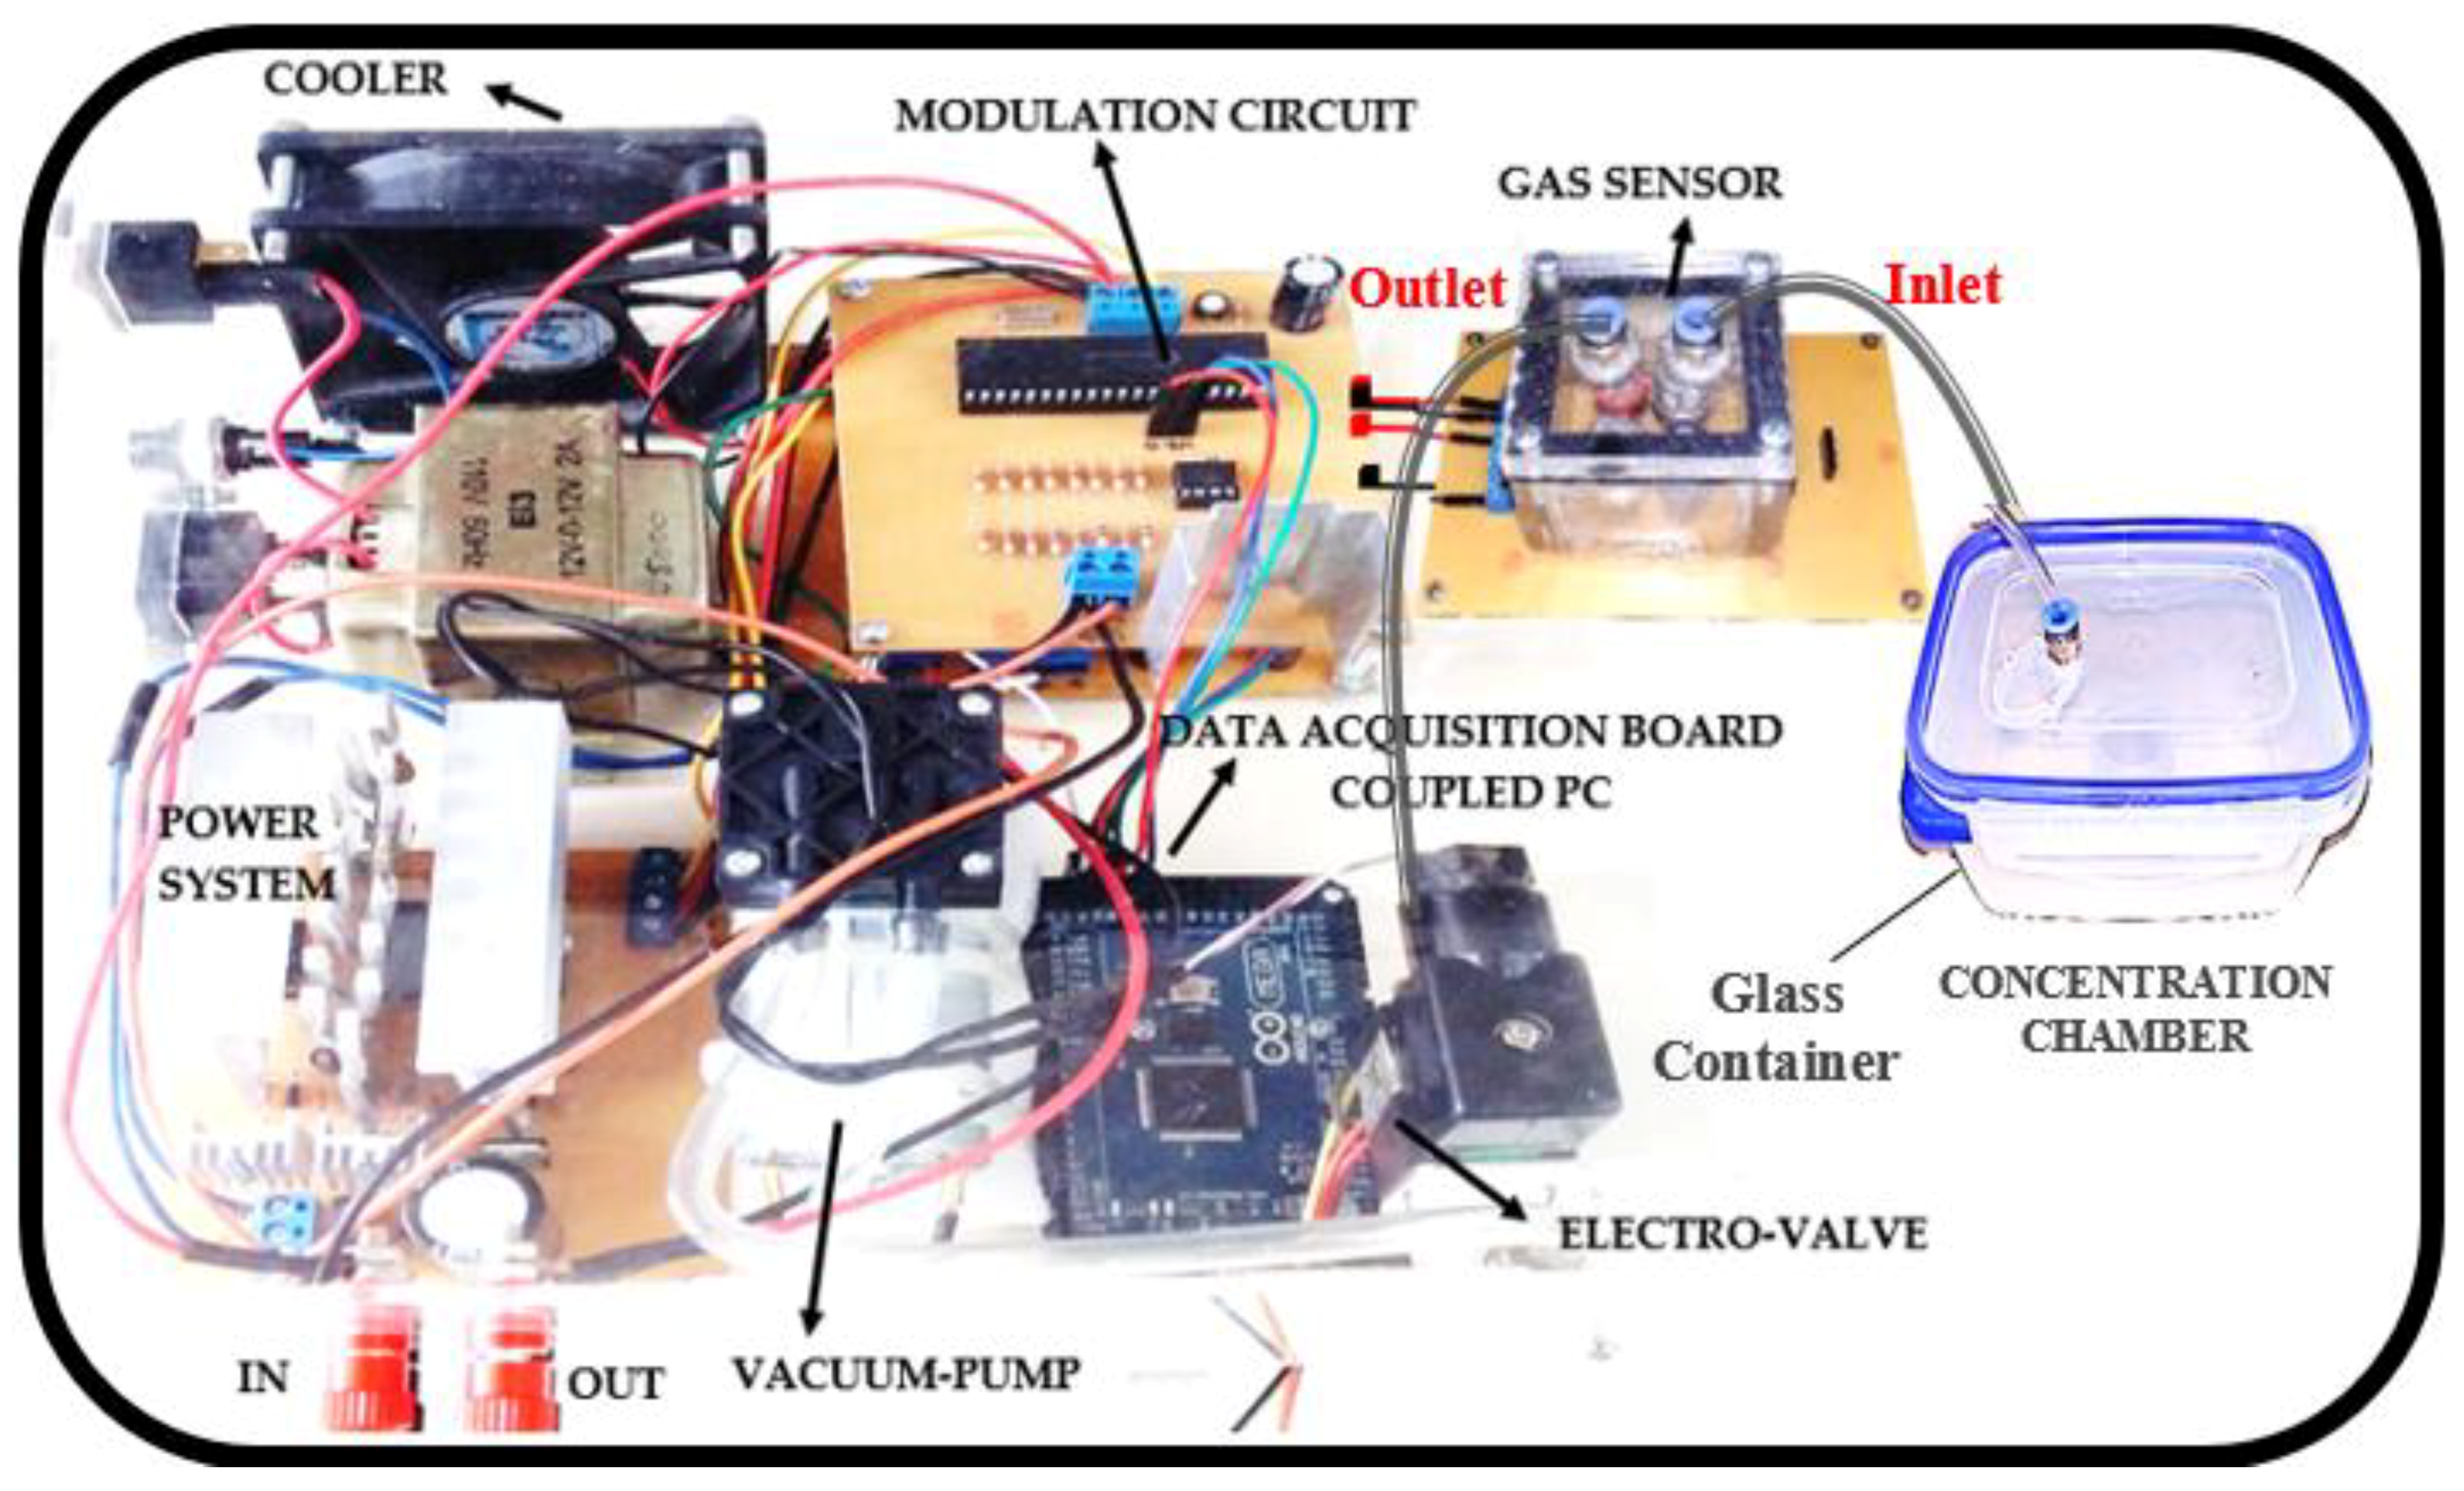
Figure 4 shows the experimental setup of the electronic nose and temperature modulation “homemade”.
The components of experimental setup are shown below:
- ▪
- Concentration chamber
- ▪
- Electro-valve
- ▪
- Vacuum pump
- ▪
- Sensor chamber (gas sensor)
- ▪
- Modulation circuit
- ▪
- Data acquisition board
- ▪
- Power system
2.1. Concentration Chamber
For the design of the concentration chamber, an airtight container of methacrylate material of 200 mL in volume was chosen to keep the sample. The purpose of the concentration chamber is to be used for the volatile compound concentration released from the sample that is inside of the chamber, in order to make the best measurement protocol. For realizing the conditioning of the liquid sample within the concentration chamber, an uncovered container of glass of 4 mL was used to hold the sample. The concentration chamber was composed of one hole located on the top part of the cover, which was connected with the inlet orifice located on top side of the sensor chamber. The air outlet located in opposite side of the sensor chamber coupled to a vacuum-pump, shifts the volatile compounds from the sensor chamber to the output orifice of the system; in this time the sample was measured. On the other hand, through input orifice it is take the air from outside to clean the container as well as piping (i.e., avoiding condensation within the circuit) after the measurement. The concentration chamber was connected to the measuring system through of a two-way solenoid valve, to supply air from the outside at the time to clean the sensors, obstructing the air flow of the chamber which brings a large number of concentrated volatiles while the sensors are cleaned. After the cleansing time of the sensors, large volatile compounds were generated in the concentration chamber, whereas the solenoid valve position was changed making the gas flow through an air pump with a rate of 500 mL/min from the sensor chamber. To deliver the gas to the sensor chamber a one-way direction solenoid valve and vacuum pump were activated to drag all compounds generated from the concentration chamber to sensor chamber; this flow was measured with a rotameter of 0–500 mL/min, reaching an input value of 450 mL/min inside the measurement chamber.
2.2. Modulation System
The modulation circuit designed to vary the temperature of the heating resistor will be show below:
2.2.1. Modulation Circuit
Figure 5 provides the electronic circuit used to generate the square pulses applied to the heater coil of the sensor, in order to modulate the temperature.
For realizing the pulse modulation, an integrated circuit (LM555 oscillator) was used in “stable mode”, which can generate a square pulse; this simple circuit has the advantage because it is possible to know the period, frequency and the work cycle when it is having the resistance and capacitance.
It should be noted that the period is the length of time; it takes ON and OFF cycles to repeat, while the duty cycle is the percentage of time that the output is on (i.e., T1/T).
Also, increasing the value of the resistor R1 will increase the time within a high value (T1) of the cycle, but the time in low (T0) will not be affected.
Increasing the value of resistance R2 will increase the time in high (T1) and the time in low (T0) but will decrease the working cycle to a minimum of 50%.
2.2.2. Generator Circuit of a Sawtooth Signal
The electronic circuit to generate a sawtooth signal was composed of an integrated LM555, which is low cost and very useful to give precise and highly stable delays of time or oscillation. This topology allows for variance of the frequency of work and this can be carried out by simply varying the values of capacitance and resistance of the circuit.
To calculate the frequency generated by this circuit, the following equation was used:
where,
= Voltage supply
= Peak-to-peak output voltage
However, the result of the performed tests could not reach the working cycle with this type of circuit (i.e., 50% or less). Thus, to realize tests with a work cycle less than this value was necessary to use a PIC18F4550 microcontroller, which was used to generate the modulated signals. The output signals of the D port of the microcontroller were connected to an Analog to Digital Converter (ADC), in order to transform the analog signals to digitals with 10 bits of resolution. These signals were coupled to an integrated circuit LM741 to amplify the gas sensor response using the noninverting configuration to increase the voltage levels. Subsequently, a TIP122 darlington switching circuit was used to supply the required current to feed the heating resistors of each gas sensor (Figure S1 of Supplemental Material shows the amplification circuit). An Arduino Mega 2560 card was used for data acquisition with an ADC of 10 bit of ADC resolution.
Figure 6 shows the output times of a Pulse width modulation (PWM) circuit. For the operation of the circuit, the following conditions must be taken into account: Increasing the capacitance, increase the cycle time, therefore the frequency decrease.
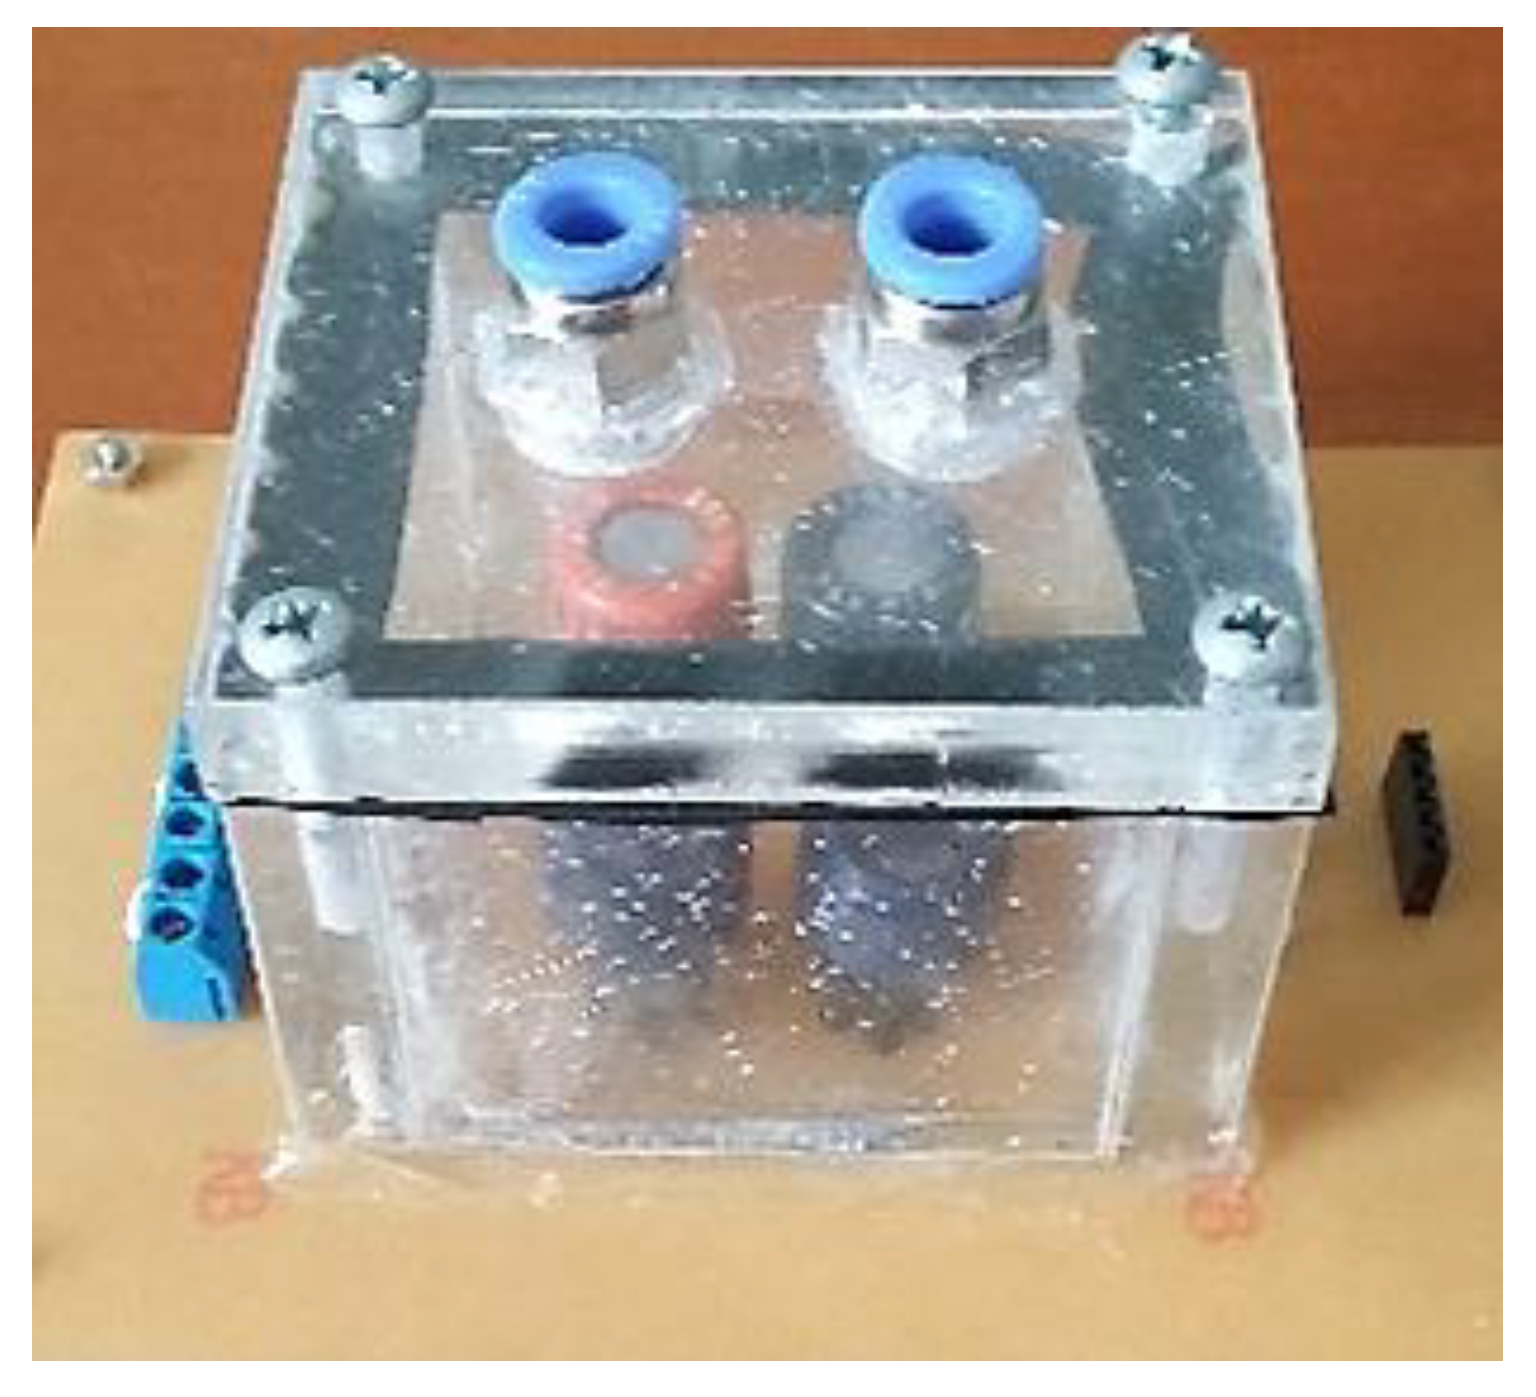
2.3. Gas Sensor Chamber
The gas sensors were located within an airtight chamber with adequate conditions to work properly, preventing that other types of volatiles (from environmental air) can affect the measurements. It had to be ensured that the chamber did not leak when the sample was introduced because it would lose the concentration of the volatile object of study. Table 1 describes the sensors used to be sure what sensors were more sensitive and selective to the different volatile organic compounds (VOC’s).
The sensor chamber (see Figure 7) was composed of four commercial gas sensors (Figaro and FIS SP) manufactured by FIS Inc. Nissha Printing Co., Ltd., (Hyogo, Japan) 1995 and Figaro Engineering Inc. Figaro Gas Sensor Technical Reference, (Arlington, VA, USA) 1969. Each sensor has a different detection characteristic, because they are able to generate a response with any type of volatile compound but will have another response when it is applied a target gas, for which it is more sensitive.
Each sensor has different sensitivity depending on the volatile target, this selection was made in order to obtain an efficient and selective response at the time of making the discrimination of a volatile compound. The chamber was constructed with acrylic material of 1-cm thickness, and on the top part, there are two holes that allow for the entrance and exit of air, through which the air of the sample should circulate with a constant flow.
To keep the chamber tightly sealed, four screws were used to generate pressure on the cover and the body respectively. It is covered rests on a rubber that ensures the tight seal and prevents leaks. The sensors inside the chamber were operated with 5 DC volts and the heating resistors were connected to the modulation circuits. The sensor chamber was designed to change the configuration of the sensors, since these were connected with different sockets to take out the sensors easily. The load resistor connected to the output of the sensors has a fixed value of 4.7 kΩ; this resistance fulfills the function of a voltage divider, which allowed to obtain a voltage variation when a volatile compound it is supplied to the sensor chamber.
2.4. Data Acquisition System
As mentioned above, in order to make the modulation process for the gas sensors array, an PIC18F4550 microcontroller and Arduino card 2560 were used for conditioning circuit, data acquisition, generating the modulated signals, and digital control.
The card has eight analog inputs channels; only four of them were used for data acquisition of gas sensors array and the experimental setup was done for 10 samples/second of the sampling rate and 2.5 mV of resolution to 10 bits.
Two digital output channels were used for control the activation of a solenoid valve and vacuum pump; the power system was totally automatic.
2.5. Data Processing
For data processing, an unsupervised algorithm called principal component analysis (PCA) was applied to the data set. This multivariate data analysis method is useful in feature reduction, data compression, and variable selection and sometimes used for noise reduction [28]. This powerful tool for data analysis was selected in this application since it is an effective linear unsupervised and supervised method to extract the most relevant information and project data from several sensors to a two-dimensional plane using a scores plot. Therefore, it is possible to discriminate properly a measure set, finding the directions of maximal variance [29]. PCA returns a new basis, which is a linear combination of the original basis. Each vector (orthogonal) has an amount of variance in the data set with a different degree of importance. The scalar product of the orthogonal vectors gives the value of the principal component.
3. Results
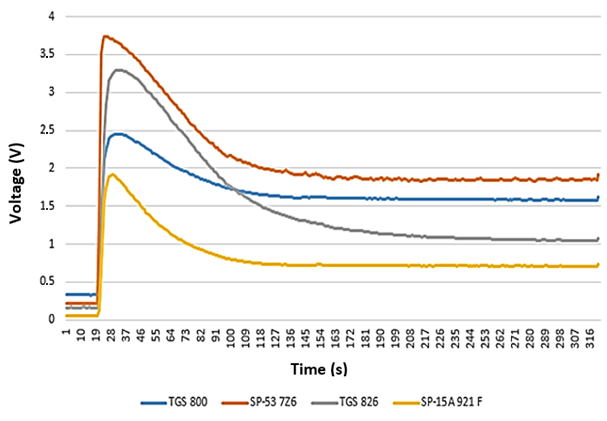
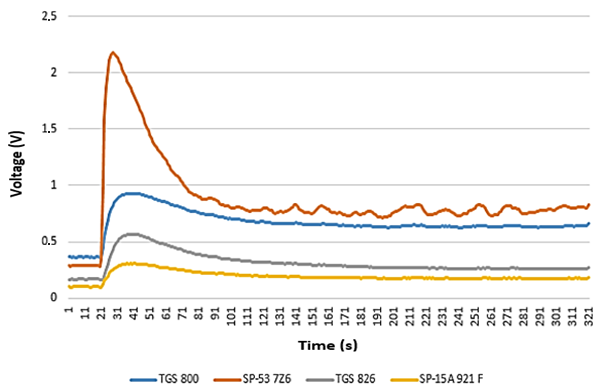
Figure 8 shows the gas sensors’ responses (TGS 800, SP-53, TGS 826 and SP-15A 921 F, manufactured by FIS inc, Hyogo, Japan and Figaro, Arlington, VA, USA) at the instant when the heating resistors without temperature modulation was applied. The figure depicts the sensors sensitivity to a sample of 2 mL of ethyl alcohol at 70% concentration, which was supplied to them. In this way, the gas sensor response could be determined by using a continuous voltage of 5 volts applied to the heating resistor, obtaining a very high percentage of sensitivity. Furthermore, they responded instantly to the sample concentrated previously within the chamber and the type of compound was also determined. The TGS 800 sensor is widely used to recognize gases, such as air and hydrogen. The TGS 826 sensor is used to recognize ammonia; a response characteristic is present when these gases are supplied.
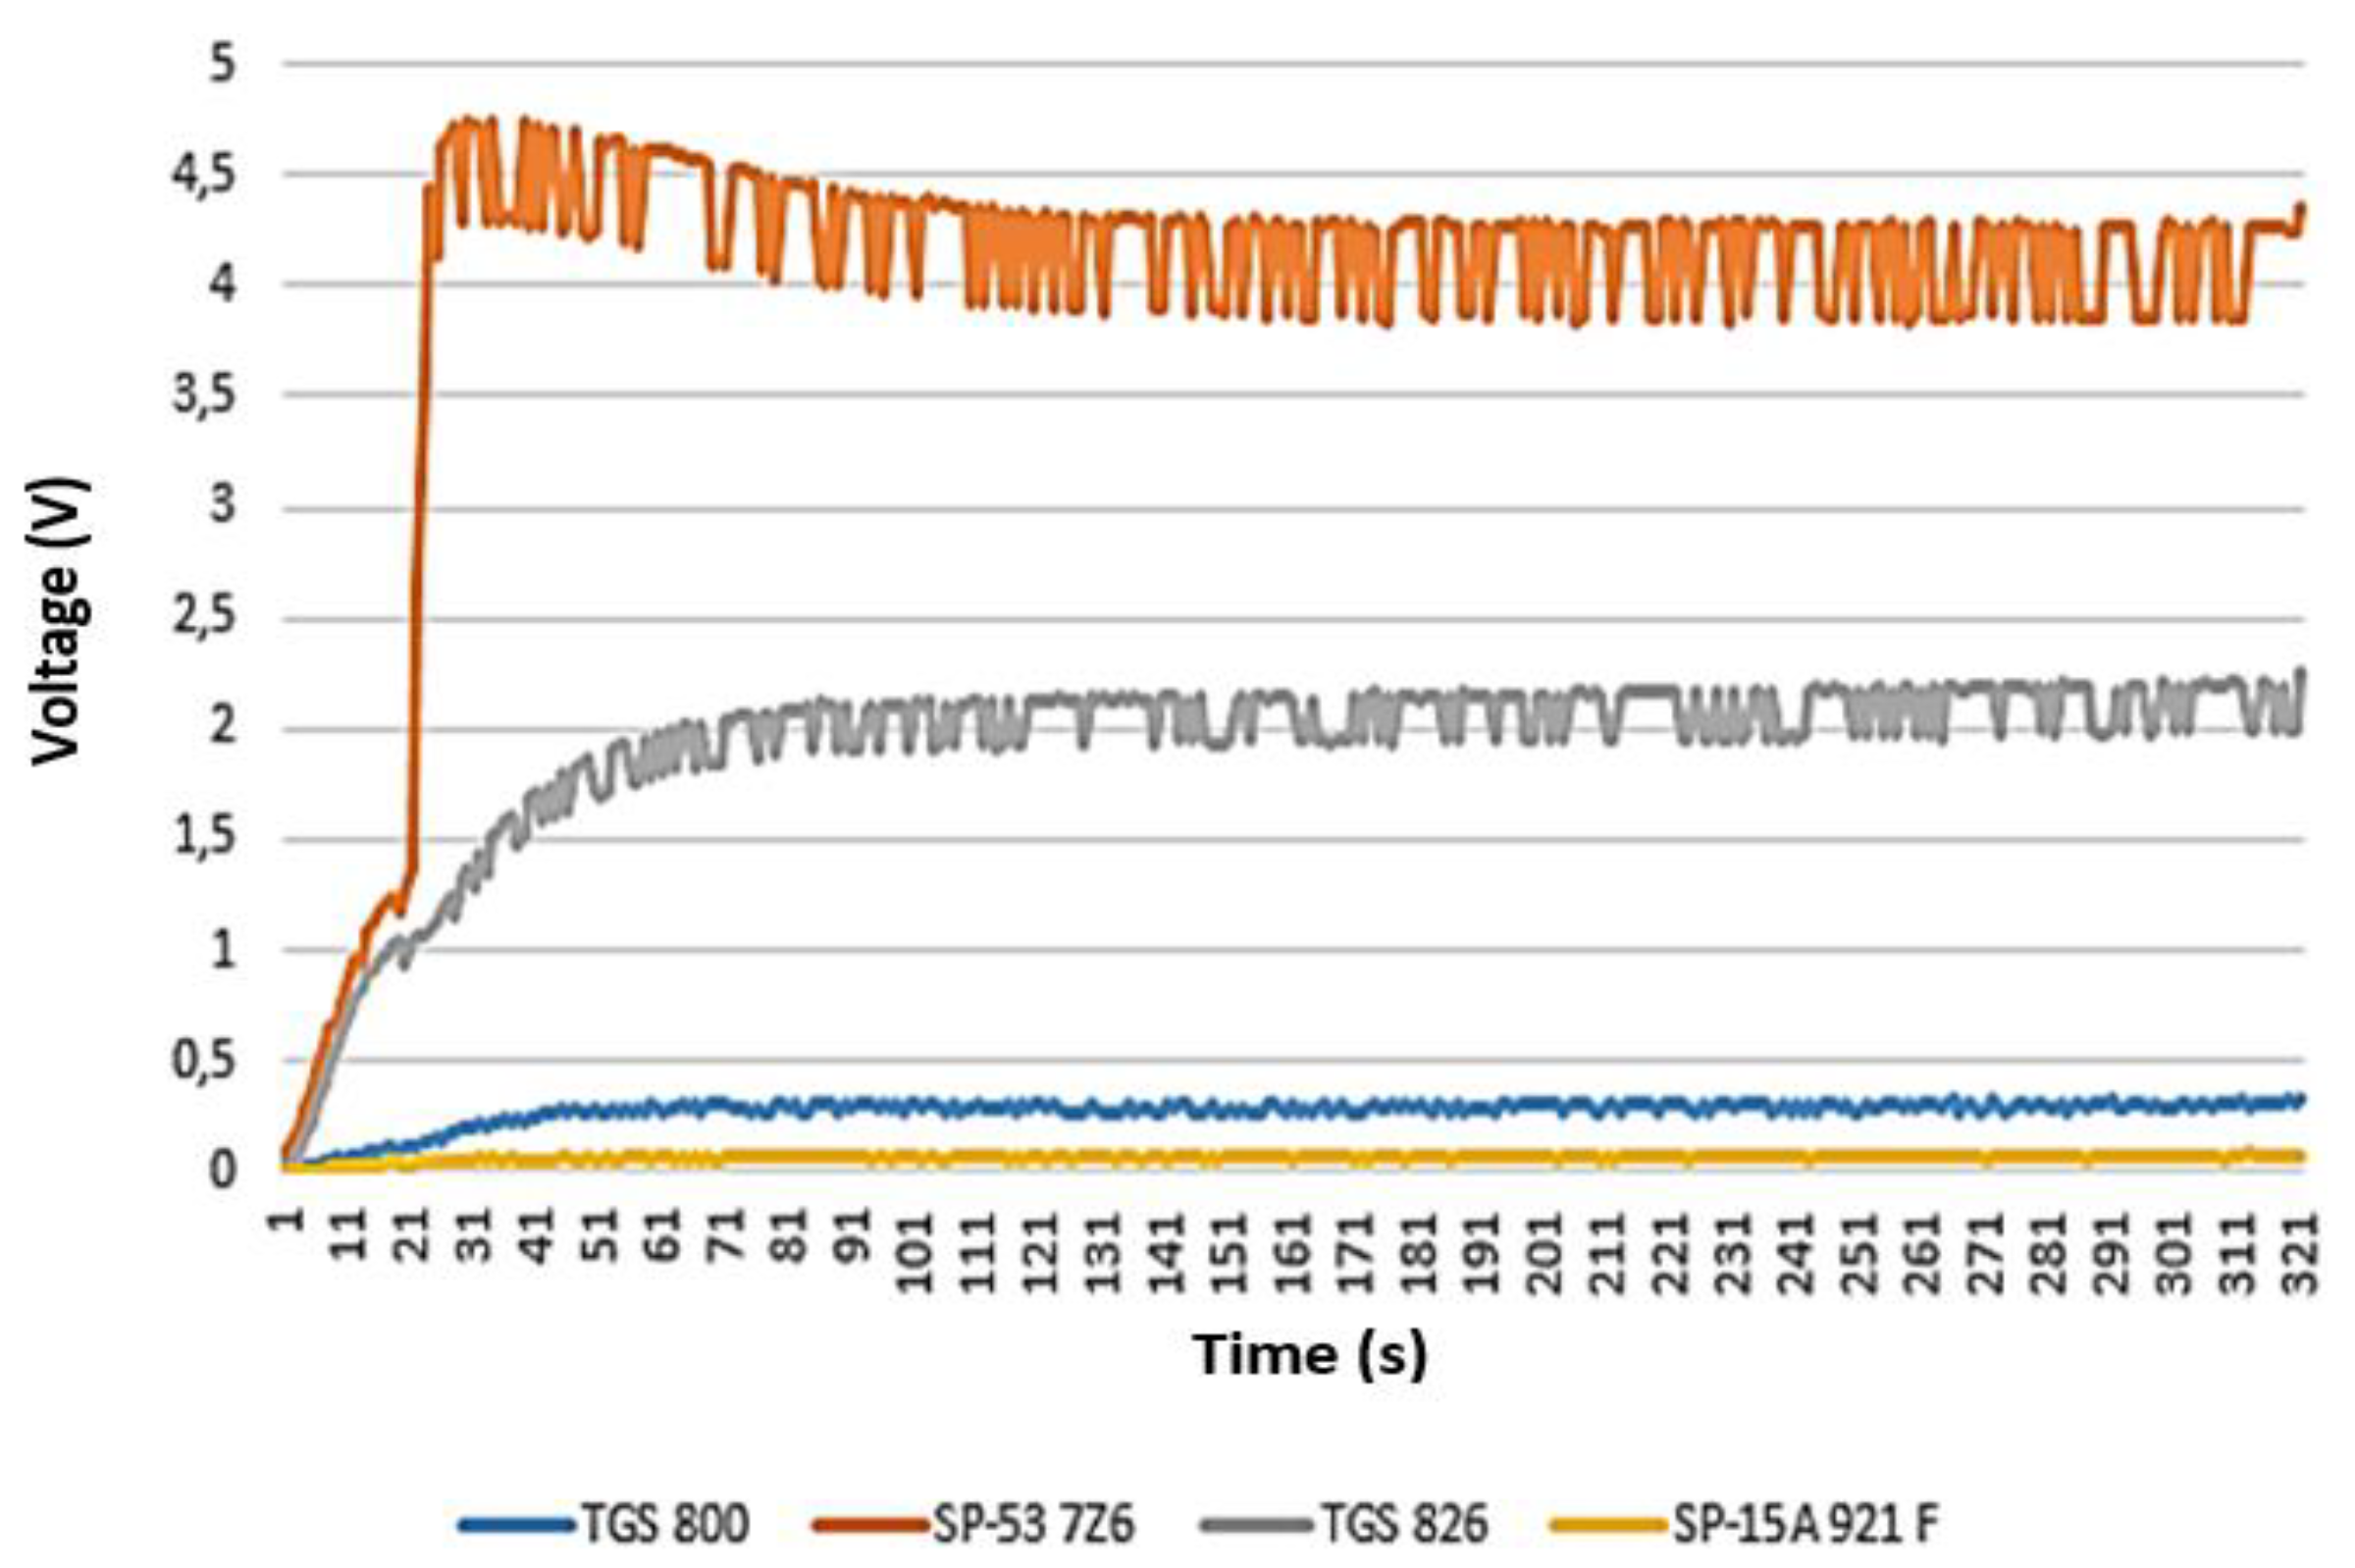
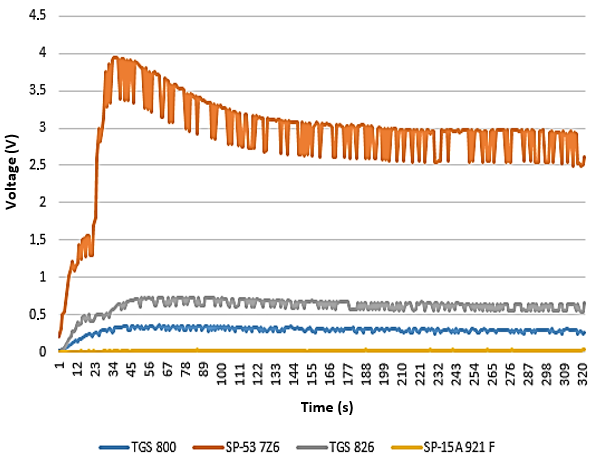
The sensors response can be observed in Figure 9, when a PWM modulation using a DC voltage of 0–4.5 Volts was applied to the heater resistor with a frequency of 490 Hz and a 33.3% duty cycle, since it was generated using the same concentration parameters of the sample. From this point of view, the behavior of sensors with modulation and with constant voltage of 5 volts was evaluated, and determined a low energy consumption through this method, as well as good accuracy and repetitiveness.
When deducing the graph of the voltage response of the sensors by applying a PWM modulation with a duty cycle of less than 50%, it can be seen that the response when the sensor is powered, tends to a maximum amplitude value. Thus, it is very similar to a response without modulation in the heater resistor, but with the difference that the response with the modulated signal in the heater tends to be kept longer with the maximum value, whereas the response when a continuous signal in the heater has a slope and tends to remain at a half value approximately of the maximum value obtained, when the sample is applied.
It could also be noticed that the gas sensors response SP-53 7Z6, TGS 826 and SP-15 921 F, changed completely since none of the sensors reached the maximum value obtained, when the signal without modulation was applied to the heating resistor. In this case, the sensitivity of the sensor SP-53 7Z6 improved applying PWM modulation and the power consumption was reduced almost 3/4 of the real value (400 mW). During all tests the other sensors responded in similar way but TGS 826 and SP-15 921F sensors obtained a very small voltage response, such as can be seen in the figure, the maximum voltage reached did not exceed 0.5 volts, but nevertheless, it can be said that these sensors responded immediately when the alcohol sample was applied, which was previously concentrated inside the chamber. Figure 10 illustrates the response of the sensors subjected to the continuous airflow of a sample of 2 mL of 1% of Moscatel wine made in Colombia.
The behavior of this signal was determined when a sample of 2 mL of Moscatel wine at 2% of alcohol was supplied to the sensor chamber. In this case, the amplitude of the signal changes as it is smaller when a sample of wine is applied. Figure 11 illustrates the response of the sensors exposed to the continuous airflow of a sample of 2 mL of Moscatel wine to 2% by applying a PWM modulation with a frequency of 490 Hz and a duty cycle of 33.3%. In this experiment, the voltage applied to the heater resistance was 0–4.5 volts, since the temperature modulation was applied. Therefore, the sensor response (i.e., selectivity) was better in contrast when was applied only 5 volts using constant voltage. In this case, the sensitivity as well as sensibility of SP-53 sensor increased, giving a voltage response higher when the wine sample was supplied.
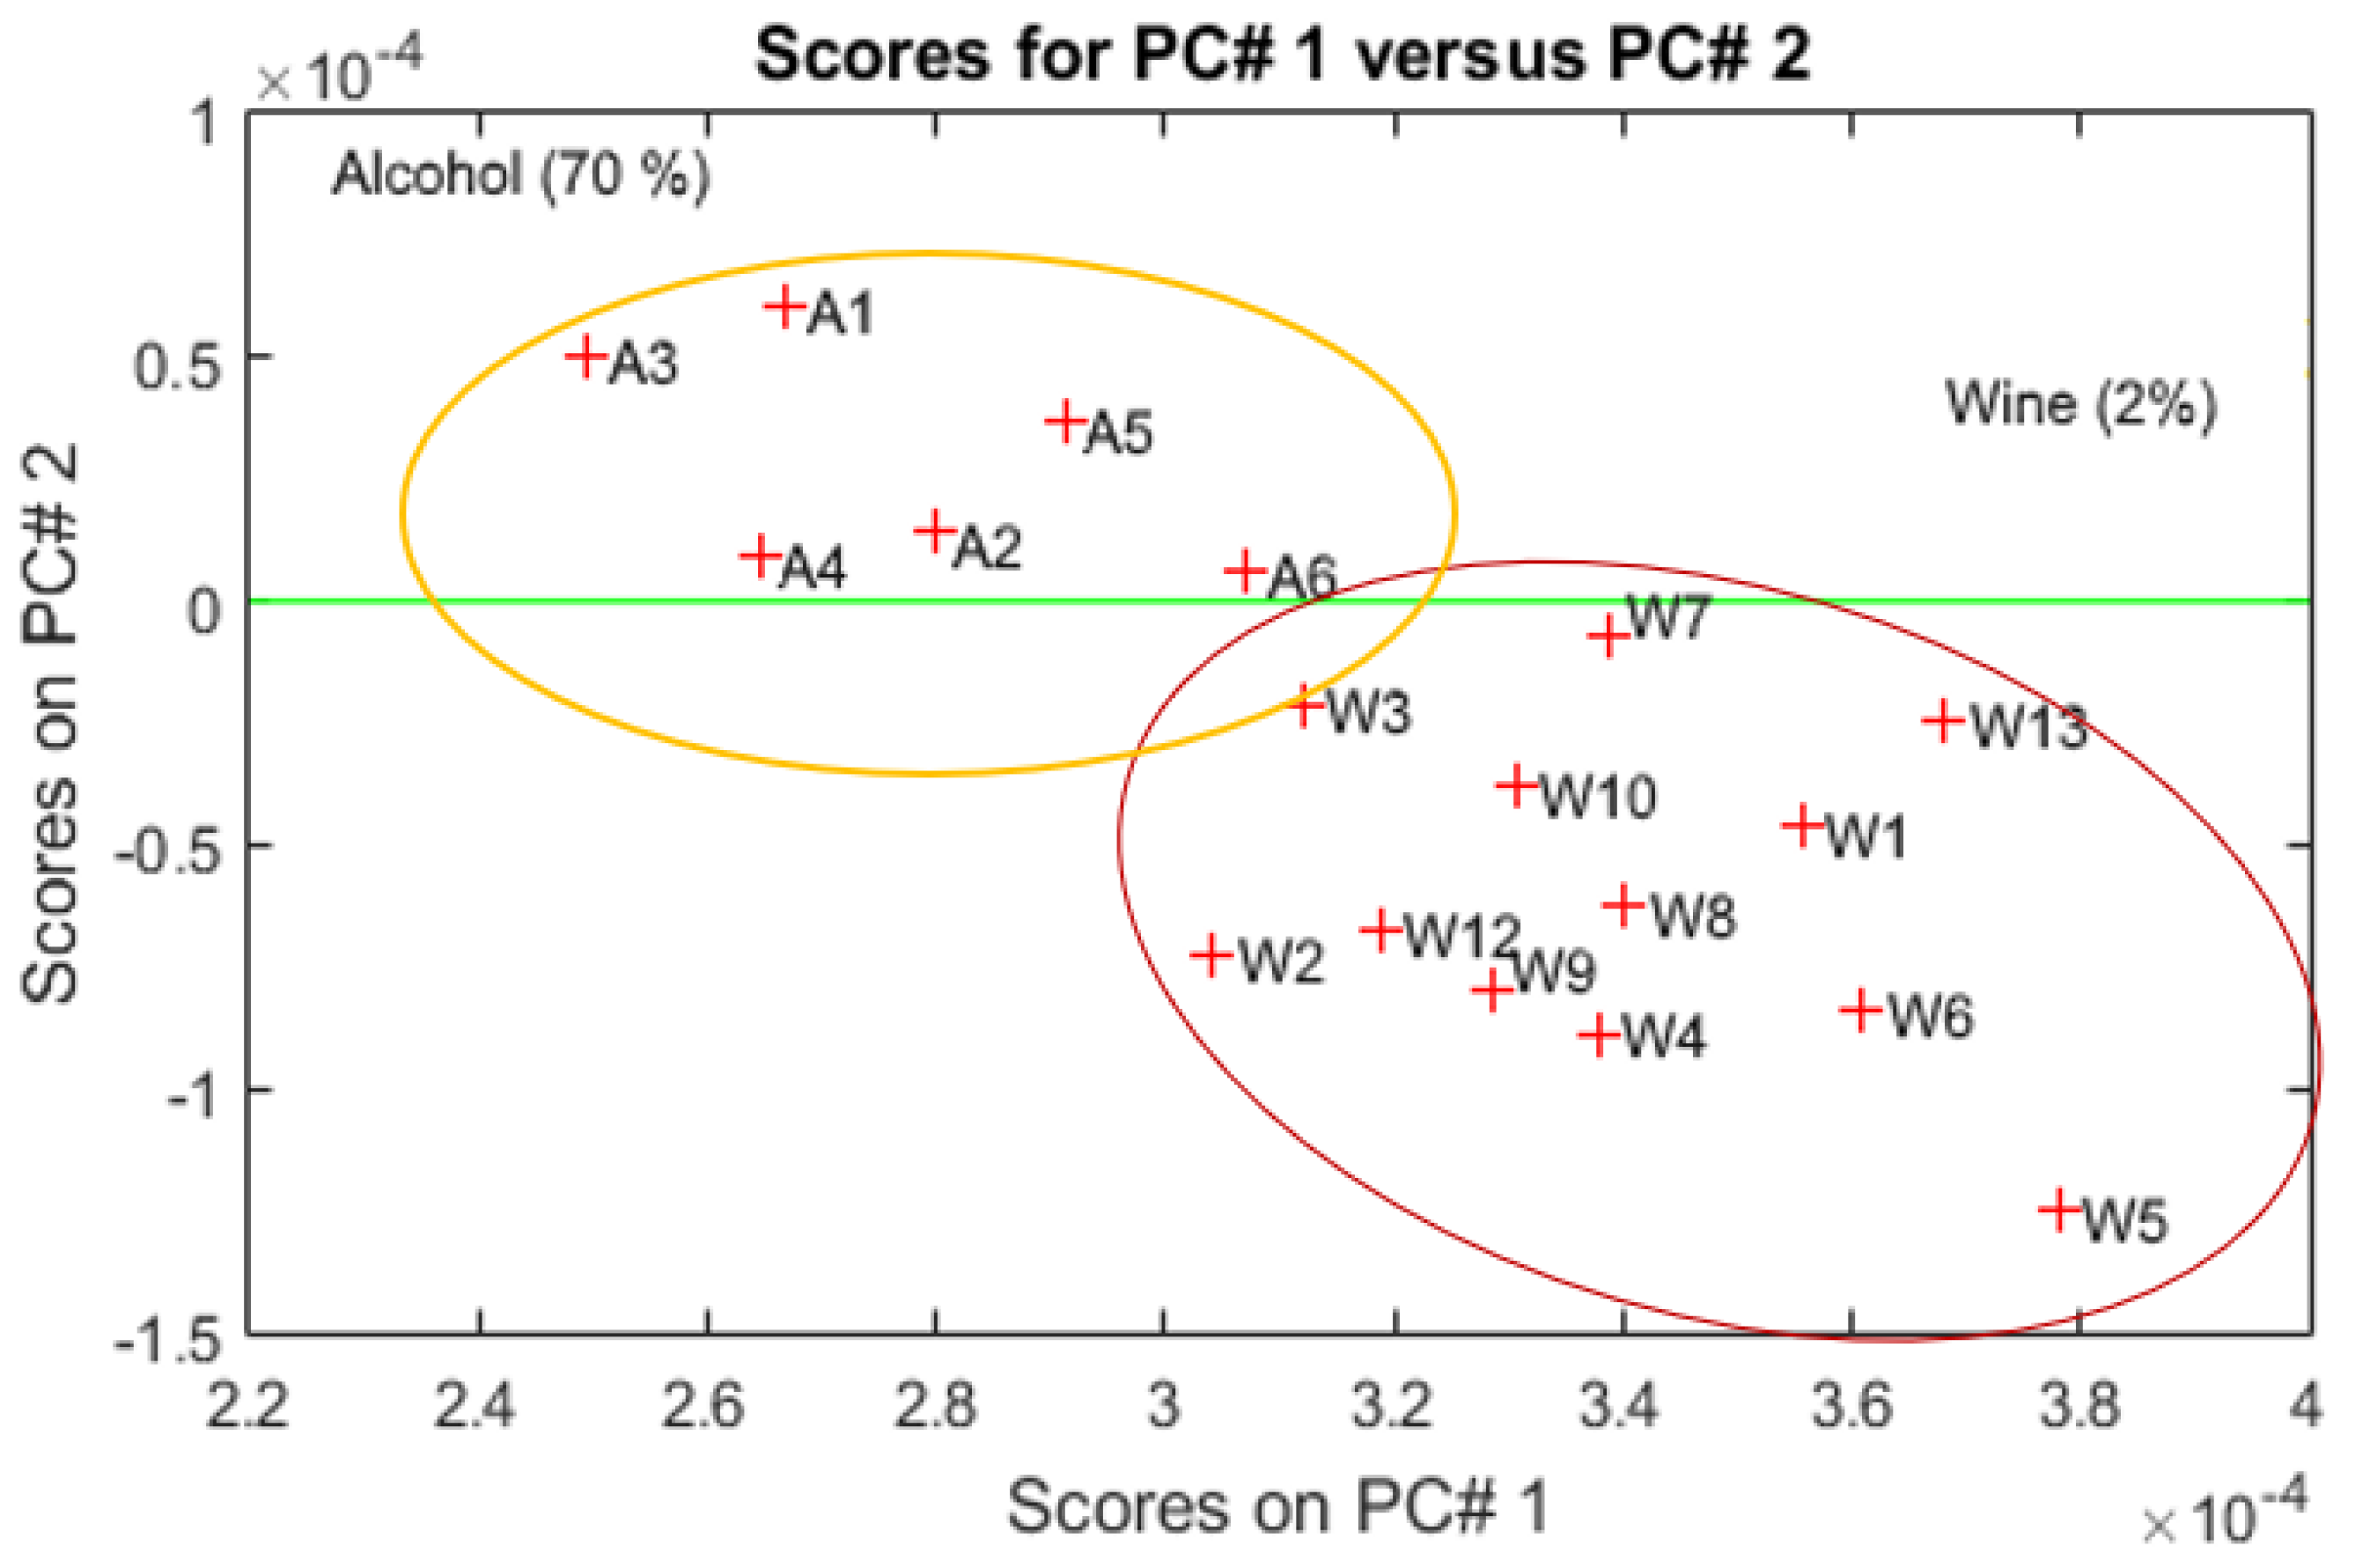
Despite reducing the amplitude of SP-15A and TGS 800 with temperature modulation, the selectivity and sensitivity of SP-53 and TGS 826 sensor was possibly improved, achieving an excellent amplitude response. Worth noting is that they are still sensitive when the temperature modulation was used. The amplitude of the signal tends to remain stable after reaching the maximum amplitude, this was a satisfactory response being for analysis and data processing. In this preliminary study, it can be said that the response of the sensors can reach a good performance when modulation is applied, whereas the data processing can be easily at the moment to obtain the data discrimination and/or success rate of classification. The changes of voltages produced by the sensors and each response varies the amplitude according to the type of volatile compound. To get the discrimination of data set, a modulated sawtooth signal was used to the heater of each sensor. Then, a data matrix with 19 measurements and 4 sensors was performed using 13 measurements of Moscatel Wine (W) with 2% of alcohol and six measurements with 70% of ethyl alcohol (A)). To apply the PCA analysis, a statistical parameter ( was used (Gmax is the maximum conductance and Gmin is the minimum conductance), in order to obtain the relevant information of data set. Also, a normalization method (i.e., autoscaled) was calculated and applied previously, making all the sensors with equal weight. Figure 12 shows the PCA analysis without temperature modulation, where a good discrimination was obtained using the two first PC’s, with 80.5% of variance and 90.2% of accuracy the data set.
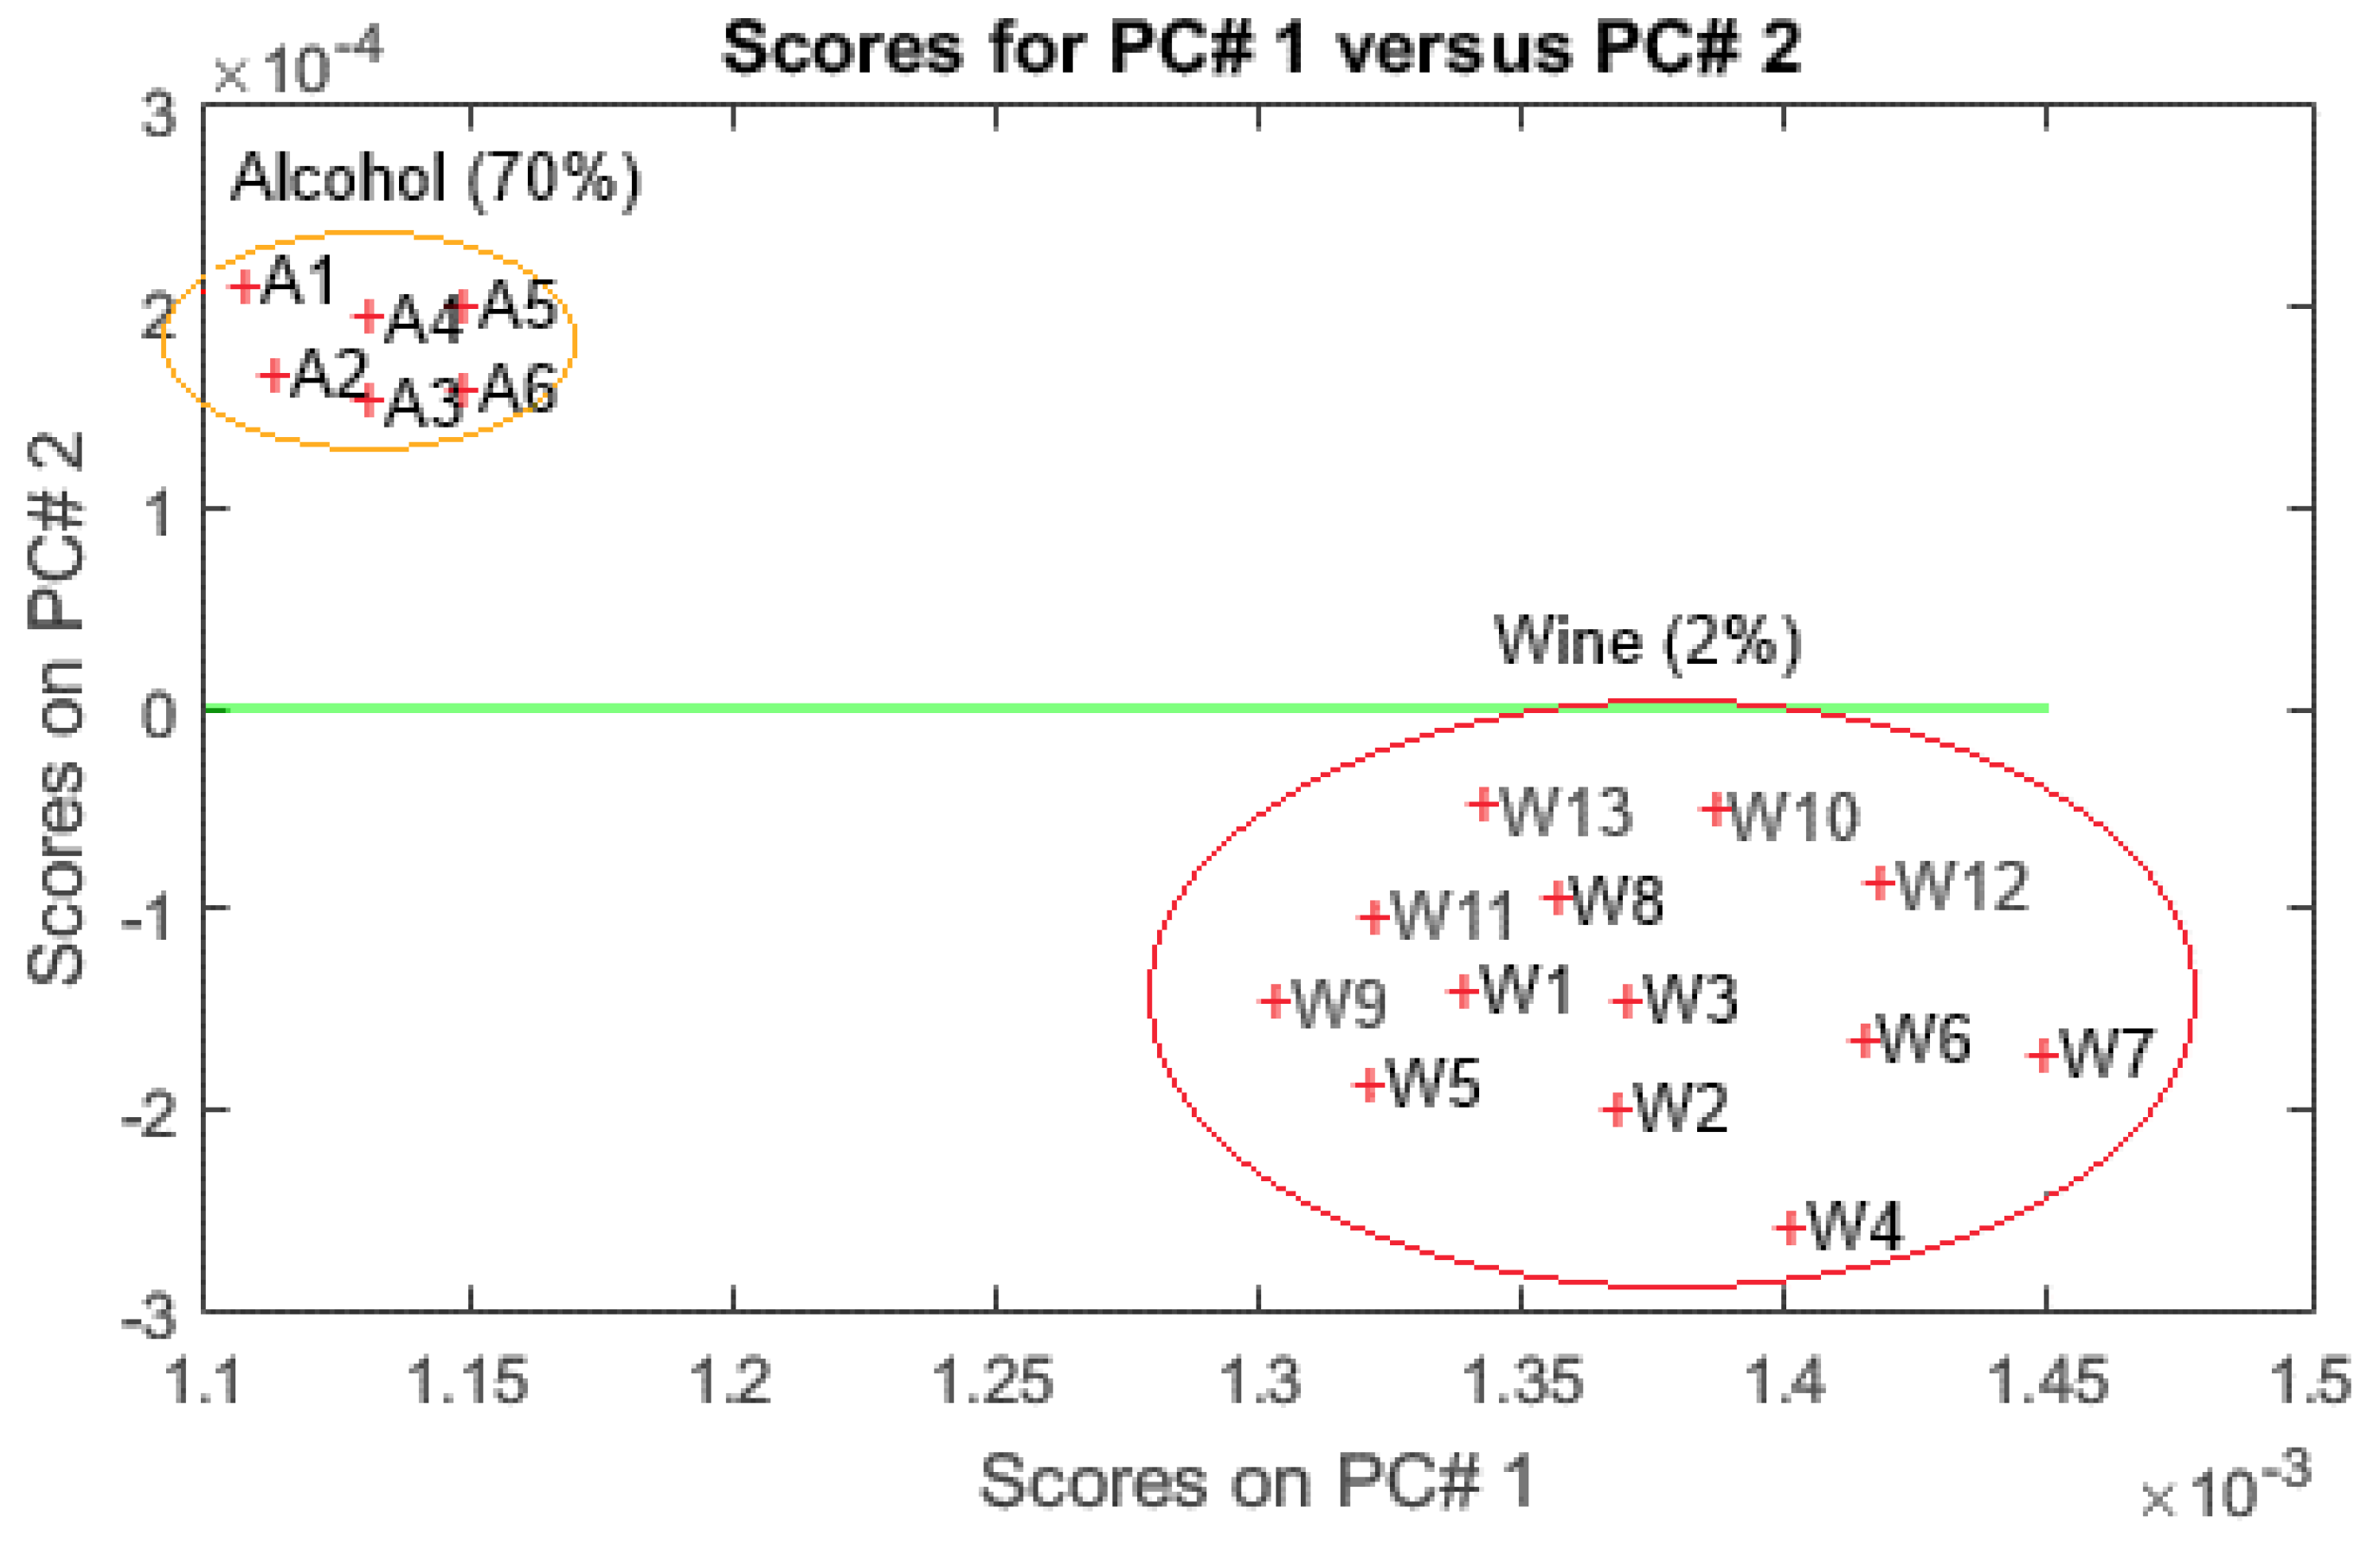
Using the same inputted normalized data but with temperature modulation and the following parameters applied to the heater resistor: DC voltage of 0–4.5 Volts and frequency of 490 Hz and 33.3% duty cycle, the PCA analysis was calculated obtaining a better discrimination of the data set. Figure 13 illustrate the PCA analysis results using temperature modulation.
The PCA was performed with all sensors since the features extracted and responses of them were suitable. This figure depicts an excellent discrimination using the two first PC’s, reaching 94.5% of variance and 100% of accuracy the data set. By comparing both figures it is important to note that the results with temperature modulation showed a better sensitivity, selectivity, and repeatability.
The loadings plot in Figure 14 confirmed that the contribution of all sensors using temperature modulation is important for the results obtained. A significant difference could be observed on PC2 loadings between the sensors (see Table 1), since the contribution of original variables represented in S2 (SP-53) and S3 (TGS-826) was most significant in comparison with S1 (TGS 800) and S4 (SP-15A), which were projected in the negative and positive region of the axis.
In this study, the main purpose of this test was tried to discriminate between two compounds with different degrees of alcohol, in order to obtain an approximation of the performance of sensors when they are subjected to this type of modulation. With these preliminary results would be possible to implement this system in food applications to evaluate the different degrees of alcohol in several types of wines.
4. Conclusions
In this study, a multisensorial device was developed and implemented in order to obtain electrical signals produced by the gas sensors when a volatile compound was supplied and the temperature of the heater was applied to change the response through modulation techniques. The signals from the gas sensors were acquired by a low-cost data acquisition card and then were stored in a computer to perform the data processing and classification.
According to the measurements obtained with the electronic nose system, it was possible to determine which sensors vary their response according to the type of modulation that is useful to the heater.
The performance of the electronic nose system improved when a temperature modulation was applied to each sensor; it could be noticed since the sensors generated a voltage output, whereas was possible to identify the final voltage to be applied to each sensor. This promising behavior of the sensor allowed for the implementation of a processing and/or discrimination method for volatile compounds discrimination; for example, to obtain the relevant information of data set we used the static parameter, , whereas was possible to extract and feed to a pattern recognition techniques like PCA analysis.
The sensitivity of sensor SP-53 was better unlike other when temperature modulation was applied, giving a voltage response almost instantaneously when the wine and alcohol samples were conditioned.
An excellent discrimination using two PCs with 94.5% of variance and 100% of accuracy of data set was reached, when the sensors were exposed to a continuous flow of a wine sample (i.e., 2 mL of wine to 2% and 70% of ethyl alcohol) by applying a PWM modulation with a frequency of 490 Hz and a duty cycle of 33.3%. When applying another type of data processing method, a better comparison could be made to perform the discrimination or classification of measurements, and with this result, to validate the response of the sensory system through the temperature modulation.
The results with PCA analysis could be obtained in fast and easy form, as it was possible to acquire the information in the “online” mode and realize the processing instantly.
Considering these preliminary results, the idea in the future will be to improve the energy consumption and behavior of Metal Oxide (MOX) sensors with other modulation methods in order to be used in different applications.
Supplementary Materials
The following are available online at https://www.mdpi.com/2079-9292/7/4/54/s1, Figure S1: Modulation circuit, shows the amplification circuit which was used to supply current in order to feed the heater resistor of each gas sensor.
Author Contributions
Cristhian Durán organizes the materials and writes the manuscript. Juan Benjumea provides the technical feedback and Jeniffer Carrillo revises and proofread the manuscript.
Conflicts of Interest
The authors declare no conflict of interest.
References
- Balasubramanian, S.; Amamcharla, J.; Shin, J. Possible Application of Electronic Nose Systems for Meat Safety, Electronic Noses and Tongues in Food Science; Chapter 7; Elsevier Inc.: Barrington, IL, USA, 2016; pp. 59–71. [Google Scholar]
- Alphus, D.W.; Baietto, M. Applications and advances in electronic-nose technologies. Sensors 2009, 9, 5099–5148. [Google Scholar]
- Delgado, R.; Ruiz, M.; Giraldez, I.; López, R.; Madejón, E.; Díaza, M. Use of electronic nose and GC-MS in detection and monitoring some VOC. Atmos. Environ. 2012, 51, 278–285. [Google Scholar] [CrossRef]
- Polese, D.; Martinelli, E.; Catini, A.; D’Amico, A.; Di Natale, C. Self-Adaptive Thermal Modulation of Gas Sensors. Procedia Eng. 2010, 5, 156–159. [Google Scholar] [CrossRef]
- Fort, A.; Gregorkiewitz, M.; Machetti, N.; Rocchi, S.; Serrano, B.; Tondi, L.; Ulivieri, N.; Vignoli, V.; Faglia, G.; Comini, E. Selectivity enhancement of SnO2 sensors by means of operating temperature modulation. Thin Solid Films 2002, 418, 2–8. [Google Scholar] [CrossRef]
- Gosangi, R.; Gutierrez-Osuna, R. Active temperature modulation of metal-oxide sensors for quantitative analysis of gas mixtures. Sensors Actuators B 2013, 185, 201–210. [Google Scholar] [CrossRef]
- Martinelli, E.; Polese, D.; Catini, A.; D’Amico, A.; Di Natale, C. Self-adapted temperature modulation in metal-oxide semiconductor gas sensors. Sensors Actuators B 2012, 161, 534–541. [Google Scholar] [CrossRef]
- Ngo, K.; Lauque, P.; Aguir, K. High performance of a gas identification system using sensor array and temperature modulation. Sensors Actuators B 2013, 124, 209–216. [Google Scholar] [CrossRef]
- Ortega, A.; Marco, S.; Perera, A.; Šundic, T.; Pardo, A.; Samitier, J. An intelligent detector based on temperature modulation of a gas sensor with a digital signal processor. Sensors Actuators B 2001, 78, 32–39. [Google Scholar] [CrossRef]
- Zhao, Z.; Tian, F.; Liao, H.; Yin, X.; Liu, Y.; Yu, B. A novel spectrum analysis technique for odor sensing in optical electronic nose. Sensors Actuators B 2016, 222, 769–779. [Google Scholar] [CrossRef]
- Vergara, A.; Martinelli, E.; Llobet, E.; D’Amico, A.; Di Natale, C. Optimized feature extraction for temperature-modulated gas sensors. J. Sensors 2009, 10. [Google Scholar] [CrossRef]
- Bora, A.; Chandra, K. A temperature modulation circuit for metal oxide semiconductor gas sensor. Indian J. Sci. Technol. 2015, 8. [Google Scholar] [CrossRef]
- Burgués, J.; Marco, S. Low power operation of temperature-modulated metal oxide semiconductor gas. Sensors 2018, 18, 339. [Google Scholar] [CrossRef] [PubMed]
- Spinelle, L.; Gerboles, M.; Kok, G.; Persijn, S.; Sauerwald, T. Review of portable and low-cost sensors for the ambient air monitoring of benzene and other volatile organic compounds. Sensors 2017, 17, 1520. [Google Scholar] [CrossRef] [PubMed]
- Burgués, J.; Fonollosa, J.; Marco, S. Discontinuously operated MOX sensors for low power applications. In Proceedings of the ISOCS/IEEE International Symposium on Olfaction and Electronic Nose (ISOEN), Montreal, QC, Canada, 28–31 May 2017. [Google Scholar]
- Dattoli, E.; Davydov, A.; Benkstein, K. Tin oxide nanowire sensor with integrated temperature and gate control for multi-gas recognition. Nanoscale 2012, 4, 1760–1769. [Google Scholar] [CrossRef] [PubMed]
- Alphasense Company© 2018. Available online: http://www.alphasense.com/WEB1213/wp-content/uploads/2017/07/MMO-CO.pdf (accessed on 1 January 2018).
- Kim, J.H.; Zhou, Q.; Chang, J. Suspended graphene-based gas sensor with 1-mw energy consumption. Micromachines 2017, 8, 44. [Google Scholar] [CrossRef]
- The eNose Company© 2018. Available online: http://www.enose.nl/rd/technology/ (accessed on 2 March 2018).
- FIGARO Engineering Inc. Available online: http://www.figaro.co.jp/en/technicalinfo/principle/mos-type.html (accessed on 3 January 2018).
- Wang, C.; Yin, L.; Zhang, L.; Xiang, D.; Gao, R. Metal oxide gas sensors: Sensitivity and influencing factors. Sensors 2010, 10, 2088–2106. [Google Scholar] [CrossRef] [PubMed]
- Shaposhnik, A.; Moskalev, P.; Zviagin, A.; Chegereva, K.; Ryabtsev, S.; Vasiliev, A.; Shaposhnik, P. Selective gas detection by a single MOX-sensor, voronezh state agrarian university. Proceedings 2017, 1, 594. [Google Scholar] [CrossRef]
- Plecenik, T.; Moško, M.; Haidry, A.; Ďurina, P.; Truchlý, M.; Grančič, B.; Gregor, M.; Roch, T.; Satrapinskyy, L.; Mošková, A.; et al. Fast highly-sensitive room-temperature semiconductor gas sensor based on the nanoscale Pt–TiO2–Pt sandwich. Sensors Actuators B 2015, 207, 351–361. [Google Scholar] [CrossRef]
- Figaro Engineering Inc. Figaro Gas Sensor Technical Reference; Figaro Engineering Inc.: Arlington, VA, USA, 2000. [Google Scholar]
- FIS Inc. Nissha Printing Co., Ltd. 2005. Available online: http://www.fisinc.co.jp/en/products/basic.html (accessed on 1 March 2018).
- Babaei, F.H.; Golgoo, S.M. Analyzing the responses of a thermally modulated gas sensor using a linear system identification technique for gas diagnosis. IEEE Sensors J. 2008, 8, 1837–1847. [Google Scholar] [CrossRef]
- Gwiżdż, P.; Brudnik, A.; Zakrzewska, K. Temperature modulated response of gas sensors array humidity interference. Procedia Eng. 2012, 47, 1045–1048. [Google Scholar] [CrossRef]
- Eun, G.K.; Lee, S.; Kim, J.; Kim, C.; Byun, T.T.; Kim, H.S.; Lee, T. Pattern recognition for selective odor detection with gas sensor arrays. Sensors 2012, 12, 16262–16273. [Google Scholar]
- Bedoui, S.; Faleh, R.; Samet, H.; Kachouri, A. Electronic nose system and principal component analysis technique for gases identification. In Proceedings of the 10th International Multi-Conferences on Systems, Signals & Devices-(SSD13), Hammamet, Tunisia, 18–21 March 2013. [Google Scholar]
Figure 1.
Voltage applied to the heating resistence.

Figure 2.
Bode diagram of the system.

Figure 3.
Scheme of measurement and data analysis.

Figure 4.
Experimental setup (homemade).

Figure 5.
Generator Circuit, Pulse Width Modulation (PWM).

Figure 6.
Generator circuit of a PWM signal.

Figure 7.
Gas sensor chamber.

Figure 8.
Response of the sensors without temperature modulation, exposed to a sample of alcohol (70%).
Figure 8.
Response of the sensors without temperature modulation, exposed to a sample of alcohol (70%).

Figure 9.
Response of the sensors to a PWM signal with a 33.3% duty cycle, on the heater resistor (alcohol [70%]).
Figure 9.
Response of the sensors to a PWM signal with a 33.3% duty cycle, on the heater resistor (alcohol [70%]).

Figure 10.
Response of the sensors without temperature modulation, subjected to a sample of 2%. (Moscatel wine).
Figure 10.
Response of the sensors without temperature modulation, subjected to a sample of 2%. (Moscatel wine).

Figure 11.
Response of the sensors subjected to temperature modulation with a sample of. Moscatel wine; alcohol (2%).
Figure 11.
Response of the sensors subjected to temperature modulation with a sample of. Moscatel wine; alcohol (2%).

Figure 12.
PCA scores plot performed to discriminate the measurements of alcohol (70%) and wine (2%) without temperature modulation.
Figure 12.
PCA scores plot performed to discriminate the measurements of alcohol (70%) and wine (2%) without temperature modulation.

Figure 13.
PCA scores plot performed to discriminate the measurements of alcohol (70%) and wine (2%) with temperature modulation.
Figure 13.
PCA scores plot performed to discriminate the measurements of alcohol (70%) and wine (2%) with temperature modulation.

Figure 14.
PCA loadings obtained from the sensors. The numbers represent the features of the different sensors.
Figure 14.
PCA loadings obtained from the sensors. The numbers represent the features of the different sensors.


Table 1.
Metal-oxide gas sensors.
| No. | Type | Target Sensor | Heater Voltage | Circuit Voltage |
|---|---|---|---|---|
| S1 | TGS 800 | Carbon monoxide, Isobutane, Hydrogen and Ethanol | ≤ 5V ± 0.2V AC/DC | ≤24V AC/DC |
| S2 | SP-53 7Z6 | Methane | ≤ 5V ± 0.2V AC/DC | ≤24V AC/DC |
| S3 | TGS-826 | Ammonia | ≤ 5V ± 0.2V AC/DC | ≤24V AC/DC |
| S4 | SP-15A 921 F | Propane, Butane | ≤ 5V ± 0.2V AC/DC | ≤24V AC/DC |
© 2018 by the authors. Licensee MDPI, Basel, Switzerland. This article is an open access article distributed under the terms and conditions of the Creative Commons Attribution (CC BY) license (http://creativecommons.org/licenses/by/4.0/).
Share and Cite
MDPI and ACS Style
Durán, C.; Benjumea, J.; Carrillo, J. Response Optimization of a Chemical Gas Sensor Array using Temperature Modulation. Electronics 2018, 7, 54. https://doi.org/10.3390/electronics7040054
AMA Style
Durán C, Benjumea J, Carrillo J. Response Optimization of a Chemical Gas Sensor Array using Temperature Modulation. Electronics. 2018; 7(4):54. https://doi.org/10.3390/electronics7040054
Chicago/Turabian StyleDurán, Cristhian, Juan Benjumea, and Jeniffer Carrillo. 2018. "Response Optimization of a Chemical Gas Sensor Array using Temperature Modulation" Electronics 7, no. 4: 54. https://doi.org/10.3390/electronics7040054
Note that from the first issue of 2016, this journal uses article numbers instead of page numbers. See further details here.