Assessing the Ecological Footprint of Ecotourism Packages: A Methodological Proposition
by

Maria Serena Mancini
1, 
Mikel Evans
2,
Katsunori Iha
2,
Carla Danelutti
3 and
Alessandro Galli
1,*
1
Global Footprint Network, 18 Avenue Louis-Casai, 1219 Geneva, Switzerland
2
Global Footprint Network, 426 17th Street, Suite 700, Oakland, CA 94612, USA
3
IUCN Centre for Mediterranean Cooperation, Calle Marie Curie 22, 29590 Malaga, Spain
*
Author to whom correspondence should be addressed.
Resources 2018, 7(2), 38; https://doi.org/10.3390/resources7020038
Submission received: 2 May 2018
/
Revised: 31 May 2018
/
Accepted: 12 June 2018
/
Published: 16 June 2018
(This article belongs to the Special Issue Ecological Footprint Assessment for Resources Management)
Abstract
:Tourism represents a key economic sector worldwide, constituting great leverage for local economic development but also putting noticeable environmental pressures on local natural resources. Ecotourism may be a viable alternative to mass tourism to minimize impacts on ecosystems, but it needs shared sustainability standards and monitoring tools to evaluate impacts. This paper presents a first methodological proposition to calculate the environmental impact of ecotourism packages through the use of an ad-hoc, customized version of the Ecological Footprint methodology. It follows a participatory, bottom-up approach to collecting input data for the four main services (Accommodation, Food & Drinks, Activity & Service, and Mobility & Transfer) provided to tourists through the use of surveys and stakeholders engagement. The outcome of our approach materializes in an excel-based ecotourism workbook capable of processing input data collected through surveys and returning Ecological Footprint values for specific ecotourism packages. Although applied to ecotourism in Mediterranean Protected Areas within the context of the DestiMED project, we believe that the methodology and approach presented here can constitute a blueprint and a benchmark for future studies dealing with the impact of ecotourism packages.
1. Introduction
1.1. An Overview on Tourism at Global and Mediterranean Level
Tourism represents a key economy sector across all countries worldwide. In 2016, tourism contributed to 10.2% of the global GDP, with a yearly growth rate outpacing that of the global GDP during the 2010–2016 period [1]. With more than 310 million tourist arrivals in 2014, the Mediterranean region is the largest global tourist destination in the world [2]. Here, tourism creates employment, drives exports (by exports we mean the money spent by foreign visitors within a country for both business and leisure trips [1]), and generates prosperity, contributing to 11.4% of the regional GDP [1].
However, this revenue stream and the expected further growth in international tourists’ arrivals comes with several challenges that are likely to influence the long-term development and success of the region [3]: social inequity, weak governance and degradation of cultural heritage, and competition for limited space, as well as impacts on the ecosystems, pollution generation, resources depletion, sea level rise, and climate variability due to the climate change [4,5,6]. Moreover, tourism in the Mediterranean region is highly concentrated both spatially (i.e., coastal and marine areas receiving half of the arrivals in the region) and seasonally (i.e., tourism is concentrated in the summer months) [3].
To ensure a sustainable future for the Mediterranean region, and following-up on the directions of the 2030 Agenda of the United Nations [7], countries in the region adopted the Mediterranean Strategy for Sustainable Development for the period 2016–2025 (MSSD) in 2016 [8], in which tourism plays a fundamental role. The MSSD is an integrative policy framework aiming to guide—through shared strategies—regional stakeholders towards the achievement of the Sustainable Development Goals (SDGs), properly adapted from the UN Agenda. Although roughly fitting into all 17 Goals, the tourism sector features a specific key role as regards the creation of jobs and the promotion of local culture and products (Goal 8), the promotion of sustainable consumption and the production and the implementation of tools for monitoring the sustainable development of tourism (Goal 12), and, finally, the sustainable use of marine resources (Goal 14) and life on land (Goal 15) [9].
The challenges related to tourism in the Mediterranean require specific strategies rooted in the local territories, stimulating economic competitiveness and social responsibility, as well as fostering the conservation of natural resources by monitoring the human footprint on the environment. According to this vision, we embrace the definition of sustainable tourism as given in [10], “a tourism that takes full account of its current and future economic, social and environmental impacts, addressing the needs of visitors, the industry, the environment and host communities”. Specifically, in our study we refer to a subcategory of sustainable tourism called “ecotourism” and defined as an “environmentally responsible travel to natural areas, in order to enjoy and appreciate nature (and accompanying cultural features, both past and present) that promote conservation, have a low visitor impact and provide for beneficially active socio-economic involvement of local peoples” [11]. In the context of the present study, we refer specifically to natural Protected Areas (PAs), which are defined as geographical spaces, recognized, dedicated and managed, through legal or other effective means, to achieve the long term conservation of nature with associated ecosystem services and cultural values.
1.2. Addressing Eco-Tourism through the DestiMED Project
The concept of ecotourism was originally introduced in the 1980s as an environmentally responsible tourism in which small group of tourists visit undisturbed natural areas and interact respectfully with local communities and traditions [12]. Over time, the meaning of ecotourism has gradually evolved to keep up with the evolution of the sustainable development concept and emerging societal needs. Currently, rather than having a unique definition, ecotourism “stands at the intersection of what is ecologically viable, economically feasible and socially desirable or acceptable”, a statement that can be easily agreed on in principle but is barely applicable in practice [12].
Despite international efforts to create harmonized concepts, agreed definitions, and quality and sustainability standards for ecotourism [13,14,15,16], the Mediterranean region still lacks common methods and systems for managing and measuring tourism impacts. As a result, the level of knowledge and capacity in addressing and reducing negative impacts varies widely across Protected Areas and tourism-focused organizations, and a consistent baseline of acceptable performance is lacking [17]. As such, it is urgent to work towards the establishment of a coherent, functional monitoring system at Mediterranean level, for ensuring the sustainability of ongoing tourism activities in the area, especially in PAs, and safeguarding the very resources they depend on.
DestiMED is a three years project founded by the European InterregMED Programme [18] aimed at favoring conservation in Mediterranean PAs through the promotion, planning, and management of ecotourism. The Project focuses on developing ecotourism packages (i.e., a mix of activities, accommodation, food, and services provided to a group of tourists for a determined period of time) through participatory processes and monitoring their sustainability. The pilot action implementation involves 13 PAs located in 6 countries (Italy, Spain, France, Greece, Croatia, and Albania) in each of which a Local Ecotourism Cluster (LEC)—composed of PA managing body and local inbound tourism operators at least—is responsible for developing, managing, and implementing the ecotourism products through a participatory process. The ultimate aim of DestiMED project is to develop an operational system that is able to monitor the sustainability of a “Mediterranean ecotourism destination”, encompassing quality, economic, social, and cultural aspects, as well as the environmental component of sustainability. This latter component includes resource consumption and conservation aspects.
Although ecotourism is usually referred to as having a lower impact compared to mass tourism, no clear agreement exists in the international community about how to monitor and assess this, or on the subject of the analysis (hotels, destinations, or whole ecotourism packages). As such, in the DestiMED project, Ecological Footprint is proposed as a tool with which to quantitatively assess the demand for natural resources and ecosystem services needed to support the activities included in ecotourism packages (i.e., part of the environmental pillar of sustainability). Since this methodology is not able to cover all dimensions of sustainability, the quality, socio-cultural, economic, and conservation aspects, although being part of the DestiMED project, are beyond the scope of this article and thus no longer addressed here.
The aim of this paper is thus to describe in detail the Ecological Footprint approach and calculation used in the DestiMED project to assess the pressure on ecosystems of 13 ecotourism packages, which could serve as a blueprint for similar future studies.
2. Materials and Methods
2.1. Standard Ecological Footprint Methodology and Accountings
The Ecological Footprint is an environmental accounting tool conceived in the early 1990s by Mathis Wackernagel and William Rees at the University of British Columbia, to track the human pressure on nature’s capacity to provide life-supporting resources and sequester human wastes [19,20]. Since its introduction, the Ecological Footprint methodology has been developed and standardized to build a robust accounting framework able to measure both the human appropriation (demand side) and the natural provision of (supply side) the regenerative capacity of biosphere, which provides key provisioning and regulating ecosystem services [21,22,23]. The established accounting framework is based on two fundamental metrics:
- –
- Ecological Footprint (hereafter EF), measuring the demand side of methodology. This demand is measured in terms of biologically productive areas that humans and activities require for producing all the resources consumed and absorbing all waste produced;
- –
- Biocapacity (hereafter BC), measuring the supply side of the methodology. This supply is measured as the amount of biologically productive land and sea area available to provide the resources and ecosystem services that humanity consumes. It is also called nature’s regenerative capacity.
Specifically, the considered biologically productive areas are referred to as those where the photosynthetic activity takes place through autotrophic organisms producing useful resources and services to humans [24,25]. Consequently, the methodology takes into account six main land types, supplying a key sub-set of ecosystem services:
- Cropland for food, animal feed, fiber, oil, and rubber;
- Grazing land for animal based products (such as meat, milk, dairy products, wool, and hide);
- Fishing ground (marine and inland) for fish products;
- Forests for wood timber products;
- Carbon uptake land for sequestration of the carbon dioxide released from fossil fuel burning (this is the part of the methodology dealing with waste absorption);
- Built-up surface for shelter and other urban infrastructures.
Since average biological productivity differs between land use types, as well as according to the various geographical locations, each area is weighted in proportion to its bioproductivity, by means of two key coefficients: yield factors (YF) and equivalence factors (EQF) [21,26]. Both EF and BC are thus expressed in terms of hectare-equivalent units of land or water with world-average productivity, namely, global hectares (gha). This means that different land types can be added up to obtain an aggregate indicator of Ecological Footprint or biocapacity, and the two parameters can be compared in a simple “ecological balance” at different scales; use of global hectares also allows comparing across different geographical places [27]. For further details on each land type of the methodology, please refer to [21,24].
The conversion of resources into the Ecological Footprint measure is realized as per Equation (1):
in which
- –
- P is the amount of any primary resource i (such as food or fiber or an out-flowing waste such as carbon dioxide for which sequestration is needed) that is appropriated by humans; expressed in t year−1.
- –
- YW,i is the annual world-average yield for the production of the resource i (or its carbon uptake capacity in cases of out-flowing CO2 emissions); it is expressed in t ha−1 year−1.
- –
- EQFi is the equivalence factor for the type of ecosystem (e.g., a crop, a forest, etc.) producing the resource i; it is expressed in gha ha−1.
The Ecological Footprint methodology is mainly applied at the world and country levels, as national-level assessments are often regarded as the most complete. The National Footprint Accounts (hereafter NFAs) constitute the annual accounting framework for approximately 200 world countries and highlight relevant results for decision making and policy levels [21,25,28,29]. Within NFAs, calculations are mainly based on data from UN agencies (e.g., FAO, UN Comtrade, IPCC, etc.), international organizations (e.g., IEA), and peer-reviewed scientific publications.
The BC term in each nation is calculated as in Equation (2):
in which
- –
- AN,i is the bioproductive surface of an ecosystem—the ecological assets—that is available for the production of each service i at the country level; it is expressed in ha year−1
- –
- YFN,i is the country-specific yield factor for the asset producing such service i; yield factors are evaluated annually as the ratio between the yield for the production of each product i, in the considered nation, and the yield for the production of that same product in the world as a whole.
- –
- EQFi is the equivalence factor for the asset producing the service i; it is expressed in gha ha−1.
When applied at country level, EF and BC represent two sides of a national ecological balance sheet: if a country’s Ecological Footprint is smaller than its biocapacity, this country runs an ecological reserve. Conversely, if a country’s consumption of natural resources and services (i.e., its footprint) is greater than the capacity of its natural assets to supply them (i.e., its biocapacity), a situation of ecological deficit is created [22]. At world level, this situation is called ecological overshoot, and occurs when humanity’s demand for resources exceeds the Biosphere’s capacity to regenerate resource provisioning and regulatory services, leading to liquidation of natural capital stock [30,31].
Usually, Ecological Footprint accountings are applied by using a consumer-based approach that assigns responsibility of resources consumption (or of CO2 emissions) to countries in which the final demand takes place, thus considering imports and exports [32,33]. The Ecological Footprint of consumption is calculated as in Equation (3):
in which
- –
- EFP is the Ecological Footprint associated with the productive human activities taking place within the geographical boundaries of the country;
- –
- EFI is the footprint embodied in imported commodity;
- –
- EFE is the footprint embodied in exported commodity.
- –
- For each product i, locally produced or traded, EFP, EFI, and EFE are calculated as in Equation (1), with P being the amount of product i that is locally produced, imported, or exported.
Along with country scale accountings, EF is also applied at city and regional levels [34,35]. These sub-national EF assessments mainly follow a top-down approach, which consists of a multi-step process involving the use of NFAs data on production, monetary Multi Regional Input Output (MRIO) tables, household expenditure survey data, and additional local data (e.g., consumer price index) to improve the accuracy of the analysis [34,35]. Since discussing results at national or regional level is beyond the scope of this paper, interested readers might want to refer to [36,37].
2.2. Ecological Footprint and Tourism: An Application Gap
Over the last decade, the tourism sector has represented a new field of analysis for Ecological Footprint accounting [38,39,40,41]. Existing academic studies agree that EF is a key indicator with which to evaluate the environmental impact of tourism both at local and global level for conservation issues, resources consumption, and sustainable practices [39,40]. Also, EF can serve as supporting communicating tool for decision-makers for better planning and managing their territories in relation to tourism or any other event capable of attracting foreign visitors, as well as the local community [42,43].
Nevertheless, a unique standard method for assessing the Ecological Footprint of tourism is missing: the majority of authors acknowledge the lack of tourism-specific databases and statistics, as well as reliable data on the resource consumption of tourists [39,41]. These drawbacks limit the applicability of the top-down approach and force users of the EF methodology to either make several assumptions [38] or combine national statistics with data on consumption practices collected through on-the-ground surveying of tourists (bottom-up approach) [43]. Although this bottom-up process leads to a high resolution analysis, as well as to an accurate investigation of the consumption patterns at local level [44], it is resource- and time-intensive and might result in different data aggregation methods, thus compromising results’ comparability among studies [34,45]. Furthermore, the context of ecotourism in particular is hard to standardize into representative products and common examples, making the bottom-up approach even more difficult to accomplish [46].
3. Results: A Proposal for Ecotourism Footprint Analyses
3.1. Customized Ecological Footprint Methodology for Tourism Accounting
Within the current NFAs, tourism’s impact is tracked within the country where the tourist is travelling, resulting in the assignment of the tourist resources’ consumption to the residents of that country. This is due to the lack of international standardized tourism datasets, as well as specific tourists’ expenditure data; as such, better understanding the contribution of the tourism sector to a country’s Footprint represents a necessary improvement as identified by [23].
In order to address the methodological challenges related to the tourism sector, as a first result of our research here we present a customized version of the EF methodology, which was developed within the DestiMED project. The process of customization required a strong collaboration and a continuous interaction among all the involved stakeholders (project partners, Protected Area staff, LEC, and service providers). Also, it implied an iterative process in which each package was tested twice and the Ecological Footprint calculated after each test to ensure its use as an effective monitoring tool (to favor lowering of the impact on the environment). Consistently with the rationale of the standard EF methodology, the ultimate aim of this specific EF analysis is to quantify the amount of land necessary to support an ecotourism package and each single tourist participating in it.
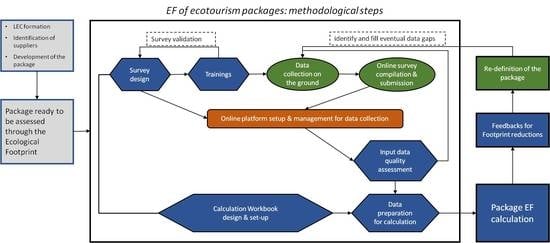
The implemented method has followed a multi-step, bottom-up component approach to collect specific data on-the-spot, in which each package is made and then computed into Ecological Footprint values (see Figure 1). As a first step of this process, an ad-hoc survey was designed by Global Footprint Network to allow the collection of data, specifically concerning direct estimates of energy and materials required by the services included in each package and provided to tourists (the designed survey is attached in Appendix A of this paper).
To facilitate data collection, as well as organize the calculation process, the survey has been structured into four sections, reflecting major macro-categories of tourism services: Accommodation, Food & Drinks, Activities & Services, and Mobility and Transfers (see Figure 2 for definitions of the categories).
In addition, an introductive section was included in the survey to collect general information on each package, composed of the name of PA where the package was developed, length of the package, number of participants, and contact details of the person in charge of collecting data.
As a second step, training was provided to each PA involved in the DestiMED project and LEC representatives—particularly the surveyor in charge of collecting data—were guided through the structure and functioning of the survey. Goals of the training were (1) to describe the specific data needed for the analysis, (2) to explain the procedure for collecting data in collaboration with the service suppliers, (3) to provide insights on Ecological Footprint accounting and how to interpret its results, and (4) to calibrate and validate the survey with the direct users, who could inform on specific practices in their package, which need to be captured in the EF calculation.
The online platform Survey Monkey was used to facilitate and streamline the data collection process and obtain collected data in excel format, ready to be used in the calculation workbook.
To ease the survey compilation process, surveyors were recommended to share a copy of the survey with each service provider—so that they could start compile the requested data—and then follow-up with in-person visits to complete the survey together and report data on the online system. This way of proceeding was suggested to ensure that LEC could control all the input data and better handle the data validation process. As a final step, quality assessments of the input data were jointly conducted by Global Footprint Network and LEC representatives. This phase was necessary to validate the collected data, identify and fill eventual data gaps, and prepare data for its use in an ad-hoc customized Excel calculation workbook (see Section 3.2), specifically designed to calculate the Ecological Footprint of ecotourism packages.
3.2. General Workbook Description
The calculation of the Ecological Footprint of ecotourism packages is realized through an Excel workbook designed to systemically run the assessment of all PAs on the basis of the data collected via surveys. It has been set-up following the structure of the NFAs workbook [47] and consists of several spreadsheets with categorized content and links among all of them. The file—hereafter ecotourism workbook—is organized according to the four categories of consumption reported in Figure 2 and, for each category, it presents five worksheets, each with the following functions:
- Category_Survey: this is the worksheet where data collected from surveyors are inputted directly from the online Survey Monkey platform;
- Cnst_category: this worksheet contains constant values and factors related to the specific category under consideration (see Section 3.3). These factors are drawn from the NFAs, international databases (i.e., IEA, IPCC), and academic studies, and are used to transform the input data into footprint units;
- Category EF Calculation: this is the worksheet in which the Ecological Footprint by land type is calculated by using specific formulas that combine input data and constant factors. All the PAs are listed in this worksheet and calculation formulas repeated for each of them;
- Category EF recap: this worksheet recaps the EF calculation made in the calculation sheet and provides results and graphs by land types and day per each PA;
- Category analysis: this worksheet includes percentage analysis of the results obtained in the previous sheet.
In addition to the above-mentioned, category-specific spreadsheets, additional worksheets are included in the workbook, which are common to all the four categories:
- Multiple Summary worksheets: they summarize the Ecological Footprint values stored in the various Category EF recap spreadsheets into synoptic tables that categorize results either by land type, by category, or by day per each PA. These summaries allow comparing packages between first and second round of package iteration, as well as among each other;
- Cnst_NFAs (see Table 1): this spreadsheet lists all of the non category-specific footprint constants that are needed to convert input data into gha. Taken from the NFAs 2017 edition, these factors are Equivalence Factors (EQF) for the six land types, national electricity carbon intensities (to estimate quantities of CO2 emitted per unit of electricity produced), and footprint intensity of carbon (gha needed per unit of CO2 emitted). It is worth mentioning that, in addition to the footprint intensity of carbon in this spreadsheet, other footprint intensities are used in each category-specific spreadsheet that are related to the parameters under analysis (see Section 3.3). In general, a footprint intensity refers to the number of global hectares required to produce a unit weight of a given resource, usually expressed as global hectare per tonnes [47]. All the footprint intensities used in the ecotourism workbook are drawn from NFA 2017.
- Cnst_labor: this spreadsheet lists national EF values expressed in gha per capita per hour. These values are derived by dividing the annual national EF values from NFA 2017 [29] by the total number of hours in a year. They are then used across all categories to assess the Ecological Footprint of each worker employed in the package (EF of human labor) and needed to provide the specific service [48]. For each service provided, the labor footprint component is calculated by multiplying the hourly national footprint value reported in Table 2 by the actual duration of provided service, or assuming 8 working hours in accommodation;
- Info_survey: this spreadsheet lists answers from the introductive section of the survey, including general information on the PA and contact details of the surveyor;
- PAs list: this spreadsheet pulls out the information from Info_survey and organizes them into tables used by categories-specific spreadsheets for calculation purposes;
- File legend: it provides legend and guidelines on how to read the ecotourism workbook.
3.3. Ecotourism Workbook: Category-Specific Structure, Key Factors, and Functioning
This section describes in detail the calculation, constants, and parameters, as well as the assumptions made in calculating the EF of each of the four categories considered.
3.3.1. Mobility & Transfers
The Ecological Footprint of the Mobility & Transfer category is primarily due to the carbon footprint caused by the emission of carbon dioxide from the use of motor vehicles needed to move tourists (or equipment for activities) around. A minor component of the Ecological Footprint of this category is the labor footprint of each worker (mainly drivers) involved in providing the service (see Section 3.2).
The main input data requested for Mobility & Transfers are listed in Figure 2, while the constants used to convert fuel use into carbon emissions (emissions by type of fuel, expressed in kgCO2/L) are reported in Table 3.
As electric vehicles were also envisioned as possible transport modes, national electricity production mixes [52] were also used to provide direct conversion factors in g CO2eq/km for each country [53] (see Table 4).
Moreover, emissions in this category are adjusted by an allocation factor in case a public transport is used for the transportation (i.e., public buses or ferry boats). This factor allows assigning to the ecotourism package the share of the footprint that the group of tourists is responsible for, rather than the entire footprint value. Based on data collected on-the-ground, passenger capacity for public ferries was estimated to be 200 persons, while that of public buses was estimated to be 30 passengers (small-medium size public city buses). In the case of a group of 8 eco-tourists travelling on a ferry boat with a passenger capacity of 200 persons, for instance, only 4% of the footprint will be allocated to the ecotourism package.
Finally, once the emissions value is calculated per each route in each PA, the carbon footprint component is calculated using the constant footprint intensity of carbon (see Table 1). For routes in which no motor vehicles are used to transfer tourist or equipment, the carbon footprint is set to zero.
3.3.2. Activity & Services
The Ecological Footprint assessment of this category consists of the labor footprint associated with employees involved in guiding or assisting the tourist group throughout each activity (e.g., tour guides, tour leaders, managers of the activities, boat drivers, bird watching guides, experts, etc.), as well as the carbon footprint component due to any mean of transportation needed to perform the activity. As such, calculating the EF of the Activity & Services category requires the same constants, assumptions, and formulas of the Mobility & Transfers category.
3.3.3. Food & Drinks
The Ecological Footprint assessment of the Food & Drink category depends on the type, quality, and quantity of food served, mode and time of cooking, and the contribution of labor. Depending on the food/drink category, multiple land types are considered in the EF analysis, such as cropland (plant-based food, meat and animal by-products), grazing land (meat and animal by-products), fishing ground (fish food) and carbon footprint, which accounts for the energy required to produce one unit of product (i.e., embodied energy) and trade it around. The calculation spreadsheet for Food & Drinks category is structured according to the following common scheme for each PA:
- Four main meals a day are envisioned: breakfast, lunch, dinner, and other (including drink/food tasting, welcome buffet, snacks, tea/coffee breaks, etc.).
- In each meal, a list of 70 food and drinks items is preset, including specific items related to plant-based food (cereals, vegetables, fruits, and nuts), meat, fish, dairy products, eggs, olive oil, sweeties, and spices. Considered drinks are wine, beer, water, juices, and spirits, and, for each of them, different packaging modes are envisioned: glass bottle, jug, draught, can, plastic, or fresh squeezed (for juices).Per each food item, the Ecological Footprint is assessed on the basis of the following factors:
- Origin: referring to the place of food production and its distance from the place of consumption (i.e., food miles). A travel-per-product emission factor is used to estimate the carbon emissions associated with that transport service. Based on the method provided in [56], and considering various modes of transportation (i.e., sea, air, rail, and road) and their share contribution, the carbon intensity of trading 1 kg of foodstuff per 1 km within Europe was calculated as 2.38 × 10⁻⁵ kg CO2 (kg-km)−1 (see Table 5).
Four possible places of origin were considered:
- –
- On-farm: items harvested on the same location where the meal is consumed. These food items do not have an associate food mile, and their carbon footprint is thus zero.
- –
- Local (up to 60 km away): this option refers to food or drink products that are produced within the region and thus sourced from up to 60 km away from the place of consumption.
- –
- National: this option refers to non-local products that are nonetheless produced in the same country where the PA is located. In this case, food miles are estimated as the linear distance between each PA and the capital city of the country [58].
- –
- International: this option refers to products imported from abroad. For each given country, the average food miles (see Table 6) is estimated by considering the linear distances between that country’s capital and the capitals of the top five trading partners. Linear distances were drawn from [58], while top five trade partners were drawn from [35]. See the supplementary material for further details.
- Mode of production: this refers to the practices used to produce each food/drink item, distinguishing between certified organic and non-organic products. For non-organic items, product-specific footprint intensities (i.e., for cropland, grazing land, and fishing ground, as well as carbon) footprint intensities (all expressed in gha kg−1) are drawn from the NFAs 2017 [29] (see also the supplementary material). It is then assumed that organic practices solely affect the carbon footprint component of the EF, as the main difference relies on the use or non-use of chemical pesticides and synthetic fertilizers [59]. As such, organic-to-conventional ratios have been identified for each food item, starting from data (in CO2eq per mass unit) found in [48,59,60] and used to adjust the carbon footprint intensity of each food item (see supplementary material for details).
- Packaging of drink items: the type of packaging causes a further increase in the carbon footprint component of the EF, due to the CO2 emissions caused by the manufacturing of the packaging material. Table 7 shows the footprint intensities (expressed in gha l−1) of each packaging applied to drink items.
- Cooking time of the meal and type of stove used in preparing the meal: this data allows to estimate the carbon footprint component of the EF considering the carbon dioxide released from the energy used for cooking (see Table 8). Constants on energy delivered to the pot depending on the stove type (including gas, electric/induction, coal) and time of operation are drawn from [61], while carbon emissions per unit of energy to the pot are found in [62].
- Number of workers: the labor footprint component depends on the time of cooking and the number of people involved in cooking or providing the meal to the tourists (see Section 3.2).
3.3.4. Accommodation
The Ecological Footprint of this category consists of several components: carbon, forest, and built-up footprint components relative to the structure of the facility (e.g., hotel, B&B, etc.), carbon footprint relative to the facility’s operation (e.g., energy use), and all the land-type categories related to the labor footprint (see Section 3.2) (see also Figure 2). Opposite to the other categories, in which data specific to the ecotourism packages is collected, here the input data consists of annual data that are then allocated to the tourists of the package during their stay in the facility. To perform such allocation, the number of bed-nights in the most recent year for which complete (yearly) data is available is used together with data on the opening months; this information is used to calculate the Ecological Footprint of all tourists received by the facility in one year and then allocate the adequate footprint share to the tourists of the specific package.
For each ecotourism package, the calculation spreadsheet is thus structured to calculate the Ecological Footprint of each facility used in the package, per day of vacation, as follows:
- Labor Footprint: this is the footprint due to the workers needed to provide tourists with the various services of the facility and operate it. It is calculated by multiplying the hourly national footprint values per each land types (see Table 2) by the total number of workers and by the working hours (here a typical working day of 8 h is assumed). The footprint value so obtained is then allocated to the total number of tourist of the package.
- Building Footprint: this is the footprint contribution due to the construction of the facility, which is then allocated to the package’s tourists on the basis of the building life-span and then number of tourists in a year. According to [63], the main components of a building’s footprint are carbon uptake land (due to the embodied energy of building materials as for the extraction, manufacturing, and employment phase) and, to a lesser extent, the forest (wood-based construction systems, or interior materials) and built-up (the surface physically occupied by the building) footprint components. Footprint intensities used to convert input data about general characteristics of the facility (expressed in m2, see Figure 2) into global hectares of forest and built-up and carbon footprint are reported in Table 9.
- Energy Consumption Footprint: this is the footprint contribution due to the energy consumptions needed to operate the facility. The annual consumption of three energy systems (i.e., electricity, heating, and hot water), as well as whether they are combined or independent, is investigated. The energy consumption affects mainly the carbon footprint component of the EF due the carbon emissions from the generation of the primary fuel source or any alternative source that facilities might use. Depending on the type of energy system and the related energy source, specific carbon emissions factors (i.e., quantities of CO2 emitted per unit of energy produced) are provided in Table 10, Table 11 and Table 12. The carbon footprint components are then calculated by multiplying the amount of carbon emissions by the carbon footprint intensity value (gha (kgCO2)−1) listed in Table 1, and it is allocated to the total number of tourists of the package.For each energy system, the amount of CO2 is calculated by multiplying data on energy consumption by the carbon emission factor related to the specific energy source, and different cases have been identified for the calculation:
- –
- Electricity: three main set-ups of the electricity system are considered: (1) the electricity system is connected to the national grid; (2) an alternative source of energy (i.e., photovoltaic, wind energy thermoelectric generator, geothermal energy, hydro generator, LPG, natural gas, diesel, and solar) supplies the system and balances the consumption from the grid; (3) the system is off-grid and operates entirely through an independent alternative source. When the electricity relies on the national grid, CO2 emissions are quantified multiplying the electricity consumption by the national-specific electricity carbon intensity (see Table 1). When an alternative energy system is also installed—providing less energy than the total consumed by the facility—the amount consumed is multiplied by the energy-specific carbon emission factor (see Table 10) and carbon emissions are added up to those of the grid. On the contrary, when the production of electricity from alternative source exceeds the total consumption of the facility, or when the system is off grid, carbon emissions only derive from the consumption of energy from the alternative source.
- –
- Heating system: if the heating system is powered independently from the electricity system, additional carbon emissions are produced and depend on the specific energy source providing the heating. In Table 11, alternative energy sources are listed with the related carbon emission factors that have been used in the calculation.
- –
- Water heating: If hot water is produced via neither heating system nor electricity, then further CO2 emissions are produced. Table 12 provides alternative energy sources for water heating with the related carbon emissions factor.
4. Limitations of the Study: Advantages and Disadvantages of the Methodology
This paper proposes a customized version of the standard Ecological Footprint methodology for the assessment of ecotourism packages’ impact on Protected Area. It should be noted that the proposed method is still being tested within the DestiMED project, and further refinements are to be expected.
The strength of the method proposed here relies on the capacity of the EF to provide an aggregated assessment of multiple tourist pressures within the Protected Areas of Mediterranean and the relative simplicity in communicating the outcomes to tour operators and the different service providers included in the package. Moreover, the use of a bottom-up approach and on-the-ground collection of necessary data overcomes the usual limitation in input data that affects most of tourism-related sustainability studies.
Nonetheless, a few limitations exist: Ecological Footprint accounting is not able to cover all aspects of sustainability (i.e., social and economic) or all environmental concerns (see [24,33]), and this issue remains true in the Ecological Footprint of tourism. The quality and reliability of tourism accountings depend on the level of accuracy and availability of the input data collected on the ground—to address this, input data was verified with PA representatives (see Section 3.1). The choice of the parameters and factors used to convert input data into footprint also noticeably affects the results; as such, all conversion factors were reported (see Table 1, Table 2, Table 3, Table 4, Table 5, Table 6, Table 7, Table 8, Table 9, Table 10, Table 11 and Table 12) to allow for their verification, revision, and eventual amendment.
Finally, it is worth noting that Ecological Footprint assessment of ecotourism packages is expected to yield conservative estimates for each category of service, due to either limitations of the methodology or assumptions made in the study as indicated in Table 13:
5. Discussion
The approach to ecotourism footprint accounting described in this paper is a first attempt at providing a standardized way to calculate the EF of ecotourism packages in Protected Areas. Due to the specific subject of the analysis—i.e., ecotourism packages—comparability with other studies is limited, and there are no benchmark values against which to compare first results of such assessment. However, results can be provided and visualized in multiple ways for any investigated package, each providing different indications as explained here below:
- Ecological Footprint of the whole ecotourism package (gha per package): this result measures the overall footprint impact of a whole ecotourism package, given the specific number of tourists and its specific duration. This result refers to the total resource demand of the entire package and is useful for PAs to understand the overall impact of their package. Since there might be a significant variation among packages as for the number of tourists, duration, type of facilities, and meals served, as well as activities and experiences conducted, this result expressed in gha per package should not be used for comparison among PAs;
- Daily Ecological Footprint per package tourist per day (gha per tourist per day): this result measures the footprint impact caused by each single tourist during each day of stay. This measure is used for understanding the general trends and identifying best cases and practices among all the PAs, thus allowing for comparisons across packages. However, this measure shall not be used to derive indications of the overall impact caused by the entire package in its full length.
Both of the above results can then be broken down into activities or land types, each bearing different information to the users:
- Ecological Footprint by activity: this breakdown provides the total footprint values in the four categories of activities considered in the package: Accommodation, Food & Drinks, Activities & Services, and Mobility & Transfers (see Figure 1 for definitions). These results are useful for understanding how much each category of the package contributes to the package’s total footprint and helps managers of the package and LEC representatives to identify where to eventually intervene to lower the footprint impact of their product.
- Ecological Footprint by land type: this breakdown looks at the land types upon which the highest footprint pressure is placed, considering the six bio-productive land types of the standard footprint methodology (i.e., cropland, grazing land, fishing ground, forest land, built-up land, and land for carbon uptake). This helps identify how many natural resources are needed to support the entire package offer and provides insight on the ecosystems that are in highest demand due to the tourists’ activities. This information can be useful to PAs and LEC representatives to understand which ecosystems are most impacted by the packages they have designed.
6. Conclusions
Tourism is one of the major economic drivers in the Mediterranean region, but it also poses several socio-cultural and environmental challenges, especially in sensitive zones such as Protected Areas. Ecotourism can be a viable solution with which to develop the tourism sector toward a new model in which impacts on the local environment and communities are minimized. Nevertheless, monitoring such an alternative tourism is not an easy task, and shared standards and methodologies do not yet exist across the region.
This paper presented a systemic methodological proposition to evaluate the environmental dimension of sustainability through Ecological Footprint accounting for defined ecotourism products. The proposed methodology starts from the standard Ecological Footprint accountings as it is being brought forward by the Global Footprint Network, and it is then customized for specific application to ecotourism packages in Protected Area, as developed by the European DestiMED project. It deploys a bottom-up approach for the collection of specific data about the services provided to tourists through the use of ad-hoc surveys and requires the cooperation of all the local stakeholders in a participatory process.
The output of such specific approach is an ecotourism footprint workbook allowing for the conversion of collected data into Ecological Footprint values through the use of constant parameters and factors. This workbook—which is provided as a supplementary material to this paper—calculates the Ecological Footprint in four main categories of activities envisioned in ecotourism packages: Accommodation, Food & Drinks, Activity & Service, and Mobility & Transfer. Despite several limitations and the assumptions required in this first assessment, all the calculations are accessible and have been explained in detail to make them as reproducible as possible.
The bottom up footprint methodology and the ecotourism workbook presented in this paper are first steps for systematically monitoring the consumption of resources in the tourism sector. Nonetheless, we acknowledge that refinements and improvements are certainly needed and thus hope that this paper will manage to stimulate a debate over the use of Ecological Footprint in the tourism sector and trigger future research in this area. As next steps, we believe that research could focus on:
- Improving the biocapacity assessment at PA level, being able to identify sensitive areas where tourist use should be better planned (zoning) and merge them with the packages impacts;
- Expanding the scope of EF analyses outside PAs to reach coastal cities and destinations, where tourism consumption strongly competes with that of residents.
Supplementary Materials
Table S1: Ecotourism Footprint workbook is available online at https://www.mdpi.com/2079-9276/7/2/38/s1.
Author Contributions
Conceptualization: C.D. and A.G.; data curation: M.S.M.; formal analysis: M.S.M., M.E., and K.I.; funding acquisition: C.D. and A.G.; investigation: M.S.M. and A.G.; methodology: M.S.M. and A.G.; project administration: A.G.; supervision: C.D. and A.G.; validation: M.E. and K.I.; writing—original draft: M.S.M. and A.G.; writing—review & editing: C.D.
Funding
This research was funded by the EU Interreg MED Sustainable Tourism Programme, grant number [1MED15_3.1_M2_355].
Acknowledgments
Authors would like to acknowledge the EU´s Interreg MED Sustainable Tourism Programme for financing the DestiMED project. Also, AG and SM would also like to thanks IUCN Centre for Mediterranean cooperation and MAVA Foundation pour la Nature (Grant No. 13/09) for their support to Global Footprint Network’s Mediterranean-Mena Program.
Conflicts of Interest
The authors declare no conflict of interest.
Appendix A. Ecotourism Footprint Surveys
SECTION 0: GENERAL INFORMATION OF THE PACKAGE
Q. 01 In which country is the PA located?
- ☐
- Italy
- ☐
- France
- ☐
- Spain
- ☐
- Croatia
- ☐
- Albania
- ☐
- Greece
Q. 02 What is the name of the PA you are giving information of?
_________________________
Q. 03 Which round of test are you collecting data for?
- ☐
- Round 1
- ☐
- Round 2
Q. 04 How many days is the eco-tourism package made of?
- ☐
- 3 days/2 nights
- ☐
- 4 days/3 nights
- ☐
- 5 days/4 nights
- ☐
- 6 days/5 nights
- ☐
- 7 days/6 nights
Q. 05 Dates of the package:
Start date (dd/mm/yyyy): ___/___/____
End date (dd/mm/yyyy): ___/___/____
Q. 06 How many people is the package designed for? (if in doubt, please refer to the number of invited testers):
Number: __
Q. 07 Surveyor Information:
- Name and surname:
- Job:
- Organization/body:
- Email:
- Phone:
SECTION 1: ACCOMMODATION
In which country is the PA located?
- ☐
- Italy
- ☐
- France
- ☐
- Spain
- ☐
- Croatia
- ☐
- Albania
- ☐
- Greece
What is the name of the PA you are giving information of?
_________________________
Which round of test are you collecting data for?
- ☐
- Round 1
- ☐
- Round 2
Q. 01 Accommodation name: ___________________
Q. 02 Is the accommodation used for the entire stay?
- ☐
- Yes
- ☐
- No
Q. 03 If not, please indicate the check-in and check-out dates (dd/mm/yyyy):
Check-in (dd/mm/yyyy): ___/____/______
Check-out (dd/mm/yyyy): ___/____/______
Q. 04 Accommodation type:
- ☐
- Tourist resort
- ☐
- Hotel/guest house
- ☐
- Agritourism/holiday farm
- ☐
- Lodge
- ☐
- Apartments renting/B&B
- ☐
- Campsite (hosts stay in tents)
- ☐
- Traditional housing
- ☐
- Sailing boat (if selected fill the dedicated questions)
- ☐
- Other: specify ___________________
Q. 05 Is this hosting facility open all year long or only in holiday season?
- ☐
- All year
- ☐
- Seasonal opening
- ☐
- If seasonal, please specify opening and closing months: from ____to ___
Q. 06 Does the owner of the facility live in the facility themselves?
- ☐
- Yes
- ☐
- No
Q. 07 Does the hosting facility have an environmental/sustainability certification (e.g., ECST, EMAS)?
- ☐
- Yes, specify: _____
- ☐
- No
Q. 08 Does the hosting facility provide energy and water saving tips or off-set programs (e.g., activities for compensating energy consumption such as payment for offsetting carbon emissions) to clients?
- ☐
- Yes, off-set programs (please specify what type: ________________________)
- ☐
- Yes, tips for both energy and water saving
- ☐
- Yes, only energy related tips
- ☐
- Yes, only water related tips
- ☐
- No
Q. 09 Does the hosting facility have a customer feedback system in place?
- ☐
- Yes, and feedback system includes environment or sustainability related aspects
- ☐
- Yes but without environmental or sustainability aspects
- ☐
- No
Q. 10 Number of employees in the hosting facility (at the time of the package):
- ☐
- ______
Q. 11 Number of floors in the building:
- ☐
- N/A
- ☐
- _________
Q. 12 Total number of tourists’ bed-nights in the most recent full year:
- (a)
- Bed-nights in summer (June-August): __________
- (b)
- Bed-nights in autumn (September-November): __________
- (c)
- Bed-nights in winter (December—February): __________
- (d)
- Bed-nights in spring (March-May): __________
- (e)
- If seasonal data is not available, indicate the total number of bed-nights over the course of the year: _______
Q. 13 Total built-up surface of the hosting facility in m2 (if the facility has multiple buildings, please provide the sum of all of them):
- ☐
- _____ m2
Q. 14 Average surface of the room (or tent) assigned to a DestiMED ecotourist:
- ☐
- _____ m2
Q. 15 Average number of occupants of the room (or tent) assigned to a DestiMED ecotourist:
- ☐
- 1 person
- ☐
- 2 persons
- ☐
- 3 persons
- ☐
- Dormitory
Q. 16 Does the facility have a swimming pool?
- ☐
- Yes
- ☐
- No
Q. 17 If yes, please indicate the following specifics of the swimming pool (select and answer all that apply):
- ☐
- Open for usage from _________to ____________(indicate the months)
- ☐
- Length in m: _____
- ☐
- Width in m: _____
- ☐
- Max depth in m: ______
- ☐
- It is outside the building and not covered
- ☐
- It is outside the building and covered
- ☐
- It is inside the building
- ☐
- Water is heated at the temperature of °C: ________
- ☐
- How frequently is the swimming pool water changed (e.g., daily, weekly, monthly, biannually, or annually): _________
- ☐
- Mode of water purification: ____________
Q. 18 Indicate the Energy Performance Certificate (EPC) rating of the hosting facility:
- ☐
- Class A+
- ☐
- Class A
- ☐
- Class B
- ☐
- Class C
- ☐
- Class D
- ☐
- Class E
- ☐
- Class F
- ☐
- Class G
- ☐
- N/A
- ☐
- Other, specify:___________
Q. 19 Indicate the default air temperature the hotel set in rooms and common areas (where applicable):
Winter opening:
| Summer opening:
| N/A ☐ |
Q. 20 Are costumers allowed to set their own room temperature?
- ☐
- Yes
- ☐
- No
Q. 21 Are the rooms and/or common areas provided with a fireplace?
- ☐
- Yes
- ☐
- No
Q. 22 If yes, are customers allowed to load the fireplace themselves?
- ☐
- Yes
- ☐
- No
Q. 23 Is the hosting facility connected to a national or local electricity grid?
- ☐
- Yes, connected to the national grid
- ☐
- Yes, connected to a local grid (e.g., diesel operated network island)
- ☐
- No, self-sufficient
Q. 24 Please indicate the annual consumption of electricity of the hosting facility. Please look at the physical data (in kWh) you can find in the bills:
- Physical consumption in kWh/year: _______
Q. 25 Does the hosting facility have an electricity self-generation system installed?
- ☐
- Yes
- ☐
- No
Q. 26 If yes, please indicate the energy source used in the self-generation system and the average amount annually produced (identify your system and write down the production in the appropriate measurement unit—kW, m3, or liters. Write “N/A” in the systems that you do not use)
| Select | Mode of ELECTRICITY GENERATION | Annual production | |
| ☐ | Photovoltaic | kWh … | |
| ☐ | Wind energy | kWh … | |
| ☐ | Thermoelectric generator | kWh … | |
| ☐ | Geothermal energy | kWh … | |
| ☐ | Hydro generator | kWh … | |
| ☐ | Fuel | LPG | m3 … |
| ☐ | Natural gas | m3 … | |
| ☐ | Diesel | Liters … | |
| ☐ | Solar | kWh … | |
| ☐ | Other, specify | ||
Q. 27 Please indicate what the electricity is used for (select all that apply):
- ☐
- Appliances and lighting
- ☐
- Heating system
- ☐
- Hot water production
- ☐
- Air conditioning
- ☐
- Other, please specify: _________
Q. 28 Please indicate whether the hosting facility uses energy saving light fixtures (e.g., compact fluorescent lamps):
- ☐
- Yes
- ☐
- No
Q. 29 Is the facility provided with a HEATING SYSTEM separated from the electricity system?
- ☐
- Yes (i.e., heating system works independently from electricity)
- ☐
- No (i.e., heating system is powered by electricity)
Q. 30 If yes, please indicate the energy source and its average annual consumption (identify your system and write down the consumption in the appropriate measurement unit—kW, m3, or liters). Write “N/A” in the systems that you do not use.
| Select | ENERGY SOURCE of heating system | Physical consumption |
| ☐ | Natural gas (methane) | m3 … |
| ☐ | LPG (propane) | m3 … |
| ☐ | Heating oil | l … |
| ☐ | Heat pump | COP … |
| ☐ | Photovoltaic | kWh … |
| ☐ | Solar energy | kWh … |
| ☐ | Biomass (Wood and Pellet) | m3 … |
Q. 31 Is hot water production combined with the heating system?
- ☐
- Yes (i.e., water is heated through the heating system)
- ☐
- No (i.e., water is heated independently from the heating system)
Q. 32 If no, please indicate the energy source and its average annual consumption (identify your system and write down the consumption in the appropriate measurement unit—kW, m3, or liters. Write “N/A” in the systems that you do not use).
| Select | ENERGY SOURCE of hot water production | Physical consumption |
| ☐ | Natural gas (methane) | m3 … |
| ☐ | LPG (propane) | m3 … |
| ☐ | Heating oil | l … |
| ☐ | Heat pump | COP … |
| ☐ | Solar energy | kWh … |
| ☐ | Biomass (Wood and Pellet) | m3 … |
Q. 33 Indicate the average default temperature of the domestic hot water:
- ☐
- <40 °C
- ☐
- 40–45 °C
- ☐
- 45–50 °C
- ☐
- 50–55 °C
- ☐
- 55–60 °C
- ☐
- >60 °C
- ☐
- N/A
Q. 34 Please indicate the facility’s annual consumption of water from the aqueduct. Please look at the physical data (in m3) you can find in the periodic bills:
- m3/year: ________
Q. 35 Does the hosting facility use water from a provision system other than the aqueduct?
- ☐
- Yes, specify ___________
- ☐
- No
Q. 36 If yes, please indicate the annual volume of water consumed:
- m3/year: ________
Q. 37 Indicate whether the hosting facility uses high energy efficiency appliances (e.g., dishwasher, washing machines, dryer, vacuum cleaner, televisions, kitchen appliances, etc.):
- ☐
- Yes, all of them
- ☐
- Yes, half of them
- ☐
- No
Q. 38 How often does the hosting facility replace linen in bedrooms?
- ☐
- Every day
- ☐
- Every 2-3 days
- ☐
- Every week
- ☐
- Linen not provided
Q. 39 Does the hosting facility use re-useable tablecloths or disposable placemats?
- ☐
- Re-usable tablecloths
- ☐
- Disposable placemats
- ☐
- N/A
IF THERE ARE ANY OTHER NOTES YOU WANT/NEED TO SHARE, PLEASE WRITE BELOW:
__________________________________________________________________
__________________________________________________________________
REPEAT SAME QUESTIONS FOR EVERY ACCOMMODATION
SECTION 2: FOOD AND BEVERAGE
In which country is the PA located?
- ☐
- Italy
- ☐
- France
- ☐
- Spain
- ☐
- Croatia
- ☐
- Albania
- ☐
- Greece
What is the name of the PA you are giving information on?
_________________________
Which round of test are you collecting data for?
- ☐
- Round 1
- ☐
- Round 2
Q. 01 Day of the meal (dd/mm/yyyy):
- ☐
- ___/___/_____
Q. 02 Meal type:
- ☐
- Breakfast
- ☐
- Lunch/light lunch
- ☐
- Dinner/light dinner
- ☐
- Wine/food tasting
- ☐
- Other (e.g., tea/coffee break; aperitive; snack), specify_________
Q. 03 Indicate the service provider and its name and location for this meal:
- ☐
- Hotel: name __________________________ Location _______________________________
- ☐
- Restaurant: name ______________________ Location _______________________________
- ☐
- Agritourism: name _____________________ Location _______________________________
- ☐
- Food truck: name ______________________ Location _______________________________
- ☐
- Bar/café: name _______________________ Location _______________________________
- ☐
- Wine/food tasting facility: name _________ Location _______________________________
- ☐
- Other—specify: name ____________________ Location ___________________________
Q. 04 Describe the menu in details (item by item):
________________________________________________________________________________________________________________________________________________________________________________
Q. 05 Indicate number of employees involved in meal preparation and serving:
- ☐
- ___
Q. 06 For the meal under consideration, provide the following information and data quantities for each food and drink item in the tables below (consider the total quantities supplied to the entire group of tourists). For any item not included in the list, please add it in the “other” rows at the bottom of the tables.
| CATEGORY | ITEM | ORIGIN | MODE OF PRODUCTION | QUANTITY | |||||
| ON FARM (0 km) | LOCAL (up to 60 km Away) | NATIONAL | INTERNAT | ORGANIC | NON- ORGANIC | N/A | |||
| CEREAL | Wheat (barley, spelt etc.) |  | | | | | | | kg … |
| Rice paddy (rice) | | | | | | | | kg … | |
| Pasta | | | | | | | | kg … | |
| Bread (including pizza, pita, etc.) | | | | | | | | kg … | |
| Cereals, breakfast | | | | | | | | kg … | |
| Other cereals | | | | | | | | kg … | |
| MEAT | Beef | | | | | | | | kg … |
| Pork | | | | | | | | kg … | |
| Poultry (chicken, turkey, ducks) | | | | | | | | kg … | |
| Lamb, goat, sheep | | | | | | | | kg … | |
| Rabbit | | | | | | | | kg … | |
| Horse, mule, asses | | | | | | | | kg … | |
| Cold cuts (i.e., salami, prosciutto, sausage, etc.) | | | | | | | | kg … | |
| Other (specify) … | | | | | | | | kg … | |
| FISH | Sea bass | | | | | | | | kg … |
| Sea bream | | | | | | | | kg … | |
| Tuna | | | | | | | | kg … | |
| Swordfish | | | | | | | | kg … | |
| Lobster | | | | | | | | kg … | |
| Salmon | | | | | | | | kg … | |
| Prawns | | | | | | | | kg … | |
| Oysters | | | | | | | | kg … | |
| Mussels | | | | | | | | kg … | |
| Mackerel | | | | | | | | kg … | |
| Cod | | | | | | | | kg … | |
| Sole | | | | | | | | kg … | |
| Octopus | | | | | | | | kg … | |
| Sardines | | | | | | | | kg … | |
| Cuttlefish | | | | | | | | kg … | |
| Eel, carp, catfish, or snakehead | | | | | | | | kg … | |
| Other molluscs | | | | | | | | kg … | |
| EGGS AND DIARY | Eggs | | | | | | | | Number … |
| Cheese | | | | | | | | kg | |
| Milk | | | | | | | | l … | |
| Yogurt | | | | | | | | Kg | |
| Butter | | | | | | | | Kg … | |
| Ice cream | | | | | | | | kg … | |
| Soy/vegetable milk | | | | | | | | kg … | |
| OLIVE OILS | Olive oils | | | | | | | | kg … orl … |
| VEGETABLES and FRUITS | Vegetables | | | | | | | | kg … |
| Fruits | | | | | | | | kg … | |
| Nuts | | | | | | | | kg … | |
| Jam | | | | | | | | kg… | |
| Tomatoes | | | | | | | | kg … | |
| Olives | | | | | | | | kg … | |
| Legumes | | | | | | | | kg … | |
| Other, please specify | | | | | | | | kg … | |
| SPICES | Sugar | | | | | | | | kg … |
| Coffee | | | | | | | | kg … | |
| Tea | | | | | | | | kg … | |
| Cacao | | | | | | | | kg … | |
| Honey | | | | | | | | kg … | |
| Other spices (e.g., cinnamon, vanilla, etc.) | | | | | | | | kg … | |
| BAKED PRODUCTSOTHER | Cookies | | | | | | | | kg … |
| pies | | | | | | | | kg … | |
| Pancakes | | | | | | | | kg … | |
| brioches | | | | | | | | kg … | |
| Other pastries (e.g., typical pastries/deserts) | | | | | | | | kg … | |
| DRINKS | |||||||||
| DRINKS | ITEM | ORIGIN | MODE OF PRODUCTION | QUANTITY | |||||
| ON FARM(0 km) | LOCAL (up to 60 km Away) | NATIONAL | INTERN | ORGANIC | NON ORGANIC | N/A | |||
| WINE | Bottle | | | | | | | | l … |
| Jug | | | | | | | | l … | |
| BEER | Draught | | | | | | | | l … |
| Can | | | | | | | | l … | |
| Glass | | | | | | | | l … | |
| WATER | Tap water | | | | | l … | |||
| Glass bottle | | | | | l … | ||||
| Plastic bottle | | | | | l … | ||||
| JUICE | Can | | | | | | | | l … |
| Plastic | | | | | | | | l … | |
| Glass | | | | | | | | l … | |
| Fresh Squeezed | | | | | | | | l … | |
| OTHER | Spirits (specify) … | | | | | | | | l … |
| Other drinks (e.g., sodas) | | | | | | | | l … | |
Q. 07 Indicate the cooking time needed for preparing the entire meal (time on the stove or oven in minutes):
- Minutes: ________
Q. 08 Indicate the type of stove/oven used for preparing the meal (select all that apply):
- ☐
- Gas stove or oven
- ☐
- Electric/induction stove or oven
- ☐
- Wood stove or firewood oven
- ☐
- Other, specify….
Q. 09 How are the food left overs treated?
- ☐
- 100% discarded
- ☐
- 75% discarded and 25% re-used
- ☐
- 50% discarded and 50% re-used
- ☐
- 25% discarded and 75% re-used
- ☐
- 100% re-used
Q. 10 If reused, please indicate how: ____________
IF THERE ARE ANY OTHER NOTES YOU WANT/NEED TO SHARE, PLEASE WRITE BELOW:
__________________________________________________________________
__________________________________________________________________
REPEAT ALL QUESTIONS FOR EVERY MEAL
SECTION 3: MOBILITY AND TRANSFER
In which country is the PA located?
- ☐
- Italy
- ☐
- France
- ☐
- Spain
- ☐
- Croatia
- ☐
- Albania
- ☐
- Greece
What is the name of the PA you are giving information of?
_________________________
Which round of test are you collecting data for?
- ☐
- Round 1
- ☐
- Round 2
Q. 01 Day of the transfer (dd/mm/yyyy):
- ☐
- ___/___/_____
Q. 02 Name of the transport service provider
_____________________
Q. 03 Describe the point of origin and point of destination for this route:
- ☐
- From airport/station/port to the hotel
- ☐
- From hotel to airport/station/port
- ☐
- From hotel to restaurant
- ☐
- From restaurant to hotel
- ☐
- From hotel to activity
- ☐
- From activity to hotel
- ☐
- Moving of equipment for activity
- ☐
- Other—please specify
Q. 04 If the transfer is to a hotel, restaurant, or activity, please name the hotel/restaurant/activity:
___________________________
Q. 05 Indicate how many means of transport are used in the route:
- ☐
- __
Q. 06 If multiple means of transport are used, please indicate which segment you are answering for (e.g., in the case of three means indicate the following: 1/3 or 2/3 or 3/3):
__/__
Q. 07 Indicate the number of employees involved in providing the transfer service:
- ☐
- __
Q. 08 Indicate the distance (in km) covered in the route:
- km: ___________
Q. 09 Please indicate the duration of the transfer (in minutes):
- Minutes: _________
Q. 10 Indicate the mode of transport:
- ☐
- By walk
- ☐
- By bike
- ☐
- By car/4x4 WD car/van/shuttle/minibus
- ☐
- By public transport
- ☐
- By horse/mule riding
- ☐
- By ferry/speed boat
- ☐
- Sailing boat/catamaran/boat/dinghy
- ☐
- Other—please
Q. 11 For any motor vehicle used in the route, please indicate:
- Company: __________
- Model: _____________
- Year of construction: ___
- Fuel type
- ☐
- Gasoline
- ☐
- Diesel
- ☐
- Methane
- ☐
- LPG
- ☐
- Hybrid (petrol + electric)
- ☐
- Hybrid (petrol + LPG/methane)
- ☐
- Electric
- Fuel efficiency (in km/L or km/kg for methane vehicles):
- ☐
- <5
- ☐
- 5–10
- ☐
- 10–15
- ☐
- 15–20
- ☐
- 20–25
- ☐
- >25
- ☐
- Do not know
Q. 12 Indicate the vehicle occupancy (maximum number of people allowed in the vehicle):
- ☐
- __
IF THERE ARE ANY OTHER NOTES YOU WANT/NEED TO SHARE, PLEASE WRITE BELOW:
__________________________________________________________________
__________________________________________________________________
REPEAT SAME QUESTIONS FOR EVERY ROUTE
SECTION 4: ACTIVITIES & SERVICES
In which country is the PA located?
- ☐
- Italy
- ☐
- France
- ☐
- Spain
- ☐
- Croatia
- ☐
- Albania
- ☐
- Greece
What is the name of the PA you are giving information of?
_________________________
Which round of test are you collecting data for?
- ☐
- Round 1
- ☐
- Round 2
Q. 01 Day of the activity (dd/mm/yyyy):
- ☐
- ___/___/_____
Q. 02 Provide a brief description of the activity and what equipment is used (e.g., kayak, snorkel, etc.)
_____________________________________________________________________________________________________________________________________________________________________________________________________________________________________________________________________
Q. 03 Does the activity have any green/sustainable label or certification?
- ☐
- Yes, specify _______
- ☐
- No
Q. 04 Does the activity include any transfer of equipment (for instance bikes to be moved from their origin to the venue of the activity)?
- ☐
- Yes (then please fill a mobility survey)
- ☐
- No
Q. 05 Indicate the number of employees involved in providing the service/activity:
- ☐
- ___
Q. 06 Indicate the service provider for this activity and its name:
- ☐
- the Protected Area (name: ______________________)
- ☐
- Sailing service/school (name: _________________________)
- ☐
- Scuba diving club/school (name: ______________________)
- ☐
- Boat service (name: ________________________________)
- ☐
- Hotel involved (name: _______________________________)
- ☐
- Restaurant involved (name:_____________________________)
- ☐
- Bike provider (name:_________________________________)
- ☐
- Hiking company (name: _____________________________)
- ☐
- Museum (name: __________________________________)
- ☐
- Other—specify (name: _______________________________)
Q. 07 Indicate the duration of the activity in hours:
- ☐
- < 1
- ☐
- 1
- ☐
- 2
- ☐
- 3
- ☐
- 4
- ☐
- 5
- ☐
- >5
Q. 08 Indicate the distance covered during the activity (e.g., hiking or sailing)
- ☐
- m …
- ☐
- Km….
- ☐
- Miles…
- ☐
- Activity does not involve any move
Q. 09 Does the activity includes a motor vehicle?
- ☐
- Yes
- ☐
- No (End survey)
If yes, please provide following information:
Q. 10 Type of motor vehicle:
- ☐
- Car/Jeep
- ☐
- Motorboat
- ☐
- Sailing boat
- ☐
- Quad
- ☐
- Waterscooter
- ☐
- Waterbike
- ☐
- Other—please specify
Q. 11 Type of fuel:
- ☐
- Gasoline
- ☐
- Diesel
- ☐
- Methane
- ☐
- LPG
- ☐
- Hybrid (petrol + electric)
- ☐
- Hybrid (petrol + LPG/methane)
- ☐
- Electric
Q. 12 Mileage of the motor vehicle: km/L … or km/kg (for methane vehicle):
- ☐
- <5
- ☐
- 5–10
- ☐
- 10–15
- ☐
- 15–20
- ☐
- 20–25
- ☐
- >25
- ☐
- Do not know
IF THERE ARE ANY OTHER NOTES YOU WANT/NEED TO SHARE, PLEASE WRITE BELOW:
__________________________________________________________________
REPEAT SAME QUESTIONS FOR EVERY ACTIVITY
References
- WTTC. Travel & Tourism. Economic Impact 2017—World; WTTC: London, UK, 2017; Available online: https://www.wttc.org/-/media/files/reports/economic-impact-research/regions-2017/world2017.pdf (accessed on 19 April 2018).
- Fosse, J.; Le Tellier, J. Sustainable Tourism in the Mediterranean: State of Play and Strategic Directions; Plan Bleu Paper, 17; Plan Bleu: Valbonne, France, 2017. [Google Scholar]
- Piante, C.; Ody, D. Blue Growth in the Mediterranean Sea: The Challenge of Good Environmental Status; MedTrends Project; WWF-France: Marseille, France, 2015; 192p. [Google Scholar]
- Plan Bleu. Tourism and Sustainability in the Mediterranean—Key Facts and Trends; Working Document by Manuela Manca and Luca Santarossa; UNEP MAP Plan BLEU, Plan Bleu: Valbonne, France, 2016. [Google Scholar]
- EU, 2015. Sustainable Tourism in the Mediterranean. Aston Centre for Europe—Aston University; EU Publications: Brussels, Belgium, 2012. [Google Scholar]
- OECD. Tourism Trends and Policies; OECD: Paris, France, 2010; Available online: http://www.oecd.org/dataoecd/22/15/46754816.pdf (accessed on 19 April 2018).
- UN. Transforming Our World. The 2030 Agenda for Sustainable Development; A/RES/70/1; United Nations: New York, NY, USA, 2015; Available online: http://www.un.org/ga/search/view_doc.asp?symbol=A/RES/70/1&Lang=E (accessed on 19 April 2018).
- UNEP/MAP. Mediterranean Strategy for Sustainable Development 2016–2025; Plan Bleu, Regional Activity Centre: Valbonne, France, 2016. [Google Scholar]
- UNWTO. Tourism and the Sustainable Development Goals; United Nations World Tourism Organization: Madrid, Spain, 2015; Available online: http://icr.unwto.org/content/tourism-and-sdgs (accessed on 19 April 2018).
- UNEP; UNWTO. Making Tourism More Sustainable—A Guide for Policy Makers; UNEP: Paris, France; WTO: Madrid, Spain, 2005; pp. 11–12. [Google Scholar]
- Ceballos-Lascurain, H. Tourism, Ecotourism and Protected Areas; IUCN: Gland, Switzerland, 1996. [Google Scholar]
- McCool, S.F. The changing meaning of sustainable tourism. In Reframing Sustainable Tourism; McCool, S.F., Bosak, K., Eds.; Springer: Dordrecht, The Netherlands; Heidelberg, Germany; New York, NY, USA; London, UK, 2016; Volume 2, pp. 13–32. ISBN 978-94-017-7208-2. [Google Scholar]
- EU. The European Tourism Indicator System. ETIS Toolkit for Sustainable Destination Management; European Union: Brussels, Belgium, 2016; Available online: http://ec.europa.eu/growth/sectors/tourism/offer/sustainable/indicators/index_en.htm (accessed on 19 April 2018).
- GSTC. GSTC Criteria; Global Sustainable Tourism Council: Washington, DC, USA, 2016; Available online: https://www.gstcouncil.org/gstc-criteria/ (accessed on 19 April 2018).
- ECST—European Charter for Sustainable Tourism in Protected Areas; The Charter; Europark Federation: Regensburg, Germany, 2010; Available online: http://www.europarc.org/library/europarc-events-and-programmes/european-charter-for-sustainable-tourism/ (accessed on 19 April 2018).
- UNWTO. Ecotourism and Protected Areas; United Nations World Tourism Organization: Madrid, Spain, 2002; Available online: http://sdt.unwto.org/content/ecotourism-and-protected-areas (accessed on 19 April 2018).
- Drumm, A.; Rodriguez, A.; Danelutti, C.; Santarossa, L. Mediterranean Experience of Ecotourism Manual. A Guide to Discover the MEET Approach; IUCN and Meet Network: Gland, Switzerland; Malaga, Spain, 2016; p. 57. [Google Scholar]
- Interreg MED. Programme Manual—Strategic Framework. 2017. Available online: https://interreg-med.eu/toolbox/reference-documents/programme-manual/ (accessed on 19 April 2018).
- Wackernagel, M.; Rees, W.E. Our Ecological Footprint: Reducing Human Impact on the Earth; New Society Publishers: Gabriola Island, BC, Canada, 1996. [Google Scholar]
- Wackernagel, M.; Onisto, L.; Bello, P.; Linares, A.C.; Falfán, I.S.L.; Garcıa, J.M.; Guerrero, M.G.S. National natural capital accounting with the ecological footprint concept. Ecol. Econ. 1999, 29, 375–390. [Google Scholar] [CrossRef]
- Borucke, M.; Moore, D.; Cranston, G.; Gracey, K.; Katsunori, I.; Larson, J.; Lazarus, E.; Morales, J.C.M.; Wackernagel, M.; Galli, A. Accounting for demand and supply of the biosphere’s regenerative capacity: The National Footprint Accounts’ underlying methodology and framework. Ecol. Indic. 2013, 24, 518–533. [Google Scholar] [CrossRef]
- Lin, D.; Wackernagel, M.; Galli, A.; Kelly, R. Ecological Footprint: Informative and evolving—A response to van der Bergh and Grazi (2014). Ecol. Indic. 2015, 58, 464–468. [Google Scholar] [CrossRef]
- Kitzes, J.; Galli, A.; Bagliani, M.; Barrett, J.; Dige, G.; Ede, S.; Erb, K.; Giljum, S.; Haberl, H.; Hails, C.; Jolia-Ferrier, L.; et al. A research agenda for improving national Ecological Footprint accounts. Ecol. Econ. 2009, 68, 1991–2007. [Google Scholar] [CrossRef] [Green Version]
- Mancini, M.S.; Galli, A.; Coscieme, L.; Nicolucci, V.; Lin, D.; Pulselli, F.M.; Bastianoni, S.; Marchettini, N. Exploring ecosystem services assessment through Ecological Footprint accounting. Ecosyst. Serv. 2018, 30, 228–235. [Google Scholar] [CrossRef]
- Galli, A. On the rationale and policy usefulness of Ecological Footprint Accounting: The case of Morocco. Environ. Sci. Policy 2015, 48, 210–224. [Google Scholar] [CrossRef]
- Galli, A.; Kitzes, J.; Wermer, P.; Wackernagel, M.; Niccolucci, V.; Tiezzi, E. An exploration of the mathematic behind the Ecological Footprint. Int. J. Ecodyn. 2007, 2, 250–257. [Google Scholar] [CrossRef]
- Wackernagel, M.; Cranston, G.; Morales, J.C.; Galli, A. Ch. 24: Ecological Footprint Accounts. In Handbook of Sustainable Development: Second Revised Edition 2014; Atkinson, G., Dietz, S., Neumayer, E., Agarwala, M., Eds.; Edward Elgar: Cheltenham, UK, 2014; ISBN 978-1-78254-469-2. [Google Scholar]
- Galli, A.; Halle, M. Mounting Debt in a World in Overshoot: An Analysis of the Link between the Mediterranean Region’s Economic and Ecological Crises. Resources 2014, 3, 383–394. [Google Scholar] [CrossRef] [Green Version]
- GFN. 2017 Global Footprint Network. National Footprint Accounts, 2017 Edition. Available online: [email protected] (accessed on 19 April 2018).
- Mancini, M.S.; Galli, A.; Niccolucci, V.; Lin, D.; Hanscom, L.; Wackernagel, M.; Marchettini, N. Stocks and flows of natural capital: Implications for Ecological Footprint. Ecol. Indic. 2017, 77, 123–128. [Google Scholar] [CrossRef]
- Monfreda, C.; Wackernagel, M.; Deumling, D. Establishing national natural capital accounts based on detailed Ecological Footprint and biological capacity assessments. Land Use Policy 2004, 21, 231–246. [Google Scholar] [CrossRef]
- Wiedmann, T. A first empirical comparison of energy footprints embodied in trade—MRIO versus PLUM. Ecol. Econ. 2009, 68, 1975–1990. [Google Scholar] [CrossRef]
- Galli, A.; Wiedmann, T.; Ercin, E.; Knoblauch, D.; Ewing, B.; Giljum, S. Integrating Ecological, Carbon and Water footprint into a “Footprint Family” of indicators: Definition and role in tracking human pressure on the planet. Ecol. Indic. 2012, 16, 100–112. [Google Scholar] [CrossRef]
- Baabou, W.; Grunewald, N.; Ouellet-Plamondon, C.; Gressot, M.; Galli, A. The Ecological Footprint of Mediterranean cities: Awareness creation and policy implications. Environ. Sci. Policy 2017, 69, 94–104. [Google Scholar] [CrossRef]
- Galli, A.; Iha, K.; Halle, M.; El Bilali, H.; Grunewald, N.; Eaton, D.; Capone, R.; Debs, P.; Bottalico, F. Mediterranean countries’ food consumption and sourcing patterns: An Ecological Footprint viewpoint. Sci. Total Environ. 2017, 578, 383–391. [Google Scholar] [CrossRef] [PubMed]
- Galli, A.; Halle, M.; Grunewald, N. Physical limits to resource access and utilisation and their economic implications in Mediterranean economies. Environ. Sci. Policy 2015, 51, 125–136. [Google Scholar] [CrossRef]
- Global Footprint Network. How Can Mediterranean Societies Thrive in an Era of Decreasing Resources? Global Footprint Network: Barcelona, Spain, 2015. [Google Scholar]
- Gössling, S.; Hansson, C.B.; Hörstmeier, O.; Saggel, S. Ecological footprint analysis as a tool to assess tourism sustainability. Ecol. Econ. 2002, 43, 199–211. [Google Scholar] [CrossRef]
- Hunter, C.; Shaw, J. The ecological footprint as a key indicator of sustainable tourism. Tour. Manag. 2007, 28, 46–57. [Google Scholar] [CrossRef]
- Patterson, T.M.; Niccolucci, V.; Bastianoni, S. Beyond “more is better”: Ecological footprint accounting for tourism and consumption in Val di Merse, Italy. Ecol. Econ. 2007, 62, 747–756. [Google Scholar] [CrossRef]
- Castellani, V.; Sala, S. Ecological Footprint and Life Cycle Assessment in the sustainability assessment of tourism activities. Ecol. Indic. 2012, 16, 135–147. [Google Scholar] [CrossRef]
- Collins, A.; Cooper, C. Measuring and managing the environmental impact of festivals: The contribution of the Ecological Footprint. J. Sustain. Tour. 2016, 25, 148–162. [Google Scholar] [CrossRef] [Green Version]
- Patterson, T.M.; Niccolucci, V.; Marchettini, N. Adaptive environmental management of tourism in the Province of Siena, Italy using the ecological footprint. J. Environ. Manag. 2008, 86, 407–418. [Google Scholar] [CrossRef] [PubMed]
- Bagliani, M.; Da Villa, E.; Gattolin, M.; Niccolucci, V.; Patterson, T.M.; Tiezzi, E. The ecological footprint analysis for the province of Venice and the relevance of tourism. In The Sustainable City III; Marchettini, N., Brebbia, C.A., Tiezzi, E., Wadhwa, L.C., Eds.; WIT Press: Southampton, UK, 2004; pp. 123–131. [Google Scholar]
- Moore, J.; Kissinger, M.; Rees, W.E. An urban metabolism and ecological footprint assessment of metro Vancouver. J. Environ. Manag. 2013, 124, 51–61. [Google Scholar] [CrossRef] [PubMed]
- Hunter, C.; Shaw, J. Applying the ecological footprint to ecotourism scenarios. Environ. Conserv. 2006, 32, 294–304. [Google Scholar] [CrossRef]
- Lin, D.; Hanscom, L.; Martindill, J.; Borucke, M.; Cohen, L.; Galli, A.; Lazarus, E.; Zokai, G.; Iha, K.; Eaton, D.; et al. Working Guidebook to the National Footprint Accounts; Global Footprint Network: Oakland, CA, USA, 2017. [Google Scholar]
- Niccolucci, V.; Galli, A.; Kitzes, J.; Pulselli, R.M.; Borsa, S.; Marchettini, N. Ecological footprint analysis applied to the production of two Italian wines. Agric. Ecosyst. Environ. 2008, 128, 162–166. [Google Scholar] [CrossRef]
- OECD/IEA. Energy Statistic Manual; OECD/IEA: Paris, France, 2004; Available online: https://www.iea.org/publications/freepublications/publication/statistics_manual.pdf (accessed on 19 April 2018).
- IPCC. Guidelines for National Greenhouse Gases Inventories; Cambridge University Press: Cambridge, UK; New York, NY, USA, 2006; Chapter 3; Volume 2. [Google Scholar]
- Van Vliet, O.; Brouwer, A.S.; Kuramochi, T.; van den Broek, M.; Faaij, A. Energy use, cost and CO2 emissions of electric cars. J. Power Sources 2011, 196, 2298–2310. [Google Scholar] [CrossRef]
- Hawkins, T.R.; Singh, B.; Majeau-Bettez, G.; Strømman, A.H. Comparative environmental life cycle assessment of conventional and electric vehicles. J. Ind. Ecol. 2013, 17, 53–64. [Google Scholar] [CrossRef]
- Shrinking Footprint 2013. Available online: http://shrinkthatfootprint.com/electric-car-emissions (accessed on 19 April 2018).
- Pesut, D. Overview of Energy Sector in Balkan Region. Available online: http://siteresources.worldbank.org/EXTENERGY2/Resources/4114199-1306178323340/S1_Pesut.pdf (accessed on 19 April 2018).
- EEA, 2016. Available online: https://www.eea.europa.eu/data-and-maps/daviz/share-of-fuel-in-primary-1#tab-chart_1 (accessed on 19 April 2018).
- Cristea, A.D.; Hummels, D.; Puzzello, L.; Avetisyan, M.G. Trade and Greenhouse Gas Emissions from International Freight Transport; Working Paper Series; National Bureau of Economic Research: Cambridge, MA, USA, 2011; Available online: http://www.nber.org/papers/w17117.pdf (accessed on 19 April 2018).
- Trade and the Greenhouse Gas Emissions from International Freight Transport. Available online: http://www.nber.org/papers/w17117.pdf (accessed on 19 April 2018).
- Distance Calculator. Available online: https://www.distance.to/ (accessed on 19 April 2018).
- Treu, H.; Nordborg, M.; Cederberg, C.; Heuer, T.; Claupein, E.; Hoffmann, H.; Berndes, G. Carbon footprints and land use of conventional and organic diets in Germany. J. Clean. Prod. 2017, 161, 127–142. [Google Scholar] [CrossRef]
- Clune, S.; Crossin, E.; Verghese, K. Systematic review of greenhouse gas emissions for different fresh food categories. J. Clean. Prod. 2017, 140, 766–783. [Google Scholar] [CrossRef]
- Cimini, A.; Moresi, M. Energy efficiency and carbon footprint of home pasta cooking appliances. J. Food Eng. 2017, 204, 8–17. [Google Scholar] [CrossRef]
- Biomass Related to Cooking Stoves—Carbon Emissions.xls (Sheet 4). Available online: https://www.google.it/url?sa=t&rct=j&q=&esrc=s&source=web&cd=9&cad=rja&uact=8&ved=0ahUKEwji2ufvh83XAhUQoKQKHSzVAWQQFghhMAg&url=https%3A%2F%2Fwww.mercycorps.org%2Fsites%2Fdefault%2Ffiles%2FBiomass%2520related%2520to%2520Cooking%2520Stoves%2520-%2520Carbon%2520Emissions.xls&usg=AOvVaw1wIUfaeQbwJwgRAiDABlnR (accessed on 19 April 2018).
- Bastianoni, S.; Galli, A.; Pulselli, R.M.; Niccolucci, V. Environmental and economic evaluation of natural capital appropriation through building construction: Practical case study in the Italian context. Ambio 2007, 36, 559–565. [Google Scholar] [CrossRef]
- UK POST (Parliamentary Office for Science and Technology). Available online: http://www.geni.org/globalenergy/library/technical-articles/carbon-capture/parliamentary-office-of-science-and-technology/carbon-footprint-of-electricity-generation/file_9270.pdf (accessed on 19 April 2018).
- US EIA (Energy Information Administration). Available online: https://www.eia.gov/tools/faqs/faq.php?id=74&t=11 (accessed on 19 April 2018).
- EPA. Direct Emissions from Stationary Combustions. 2016. Available online: https://www.epa.gov/sites/production/files/2016-03/documents/stationaryemissions_3_2016.pdf (accessed on 19 April 2018).
- UK POST. Carbon Footprint of Heat Generation; Parliamentary Office for Science and Technology: London, UK, 2016. [Google Scholar]
- Hong, B.; Howhart, R.W. Greenhouse gas emissions from domestic hot water: Heat pumps compared to most commonly used system. Energy Sci. Eng. 2016, 4, 123–133. [Google Scholar] [CrossRef]
- All-Energy—Exhibition and Conference. Available online: https://www.all-energy.co.uk (accessed on 19 April 2018).
- Filimonau, V.; Dickinson, J.; Robbins, D.; Huijbregts, M.A. Reviewing the carbon footprint analysis of hotels: Life Cycle Energy Analysis (LCEA) as a holistic method for carbon impact appraisal of tourist accommodation. J. Clean. Prod. 2011, 19, 1917–1930. [Google Scholar] [CrossRef]
- Scheuer, C.W.; Keoleian, G.A.; Reppe, P. Life Cycle Energy and Environmental Performance of a New University Building: Modeling Challenges and Design Implications. Energy Build. 2003, 35, 1049–1064. [Google Scholar] [CrossRef]
Figure 1.
Scheme of the EF approach applied to DestiMED project that could serve as a blueprint for similar future studies on ecotourism sustainability. Rectangle boxes: boundaries of different system. White central rectangle: visual scheme of the EF methodological steps as described in Section 3.1 of the paper. Blue boxes are processes conducted mainly by GFN. Green boxes are processes conducted mainly by LEC. Red box: process is conducted by IUCN and George Washington University.
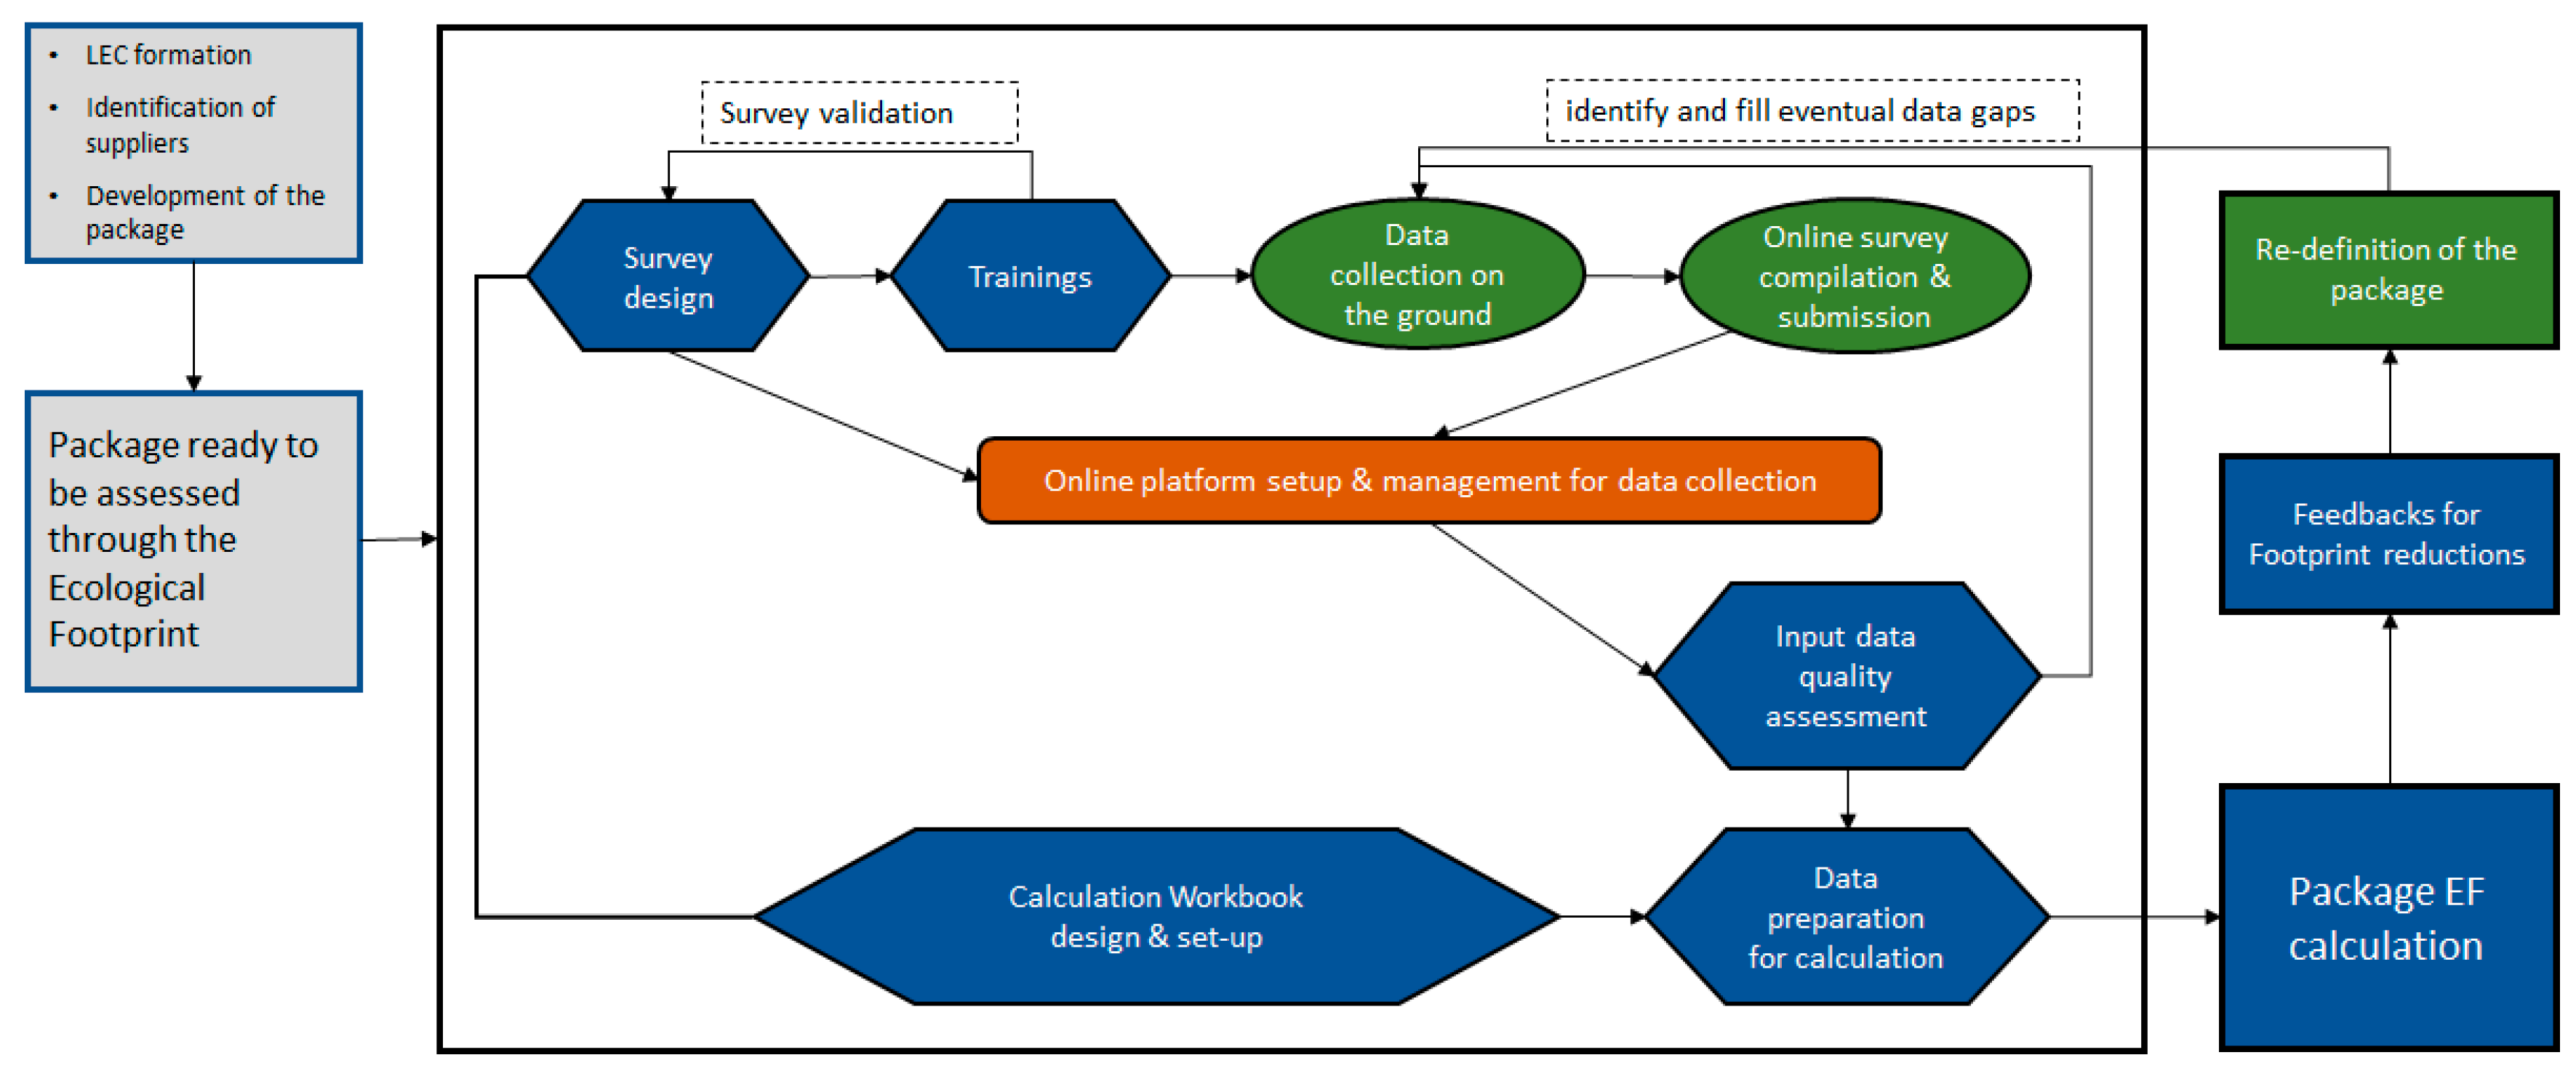
Figure 2.
Common macro-categories of services provided in tourism packages. This classification has been used to organize data collection and then process input data into the excel-based workbook to calculate the Ecological Footprint.
Figure 2.
Common macro-categories of services provided in tourism packages. This classification has been used to organize data collection and then process input data into the excel-based workbook to calculate the Ecological Footprint.
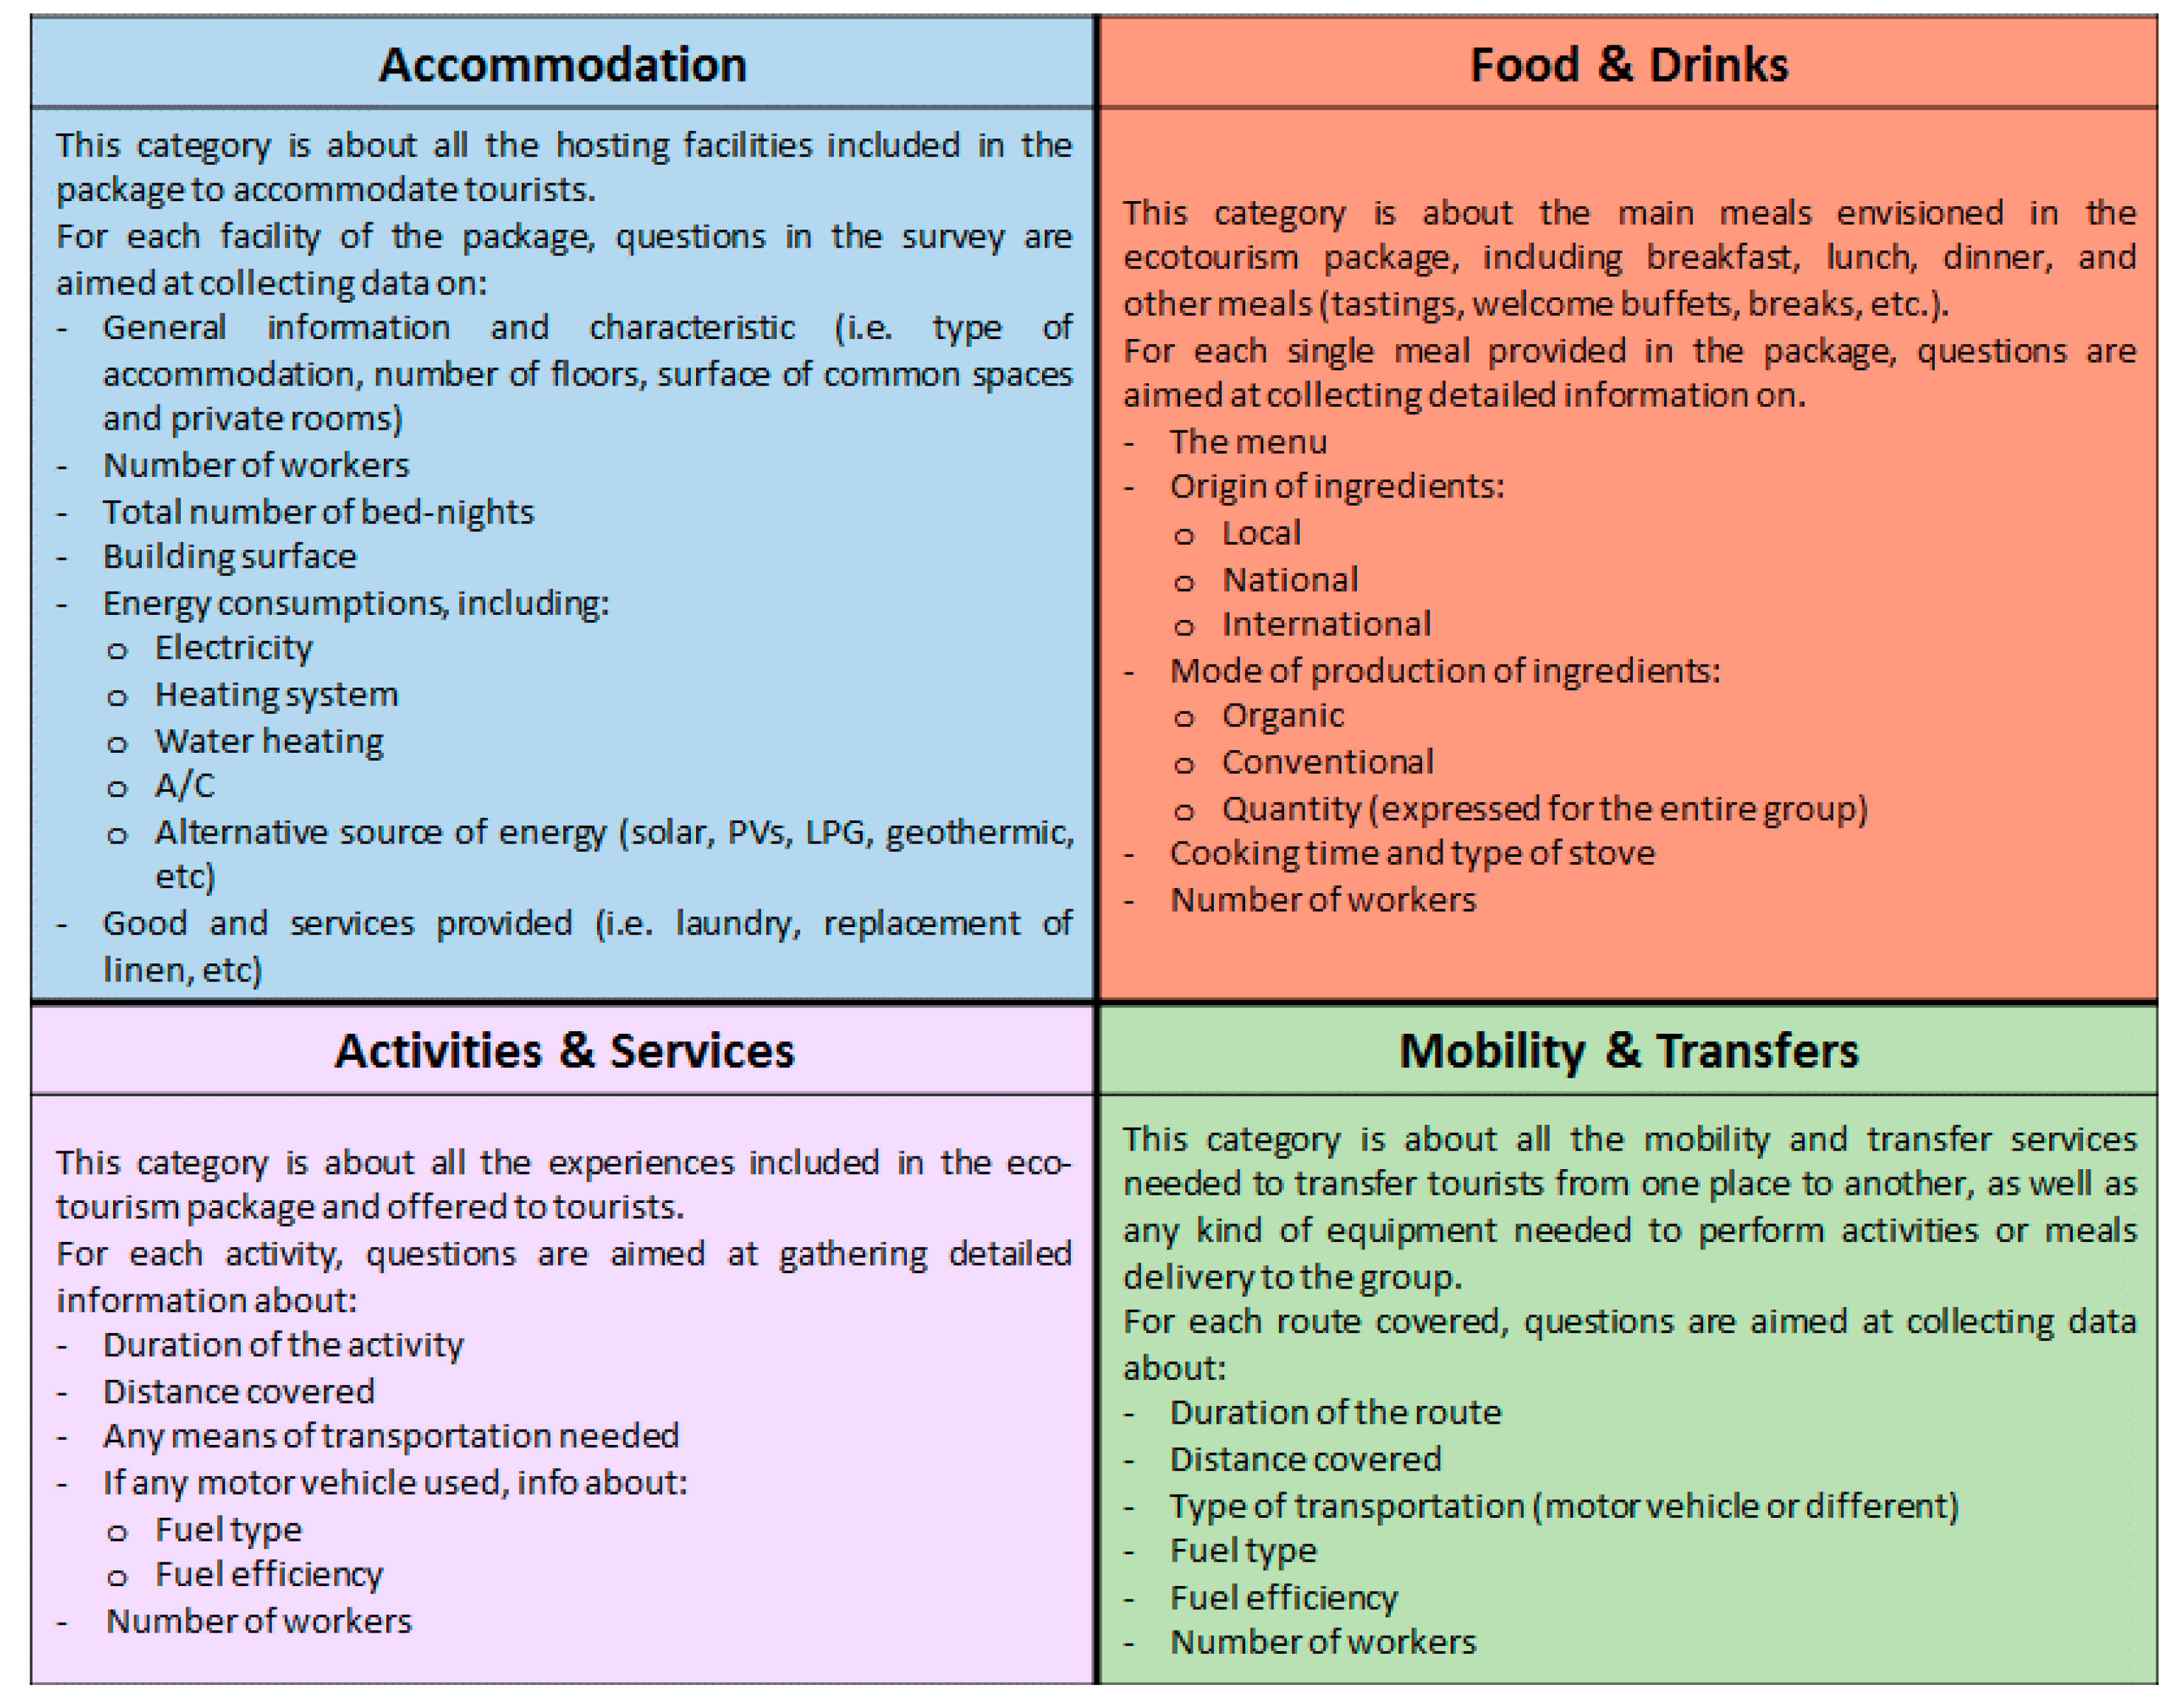

Table 1.
Constant factors from NFA 2017 edition stored in the cnst_NFAs worksheet and used to calculate EF in the four categories of ecotourism.
Table 1.
Constant factors from NFA 2017 edition stored in the cnst_NFAs worksheet and used to calculate EF in the four categories of ecotourism.
| Constant Factors | Unit | Value |
|---|---|---|
| Equivalence Factors | ||
| Crop Land | [gha wha−1] | 2.53 |
| Grazing Land | [gha wha−1] | 0.46 |
| Forest land | [gha wha−1] | 1.29 |
| Fishing ground | [gha wha−1] | 0.37 |
| Built-up land | [gha wha−1] | 2.53 |
| Carbon Footprint | [gha wha−1] | 1.29 |
| National Electricity Carbon Intensity | ||
| Albania | [kg CO2 (kWh)−1] | 0.33 |
| Croatia | [kg CO2 (kWh)−1] | 0.23 |
| France | [kg CO2 (kWh)−1] | 0.06 |
| Greece | [kg CO2 (kWh)−1] | 0.70 |
| Italy | [kg CO2 (kWh)−1] | 0.33 |
| Spain | [kg CO2 (kWh)−1] | 0.25 |
| Footprint Intensity of Carbon | [gha (kg CO2 (year−1))−1] | 0.000344 |
Table 2.
Estimated hourly footprint values [this study].
| Country Name | Cropland | Grazing | Forest | Fishing | Built up | Carbon | Total |
|---|---|---|---|---|---|---|---|
| [gha cap−1 h−1] | [gha cap−1 h−1] | [gha cap−1 h−1] | [gha cap−1 h−1] | [gha cap−1 h−1] | [gha cap−1 h−1] | [gha cap−1 h−1] | |
| Albania | 8.85 × 10⁻⁵ | 2.75 × 10⁻⁵ | 2.99 × 10⁻⁵ | 2.76 × 10⁻⁶ | 6.40 × 10⁻⁶ | 1.07 × 10⁻⁴ | 2.62 × 10⁻⁴ |
| Croatia | 8.45 × 10⁻⁵ | 2.12 × 10⁻⁵ | 7.49 × 10⁻⁵ | 8.19 × 10⁻⁶ | 6.53 × 10⁻⁶ | 2.35 × 10⁻⁴ | 4.31 × 10⁻⁴ |
| France | 1.19 × 10⁻⁴ | 3.05 × 10⁻⁵ | 5.97 × 10⁻⁵ | 2.24 × 10⁻⁵ | 2.10 × 10⁻⁵ | 3.26 × 10⁻⁴ | 5.78 × 10⁻⁴ |
| Greece | 1.14 × 10⁻⁴ | 3.83 × 10⁻⁵ | 3.13 × 10⁻⁵ | 9.54 × 10⁻⁶ | 6.00 × 10⁻⁶ | 2.81 × 10⁻⁴ | 4.80 × 10⁻⁴ |
| Italy | 9.78 × 10⁻⁵ | 3.76 × 10⁻⁵ | 4.83 × 10⁻⁵ | 1.35 × 10⁻⁵ | 6.85 × 10⁻⁶ | 3.10 × 10⁻⁴ | 5.14 × 10⁻⁴ |
| Spain | 1.22 × 10⁻⁴ | 1.74 × 10⁻⁵ | 2.15 × 10⁻⁵ | 4.12 × 10⁻⁵ | 5.66 × 10⁻⁶ | 2.52 × 10⁻⁴ | 4.60 × 10⁻⁴ |
Table 3.
Constants for road transport and water-borne transport fuels. Grey cells contain data drawn directly from the listed sources, whereas white cells are calculated in this study.
Table 3.
Constants for road transport and water-borne transport fuels. Grey cells contain data drawn directly from the listed sources, whereas white cells are calculated in this study.
| Fuel Type | Fuel Density | Net Calorific Value | Fuel Energy Content | Emission Factors | Fuel Emission |
|---|---|---|---|---|---|
| kg/L | TJ/Gg | TJ/L | kg CO2/TJ | kg CO2/L | |
| Gasoline | 0.7407 | 44.3 | 3.28 × 10⁻⁵ | 69,300 | 2.27 |
| Diesel | 0.8439 | 43.0 | 3.63 × 10⁻⁵ | 74,100 | 2.69 |
| Methane | 0.421 | 48.0 | 2.02 × 10⁻⁵ | 56,100 | 1.13 |
| LPG | 0.5222 | 47.3 | 2.47 × 10⁻⁵ | 63,100 | 1.56 |
| Hybrid (P + M) (*) | n/a | n/a | n/a | 1.70 | |
| kg CO2eq/km | |||||
| Hybrid (P + E) (**) | n/a | n/a | n/a | 1.08 × 10⁻¹ | |
| Source: | [49] | [50] | [50] |
Note: (*) Due to the lack of emissions data for vehicles with hybrid fuels, we estimated the value as an average between gasoline and methane vehicles. (**) Source: [51]. This value refers to series-hybrid electric vehicles (SHEV), and is expressed in g CO2eq per km. Non-CO2 emissions from vehicle are methane and N2O but—according to EPA—the emissions of these gases are small in comparison to CO2. As such, and given the lack of CO2 values, we assume that CO2 represents 100% of the CO2eq.
Table 4.
Constant factors for electric vehicles. Data source: [53].
Table 4.
Constant factors for electric vehicles. Data source: [53].
| Country | Electric Vehicle Emissions |
|---|---|
| kg CO2eq/km | |
| Albania(*) | 0.26 |
| Croatia(*) | 0.26 |
| France | 0.09 |
| Greece(**) | 0.20 |
| Italy | 0.17 |
| Spain | 0.15 |
Note: (*) As data for Albania and Croatia were missing, value of China is used, as it is the lowest value (most conservative estimate) among the countries with coal-based electricity production. This is also consistent with the fact that electricity production in the Balkans primarily relies on coal (73%) [54]. (**) As data for Greece was missing, the value of Turkey is used here, due to geographical proximity and similar fossil-fuels-based electricity production [55].
Table 5.
Carbon intensity factor of commodities traded within Europe. Grey cells contain data drawn directly from the listed sources, whereas white cells are derived in this study.
Table 5.
Carbon intensity factor of commodities traded within Europe. Grey cells contain data drawn directly from the listed sources, whereas white cells are derived in this study.
| Mode of Transport | Share by Mode (at EU Level) | g CO2 (t-km)−1 | kg CO2 (kg-km)−1 |
|---|---|---|---|
| Sea (container) | 92% | 12.1 | 1.21 × 10⁻⁵ |
| Air (boeing) | 1% | 552 | 5.52 × 10⁻⁴ |
| Rail | 2% | 22.7 | 2.27 × 10⁻⁵ |
| Road | 5% | 119.7 | 1.20 × 10⁻⁴ |
| Average | 23.8461 | 2.38 × 10⁻⁵ | |
| Source | [57] | ||
Table 6.
Carbon footprint associated with the international transport. Estimation of this study.
| Country | Average Importing Distance | Carbon Footprint |
|---|---|---|
| [km] | [gha kg−1] | |
| Albania | 2473 | 2.03 × 10⁻⁵ |
| Croatia | 3282 | 2.69 × 10⁻⁵ |
| France | 2779 | 2.28 × 10⁻⁵ |
| Greece | 2867 | 2.35 × 10⁻⁵ |
| Italy | 3163 | 2.59 × 10⁻⁵ |
| Spain | 3344 | 2.74 × 10⁻⁵ |
Table 7.
Carbon footprint intensities for different typologies of packaging applied to drink items in this study.
Table 7.
Carbon footprint intensities for different typologies of packaging applied to drink items in this study.
| Drinks Packaging Type | Carbon Footprint Intensity (Drink) |
|---|---|
| [gha l−1] | |
| Unpackaged | 0 |
| Glass bottle | 0.000125 |
| Plastic bottle | 0.000040 |
| Aluminum can | 0.000044 |
Table 8.
Estimation of emission factors based on the stove type and time on the stove for cooking. Grey cells contain data drawn directly from the listed sources, whereas white cells are derived in this study.
Table 8.
Estimation of emission factors based on the stove type and time on the stove for cooking. Grey cells contain data drawn directly from the listed sources, whereas white cells are derived in this study.
| Stove Type | Energy Delivered to Pot to Cook Pasta | Cooking Time | Energy Delivered to Pot | gCO2eq/MJ-Delivered to Pot | Emissions |
|---|---|---|---|---|---|
| [KJ] | [min] | [MJ h−1] | [g CO2 MJ−1] | [kg CO2 h−1] | |
| Gas stove/oven | 1261 | 11 | 6.8781818 | 125.6 | 0.86 |
| Electric stove/oven or Induction cooktop | 868 | 11 | 4.7345455 | 108.4 | 0.51 |
| Coal stove/firewood oven | 537.5 | 3.70 | |||
| Source | [61] | [61] | [62] |
Table 9.
Footprint intensity factors for buildings. Data source: [63].
Table 9.
Footprint intensity factors for buildings. Data source: [63].
| Building Type | Forest Footprint | Built-up Footprint | Carbon Footprint |
|---|---|---|---|
| [gha (m2)−1gha/m2] | [gha (m2)−1] | [gha (m2)−1] | |
| 2-storey detached house | 1.94 × 10⁻⁴ | 2.17 × 10⁻⁴ | 3.58 × 10⁻³ |
| 4-storey condominium | 3.87 × 10⁻⁴ | 2.17 × 10⁻⁴ | 5.29 × 10⁻³ |
Table 10.
CO2 emissions factor for electricity generation by alternative type of fuel/energy source.
Table 10.
CO2 emissions factor for electricity generation by alternative type of fuel/energy source.
| Type of Alternative Energy Source | Carbon Emission Factor | Source |
|---|---|---|
| [kg CO2 (kWh)−1 or l−1 or (m3)−1] | ||
| Photovoltaic | 0.0350 | [64] |
| Wind energy | 0.0046 | [64] |
| Thermoelectric generator | 0.9397 | [65] |
| Geothermal energy | 0.0263 | [65] |
| Hydro generator | 0.0030 | [64] |
| LPG | 4.2069 | [64] |
| Natural gas | 4.4784 | [65] |
| Diesel | 9.3446 | Assumed equal to petroleum |
| Solar | 0.0350 | Assumed equal to PV |
Table 11.
CO2 emissions factor for heating system produced by alternative type of fuel/energy source.
Table 11.
CO2 emissions factor for heating system produced by alternative type of fuel/energy source.
| Heating System Energy Source | Carbon Emission Factor | Source |
|---|---|---|
| [kg CO2 (kWh)−1 or l−1 or (m3)−1 or kg] | ||
| Natural gas (methane) | 1.921 | [66] |
| LPG (propane) | 1.363 | [66] |
| Heating oil | 3.083 | [67] |
| Heat pump | 0.070 | [67] |
| Solar energy | 0.010 | [67] |
| Biomass (wood and pellet) m3 | 1.689 | [66] |
Table 12.
CO2 emissions factor for water heating produced by alternative type of fuel/energy source.
Table 12.
CO2 emissions factor for water heating produced by alternative type of fuel/energy source.
| Hot Water Energy Source | Carbon Emission Factor | Source |
|---|---|---|
| [Source Type] | [kg CO2 (kWh)−1 or l−1 or (m3)−1] | |
| Natural gas (methane) | 3.304 | [68] |
| LPG (propane) | 3.304 | Assumed equal to natural gas |
| Heating oil | 3.086 | [68] |
| Heat pump | 0.151 | [68] |
| Solar energy | 0 | We estimate no emissions due to hot water production by solar panels |
| Biomass (wood and pellet) | 0.786 | [69] |
Table 13.
Category-specific limitations and assumptions in this study.
Accommodation category
| Food & Drink
|
Activities & Services
|
© 2018 by the authors. Licensee MDPI, Basel, Switzerland. This article is an open access article distributed under the terms and conditions of the Creative Commons Attribution (CC BY) license (http://creativecommons.org/licenses/by/4.0/).
Share and Cite
MDPI and ACS Style
Mancini, M.S.; Evans, M.; Iha, K.; Danelutti, C.; Galli, A. Assessing the Ecological Footprint of Ecotourism Packages: A Methodological Proposition. Resources 2018, 7, 38. https://doi.org/10.3390/resources7020038
AMA Style
Mancini MS, Evans M, Iha K, Danelutti C, Galli A. Assessing the Ecological Footprint of Ecotourism Packages: A Methodological Proposition. Resources. 2018; 7(2):38. https://doi.org/10.3390/resources7020038
Chicago/Turabian StyleMancini, Maria Serena, Mikel Evans, Katsunori Iha, Carla Danelutti, and Alessandro Galli. 2018. "Assessing the Ecological Footprint of Ecotourism Packages: A Methodological Proposition" Resources 7, no. 2: 38. https://doi.org/10.3390/resources7020038
Note that from the first issue of 2016, this journal uses article numbers instead of page numbers. See further details here.