Scenario Modelling of the “Green” Economy in an Economic Space


1
Head of Educational Program, Federal State Budget Educational Institution of Higher Education, Industrial University of Tyumen, Tyumen 625000, Volodarskogo, Russia
2
Department of Foreign Languages, Federal State Budget Educational Institution of Higher Education, Industrial University of Tyumen, Tyumen 625000, Volodarskogo, Russia
3
Department of Economics and Organization of Production, Federal State Budget Educational Institution of Higher Education, Industrial University of Tyumen, Tyumen 625000, Volodarskogo, Russia
*
Author to whom correspondence should be addressed.
Resources 2018, 7(2), 29; https://doi.org/10.3390/resources7020029
Submission received: 12 March 2018
/
Revised: 20 April 2018
/
Accepted: 23 April 2018
/
Published: 25 April 2018
(This article belongs to the Collection Management, Environment, Energy and Sustainability under a Circular Economy)
Abstract
:The article utilizes the main elements of system analysis and the bases of cognitive science to analyze the concept of the “ecological and economic system”. The characteristics of the conceptual elements of the “green” economy dynamic model used in the application of cognitive analysis are given and their mutual influence is considered. A dynamic model of the “green” economy is developed, a general extended map and a reduced-parametric cognitive map of the development of the “green” economy in the economic space of the region are constructed. Scenario modelling of the development of the region’s “green” economy based on the intensification of the influence of one of the cognitive vertices of the model on the curve of the development of the “green” economy is carried out and described. Scenario modelling and development of cognitive maps are carried out using the software package Vensim Personal Learning Edition (PLE), which is widely applied in system analysis.
1. Introduction
The “green” economy was mentioned in the United Nations (UN) program text for the first time in 1989. The active use of this concept is associated with the launch of the Green Enterprise Initiative (GEI) in 2008, which seeks to transform environmental protection into a creative process, encouraging everyone to careful daily handling of nature [1].
The study of the concept of the “green” economy made it possible to identify several interpretations: industry, economy, a version of the concept of sustainable development, and a new socioeconomic system. According to the UN, the “green” economy is an economy that leads to improved welfare and social equality, while significantly reducing economic risks and a shortage of natural resources [2].
The transition to this development model is due to an attempt by the countries to solve a complex of fuel and energy problems that have acquired special relevance.
The principles of the “green” economy continue to develop and advance in various countries of the world and, according to the European Environment Agency, include equality and justice of generations, conformity to the principles of sustainable development, adequate consideration of natural and social capital, sustainable and efficient use of resources, green jobs, poverty eradication, competitiveness and growth in the key sectors of the economy [3].
Experts note that the promotion of the transition to the “green” economy occurred in the early 2010s, as evidenced by the increased number of mentions of this concept by politicians, public and intergovernmental organizations, as well as an increase in the number of scientific studies devoted to the implementation of the concept of the “green” economy and evaluation of its development.
From the perspective of the specification from the concept of sustainable development of the economic space to the concept of the “green” economy, it is interesting to study methodological approaches to assessment of the progress of the development of economic spaces within each of the concepts. Thus, one of the world’s most famous estimates of sustainable development is the Living Planet Index, an integrated indicator computed in 1970 using aggregation methods, displaying sustainability on a planetary scale and most reflective of the economic development load on the ecosystem of the world.
Leaders in the field of sustainable development assessment include the World Bank, which since 1980 has been assessing the eradication of poverty in countries of the world based on more than 500 indicators and cites it in the annual report “The World Development Indicators”, the analysis of which is conducted at the local, regional and national levels. Since 2000, the annual “green” directory “The Little Green Data Book” has been issued, in which the indicator “true savings” based on the Gross Domestic Product (GDP) estimate was proposed. This indicator refers to the real rate of accumulation of national savings after proper consideration of investments in increasing human capital, depletion of natural resources and damage from environmental pollution. From the standpoint of sustainable development, negative indicators of true savings show the formation of an antisustainable type of development and must inevitably lead to a deterioration in well-being [4].
Since 1990, the Human Development Index (HDI) indicator has appeared in the UN reports on the human development potential. In 2010, the calculation methodology underwent significant changes and three new indexes were introduced: the Inequality-Adjusted Human Development Index (IHDI), the Gender Inequality Index (GII) and the Multidimensional Poverty Index (MPI) [5].
Since 1990, the countries of the Organization for Economic Cooperation and Development (OECD) have been developing a program of environmental indicators. In 1993, a model of sustainable development indicators was presented through a logical sequence of cause-effect relationships (load-state of the environment—society’s response), which includes ten indicators. This model was used as a basis for the Eurostat’s European Impact Indicators and is often used in analytical reviews related to the assessment of environmental quality. Accounting for the environmental factor in statistical observations was introduced in 1993 under the name of the program “System for Integrated Environmental and Economic Accounting” [6].
In 1992, William Rees proposed an indicator of the development of the area called “The Ecological Footprint”, which has found wide application in the WWF assessment programs [7]. In 1996, the Commission on Sustainable Development of the United Nations (UNCSD) proposed a draft of “Indicators of Sustainable Development: Framework and Methodology”, which includes a comprehensive assessment of 132 indicators. Special attention is paid to the development of socio-economic indicators, however, on the whole, sustainability is seen as a change in certain states that can maintain stability under qualitative changes [8].
In 2001, researchers from Yale and Columbia Universities proposed the “Environmental Sustainability Index” (ESI). The methodology of 22 indicators includes the analysis of sustainability in five areas: the state of ecosystems, environmental stress, environmental aspects of public health, social and institutional opportunities and international activity of the country (calculated before 2005) [9].
In 2006, to measure the sustainability of the country’s social development, the Society Sustainability Index was created by the Dutch researchers Geurt van de Kerk and Arthur Manuel under the auspices of the Sustainable Society Foundation. The methodology is based on an expanded understanding of sustainable development and includes 24 benchmarks ranging from 0 (lowest sustainability) to 10 (highest sustainability) in the three components of sustainable development: economic, social and environmental [10].
Since 2006, the ESI index has been revised and developed into the “Environmental Performance Index” (EPI) for the environmental load and rational use of natural resources. The index is constantly improving and in 2014 the basis for the EPI involved 20 indicators combined into two groups—viability of the ecosystem (management of natural resources) and environmental health (environmental impact on human health) [11].
Specific indicators that determine the sustainability of development are the Millennium Development Goals (MDG 8) of the United Nations [12]. The new agenda for the UN in 2016 identifies 17 goals in four areas of sustainable development (SDG): economic, social, environmental and management, aimed at stimulating activities in areas of great importance for humanity until 2030 [13].
In its pure form, the accumulated statistical information on various areas of activity of socio-economic systems, in most cases, is not informative and requires further processing. Traditional methods of analysis include a set of economic and statistical techniques and a method of indication. A relatively new way is to apply the approaches of system analysis and cognitive modelling to assess the development of socioeconomic processes. The system approach analyzes and examines the surrounding world from the point of view of its organization, directing cognitive and practical activities of a person to reveal the universal interaction and interrelation of development.
In modern scientific literature, the concept of “ecological and economic system” is widely used, making it possible to study stability from the position of a more complex organization, not as a process of distribution of limited resources, but as the interaction of a set of elements of different nature (natural and human-made). Most researchers view the ecological and economic system as an open-type dynamic system in which the exchange between the environment and economy is constantly carried out. It is necessary to consider several key distinctive features between its constituent subsystems—economy and ecology. The economy is an artificially created environment that has a finite temporal factor of functioning and constraints in development, whereas the ecological subsystem is natural, without a temporal factor of limited functioning.
To ensure the diversity of the trajectories of the development of the ecological and economic system and to improve the accuracy of forecasts, simulation modelling is often used [14]. It is the most popular and visual way to solve a wide range of issues in the analysis, planning, and management of the stability of objects of different levels and complexity (company, region, etc.). One of the main purposes of the simulation model is the multiple analysis of various options for possible development of analyzed variables that cannot be carried out in practice.
The most famous dynamic model is the development of R. Costanza and H. Daly based on the interaction of various flows that create several types of capital: human, natural, produced [15,16,17].
In A.S. Surkova’s opinion, the economy, being a production environment, processes “input” natural resources and “outputs” pollution (“waste from industrial activity”) [18]. This view is the simplest example of the functioning of a typical “ecological and economic system” based on the exchange of flows of substances. Among the studies there are attempts to study economic sustainability from the standpoint of socioeconomic analysis [19], happiness and health [20], the innovative component [21] and the ecological-economic [22].
Of particular relevance in modern theoretical and applied research has been the construction of ecological models aimed at solving issues related to predicting the development of analyzed parameters, including CRYSYS—CRYosphereSYStem (climate models), HASA-CASA (DGVM—dynamic global vegetation model), OCAM (oceanic model), MARKAL (analysis of environmental problems of the industry), ECOPATH (aquatic ecosystems), MEDIAS (MEDiteranean International Acoustic Survey) and others [23].
The cognitive approach (cognitive modelling), which is becoming more widely used in the development of dynamic systems in the economy, is aimed at investigating the cause–effect relationships that determine the parameters of system [24].
The emergence of cognitive science dates to 1960 when the first center of cognitive research was opened in Harvard. Cognitive (mental) maps, which are the basis of cognitive science, were first mentioned in the study of E. Tolman in 1948. Elements and stages of the formation of the foundations of cognitive science and cognitive modelling are reflected in the studies of a number of scientists: W. Neisser (1967), A. Cicourel (1973), R. Axelrod (1976), C. Dumis (1976), K. Sayd (1986), K. Idei (1988), R. Solso (1996), and others [25].
Cognitive modelling was first mentioned in 1976 (University of Princeton), and the appearance of fuzzy cognitive maps of B. Koscodates appeared in the 1980s. Nowadays, cognitive maps are an effective tool for system analysis in various fields, allowing for the studying and modelling heterogeneous situations using a large set of interrelated factors of the external and internal environment, and creating and testing scenarios of controlled targeted development. Researchers can describe and structure real events, applying their own subjective assessments, and modelling rational scenarios for the development of certain phenomena and processes.
With the use of cognitive models, the region’s economic space is viewed as a dynamic system with mutually influencing elements. Simultaneous use of quantitative and qualitative parameters is possible in the process of modelling. Some authors (Gorelova G.V., Zakharova E.N., Radchenko S.A., Dorgushaova A.K.) note a certain sequence of actions in cognitive modelling which consists of five key stages: development of a cognitive model in the form of a cognitive map, its analysis, impulse simulation, construction of scenarios for the development of the system, designing a strategy for managing the system.
2. Materials and Methods
To model the scenario of the “green” economy development in the economic space and determine its effectiveness, we use the toolkit of cognitive modelling and conduct its approbation on the example of the economic space of the region (UFD). When constructing a cognitive map, the study materials [26,27,28] were used and its main intermediate results were considered (Table 1).
These conceptual elements (concepts) used in constructing a cognitive map are not exhaustive and can be revised, adjusted and supplemented considering specific regional features of the development of the “green” economy or research objectives. Table 2 provides an explanation of the main characteristic relationships obtained in cognitive modelling.
Inertial pulses are divided into “input” and “output”, having direct and reverse influence (positive or negative). For example, the aggregated “vertices” of the cognitive map do not have negative output pulses because this property is characteristic of a state of balanced stability—the result that the given system seeks.
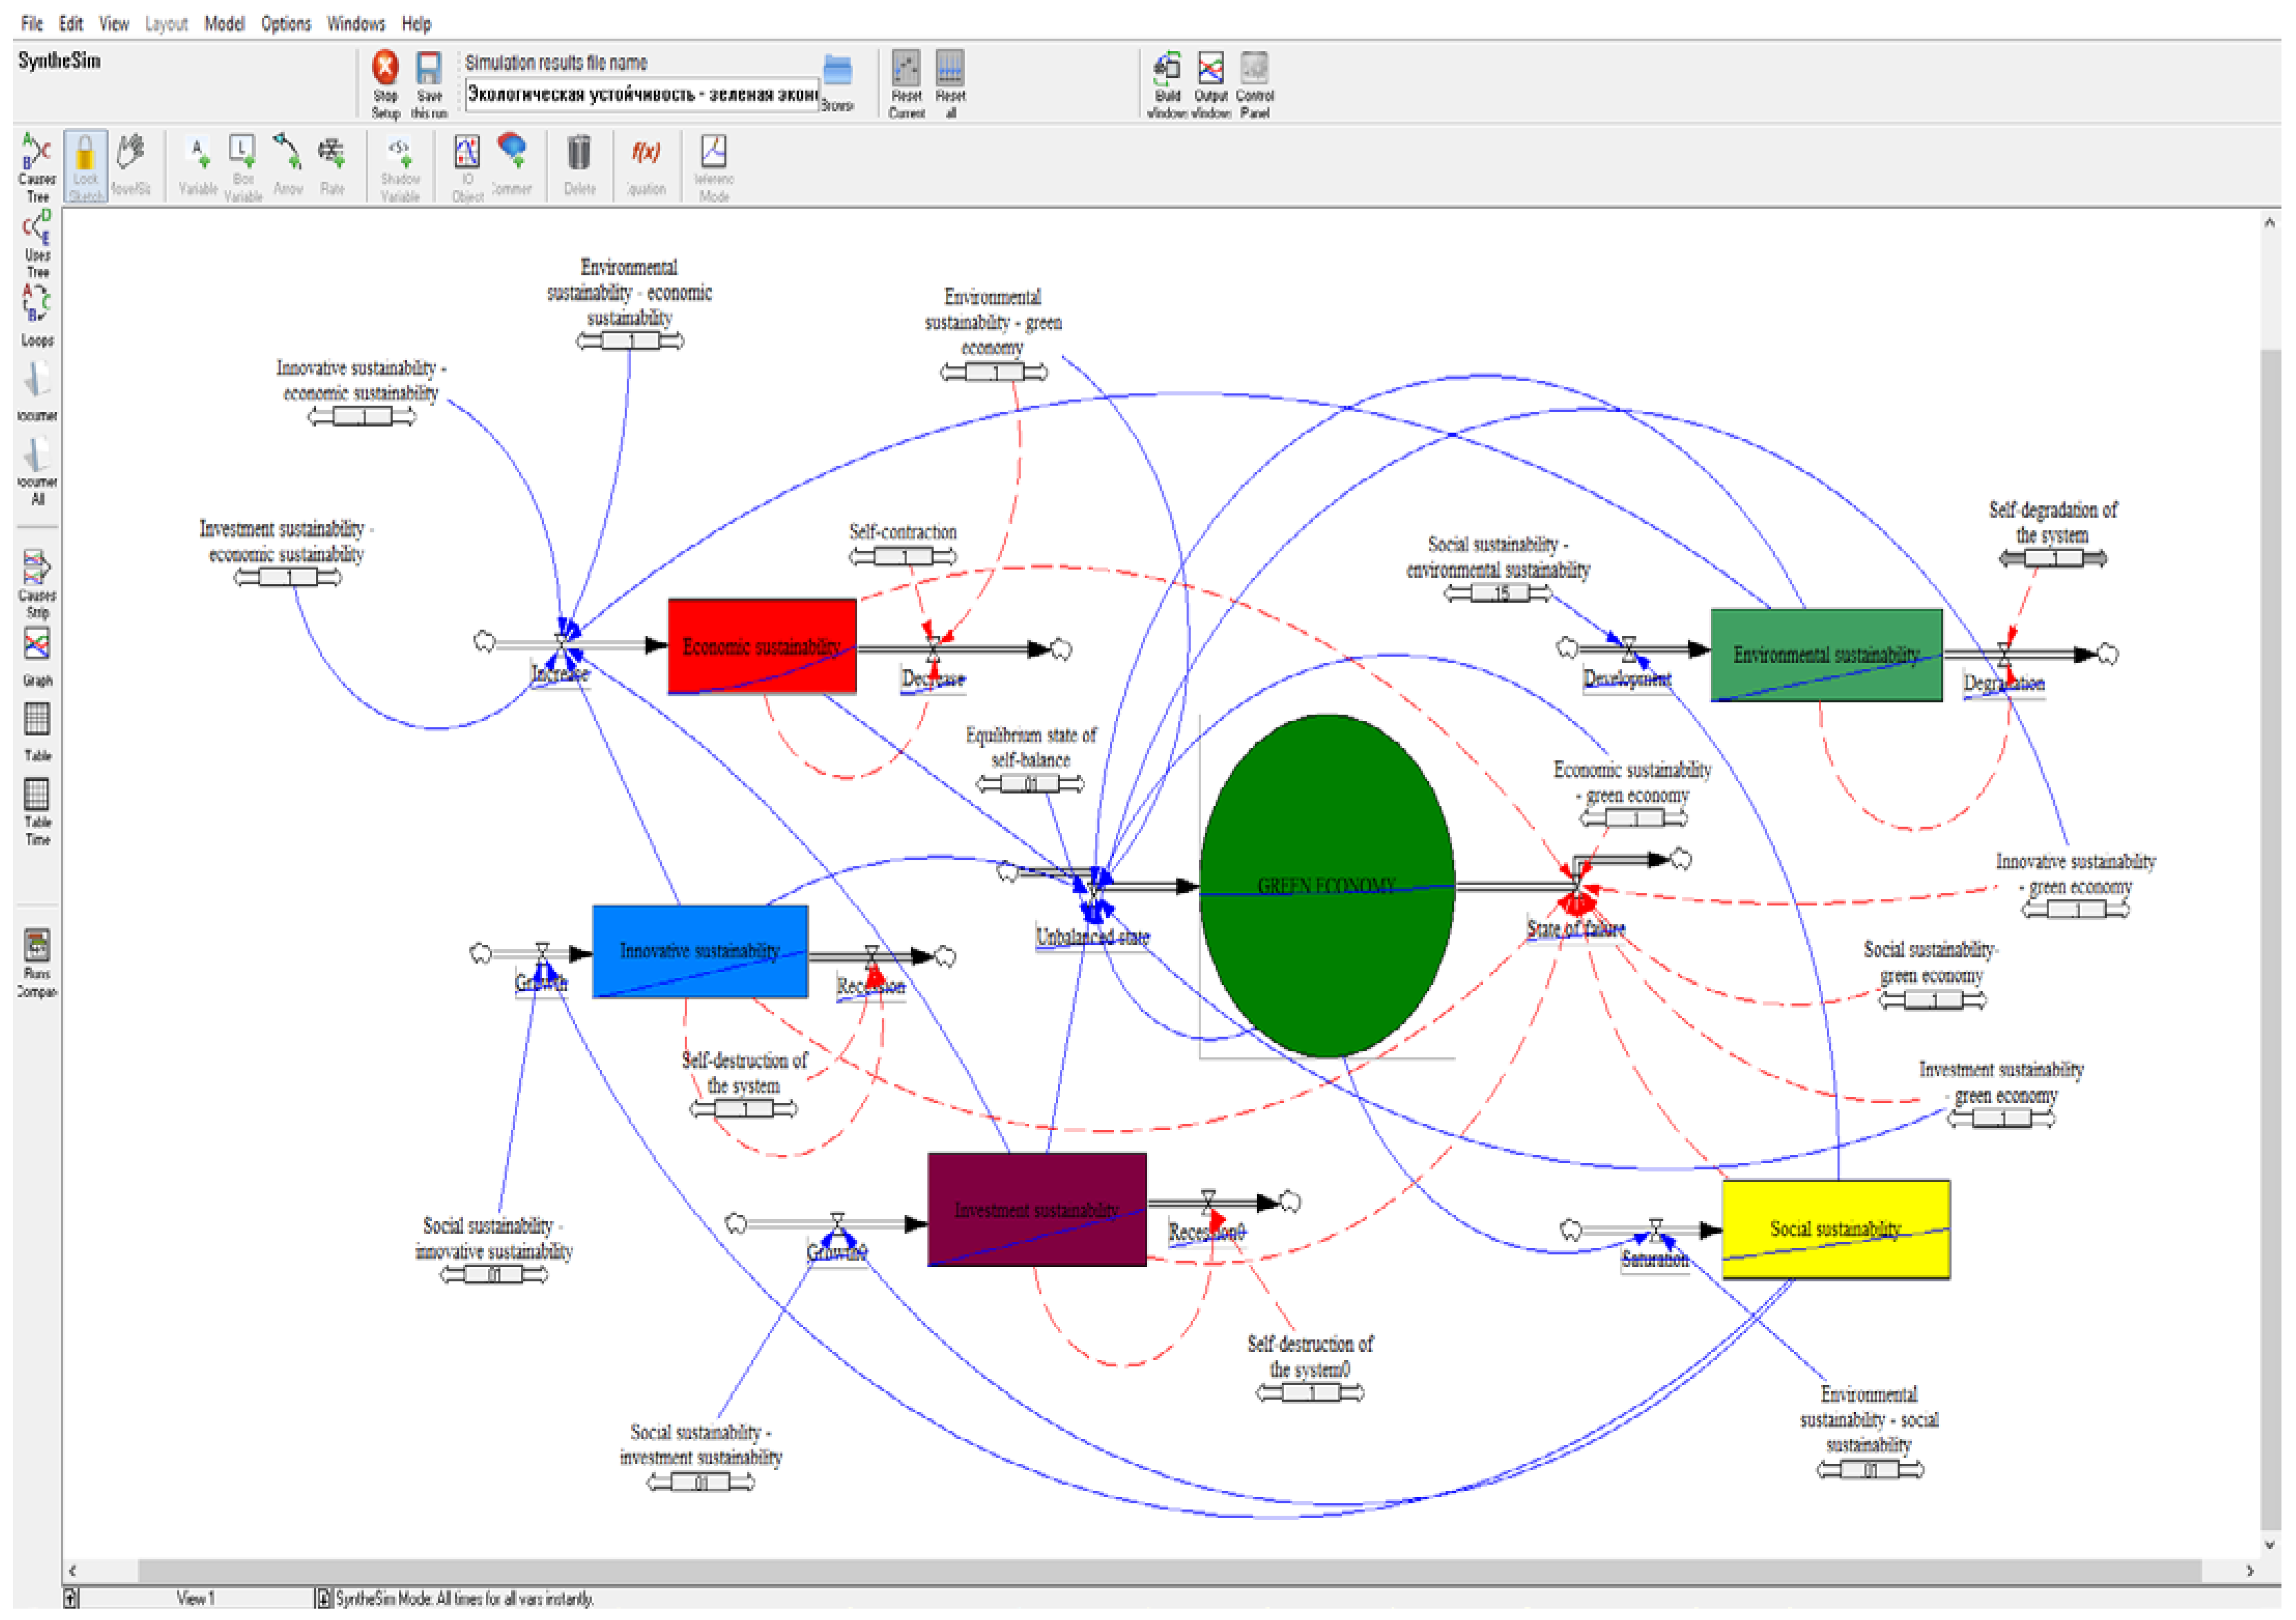
Proceeding from the proposed set of original concepts and the relationship between them, using the software capabilities of system cognitive modelling in the Vensim Personal Learning Edition (PLE), (Ventana Systems, Inc., Harvard, Cambridge, MA, USA), we will build a general cognitive map and a reduced-parametric cognitive map of the process of development of the “green” economy in the economic space of the region (Figure 1).
The cognitive map clearly demonstrates several levels of decomposition: the “green” economy is represented by several types of stability in various spheres which, in turn, are composed of positively and negatively influencing factors; there are 65 decomposition factors of the “green” economy.
Based on the previous research, a reduced-parametric cognitive map was created which includes the most significant decomposition factors, which allows viewing the existing relationships in more detail (Figure 2).
Values presented in Table 3 show the cause-effect relationships between the alleged “vertices” of the cognitive map.
The main goal of the developed model of the process of development of the “green” economy is to increase the efficiency of regional development and to find the way to achieve the stability necessary for the transition to a new paradigm. The proposed cognitive simulation model allows giving an approximate estimation of the control actions and emerging effects by individual elements of the regional system through the “greening” of development. The formation of a “green” model for the development of the region is a priority in the new economic reality of the country.
Based on the cognitive map, a system dynamic model of the “green” economy has been developed in the software package Vensim PLE, which allows for the creation of forecast scenarios of its development. In this model, there is no task of maximizing the regional development potential and optimizing it. This is due to the need to assess the management impact on any elements of the system in order to identify areas of priority stimulation and development of the “green” economy and stability in general (Figure 3).
3. Results
The presented dynamic model of the “green” economy allows us to promptly forecast the outcome of various scenarios for its development, considering a wide range of multifaceted factors and interactions at the level of the regional space. Within the capabilities of the developed model, an experiment was carried out suggesting several key scenarios reflecting multifaceted options for developing a “green” economy. Each of them presupposes intensification of the influence of one of the cognitive vertices of the model on the development curve of the “green” economy. The range of values for each simulated flow to be changed is in the range [−1; +1] It should be noted that the maximum assessment of the development of the “green” economy in the economic space is 1, which corresponds to estimates of the values of the resulting indicator of the development of the “green” economy in the economic space of the region [28]. Forecasting covers a time interval of 15 years. The main results of scenario modelling are presented in Figure 4, Figure 5, Figure 6, Figure 7 and Figure 8.
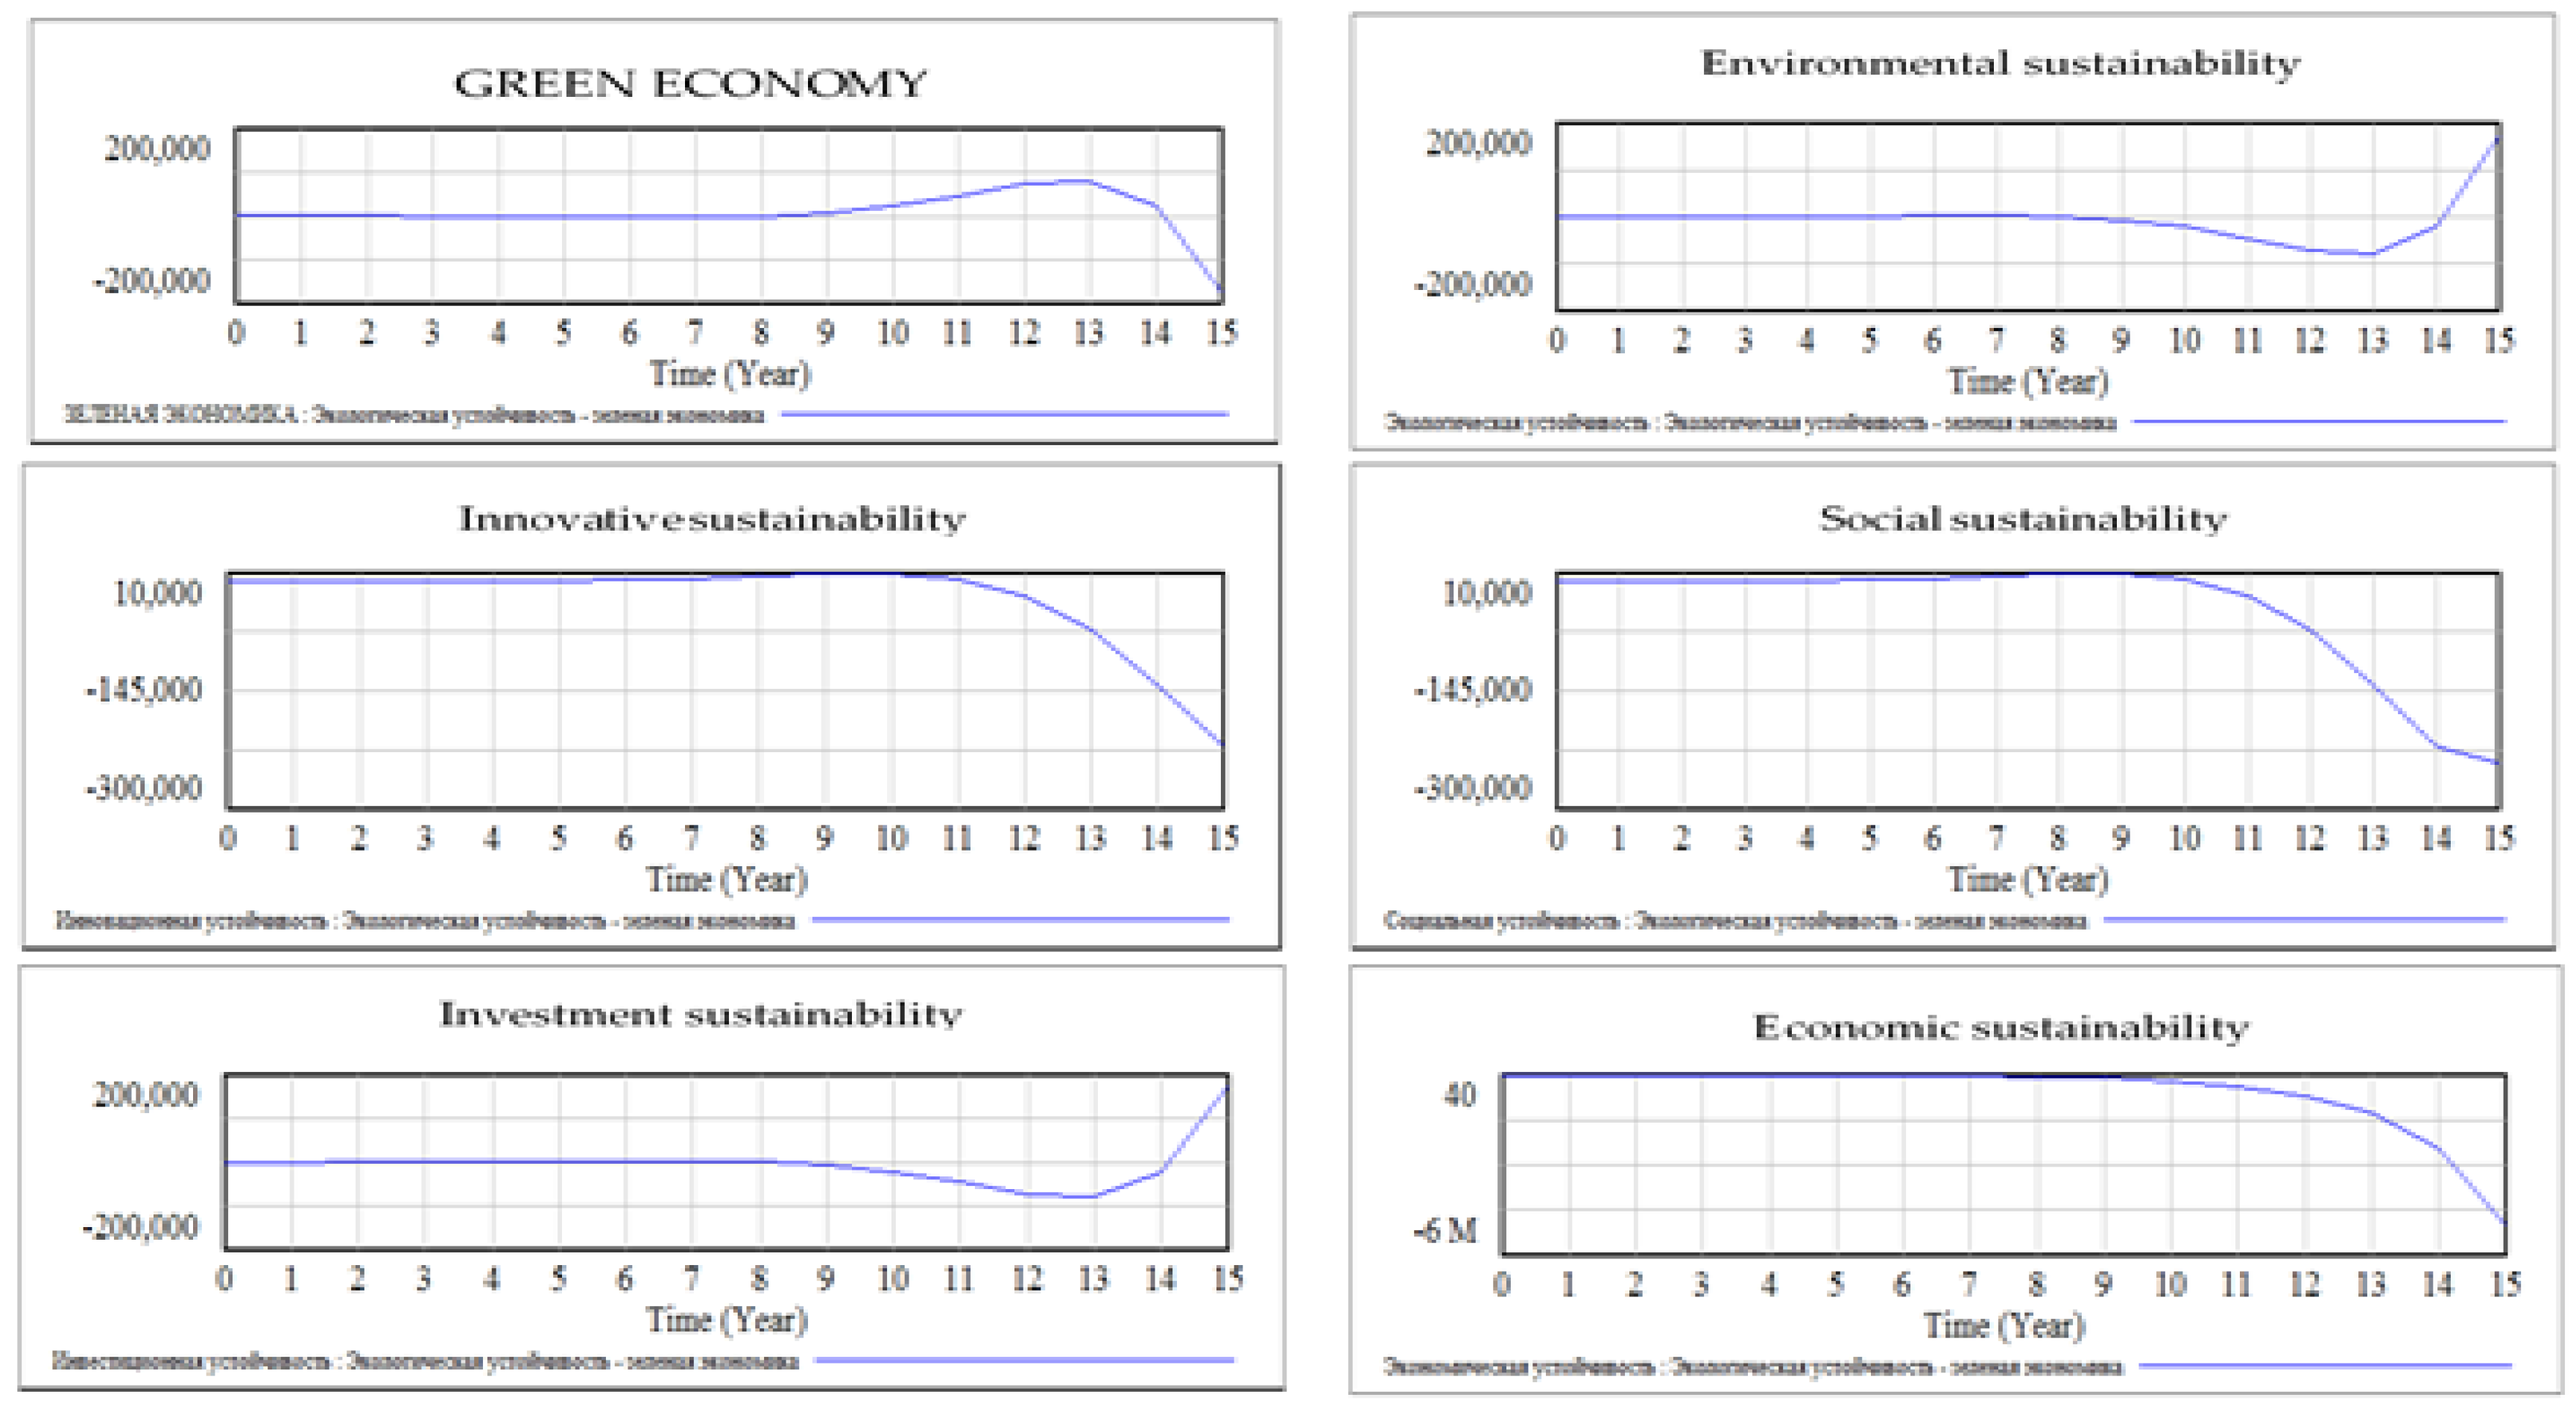
Scenario 1 demonstrates that, under the influence of maximizing social stability, there will be positive increments in all interrelations at first glance, but the synergetic effect of the influence on the development of the “green” economy is extremely negative. A special role is assigned to social sustainability, which is directly dependent and has the greatest impact on the formation of a green economy. This interdependence underlines the key goal of sustainable development—improving the life of the population. (Figure 4).
The paradigm of economic dominance that existed for a long time in society shows that even the growth of ecological stability in cooperation with economic one does not contribute to the effective development of the “green” economy, showing its artificial growth followed by a rapid decline (Figure 5).
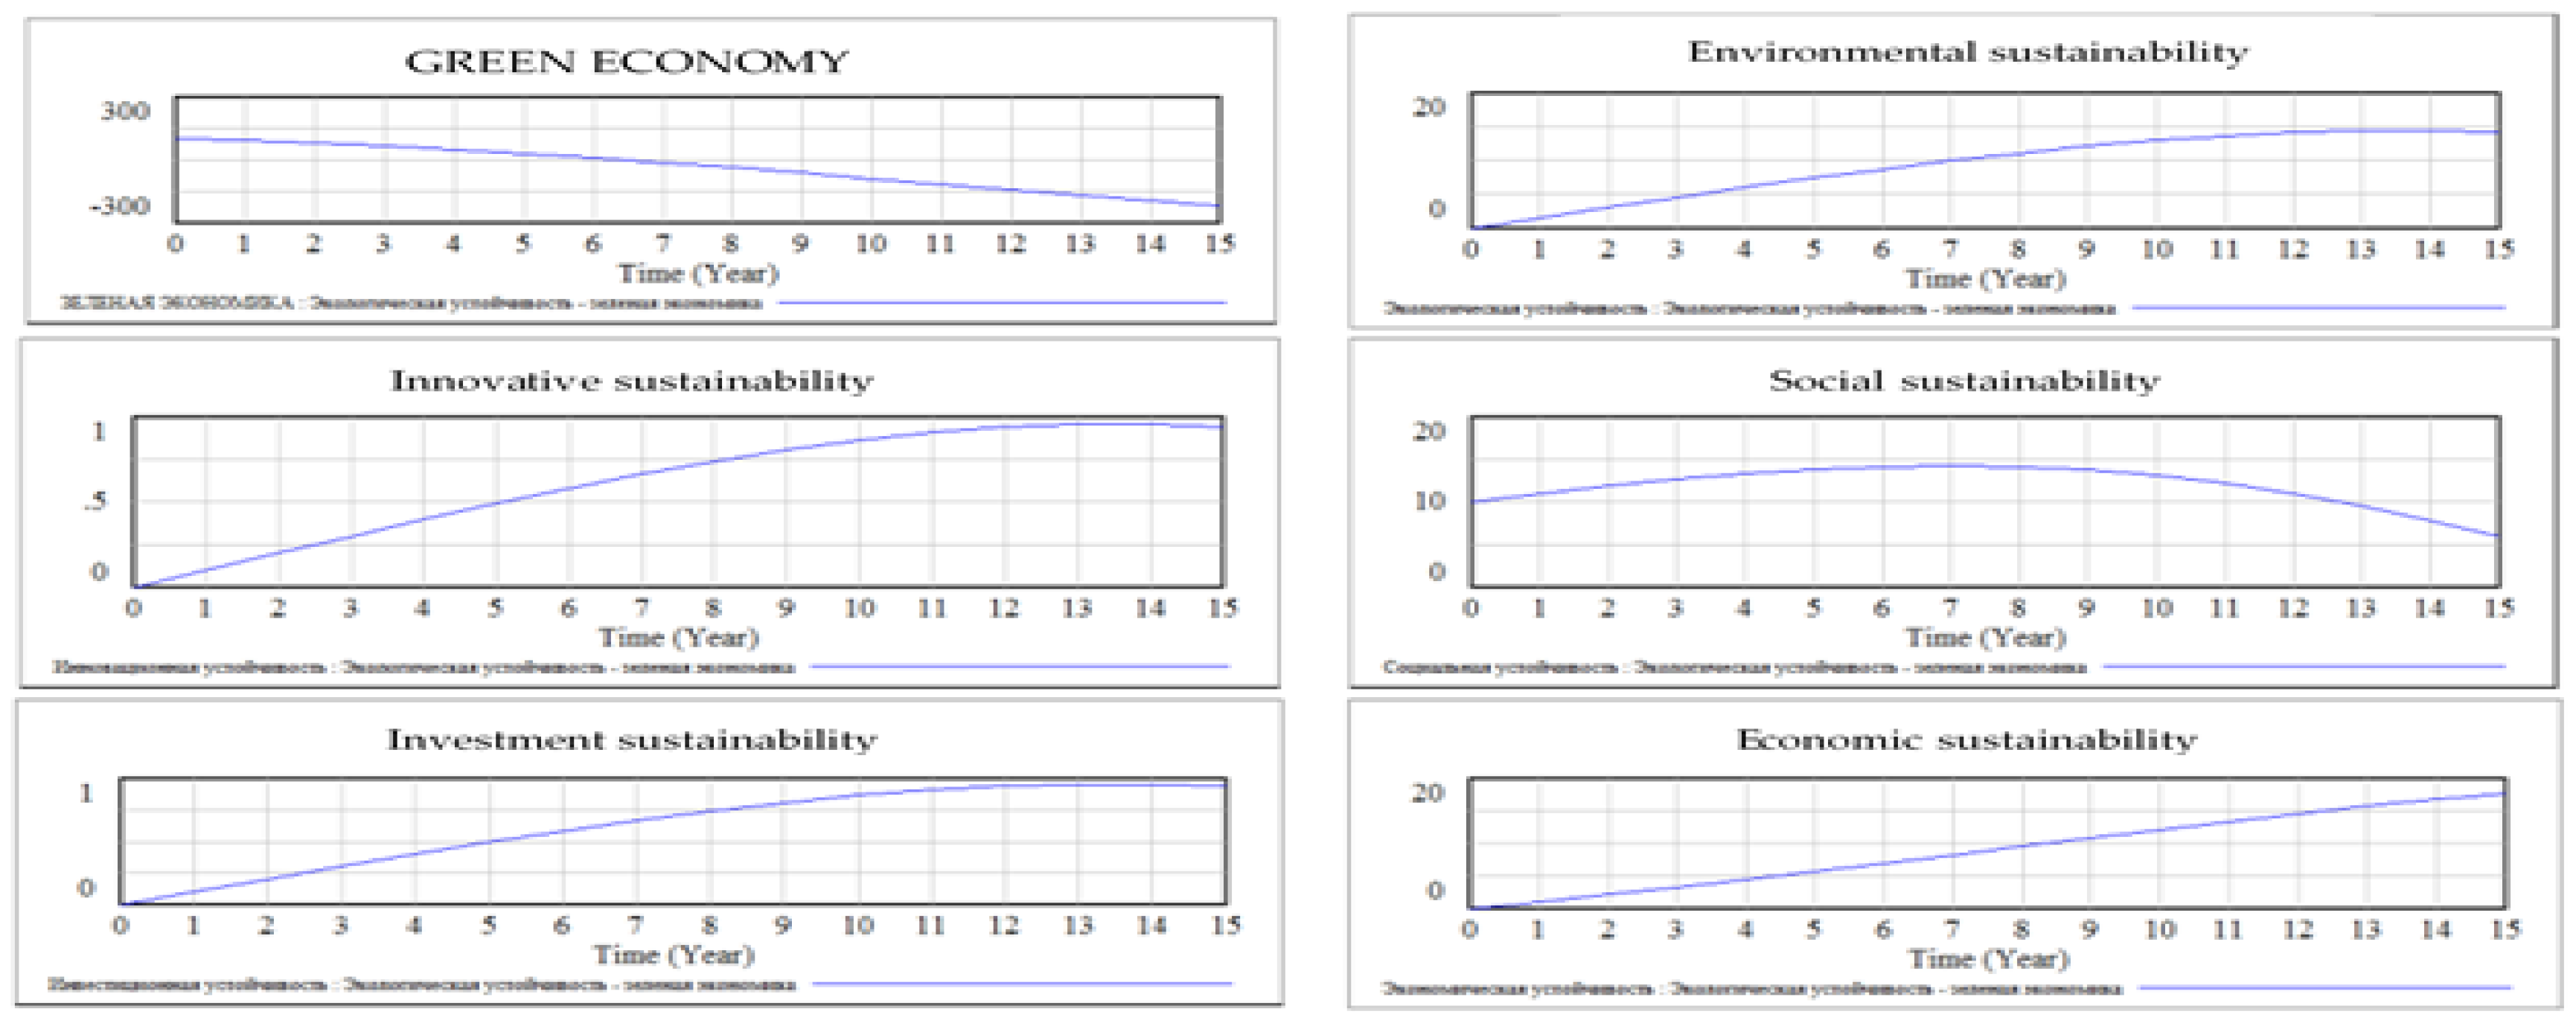
The priority of ecological stability confirms the long-known hypothesis of acquiring economic stability through environmental factors, i.e., this scenario confirms the very idea of a “green” economy, pointing out its effectiveness and attainability in the horizon of the next 15 years while observing the basic principles of “sustainable” development. The decline in innovation and investment stability is explained by the achievement of self-balance of these systems, which reduces the need for their financing. It is worth noting that the curve of the development of the “green” economy for a period of up to 10 years is in an unchanged state, which can be explained by the duration and complexity of the period of acquiring the state of stability; innovation and investment stabilities have minimal impact, emphasizing the conceptual trinity of sustainable development (Figure 6).
4. Discussion
Summary results of scenario modeling of the development of the “green” economy in the region’s space are presented in Table 4.
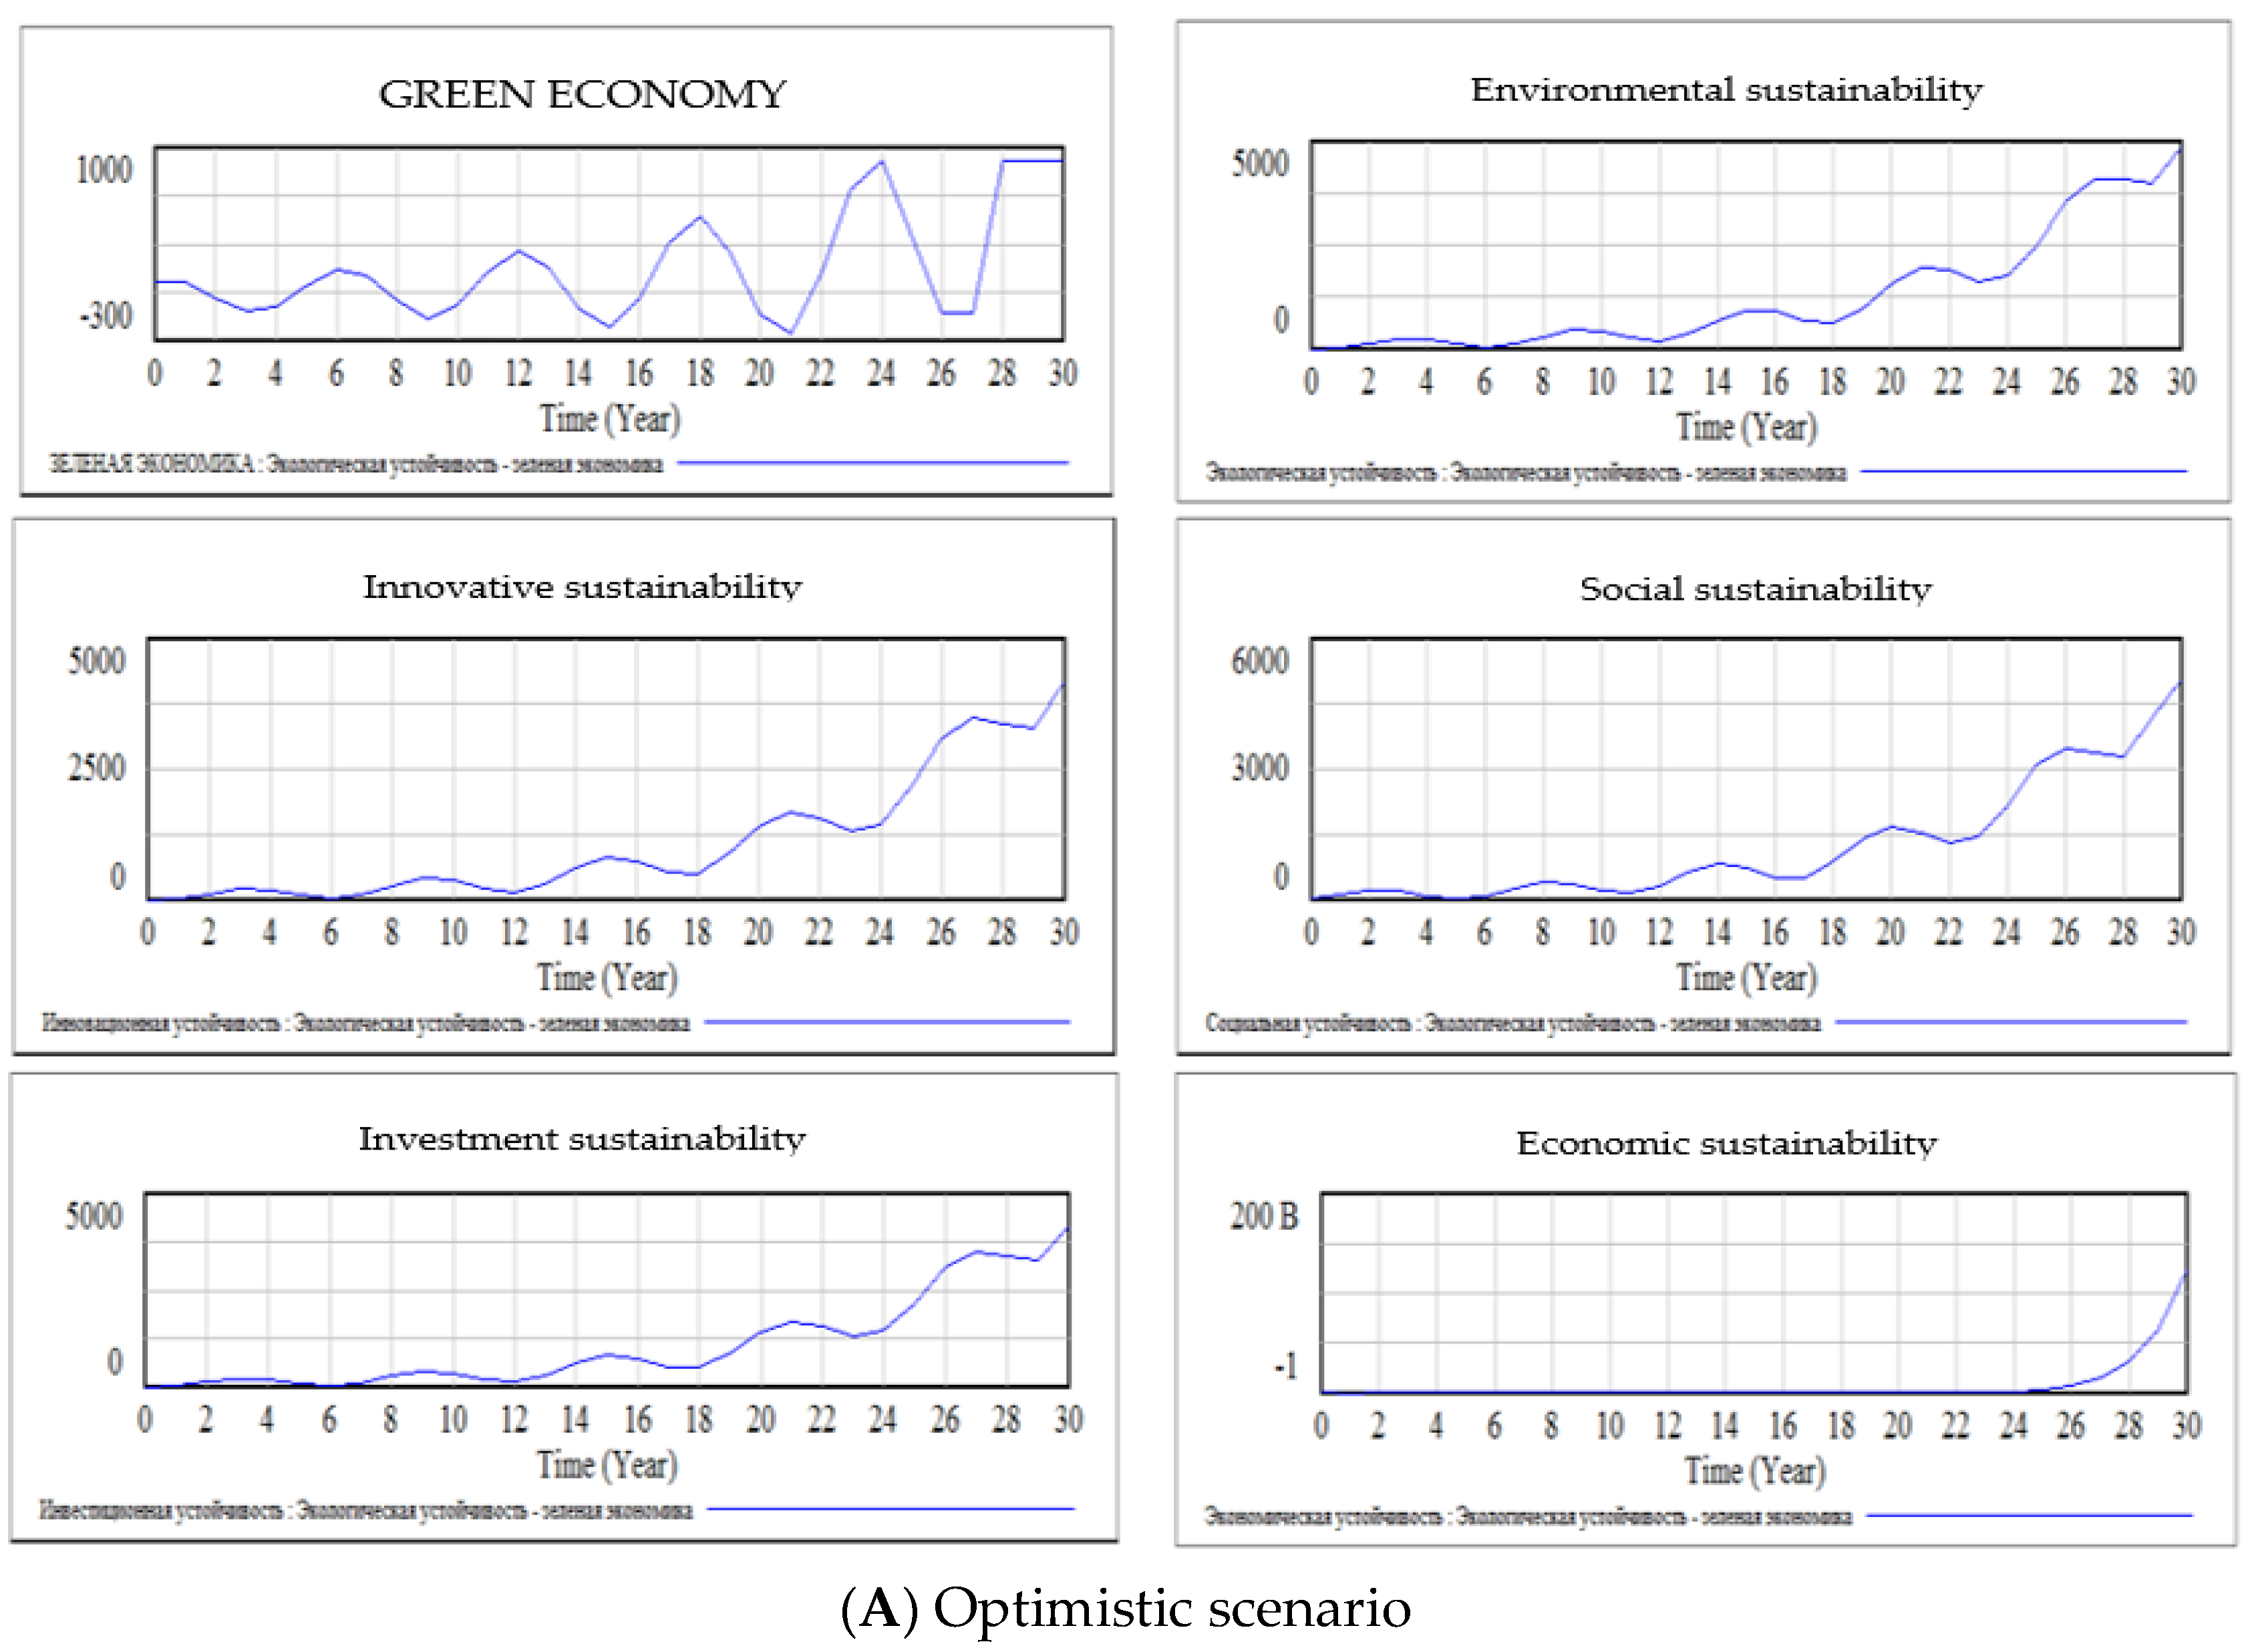
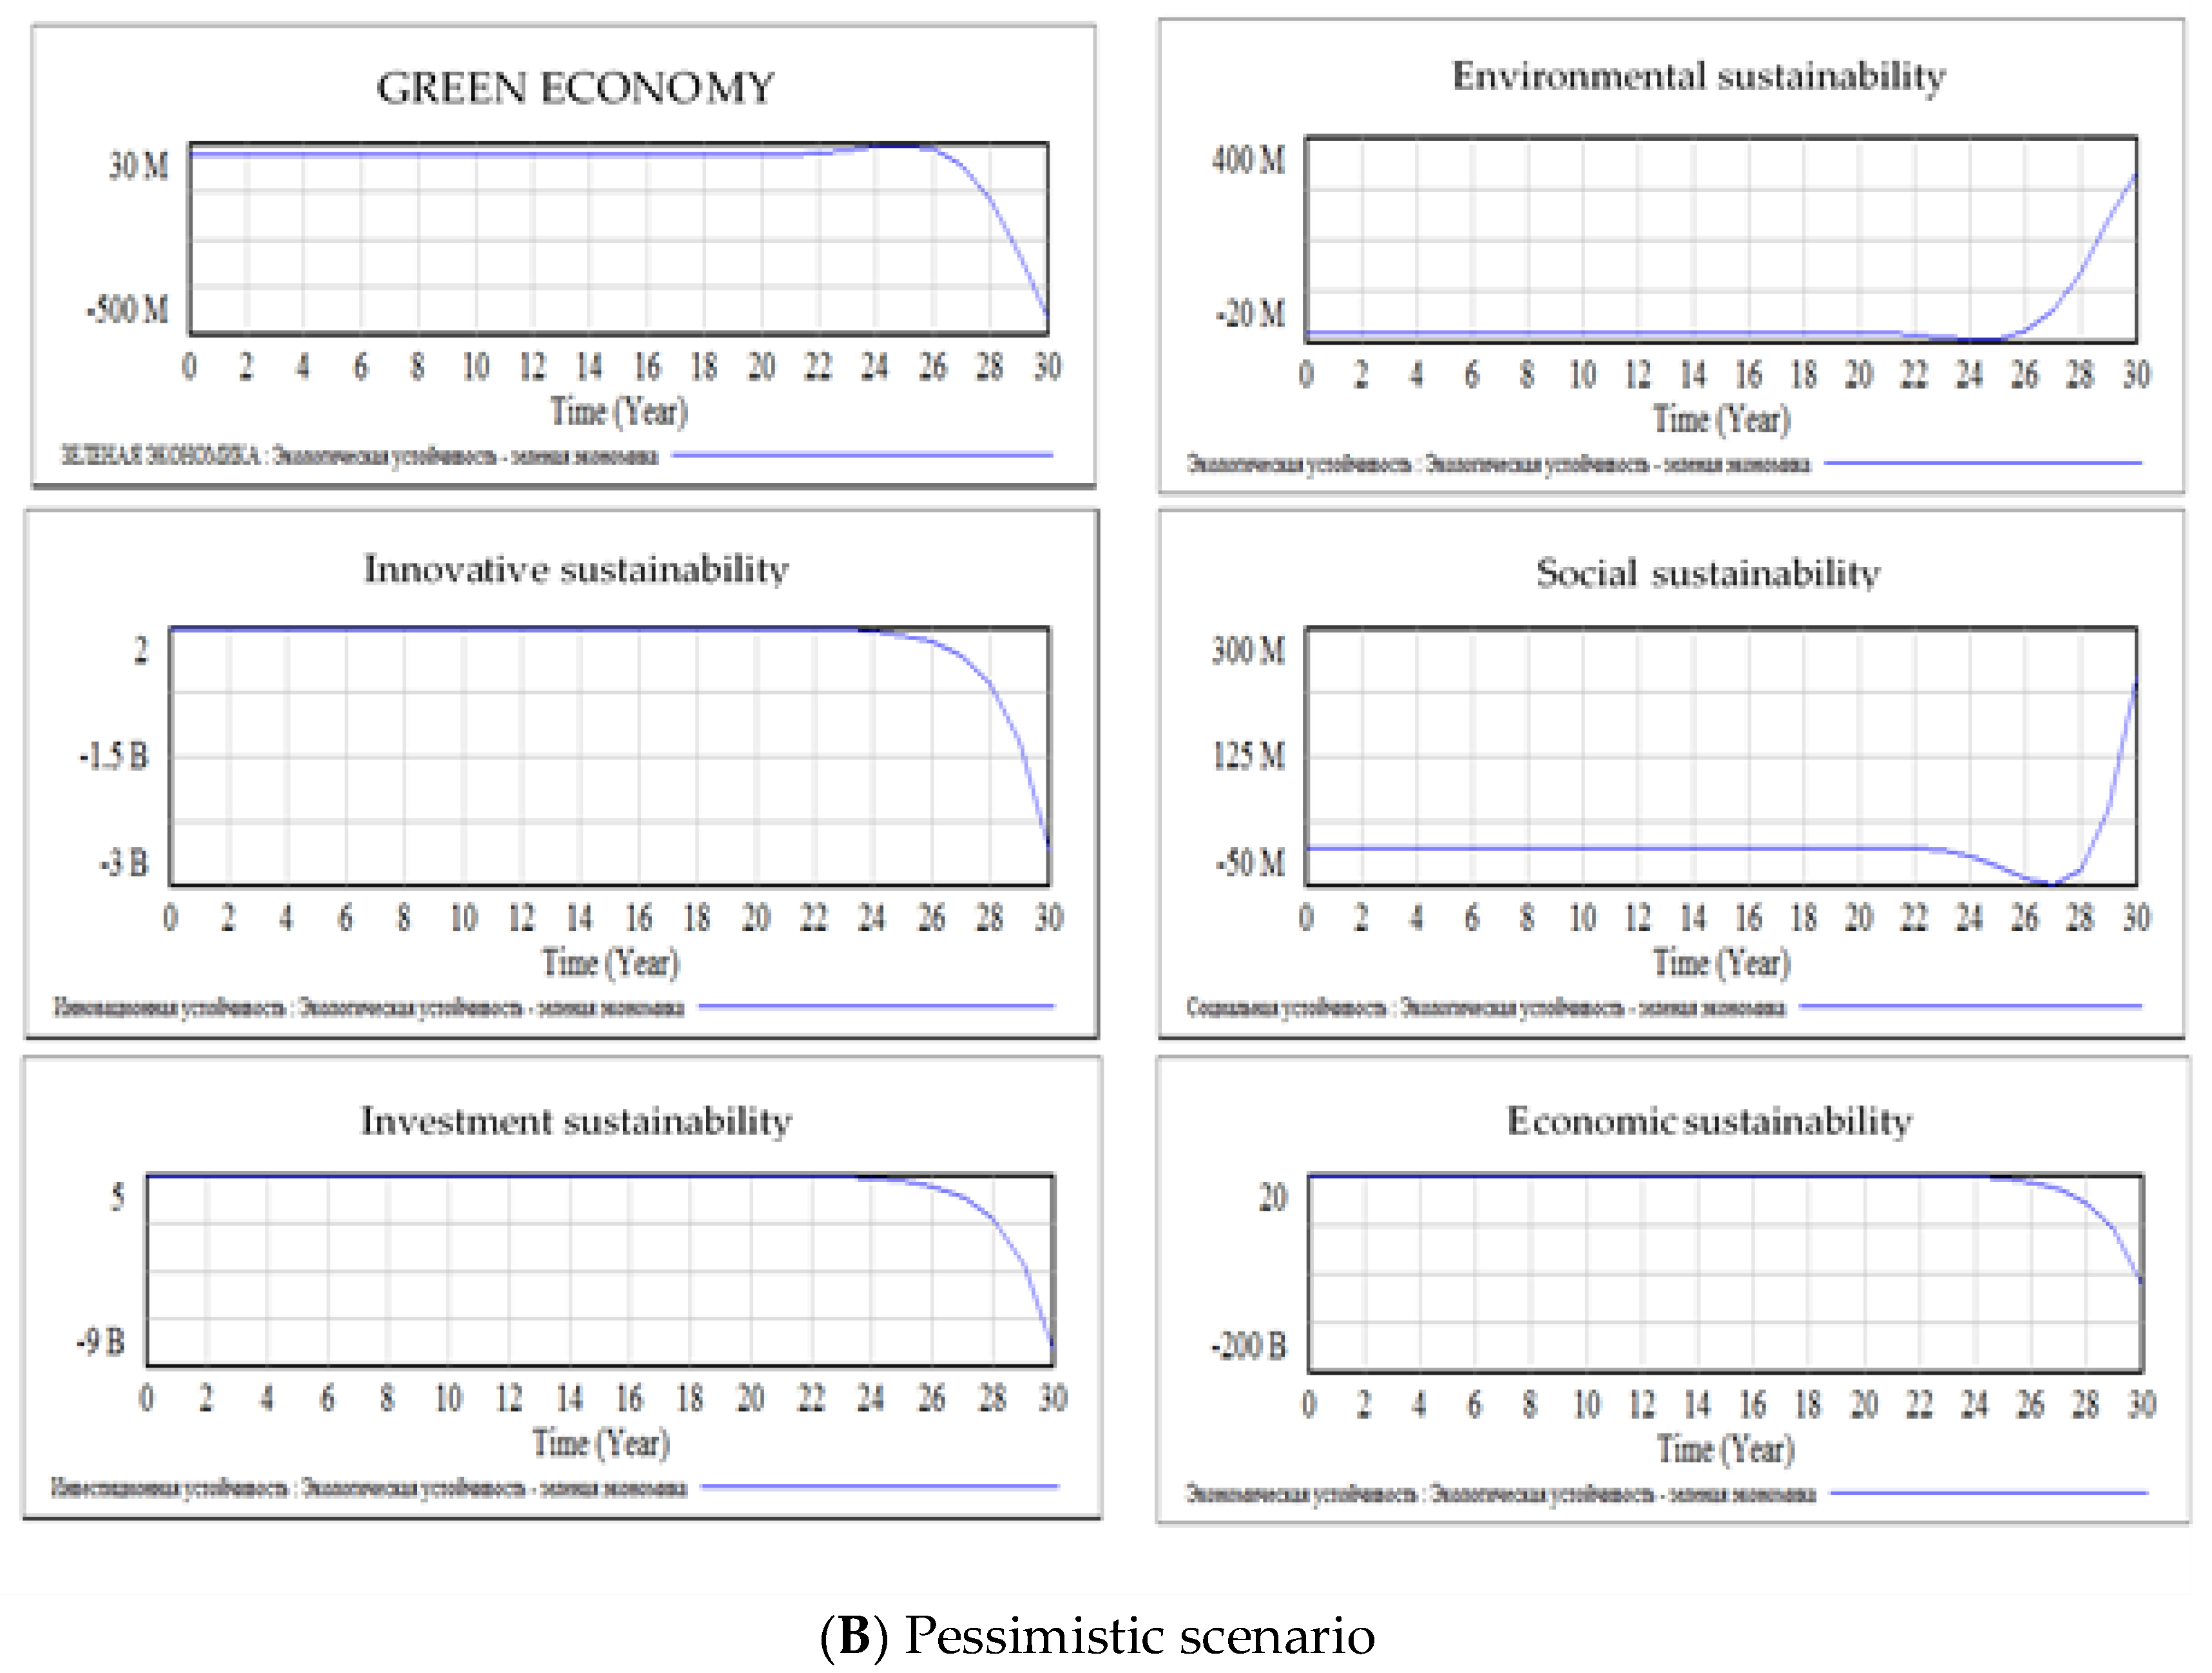
Modelling the process of developing a “green” economy as a basis for ensuring the stability of a regional space is based on optimistic and pessimistic scenarios that consider radically positive and negative interactions of the types of stability and the “green” economy (Figure 9).
It should be noted that the data presented in Figure 5, Figure 6, Figure 7, Figure 8 and Figure 9 are not final; the model enables obtaining more than 130 multivariate scenarios for the development of the “green” economy, analyzing the consequences of specific management influences. If necessary, the studied interrelations can be more detailed, and the main concepts of the objects under investigation finalized.
5. Conclusions
The results of the scenario modelling show that the development of the “green” economy leads to significant changes in the sphere of social stability. Insensitive to the current changes are the areas of innovation and investment sensitivity, which indicates the “narrow” places of management actions at the regional level and the necessary directions for activating the “growth points” of the “green” economy.
The most promising possibilities for further development of this approach in the study include:
- -
- compilation of annual ratings of regions on the level of development of the “green” economy;
- -
- creation of an analytical rating of economic areas within a regional entity;
- -
- improving the processing of modelling results and increasing their sensitivity;
- -
- upgrading the GUI of the model.
The composition of cognitive modelling and system dynamics allows creating an effective analytical and forecasting tool for studying the complex phenomenon—the development of the “green” economy in the economic space of the region, which includes a vast number of interrelations of various orders. This symbiosis helps to determine the role and effectiveness of managerial decisions in various subsystems of the region (economic, ecological, social, innovation, investment), provides a visual demonstration of the adequacy of decisions taken from the position of developing a “green” economy.
It should be noted that in the future, the dynamic model of the development of the “green” economy can include a greater number of factors that detail the necessary interrelations. The proposed toolkit is universal and can be adapted to the sectoral specifics of the studied region, as well as to the factors and conditions of its development.
Author Contributions
The authors contributed equally to this work.
Acknowledgments
The research was carried out with the financial support of the Russian Foundation for Fundamental Research within the framework of the scientific project No. 16-36-00218 “Theory and methodology for assessing the development of the ‘green economy’ in the context of the theory of economic space.”
Conflicts of Interest
The authors declare no conflicts of interest.
References
- Crandall, R.E.; Crandall, W.R.; Chen, C.C. Principles of Supply Chain Management, 2nd ed.; CRC Press: Boca Raton, FL, USA, 2015; 704p, ISBN 9781482212051. [Google Scholar]
- The United Nations. Available online: http://www.un.org/en/index.html (accessed on 15 August 2017).
- The European Environment Agency. Available online: https://www.eea.europa.eu/ (accessed on 15 August 2017).
- The World Bank. Available online: http://www.worldbank.org/ (accessed on 15 August 2017).
- The United Nations Development Programme. Available online: http://hdr.undp.org/en/content/human-development-index-hdi (accessed on 15 August 2017).
- The Organisation for Economic Co-Operation and Development. Available online: http://www.oecd.org/ (accessed on 15 August 2017).
- The Global Footprint Network. Available online: https://www.footprintnetwork.org/our-work/ecological-footprint/ (accessed on 15 August 2017).
- The United Nations Commission on Sustainable Development. Available online: https://sustainabledevelopment.un.org/csd.html (accessed on 15 August 2017).
- The Socioeconomic Data and Applications Center. Available online: http://sedac.ciesin.columbia.edu/data/collection/esi/ (accessed on 15 August 2017).
- Van de Kerk, G. A Comprehensive Index for a Sustainable Society: The SSI—The Sustainable Society Index. Available online: http://citeseerx.ist.psu.edu/viewdoc/download?doi=10.1.1.536.9996&rep=rep1&type=pdf (accessed on 15 August 2017).
- The Environmental Performance Index. Available online: https://epi.envirocenter.yale.edu/ (accessed on 15 August 2017).
- The Eight Millennium Development Goals. Available online: http://www.un.org/millenniumgoals/ (accessed on 15 August 2017).
- Sustainable Development Goals. Available online: http://www.un.org/sustainabledevelopment/sustainable-development-goals/ (accessed on 15 August 2017).
- Martyshina, T.V. Providing Stability of Development of the Region in the Conditions of an Astable Environment. Ph.D. Thesis, Adyghe State University, Maykop, Russia, 2014. [Google Scholar]
- Costanza, R.; Cumberland, J.; Daly, H.; Goodland, R.; Norgaard, R. An Introduction to Ecological Economics; CRC Press LLC: Boca Raton, FL, USA, 1997; p. 275. ISBN 1-884015-72-7. [Google Scholar]
- Costanza, R.; Cumberland, J.H.; Daly, H.; Goodland, R.; Norgaard, R.B. An Introduction to Ecological Economics; St. Lucie Press: Boca Raton, FL, USA; International Society for Ecological Economics: Boston, MA, USA, 2014; p. 356. ISBN 9781566706841. [Google Scholar]
- Edwards, A.E.; Orr, D.W. The Stability Revolution: Portrait of a Paradigm Shift; New Society Publishers: Gabriola, BC, Canada, 2005; p. 206. ISBN 9780865715318. [Google Scholar]
- Surkova, S.A. Ecological and Economic Aspects of Scientific and Technical Policy. Available online: http://www.uran.ru/reports/2005/3dic_2004/section2/s2p146.htm (accessed on 21 August 2017).
- Čábelková, I.; Kiseleva, L.; Strielkowski, W. Study of influence of socio-demographic characteristics of workers on job satisfaction (the case of the Czech Republic). Hum. Ecol. 2015, 4, 39–46. [Google Scholar]
- Kiseleva, L.S.; Strielkowski, W. Economic analysis of happiness, wellbeing and health: A Tyumen region case study. Actual Probl. Econ. 2014, 11, 245–254. [Google Scholar]
- Kolmakov, V.V.; Polyakova, A.G.; Shalaev, V.S. An analysis of the impact of venture capital investment on economic growth and innovation: Evidence from the USA and Russia. Econ. Ann. 2015, LX, 7–37. [Google Scholar] [CrossRef]
- Bobylev, S.N.; Minakov, V.S.; Solovieva, S.V.; Tretyakov, V.V. Ecological and Economic Index of Russian Regions. 2013. Available online: https://new.wwf.ru/upload/iblock/dc8/index.pdf (accessed on 21 August 2017).
- Gurman, V.I. System analysis of sustainable development strategies. Bull. Buryat State Univ. 2012, 1, 47–53. [Google Scholar]
- Dorgushaova, A.K. The economic framework of the territory of innovation-oriented development: A structural model, institutes and mechanisms of formation. Ph.D. Thesis, Maykop State Technological University, Maykop, Russia, 2016. [Google Scholar]
- Ginis, L.A. The Origins of Modern Cognitive Modeling. Available online: https://cyberleninka.ru/article/n/istoki-sovremennogo-kognitivnogo-modelirovaniya (accessed on 21 August 2017).
- Rudneva, L.N.; Pchelintseva, I.G.; Gureva, M.A. General Tendencies in Modern Economy: Sustainable Development and Green Economy. J. Environ. Manag. Tour. Q. 2016, 7, 231–233. [Google Scholar]
- Rudneva, L.N.; Pchelintseva, I.G.; Gureva, M.A. The Indicative System of Assessing the Level of Ecologization in the Context of the Region’s Sustainable Development. Int. J. Econ. Financ. Issues 2016, 6 (Suppl. S1), 227–232. [Google Scholar]
- Gureva, M.A.; Simarova, I.S. Methodological approach to assessing the development of the "green" economy in the economic space. Sci. Bus. Ways Dev. 2016, 10, 90–103. [Google Scholar]
- Unified Interagency Information and Statistical System. Available online: https://fedstat.ru/ (accessed on 21 August 2017).
Figure 1.
A general extended cognitive map of the development of the “green” economy in the economic space of the region (implemented in the software package Vensim PLE).
Figure 1.
A general extended cognitive map of the development of the “green” economy in the economic space of the region (implemented in the software package Vensim PLE).
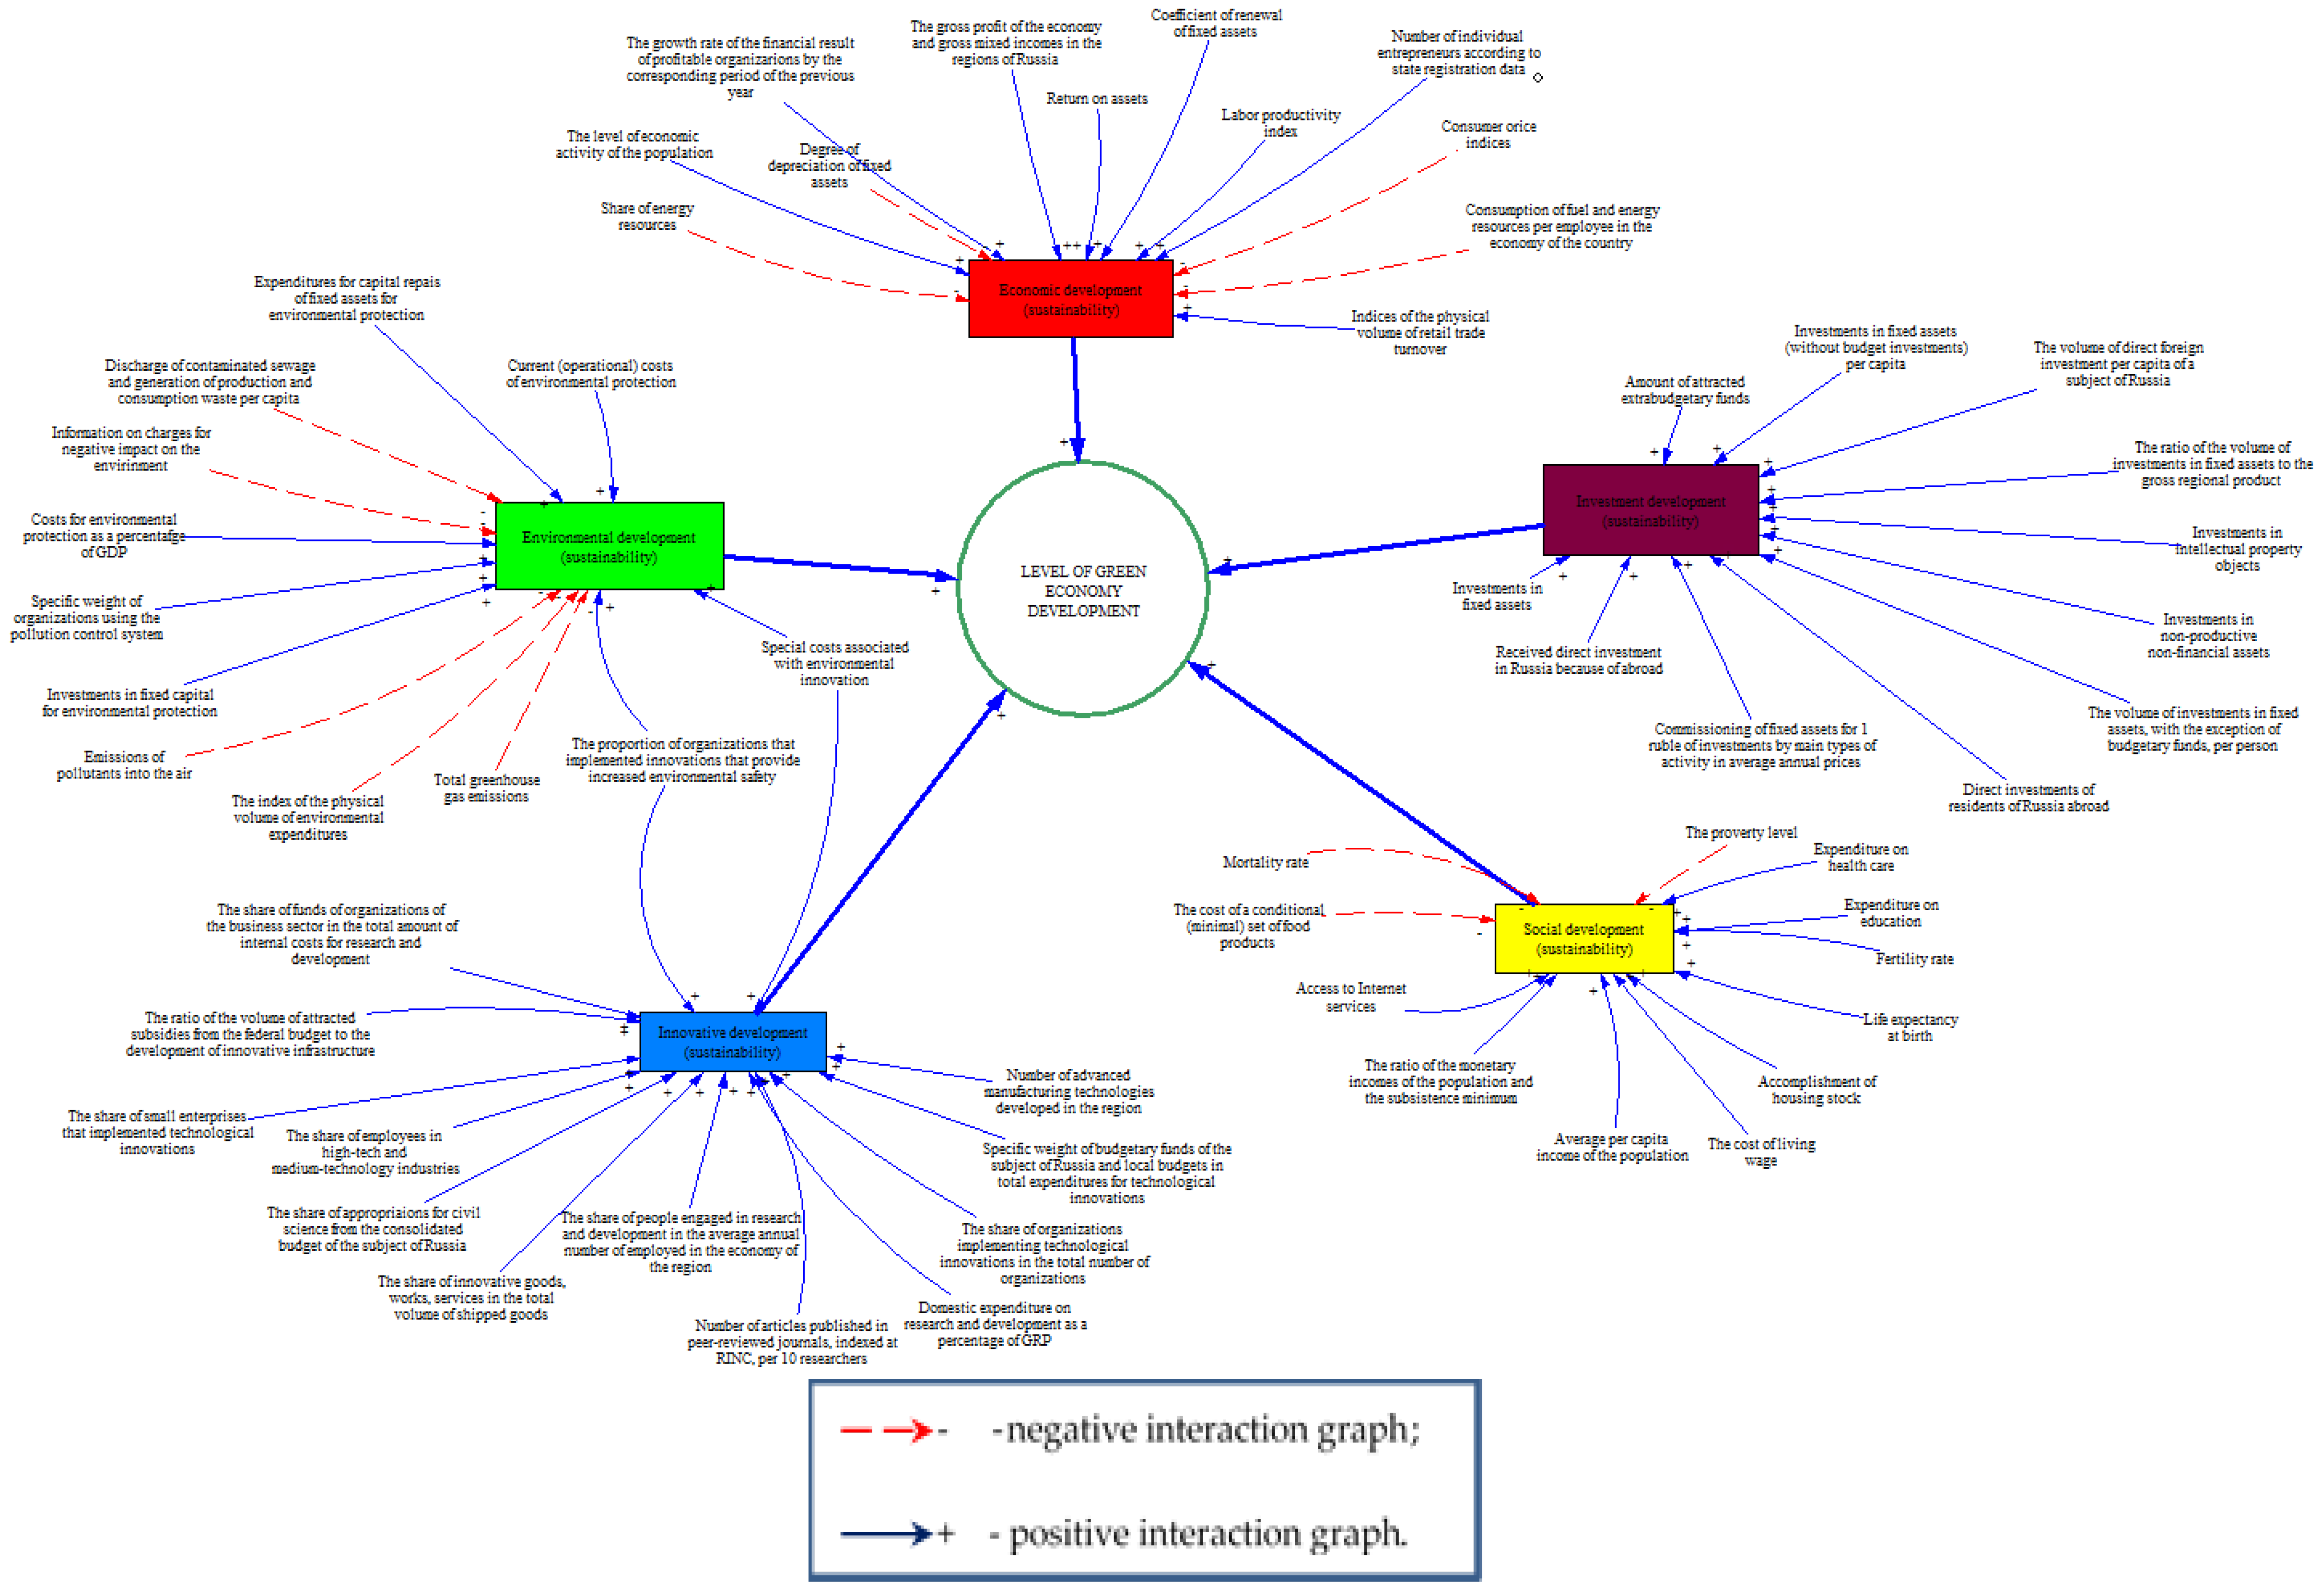
Figure 2.
A reduced-parametric cognitive map of the development of the “green” economy in the economic space of the region (implemented in the software package Vensim PLE).
Figure 2.
A reduced-parametric cognitive map of the development of the “green” economy in the economic space of the region (implemented in the software package Vensim PLE).
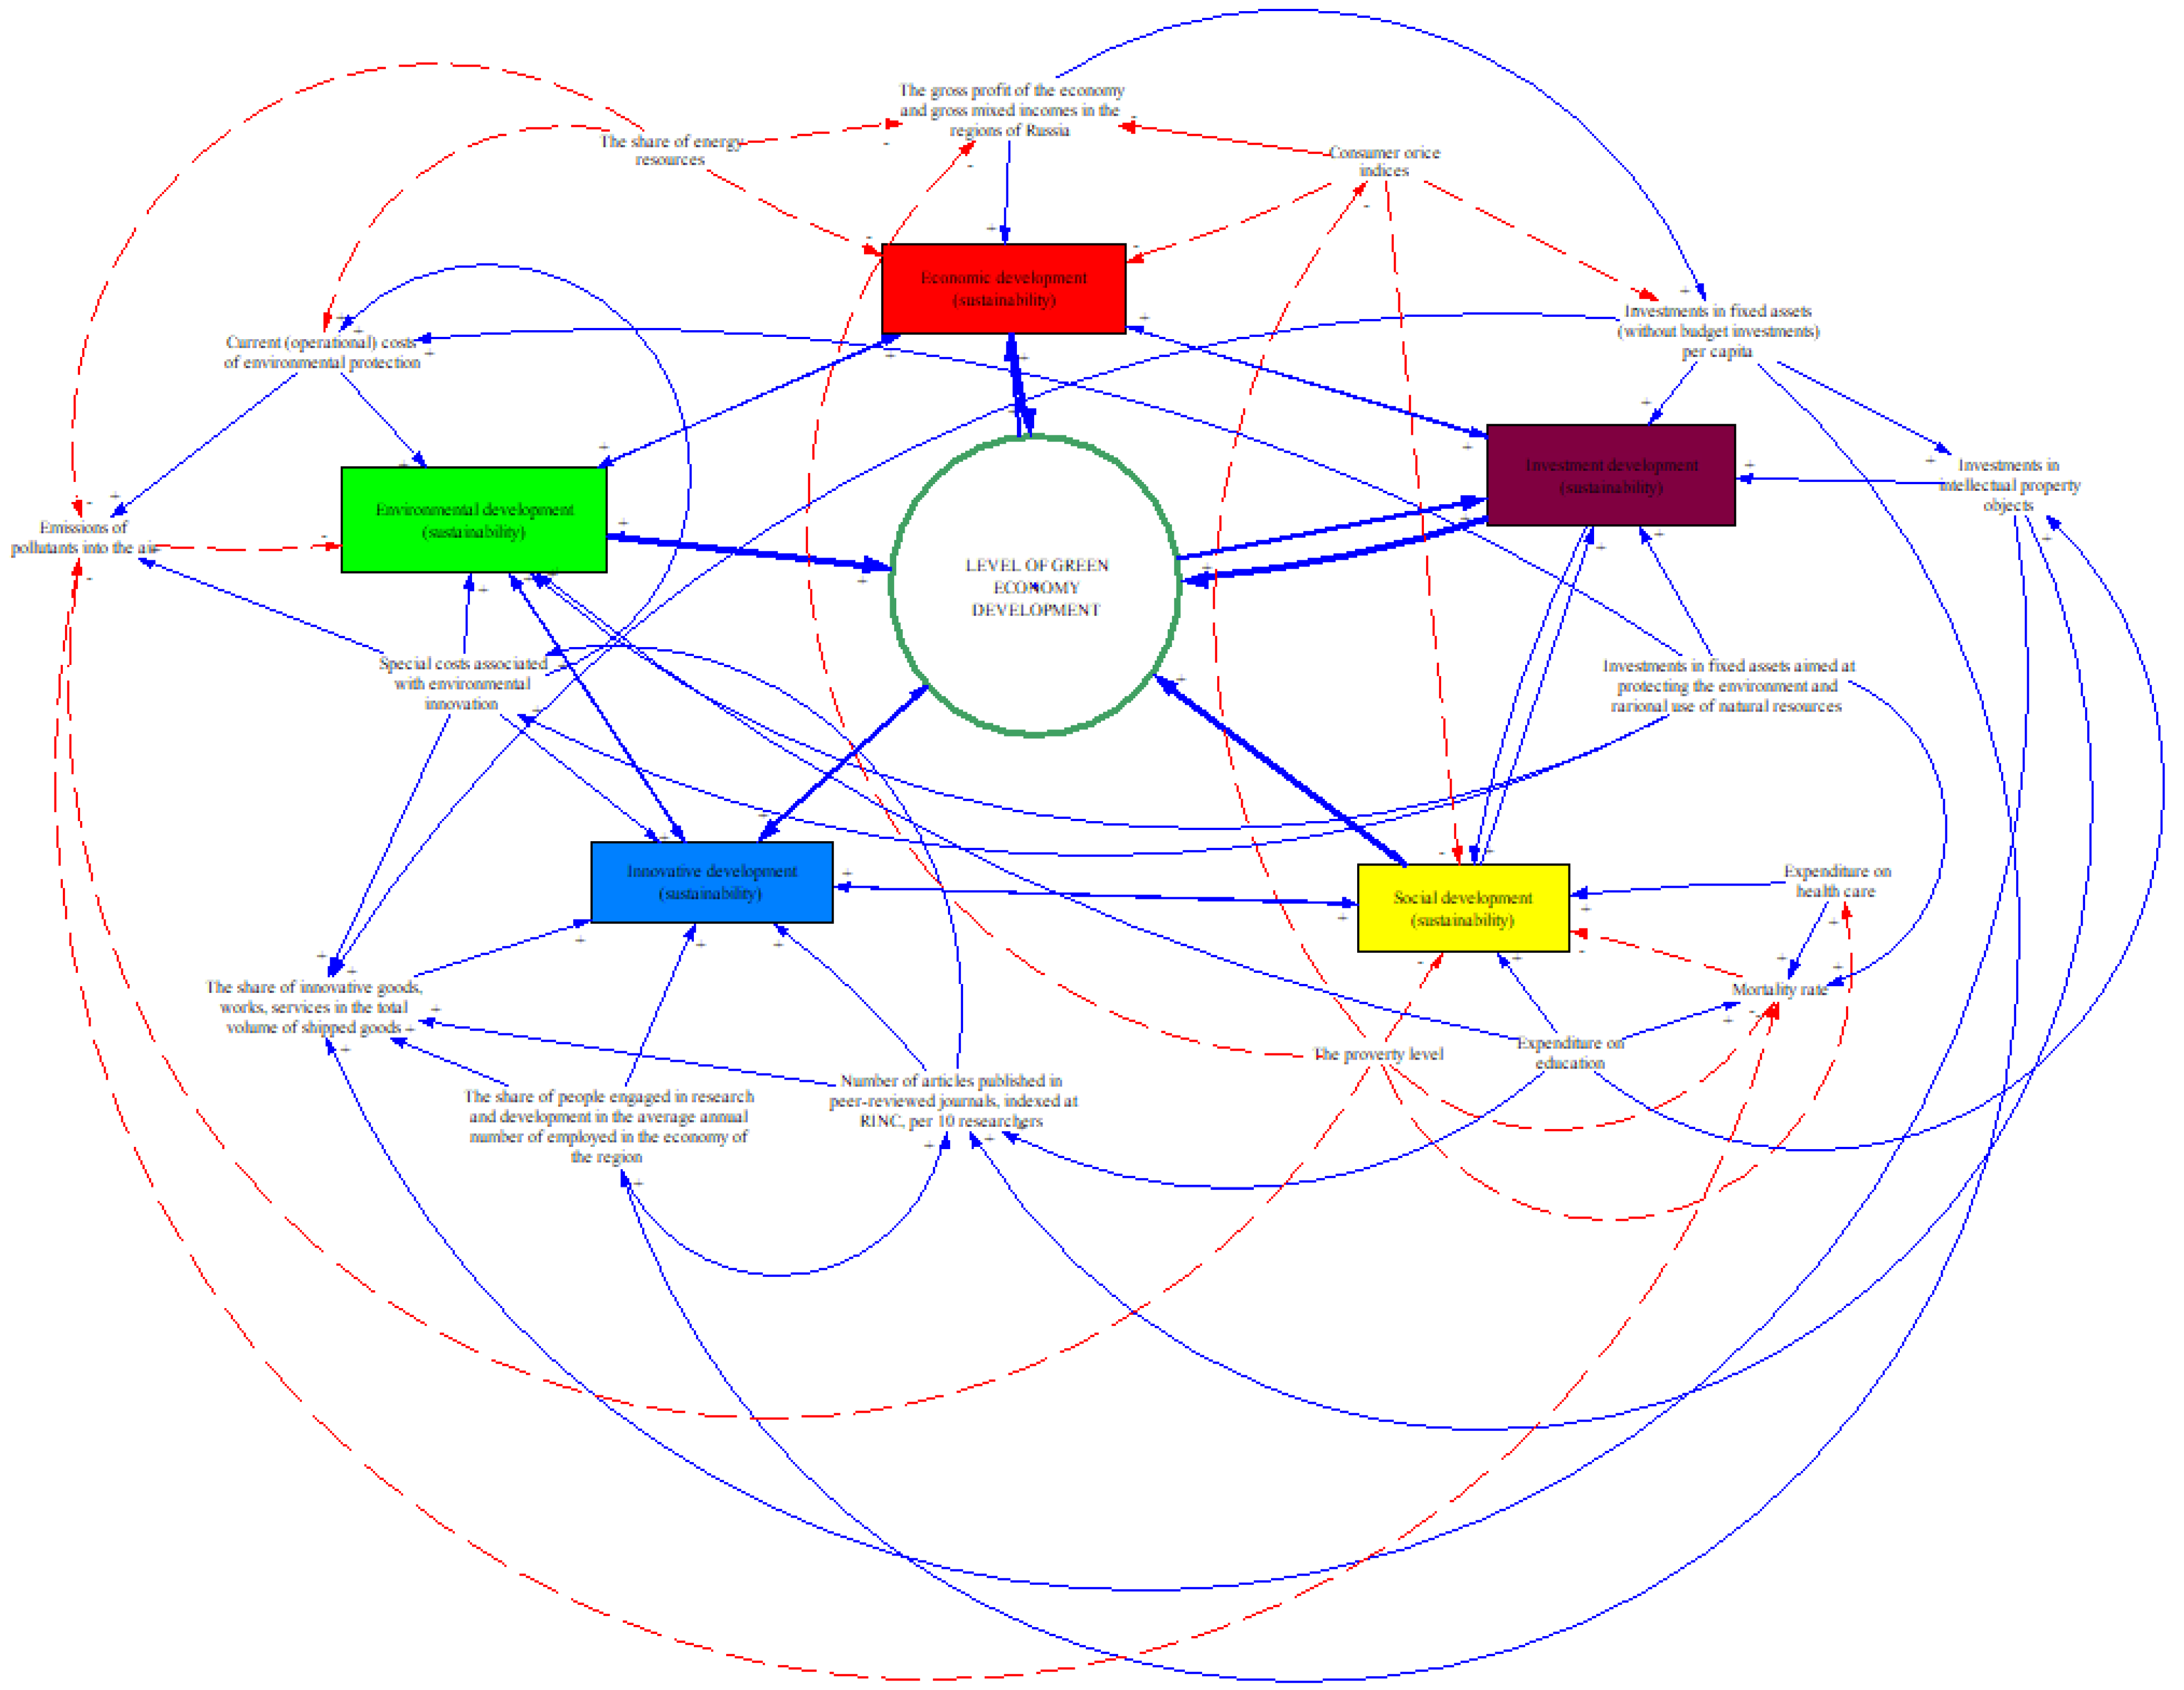
Figure 3.
A system dynamic model of the development of the “green” economy in the economic space of the region (implemented in the software package Vensim PLE).
Figure 3.
A system dynamic model of the development of the “green” economy in the economic space of the region (implemented in the software package Vensim PLE).

Figure 4.
Scenario 1. Change of the “green” economy with the strengthening of the integration interaction of social stability (implemented in the software package Vensim PLE).
Figure 4.
Scenario 1. Change of the “green” economy with the strengthening of the integration interaction of social stability (implemented in the software package Vensim PLE).
Figure 5.
Scenario 2. Change of the “green” economy with the strengthening of the integration interaction of economic stability (the software package Vensim PLE).
Figure 5.
Scenario 2. Change of the “green” economy with the strengthening of the integration interaction of economic stability (the software package Vensim PLE).
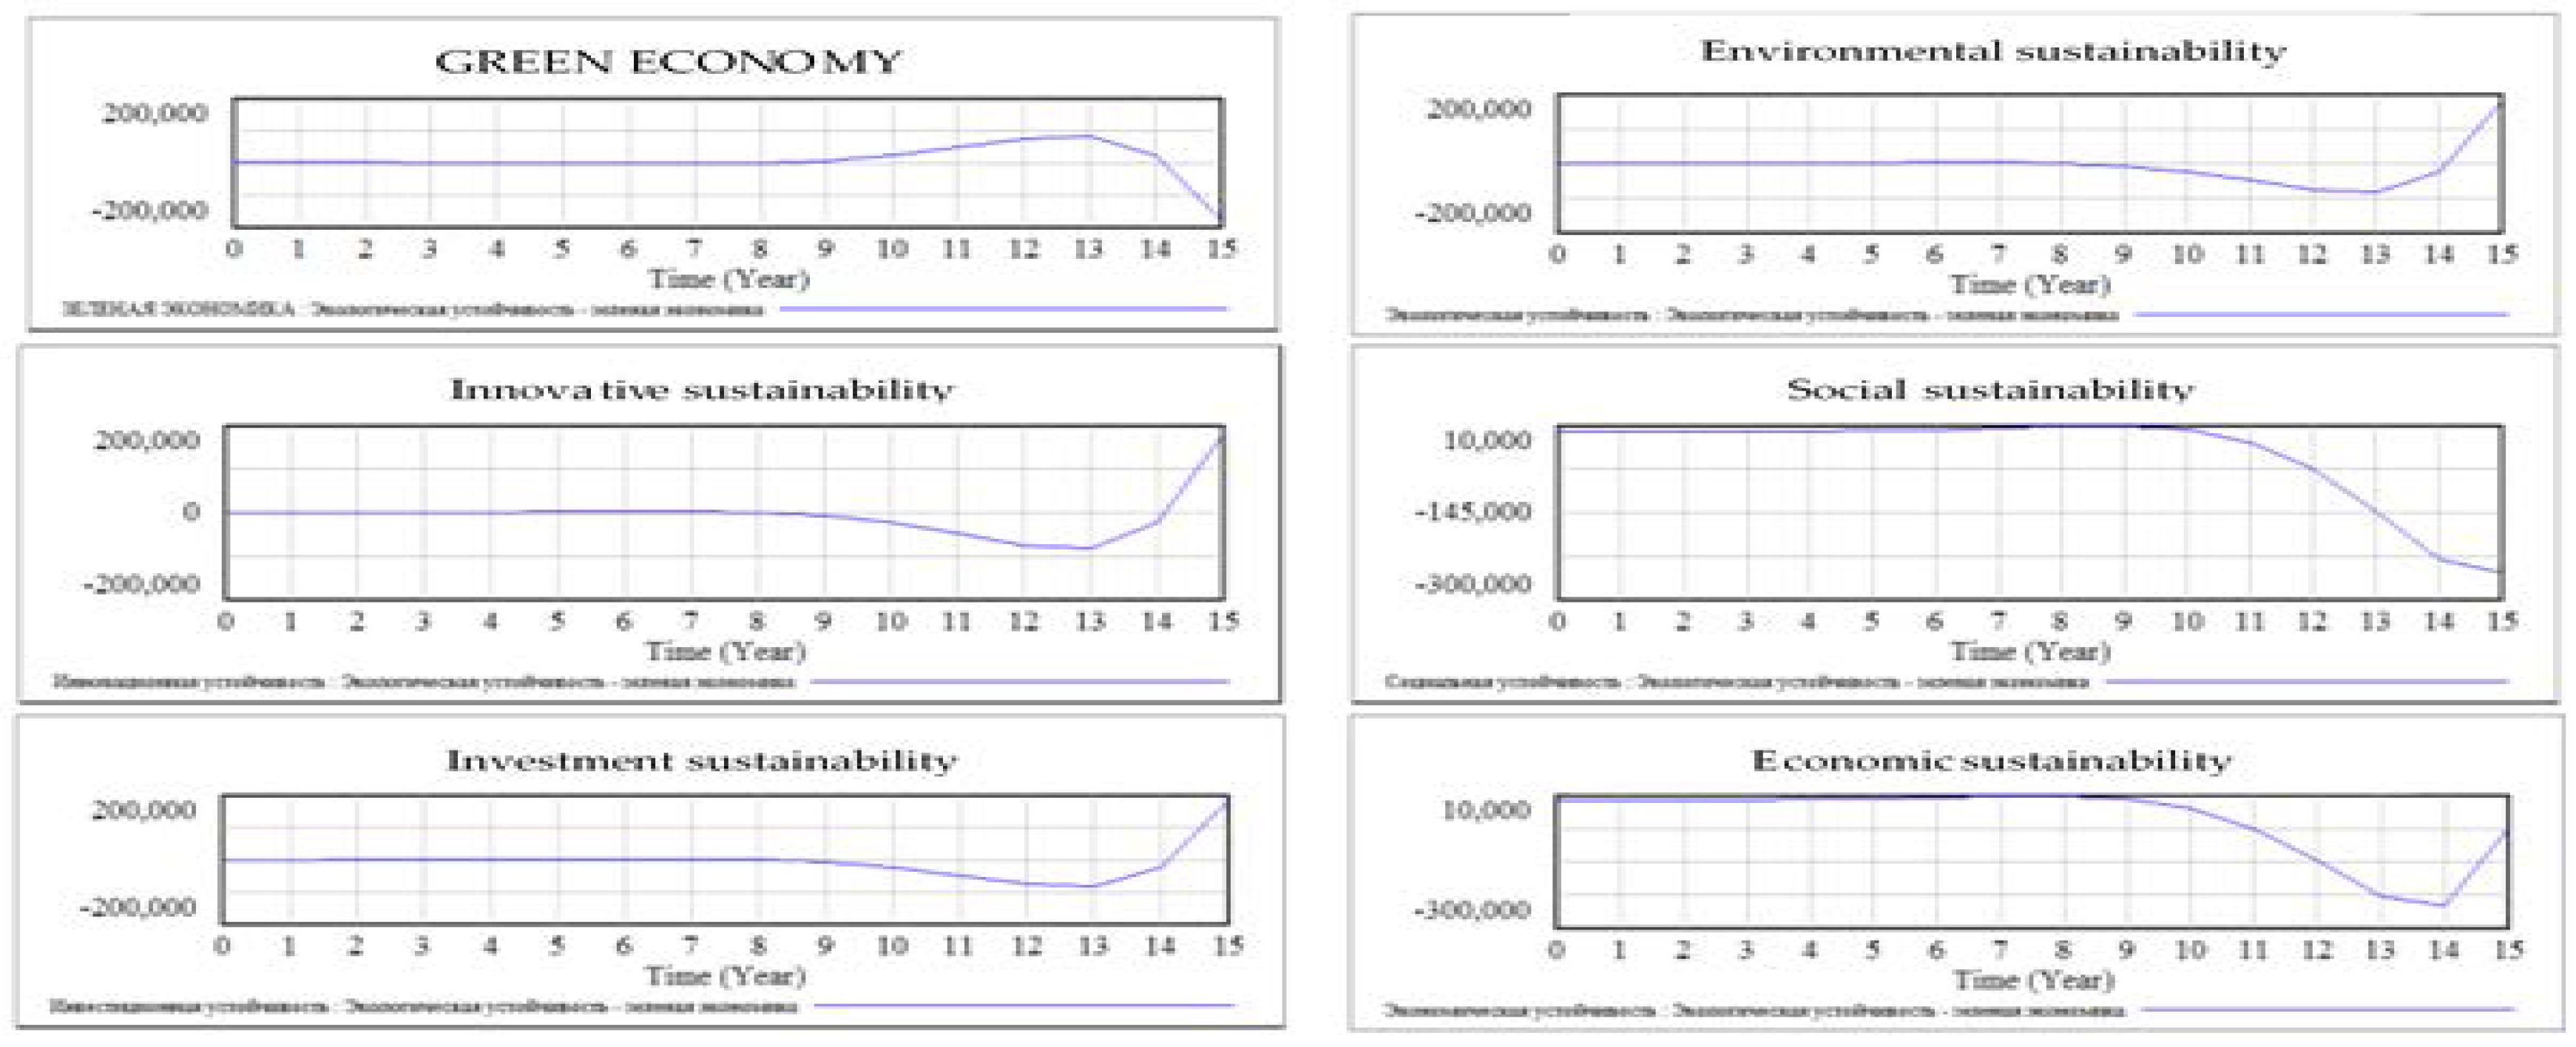
Figure 6.
Scenario 3. Change of the “green” economy with the strengthening of the integration interaction of ecological stability (implemented in the software package Vensim PLE).
Figure 6.
Scenario 3. Change of the “green” economy with the strengthening of the integration interaction of ecological stability (implemented in the software package Vensim PLE).
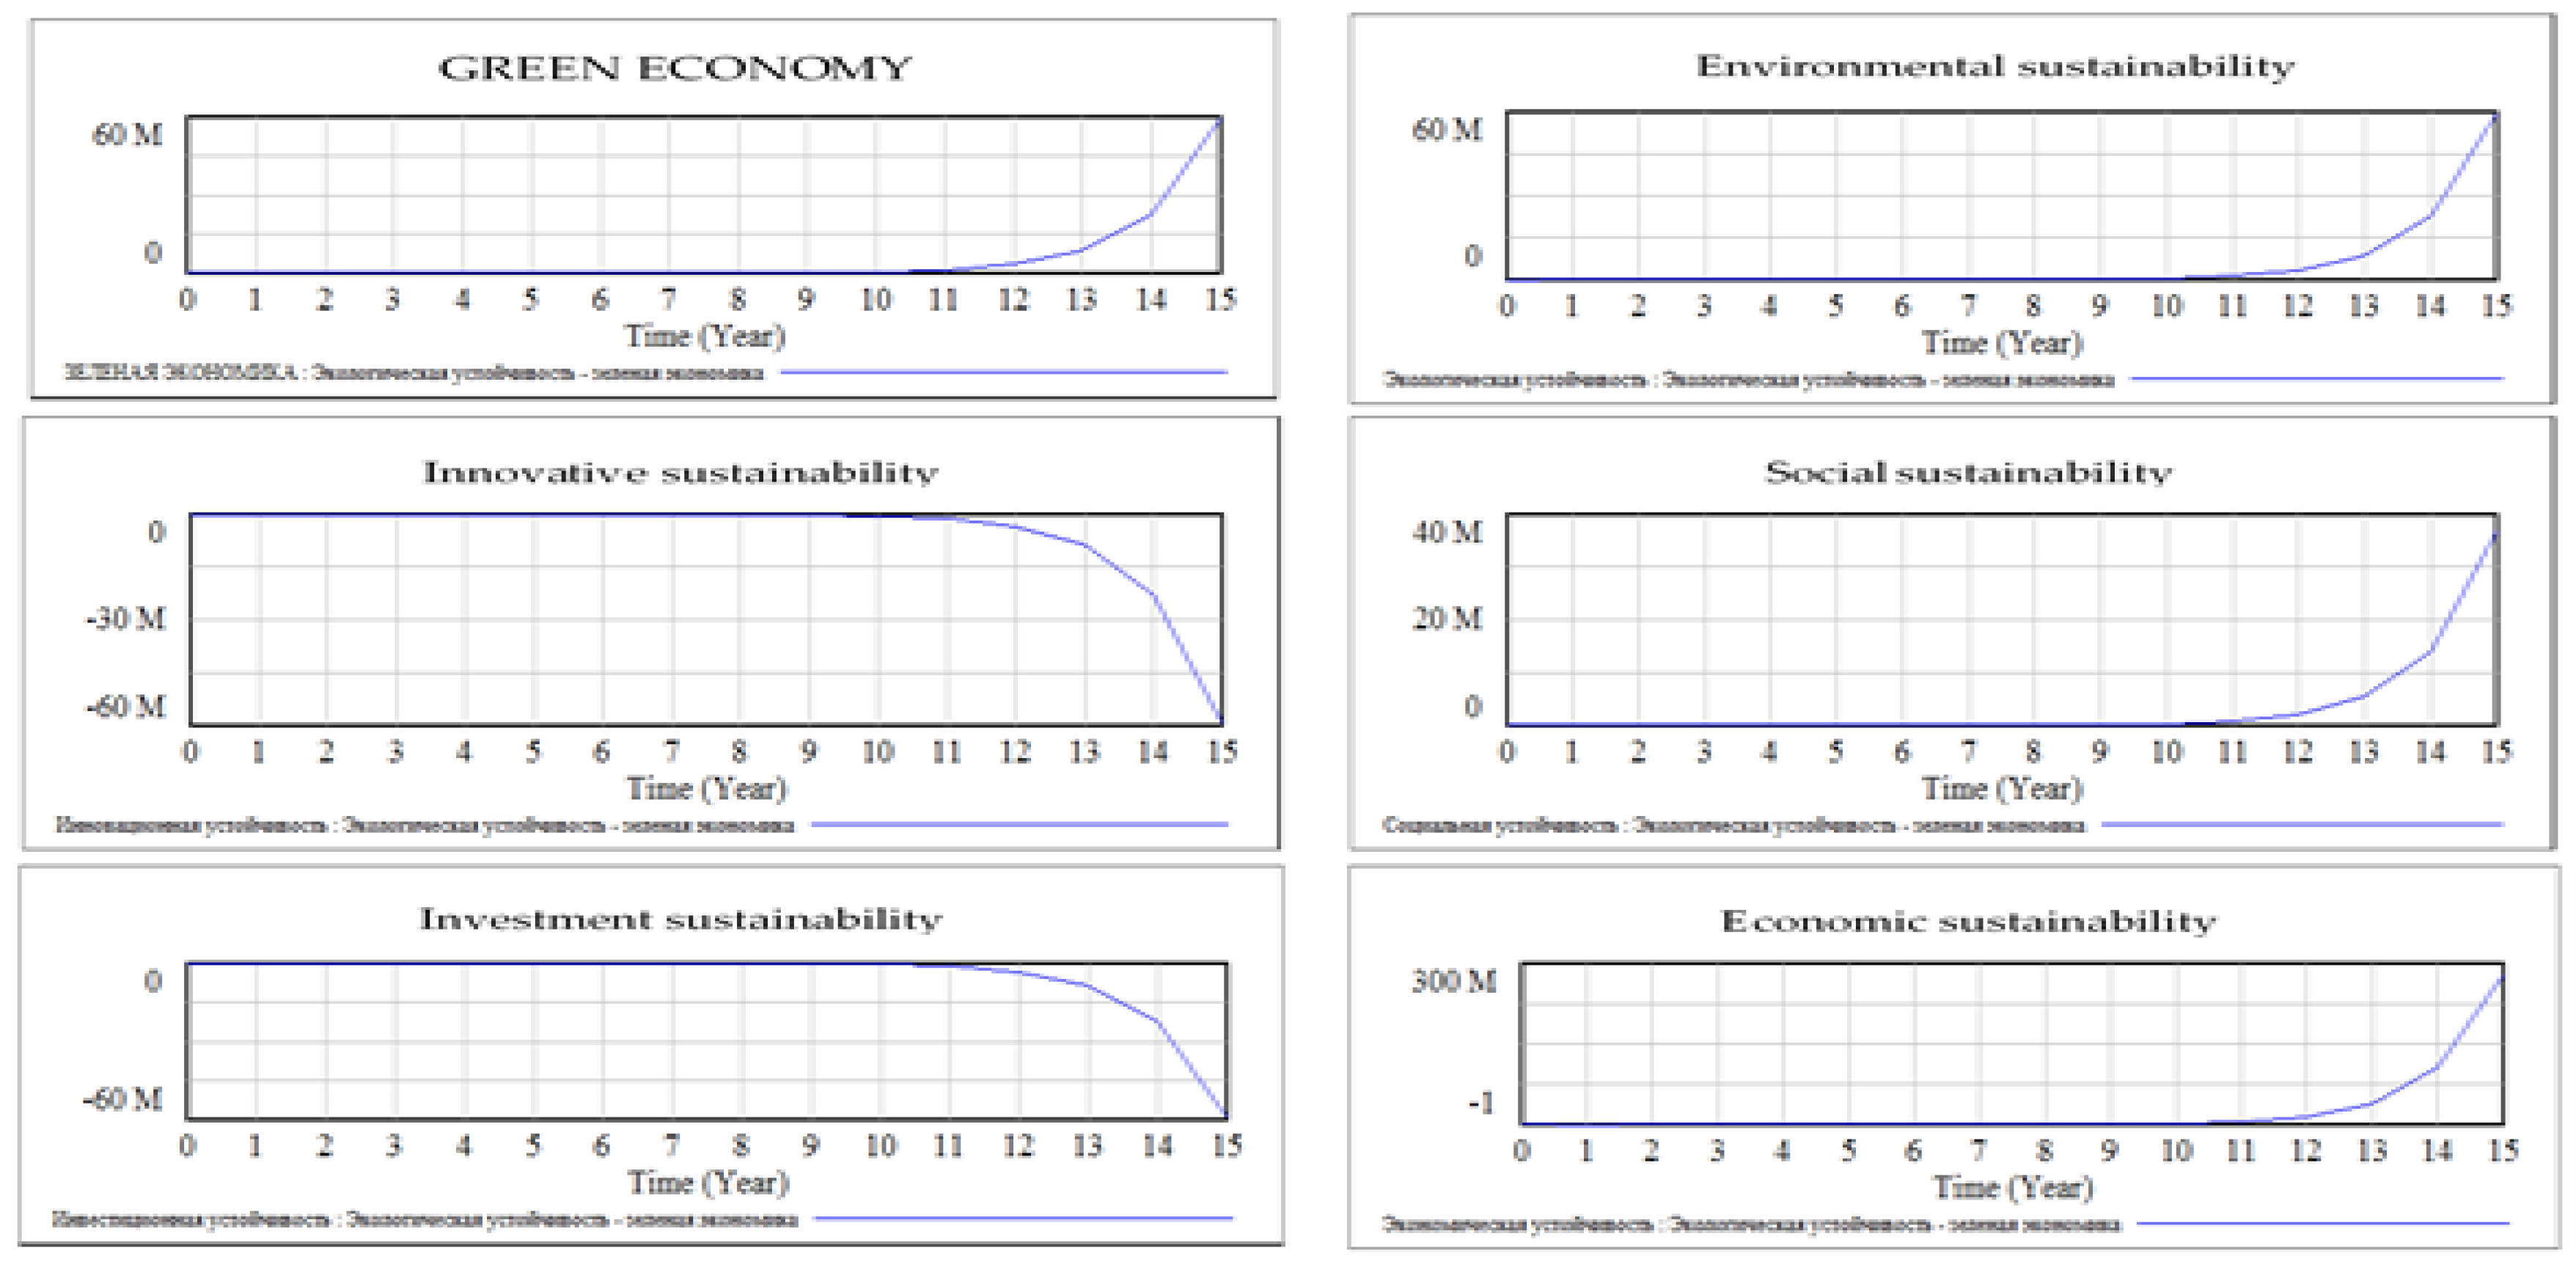
Figure 7.
Scenario 4. Change of the “green” economy with the strengthening of the integration interaction of innovation stability (implemented in the software package Vensim PLE).
Figure 7.
Scenario 4. Change of the “green” economy with the strengthening of the integration interaction of innovation stability (implemented in the software package Vensim PLE).

Figure 8.
Scenario 5. Change of the “green” economy with the strengthening of the integration interaction of investment stability (implemented in the software package VensimPLE).
Figure 8.
Scenario 5. Change of the “green” economy with the strengthening of the integration interaction of investment stability (implemented in the software package VensimPLE).
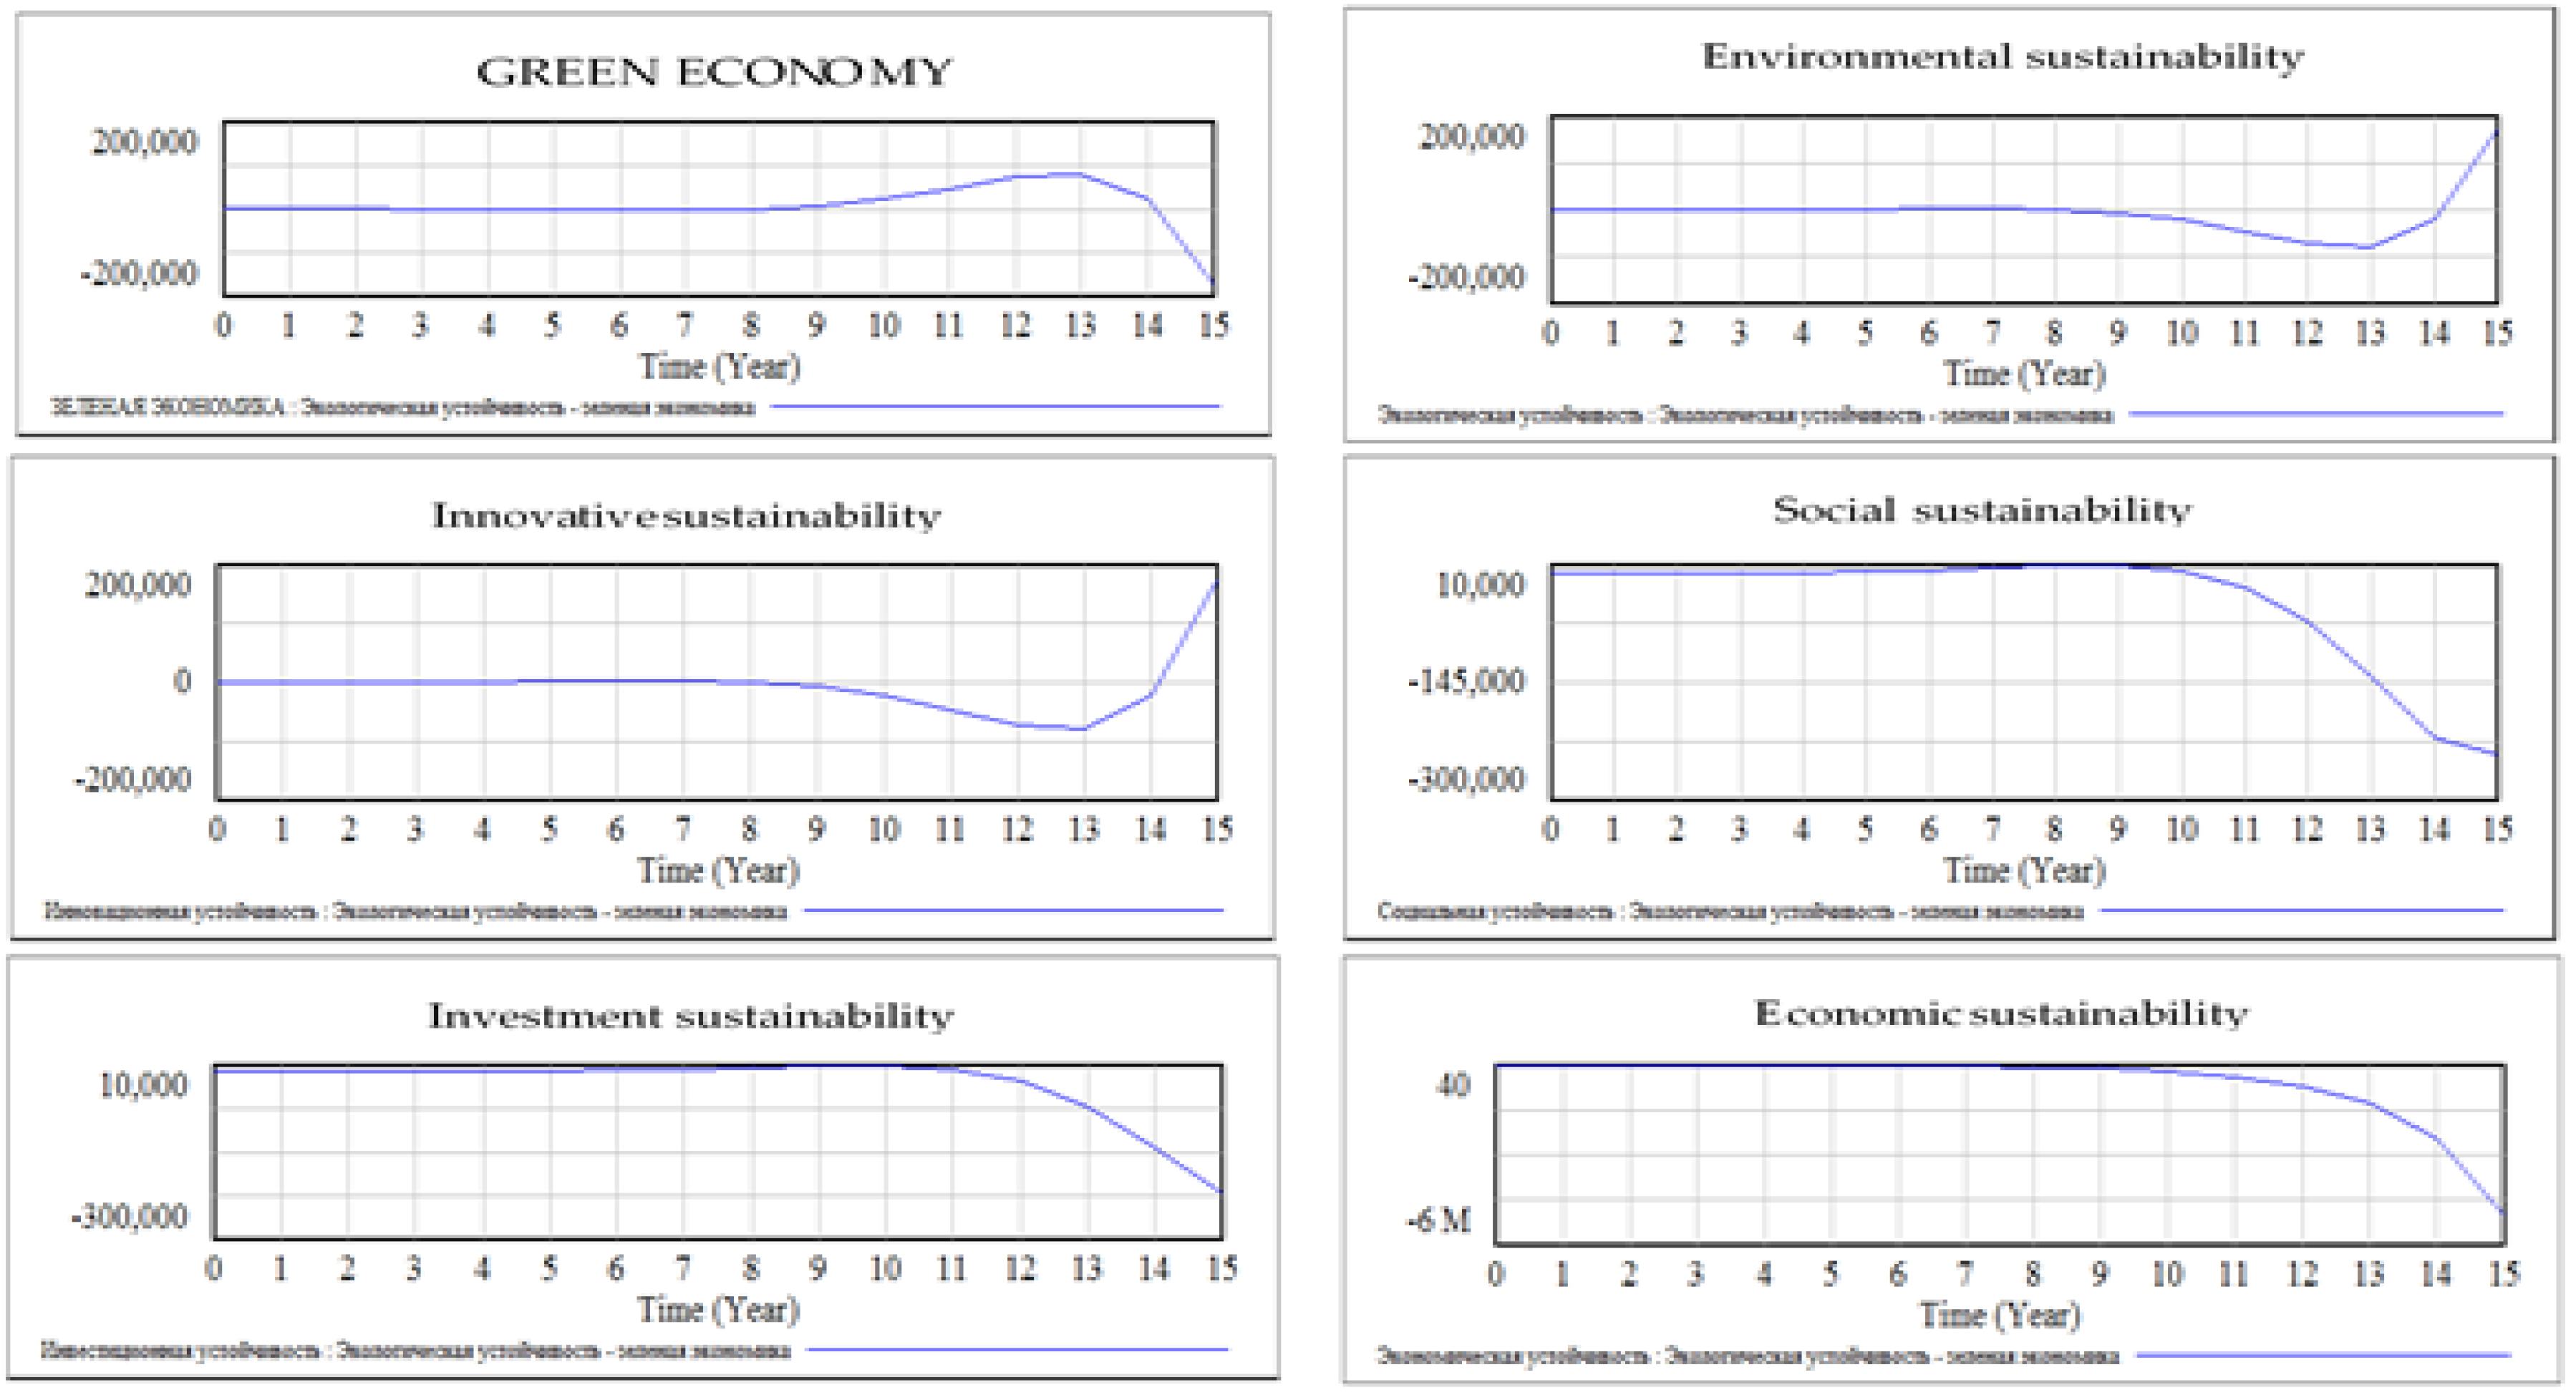
Figure 9.
Scenario modelling of the development of the “green” economy in the region’s space in the forecasting horizon of 30 years (implemented in the software package Vensim PLE).
Figure 9.
Scenario modelling of the development of the “green” economy in the region’s space in the forecasting horizon of 30 years (implemented in the software package Vensim PLE).

Table 1.
Characteristics of the conceptual elements of the dynamic model of the “green” economy used cognitive analysis ***.
Table 1.
Characteristics of the conceptual elements of the dynamic model of the “green” economy used cognitive analysis ***.
| Name of the “Vertex” and Symbols of the Cognitive Map | Conceptual Elements (Indicators and Their Symbols) on the Cognitive Map * | Functional Dependence |
|---|---|---|
| Level of the “green” economy development IRGE (IRegional Green Economy) | - economic development (stability)—A, обратное—A’; - social development (stability—C, reverse—С’; - ecological development (stability)—B, reverse—В’; - innovation development (stability)—D, reverse—D’; - investment development (stability)—F, reverse—F’. | |
| Economic development (stability) А | - gross profit of the economy and gross mixed incomes in the regions of the RF **—А5; - labor productivity index—А8; - indices of the physical volume of retail trade turnover—А12; - consumer price indices **—А10; - share of energy resources produced using renewable energy sources in total energy production **—А1; - coefficient of renewal of fixed assets—А7; - degree of depreciation of fixed assets—А3; - level of economic activity of the population—А2; - return on assets—А6; - growth rate of the financial result of profitable organizations by the corresponding period of the previous year—А4; -index of the number of individual entrepreneurs according to state registration data—А9; - consumption of fuel and energy resources per employee in the economy of the country—А11. | |
| Social development (stability) C | - subsistence level—С6; - per capita monetary income of the population—С5; - ratio of monetary incomes of the population and the subsistence minimum—С4; - poverty level **—С12; - birth rate—С9; - death rate **—С1; - life expectancy at birth—С8; - value of a conditional (minimal) set of food products—С2; - education expenditure index **—С10; - health expenditure index **—С11; - index of improvement of housing stock—С7; - access to internet services, depending on the level of average per capita disposable resources, for 10 percent groups of the population—С3. | |
| Ecological development (stability) B | -share of current (operational) costs for environmental protection **—В1; - share of expenses for capital repairs of the basic funds for environmental protection—В2; - environmental costs as a percentage of GDP—В5; - index of the physical volume of environmental expenditures—В9; - share of investments in fixed assets aimed at environment protection and rational use of natural resources—В7; - share of organizations that carried out innovations ensuring increased environmental safety in the production of goods, works, services, in the total number of organizations that carried out environmental innovations—В11; - share of organizations using the system for monitoring environmental pollution in the total number of organizations—В6; - special cost index associated with environmental innovation **—В12; - index of fee for negative impact on the environment (environmental payments)—В4; - emissions of pollutants into the air **—В8; - discharge of contaminated sewage and generation of production and consumption wastes per capita—В3; -aggregate greenhouse gas emissions index—В10. | |
| Innovation development (stability) D | - share of funds of organizations of the business sector in the total amount of internal costs for research and development—D1; - share of employed in high-tech and mid-tech high-level industries of production in the total number of employed in the economy of the region—D2; - domestic expenditure on research and development as a percentage of GRP—D3; - share of employed in research and development in the average annual number of employed in the economy of the region **—D4; - share of organizations that carried out technological innovation in the total number of organizations (by industrial production organizations)—D5; - share of small enterprises that carried out technological innovations in the total number of small enterprises—D6; - share of innovation goods, works, services in the total volume of goods shipped, works and services performed (by organizations of industrial production) **—D7; - ratio of the amount of subsidies raised from the federal budget for the development of innovation infrastructure for small- and medium-sized businesses to GRP—D8; - share of budgetary funds of the subject of the RF and local budgets in total costs for technological innovations—D9; - share of appropriations for civil science from the consolidated budget of the subject of the RF in the expenditures of the consolidated budget of the subject of the RF—D10; - number of advanced manufacturing technologies developed in the region, per million of economically active population—D11; - number of articles published in peer-reviewed journals indexed at RSCI, per 10 researchers **—D12. | |
| Investment development (stability) F | - index of investments in fixed assets (without budget investments) per capita **—F1; - index of investment in intellectual property **—F2; - index of investment in fixed assets—F3; - index of investment in non-produced non-financial assets—F4; - index of investment in fixed assets aimed at environment protection and rational use of natural resources **—F5; - index of investments of direct investments of residents of the RF abroad by instruments and partner countries—F6; - index of direct investment in Russia from abroad—F7; - index of fixed assets put into operation per 1 ruble of investments by main types of activity in average annual prices—F8; - ratio of the volume of investments in fixed assets to the gross regional product—F9; - amount of attracted extrabudgetary funds—F10; - volume of investments in fixed assets, excluding budgetary funds, per person—F11; - volume of direct foreign investments per 1 resident of a subject of the RF—F12. |
* modelling of general and reduced-parametric cognitive maps of the development of the “green” economy is based on a system of indicators for assessing the development of the “green” economy in the economic space; ** indicators which have the greatest value for the development of the “green” economy; *** The indicators from Unified Interagency Information and Statistical System [29].
Table 2.
Interrelationships reflected in the general extended cognitive map of the development process of the “green” economy.
Table 2.
Interrelationships reflected in the general extended cognitive map of the development process of the “green” economy.
| “Vertex” of the Cognitive Map | Input Pulses | Output Pulses | ||
|---|---|---|---|---|
| «+» | «−» | «+» | «−» | |
| Level of the “green” economy development | A, B, C, D, F | - | A’, B’, C’, D’, F’ | - |
| Economic development (stability) | A2, A4, A5, A6,A7, A8, A9, A12 | A1, A3, A10, A11 | A | - |
| Ecological development (stability) | B1, B2, B5, B6, B7, B11, B12 | B3, B4, B8, B9, B10 | D | - |
| Social development (stability) | C3, C4, C5,C6, C7, C8, C9, C10, C11 | C1, C2, C12 | C | - |
| Innovation development (stability) | D1, D2, D3,D4, D5, D6, D7, D8, D9, D10, D11, D12 | - | D | - |
| Investment development (stability) | F1, F2, F3,F4, F5, F6, F7, F8, F9, F10, F11, F12 | - | F | - |
Table 3.
Matrix of the adjacent configuration for the reduced-parametric cognitive map of the process of development of the “green” economy in the economic space of the region.
Table 3.
Matrix of the adjacent configuration for the reduced-parametric cognitive map of the process of development of the “green” economy in the economic space of the region.
| Name and Symbols of the “Vertex” of the Cognitive Map | 1 | 2 | 3 | 4 | 5 | 6 | 7 | 8 | 9 | 10 | 11 | 12 | 13 | 14 | 15 | 16 | 17 | 18 | 19 | 20 | 21 | 22 |
|---|---|---|---|---|---|---|---|---|---|---|---|---|---|---|---|---|---|---|---|---|---|---|
| 1. Level of the “green” economy development | A | P | P | P | P | P | A | A | A | A | A | A | A | A | A | A | A | A | A | A | A | A |
| 2. Economic development (stability) | P | A | P | P | P | P | A | A | A | A | A | A | A | A | A | A | A | A | A | A | A | A |
| 3. Social development (stability) | P | P | A | P | P | P | A | A | A | A | A | A | A | A | A | A | A | A | A | A | A | A |
| 4. Ecological development (stability) | P | P | P | A | P | P | A | A | A | A | A | A | A | A | A | A | A | A | A | A | A | A |
| 5. Innovation development (stability) | P | P | P | P | A | P | A | A | A | A | A | A | A | A | A | A | A | A | A | A | A | A |
| 6. Investment development (stability) | P | P | P | P | P | A | A | A | A | A | A | A | A | A | A | A | A | A | A | A | A | A |
| 7. Gross profit of the economy and gross mixed incomes in the regions of the RF | A | P | A | A | A | A | A | A | A | A | A | A | A | A | A | A | A | A | A | P | A | A |
| 8. Consumer price indices | A | N | N | A | A | A | N | A | A | A | A | A | A | A | A | A | A | A | A | N | A | A |
| 9. Share of energy resources produced using renewable energy sources in total energy production | A | N | A | A | A | A | N | A | A | A | A | A | A | N | A | N | A | A | A | A | A | A |
| 10. Poverty level | A | A | N | A | A | A | N | N | A | A | N | A | N | A | A | N | A | A | A | A | A | A |
| 11. Death rate | A | A | N | A | A | A | A | A | A | A | A | A | A | A | A | A | A | A | A | A | A | A |
| 12. Education expenditure | A | A | P | P | A | A | A | A | A | A | P | A | A | A | A | A | A | A | P | A | P | A |
| 13. Health expenditure | A | A | P | A | A | A | A | A | A | A | P | A | A | A | A | A | A | A | A | A | A | A |
| 14. Current (operational) costs for environmental protection | A | A | A | P | A | A | A | A | A | A | A | A | A | A | A | P | A | A | A | A | A | A |
| 15. Special cost associated with environmental innovation | A | A | A | P | P | A | A | A | A | A | A | A | A | A | A | P | A | P | A | A | A | A |
| 16. Emissions of pollutants into the air | A | A | A | N | A | A | A | A | A | N | A | A | A | A | A | A | A | A | A | A | A | A |
| 17. Share of employed in research and development in the average annual number of employed in the economy of the region | A | A | A | A | P | A | A | A | A | A | A | A | A | A | A | A | A | P | P | A | A | A |
| 18. Share of innovation goods, works, services in the total volume of goods shipped, works and services performed (by organizations of industrial production) | A | A | A | A | P | A | A | A | A | A | A | A | A | A | A | A | A | A | A | A | A | A |
| 19. Number of articles published in peer-reviewed journals indexed at RSCI, per 10 researchers | A | A | A | A | P | A | A | A | A | A | A | A | A | A | P | A | A | P | A | A | A | A |
| 20. Index of investments in fixed assets (without budget investments) per capita | A | A | A | A | A | P | A | A | A | A | A | A | A | A | A | A | P | P | A | A | P | A |
| 21. Index of investment in intellectual property | A | A | A | A | A | P | A | A | A | A | A | A | A | A | A | A | A | P | P | A | A | A |
| 22. Index of investment in fixed assets aimed at environment protection and rational use of natural resources | A | A | A | P | A | P | A | A | A | A | A | A | A | P | P | A | A | A | A | A | A | A |
P—positive pulse (equals 1); N—negative pulse (equals −1); A—absence of direct link (equals 0).
Table 4.
Comparative analysis of the scenario modelling results of the development of the “green” economy in the region’s space.
Table 4.
Comparative analysis of the scenario modelling results of the development of the “green” economy in the region’s space.
| Variable Parameter (Cognitive Vertex) | Scenario 1 | Scenario 2 | Scenario 3 * | Scenario 4 | Scenario 5 |
|---|---|---|---|---|---|
| Social stability |  | |  | | |
| Economic stability | | | | | |
| Environmental stability | | | | | |
| Innovation stability | | | | | |
| Investment stability | | | | | |
| Green economy | | | | | |
—positive dynamics of changes (growth); —negative dynamics of changes (decline); * Most Optimal Scenario.© 2018 by the authors. Licensee MDPI, Basel, Switzerland. This article is an open access article distributed under the terms and conditions of the Creative Commons Attribution (CC BY) license (http://creativecommons.org/licenses/by/4.0/).
Share and Cite
MDPI and ACS Style
Rudneva, L.; Pchelintseva, I.; Gureva, M. Scenario Modelling of the “Green” Economy in an Economic Space. Resources 2018, 7, 29. https://doi.org/10.3390/resources7020029
AMA Style
Rudneva L, Pchelintseva I, Gureva M. Scenario Modelling of the “Green” Economy in an Economic Space. Resources. 2018; 7(2):29. https://doi.org/10.3390/resources7020029
Chicago/Turabian StyleRudneva, Larisa, Irina Pchelintseva, and Maria Gureva. 2018. "Scenario Modelling of the “Green” Economy in an Economic Space" Resources 7, no. 2: 29. https://doi.org/10.3390/resources7020029
Note that from the first issue of 2016, this journal uses article numbers instead of page numbers. See further details here.