The Ortelius Incident in the Hinlopen Strait—A Case Study on How Satellite-Based AIS Can Support Search and Rescue Operations in Remote Waters


1
Institute for Marine and Antarctic Studies, University of Tasmania, Private Bag 129, Hobart, TAS 7001, Australia
2
Department of Research and Development, Norwegian Defence Cyber Academy, P.O. Box 800, Postmottak, NO-2617 Lillehammer, Norway
Resources 2017, 6(3), 35; https://doi.org/10.3390/resources6030035
Submission received: 26 April 2017
/
Revised: 3 July 2017
/
Accepted: 24 July 2017
/
Published: 27 July 2017
(This article belongs to the Special Issue Sustainable Tourism and Natural Resource Conservation in the Polar Regions)
Abstract
:In this paper, Automatic Identification System (AIS) data collected from space is used to demonstrate how the data can support search and rescue (SAR) operations in remote waters. The data was recorded by the Norwegian polar orbiting satellite AISSat-1. This is a case study discussing the Ortelius incident in Svalbard in early June 2016. The tourist vessel flying the flag of Cyprus experienced engine failure in a remote part of the Arctic Archipelago. The passengers and crew were not harmed. There were no Norwegian Coast Guard vessels in the vicinity. The Governor of Svalbard had to deploy her vessel Polarsyssel to assist the Ortelius. The paper shows that satellite-based AIS enables SAR coordination centers to swiftly determine the identity and precise location of vessels in the vicinity of the troubled ship. This knowledge makes it easier to coordinate SAR operations.
1. Introduction
On Friday 3 June 2016 at 12:30 am local time, the tourist vessel Ortelius reported engine trouble in the vicinity of the Vaigatt Islands in the Hinlopen Strait. This strait separates the main islands of Spitsbergen and Nordaustlandet in Norway’s Svalbard archipelago [1,2,3]. There were 146 persons on board, out of which 105 were passengers. The Governor’s vessel, the Polarsyssel, was sent to the region to tow the Ortelius back to Longyearbyen where it arrived in the evening of Sunday 5 June. Neither the Ortelius nor her passengers were reported to be in any danger during the incident.
In this paper, the Ortelius incident is used as a case study to show how satellite-based Automatic Identification System (AIS) can help establish situational awareness and support search and rescue operations in remote waters like the Arctic and Antarctica.
The purpose of the Automatic Identification System (AIS) is to increase safety at sea [4]. It transmits information about the ship and voyage. All ships of 300 gross tonnage and upwards that are engaged on international voyages, cargo ships of 500 gross tonnage and upwards not engaged on international voyages, and all passenger ships, irrespective of size, must have and use AIS. The requirement became effective for all ships by 31 December 2004. Ships equipped with an AIS transponder must keep it in operation at all times, except when international agreements, rules or standards provide for the protection of navigational information. Military vessels do not have an obligation to shine an AIS transponder, but may choose to do so. These regulations are implemented through the International Maritime Organization (IMO).
The transmissions take place in the VHF band. As a rule of thumb, the distance to the radio horizon of VHF transmissions can be calculated by taking the square root of the height of the antenna measured in meters and multiplying this number by 4124. Mountains, islands and other obstacles will reduce the effective range. It turns out that the AIS signals can also be received by satellites in low Earth orbit. Norway has therefore pursued satellite-based AIS to increase situation awareness in the North Atlantic and Arctic Ocean, which are that nation’s main area of interest.
Satellites in polar orbits have global coverage. This is an advantage over satellites in geostationary orbit, which only see approximately one third of the Earth’s surface. A geostationary satellite is located 36,000 km over the equator, approximately 1/10 the distance to the Moon. Such satellites are much more complicated and expensive to maintain and launch than small satellites in low Earth orbit. The advent of relatively simple and inexpensive micro-, nano- and pico-satellites gives small countries access to services that used to be available for superpowers only.
Ice melting from man-made climate change has opened the Arctic as a high-end tourist destination. Areas that used to be blocked by ice contain beautiful landscapes and natural resources like oil, natural gas and minerals that are of great interest to private and state actors. The increased traffic in the High North led to the Arctic Council adopting the “Agreement on Cooperation on Aeronautical and Maritime Search and Rescue in the Arctic” in 2011 [5]. The Arctic nations have divided the Arctic into national areas of responsibility, where “Each party shall promote the establishment, operation and maintenance of an adequate and effective search and rescue capability within its area (of national responsibility)”.
Article 7.3b of the Agreement states that “if a search and rescue agency and/or (Rescue Coordination Center) (RCC) of a Party receives information that any person is, or appears to be, in distress, that party shall take urgent steps to ensure that the necessary assistance is provided”. This paper shows that satellite-based AIS enables the Rescue Coordination Center to quickly get an overview of ships in the vicinity of a disabled vessel. This knowledge enables the RCC to plan the SAR operation in a very effective way.
The author is aware of only one paper that quantifies tourist traffic in the European Arctic. Aase and Jabour (2015) [6] studies three areas in the European Arctic using AIS satellite data obtained between 2010–2014. One of these regions is the waters north of 80° N in the Norwegian SAR area of responsibility between 0 and 35° E. This region is located just north of Spitsbergen.
The number of tourist vessels north of Svalbard increased from 15 in 2010 to 22 in 2013. It then dropped to 20 in 2014. This is most likely an organic fluctuation in the tourism industry, with more or less ships each season highly dependent on market demand. The first tourist vessel was seen north of 80° N on 1 June in 2012, on 4 June in 2011 and 2013, and on 9 June in 2014. AISSat-1 was launched after the start of the 2010 tourist season, so there is no first date for 2010. There is no obvious pattern to determine when the season ends. The last tourist vessel was seen north of 80° N on 22 September 2010, while the tourist season lasted until 7 October in 2011. Tourist vessels were seen north of 82° N in both 2011 and 2012. A vessel is out of reach from geostationary communication satellites at this latitude. Lack of broadband communications complicates SAR operations.
2. Materials and Methods
The Technology
The Norwegian satellite AISSat-1 was launched on 12 July 2010 [7] as secondary payload on an Indian rocket. As of 24 April 2017, the satellite flies in an orbit where the altitude changes between 610 and 626 km [8]. It is inclined with the equator by 98.0°. The satellite will hence pass over different areas in the Arctic and Antarctica for each orbit. This can explain why the numbers in Table 1 change. When a ship is outside the field of view of the satellite, the AIS transmissions will not be recorded. On the next pass, the path of the satellite has changed, and the vessel may be seen. The satellite records the time when a transmission is received by assigning a time stamp in J2000.0 format. J2000.0 equals the number of seconds passed since noon GMT on 1 January 2000.
Data is downloaded from AISSat-1 when the satellite passes over the town Vardø in Norway’s northernmost county, Finnmark. Some AISSat-1 passes in the Arctic take place below the horizon seen from Vardø, and there are hence some gaps in the data flow.
The technical characteristics behind the AIS system are published in Recommendation ITU-R M.1371-5 [9]. In [10], Clazzer et al. analytically model the AIS Self-Organized Time Division Multiple Access (SOTDMA) traffic pattern at the satellite and investigate the realistic behavior of SOTDMA via simulations. Shelmerdine [11] demonstrates a procedure for the processing, analysing, and visualisation of AIS data with example outputs and their potential uses. Over 730,000 data points of AIS information for 2013 from around Shetland were processed, analysed, and mapped. Tools used included density mapping, vessel tracks, interpolations of vessel dimensions, and ship type analysis. The dataset was broken down by sector into meaningful and usable data packets which could also be analysed over time. Density mapping, derived from both point and vessel track data, proved highly informative but was unable to address all aspects of the data. Vessel tracks showed variation in vessel routes, especially around island groups. Additional uses of AIS data were addressed and included risk mapping for invasive non-native species, fisheries, and general statistics. Temporal variation of vessel activity was also discussed.
AIS equipment Class A is ship-borne mobile equipment intended to meet all performance standards and carriage requirements adopted by the IMO [12]. Class A stations report their position autonomously every 2 to 10 s depending on the vessel’s speed and/or course changes. Position messages are transmitted every three minutes or less when the vessel is at anchor or moored. The static and voyage related messages are transmitted every six minutes. Class A stations are capable of text messaging safety-related information and AIS Application Specific Messages, such as meteorological and hydrological data, electronic broadcast Notice to Mariners, and other marine safety information.
For Class A equipment, AIS position reports are transmitted as Messages types 1, 2 and 3 [13]. The messages contain the vessel’s Maritime Mobile Service Indicator (MMSI) number. This is a unique nine-digit number that identifies the vessel that transmits the message. These messages also inform about the vessel’s navigational status, like “under way using engine”, “at anchor”, “restricted manoeuvrability”, “moored” or “aground”. In these messages, one can also find information about the rate of turn, speed over ground, position accuracy, longitude, latitude, course over ground and true heading. A time stamp indicating the time of download in J2000.0-format is added to the data files by the satellite software.
Class A ship static and voyage-related data are transmitted in AIS Messages type 5. These messages contain the ship’s MMSI number, and also the IMO number, call sign and ship name. They also inform about the type of ship and cargo type, overall dimension, type of electronic position fixing device, estimated time of arrival (ETA), maximum present static draught, and destination.
AIS equipment Class B is ship-borne mobile equipment that is interoperable with all other AIS stations, but does not meet all the performance standards adopted by the IMO. Like Class A stations, they report every three minutes or less when moored or at anchor, but their position is reported less frequently or at less power than for Class A equipment. The vessel’s static data is reported every six minutes. Class B equipment does not send any voyage-related information. It can, however, receive safety related text and application specific messages. Class B transponders use a different communications protocol than Class A transponders.
Class B position reports are transmitted as AIS messages types 18 and 19. They include the vessel’s MMSI number, speed over ground, position accuracy, longitude, latitude, course over ground, true heading and some technical information. Messages type 19 also include the ship’s name and information about the type of ship and cargo.
Messages type 24 are Class B static data reports. They consist of two parts, A and B. Part A includes the MMSI number and the vessel’s name. Part B also includes the MMSI number, in addition to the type of ship and cargo type, vendor ID, call sign, dimension of ship and type of electronic position fixing device.
All these AIS messages contain the transmitting vessel’s MMSI number. This information is used in this work to identify the vessel. AIS messages types 1 and 18 contain a time stamp and the position of the vessel in latitude and longitude. AIS messages types 5 and 24 contain the vessel’s name, call sign, IMO number and destination. From AIS messages types 1 and 18 the time stamp, MMSI number and position are extracted to text files in .txt format, which are readable in MatLAB and can be used to plot positions in Google Maps.
The Norwegian Coastal Administration (NCA) (Name in Norwegian: Kystverket) owns the AISSat data sets. The NCA determines if an applicant shall get access to the data. The global data base is administered by Forsvarets Forskningsinstitutt (FFI). The FFI provides the data sets for free as password-protected zip files when access has been granted. The data sets shall not be used for commercial purposes.
By using the map published in the first online news articles [3], the position of the Ortelius was estimated to be 79.4° N 19° E. FFI generously provided a data set with AISSat-1 readings of positions within a radius of 200 km from this position obtained on 3 June. The first batch of data was downloaded at 07:19 UTC on 3 June, the last at 00:56 UTC on the 4th of June. The data set contains downloads from 12 passes over Vardø (Table 1).
AIS messages types 1, 5, 18 and 24 are used in this study. The unzipped text files are read into an Excel spreadsheet. For messages type 1, the J2000.0 time stamp, MMSI number and position (longitude and latitude) are used. The data set was divided into 12 subsets, where each subset was the data downloaded from each pass. The NDRE generously converted the J2000.0 time stamp into UTC time. In each of these subsets, only the first position sent from a vessel is used.
3. Results
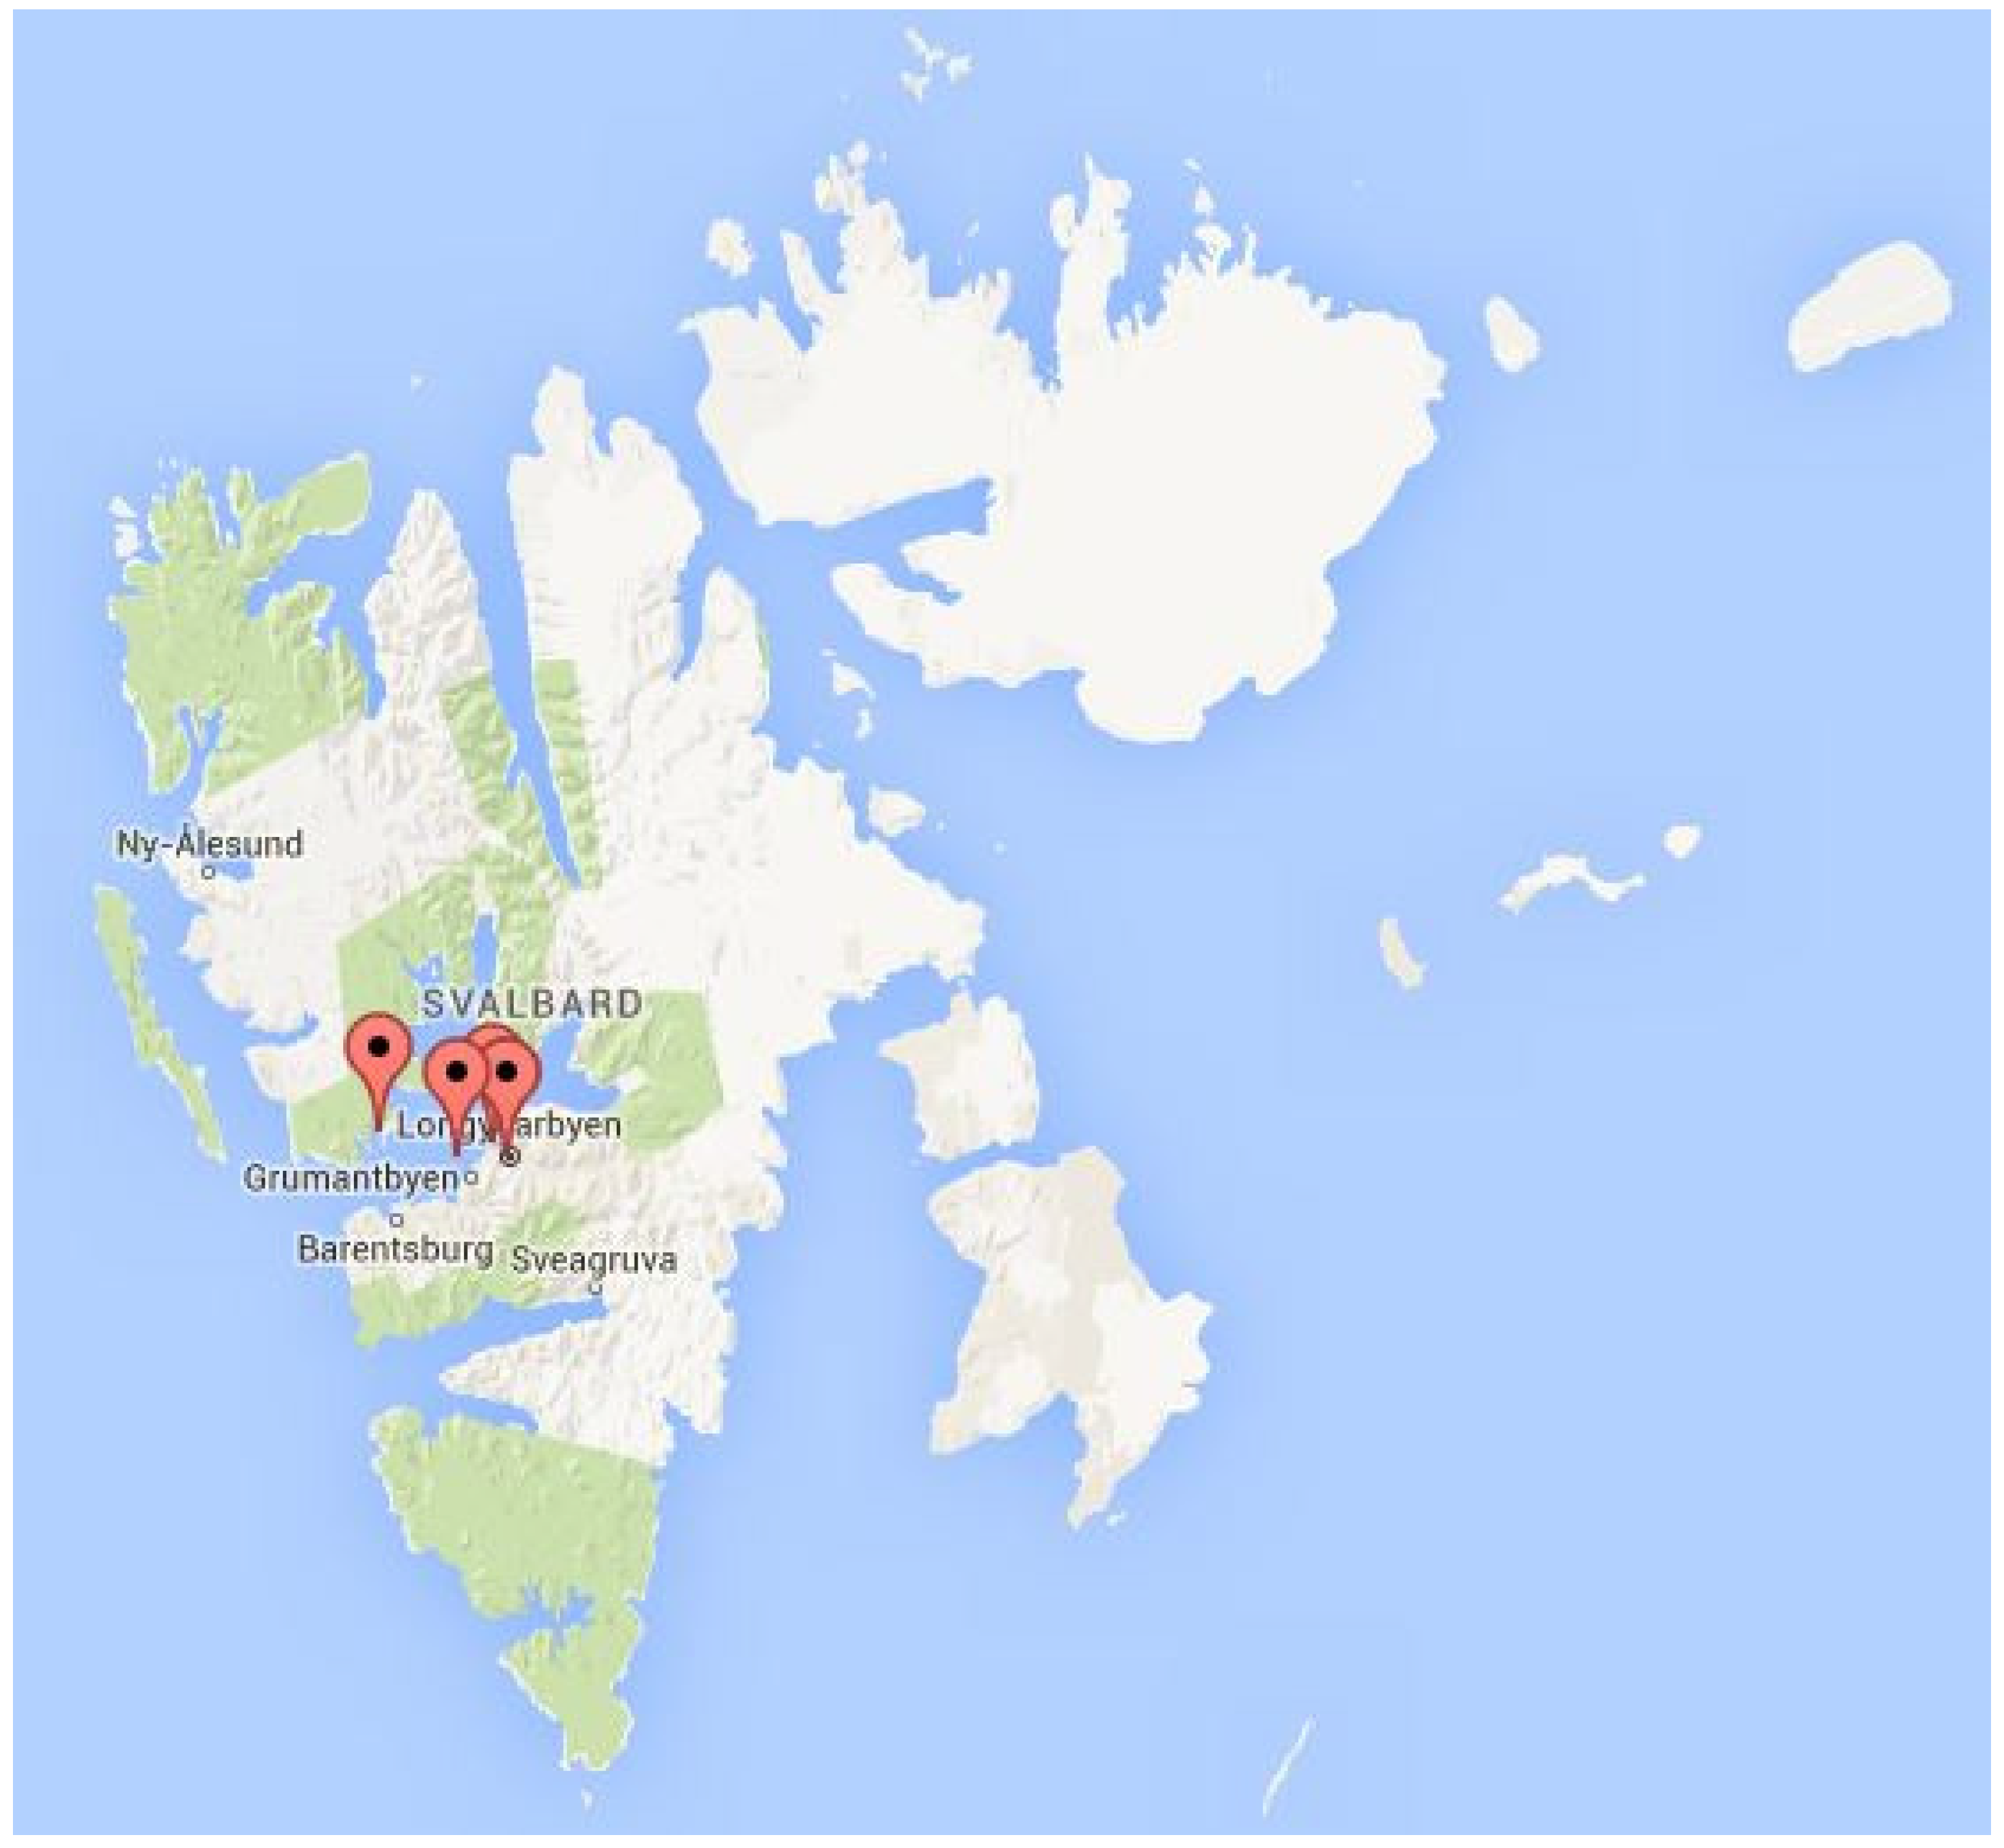
Table 1 describes 12 satellite passes over Svalbard on the 3rd and 4th of June 2016. Table 1 shows the times when the data download began in both J2000-format and time given in UTC. Norwegian, i.e., Central European, summer time is two hours ahead of UTC time. The two last columns show the number of Class A and Class B transponders found in the downloaded batches of data. A data set was downloaded five minutes (UTC 10:35:26) after the Ortelius reported her engine problems (UTC 10:30). 17 Class A and 0 Class B transponders were found in that batch of data. The data set contains information from the two passes before Ortelius reported her accident, downloaded at 07:19 and 8:58 UTC. In the download received at UTC 08:58, 19 Class A transponders were seen. The maximum number of Class B transporters was seen in the 13:47 pass. Three transponders were seen. This day the satellite saw four unique Class B transponders (Figure 4).
Table 2 and Table 3 show information about the vessels seen in the downloads starting at 08:58:40 and 10:35:26. Only data from the first Type 1 message received from each ship is used. Column 1 shows the time in J2000.0 format when AISSat-1 received the first message from the vessel. Column 2, Groundtime, tells when the first message was received by the radio receiver in Vardø. Columns 3 and 4 provides the vessel’s unique MMSI number and name. Columns 5 and 6 give the first position recorded from the vessel in each pass. The positions are plotted in Google maps in Figure 1 and Figure 2.
In Figure 2, the vessels observed during AISSat-1s first pass over Svalbard after the Ortelius notified the authorities about her engine problems are plotted in Google Maps. Neither the Stockholm nor the Sea Endurance are seen in this data set. There are several possible explanations for this. Both vessels may have been sailing close to land, and hence entered radio shadows behind mountains which have prevented the radio signals to reach the satellite. The ship antennas may have been mounted in unfavourable places on the vessels. Co-channel interference or atmospheric/ionospheric interference are also possible explanations. The satellite may also have flown at more eastern longitude, and hence not seen the vessels.
The AIS data show that there were 24 vessels with Class A AIS transponders in the region of interest. Their positions are illustrated in Figure 1. Figure 1 shows that there were four vessels that could reach the Ortelius in reasonable time if it had stated an emergency. The Stockholm and the Sea Endurance were sailing in the fjords of north-western Spitsbergen. The National Geographic Explorer was sailing along the eastern coast of Spitsbergen. The Letto was sailing near Svenskøya Island.
The other vessels were located on the western coast of Spitsbergen, near the settlements Ny-Ålesund, Longyearbyen, and Barentsburg. It would take time for these ships to sail to the rescue of the Ortelius.
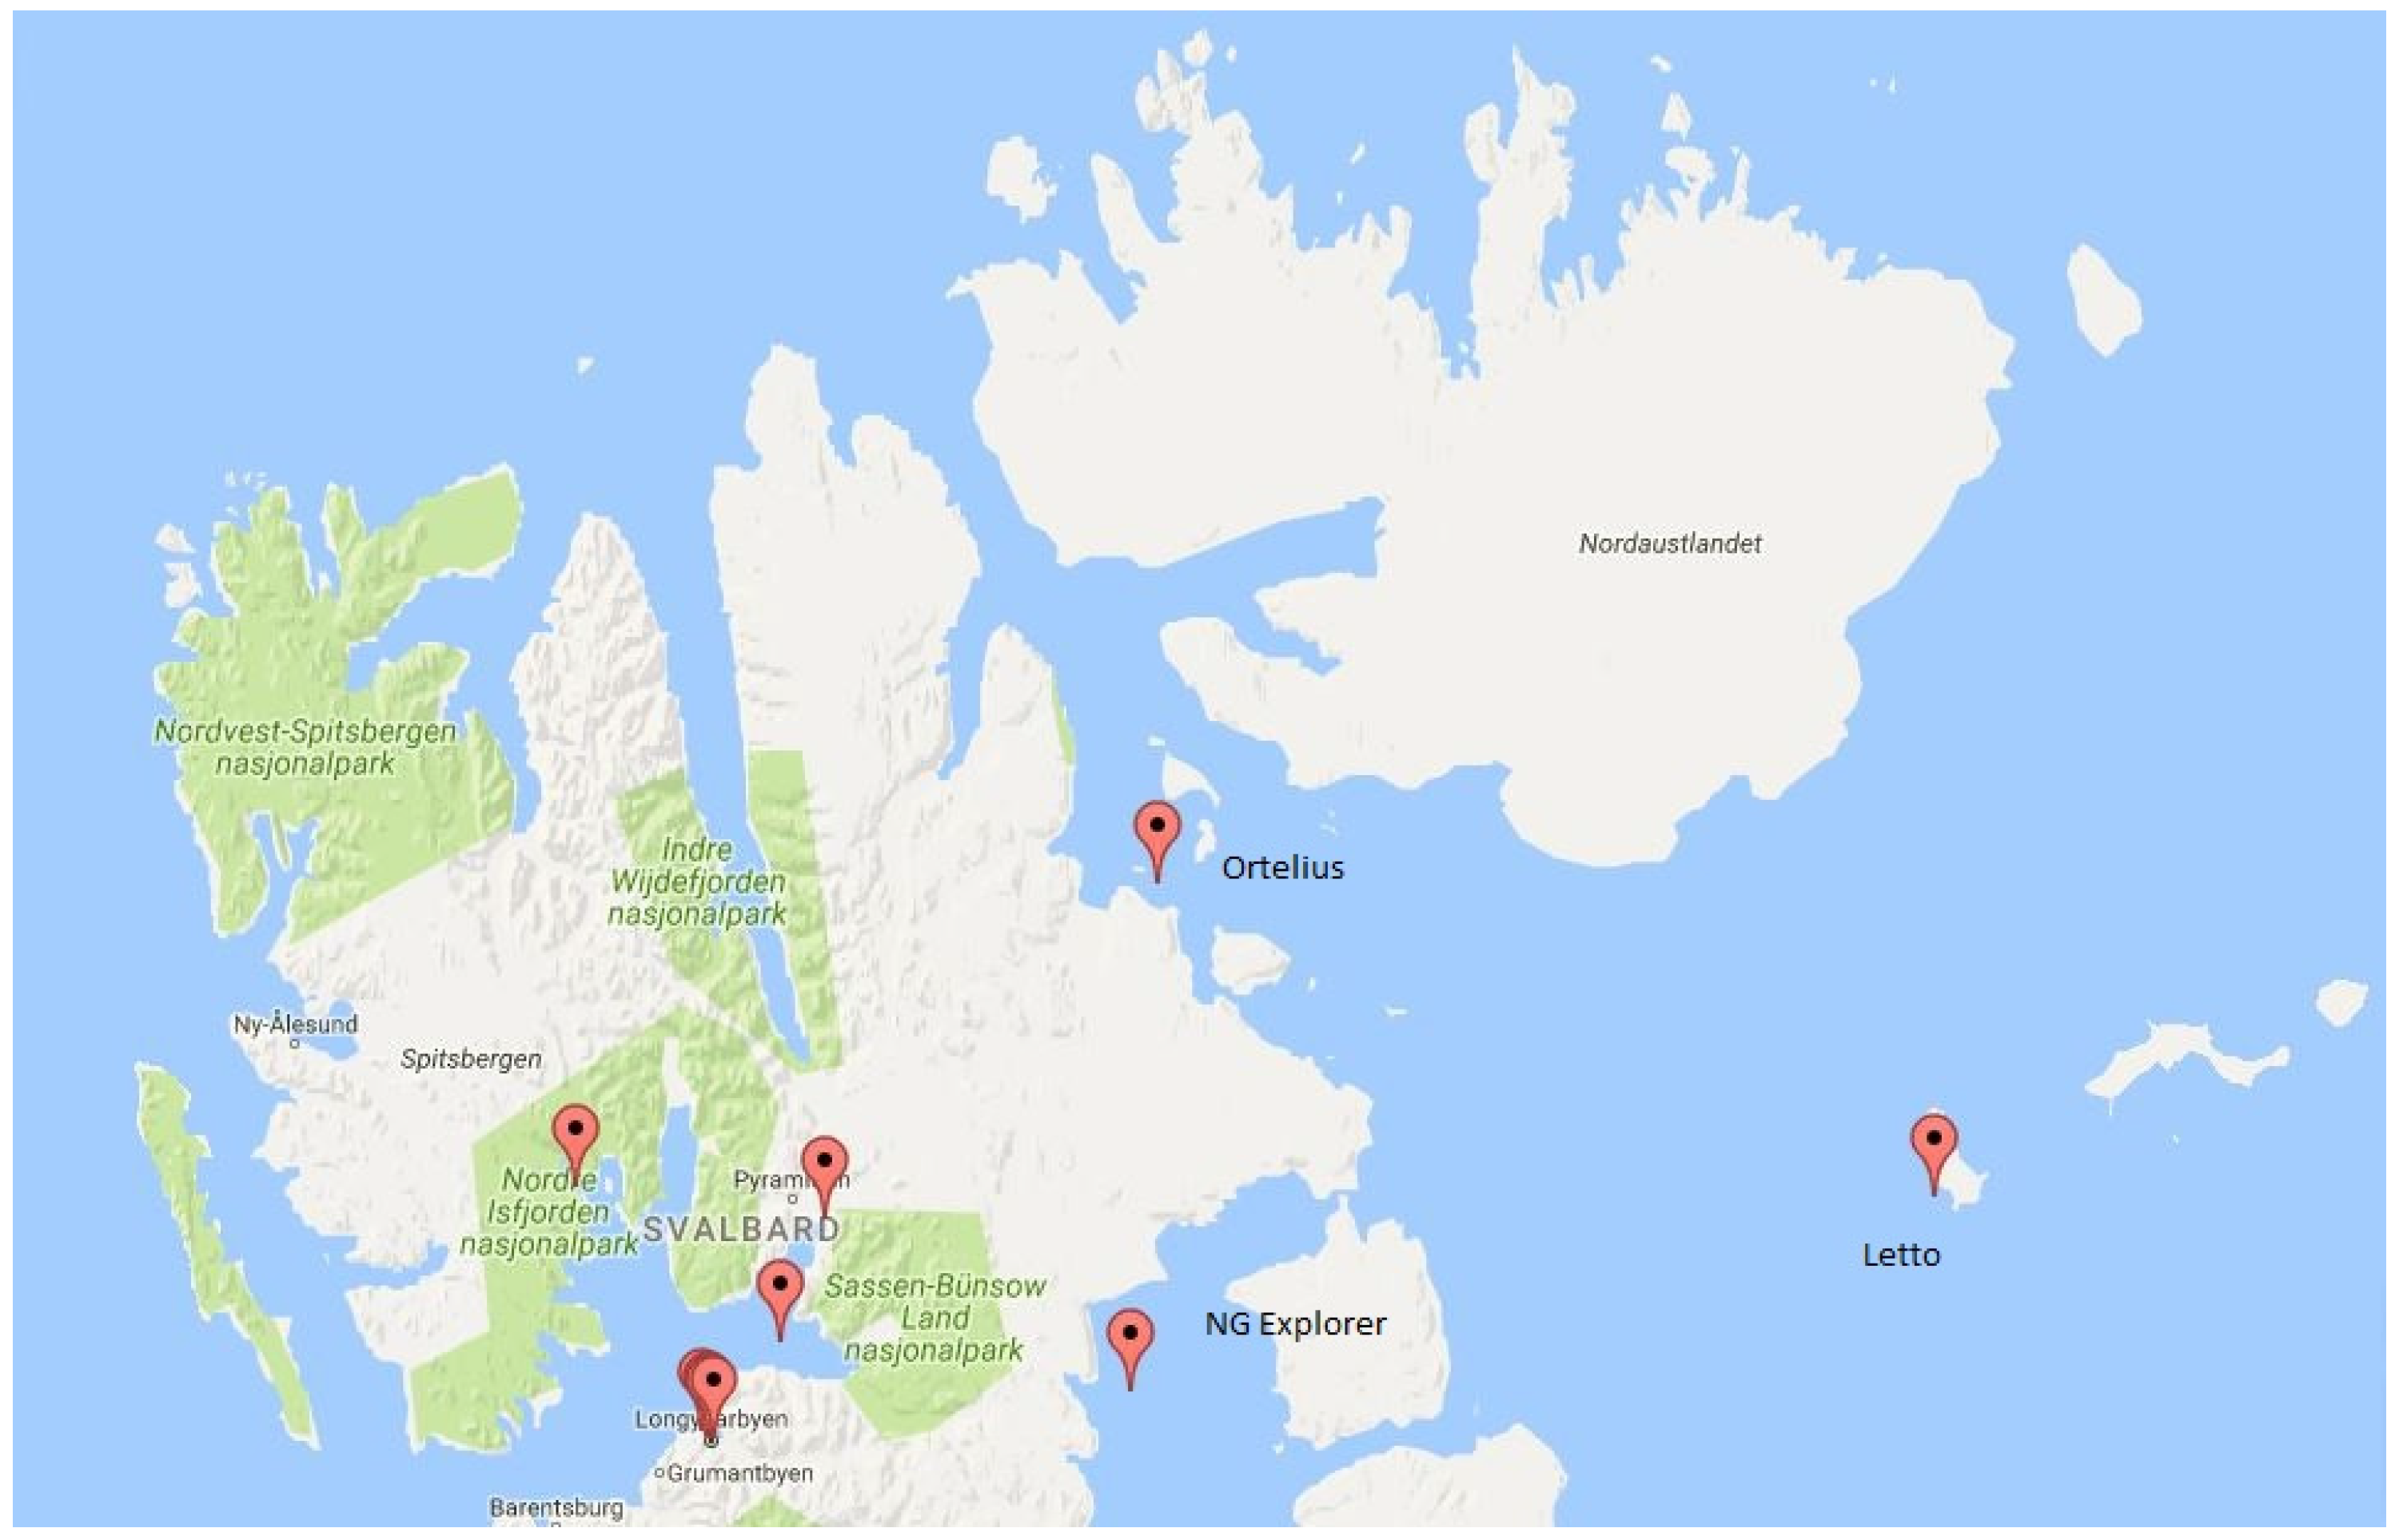
Figure 2 and Figure 3 show the ships seen in the 10:35 and 12:12 UTC downloads. It should be noted that the vessels Stockholm and Sea Endurance are not seen in the 10:35 download, while the National Geographic Explorer and the Sea Endurance are not seen in the 12:12 UTC data (Table 4).
Four unique vessels were shining Class B transponders and transmitting AIS messages types 18 and 24. Figure 4 shows that all were located in the Isfjorden region on the west coast of Spitsbergen, and would probably not be able to support the Ortelius in a SAR operation.
4. Discussion
This case study shows that satellite-based AIS is a powerful tool in SAR operations in remote waters. The AISSat-1 satellite provided Norwegian authorities with data on the identity and position of vessels close to the ship that had run into problems. Fresh data were available just a few minutes after the Ortelius had reported the engine problems. The data sets show that there were four vessels in the vicinity that could assist in an emergency. The satellite orbits the Earth in approximately 100 min. The more satellites in orbit, the more frequent the updates. After the successful dual launch of NorSat-1 and -2 in July 2017, Norway has four polar orbiting satellites with AIS detectors.
It also shows that data from more than one pass should be studied to provide situational awareness. A ship is in the satellite’s shadow when it is sailing behind an island, mountain or in a fjord and its transmissions will not be recorded. It may also be outside the footprint of the satellite, and its transmissions are hence not heard. The risk of losing vessels this way will decrease with the number of satellites carrying AIS receivers.
Not all ships may be suited to participate in a SAR operation. The International Code for Ships operating in Polar Waters (Polar Code) will enter force on 1 January 2017 [14]. The Code defines three categories of ships to operate in Polar waters:
Category A ship means a ship designed for operation in polar waters in at least medium first-year ice, which may include old ice inclusions.
Category B ship means a ship not included in category A, designed for operation in polar waters in at least thin first-year ice, which may include old ice inclusions.
Category C ship means a ship designed to operate in open water or in ice conditions less severe than those included in categories A and B.
It also defines ice conditions:
First-year ice means sea ice of not more than one winter growth developing from young ice with thickness from 0.3 to 2.0 m.
Medium first-year ice means first-year ice of 70 cm to 120 cm thickness.
Old ice means sea ice which has survived at least one summer’s melt; typical thickness up to 3 m or more. It is subdivided into residual first-year ice, second-year ice and multi-year ice.
Thin first-year ice means first-year ice 30 cm to 70 cm thick.
The ice conditions in the waters surrounding the troubled vessel can be known by analysing satellite images [15], observations from Maritime Patrol Aircraft or from the vessel itself. Norwegian authorities receive data from the European Sentinel Earth Observation satellites and Canadian Radarsat satellites. The Sentinel satellites are equipped with optical and radar sensors. In case of a real emergency, one can safely assume that the Norwegian Air Force would task at least one of its P-3 Orion (soon P-8 Poseidon) Maritime Patrol Aircraft to the area to monitor the situation.
The ice and weather conditions in the SAR area may be so harsh that the RCC, for safety reasons, decide not to send any of the vessels in the vicinity of the ship in trouble to support it if they do not have a sufficient ice class. The identity of a vessel can be determined from its MMSI number, which is available in all AIS transmissions. The Regional Coordination Centres should have access to a data base where both the MMSI numbers and ice category are listed. This is a simple and efficient way to prevent Category C ships being tasked in SAR operations that require Category A or B vessels.
Not all waters along the coasts of Svalbard have been properly mapped [16]. Some waters along the south-eastern coast of Spitsbergen and the fjords of Nordaustlandet should be mapped better. A RCC should not send a vessel towards such dangerous areas.
In a real scenario, the Letto would probably be the first vessel to reach the Ortelius at the Vaigatt Islands. The distance is approximately 150 km, or 80 nautical miles. If sailing with a speed of 12 knots, it should reach the Ortelius in 7 h. The position in Figure 1 of the Sea Endurance is approximately 200 km (110 nm) from the Ortelius. The closest vessel is the NG Explorer, located near Dunérbukta on the east coast of Spitsbergen. To reach the Ortelius, the NG Explorer would have to go through the narrow Heley Sound between Spitsbergen and Barents Island, through the Freeman Sound between the Barents Island and the Edge Island, or sail the long journey south of the Edge Island.
5. Conclusions
This paper shows that satellite-based AIS is a powerful tool for coordinating SAR operations, especially in remote areas like the Arctic and Antarctica where land-based AIS is rare or non-existent. In this case, fresh position data were received just a few minutes after the Ortelius declared her emergency. This provided a good situational awareness. The analysis shows that not all ships appear in the data sets. It is hence recommended for RCC staff in future similar situations to go through recent data sets to verify that all vessels in the region of interest are known.
By using ice data from, e.g., radar satellites, an RCC can also determine if conditions make it unsafe for a vessel to participate in a SAR operation.
Acknowledgments
The author wishes to thank Øystein Helleren at Forsvarets Forskningsinstitutt for providing the data sets, and Befalets Fellesorganisasjon for a generous financial grant.
Conflicts of Interest
The author declares no conflict of interest.
References
- Ylvisåker, L.N. Slept til byen. 2016. Available online: http://svalbardposten.no/nyheter/slept-til-byen/19.7240 (accessed on 1 July 2017).
- The Governor of Svalbard. Ekspedisjonsskip Slept til Longyearbyen av Polarsyssel (Press Release). Available online: http://www.sysselmannen.no/Nyheter/Ekspedisjonsskip-slept-til-Longyearbyen-av-Polarsyssel-/ (accessed on 1 July 2017).
- Engås, C. Passasjerskip har motorhavari i Hinlopenstretet. Svalbardposten (Internet). 2016. Available online: http://svalbardposten.no/nyheter/passasjerskip-har-motorhavari-i-hinlopenstretet/19.7238 (accessed on 1 July 2017).
- International Maritime Organization. AIS transponders. Available online: http://www.imo.org/en/OurWork/Safety/Navigation/Pages/AIS.aspx (accessed on 1 July 2017).
- Arctic Council. Agreement on cooperation on aeronautical and maritime search and rescue in the Arctic. In Proceedings of the Ministerial Meeting, Nuuk, Greenland, 12 May 2011. [Google Scholar]
- Aase, J.G.; Jabour, J. Can monitoring maritime activities in the European High Arctic by satellite-based Automatic Identification System enhance polar search and rescue? Polar J. 2015, 5, 1–17. [Google Scholar] [CrossRef]
- Norwegian Space Centre. Norway’s Satellites. Available online: http://www.romsenter.no/eng/Norway-in-Space/Norway-s-Satellites (accessed on 24 April 2017).
- AISSat-1 Satellite Details. Available online: http://www.n2yo.com/satellite/?s=36797 (accessed on 24 April 2017).
- ITU. Technical Characteristics for an Automatic Identification System Using Time Division Multiple Access in the VHF Maritime Mobile Frequency Band; ITU: Geneva, Switzerland, 2014. [Google Scholar]
- Clazzer, A.M.; Berioli, M.; Lazaro Blasco, F. On the Characterization of AIS Traffic at the Satellite 2014:(1 p.). Available online: https://login.ezproxy.utas.edu.au/login?url=http://search.ebscohost.com/login.aspx?direct=true&db=edseee&AN=edseee.6964425&site=eds-live (accessed on 2 July 2017).
- Shelmerdine, R.L. Teasing out the detail: How our understanding of marine AIS data can better inform industries, developments, and planning. Mar Policy 2015, 54, 17–25. [Google Scholar] [CrossRef]
- Security NC-USDoH. Types of AIS Updated 10/21/2015. Available online: http://www.navcen.uscg.gov/?pageName=typesAIS (accessed on 1 July 2017).
- Security NC-USDoH. Class A AIS Position Reports (Messages 1, 2 and 3) Updated 09/12/2014. Available online: http://www.navcen.uscg.gov/?pageName=AISMessagesA (accessed on 1 July 2017).
- International Maritime Organization. International Code for Ships Operating in Polar Waters (Polar Code); International Maritime Organization: London, UK, 2014. [Google Scholar]
- English, J.; Hewitt, R.; Power, D.; Tunaley, J. (Eds.) ICE-SAIS—Space-based AIS and SAR for improved Ship and Iceberg Monitoring. In Proceedings of the 2013 IEEE Radar Conference (RadarCon13), Ottawa, ON, Canada, 29 April–3 May 2013. [Google Scholar]
- SINTEF. Analysis of Maritime Safety Management in the High North (MARSAFE); SINTEF: Trondheim, Norway, 2010. [Google Scholar]
Figure 1.
The location of the vessels seen in the 8:58 UTC download plotted in Google Maps. This was the most recent dataset available when the Ortelius reported engine problems.
Figure 1.
The location of the vessels seen in the 8:58 UTC download plotted in Google Maps. This was the most recent dataset available when the Ortelius reported engine problems.
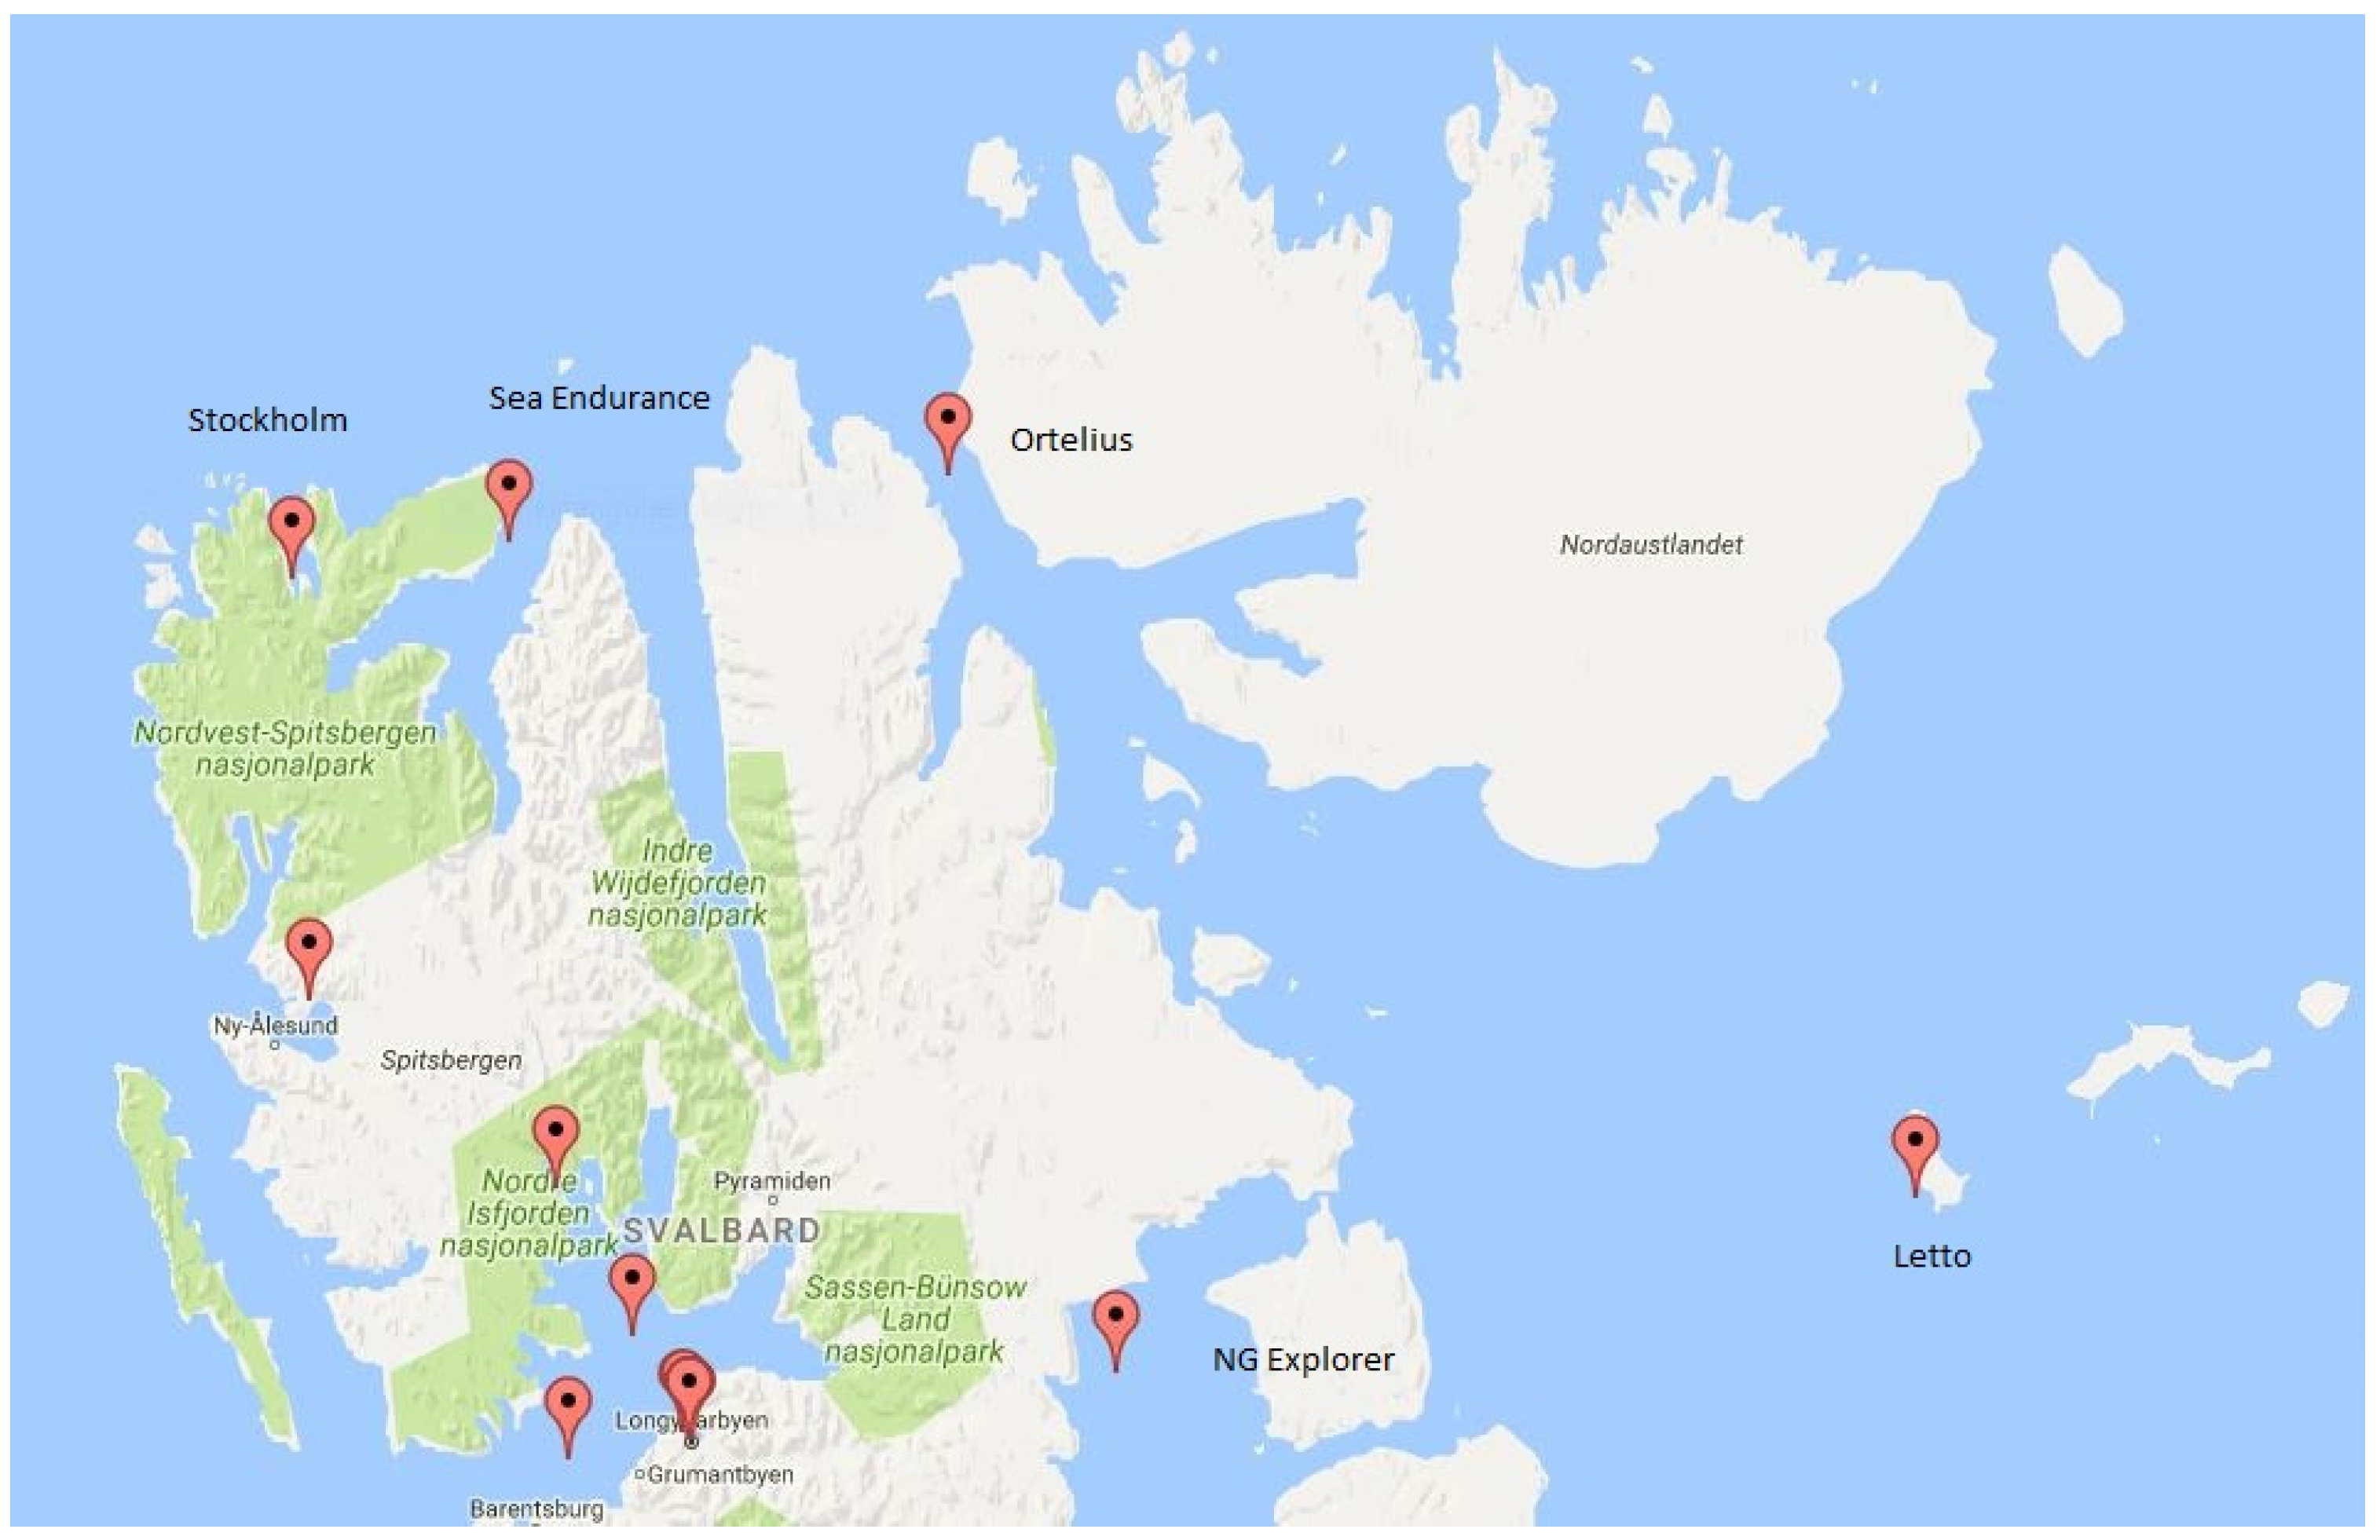
Figure 2.
The vessels seen in the 10:35 UTC download. This was the first received data set after the Ortelius reported engine problems. The Ortelius has moved significantly from the position in Figure 1.
Figure 2.
The vessels seen in the 10:35 UTC download. This was the first received data set after the Ortelius reported engine problems. The Ortelius has moved significantly from the position in Figure 1.

Figure 3.
The vessels seen in the 12:12 UTC download. Note that neither the Sea Endurance nor the National Geographic Explorer are seen in this data set.
Figure 3.
The vessels seen in the 12:12 UTC download. Note that neither the Sea Endurance nor the National Geographic Explorer are seen in this data set.
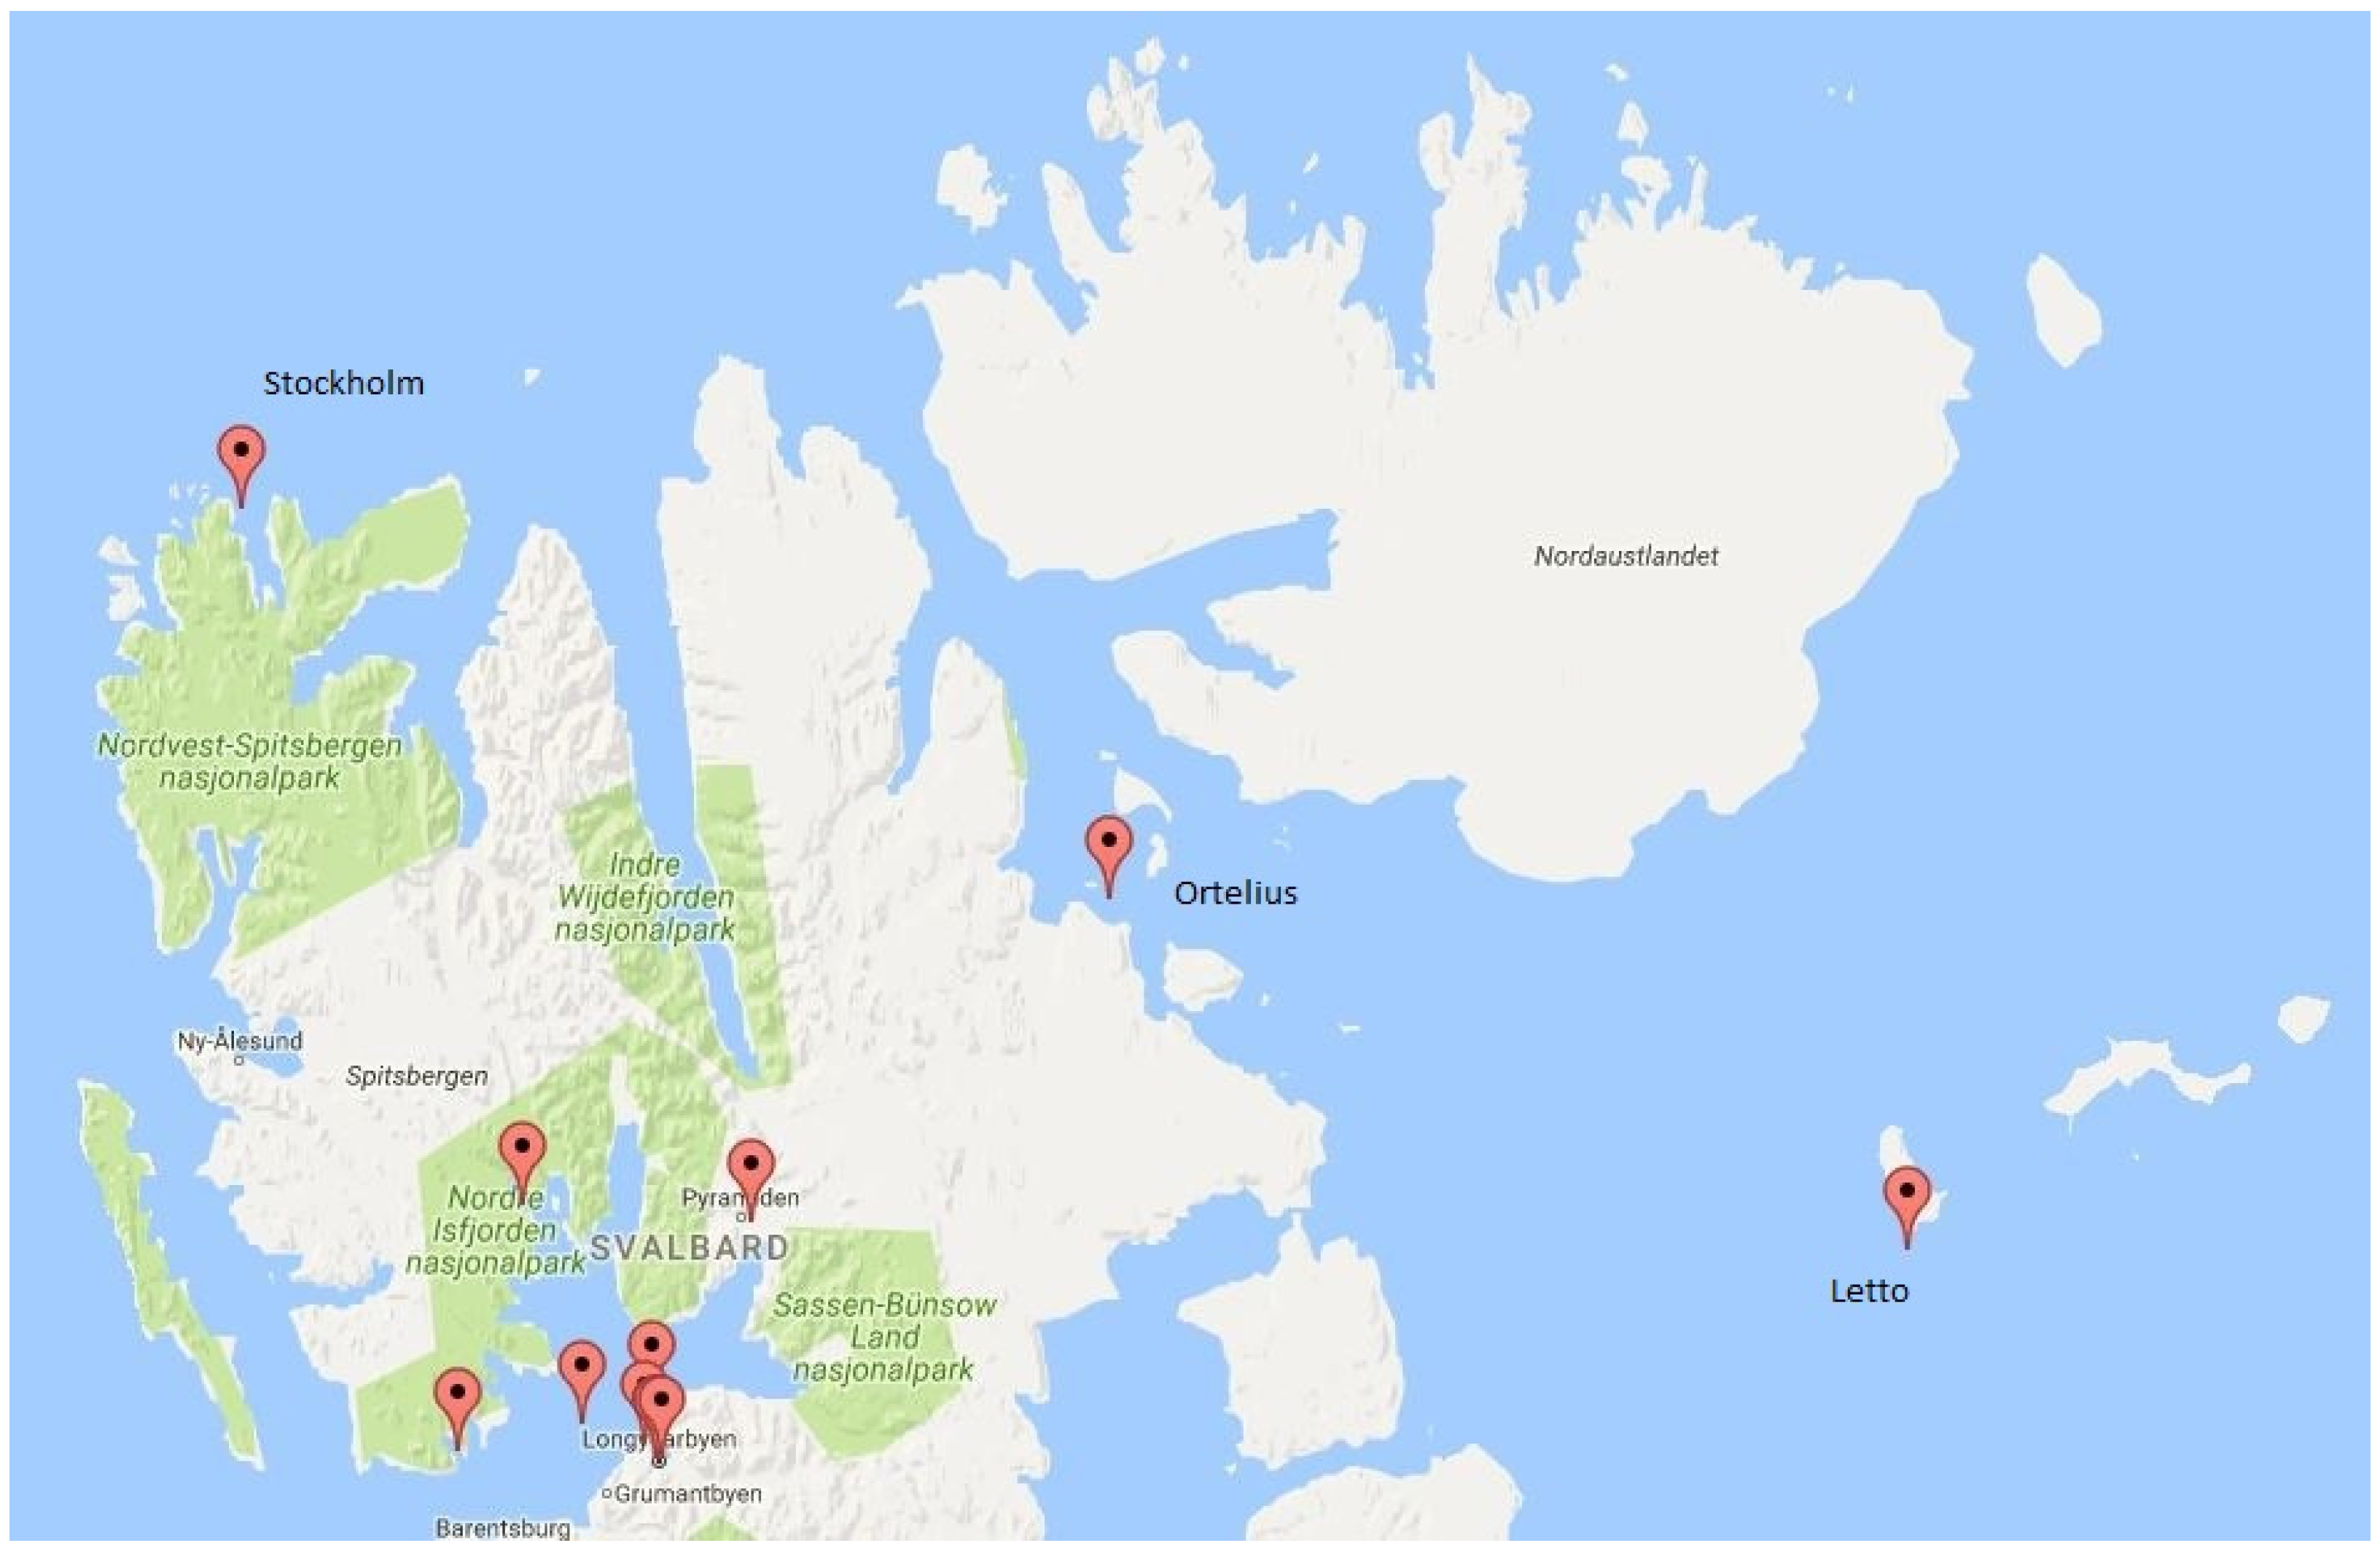
Figure 4.
Location of vessels with Class B AIS transponders


Table 1.
Table showing the number of Type A and B transponders seen in the 200 km area of interest surrounding the Ortelius in passes on 3 June 2016.
Table 1.
Table showing the number of Type A and B transponders seen in the 200 km area of interest surrounding the Ortelius in passes on 3 June 2016.
| Ground Time (J2000-Format) | Ground Time (UTC) | Number of Class A Transponders | Number of Class B Transponders |
|---|---|---|---|
| 518210407 | 07:19:03 | 17 | 0 |
| 518216384 | 08:58:40 | 19 | 0 |
| 518222190 | 10:35:26 | 17 | 0 |
| 518227993 | 12:12:11 | 15 | 0 |
| 518233702 | 13:47:20 | 14 | 3 |
| 518239380 | 15:21:57 | 15 | 0 |
| 518245043 | 16:56:19 | 15 | 2 |
| 518250739 | 18:31:15 | 15 | 0 |
| 518256482 | 20:06:58 | 10 | 0 |
| 518262252 | 21:43:08 | 16 | 0 |
| 518268049 | 23:19:45 | 15 | 1 |
| 518273856 | 00:56:32 | 13 | 0 |
Table 2.
Vessels seen in the 8:58 UTC download from AISSat-1 on 3 June 2016. The positions are plotted in Figure 1.
Table 2.
Vessels seen in the 8:58 UTC download from AISSat-1 on 3 June 2016. The positions are plotted in Figure 1.
| J2000 Time | Ground Time | MMSI | Ship Name | Latitude (° N) | Longitude (° E) |
|---|---|---|---|---|---|
| 518197774 | 518216384 | 257716000 | Norvarg | 78.194901667 | 14.518225 |
| 518197769 | 518216384 | 257785000 | Norbjorn | 78.2271 | 15.626295 |
| 518197743 | 518216384 | 258499000 | Polargirl | 78.228463333 | 15.607216667 |
| 518197769 | 518216384 | 259383000 | Kvalstein | 78.415078333 | 15.091848333 |
| 518197716 | 518216384 | 308198000 | Sea Endurance | 79.755633333 | 14.0061 |
| 518197797 | 518216385 | 209778000 | Ortelius | 79.857116667 | 17.901213333 |
| 518197874 | 518216385 | 228016600 | Polaris I | 79.000926667 | 12.226958333 |
| 518197813 | 518216385 | 231219000 | Billefjord | 78.228133333 | 15.609723333 |
| 518197966 | 518216385 | 257564000 | Polarsyssel | 78.243046667 | 15.542806667 |
| 518197919 | 518216385 | 257958900 | Elling Carlsen | 78.228358333 | 15.607108333 |
| 518197813 | 518216385 | 258301500 | Longyear 2 | 78.229455 | 15.595758333 |
| 518197808 | 518216385 | 265339000 | Origo | 78.675666667 | 14.424033333 |
| 518197969 | 518216385 | 265472000 | Stockholm | 79.694685 | 12.072846667 |
| 518197840 | 518216385 | 265511830 | Malmo | 78.228395 | 15.63347 |
| 518197817 | 518216385 | 309336000 | NG Explorer | 78.349136667 | 19.403083333 |
| 518203825 | 518216386 | 230359000 | Letto | 78.66142 | 26.515886667 |
| 518203679 | 518216386 | 246337000 | Antigua | 78.229641667 | 15.599933333 |
| 518203756 | 518216386 | 259560000 | Aurora Explorer | 78.228448333 | 15.606318333 |
| 518215390 | 518216388 | 982575641 | Munin | 78.243265 | 15.545936667 |
Table 3.
Vessels seen in the 10:35 UTC download from AISSat-1 on 3 June 2016. The positions are plotted in Figure 2.
Table 3.
Vessels seen in the 10:35 UTC download from AISSat-1 on 3 June 2016. The positions are plotted in Figure 2.
| J2000 Time | Ground Time | MMSI | Ship Name | Latitude (° N) | Longitude (° E) |
|---|---|---|---|---|---|
| 518215514 | 518222190 | 231219000 | Billefjord | 78.40383 | 16.231346667 |
| 518215513 | 518222190 | 257716000 | Norvarg | 78.234521667 | 15.58116 |
| 518215513 | 518222190 | 258301500 | Longyear 2 | 78.229436667 | 15.595971667 |
| 518215515 | 518222190 | 259383000 | Kvalstein | 78.238475 | 15.600005 |
| 518215514 | 518222190 | 265339000 | Origo | 78.6755 | 14.423383333 |
| 518215514 | 518222190 | 309336000 | NG Explorer | 78.312518333 | 19.353716667 |
| 518215520 | 518222190 | 982575641 | Munin | 78.24277 | 15.543858333 |
| 518221167 | 518222192 | 209778000 | Ortelius | 79.195583333 | 19.60105 |
| 518221271 | 518222192 | 230359000 | Letto | 78.661575 | 26.517788333 |
| 518221264 | 518222192 | 231219000 | Billefjord | 78.621325 | 16.639601667 |
| 518221318 | 518222192 | 246337000 | Antigua | 78.229663333 | 15.600031667 |
| 518221376 | 518222192 | 257958900 | Elling Carlsen | 78.228355 | 15.60712 |
| 518221283 | 518222192 | 258499000 | Polargirl | 78.228463333 | 15.607218333 |
| 518221340 | 518222192 | 265511830 | Malmo | 78.228398333 | 15.633618333 |
Table 4.
Vessels seen in the 12:12 UTC download from AISSat-1 on 3 June 2016. The positions are plotted in Figure 3.
Table 4.
Vessels seen in the 12:12 UTC download from AISSat-1 on 3 June 2016. The positions are plotted in Figure 3.
| J2000 Time | Ground Time | MMSI | Ship Name | Latitude (° N) | Longitude (° E) |
|---|---|---|---|---|---|
| 518221298 | 518227993 | 265339000 | Origo | 78.675481667 | 14.423423333 |
| 518226957 | 518227995 | 209778000 | Ortelius | 79.195453333 | 19.60193 |
| 518227003 | 518227995 | 230359000 | Letto | 78.59905 | 26.655235 |
| 518227003 | 518227995 | 231219000 | Billefjord | 78.64916 | 16.435135 |
| 518227078 | 518227995 | 246337000 | Antigua | 78.229676667 | 15.599943333 |
| 518227021 | 518227995 | 257564000 | Polarsyssel | 78.257716667 | 15.496866667 |
| 518227078 | 518227995 | 257785000 | Norbjorn | 78.227035 | 15.626483333 |
| 518227136 | 518227995 | 257958900 | Elling Carlsen | 78.228366667 | 15.607118333 |
| 518227103 | 518227995 | 258301500 | Longyear 2 | 78.229458333 | 15.59592 |
| 518227122 | 518227995 | 258499000 | Polargirl | 78.228461667 | 15.607258333 |
| 518226988 | 518227995 | 259383000 | Kvalstein | 78.290006667 | 14.942508333 |
| 518227008 | 518227995 | 259560000 | Aurora Explorer | 78.327628333 | 15.561741667 |
| 518226971 | 518227995 | 265472000 | Stockholm | 79.824723333 | 11.941258333 |
| 518227261 | 518227995 | 265509140 | Freya | 78.243206667 | 13.846441667 |
| 518227120 | 518227995 | 265511830 | Malmo | 78.228373333 | 15.633635 |
© 2017 by the author. Licensee MDPI, Basel, Switzerland. This article is an open access article distributed under the terms and conditions of the Creative Commons Attribution (CC BY) license (http://creativecommons.org/licenses/by/4.0/).
Share and Cite
MDPI and ACS Style
Aase, J.G. The Ortelius Incident in the Hinlopen Strait—A Case Study on How Satellite-Based AIS Can Support Search and Rescue Operations in Remote Waters. Resources 2017, 6, 35. https://doi.org/10.3390/resources6030035
AMA Style
Aase JG. The Ortelius Incident in the Hinlopen Strait—A Case Study on How Satellite-Based AIS Can Support Search and Rescue Operations in Remote Waters. Resources. 2017; 6(3):35. https://doi.org/10.3390/resources6030035
Chicago/Turabian StyleAase, Johnny Grøneng. 2017. "The Ortelius Incident in the Hinlopen Strait—A Case Study on How Satellite-Based AIS Can Support Search and Rescue Operations in Remote Waters" Resources 6, no. 3: 35. https://doi.org/10.3390/resources6030035
Note that from the first issue of 2016, this journal uses article numbers instead of page numbers. See further details here.