
A Standard Characterization Methodology for Respirable Coal Mine Dust Using SEM-EDX


Abstract
:1. Introduction
2. Description of Developed Dust Characterization Method
2.1. Particle Characteristics of Interest
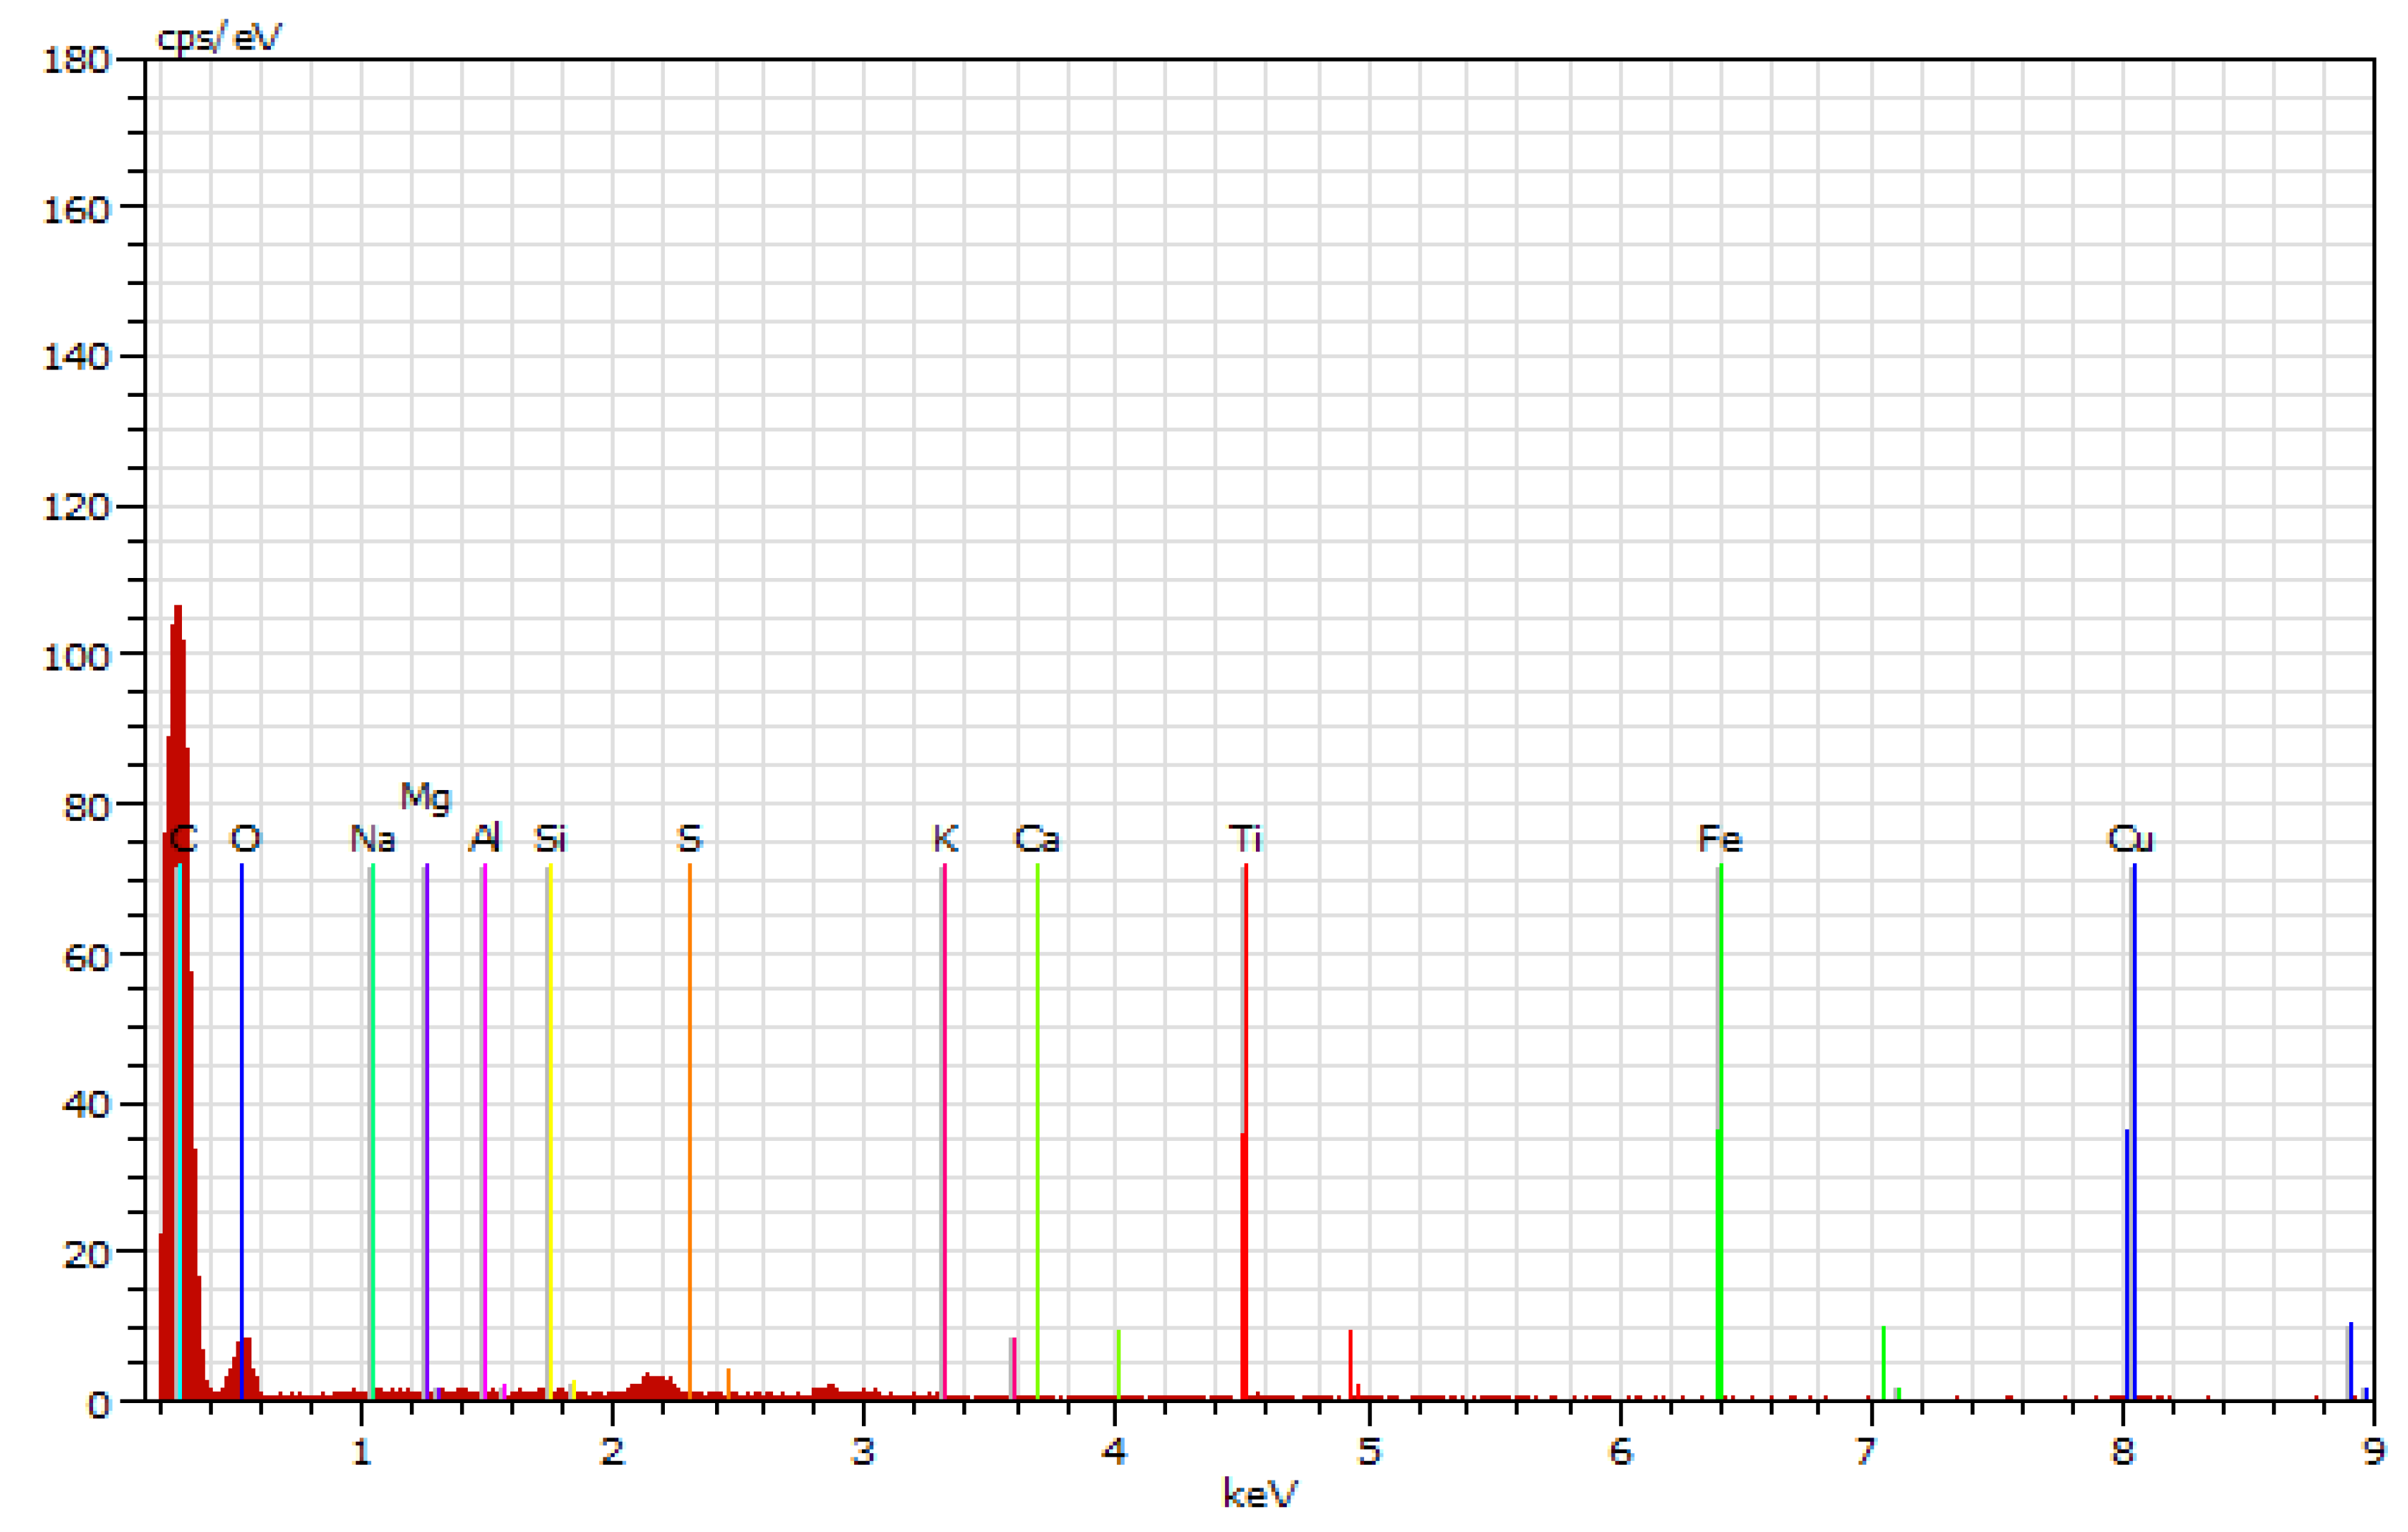
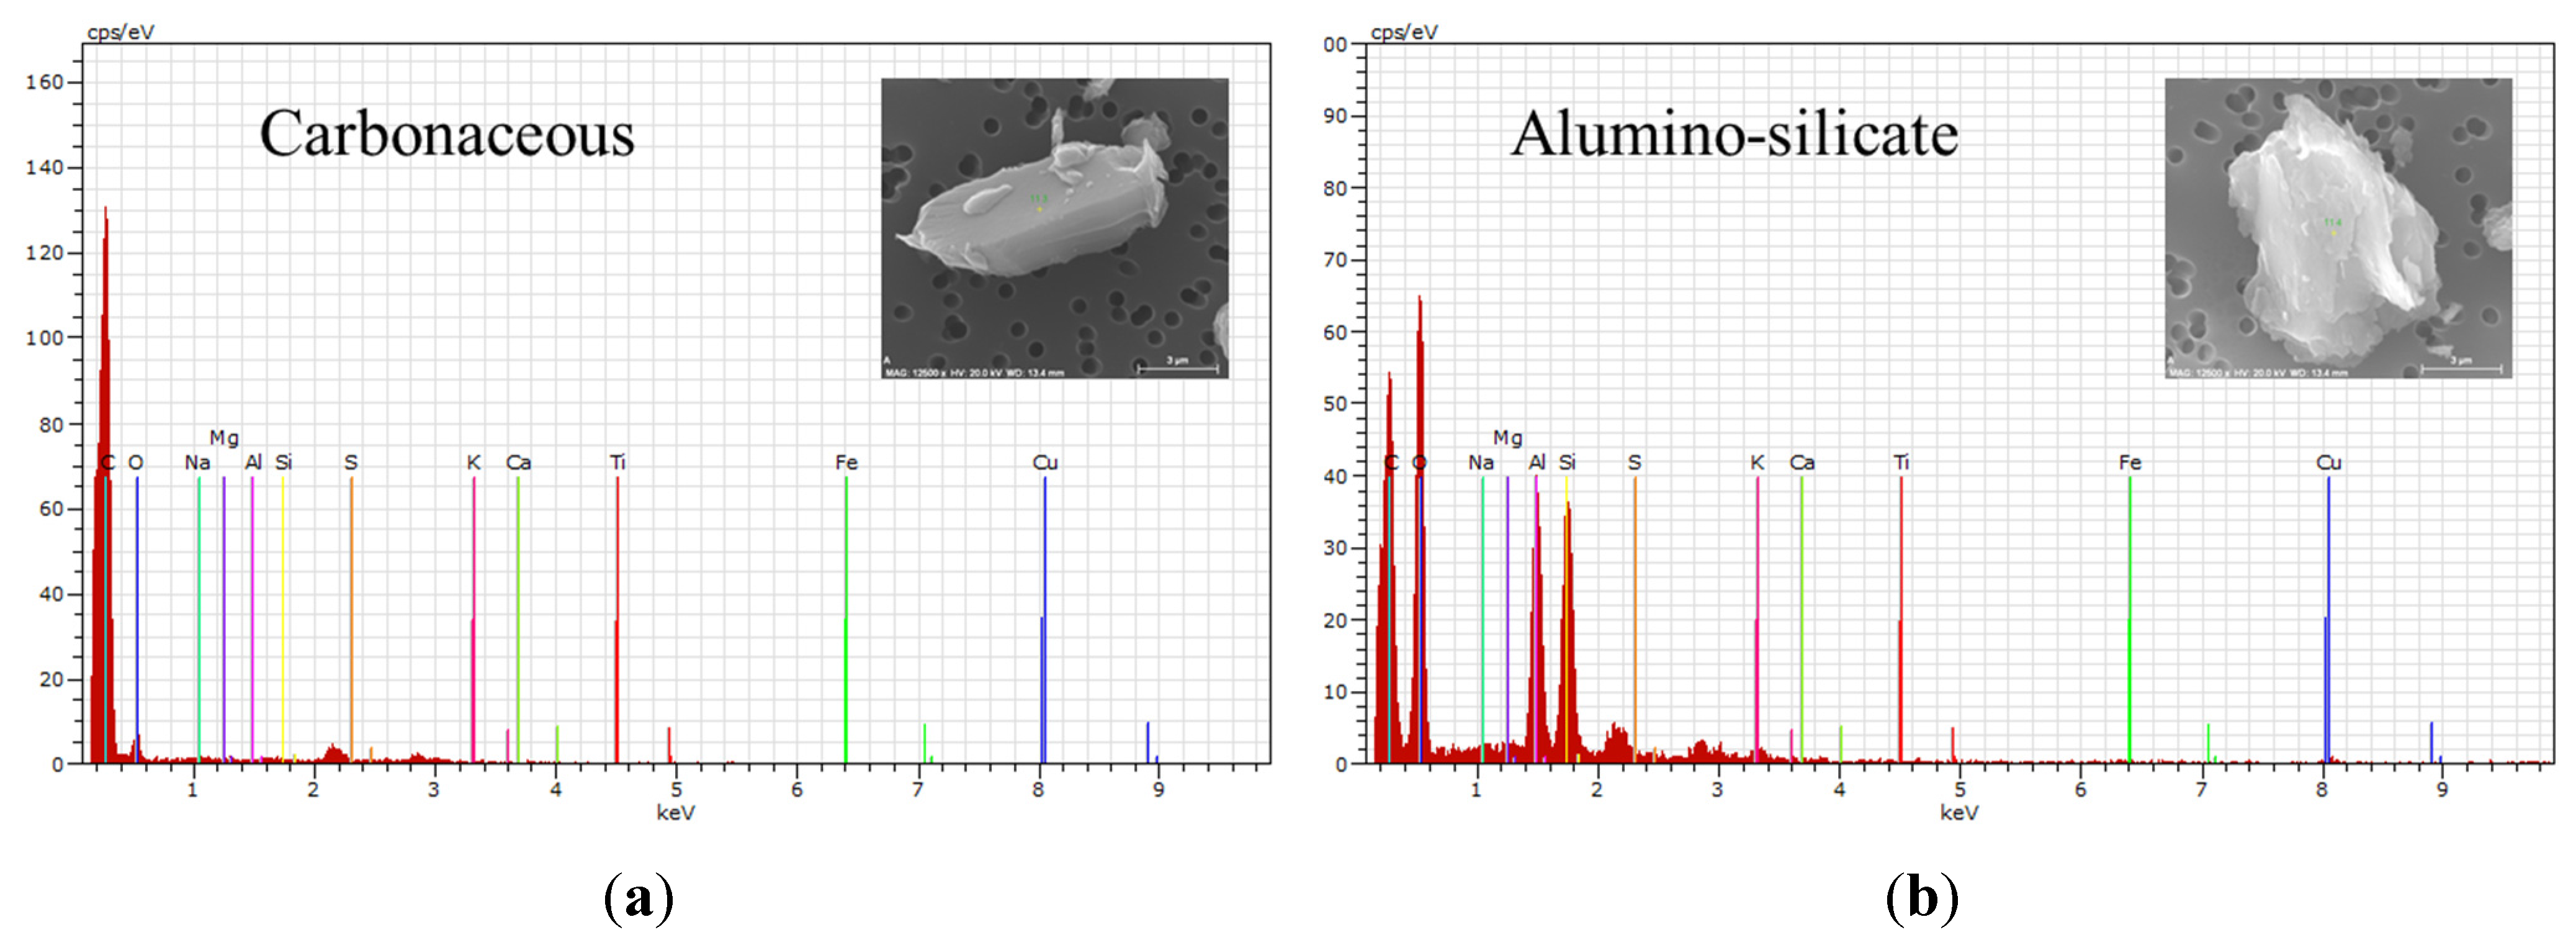
2.1.1. Composition

| Dust Category | Example Mineralogy | Parameters for Classification (Atomic % Equivalents) | Real Time Classification (Raw Peak Heights (Cps/eV)) |
|---|---|---|---|
| Carbonaceous | Coal | Carbon ≥ 70% Oxygen ≤ 30% | Carbon ≥ 80 Oxygen ≤ 20 |
| Mixed Carbonaceous | Very thin clay minerals, or clay minerals with some carbon content | 4% > Silicon ≥ 2% 4% > Aluminum ≥ 2% Carbon > 70% Oxygen < 20% | 20 > Silicon ≥ 10 20 > Aluminum ≥ 10 Carbon ≥ 80 Oxygen ≤ 20 |
| Alumino-silicate | Clay minerals, feldspars | Silicon ≥ 4% Aluminum ≥ 3% Oxygen > 20% | Silicon ≥ 20 Aluminum ≥ 20 Oxygen > 20 |
| Quartz | Crystalline silica | Silicon ≥ 5% Oxygen > 20% | Silicon ≥ 20 Oxygen > 20 |
| Carbonate | Calcite, dolomite | Calcium/Magnesium ≥ 5% Oxygen > 20% Carbon < 70% | Calcium/Magnesium ≥ 20 Oxygen > 20 Carbon < 80 |
| Heavy Mineral | Pyrite, titanium oxides | Iron/Titanium/Aluminum ≥ 5% Oxygen > 20% | Iron/Titanium/Aluminum ≥ 20 Oxygen > 20 |
| Other | Diesel particulates, etc. | Does not fit any of the above | Does not fit any of the above |


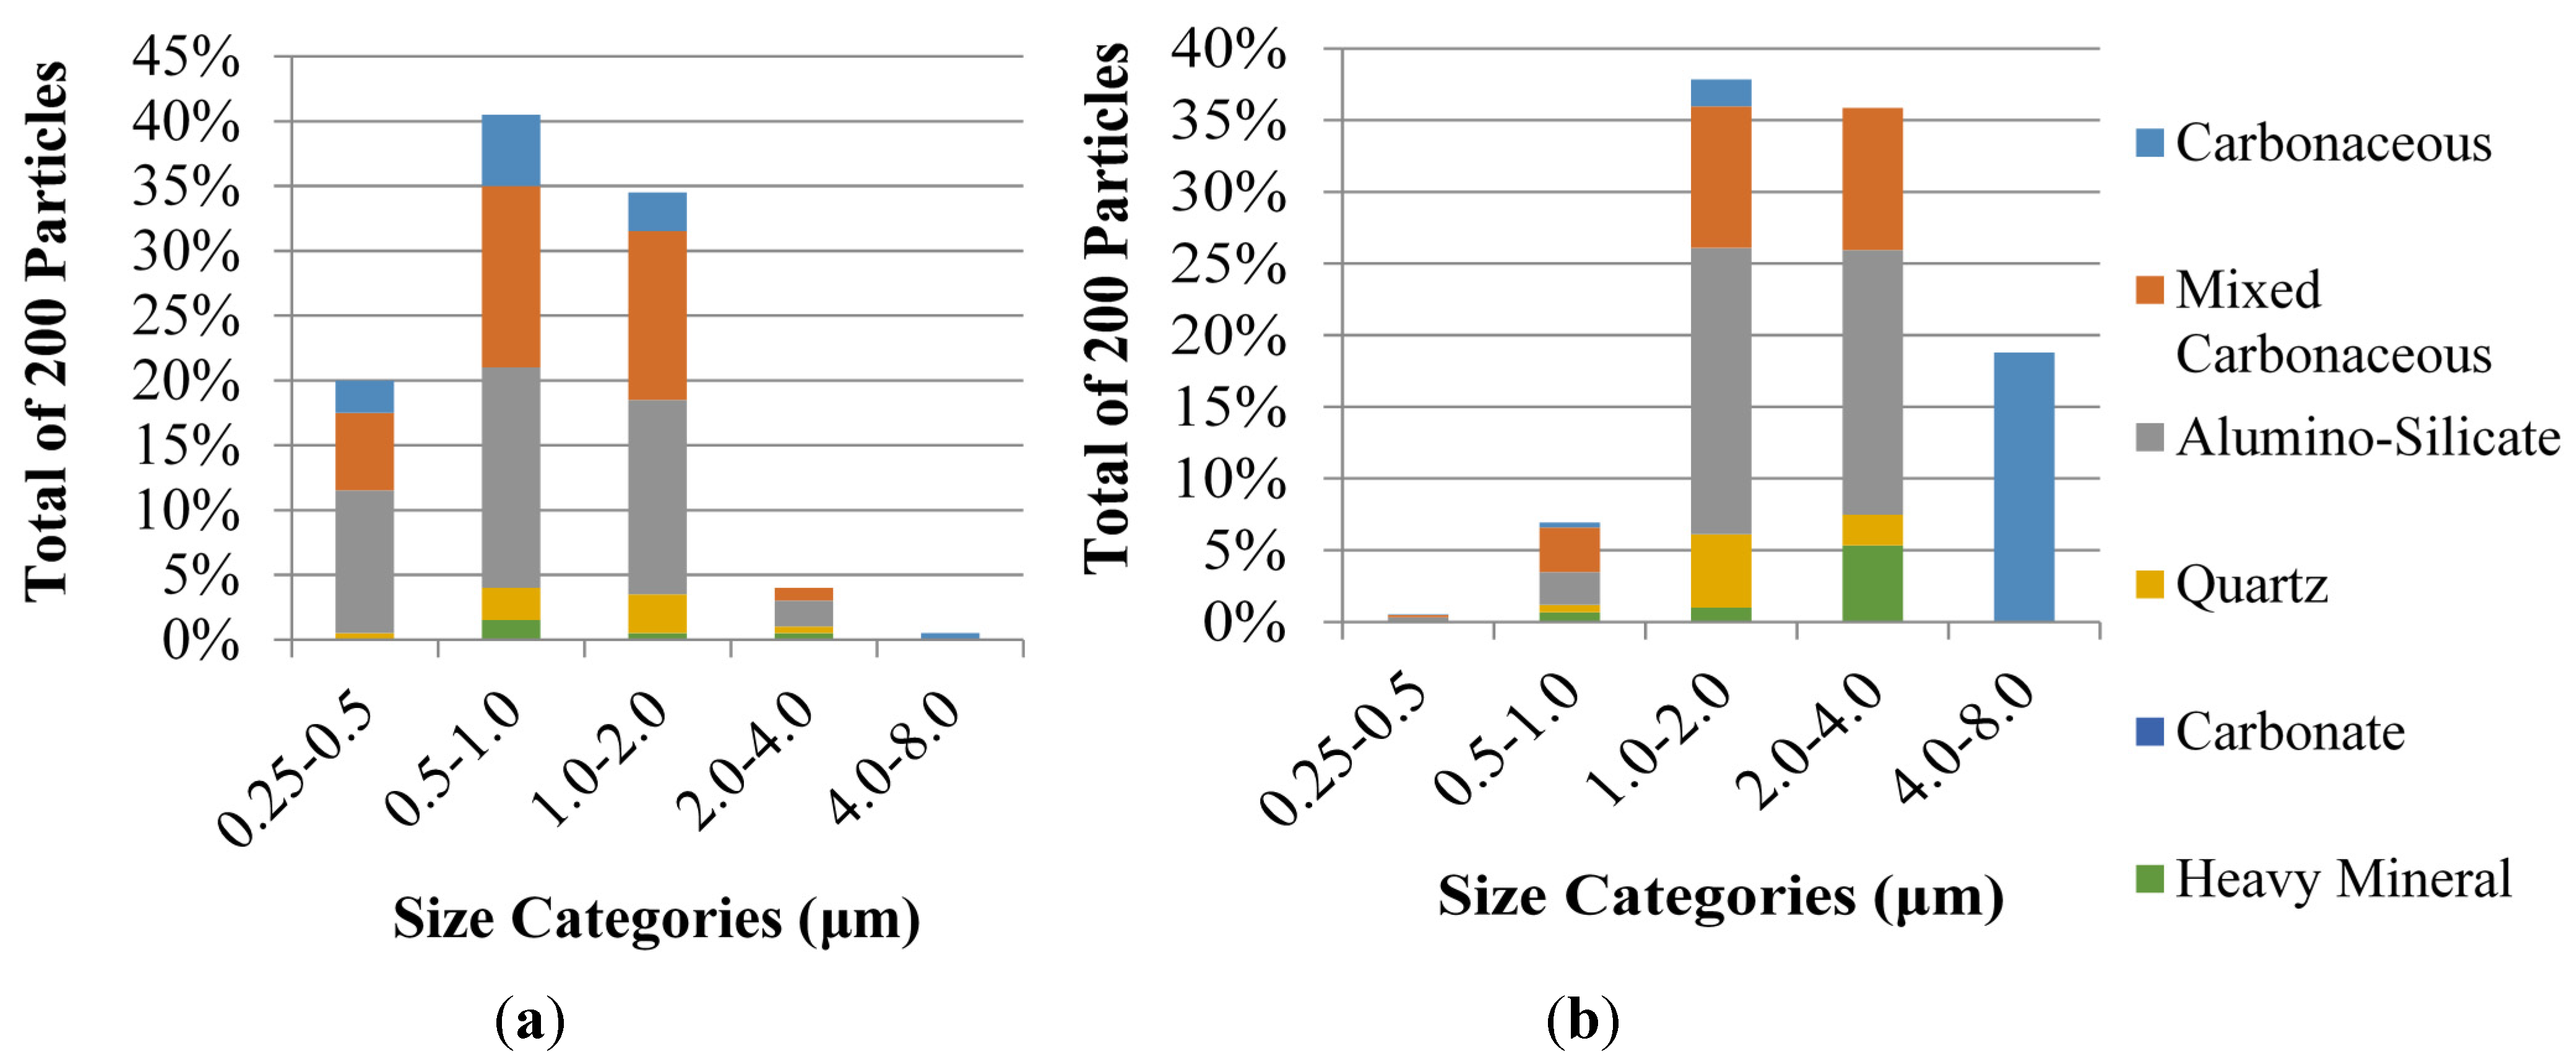
2.1.2. Dimensions
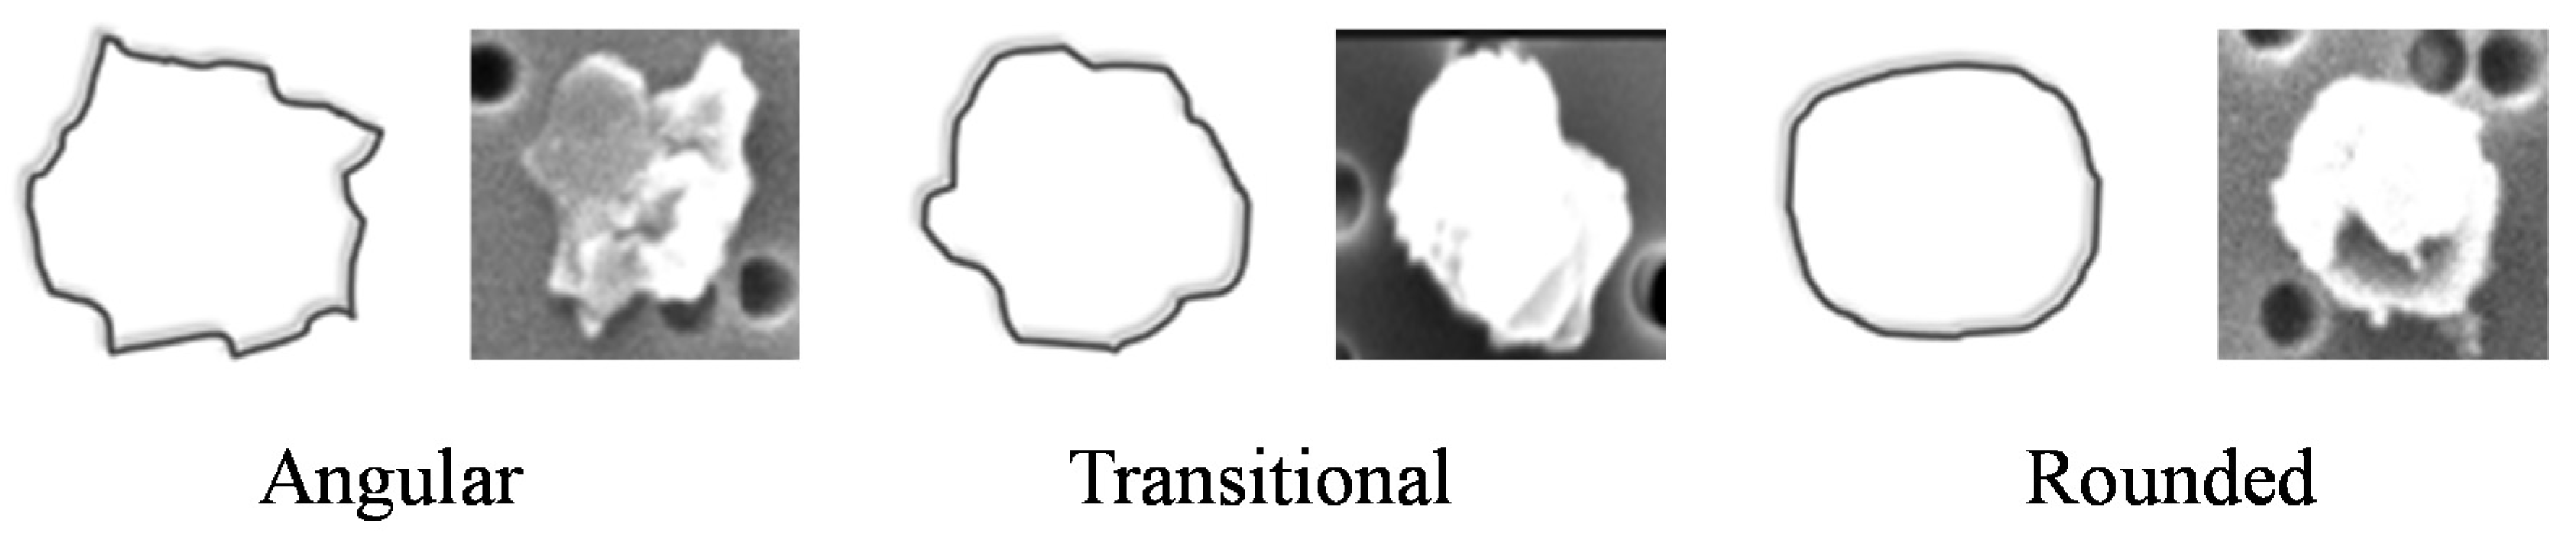
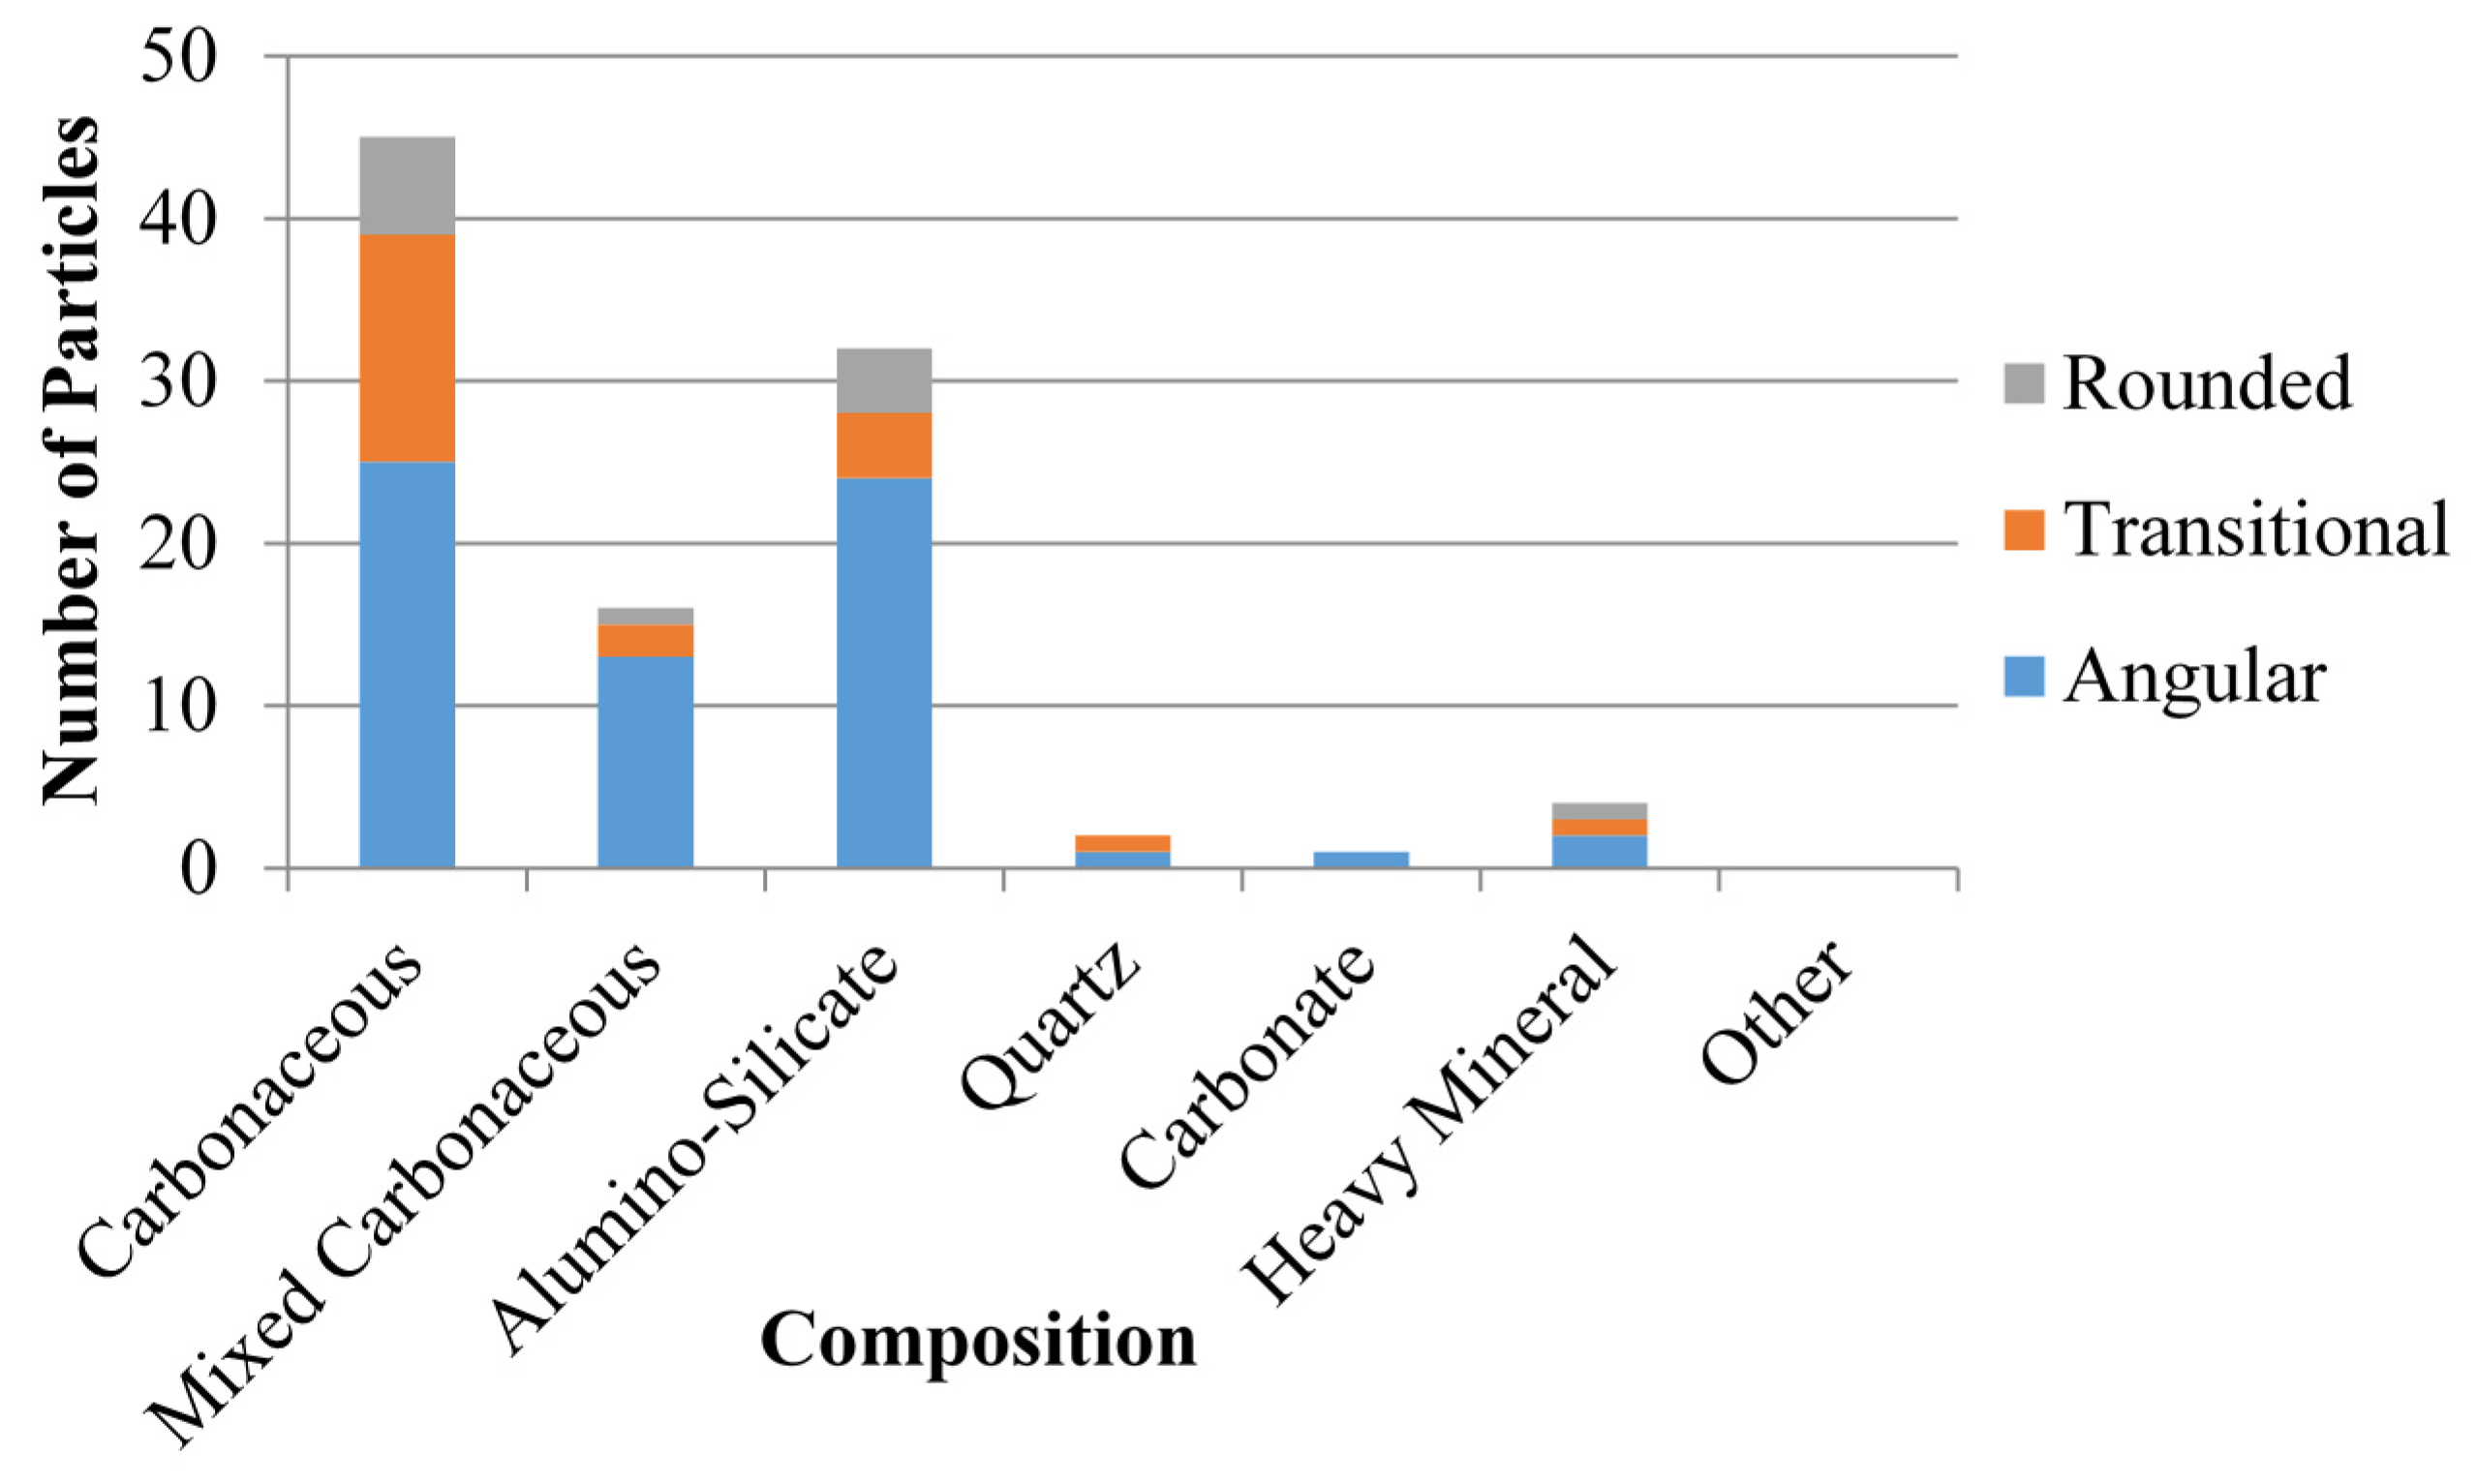
2.1.3. Shape, Volume, and Mass

2.2. General Procedures for Dust Characterization
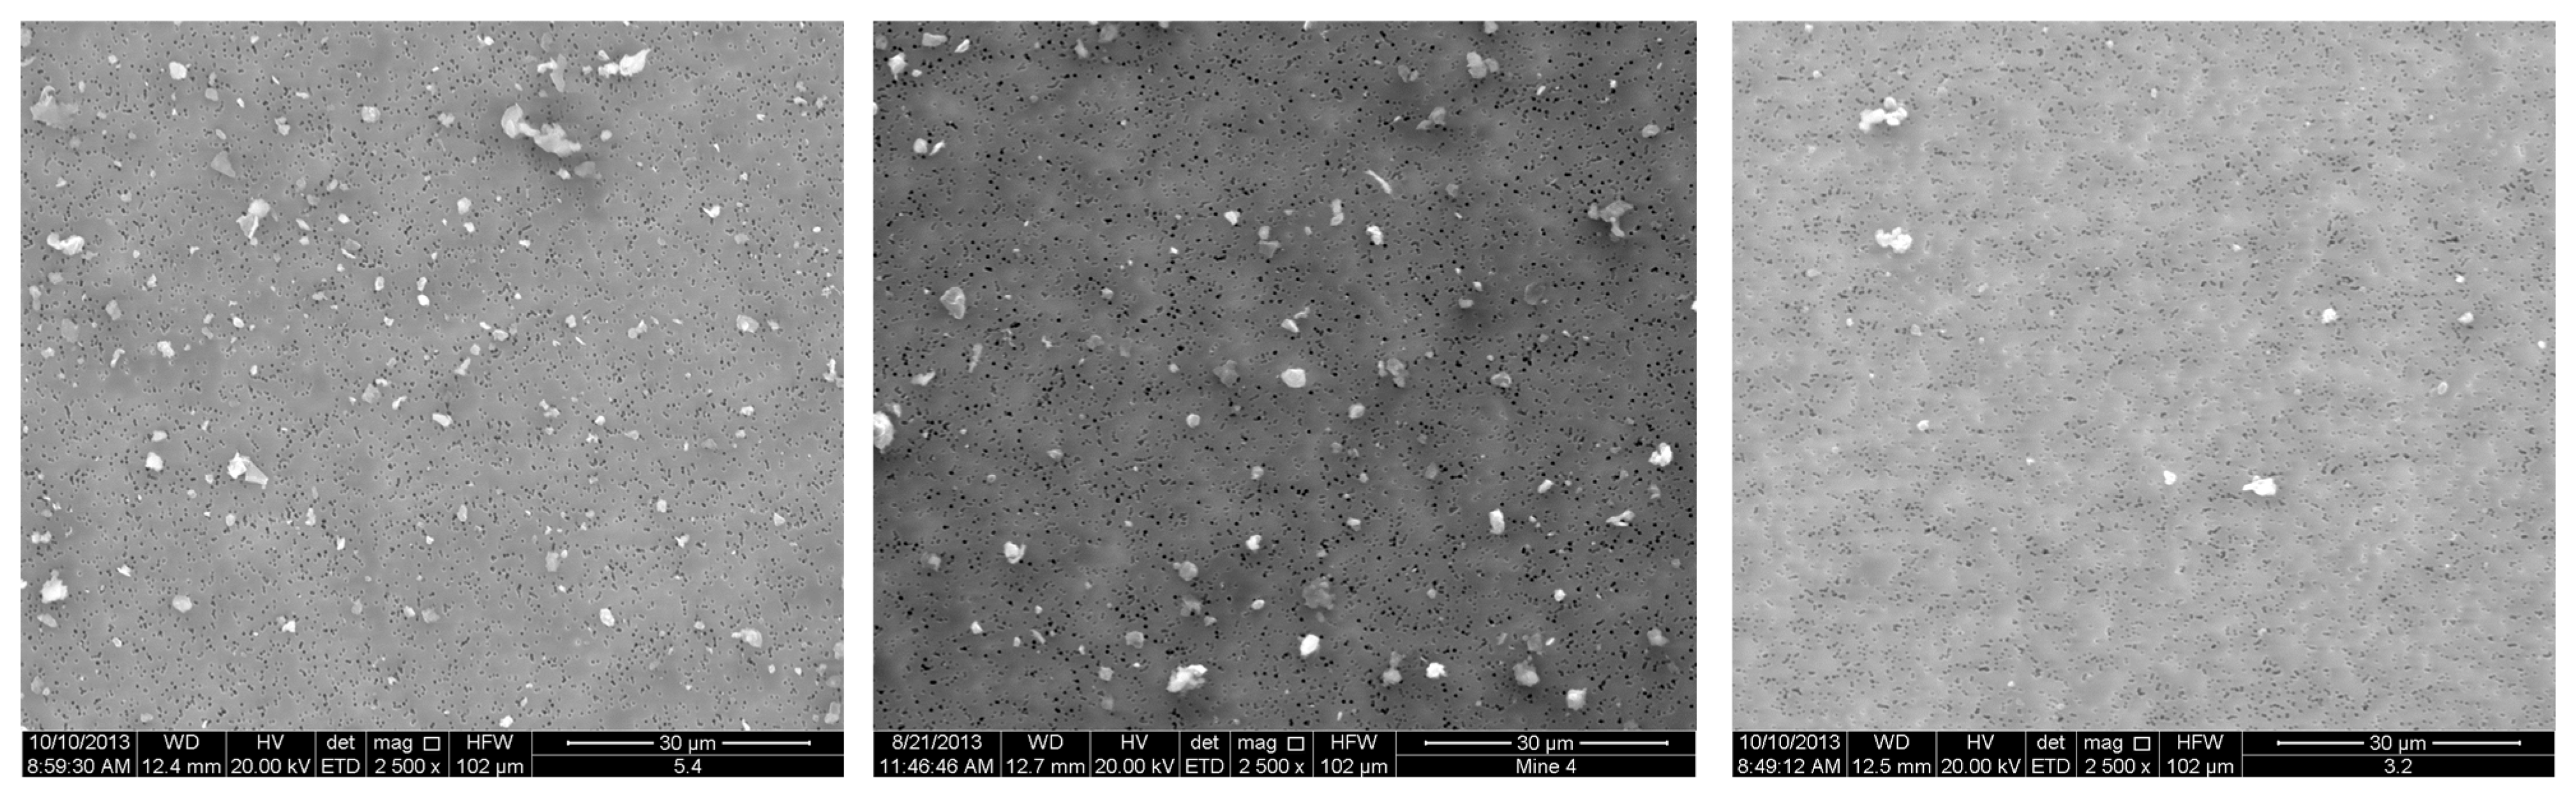
2.2.1. Sample Collection and Filter Preparation
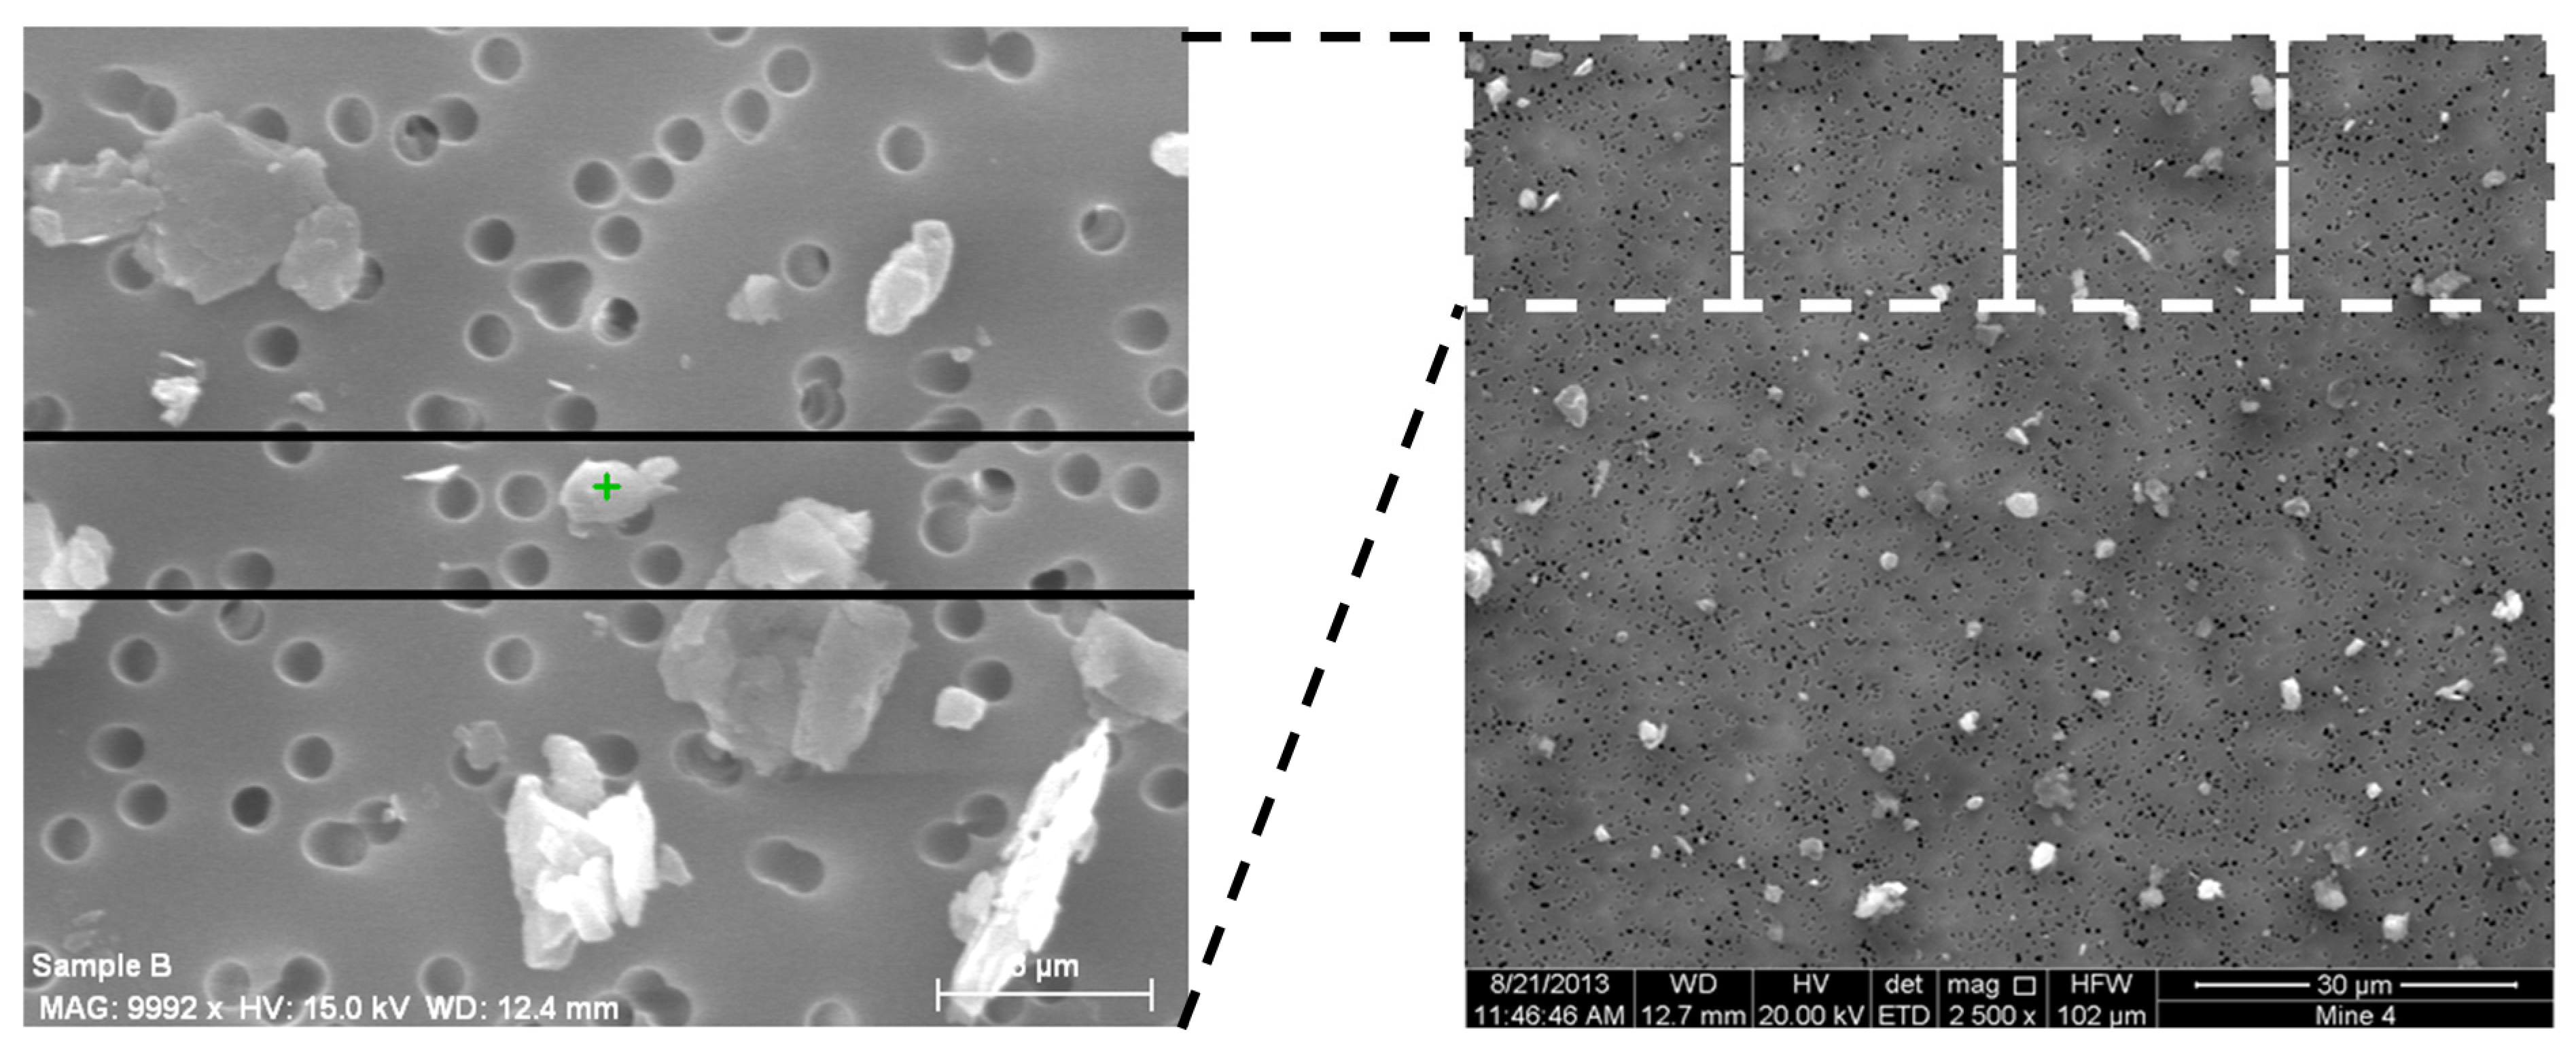
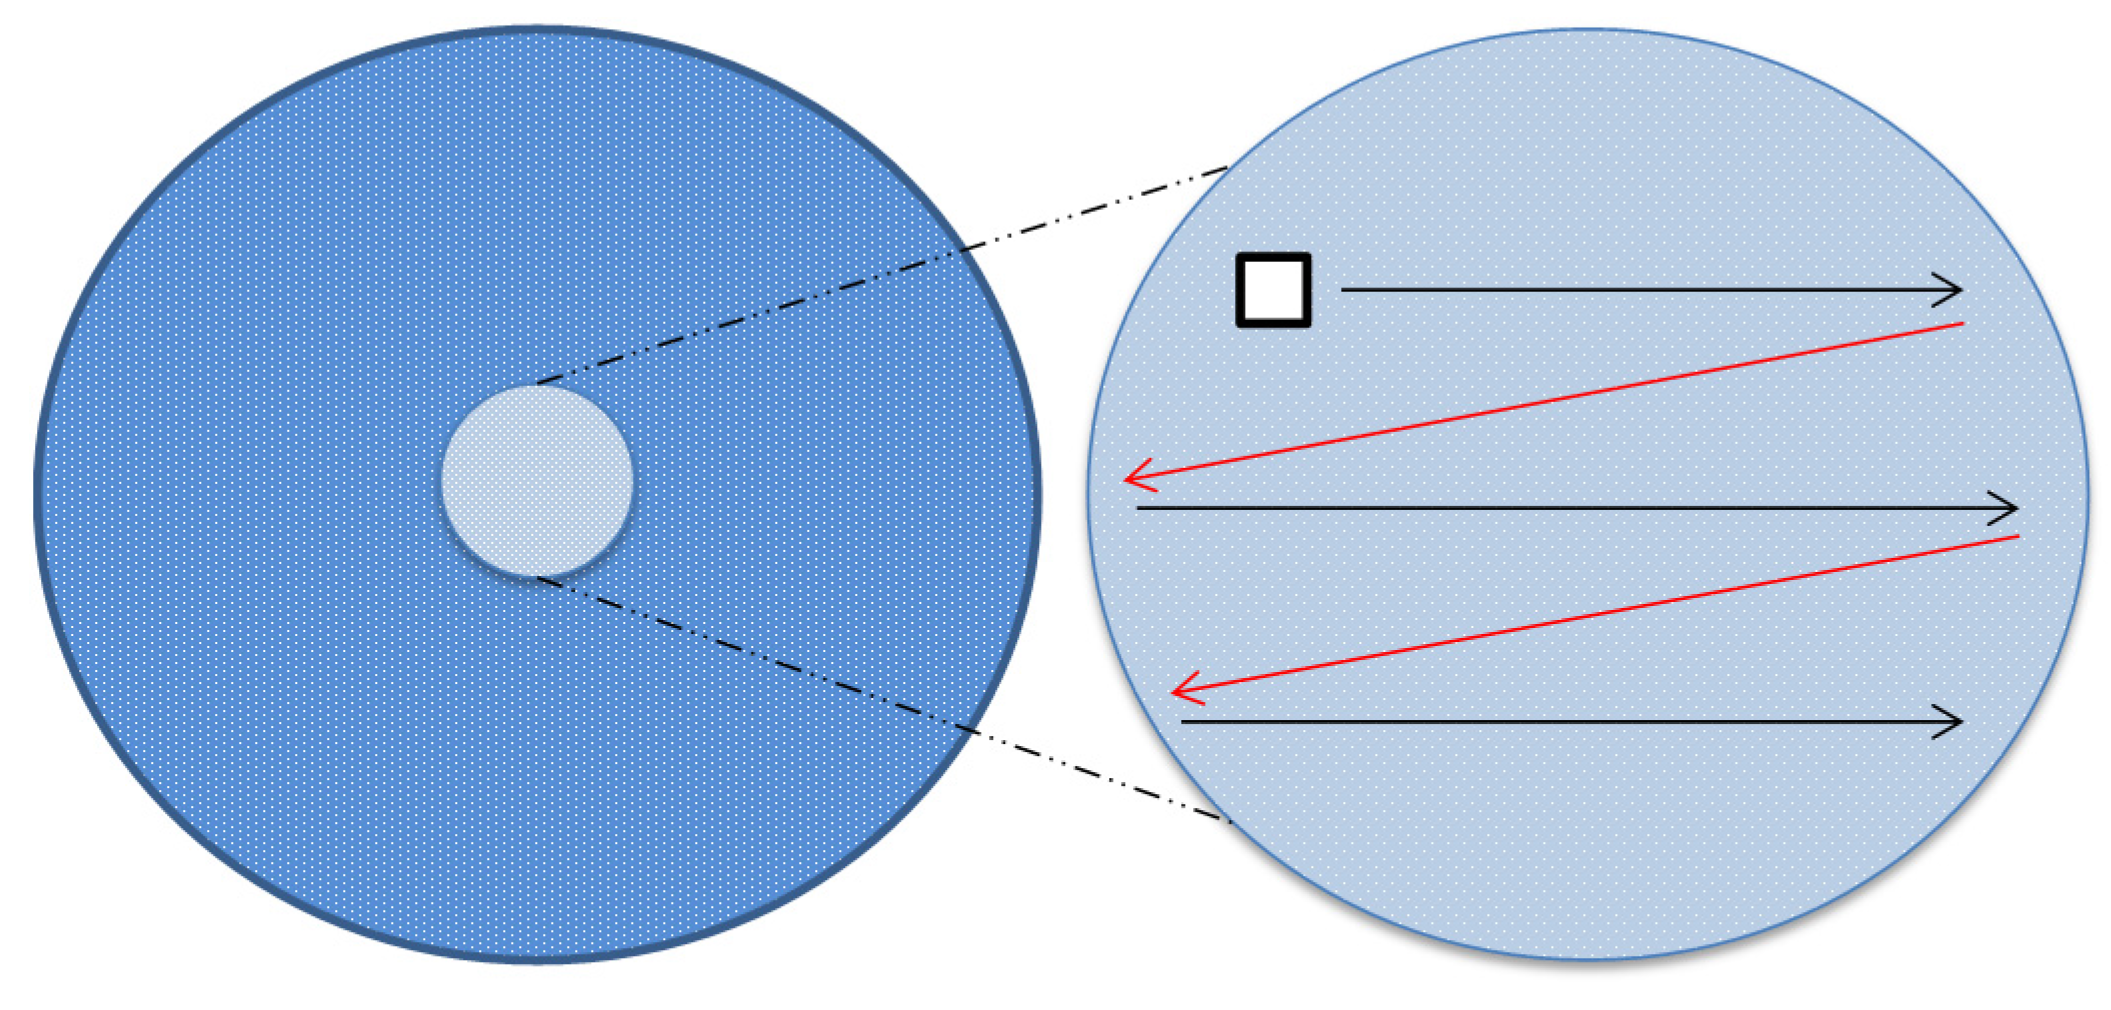
2.2.2. Particle Selection and Analysis by SEM-EDX


2.3. Automated Analysis Program
3. Preliminary Verification of Developed Characterization Method
3.1. Materials
3.2. Results and Discussion
| Roof Bolter | 25 Particles | 50 Particles | 100 Particles | 150 Particles | 200 Particles |
|---|---|---|---|---|---|
| Carbonaceous | 12% (1%) | 12% (2%) | 11% (3%) | 11% (27%) | 12% (21%) |
| Mixed Carbonaceous | 36% (31%) | 28% (25%) | 32% (19%) | 33% (26%) | 35% (23%) |
| Alumino-Silicate | 48% (68%) | 50% (64%) | 49% (67%) | 47% (39%) | 45% (41%) |
| Quartz | 4% (0%) | 8% (7%) | 6% (10%) | 6% (6%) | 7% (8%) |
| Carbonate | 0% (0%) | 0% (0%) | 0% (0%) | 0% (0%) | 0% (0%) |
| Heavy Mineral | 0% (0%) | 2% (2%) | 2% (1%) | 3% (2%) | 3% (7%) |
| Other | 0% (0%) | 0% (0%) | 0% (0%) | 0% (0%) | 0% (0%) |
| Belt Drive | 25 Particles | 50 Particles | 100 Particles | 150 Particles | 200 Particles |
| Carbonaceous | 20% (27%) | 24% (40%) | 29% (37%) | 26% (36%) | 24% (27%) |
| Mixed Carbonaceous | 20% (3%) | 24% (7%) | 21% (5%) | 21% (5%) | 25% (5%) |
| Alumino-Silicate | 32% (62%) | 30% (40%) | 30% (46%) | 33% (48%) | 30% (47%) |
| Quartz | 4% (0%) | 2% (0%) | 4% (1%) | 3% (1%) | 5% (2%) |
| Carbonate | 8% (1%) | 12% (9%) | 12% (10%) | 12% (9%) | 14% (18%) |
| Heavy Mineral | 16% (7%) | 8% (4%) | 4% (1%) | 5% (1%) | 4% (1%) |
| Other | 0% (0%) | 0% (0%) | 0% (0%) | 0% (0%) | 0% (0%) |
| Intake | 25 Particles | 50 Particles | 75 Particles | 100 Particles | |
| Carbonaceous | 32% (56%) | 40% (50%) | 44% (44%) | 45% (48%) | |
| Mixed Carbonaceous | 20% (2%) | 16% (4%) | 17% (33%) | 16% (30%) | |
| Alumino-Silicate | 40% (22%) | 36% (25%) | 31% (12%) | 32% (14%) | |
| Quartz | 4% (1%) | 2% (1%) | 1% (0%) | 2% (0%) | |
| Carbonate | 4% (19%) | 2% (16%) | 1% (7%) | 1% (6%) | |
| Heavy Mineral | 0% (0%) | 4% (4%) | 5% (3%) | 4% (3%) | |
| Other | 0% (0%) | 0% (0%) | 0% (0%) | 0% (0%) | |

4. Conclusions
Acknowledgments
Author Contributions
Conflicts of Interest
References
- Attfield, M. Current intelligence bulletin 64: coal mine dust exposures and associated health outcomes—A review of information published since 1995; Report No. 2011–172; Department Of Health And Human Services (DHHS), National Institute for Occupational Safety and Health (NIOSH): Pittsburgh, PA, USA, 2011. [Google Scholar]
- Laney, A.; Wolfe, A.; Petsonk, E.; Halldin, C. Pneumoconiosis and Advanced Occupational Lung Disease among Surface Coal Miners—16 states, 2012–2011; Report No. 61(23); MMWR: Atlanta, GA, USA, 2012; pp. 431–434. [Google Scholar]
- Coal Workers’ Health Surveillance Program (CWHSP) Data Query System. Occupational Respiratory Disease Surveillance. Available online: http://webappa.cdc.gov/ords/cwhsp-database.html (accessed on 18 March 2014).
- Suarthana, E.; Laney, A.; Storey, E.; Hale, J.; Attfield, M. Coal workers’ pneumoconiosis in the United States: Regional differences 40 years after implementation of the 1969 Federal Coal Mine Health and Safety Act. Occup. Environ. Med. 2011, 68, 908–913. [Google Scholar] [CrossRef] [PubMed]
- Centers for Disease Control (CDC). Advanced Cases of Coal Workers’ Pneumoconiosis-Two Counties, Virginia; Report No. 55(33); MMWR: Atlanta, GA, USA, 2006; pp. 909–913.
- Laney, A.; Attfield, M. Examination of potential sources of bias in the US coal workers’ health surveillance program. Am. J. Public Health 2014, 104, 165–170. [Google Scholar] [CrossRef] [PubMed]
- Pollock, D.; Potts, J.; Joy, G. Investigation into dust exposures and mining practices in mines in the Southern Appalachian Region. Min. Eng. 2010, 62, 44–49. [Google Scholar]
- Lowering miner’s exposure to respirable coal mine dust, including continuous personal dust monitors. Available online: http://webapps.dol.gov/federalregister/PdfDisplay.aspx?DocId=27535 (accessed on 11 December 2015).
- Gomes, J.; Albuquerque, P.; Esteves, H.; Carvalho, P.A. Notice on a methodology for characterizing emissions of ultrafine particles/nanoparticles in microenvironments. Energy Emiss. Control Technol. 2013, 1, 15–27. [Google Scholar] [CrossRef]
- Gomes, J.; Guerreiro, C.; Lavrador, D.; Carvalho, P.A.; Miranda, R.M. TEM analysis as a tool for toxicological assessment of occupational exposure to airborne nanoparticles from welding. Microsc. Microanal. 2013, 19, 153–154. [Google Scholar] [CrossRef]
- Laskin, A.; Cowin, J. Automated single-particle SEM/EDX analysis of submicron particles down to 0.1 μm. Anal. Chem. 2001, 73, 1023–1029. [Google Scholar] [CrossRef]
- Sneed, E.; Folk, R. Pebbles in the Lower Colorado River, Texas, a study in particle morphogenesis. J. Geol. 1958, 6, 114–150. [Google Scholar] [CrossRef]
- Sellaro, R.; Sarver, E. Characterization of respirable dust in an underground coal mine in Central Appalachia. Soc. Min. Metall. Explor. Trans. 2014, 336, 457–466. [Google Scholar]
- Weber, C.; Heuser, M.; Mertens, G.; Stanjek, H. Determination of clay mineral aspect ratios from conductive titrations. Clay Miner. 2014, 49, 17–26. [Google Scholar] [CrossRef]
- Hinds, W. Aerosol Technology: Properties, Behavior, and Measurement of Airborne Particles, 2nd ed.; Wiley-Interscience Publications: New York, NY, USA, 1999. [Google Scholar]
- U.S. Geological Survey (USGS). Available online: www.usgs.gov (accessed on 8 December 2013).
- Liebhard, M.; Levy, A. The effect of erodent particle characteristics on the erosion of metals. Wear 1991, 151, 381–390. [Google Scholar] [CrossRef]
- Stachowiak, G. Numerical characterization of wear particles morphology and angularity of particles and surfaces. Trobol. Int. 1998, 31, 139–157. [Google Scholar] [CrossRef]
- Powers, M. A new roundness scale for sedimentary particles. J. Sediment. Petrol. 1953, 23, 117–119. [Google Scholar] [CrossRef]
- Gero, A.; Parobeck, P.; Suppers, K.; Apel, B.; Jolson, J. Effect of altitude, sampling port inlet loading, and temperature on the volumetric flow rate of the MSA Escort Elf Constant-Flow-Rate Pump. Appl. Occup. Environ. Hyg. 1997, 12, 941–946. [Google Scholar] [CrossRef]
- Khan, A. Characterizing the Variability in Respirable Dust Exposure Using Johnson Transformation and Re-Examining 2010 Proposed Changes to the U.S. Underground Coal Mine Dust Standard. Master’s Thesis, University of Kentucky, Lexington, KY, USA, 2 May 2013. [Google Scholar]
- National Institute for Occupational Safety and Health (NIOSH). Particulates Not Otherwise Regulated, Respirable: Method 0600. In NIOSH Manual of Analytical Methods, 4th ed.National Institute for Occupational Safety and Health (NIOSH): Atlanta, GA, USA, 1998; Issue 3. [Google Scholar]
- De Bock, L.; van Malderen, H.; van Grieken, R. Individual aerosol particle composition variations in air masses crossing the North Sea. Environ. Sci. Technol. 1994, 28, 1513–1520. [Google Scholar] [CrossRef] [PubMed]
- Katrinak, K.; Anderson, J.; Buseck, P. Individual particle types in the aerosol of Phoenix, Arizona. Environ. Sci. Technol. 1995, 29, 321–329. [Google Scholar] [CrossRef] [PubMed]
- Baron, P. Factors Affecting Aerosol Sampling; National Institute for Occupational Safety and Health (NIOSH)/Division of Applied Research and Technology (DART): Pittsburgh, PA, USA, 2003. [Google Scholar]
- Miller, A.; Drake, P.; Murphy, N.; Cauda, E.; LeBouf, R.; Markevicius, G. Deposition uniformity of coal dust on filters and its effects on the accuracy of FTIR analyses for silica. Aerosol. Sci. Technol. 2013, 47, 724–733. [Google Scholar] [CrossRef]
- Rice, S.; Chan, C.; Brown, S.; Eschbach, P.; Han, L.; Ensor, D.; Stefaniak, A.; Bonevich, J.; Vladar, A.; Walker, A.; et al. Particle size distributions by transmission electron microscopy: An interlaboratory comparison case study. Metrologia 2013, 50, 663–678. [Google Scholar] [CrossRef] [PubMed]
- Wentworth, C. A scale of grade and class terms for clastic sediments. J. Geol. 1922, 30, 377–392. [Google Scholar] [CrossRef]
- Sellaro, R.; Sarver, E. Preliminary investigation of SEM-EDX as a tool for characterization of coal mine dusts. Min. Eng. 2014, 66, 16–40. [Google Scholar]
© 2015 by the authors; licensee MDPI, Basel, Switzerland. This article is an open access article distributed under the terms and conditions of the Creative Commons Attribution license (http://creativecommons.org/licenses/by/4.0/).
Share and Cite
Sellaro, R.; Sarver, E.; Baxter, D. A Standard Characterization Methodology for Respirable Coal Mine Dust Using SEM-EDX. Resources 2015, 4, 939-957. https://doi.org/10.3390/resources4040939
Sellaro R, Sarver E, Baxter D. A Standard Characterization Methodology for Respirable Coal Mine Dust Using SEM-EDX. Resources. 2015; 4(4):939-957. https://doi.org/10.3390/resources4040939
Chicago/Turabian StyleSellaro, Rachel, Emily Sarver, and Daniel Baxter. 2015. "A Standard Characterization Methodology for Respirable Coal Mine Dust Using SEM-EDX" Resources 4, no. 4: 939-957. https://doi.org/10.3390/resources4040939