Close the Loop! System Dynamics Modelling in Service Design

Faculty of Multimedia Communications, Tomas Bata University in Zlín, Univerzitní 2431, 760 01 Zlín, Czech Republic
Systems 2018, 6(4), 41; https://doi.org/10.3390/systems6040041
Submission received: 18 August 2018
/
Revised: 19 November 2018
/
Accepted: 20 November 2018
/
Published: 23 November 2018
(This article belongs to the Special Issue Human Factors in Complex Systems)
Abstract
:Service design is a thought process using creativity, empathy in responding to a customer’s need and rationality in an analysis of a recommended, innovative solution. In this paper, we propose a research methods system which enables designers to integrate design and systems thinking into a system dynamics model of a creative project. Based on these research methods, topics and problems can be detected, and solutions can be proposed. The communicative game “Close the Loop!” which uses elements of visual language, and modifies the Grounded Theory method and its three processes: open coding, axial coding, and selective coding. The aim of the game is to create a Causal Loop Diagram which expresses a dynamic hypothesis, a Stock and Flow Diagram, which solves the problem visually and follows the Causal Loop Diagram. The accuracy of this set of method is demonstrated by its application in a case study from the service area. The article is intended for researchers who endeavour to use research methods in order to improve their services and meet a customer’s requirements.
1. Introduction
This paper introduces design thinking [1], systems thinking [2] and system dynamics modelling [3] as methodological platforms for analyzing large amounts of qualitative data and transforming them into a quantitative mode, with the goal of disclosing causality in research focusing on societal and behavioural issues in service design, a relatively new field. It is based on the cooperation of service providers and customers interested in the use of this service. In order to design a service, it is crucial to ascertain which parameters of the service are significant in the customer’s decision-making process. Kramolis and Kotaskova [4] stated that businesses are definitely aware of the fact that product and service design is an essential part of a successful business. A major criterion for success in business is to be distinctive in the market; therefore, design is fundamental in this field. What do system dynamics model design and service design have in common? Williams and Harris [5] said: “System dynamics is a methodology for studying and managing complex feedback systems, such as one finds in business and other social systems.” It follows therefore that a key attribute of system dynamics is to model a problem or research question rather than the complete service design which is the focus of this paper. If a service is not attractive to customers, it is necessary to discern the cause of the problem and design its solution. In order to substantiate the objectivity of the recommended action, methods must be employed which express both the service provider’s and the customer’s reasoning in a comprehensive and clear manner, thus enabling researchers to discover a solution to the problem. This objectivity is possible using system dynamics modelling which enables the researcher to not only model an existing problem in a specific situation but also to predict customers’ decision-making processes and therefore their behaviour on a timeline. This is possible using system dynamics modelling that enables one not only to model a problem that shows a current situation but also to predict customers’ decision-making processes and therefore their behaviour on a timeline.
The aims of this article are to present the methodology of an integral (mixed) research process and to introduce the design thinking process—a solution-oriented approach applicable in social sciences and humanities. The research methods describe a method by which dialogue transcripts are transferred into a tool recommended by Sterman [6] as a practical method for system thinking: a Casual Loop Diagram (CLD). According to Sterman, systems thinking is the ability to see the world as a complex system, in which we understand that “you can’t just do one thing” but that “everything is connected to everything else.” ([6], p. 4) a CLD aids in the formulation of dynamic hypotheses of a research problem providing a tool for mapping a causal structure. These hypotheses are expressed in a Stock and Flow Diagram (SFD) and after that tested there. The SFD accurately reflects the CLD, and along with the CLD accurately reflects the dialogue transcript. The SFD, therefore, does not model the whole system but only one problem which was articulated during the qualitative research process (Grounded Theory method) as the first recommended step of the modelling process.
The article is divided into five sections. The opening section not only includes quotations of key publications but also methodological ambiguities in relation to the formation of the CLD which led to this article. The second section contains a description of research method sets which can be understood and implemented easily. The third section Results describes the applied methodology which was performed on the study of a service design in a university environment. The effectiveness of the communication with the respondents was intensified by using visual language tools in the research study. As Gray, Brown and Macanufo [7] emphasize, visual language tools enable one’s imagination and ideas to be communicated in a more concrete way. In the section Discussion, comments are made on the results of the research. There are also three scenarios for a change in the design of the analysed service presented there. The final section summarizes the procedure to attain the research goal. Appendix A provides a complete documentation in order to compile the published system dynamics model.
The starting point of this published study is defined for those who have read The Fifth Discipline [2] and want to apply their knowledge about systems thinking in practice. It is not claimed, in this study, that this system dynamics model is the only one that is correct. However, it is claimed that the data which were collected and analysed were processed in accordance with scientific research methods of analysis and synthesis. The readers of this study need to make their own assessment as to whether or not this approach to mental modelling fulfils their requirements and expectations.
Eker and Zimmermann [8] provide a thorough research of various approaches using textual data in the conceptualization of the system dynamics model. The collection of methods published in this article in the Research Methods section follow the same concept as Eker and Zimmermann [8] who introduce a method of processing qualitative data for systems dynamics modelling. These authors [8] published an alternative approach which is focused on causal relationships starting from the initial steps of coding in the Grounded Theory method. They only use the first process—open coding—from the Grounded Theory which is consistently applied in the text analyses by the use of support software. Consenz [9] suggests a system dynamics model structure in which he uses a business model canvas according to Osterwalder and Pigneur [10]. The business model concept canvas overcomes the limitations of the traditional construction of business models. It achieves this by adding elements of design thinking and visual language into its compilation. One of the limitations in the business model concept canvas that Consenz [9] deals with is the shortage of systemic perspective in depicting both business performance management and measurement. Consenz, therefore, broadens the business model construction according to Osterwalder and Pigneur [10] with system dynamics modelling. Vemuri and Bellinger [11] use the systems model method based on the spirit, mind and body (SMB) of the organization for their model setting. In their paper, they examined the need for a systemic approach for the successful implementation of Systems Thinking in an organization. Simonsen and Friberg [12] present two techniques, affinity diagramming and diagnostic mapping. These two techniques support a collective analysis of large amounts of qualitative data. Their research method is based on the collection of qualitative data and on the interpretation of using coding. Part of these methods is also presented in this article in the Research Methods section. Bureš and Rácz [13] employ system dynamics modelling to identify behavioural stereotypes in their study. They acquire data from interviews and subsequently analyse them to identify the main areas. These areas are described by feedback loop diagrams in their study. According to Bureš and Rácz [13], keywords were identified and gathered into groups which were later named according to stereotypes identified in the answers. The process of the exploration of qualitative data is inspired by Bureš and Rácz in this study. However, it is described in a different way than in the Bureš and Rácz study [13].
System dynamics models published by Richardson and Pugh [14] are a result of a causal structure but proceed from their own experience and knowledge about project management. This means that their methods are not directly based on primary data collection. Mildeová [15] demonstrates that the usage of a connection circle tool may be profitable for causal analysis. In her study concerning Software Piracy, she considers specific variables as key points of this problem. Generally, these variables (of Software Piracy) are ethics, costs, sales, financial stability, company development, and prices. Sterman ([6], p. 86) suggests five steps in the modelling process: (1) Problem Articulation; (2) Formulation of a Dynamic Hypothesis; (3) Formulation of a Simulation Model; (4) Testing with a comparison to reference modes: Does the model reproduce the problem behaviour adequately for my purpose? (5) Policy Design and Evaluation with a scenario specification: What environmental conditions might arise? In accordance with the second step (Formulation of Dynamic Hypothesis) of Sterman’s modelling process, the article describes the procedure of developing a causal structure, using a tool such as a Causal Loop Diagram (CLD) and Stock and Flow maps [6].
The list of literature related to CLD compilation is not complete and it can be assumed that there are other approaches that were not found by the author of the article. However, in the design process and design thinking field which is familiar to the author of the article, a more precise description of qualitative research methods for CLD compilation is missing. SFD design and its verification according to dynamics hypotheses is a process that is complex. Therefore, the aim of the article is to present an easy case study showing how to prepare a solution with the system dynamics model from qualitative research interviews. The accuracy of a CLD construction is crucial for a correct SFD compilation. CLD is a tool that uses a visualization of system components and their mutual relationships. Therefore, a process that leads to a CLD compilation is also based on using visual language and on the theory of games for problem analysis. Design thinking is behind the design process. It was used to develop a game as a research process. This new game was created for research purposes and is an essential command in system dynamics modelling: “Close the Loop!” The game “Close the Loop!” is described as one of the possible tools for the development of creative thinking, team cooperation, and complex problem-solving. This game is in compliance with the Gamestorming concept [7]. The research, compared to published literature, is innovative. Qualitative data were gathered first and were then used to explore the problem. Consequently, the quantitative data which are used explain relationships among the qualitative data thus solving a problem that was found during research. “Close the loop!” is a challenge in the form of a communicative game that will enable researchers to eliminate errors in a decision-making process in an area of human activity. Forrester [3] states that we should try to understand the principle of the behaviour of the systems in which we work and live. Forrester believes that system dynamics modelling is learning by doing. It is learning through being surprised by the mistakes one makes.
2. Research Method
The paper presents new research methods’ classification of qualitative research for system dynamics modelling and for the change from qualitative research to quantitative data in an SFD. All these qualitative research methods are consequently described and graphically presented in the text below. Qualitative research methods are appropriately ordered to provide credible information for solving the research question.
2.1. Grounded Theory
Grounded Theory is the qualitative research method that is typically used as a tool for developing a theoretical and conceptual understanding of social and interpersonal effects. Analytical processes of the Grounded Theory approach are designed to evaluate the examined system and to add credibility to the research process. Based on a recommendation by Strauss and Corbin [16,17], the data are analysed, conceptualized and then put together again in a new way. The game “Close the Loop!” is linked to the steps of the Grounded Theory. Every topic represented a different situation or a problem. Open coding is the research process of problem analysis. The aim of the application of Grounded theory research method and the Open Coding part is:
- to query research questions.
- to record answers to research questions.
- to divide the information from interviews into sentences so that it is possible to explore the meaning of every sentence.
- to divide sentences according to their similarities and differences into categories (groups).
As another step in the research, the axial coding technique was used. During questionnaire analyses, every sentence was defined in accordance with the recommended subject of action according to the Grounded Theory method. The main idea expressed by each sentence was ascertained. Concepts to the particular sentences were assigned. Each concept was formed into a sentence according to a mental model technique. Each sentence was evaluated as to what it, in fact, communicated. A template “A causes B” was applied which also involves polarity according to Richardson [18]. In general, it can be stated: If A occurs, then B rises of if A occurs then B falls. Polarity was labelled with the sign (+) or (−) near the arrow. The sentences were put into categories and then the links between the categories were evaluated.
The third technique from the Grounded Theory method is selective coding. It is a process where one central category is chosen and it is then systematically introduced into a relationship with other categories. A system dynamics model core is created in this process, that is, a variable is being chosen which is crucial as an answer to the key question. This variable is not only the focal point of the researchers, but it is also the key variable for a graphic display of modelled problem dynamics. The main variable in the system dynamics model is represented as stock. Stock can be changed only by the flow (Stock and Flow Diagram).
2.2. Grounded Theory and Its Relation to the Systems Thinking
The Causal Loop Diagram (CLD) can be used to develop a map of causal structure based on an initial hypothesis, key variables, reference modes and other available data [6]. The CLD maps elements of the system and the relationships between them. It is quite simple to design. That is its advantage. However, a CLD’s expressive ability is limited, and it complicates an accurate understanding of the dynamic behaviour of the system. It was created based on data from questionnaires or from interviews and the three above mentioned processes of the Grounded Theory research method were used (open coding, axial coding, and selective coding) for its compilation. Therefore, accuracy and reliability of the qualitative research must be validated. This is performed based on an independent evaluation accuracy of the research. Relations between categories are validated during the research process and during the game “Close the Loop!” Players (research participants) have to reach agreement on what the particular respondents’ statements mean, in what category to place them (in open coding process) and what their mutual relation is (axial coding process). The last step to verify research accuracy is confirmation in naming the central category correctly (selective coding process).
However, events are more complicated, and it is not enough to determine the causes and effects of decisions without knowing their consequences. Thinking without feedback which impacts on decisions and subsequent events is called ‘thinking in an open line’. The mental model, which was created based on evaluating primary data, can be imperfect. Feedback loops are not a necessary part of the mental model created in this way. This means that the model has to be considered in its wider context. Primary data does not enable researchers to consider the wider context rather it only allows them to deal with the problems from their own point of view. Nevertheless, it is not a failure of research. On the contrary, the opinions and experience of the service designers were requested as a valuable starting point for qualitative research.
2.3. System Dynamics Modelling
A formulation of a simulation model is the next step according to Sterman [6]. The Stock and Flow Diagram is based on the Causal Loop Diagram. The CLD defines the main variables and interdependencies among them. However, in a CLD it is possible only to show the dependencies using arrows and to show whether the dependency is positive or negative. Quantitative expression or more detailed information about dependencies cannot be found in the CLD. This barrier will be solved by the simulation model (SFD), which requires specific quantitative inputs for all variables. The simulation model is usually much more complex and contains more variables than those that appear in the CLD. Qualitative research is moved into a quantitative one. The SFD contains numerical data which are generated in this model and show the behaviour of the researched system in dependence on time. This system dynamics model is available in the Supplementary Materials (using computer modeling software Vensim).
3. Results
The design thinking approach is used for a new service design that represents the teaching of a project management subject at university. This service (teaching of the Project Management subject) is at a disadvantage because of its positioning in the study plan. Design thinking leads to a change in the service in order that it be taught in a better way for an optimal number of students. The product of design thinking is, in this case, the service that is service design. A proposal of research methods sets is introduced in the article and applied to a simple case study which leads to the creation of a system dynamics model. The applicability of research methods of qualitative and quantitative research is tested by the means of a case study. The service that is offered, that means a university course, does not capture the customers (students) interest. Whose fault is it? The designer both of a tangible and intangible product is always in charge. Is it possible to change the situation? When does the service deserve more customers? The system dynamics model deals with these open points in an accurately measurable way, yet creatively. It starts with qualitative research, a dialogue with customers (students) and a service provider (a lecturer) and ends with a quantitative expression of the customers’ behaviour and the provider-specific time-frame.
3.1. Design Thinking Game: “Close the Loop!”
To obtain research data a communication game called “Close the Loop!” was used. The rules of the communicative game can be found in the second Appendix B to the article. This game depicts research methods sets and works with the design thinking concept. The game’s design is inspired by systems thinking [2,19] and Design Thinking [7]. Redesigning a school subject ‘Project Management at University’ is the main focus of the case study. The problem that is solved in the research is the students’ lack of interest in this subject. According to the published case study, the lecturer is certain that the Project management subject is of high importance, even though it is a compulsory elective, for university students in the study program Media and Communication Studies. The subject has had a low number of registered students for four years. Students do not register for this subject and prefer another compulsory elective subject which is offered. It is the lecturer’s duty to accept responsibility for the lack of students in his/her subject. It is necessary to investigate the reasons for low attendance and then to suggest a design change in the subject, that is, a change in this specific service design. It follows that the bad design criterion of this subject results in a low number of students. Attendance is also the main parameter that will be monitored over time. The case study that has been chosen for an application of research methods sets is therefore simple because the case study for an application of research methods sets is clear. The main aim of the article, to publish a combination of qualitative research methods in order to create a system dynamics model can be easily highlighted.
Six people were interviewed for the research: three who had registered for this subject and three who had not. The lecturer of the unpopular subject Project Management was also interviewed. Research data were gained from October to December 2017 and were processed in five steps. The qualitative research uses a small number of respondents. However, their answers are analysed thoroughly using the Grounded theory. Therefore, the reliability of the results of the model depends more on keeping the causal dependencies than on the number of respondents.
3.1.1. The First Step of Research Application—Open Coding
The first step is to ask the students and the lecturer specific questions. The lecturer is not told the students’ answers so that he/she is not influenced by them. Both the students who registered for this subject and those who did not, were asked the same question: Why did only three students register for this subject? Students submitted their written answers to the researcher at the beginning of the discussion. The list of students’ answers are as follows:
- The subject was listed as the last one among the compulsory elective subjects in the study plan.
- A number of credits—fulfilled.
- No need to register for another subject when I gained all credits.
- I will not register for another subject when I fulfilled all credits and I do not need another one.
- I chose a subject for my study plan that is not interesting, but the timetable is more convenient for me.
- I am too lazy to study something else, something extra.
- I am sorry I did not register for this subject. But its timetable was not suitable for me.
- To be honest, the number of credits was important to me, this is the main requirement to me and to my colleagues.
- Too lazy to register for other compulsory elective subjects when I fulfilled all credits. I hope I did not offend the lecturer.
- I was choosing between two equally attractive subjects in the same semester.
- I just followed the crowd, it means that I found it suspicious to see a low number of my classmates to be registered for this subject and I assumed that this subject had a low level.
- I had no idea that this subject could be important for my future career and I took it lightly.
- I was worried that this subject would be too demanding and I would fail the exam.
- The subject content did not show its full potential.
Category A. The following category summarizes the first 10 responses: timetable of the subject in the study plan predetermines it to be less interesting to students. Overall name of category A: Advantaged time positioning in the study plan.
Category B. Response 11 is in category B: Confidence in the quality of the subject.
Category C. Responses 12 and 14 characterize students’ opinions about the subject content. Name of this category C: Narrative of the subject content.
Category D. Response 13 characterizes the students’ relationship to the subject in a less attractive or even discouraging way. Name of category D: Attractiveness of the subject for students.
The lecturer who asked for a solution to the problem of a low number of registered students was asked the following question: What, according to you causes the problem with a low number of students interested in this subject? The lecturer’s response: The subject is listed as the last one among the compulsory elective subjects in the study plan. This statement belongs to category A.
Category E. The sentences contained most frequently a phrase number of students in the subject. It is, therefore, a separate category (Category E).
3.1.2. The Second Step of the Research Application—Axial Coding
The students and the lecturer were asked in the second step to find relationships among individual categories according to the basic pattern of systems thinking: cause and effect. We used a template to simplify the understanding of causal interconnection: A causes B according to Richardson [18]. There can be polarities between categories, for example by increasing A, B is increased (positive polarity), or if A is increased, B decreases (negative polarity). The game “Close the Loop!” is found to be a good application in this step of axial coding because it is in line with Design Thinking and Systems Thinking principles. Each category was briefly formulated and rewritten on post-its. The students and the lecturer filled in relations and polarity between individual categories that became variables in the CLD and afterward in the SFD.
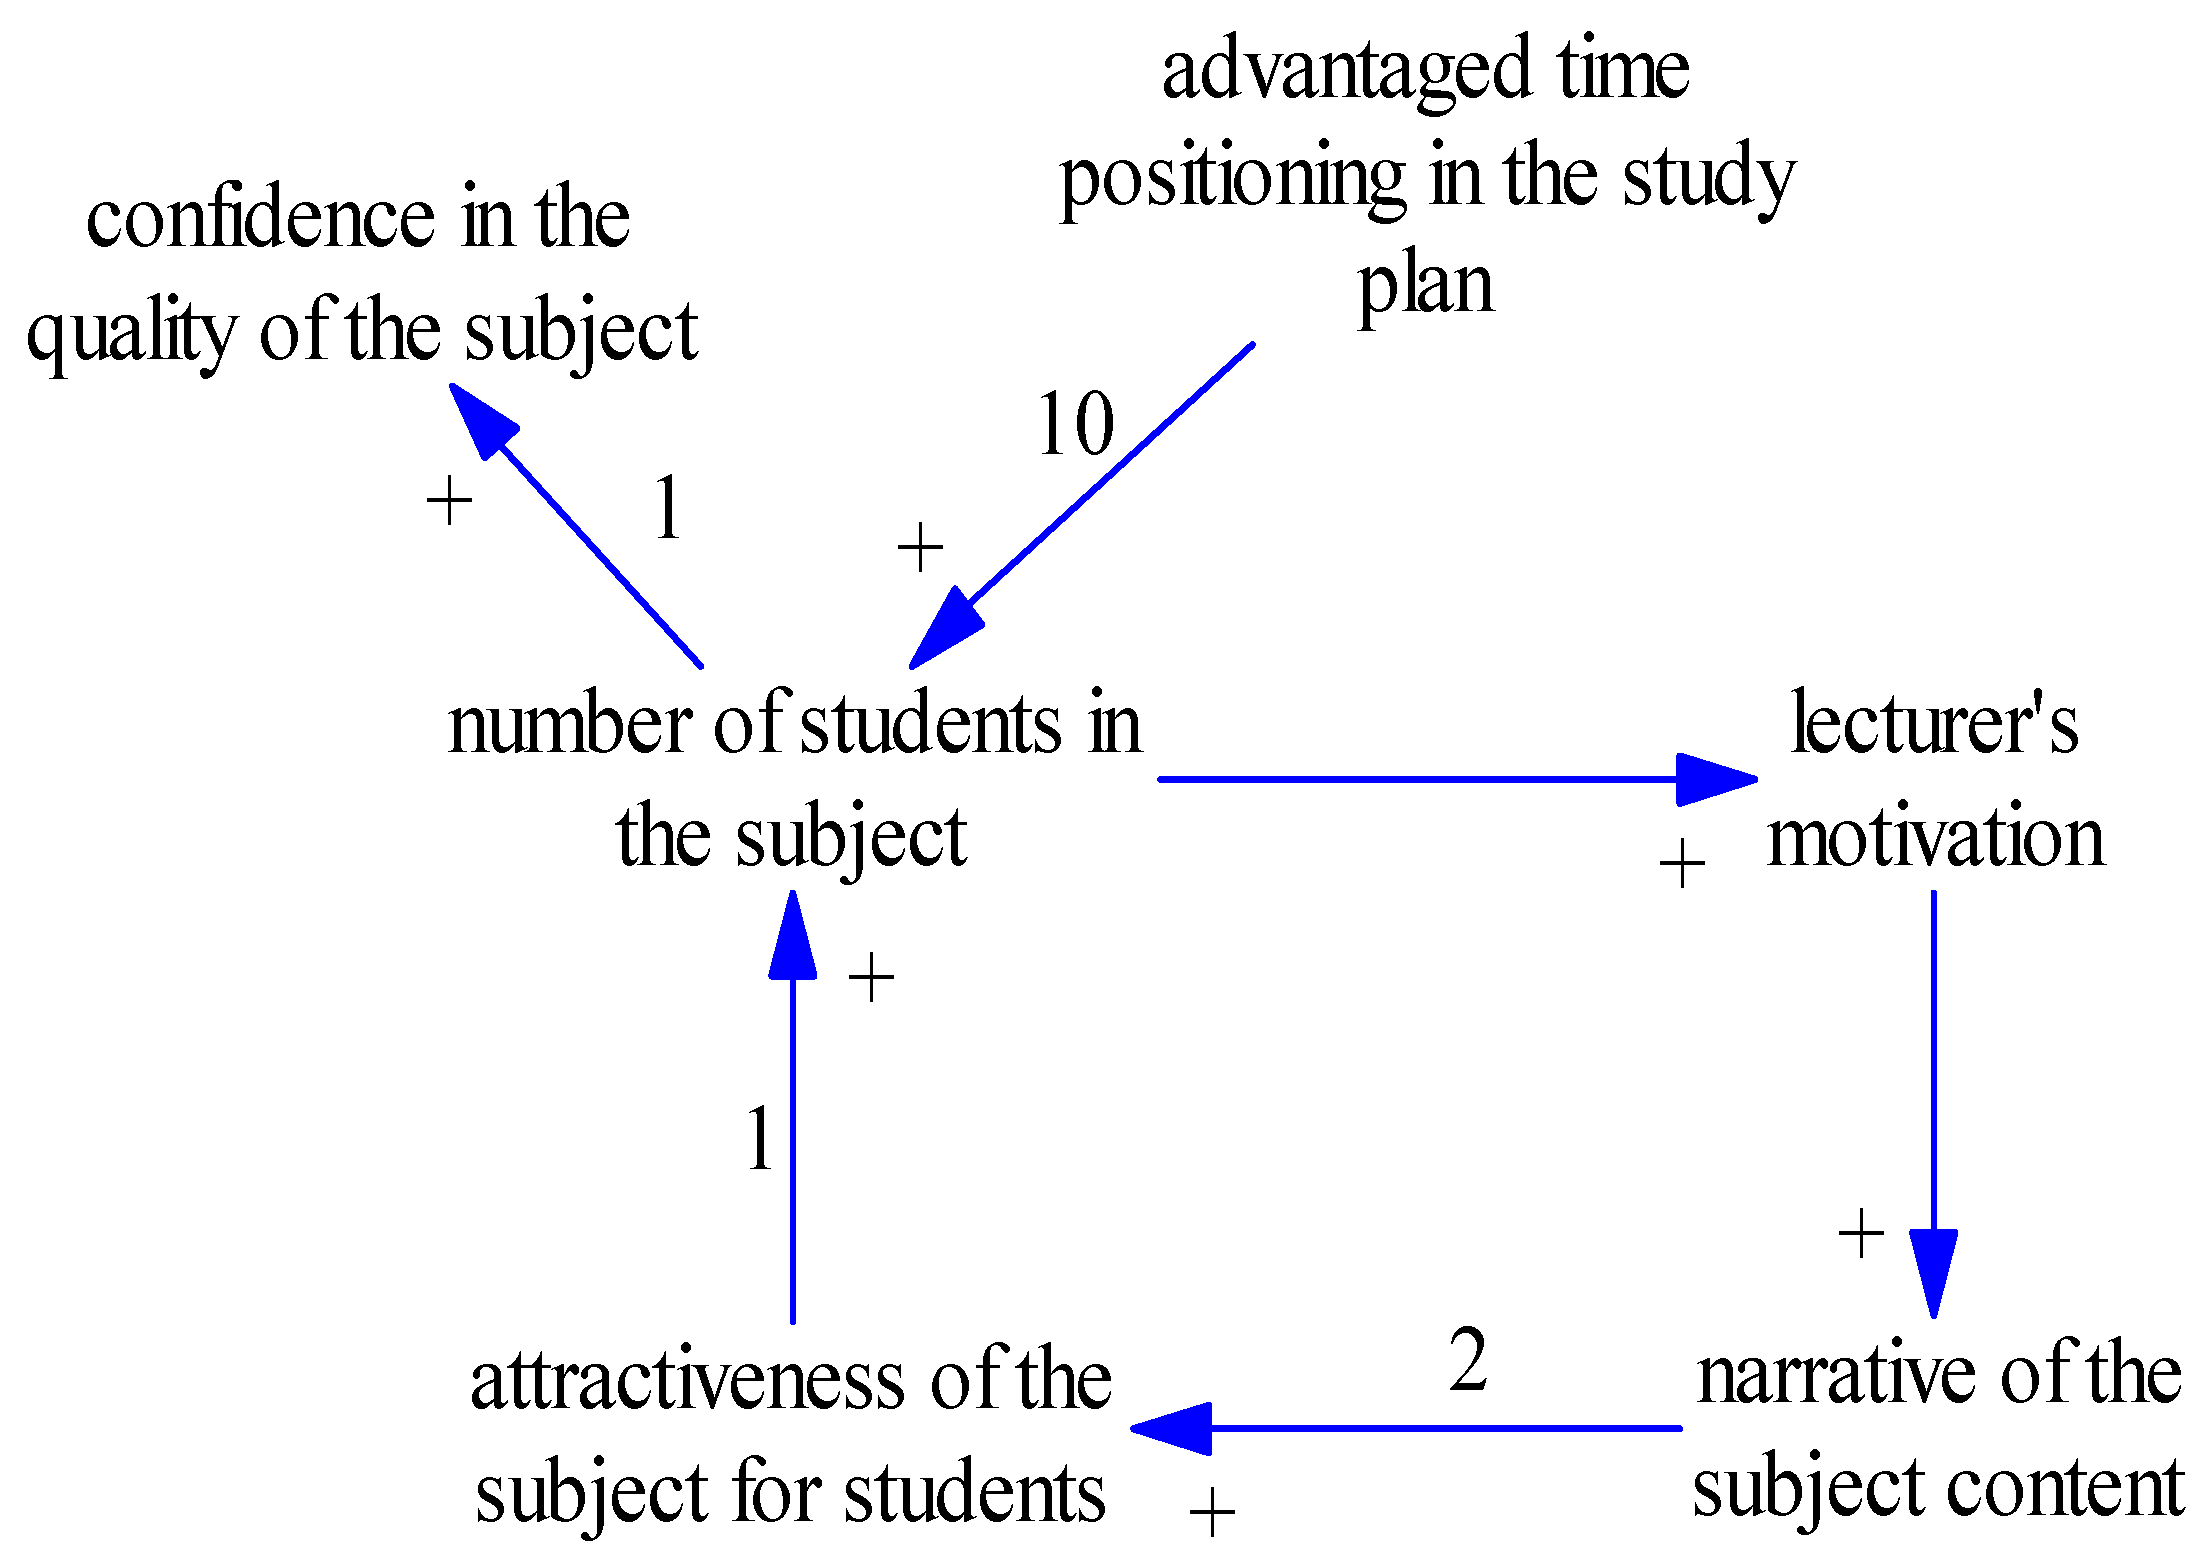
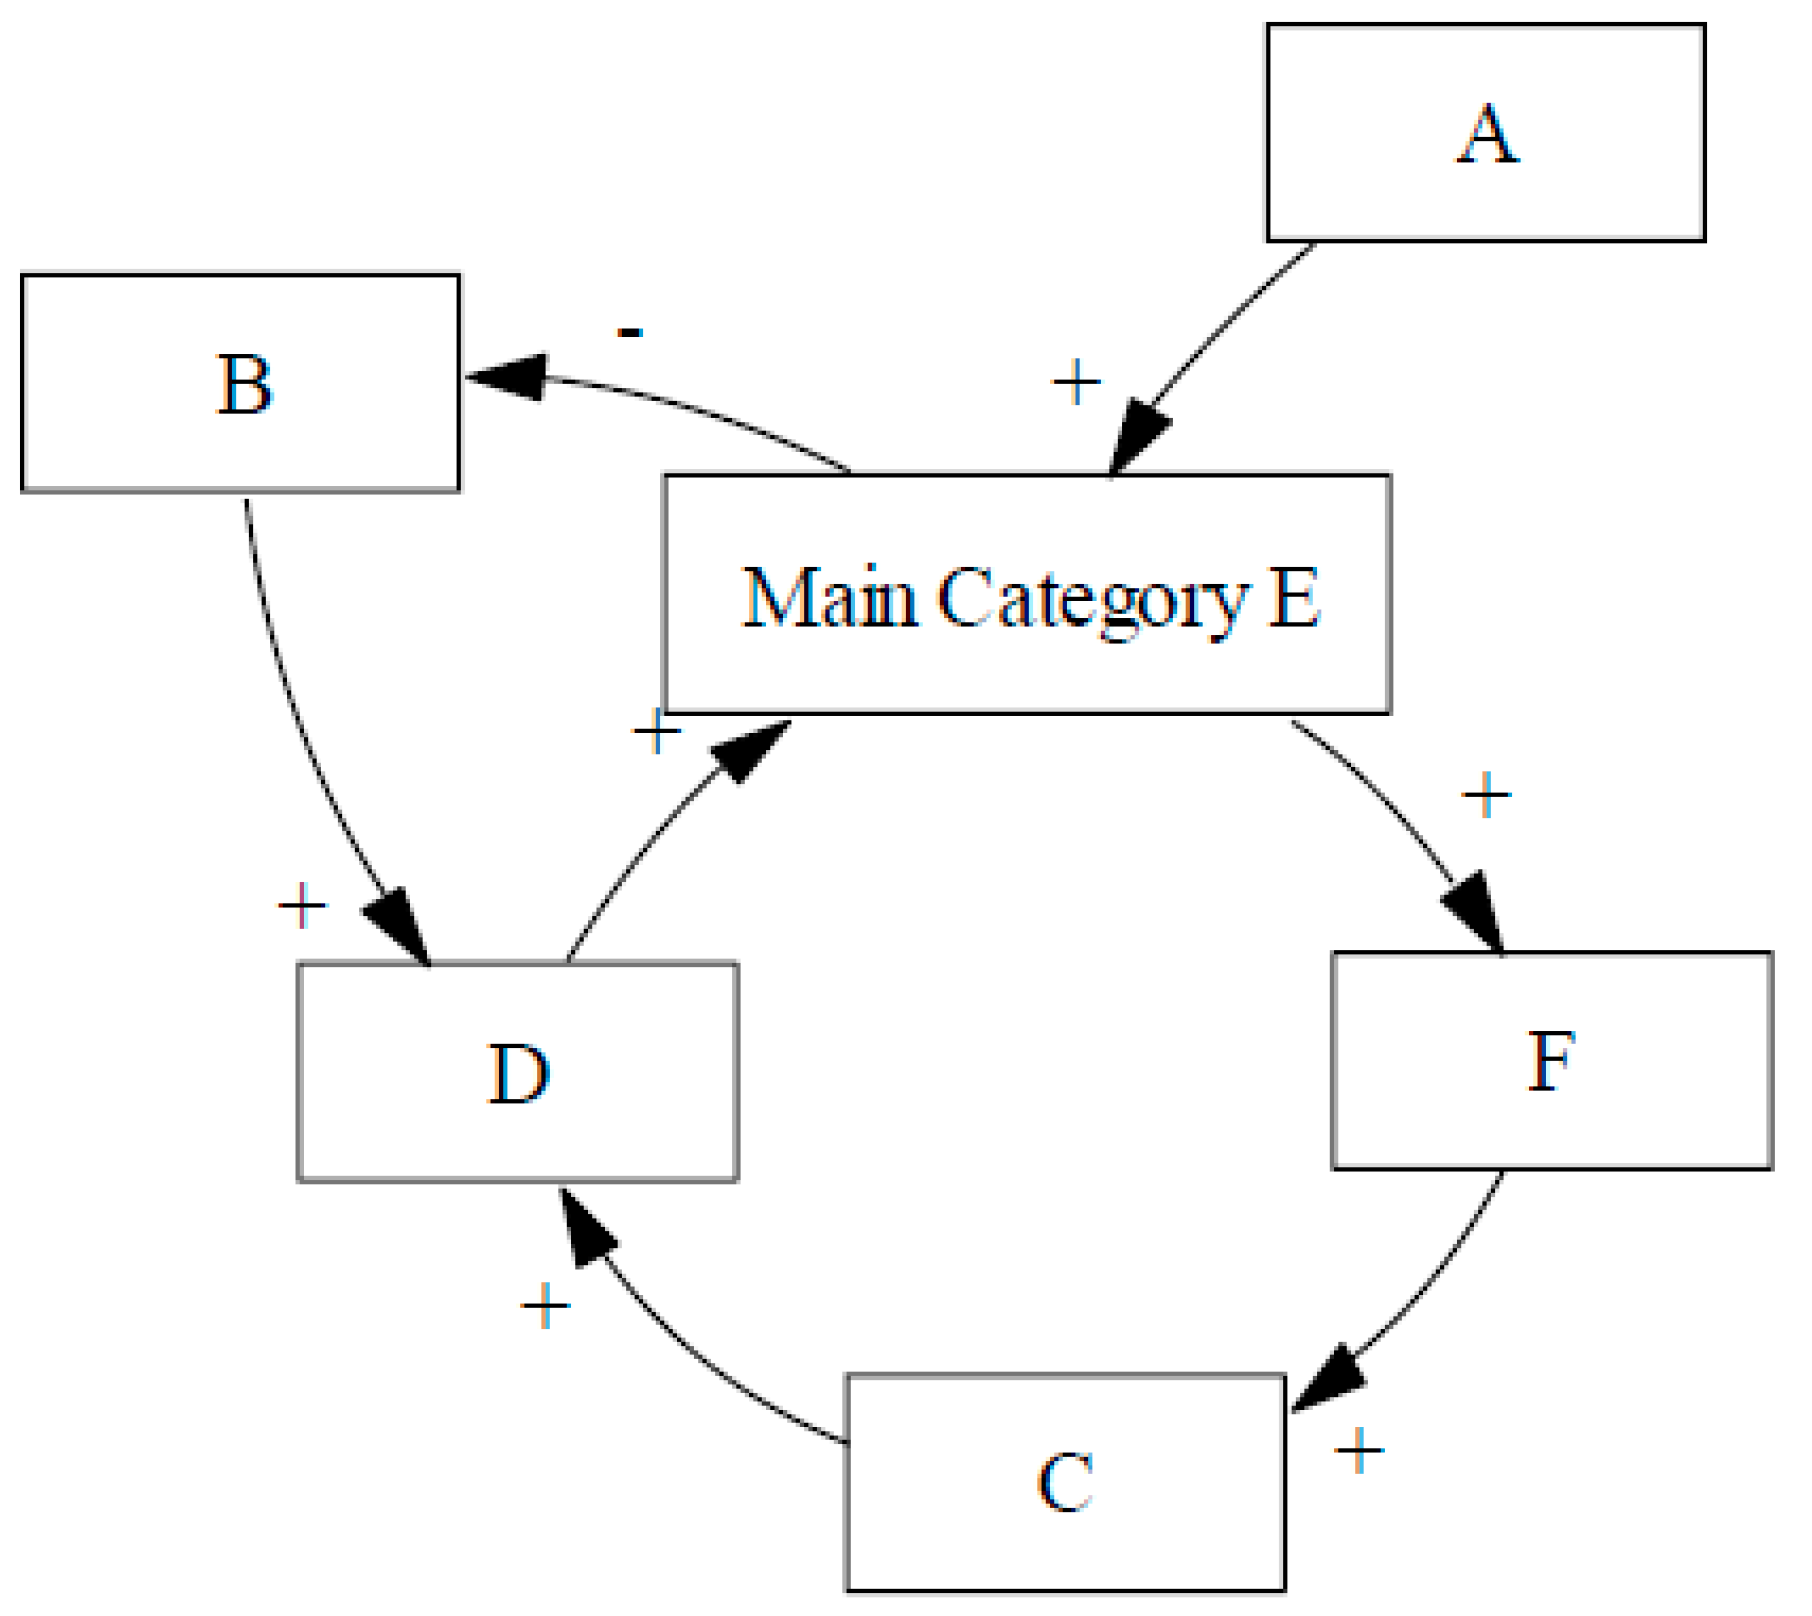
Students’ answers: The students first commented on the disadvantaged time positioning in the study plan. They commented further on the quality of the subject content they encountered when they were choosing a subject and finally they evaluated a relationship between the number of registered students and subject credibility. Low-quality subject content causes a subject to be unattractive to students. If the subject content is difficult to understand, they will not choose it for their study plan. The lower the number of registered students is, the lower the attractiveness of the subject. The relationships between the variables are presented in the picture below. The polarity between categories (variables) is presented there as well. Figure 1 describes the way in which the categories were analysed and the expression of their polarity in the axial coding process.
The lecturer’s answers: The lecturer is persuaded that the main obstacle for students in registering for this subject is the fact that it is positioned in the last place in the study plan. Other consequences follow. If the number of registered students is low, the lecturer has almost no motivation to prepare study materials. Lecturer’s motivation is, therefore, another category that we found in the axial coding process and added it to the mind map (Category F). Low motivation for the preparation of study materials causes the low-level quality of the subject content in the information system. A quote from the lecturer: ‘Few students register no matter what I do, why should I waste time to improve the subject content.’ Expression of categories polarity in the axial coding process by the lecturer is also in the picture below (Figure 1).
3.1.3. The Third Step of the Research Application—Selective Coding
Selective coding is based on setting the process where one central category is chosen that is systematically and gradually introduced into a relationship with other categories. The variable Number of students in the subject was chosen as the central category. This variable (number of students in the subject) is a key variable that has a relation to the other four categories and it is the desired key phenomenon. A summary of students’ and lecturer’s answers with a representation of a relation to the central category is also schematically presented in the figure above (Figure 1).
3.1.4. The Fourth Step of Research Method Application—Systems Thinking
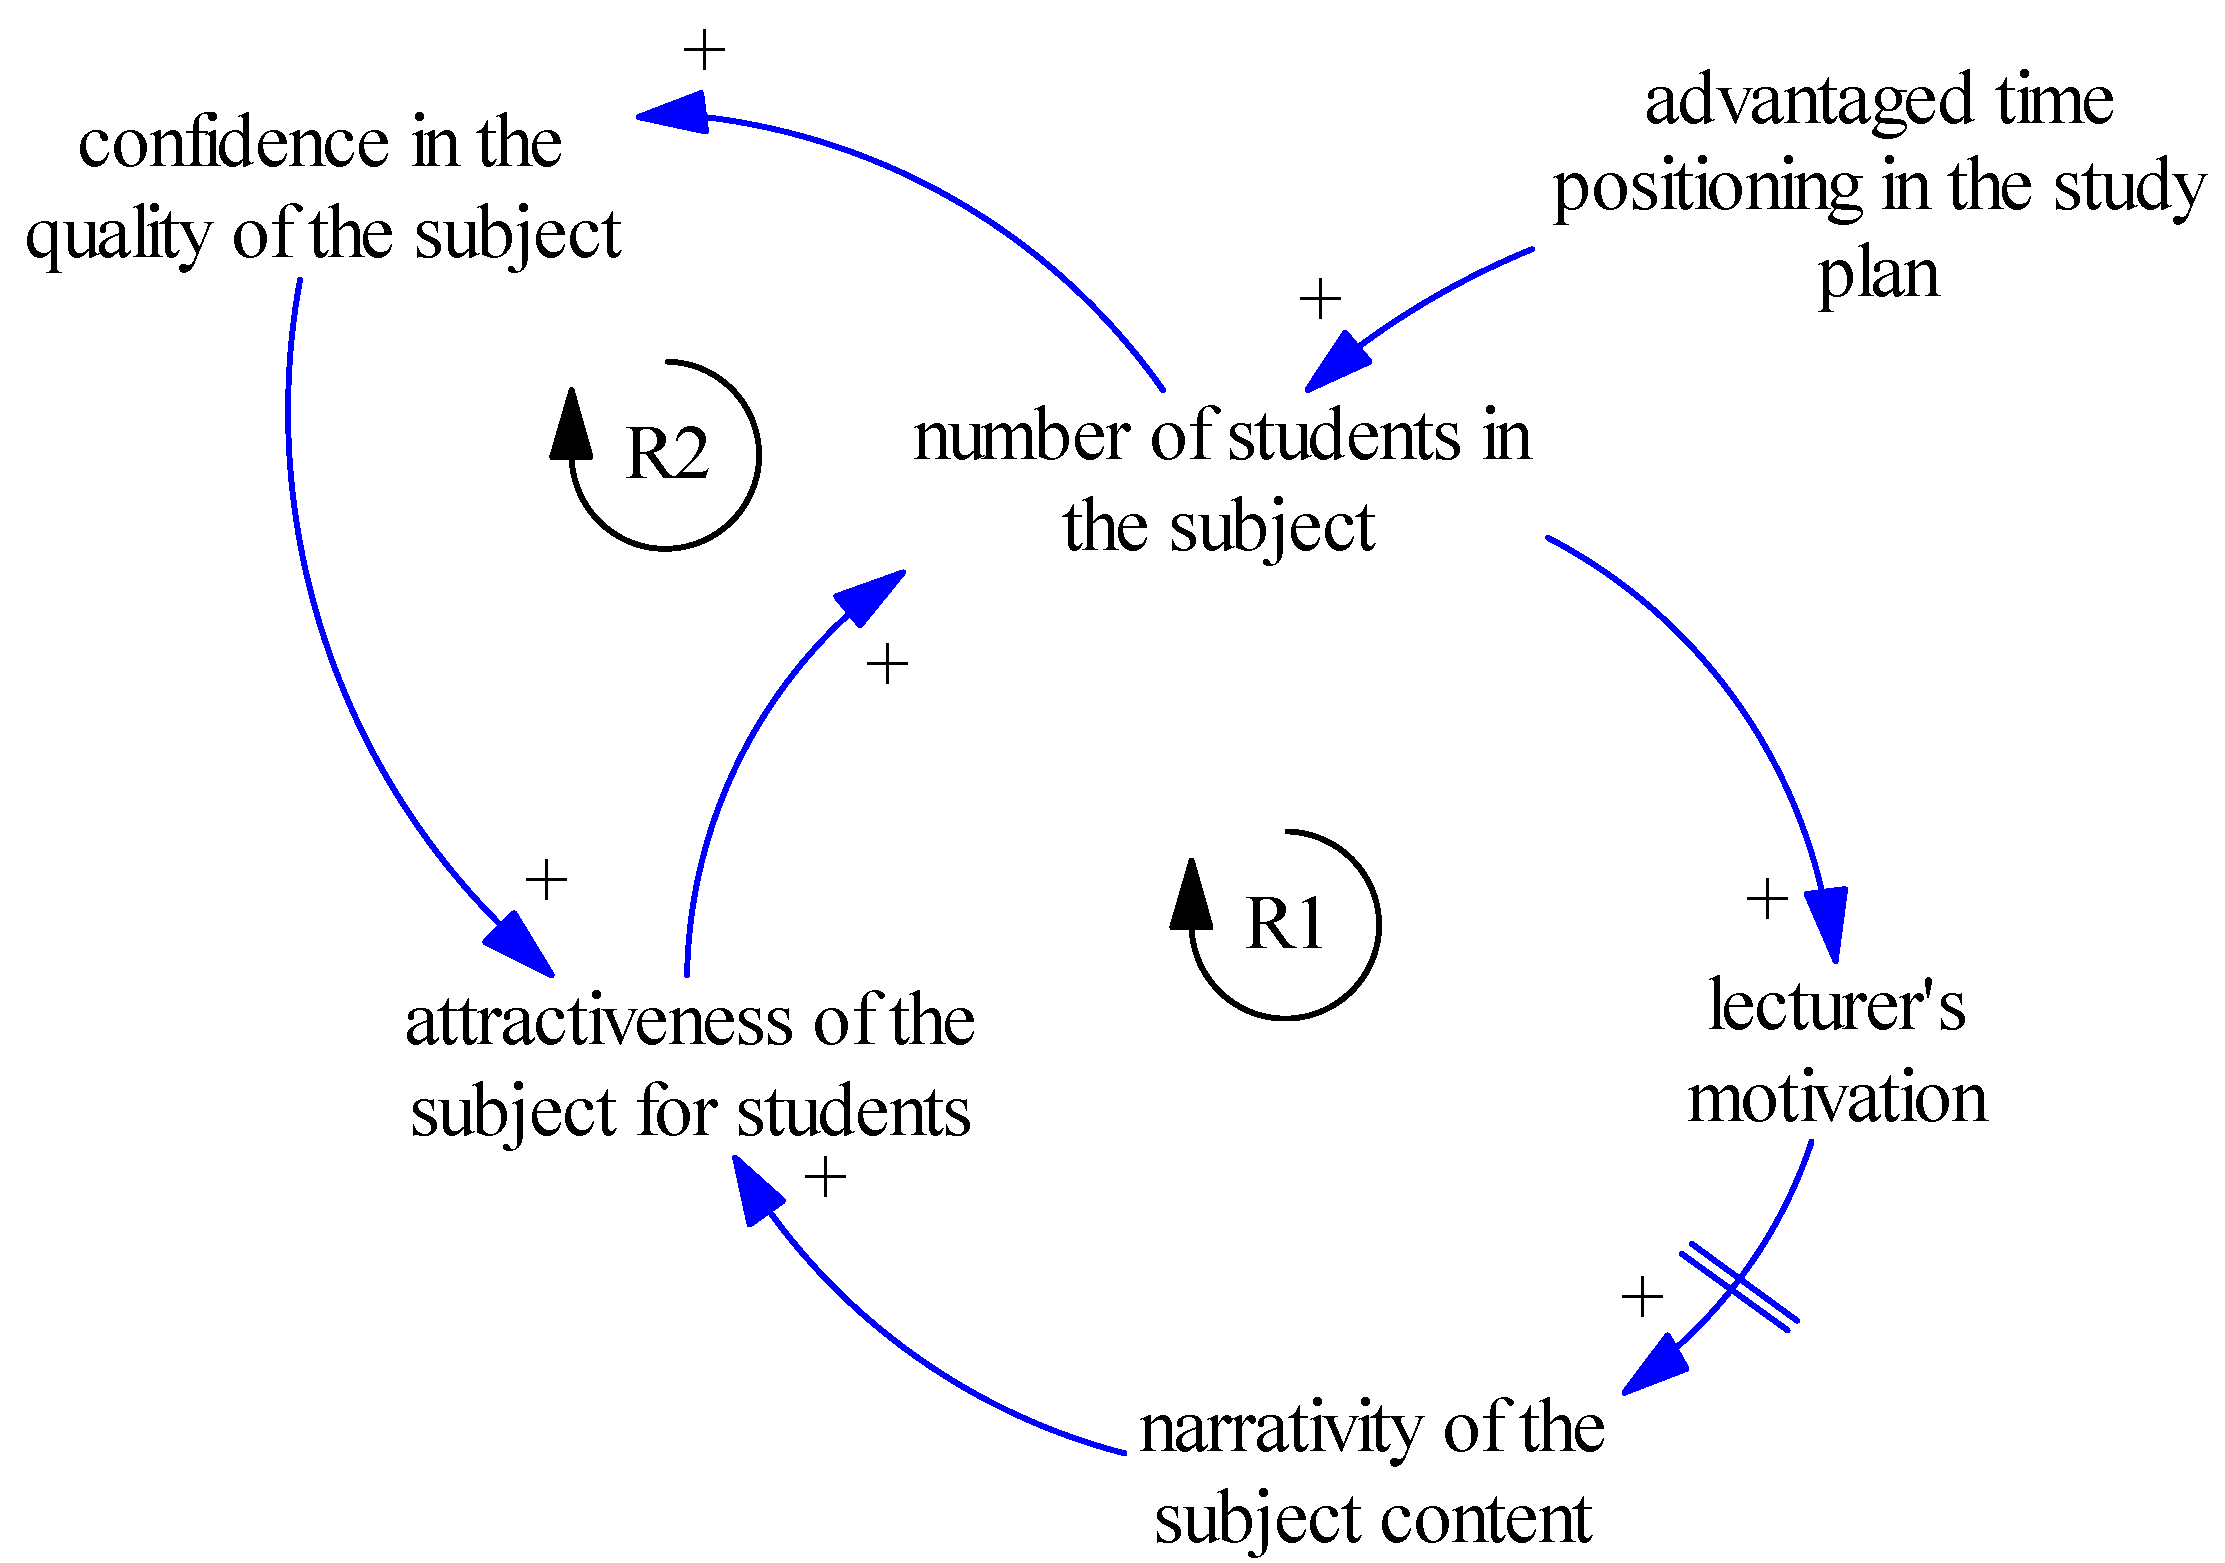
It is possible to graphically present relationships between the variables as is in the figure below. The researched question that was stated at the beginning of the research process is: Why is the number of registered students for this subject so low? The loop (see Figure 2 below) is compiled according to the rules of systems thinking. It contains two reinforcing loops, which means that both of them are positive, that is, amplifying. A CLD structure and its veracity and accuracy were verified during mutual qualitative research using the process of questioning and visual language. This solution was prepared during a discussion with the students and their lecturer. It is according to the game Close the Loop! The result of this discussion is in Figure 2 in the manuscript. The frequency of answers is also added to Figure 2 showing a relationship between two variables. The frequency of answers is written near the arrows. The connection between the variables attractiveness of the subject for students and the number of students in the subject was added in compliance with the selective coding method because this relationship was missing in the respondents’ answers.
An example is used as a tool for the application of the designed research methods system only. If a solution to a problem using the system dynamics method is to be suggested, a series of characteristics of events which influence the primary problem must be found. The number of arrows with positive polarity then influence the nature of the reinforcing loop.
Variables that are not part of the reinforcing loop are exogenous variables which enter the system from the outside environment and are not influenced by the system itself. In this case (see the figure below), there is one exogenous variable Advantaged time positioning in the study plan. It is a variable which according to the dynamic hypothesis (Figure 2 above) the lecturer cannot influence.
3.1.5. The Fifth Step of the Research Method Application—System Dynamics Model
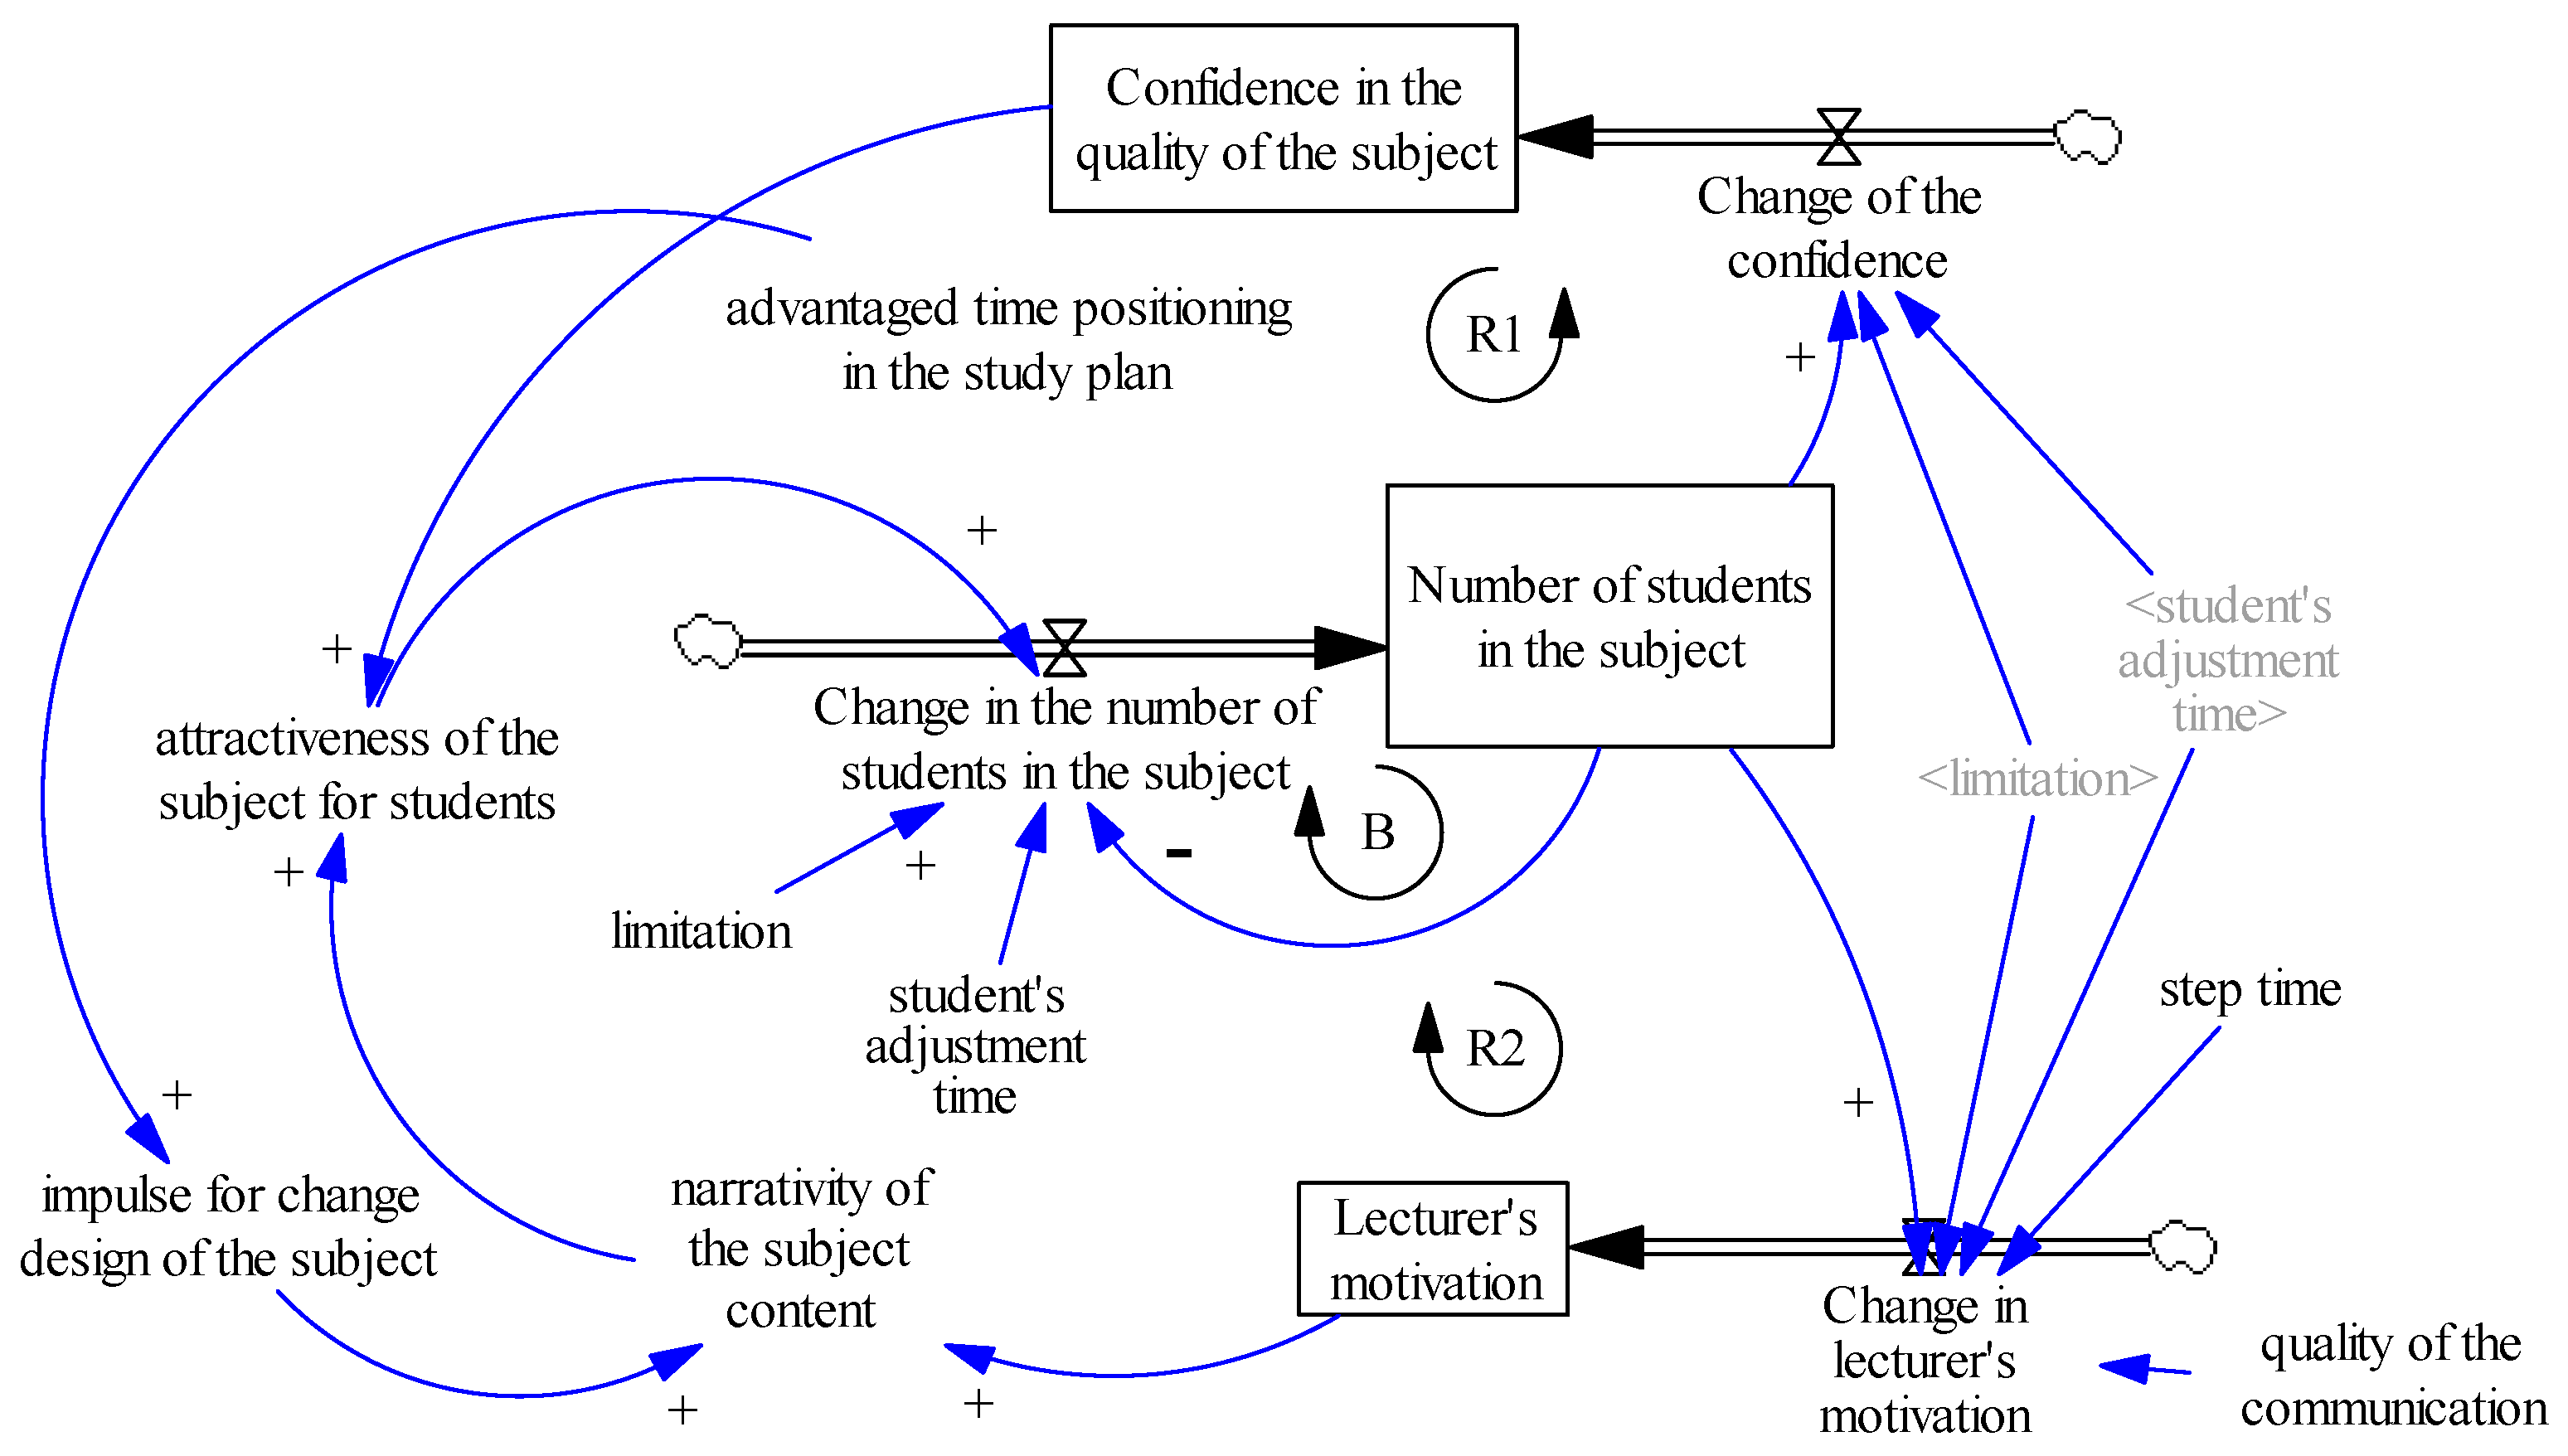
The formulation of a dynamic hypothesis according to the CLD is: if the subject content narrative is improved, the attractiveness of the subject will improve. However, if the low percentage of the advantaged time positioning of the subject in the study plan continues as well, the number of registered students will not increase. This means that the lecturer’s motivation will continue as it is and he/she will not improve the subject content. The result of which is, the subject remains unattractive. The lecturer may well expect another decline in the number of registered students. The SD model follows below (Figure 3).
Students have one week per academic year to decide whether they will choose the subject or not. The lecturer can only alter the subject content once per academic year as well. Therefore, the basic time unit is one year. The variable number of students in the subject (the only stock in the model) has an initial value of three students to illustrate the real numbers in the current academic year 2017/2018, that is, the sixth year of the timeline of the research.
The model contains two exogenous variables that influence the behaviour the model: (1) the variable limitation for the number of students in the subject is 15 students. This variable means that the stock number of students in the subject and its change, that is, the flow variable change in the number of students in the subject is in its structure in the model “goal searching loop”. The goal of which is to achieve the maximum number of students in the subject, that is 15. Another variable that is exogenous (2) is advantaged time positioning in the study plan. This variable can reach a level of between 0 to 100 and it expresses the level of advantage in the subject in the study plan. The higher the number is, the higher the advantage is, lowering the barrier to the students’ interest in the subject. The other two exogenous constants do not influence the model’s behaviour, they are applied for correct and understandable transfer of units. (1) week = 1 week; (2) students = 1 student(s). The dynamic model is compiled to contain all variables that are designed in the CLD and at the same time, it corresponds to the dynamic hypotheses: decreasing the variable advantaged time positioning in the study plan decreases the number of registered students. This fact negatively influences the lecturer’s motivation and thus decreases the lecturer’s interest in improving the subject content which in turn decreases the attractiveness of the subject.
4. Discussion
The story that was described using the dynamic hypotheses (CLD) and solved in System Dynamics Model may be interpreted by the means of graphs which characterize three managerial strategies. Each strategy (scenario) is named after its behaviour. These graphs, which express the results of the system dynamics model, are accurate and comprehensible for users who want to use the results of the research.
4.1. Model Interpretation
The model contains three stocks. The number of students in the subject that is the core of the model and at the same time the main variable. This stock proves whether or not the dynamic hypothesis is true or not true. The mathematical formulation is Number of students in the subject = INTEG (Change in the number of students in the subject, 3) Unit: Students. The main hypothesis is a research question: a number of students in the subject so this is the stock—the most obvious accumulation. The model for simulation uses only one variable with the Lookup function. Lookup allows its users to define customized relationships between a variable and its causes. An equation can be defined with a specially constructed function:
Y—my function (x)
The output variable y is changed by the input variable x through the Lookup function my function, which has a (typically nonlinear) shape that you specify. ([20], p. 107)
4.2. A Search for a Suitable Managerial Strategy
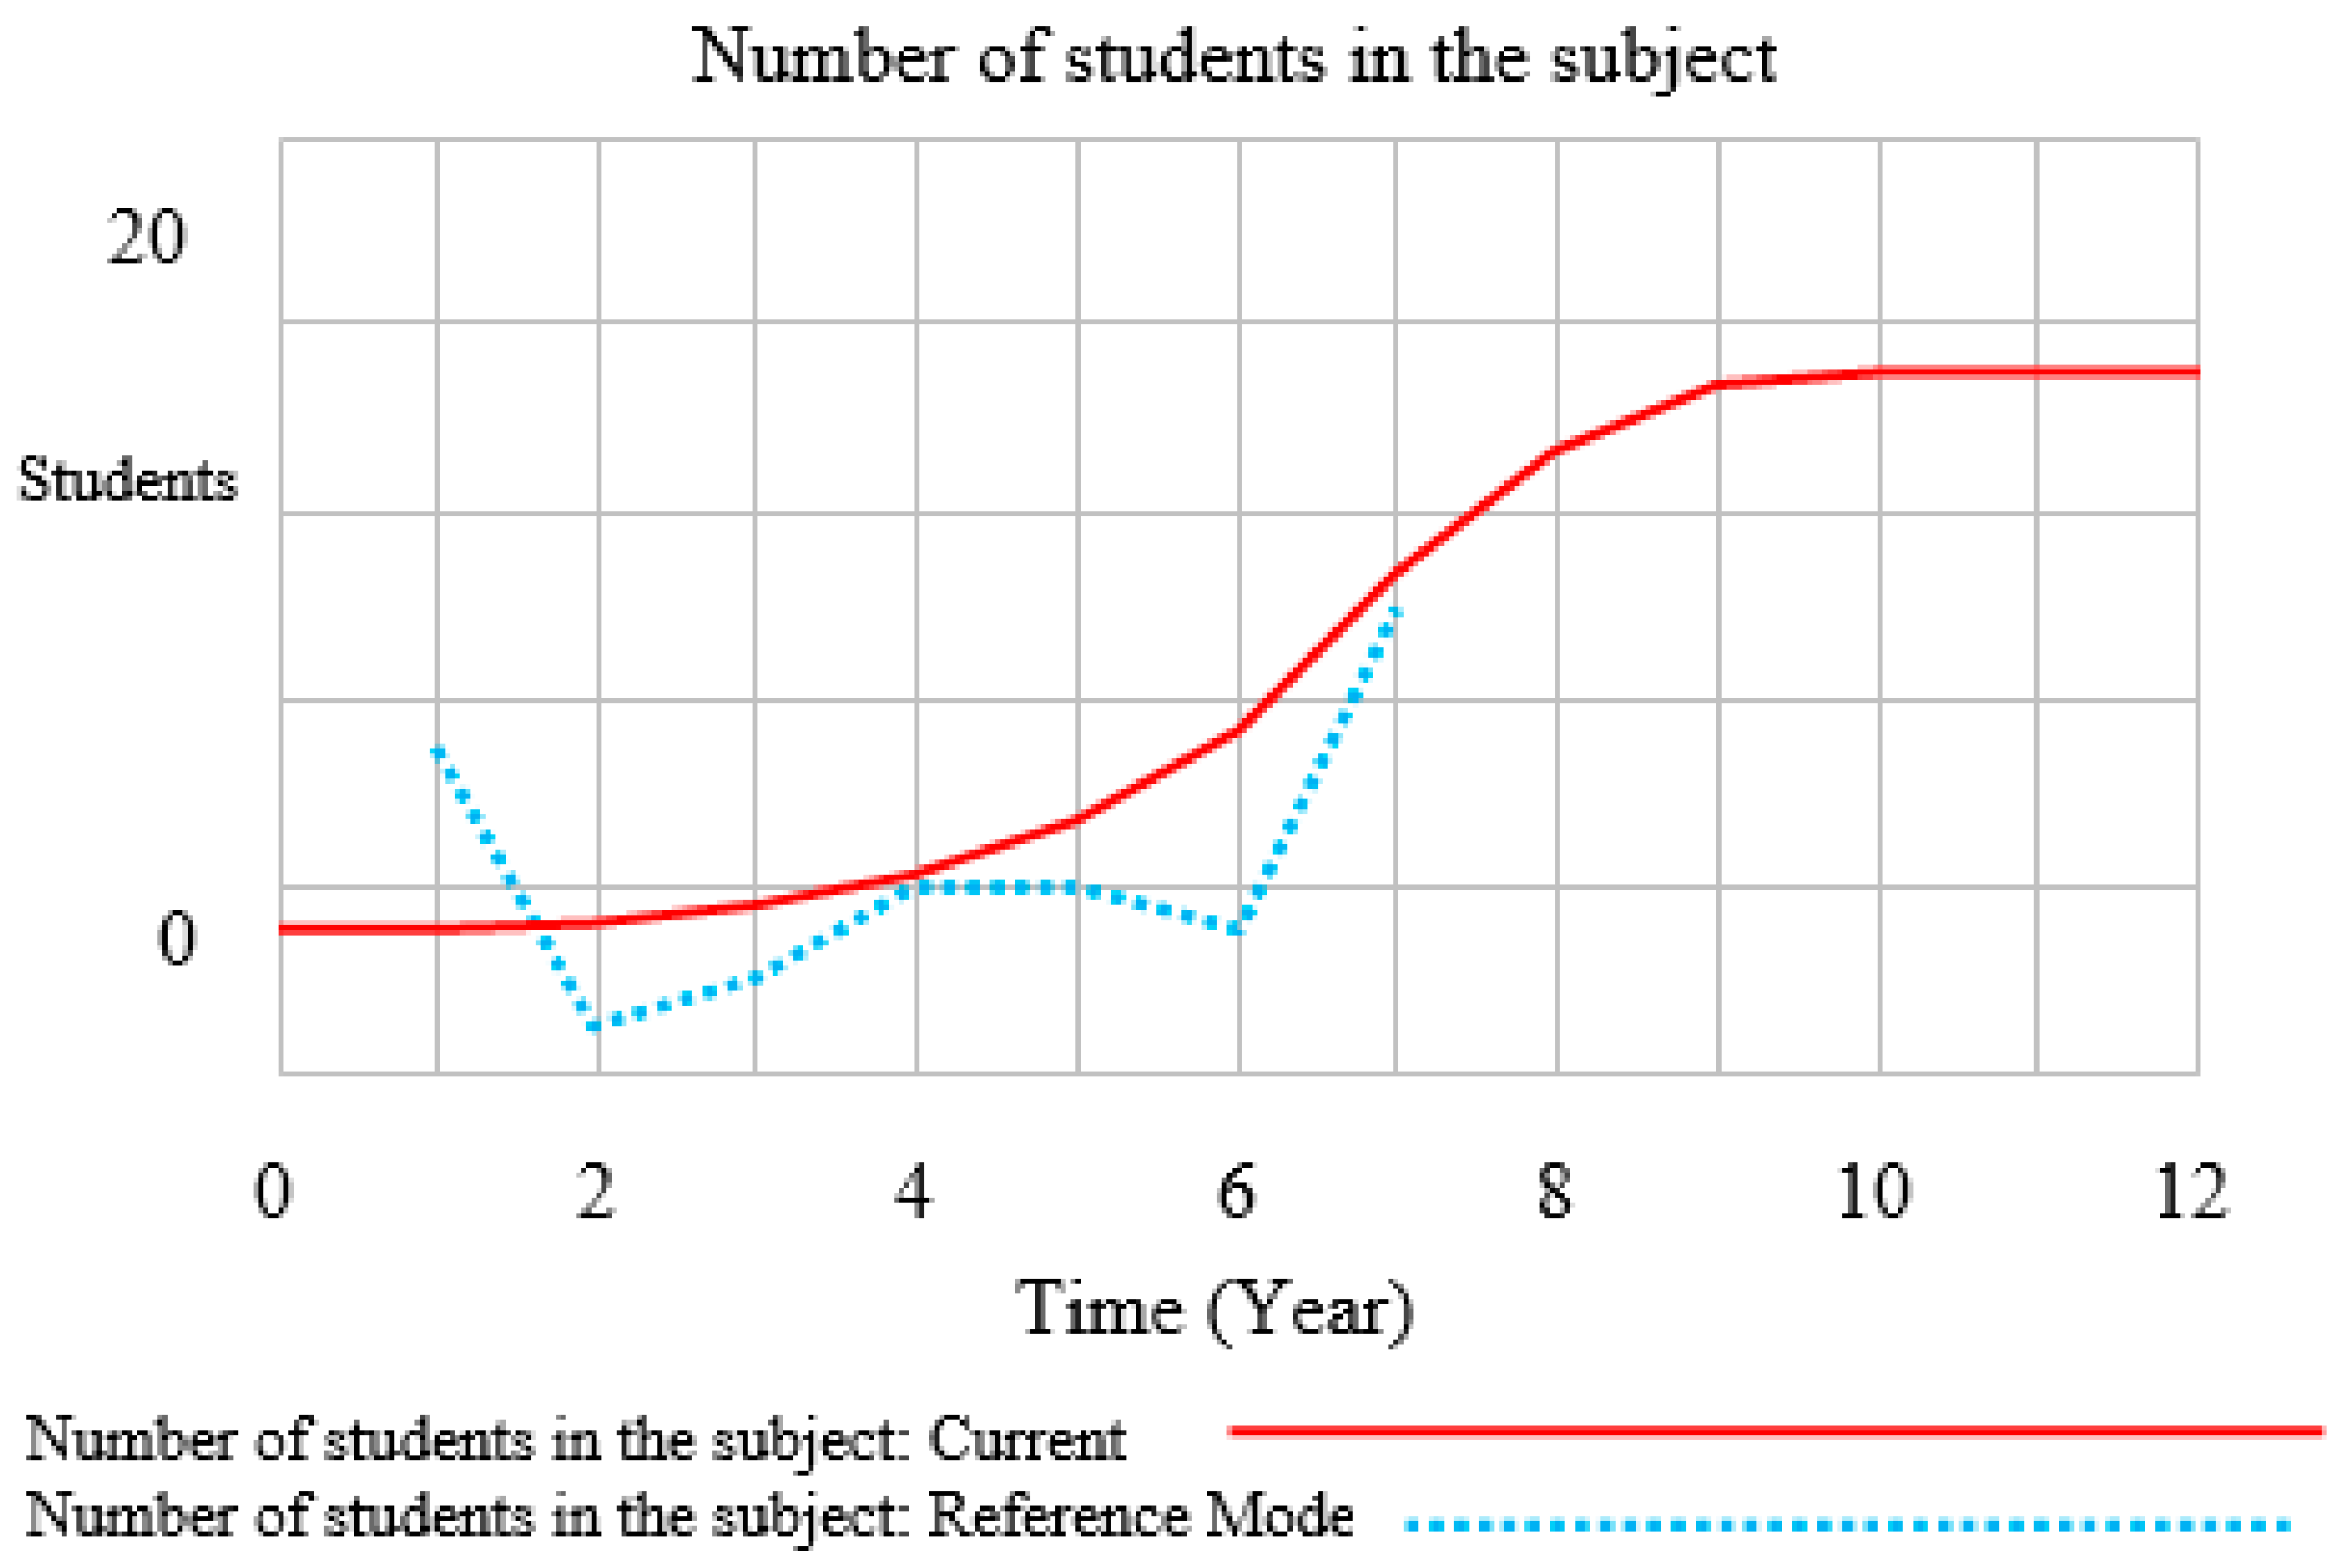
A reference mode showing the real number of students in the subject in monitored years is shown in the system dynamics model for comparison (Figure 4). Reference mode values are given up to the seventh year in the graphs (scenarios) which means 2018/2019, the last academic year of the research. Two things were changed after the academic year 2017/2018 based on the results of the research: (1) a change in the positioning of the subject in the study plan; (2) an improvement of the subject content. Although the position in the study plan was not changed, ten students registered for this subject in the academic year 2018/2019 because the content of the subject had been improved. This fact is obvious in the reference mode as a significant change in the seventh year of the modelled period (Figure 4).
The following figures describe three situations as possible scenarios that could result in relationship to the solved problem. It is assumed that the lecturer cannot influence this variable. The scenarios describe three decision-making strategies and are the fourth step of the modelling process according to Sterman [6], see Figure 5, Figure 6 and Figure 7 below. Two extreme values, 0% and 100% and one average value of 50% were chosen for the only exogenous variable in the model which is advantaged time-positioning in the study plan.
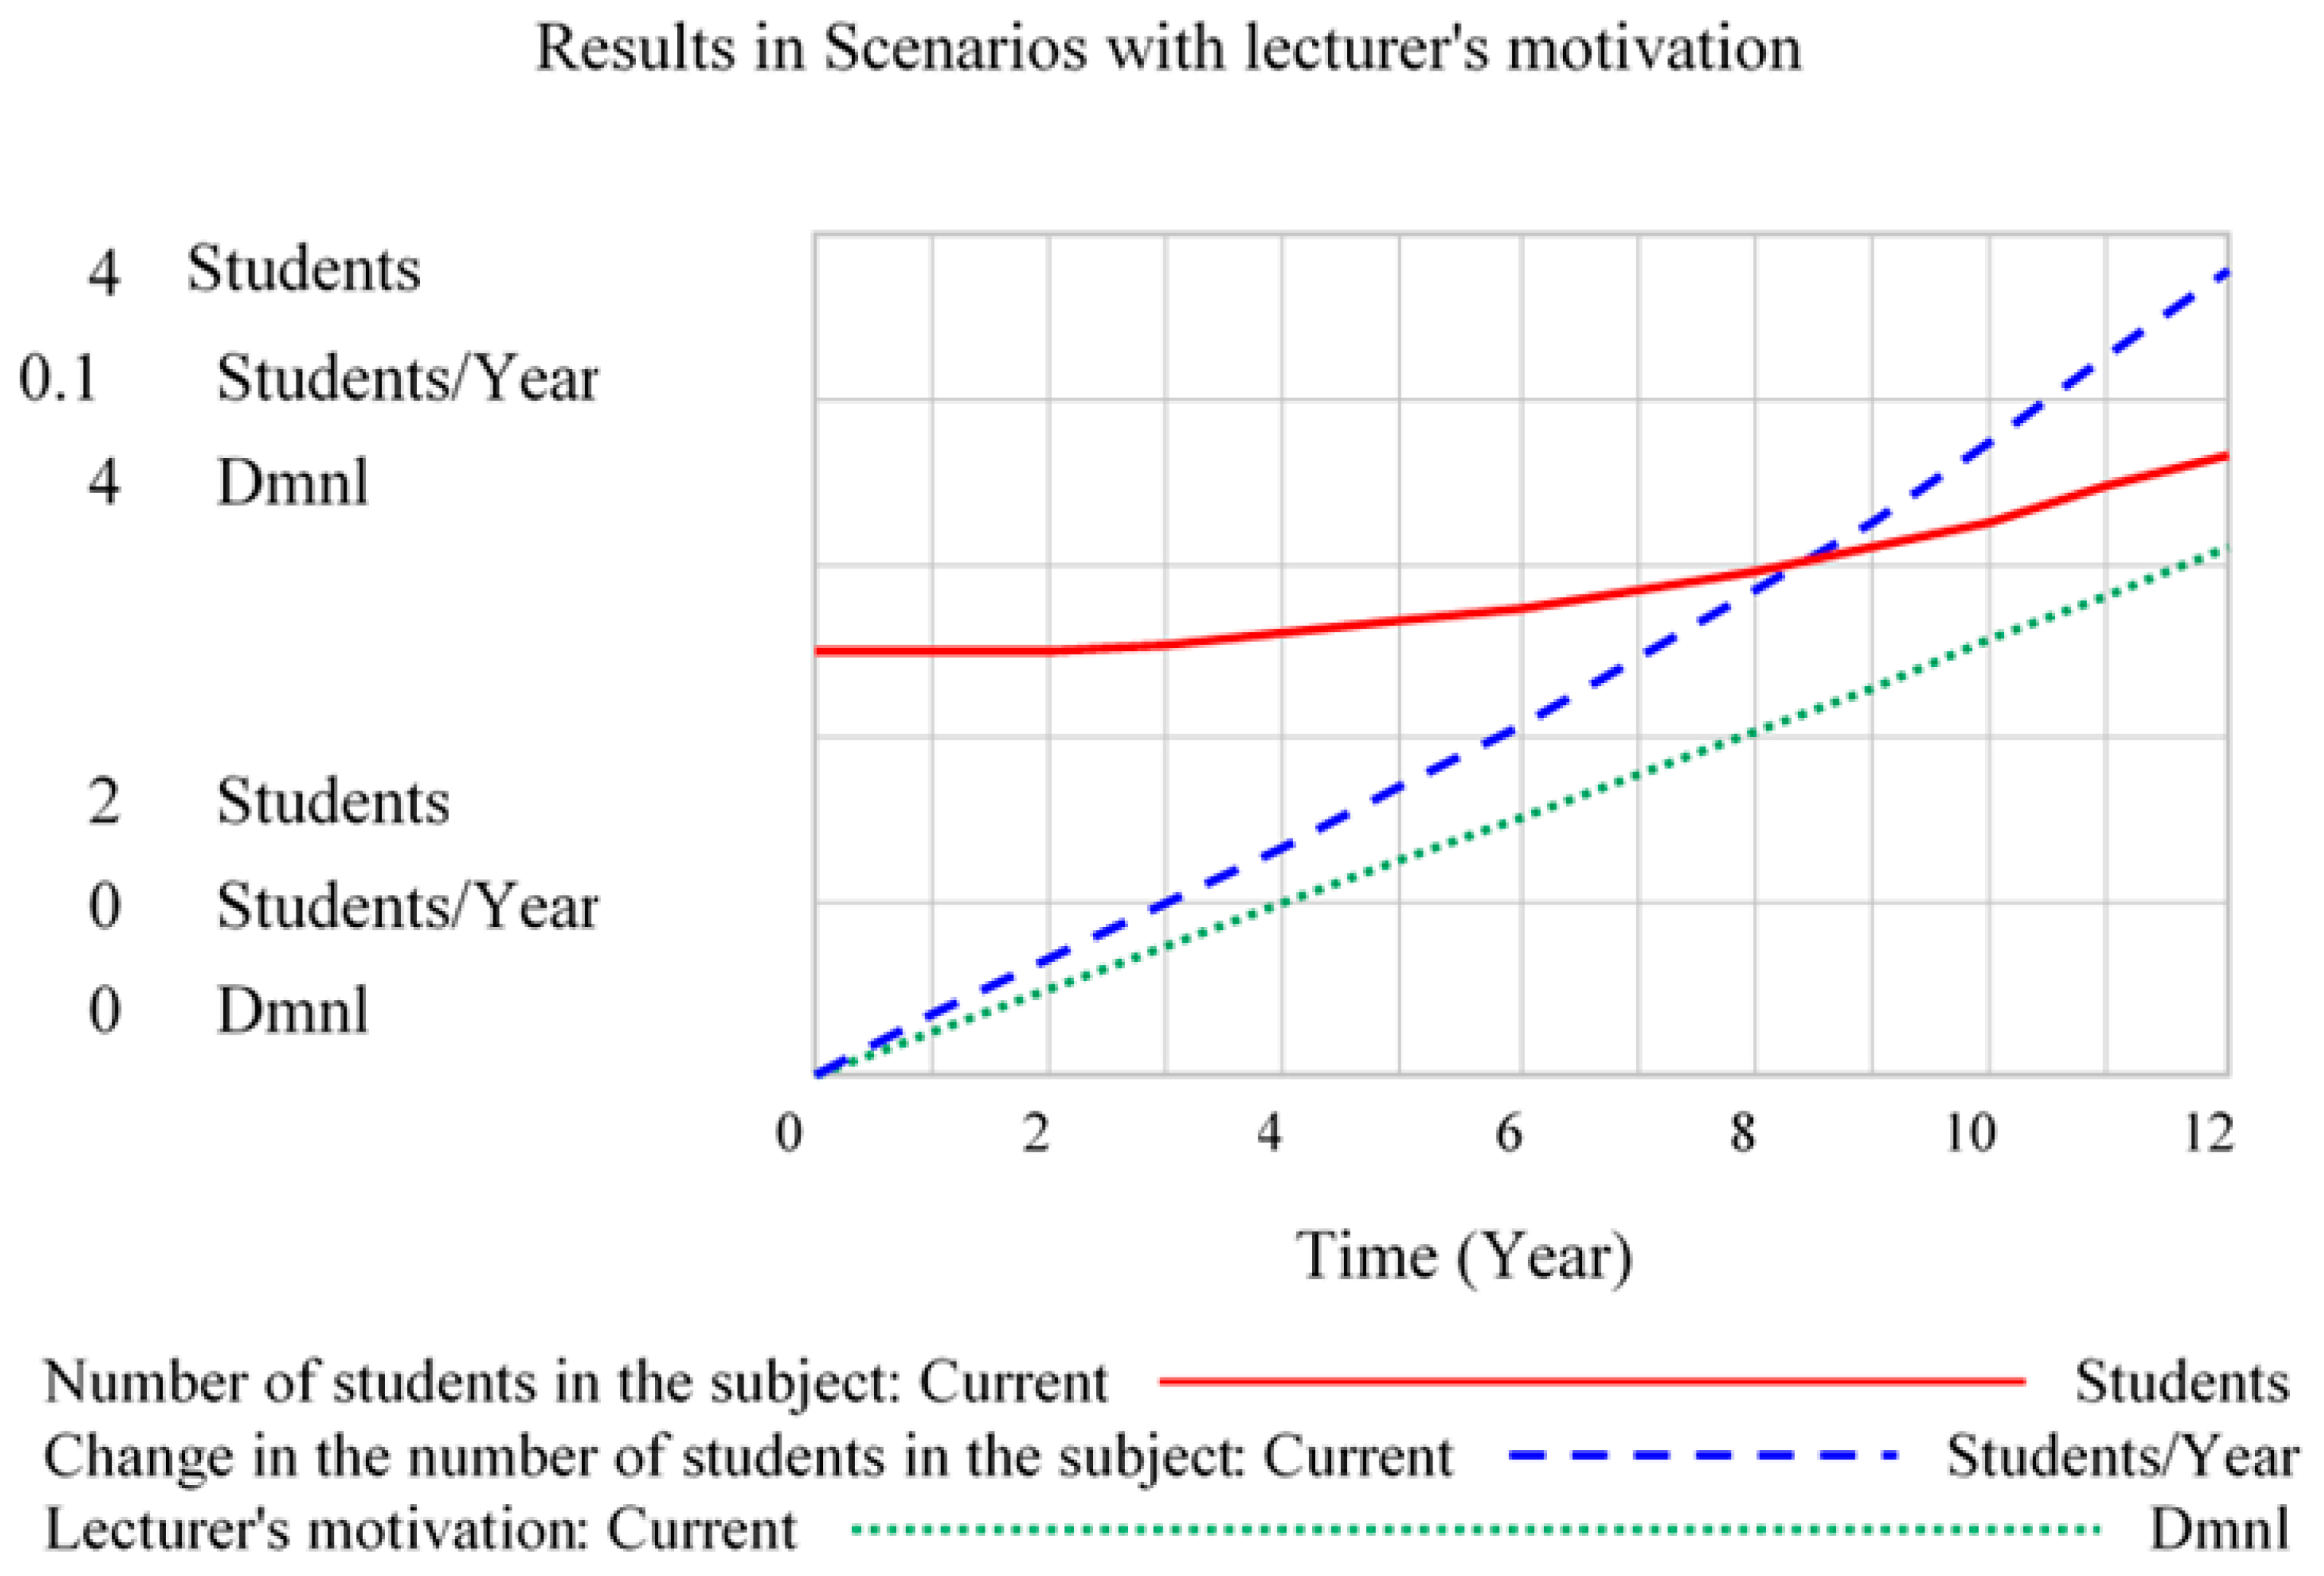
4.3. First Strategy: No Advantage in the Subject Position in the Study Plan
The exogenous variable advantaged time positioning in the study plan is 0%. The lecturer’s lack of motivation to improve the content of the subject resulted in no additional students, see Figure 5. The lecturer is only willing to improve the content of the subject if the subject is placed at a more advantageous time in the schedule. With the advantaged time position variable at 0%, the system becomes stable. The number of students in the subject does not change throughout the simulation and equals the initial conditions, that is, three students.
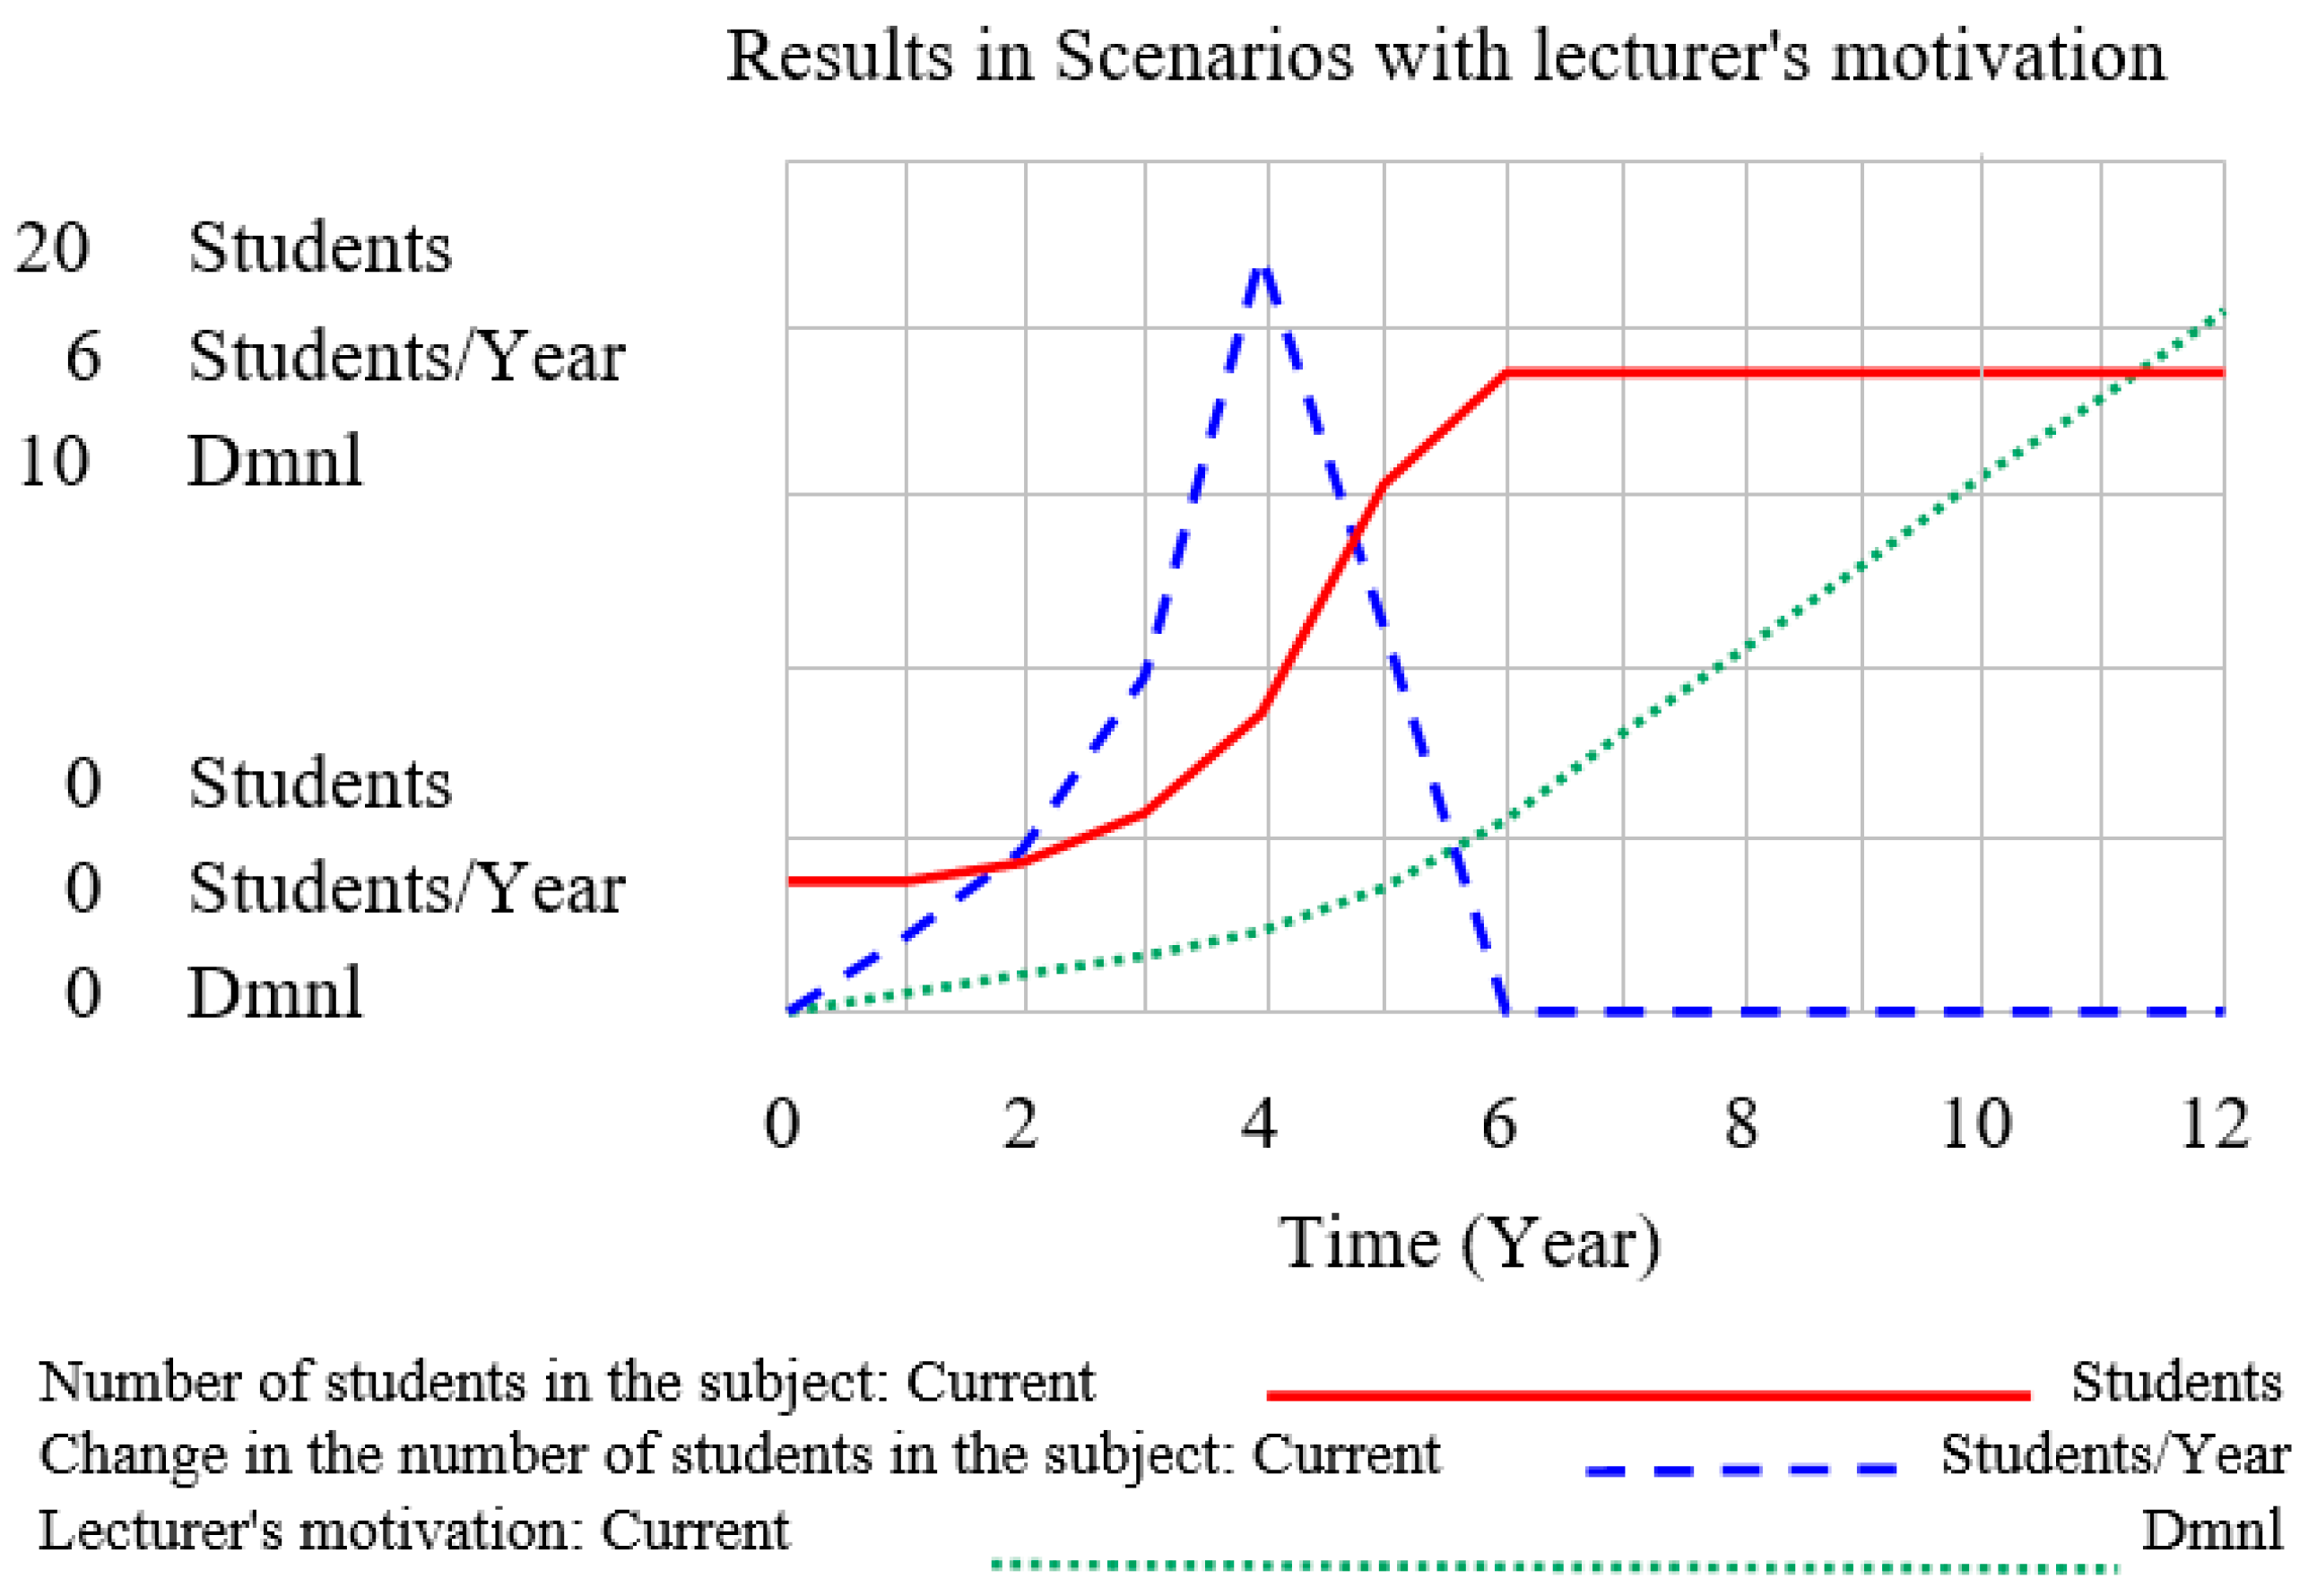
4.4. Second Strategy: A High Advantage of the Subject Position in the Study Plan
The second strategy is to place the subject in the most advantageous position in the study plan. The exogenous variable advantaged time positioning in the study plan is 100%, it means that the subject is noticeably advantaged. The lecturer tries to increase the attendance by means that are available to him/her and can be used by him/her. This means that the lecturer influences the subject popularity by improving the narrative of the subject content thus making the subject more attractive to the students. This model improved students’ interest by the fourth year of monitored time with the number reaching 15 students, see Figure 6.
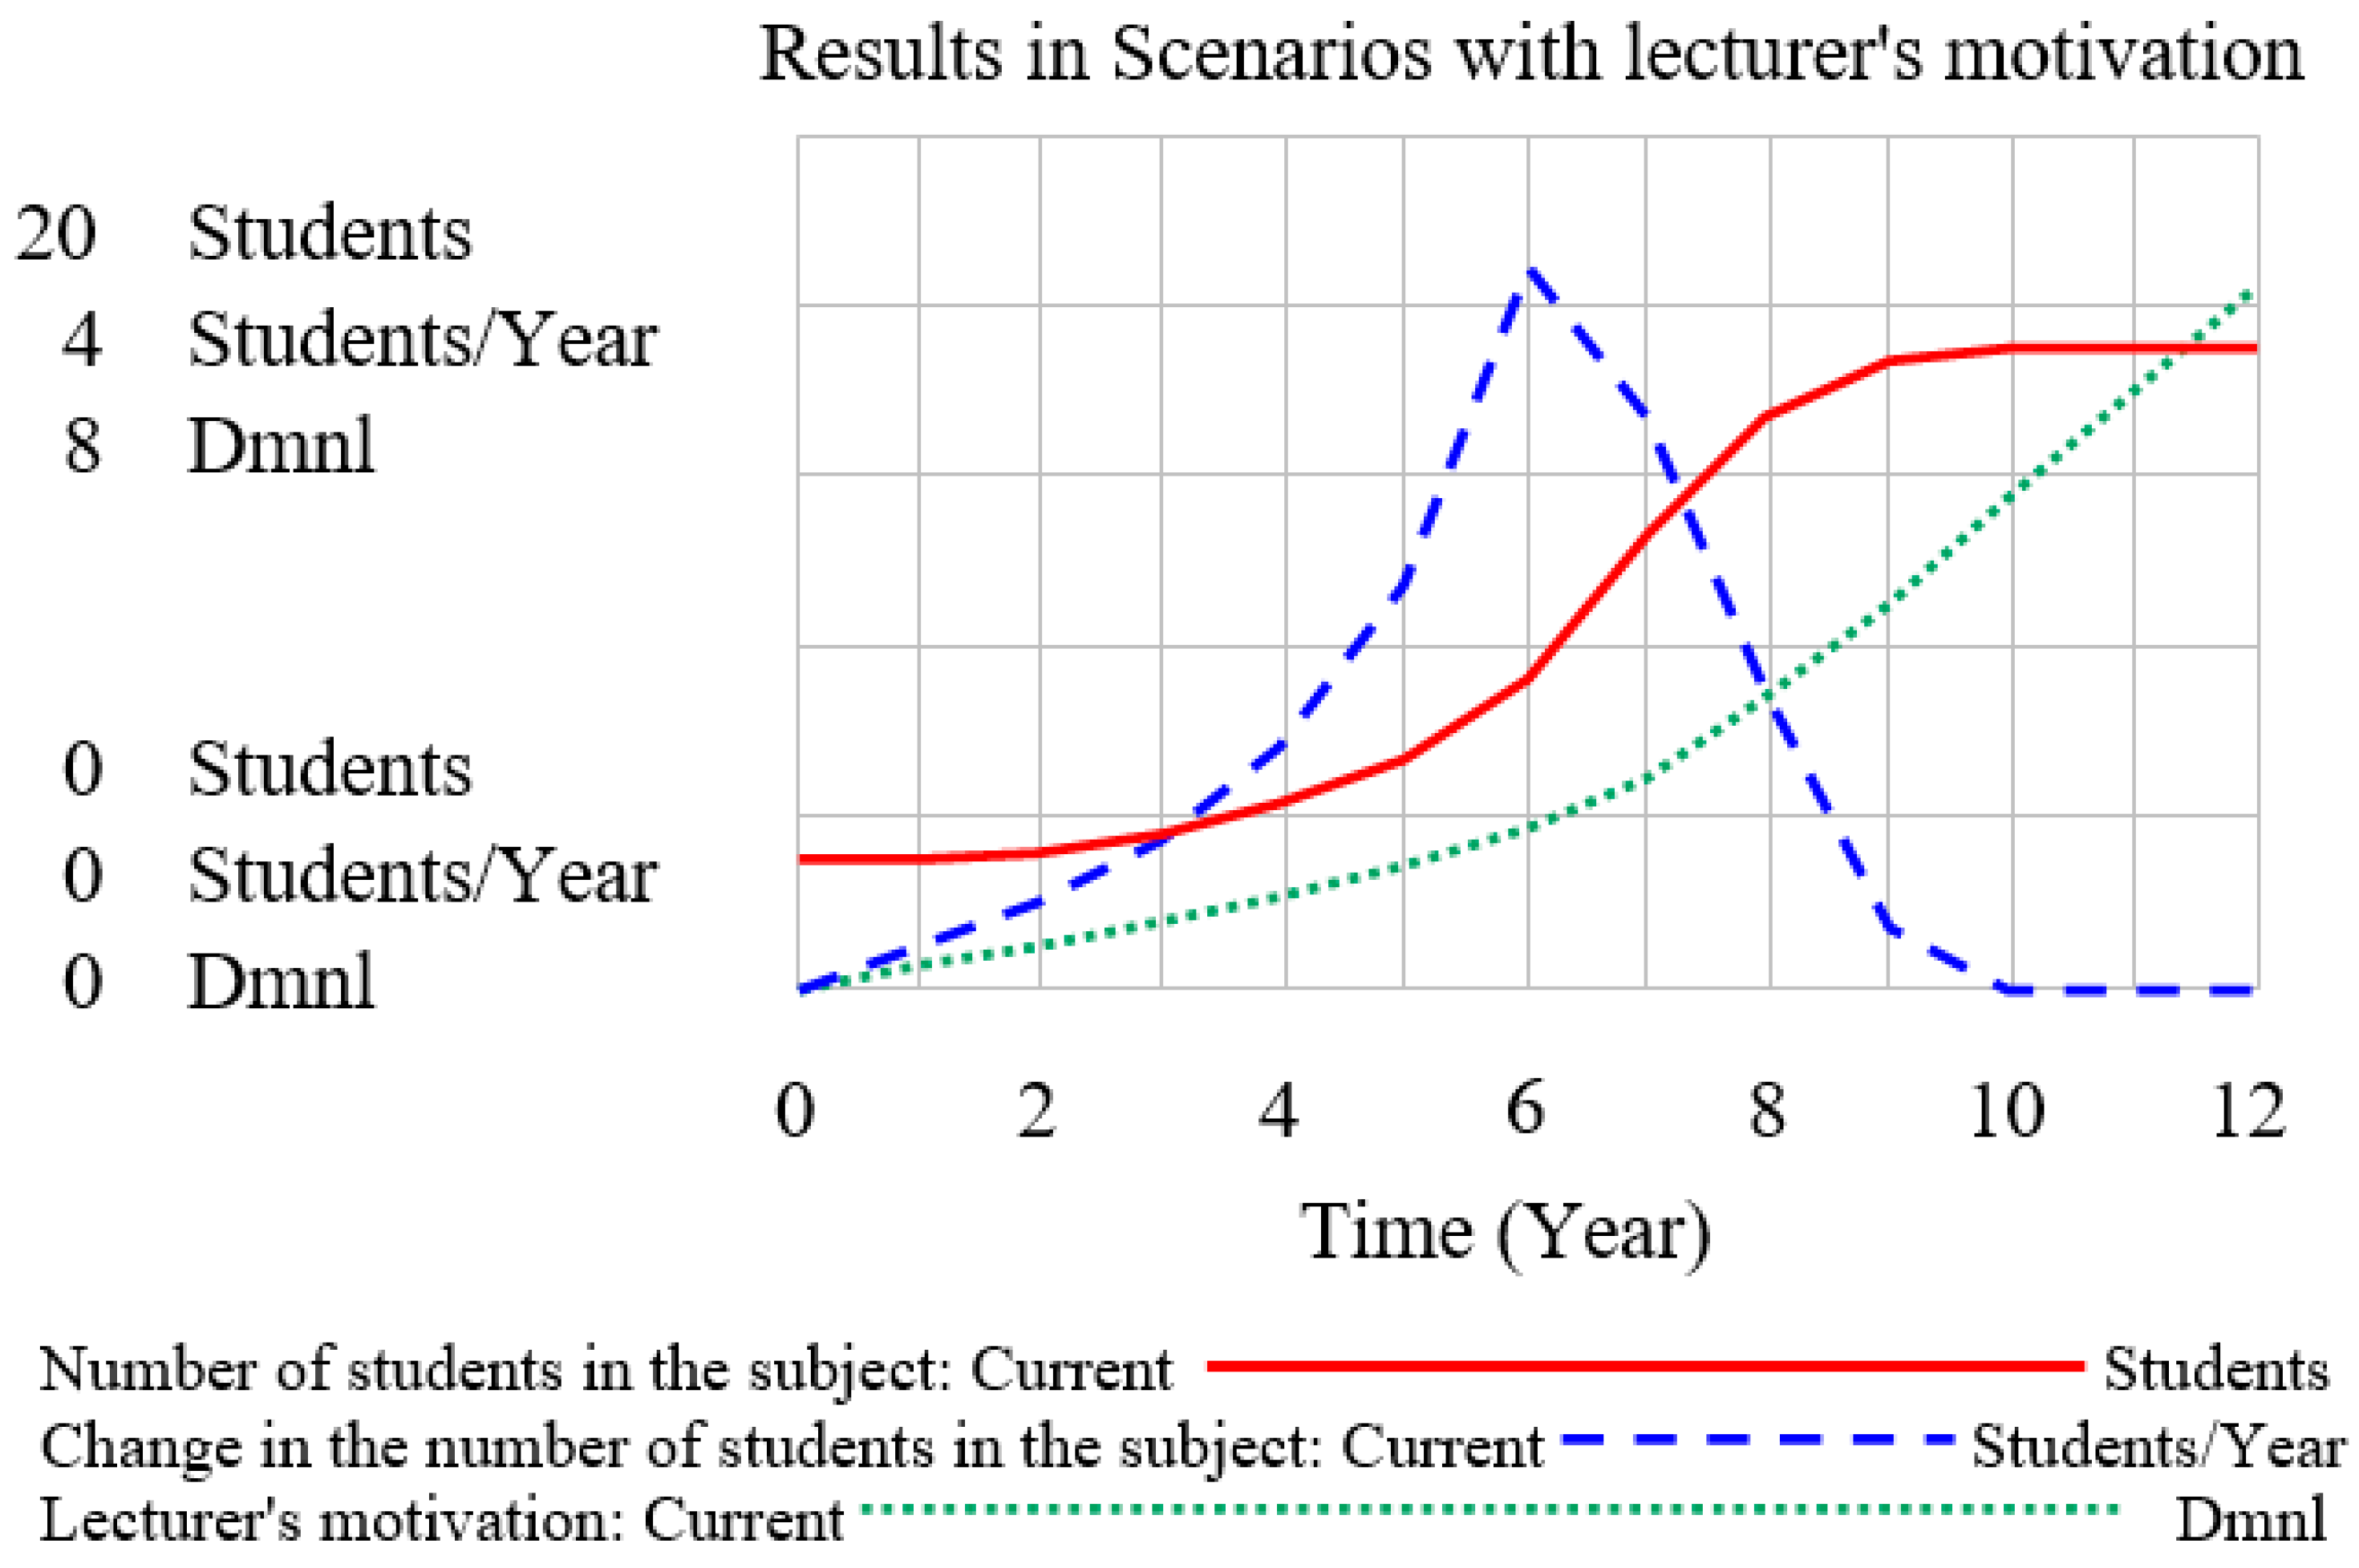
4.5. Third Strategy: Neutral Subject Position in the Study Plan Scenario
The exogenous variable advantaged time positioning in the study plan is 50%. This illustrates equal competition among other subjects that are offered to students. With this strategy, the lecturer increases the number of students from 3 to 15 students over the 9 years (see Figure 7).
5. Conclusions
The article publishes a new collection of methods of qualitative research and following methods of system dynamics modelling. The qualitative research method sequence is described and graphically prepared in the study. The communication game “Close the Loop!” enabled the researchers to compile a reinforcing loop diagram. Its main task was to define dynamic hypotheses using qualitative research which was prepared on the basis of three processes of Grounded Theory: open coding, axial coding, and selective coding. On the basis of the data gathering by qualitative research, a CLD was compiled which formulated a dynamic hypothesis: The number of students in the subject can only be increased by a better subject time positioning in the study plan. Strategies or scenarios of key variables behaviour in time may be prepared, both optimistic and also pessimistic. The initial information to compile the model was investigated first by questions and recording respondents’ answers. Then the information was analysed using the visual communication game with the respondents. The first method of qualitative research that was used, was the Grounded Theory method and its three processes: open coding, axial coding and selective coding. Using the Systems Thinking method, a CLD was compiled and dynamic hypotheses were determined. Data from qualitative research were transformed into quantitative research in the following step and a system dynamics model was created. The model was tested using three scenarios at the end.
The essence of a correct application of qualitative research methods is to understand the basic relationship between cause and effect. The template ‘A causes B to be greater or A causes B to be lesser’ is uncomplicated and therefore effective when speaking to respondents. Using this template, it is possible to prepare a basic model of backward loops quite quickly and with a high level of accuracy. The communication game “Close the Loop!” helps to visualize the addressed problem and the components that are related to the problem. To use the “Close the Loop!” game correctly, it is necessary to keep an objective distance from the problem being considered and to ask a clear question. Two problems with research methods that the “Close the Loop!” game contains can be as follows: (1) a researcher is too involved in the problem and is not able to objectively evaluate the situation; (2) respondents let themselves be manipulated by the researcher’s opinions. Therefore, it is very important for the researcher to keep a distance from the researched system and not to miss any good observations from the respondents even if they do not fit into the researcher’s assumptions. For this reason, it is recommended that two research teams are involved and solve the problem independently without any mutual interaction. If the solved problem is complex and the research question complicated, this procedure will be crucial for verifying the accuracy of its conclusions.
Supplementary Materials
This system dynamics model used in the paper (Vensim software) is available online at https://www.mdpi.com/2079-8954/6/4/41/s1.
Funding
This research was funded by internal grant number RO40182011025, “Design Thinking”.
Conflicts of Interest
The author declares no conflict of interest.
Appendix A
System Dynamics Model Documentation
Stocks
(01) Number of students in the subject = INTEG (Change in the number of students in the subject, 3) Unit: Students
(02) Confidence in the quality of the subject = INTEG (Change of the confidence, 0) Unit: Dmnl
(03) Lecturer’s motivation = INTEG (Change in lecturer’s motivation, 0) Unit: Dmnl
Flows
(04) Change of the confidence = Number of students in the subject/limitation/student’s adjustment time Unit: 1/Year
(05) Change in lecturer’s motivation = STEP (Number of students in the subject/limitation/student’s adjustment time × quality of the communication, step time) Unit: 1/Year
(06) Change in the number of students in the subject = (((MIN(Number of students in the subject, (limitation-Number of students in the subject))) × attractiveness of the subject for students/100)/student’s adjustment time) Unit: Students/Year
Auxiliaries
(07) narrativity of the subject content = (MIN(Lecturer’s motivation × impulse for change design of the subject, 100)) Unit: Dmnl
(08) attractiveness of the subject for students = MIN(((narrativity of the subject content + Confidence in the quality of the subject)),100) Unit: Dmnl
(09) impulse for change design of the subject = WITH LOOKUP (advantaged time positioning in the study plan, ([(0,0)–(100,100)],(0,0.1),(1,5),(25,10),(40,20),(50,30),(60,50),(70,60),(85,75),(100,80))) Unit: Dmnl [1,100,1]
(10) advantaged time positioning in the study plan = 50 Unit: Dmnl [0,100,1]
Model Setting
step time = 0 Unit: Year
quality of the communication = 1 Unit: Dmnl
limitation = 15 Unit: Students
student’s adjustment time = 1 Unit: Year
FINAL TIME = 12 Year The final time for the simulation.
INITIAL TIME = 0 Year The initial time for the simulation.
SAVEPER = TIME STEP Year. The frequency with which output is stored.
TIME STEP = 1 Year. The time step for the simulation.
Appendix B
Close the Loop!
This sophisticated game enables one to discover the reason why a service does not bring its expected value. The game would be categorized as part of the Discovery phase (the first phase of a design thinking process). The communicative game uses the feedback to change bad events into good ones.
Number of players: 5–10 players
Duration of play: from 30 min up to 1 h
Rules
- Ask the players a question that you want to find an answer to. The question must contain a variable that you want to change. For example, why there is such a low number of students registered in the subject? What can be done to increase the number of registered students?
- Ask the players to react to your question with the highest number of answers. Both the cause and effect of the problem are found. For instance, the problem is a low number of students in the subject. The first situation: The subject is placed in a disadvantaged time position in the study plan. The second situation: The subject is less attractive than the others are. The effect: A lecturer is not motivated to improve the subject curriculum.
- OPEN CODING. Categorize the players’ answers into groups according to the typical words that appear there. Mark the problem as a central category.
- AXIAL CODING. Interconnect categories with the arrows. Mark a cause and effect in this way. Note the number of answers also. Then find out the importance of the relationships between the categories. Categories are variables in the next text.
- AXIAL CODING. Add a polarity among the variables if it is discovered. In the case, that no polarity is found, the variables must be reformulated. A polarity always exists. For example, if A is reinforced, B is also reinforced (positive polarity) or if A is reinforced, then B will be weakened (negative polarity).
- SELECTIVE CODING. Find at least one feedback loop so the original problem will be influenced from within the mental model. Remove any variables that are not essential for problem-solving from the mental model.
- SELECTIVE CODING. Interpret a story that is written by using a feedback loop diagram. Start with any variable of the feedback loop and read as long as is necessary until the first chosen variable is reached once again. As the best start for story interpretation is very often the variable, that is a central category.
- Find a suitable managerial strategy to change in order to have a better story. Test with a team to see if your conclusion is right or not.
Strategy for playing the game
This game only seems complex. In reality, it is based on the Grounded Theory approach and also the complete Design Thinking process.
Process Discovery information about a problem starts with rules No. 1 and 2. The first step of the Grounded Theory approach is open coding (rule No. 3). It follows axial coding (rules No. 4 and 5). Process Interpretation of the research results is opened with the selective coding step (rules No. 6 and 7). Rule No. 8 enables a suggested solution, and in this way, it allows to open process Ideation. If a player continues with the design of a system dynamics model, he opens process Experimentation. By implementing the results in a real-life situation, he closes the loop of Design Thinking Process with the Evolution phase.
As soon as the players discover an elementary relationship between cause and effect, they can move ahead quickly to the next step. The game has its logical rules, and it needs only a little practice and a clear question which defines the challenge.
A problem during the game can arise when the loop has not been closed and a new variable has to be thought up and inserted into the mental model. Be careful to stay as objective as possible, or at least to keep an open mind to the players’ insights. Do not even let one be missed.
Good luck. Close the Loop!
Figure A1.
Relationships among categories and their background, generally.

References
- Lawson, B. How Designers Think: The Design Process Demystified; University Press: Cambridge, MA, USA, 2006. [Google Scholar]
- Senge, P.M. The Fifth Discipline; The Art and Practice of the Learning Organization: New York, NY, USA, 2006. [Google Scholar]
- Forrester, J.W. Learning through System Dynamics as Preparation for the 21st Century; Sloan School of Management Massachusetts, Institute of Technology: Cambridge, MA, USA, 1994. [Google Scholar]
- Kramoliš, J.; Kotásková, A. The Gap of Importance of Design in Business between 2014 and 2016. E&M Ekonom. Manag. 2018, XXI, 133–146. [Google Scholar]
- Williams, B.; Harris, B. Available online: www.bobwilliams.co.nz/ewExternalFiles/AESSD.pdf (accessed on 25 January 2018).
- Sterman, J. Business Dynamics Systems Thinking and Modelling for a Complex World; Irwin/McGraw-Hill: Boston, MA, USA, 2000; p. 982. [Google Scholar]
- Gray, D.; Brown, S.; Macanufo, J. Gamestorming, A Playbook for Innovators, Rulebreakers, and Changemakers; O’Reilly: Sebastopol, CA, USA, 2010. [Google Scholar]
- Eker, S.; Zimmermann, N. Using Textual Data in System Dynamics Model Conceptualization. Systems 2016, 4, 28. [Google Scholar] [CrossRef]
- Consenz, F. Supporting startup business model design through system dynamics modelling. Manag. Decis. 2016, 55, 57–80. [Google Scholar] [CrossRef]
- Osterwalder, A.; Pigneur, Y. Business Model Generation: A Handbook for Visionnaires, Game Changers, and Challangers; Wiley: Hoboken, NJ, USA, 2010. [Google Scholar]
- Vemuri, P.; Bellinger, G. Examining the Use of Systemic Approach for Adoption of Systems Thinking in Organizations. Systems 2017, 5, 43. [Google Scholar] [CrossRef]
- Simonsen, J.; Friberg, K. Collective Analysis of Qualitative Data. In Situated Design Methods; MIT Press: Cambridge, MA, USA, 2014; pp. 99–117. [Google Scholar]
- Bureš, V.; Rácz, F. Identification of Sustainability Key Factors Based on Capturing Dominant Feedbacks of Behavioural Stereotypes in Socio-Economic Systems. Systems 2017, 5, 42. [Google Scholar] [CrossRef]
- Richardson, G.; Pugh, P. Introduction to System Dynamics Modelling with Dynamo; MIT Press: Cambridge, MA, USA, 1981. [Google Scholar]
- Mildeová, S. Research problem description and definition: From mental map to connection circle. J. Effic. Responsibility Educ. Sci. 2013, 6, 328–335. [Google Scholar] [CrossRef]
- Strauss, L.; Corbin, J.M. Základy Kvalitativního Výzkumu: Postupy a Techniky Metody Zakotvené Teorie; Albert: Boskovice, Czech Republic, 1999. [Google Scholar]
- Glaser, B.; Strauss, A.L. The Discovery of Grounded Theory: Strategies for Qualitative Research; Aldine: Chicago, IL, USA, 1967. [Google Scholar]
- Richardson, G.P. Problems with Causal-loop Diagrams. Syst. Dyn. Rev. 1986, 2, 158–170. [Google Scholar] [CrossRef]
- Šusta, M. Průvodce Systémovým Myšlením; Proverbs: Praha, Czech Republic, 2015. [Google Scholar]
- Eberlein, R. Vensim User’s Guide; Ventana Systems, Inc.: Harvard, MA, USA, 2005. [Google Scholar]
Figure 1.
Axial and selective coding. Relations between categories according to students’ and lecturer’s opinions. Source: Author’s own diagram, 2017.
Figure 1.
Axial and selective coding. Relations between categories according to students’ and lecturer’s opinions. Source: Author’s own diagram, 2017.

Figure 2.
Casual Loop Diagram. Source: Author’s own diagram, 2017.

Figure 3.
Stock and Flow Diagram. Source: Author’s own diagram, 2018.

Figure 4.
Scenario: The graph for a scenario with the advantaged time position variable at 50% with a reference mode. Source: Author’s own diagram, 2018.
Figure 4.
Scenario: The graph for a scenario with the advantaged time position variable at 50% with a reference mode. Source: Author’s own diagram, 2018.

Figure 5.
The graph for a scenario with the advantaged time position variable at 0%. Source: Author’s own diagram, 2018.
Figure 5.
The graph for a scenario with the advantaged time position variable at 0%. Source: Author’s own diagram, 2018.

Figure 6.
The graph for a scenario with the advantaged time position variable at 100%. Source: Author’s own diagram, 2018.
Figure 6.
The graph for a scenario with the advantaged time position variable at 100%. Source: Author’s own diagram, 2018.

Figure 7.
Scenario: The graph for a scenario with the advantaged time position variable at 50%. Source: Author’s own diagram, 2018.
Figure 7.
Scenario: The graph for a scenario with the advantaged time position variable at 50%. Source: Author’s own diagram, 2018.

© 2018 by the author. Licensee MDPI, Basel, Switzerland. This article is an open access article distributed under the terms and conditions of the Creative Commons Attribution (CC BY) license (http://creativecommons.org/licenses/by/4.0/).
Share and Cite
MDPI and ACS Style
Svirakova, E. Close the Loop! System Dynamics Modelling in Service Design. Systems 2018, 6, 41. https://doi.org/10.3390/systems6040041
AMA Style
Svirakova E. Close the Loop! System Dynamics Modelling in Service Design. Systems. 2018; 6(4):41. https://doi.org/10.3390/systems6040041
Chicago/Turabian StyleSvirakova, Eva. 2018. "Close the Loop! System Dynamics Modelling in Service Design" Systems 6, no. 4: 41. https://doi.org/10.3390/systems6040041
Note that from the first issue of 2016, this journal uses article numbers instead of page numbers. See further details here.