1. Introduction
The Neolithic represents one of the most important shifts in human history. During this period, hunter-gatherers became farmers and began living in sedentary villages, depending on agriculture and livestock. For the first time, the process of neolithization took place in an extended region of the Fertile Crescent comprising Mesopotamia, the Taurus and Zagros Mountains and the Levant [
1,
2,
3]. This process is first attested between 12,000 and 10,000 BC, when the last hunter-gatherers began to have more sedentary ways of life, gradually acquiring forms of economic and social complexity. During the period that followed, or the Pre-Pottery Neolithic A (PPNA; 10,000 to 8500 BC), the first Neolithic villages appeared in which the first experiences with plant cultivation occurred. The first animal and plant domesticates are documented in the Pre-Pottery Neolithic B (PPNB; 8500 to 7000 BC). By the end of this period, domesticates prevailed over wild resources in the everyday lives and diets of PPNB societies. It is at the end of this period (around 7000 BC) that this new way of life expanded towards Europe and Central Asia.
The hunter-gatherer production mode entails a variable level of nomadism in order to avoid the depletion of resources in a specific area, to follow migrating animals or as a way of taking advantage of the seasonality of plant foods by shifting the place of residence [
4,
5]. Farming communities, on the other hand, tend towards sedentary lifestyles as cultivation needs attachment to territory and as the social and economic costs of moving extended Neolithic communities are too high. In the Near East, the hamlets where the last hunter-gatherers lived could group up to 50 or 60 inhabitants. The first fully sedentary villages appeared in the Early Neolithic. At the beginning of this period (
ca. 9000 cal BC), sites grew to around 1 ha, whereas over the course of the PPNB (
ca. 7500 cal BC) they grew to 30 ha [
6]. While it is not always clear whether the entire surface area of these sites was occupied simultaneously, it is evident that Neolithic sites shifted from grouping a few hundred inhabitants to a few thousand in a little more than a millennium. Consequently, the internal structure of villages became more complex. Communal buildings and open areas appeared, and were used for social and ritual purposes. Multi-roomed square houses, which replaced earlier round houses, surrounded these central communal structures. Living in extended villages must have presented important challenges and notably in adapting social structures to new needs [
7]. The existence of communal structures suggests the appearance of new social institutions which assured social cohesion and communal decision-making. Similarly, sedentary life would have also presented a challenge, as isolation from other groups entails risks. Such isolation would have undoubtedly provoked dramatic results, as fluid intergroup interactions are crucial for the sharing of information, resources and genes.
In human societies, intergroup social interaction is often associated with the exchange of valuable and commonly exotic objects [
8]. The analysis of the presence of these kinds of objects allows intergroup relationships to be quantitatively studied. Obsidian was a valued commodity exchanged at long distances in the Neolithic Near East, and the analysis of its exchange during this period permits us to study the inner workings of early interaction networks.
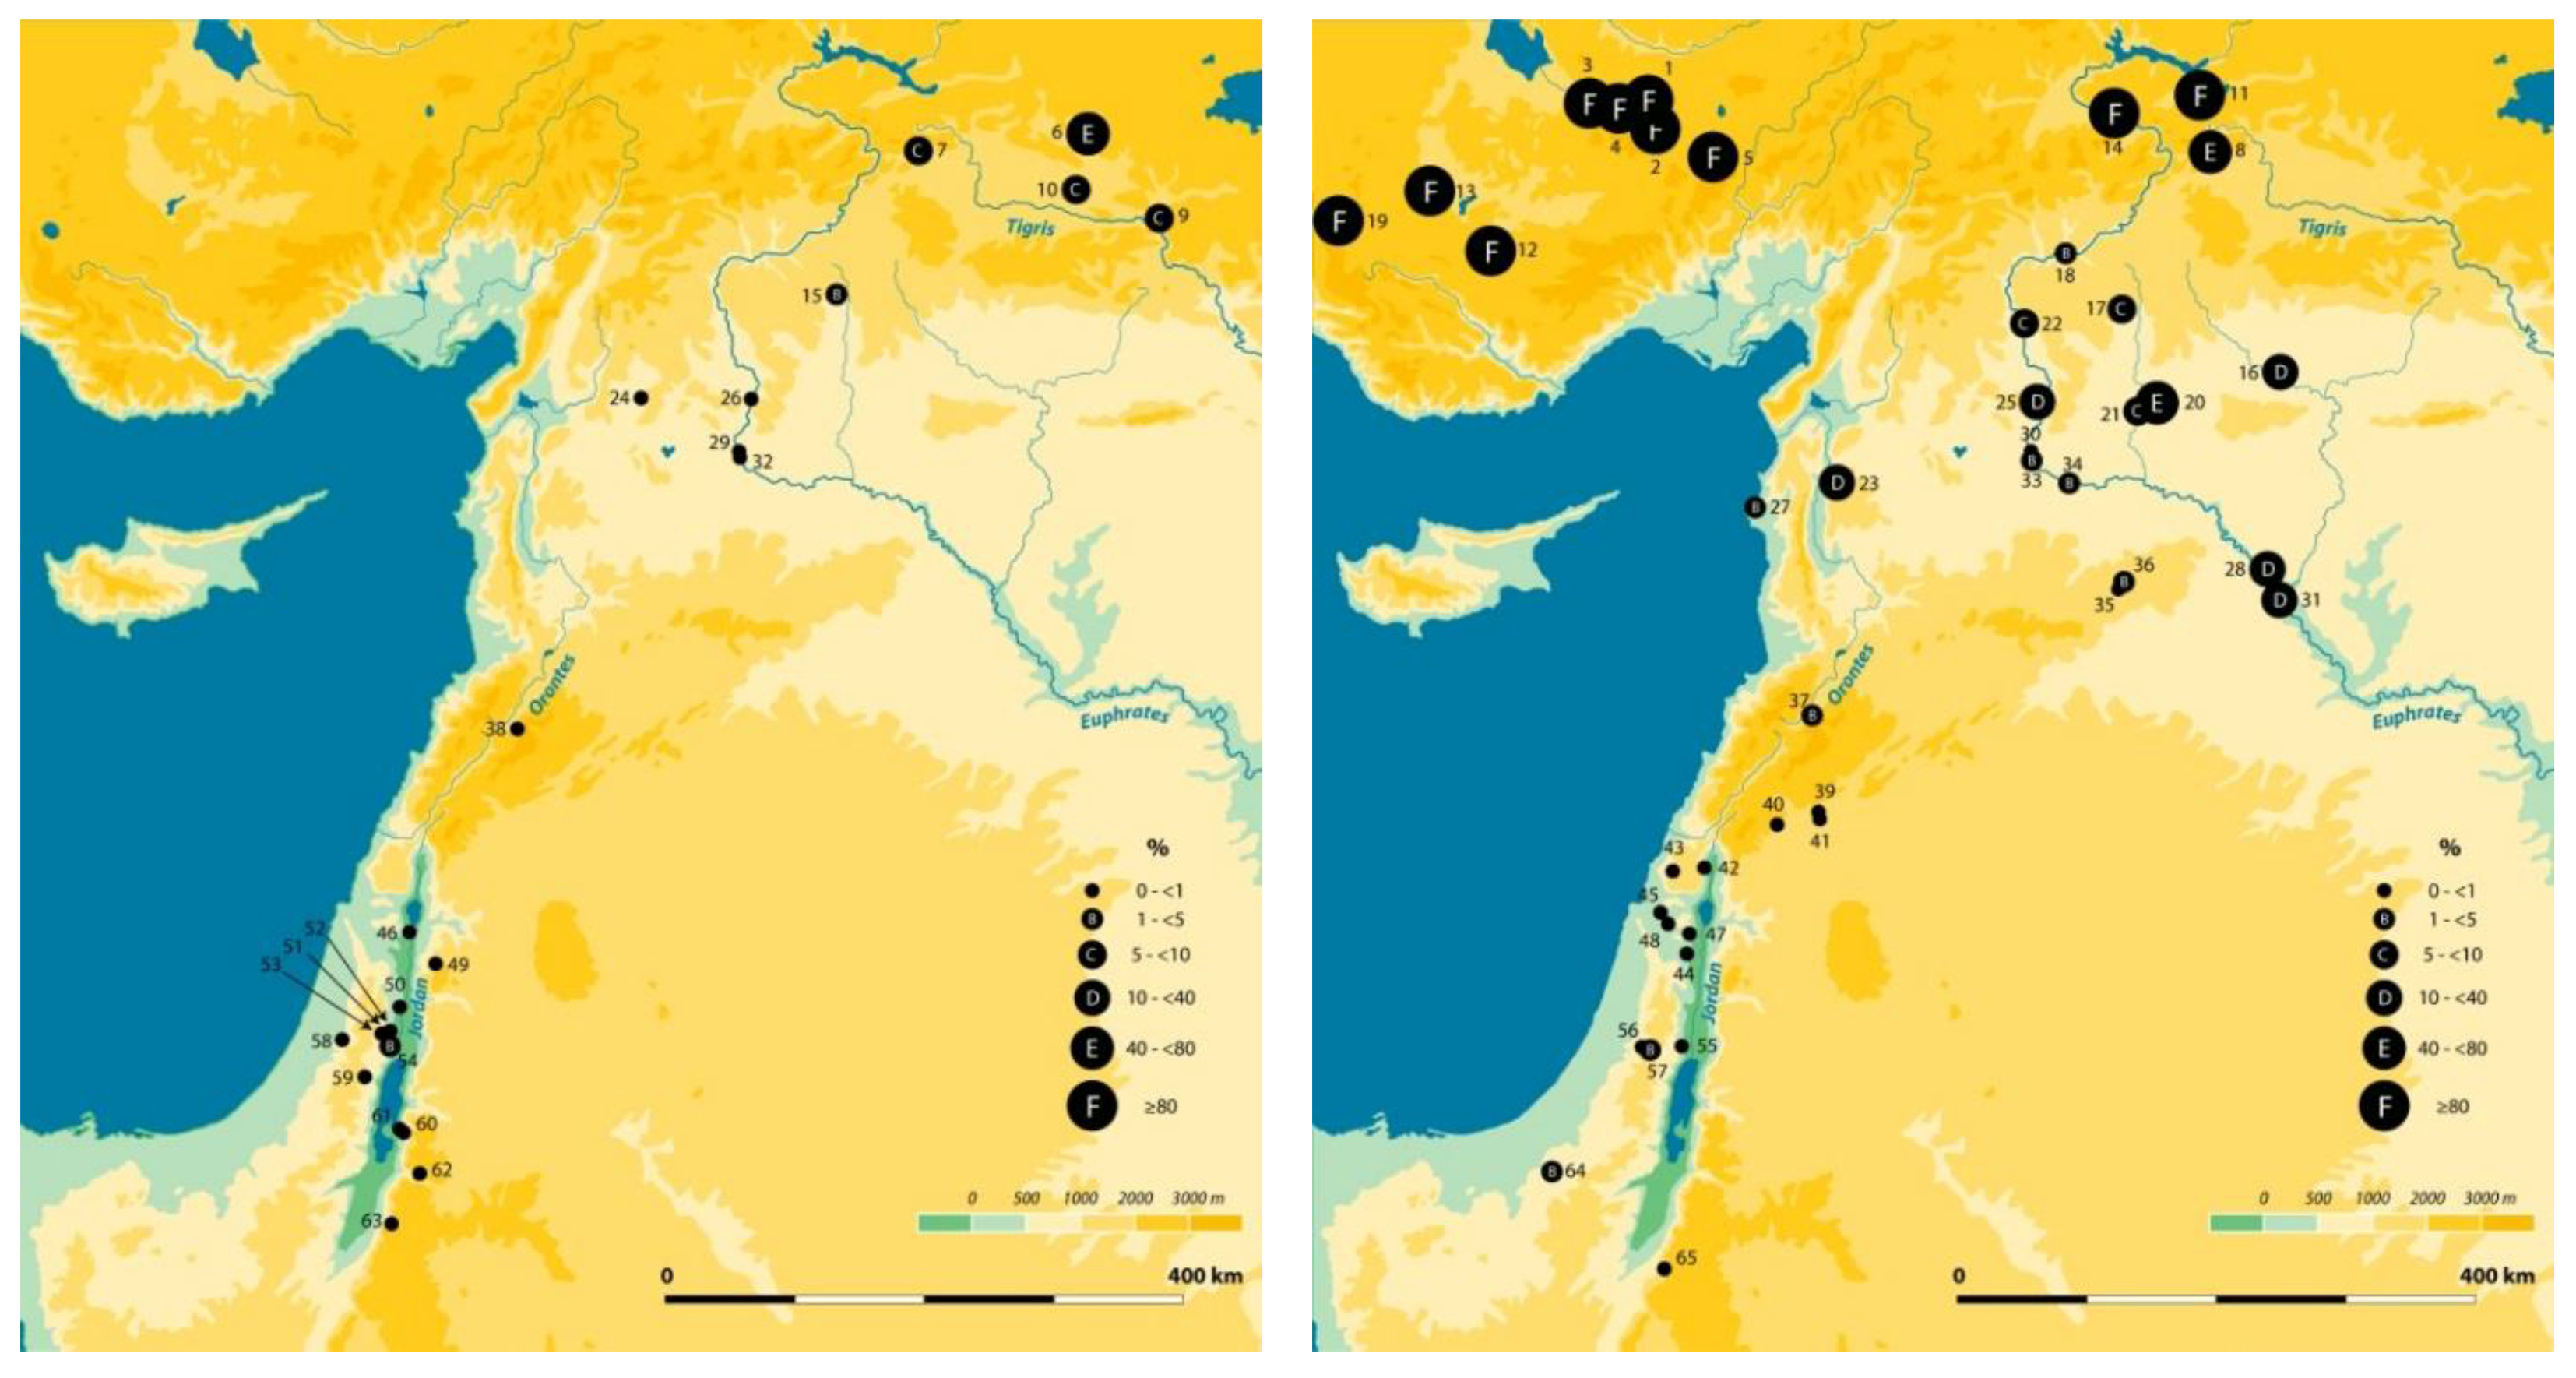
Obsidian from Central and Eastern Anatolia was exchanged at very long distances across the Fertile Crescent during the early stages of the Neolithic [
9,
10,
11] (
Figure 1, see
supplementary materials Table S1 for raw data and references) and was predominantly used for making tools. Programs dedicated to obsidian source characterization have provided the geological and archaeological data needed to match obsidian artifacts to specific sources [
12,
13].
In this paper, we infer how inhabitants of these first villages organized systems of interaction with other villages. In order to do this, we focus on the case of Neolithic obsidian exchange as it provides a tangible window into prehistoric inter-group relations. Linear regression techniques were used by C. Renfrew during the 1960s [
14,
15], demonstrating the correlation between the quantity of obsidian present in each site and the distance from the site to obsidian sources. He assumed that the obsidian fall-off curve was due to the existence of a down-the-line model of exchange, a kind of regular network of interaction between Neolithic villages. We do not agree with this second assumption and we try to demonstrate that complex networks of exchange instead of regular ones should have existed. Exchange networks can be replicated and tested by resorting to agent-based modelling (ABM), as they are complex systems which evolve with time. Using ABM, whereby agents are equivalent to Neolithic villages, we explore the relevance of different variables that may have had a role in systems of obsidian exchange. Our models are built based on archaeological data and the available ethnographic record on exchange in archaic farming societies. For the latter we concentrate mainly on ethnographic examples from New Guinea (NG). The results of our models are then compared with the archaeological data, allowing us to suggest more plausible scenarios for obsidian exchange mechanisms during the Neolithic. This is carried out by comparing between spatial data on obsidian distribution in our models and the archaeological record. Our research shows that a complex network of obsidian exchange was established from the outset of the Neolithic and that this network became more complex through time. Finally we discuss the significance of this intra-village interaction network for the Neolithic cultural transmission that occurred over a large area in the region. This paper represents a new step in ongoing research which has already resulted in two previous publications [
16,
17].
2. Materials and Methods
ABM and simulation intend to artificially build systems composed of autonomous interacting agents. This approach is especially useful for understanding the dynamics of complex systems where multiple variables interact and evolve in time and space. By modelling systems involving agents and their interactions, self-organized patterns often emerge, which are not explicitly programmed into the models but arise through agent interactions. ABM has been used in many different fields of research and its use in the social sciences [
18,
19] and in archaeology is gaining momentum [
20,
21,
22,
23,
24]. We also use complex network theory as a source for establishing our methodology [
25,
26,
27]. It is acknowledged that in addition to simple networks which are purely regular (each node is connected to all its neighbors) or purely random (each node is randomly connected to any other node), other complex networks existed where nodes were connected to their neighbors, while certain other nodes were also linked to distant nodes, showing non-trivial topological features (These features include a heavy tail in the degree distribution, a high clustering coefficient, assortativity or disassortativity among nodes, community structure, and hierarchical structure). Watts and Strogatz [
28] established that networks are defined by path length
L(p), the property measuring the mean separation between two nodes, and by clustering coefficient
C(p), measuring the degree to which agents tend to group together in local neighborhoods. Path length
L(p) involves the number of nodes an agent needs in order to cross the network. Clustering coefficient
C(p) measures to what extent nodes are preferentially linked to their near neighbors (nearest nodes) rather than to distant nodes. This is measured by the proportion of links that really exist between nodes within a neighborhood, divided by the number of links that could possibly exist between them.
In our modelling (source code accessible at
www.opeanabm.org), the Near East was reproduced as a rectangular domain measuring 400 km × 900 km. We randomly placed
villages, which are both the nodes constituting the network and the agents exchanging obsidian with other villages, in a space modelled to abstractly mimic the geography of the Near East according to a Poisson distribution (We are aware that the distribution of Neolithic village was not stochastic, as they were more densely located in the Northern and Southern Levant, with lower densities in the Central Levant. However, for evaluating this parameter adequately, we should bear in mind that the distribution of the archaeological sites currently known is partially affected by differential intensity in surveys and excavations carried out in different regions of the Levant. For this step of our analysis, we explore simple models and use a Poisson distribution for the positioning of sites in the modelled space whereby sites can be progressively distributed independently of the place where the previous site was located). Obsidian is introduced into the network from the northern boundary of the domain, so as to reproduce the presence of several natural obsidian outcrops north of the study region. Villages located at a distance of
(in km) from the northern source zones were allowed to produce a fixed quantity of obsidian at each time step according to the expression
, where
represents the distance (in km) from the village to the northern boundary. This means that associated transport costs reduce the production capacity of further villages according to the rate
.
(in km), which is an estimate of the maximum radius that Neolithic societies would have moved from their homes in order to look for resources/partners.
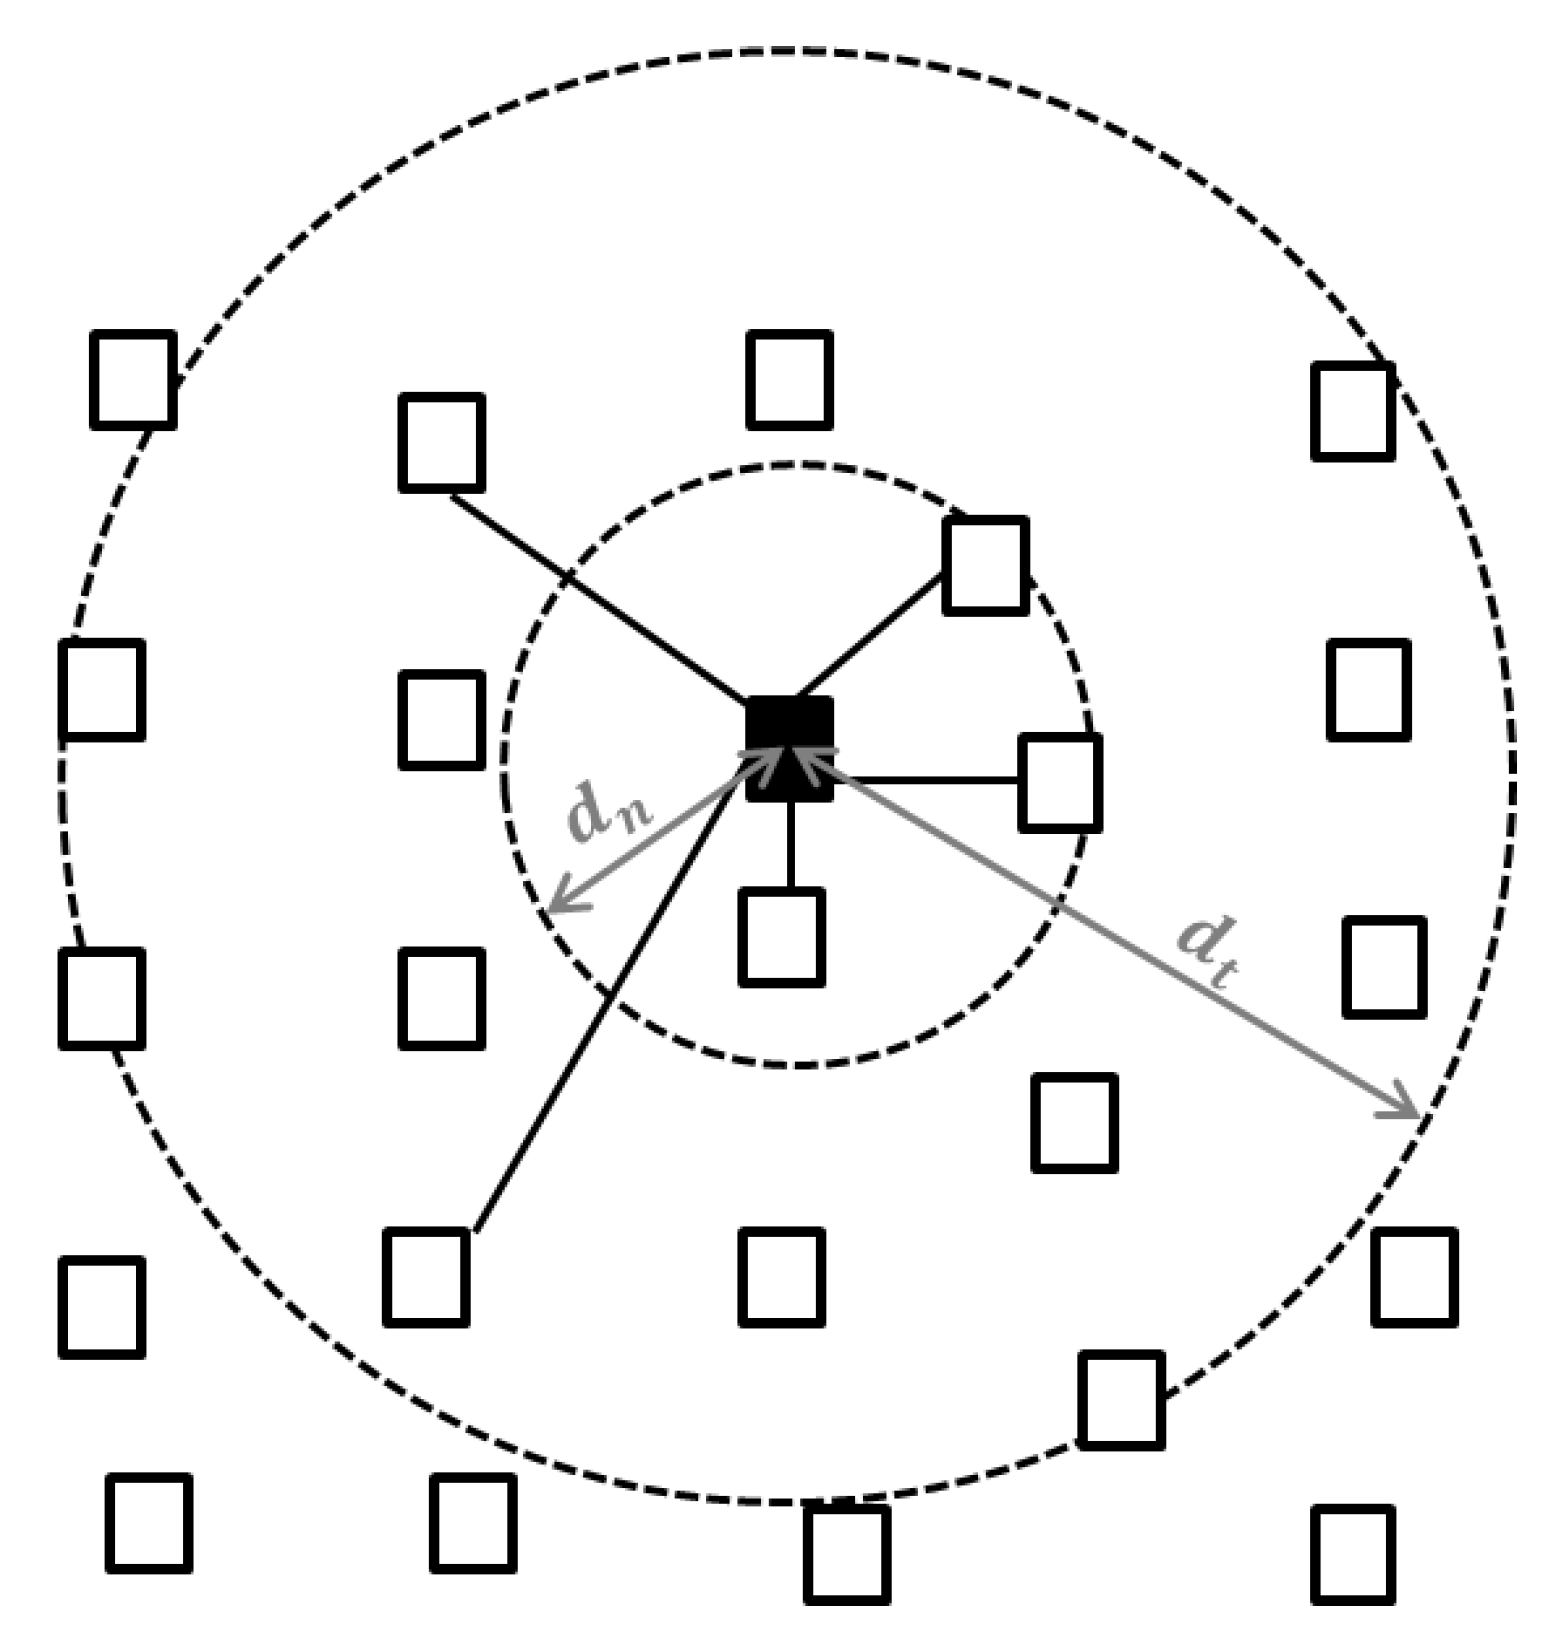
In order to construct the network that mediates obsidian exchange, all villages that are within a distance
dn (called the neighbor distance) from each other, are assumed to be permanently linked (
Figure 2). This would draw a regular network of exchange, where any node is exclusively connected with its neighbors. However, in order to test the viability of more complex exchange networks, some nodes were also allowed to connect to more distant partners in our trials. In this case, for each time step, each node is given (with probability
) the possibility to create or renew one of the
distant links it has with any of the villages which are further away than
from it but within a distance
(which represents a maximum travel distance). This introduces a dynamic generation of long-distance links that are not fixed in time but evolve dynamically during the simulation.
Two types of attachment criteria for the establishing and renewal of these long-distance nodes have been explored here, resulting in two scenarios of complex networks of obsidian exchange, which we have called ODLa and ODLb (ODL = Optimized Distant Link). In a first scenario, the ODLa, obsidian could have been one of many commodities offered for exchange. In this case, preferential exchange partners would have been those who could offer more exotic commodities in general. This scenario can be modelled considering that the selection of partners would have been directed at partners with the most numerous distant links, irrespective of the quantity of obsidian they had. In a second scenario, obsidian can have been exchanged as a commodity which was specifically sought after by Neolithic communities. In this case, exchange partners who provided more obsidian would have been more desirable. This scenario, the ODLb, can be modelled; whenever a village is given the opportunity to renew the distant exchange partner, the new link will only replace the previous one if the quantity of obsidian present in the new candidate is greater than that of the previous partner.
All of the obsidian produced or obtained through exchange by a village during each time step is divided into (i) a fraction that is meant for consumption and (ii), a part that is shared between all partners possessing less obsidian at that particular time step (so as to prevent unlikely obsidian exchange with richer nodes in the network). The specific fraction that is given to each partner can be equitable or proportional to the distance between the two villages. If we define as the distance between two nodes and , the fraction assigned by the node to its neighbor can be expressed as , where the sum is performed with all of the neighbors of that are susceptible to receive obsidian. This rule introduces the idea that costs associated with longer travel would be justified by larger exchange rates, which could also be interpreted as a mechanism to stimulate, maintain and strengthen links with distant partners.
The evolution of obsidian quantities in each node (node = village) was computed over the course of a period of approximately 3000 steps (each time step corresponding to one annual period), so as to reproduce the real time scales for the period of interest.
To generate the results reported here, we needed to extract the following information from the model (in all of the cases, averages of over 100 different trials are used):
(i) The obsidian to flint ratio at a given distance is calculated by grouping all nodes that are at a similar distance from the northern boundary of the domain and by averaging all of their obsidian consumption. Specifically, we use a step length of 15 km, so that all nodes whose distance to the northern boundary is within the range are grouped into one single class. The corresponding averages are then normalized with respect to the value obtained for the first class (that is, within the range ), which is arbitrarily assigned a value of 100;
(ii) The path length is estimated by measuring the minimum number of links that need to be covered to reach one node from the other, for each pair of nodes in the network. If we make
the minimum path distance between nodes
i and
j, then the clustering coefficient is defined by the average
where the sum is performed over the
pairs of nodes one can find in a network of
nodes;
(iii) The clustering coefficient is defined as the probability that if nodes
and
are each linked to
, then
and
are also linked to each other. Such a probability is calculated explicitly by accounting for all possible neighbor to neighbor combinations in the network. This average can be mathematically expressed as
where
is the number of neighbors of the
-th node, and the second sum is performed over all the pairs
neighbors of the
-th node, with
denoting a bivaluate function that takes the value
if nodes
are all linked to each other, and otherwise takes the value
.
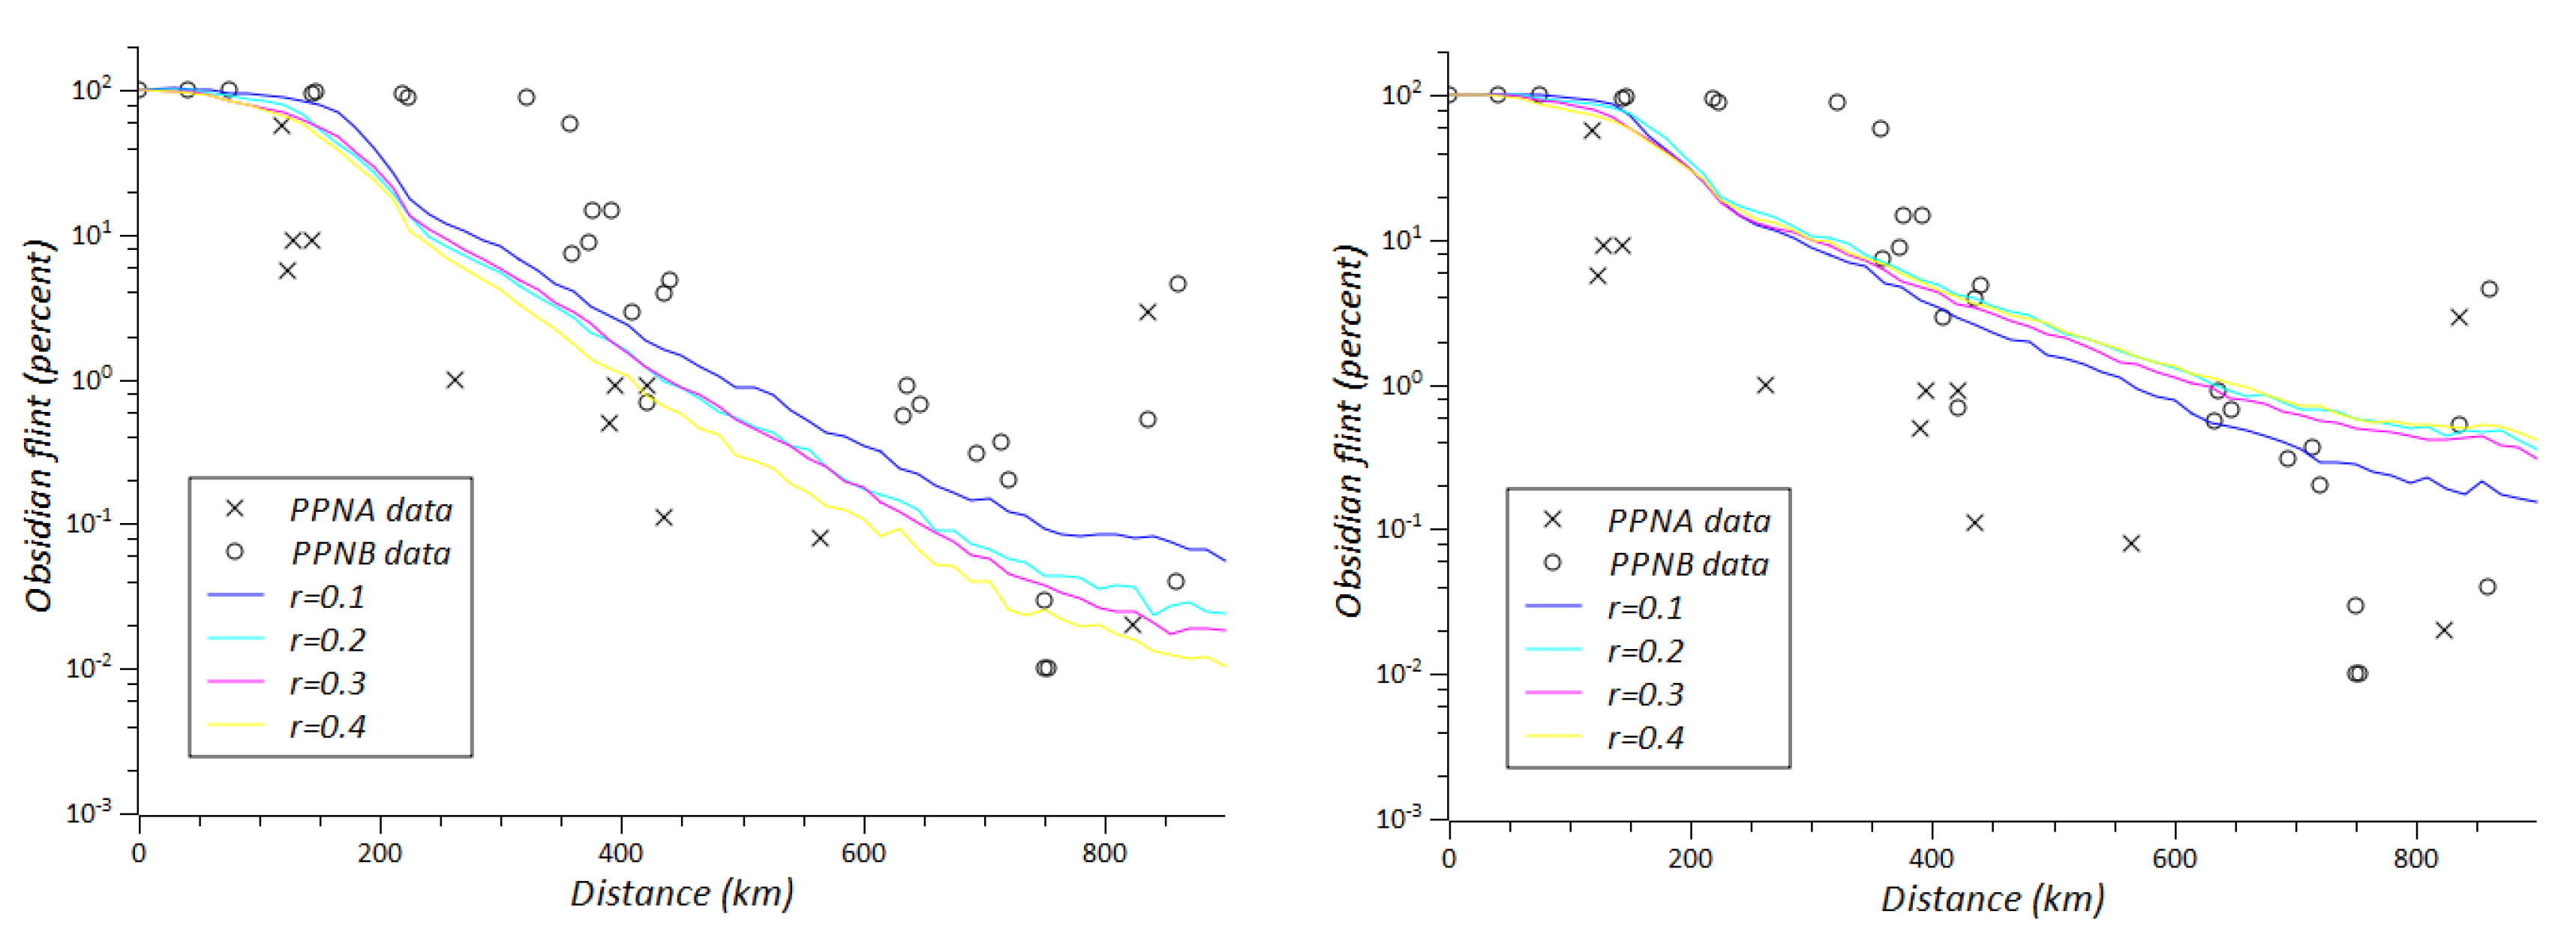
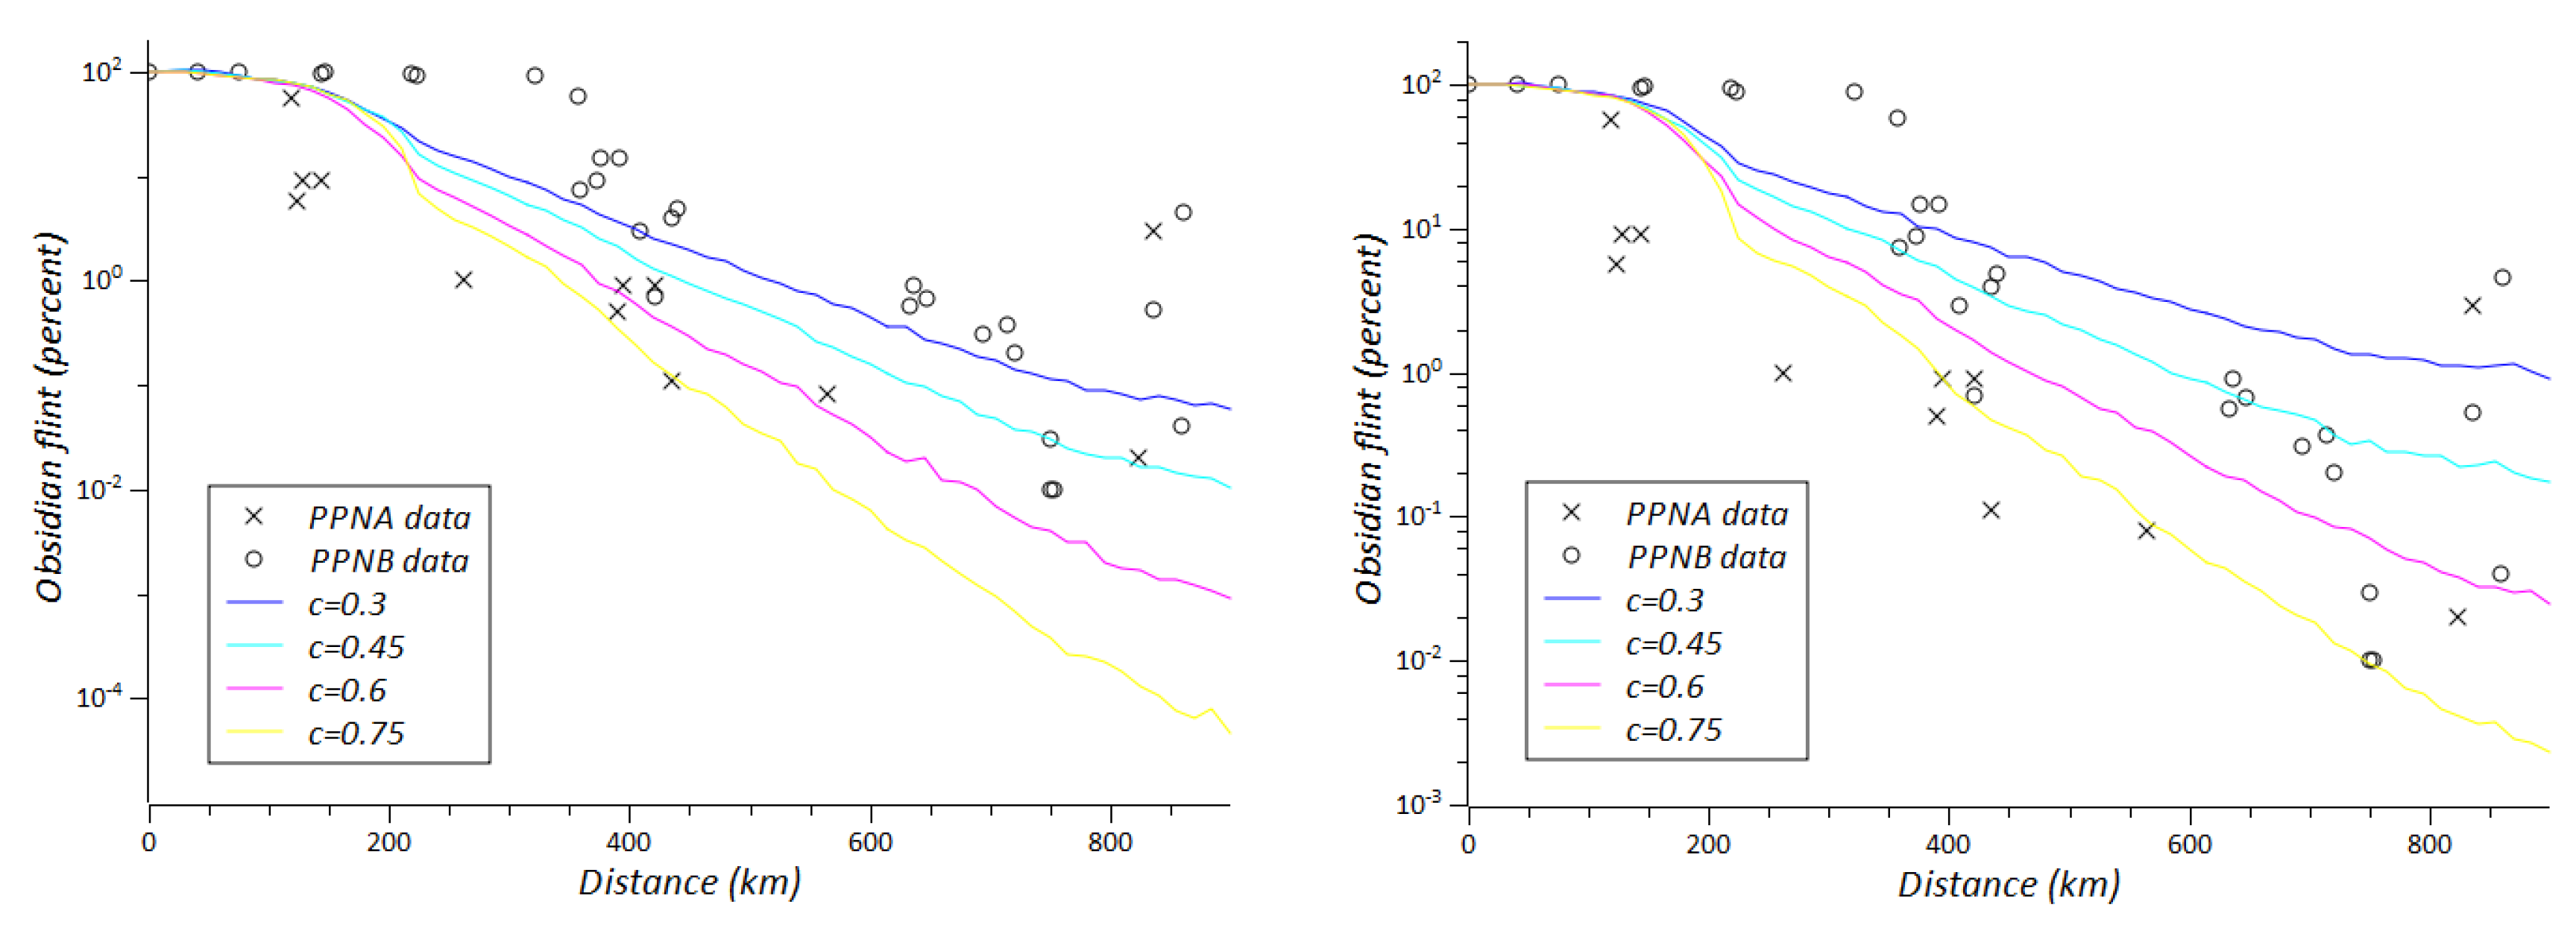
Archaeological data on obsidian exchange were gathered from bibliographic data and included the proportion of obsidian with respect to flint from every PPNA/PPNB archaeological site in the study area [
17] (see
supplementary material Table S1). The ratio of obsidian to flint is an adequate measure of the quantity of obsidian consumed at any archaeological site, assuming that there was a similar consumption rate of lithic resources for toolmaking in each Neolithic village. In order to compare the results of the model with the archaeological data, we plotted the proportion of obsidian to flint on each site in relation to the distance from each site to the source area over the two successive Early Neolithic periods (PPNA and PPNB). Observation of the two resulting graphs shows an exponential decrement of obsidian presence and a long tail that is a product of small quantities of obsidian reaching long distances. However, some diachronic differences are noted. Higher quantities of obsidian reach further distances in the PPNB with respect to the PPNA.
3. Sensitivity Analysis of the Model
We have carried out a sensitivity analysis of the main variables involved in our model of obsidian exchange in order to explore the possible effects of nonlinearities throughout the whole parameter space. To do that, statistical (Monte Carlo) sampling methods are particularly appealing. Here we have carried out a Latin Hypercube Sampling (LHS), which is one of the most standard methods employed in the literature. We have chosen the LHS in particular because it allows a more compact exploration of the parameters phase space than other randomized sampling methods, as it divides this space into equal-volume cells and assigns the same weight to each in the sampling process. We argue that in situations where there is a relatively high number of parameters in the model and specific values for them are highly speculative (so that we can simply provide a reliable range of plausible values), as happens here in our ABM, this kind of sampling turns out to be especially appropriate. The LHS implementation we have used here considers a space of six parameters of the ABM model:
Number of villages (N).
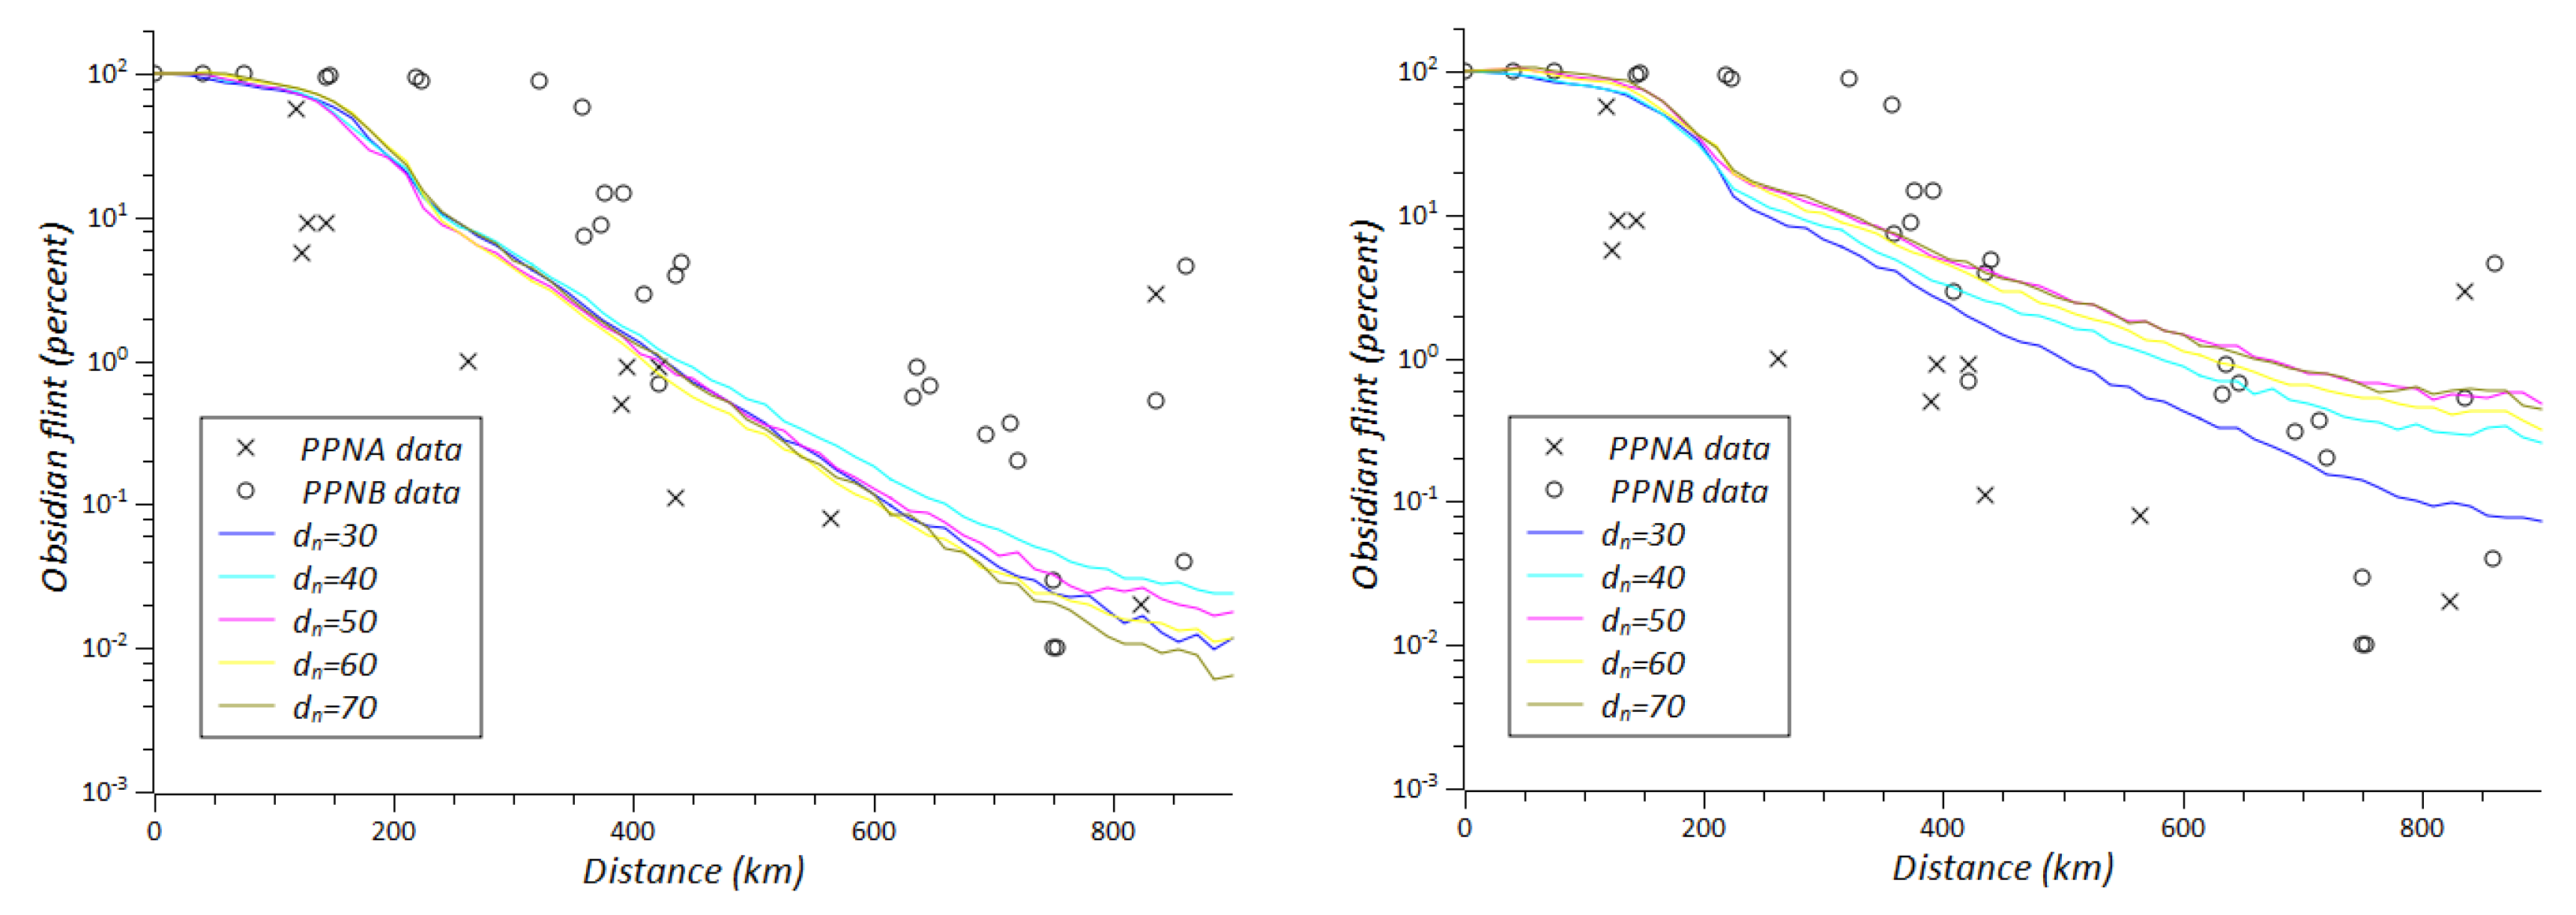
The distance defining neighborhood ().
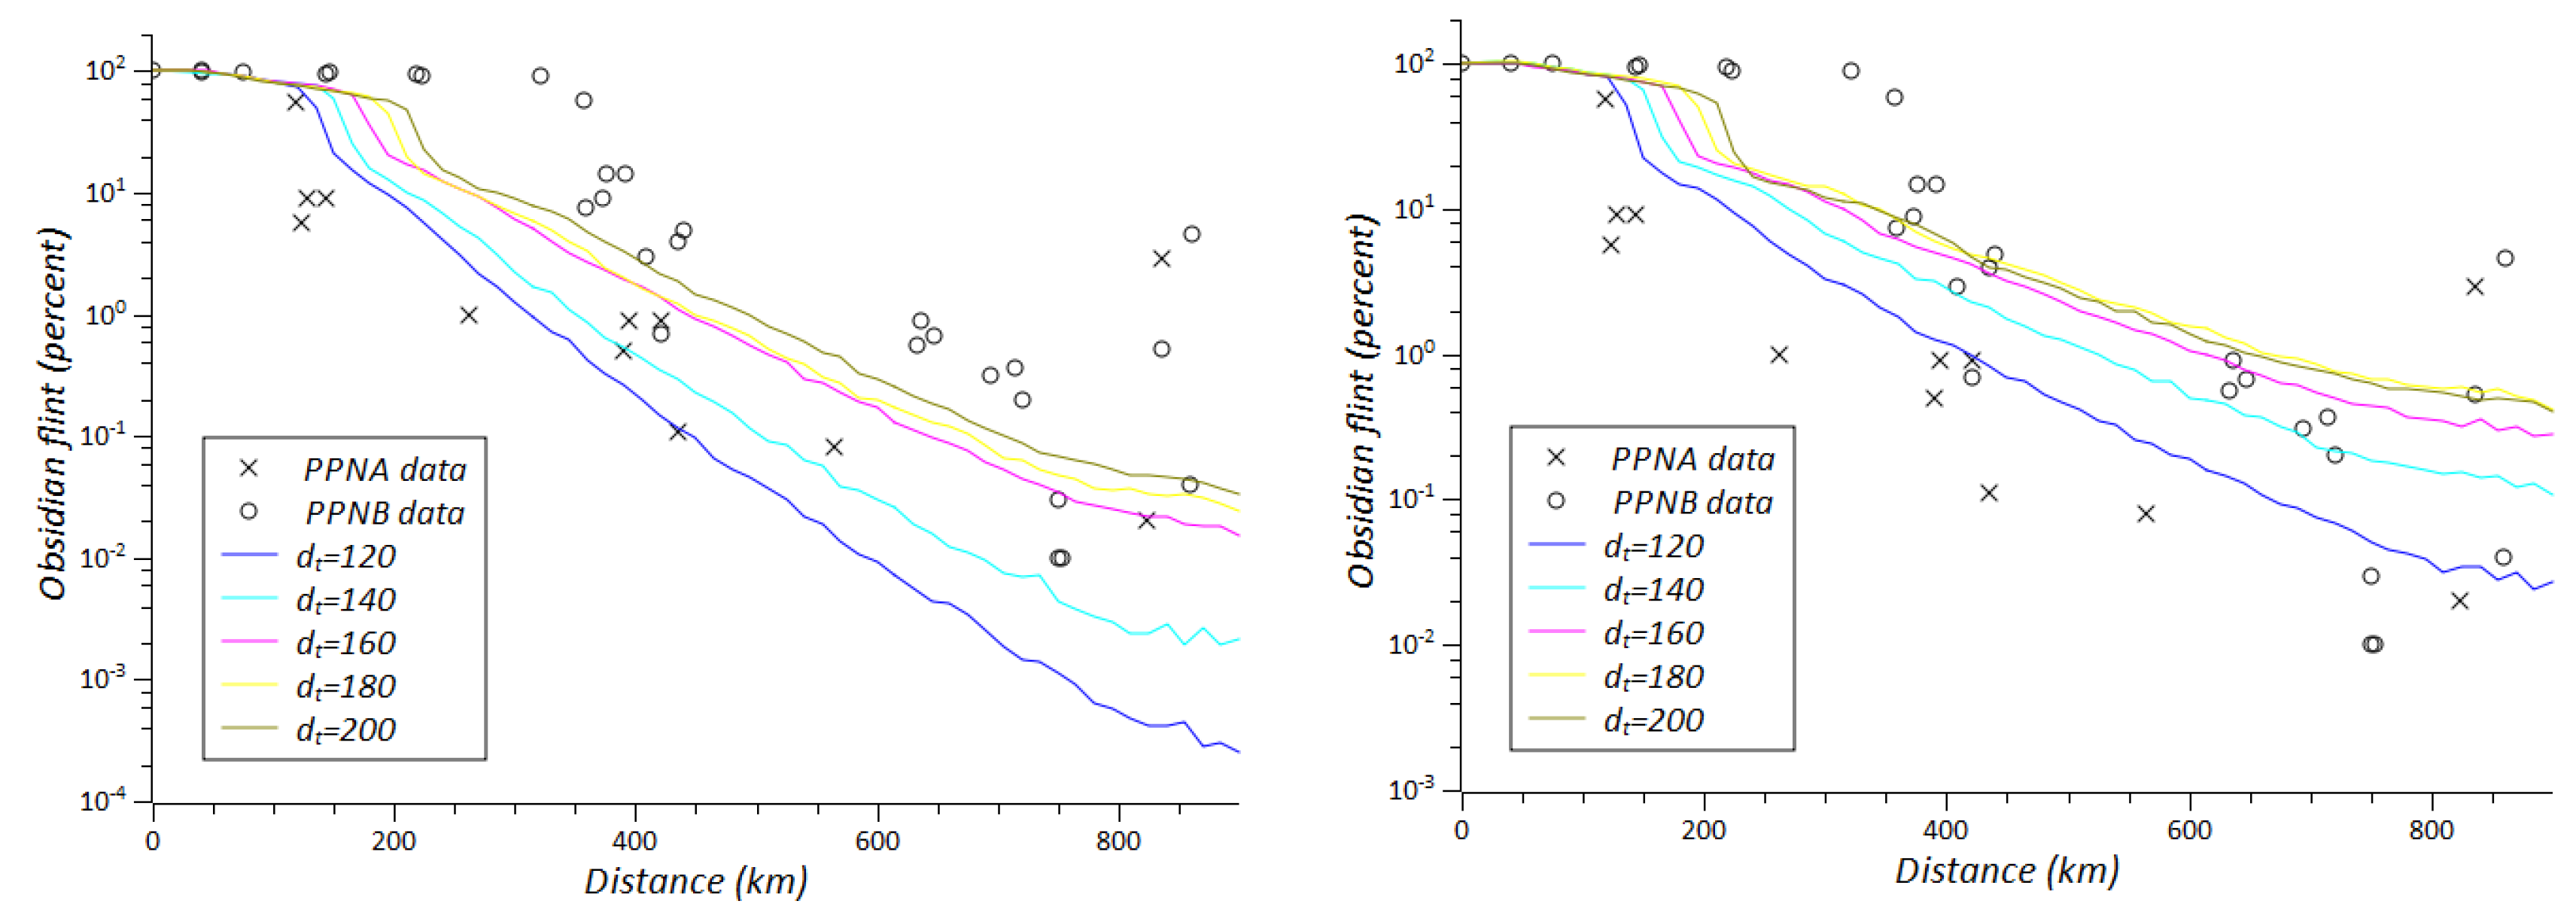
The limit for distance of exchange/production link ().
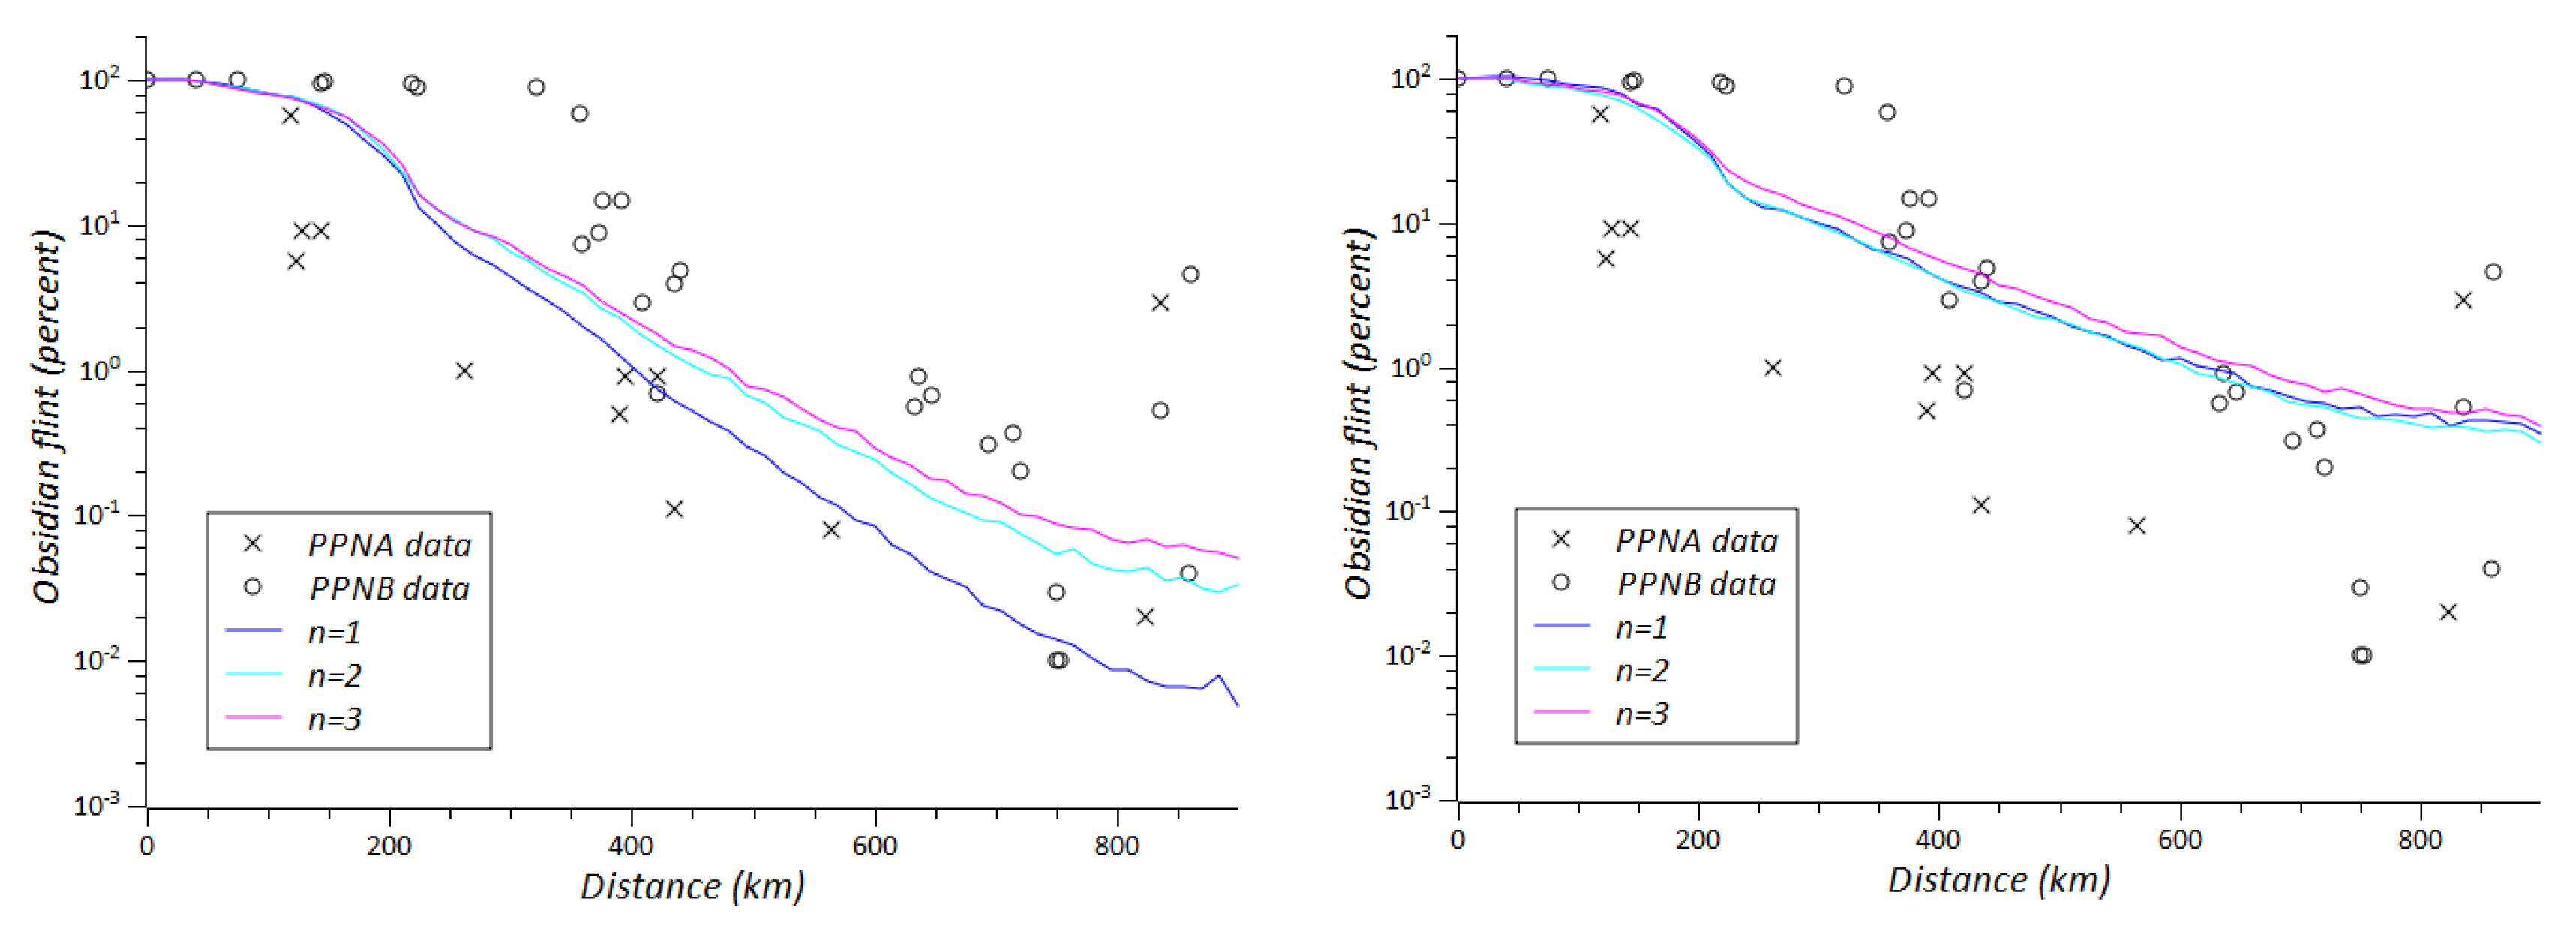
The number of distant links per village (n).
The function of decrement in obsidian acquisition () related to distance.
The rate of obsidian exchange/consumption in each village ().
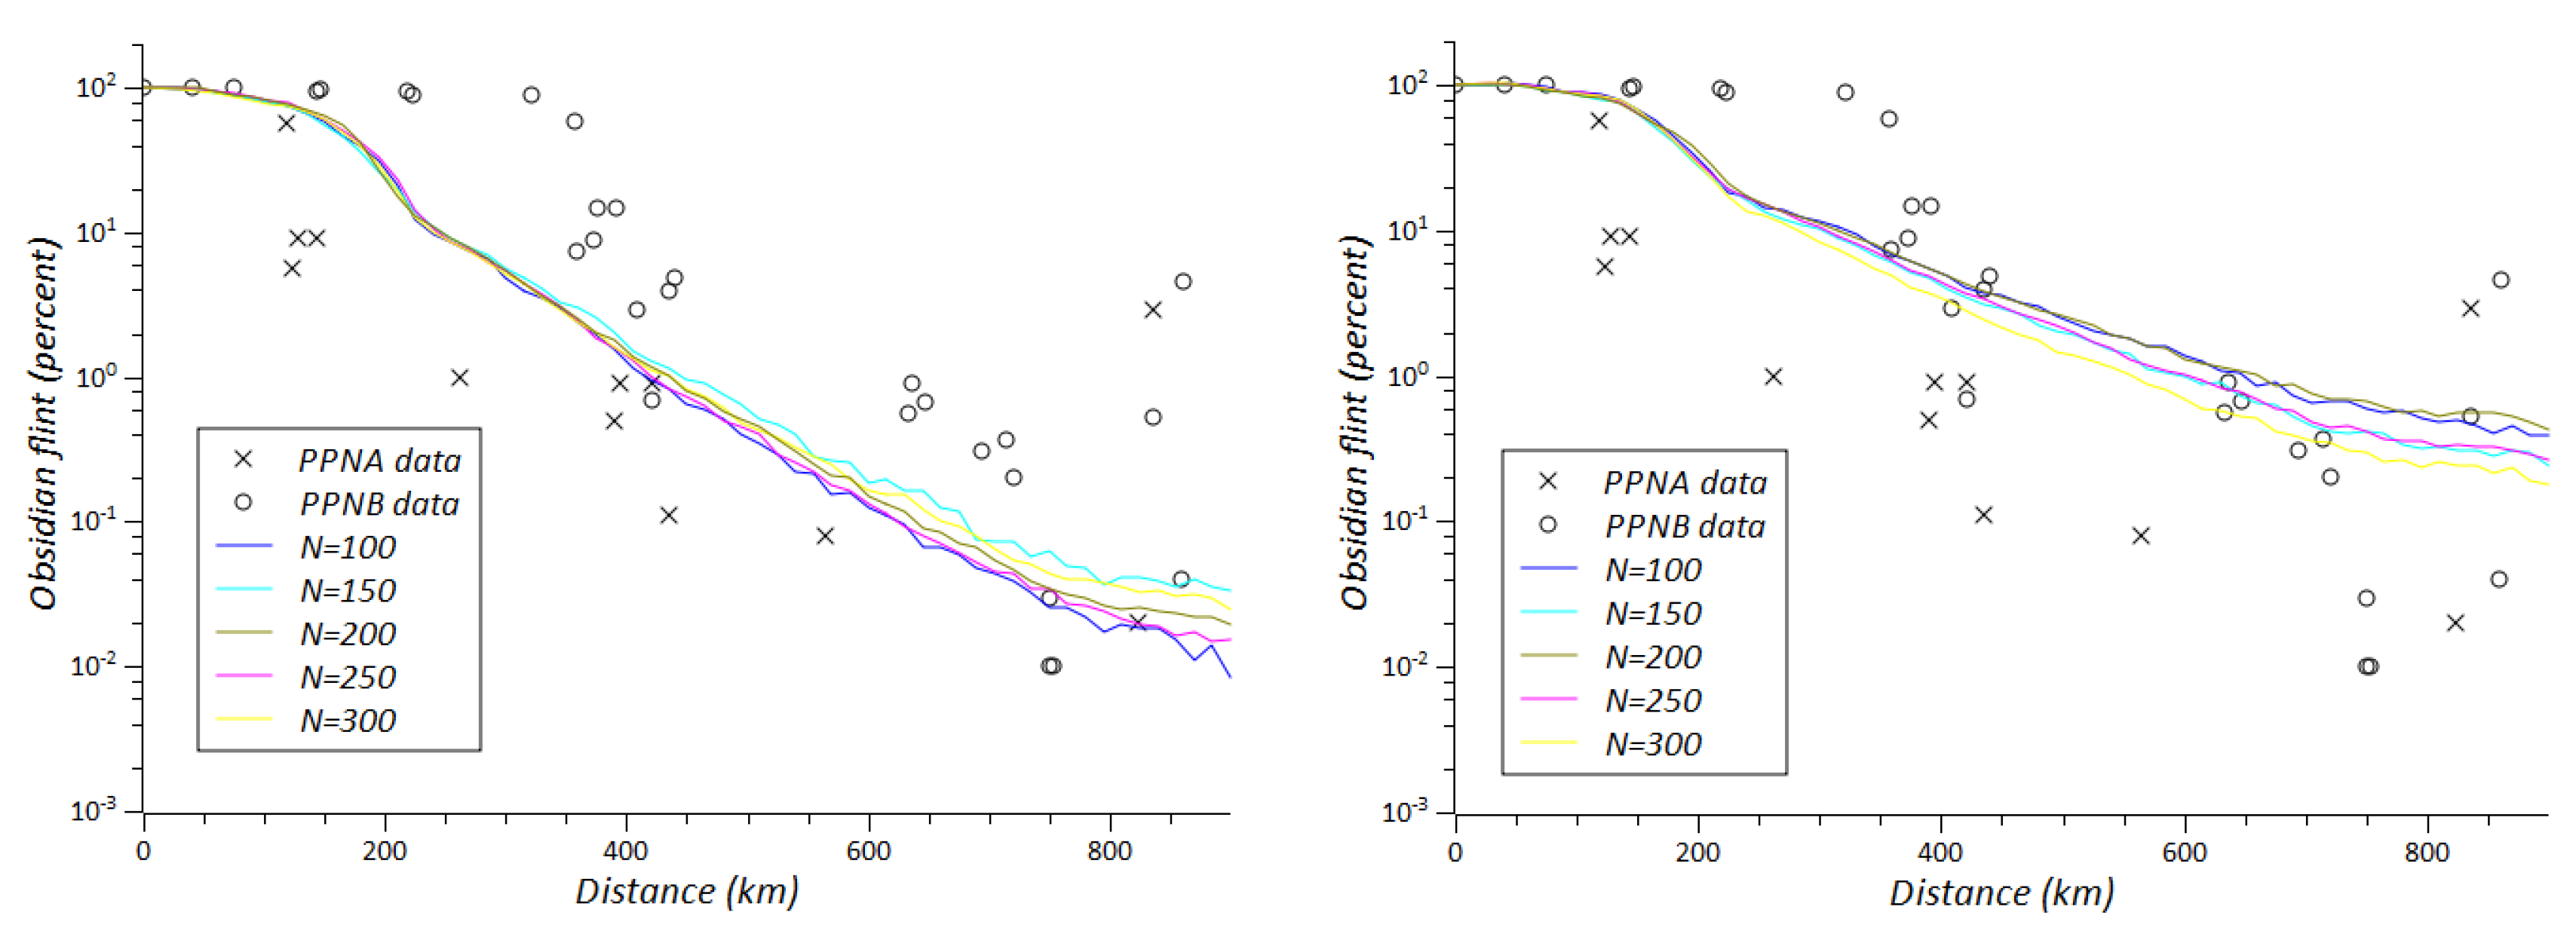
The values of the fixed parameter in each case are given in the legend. For the hypercube sampling we have used the following intervals: for the number of villages we have considered 150 < N < 350 with intervals of size 50; for the neighbor distance we have considered 30 < < 80 with intervals of size 10; for the maximum travel distance we have considered 120 < < 220 with intervals of size 20; for the number of distant neighbors we have considered n ∈ {1,2,3}; for the decay rate in obsidian production we have considered 0 < r < 0.4 with intervals of size 0.1; and for the proportion of obsidian exchanged/consumed we have considered 0.2 < c < 0.8 with intervals of size 0.15.
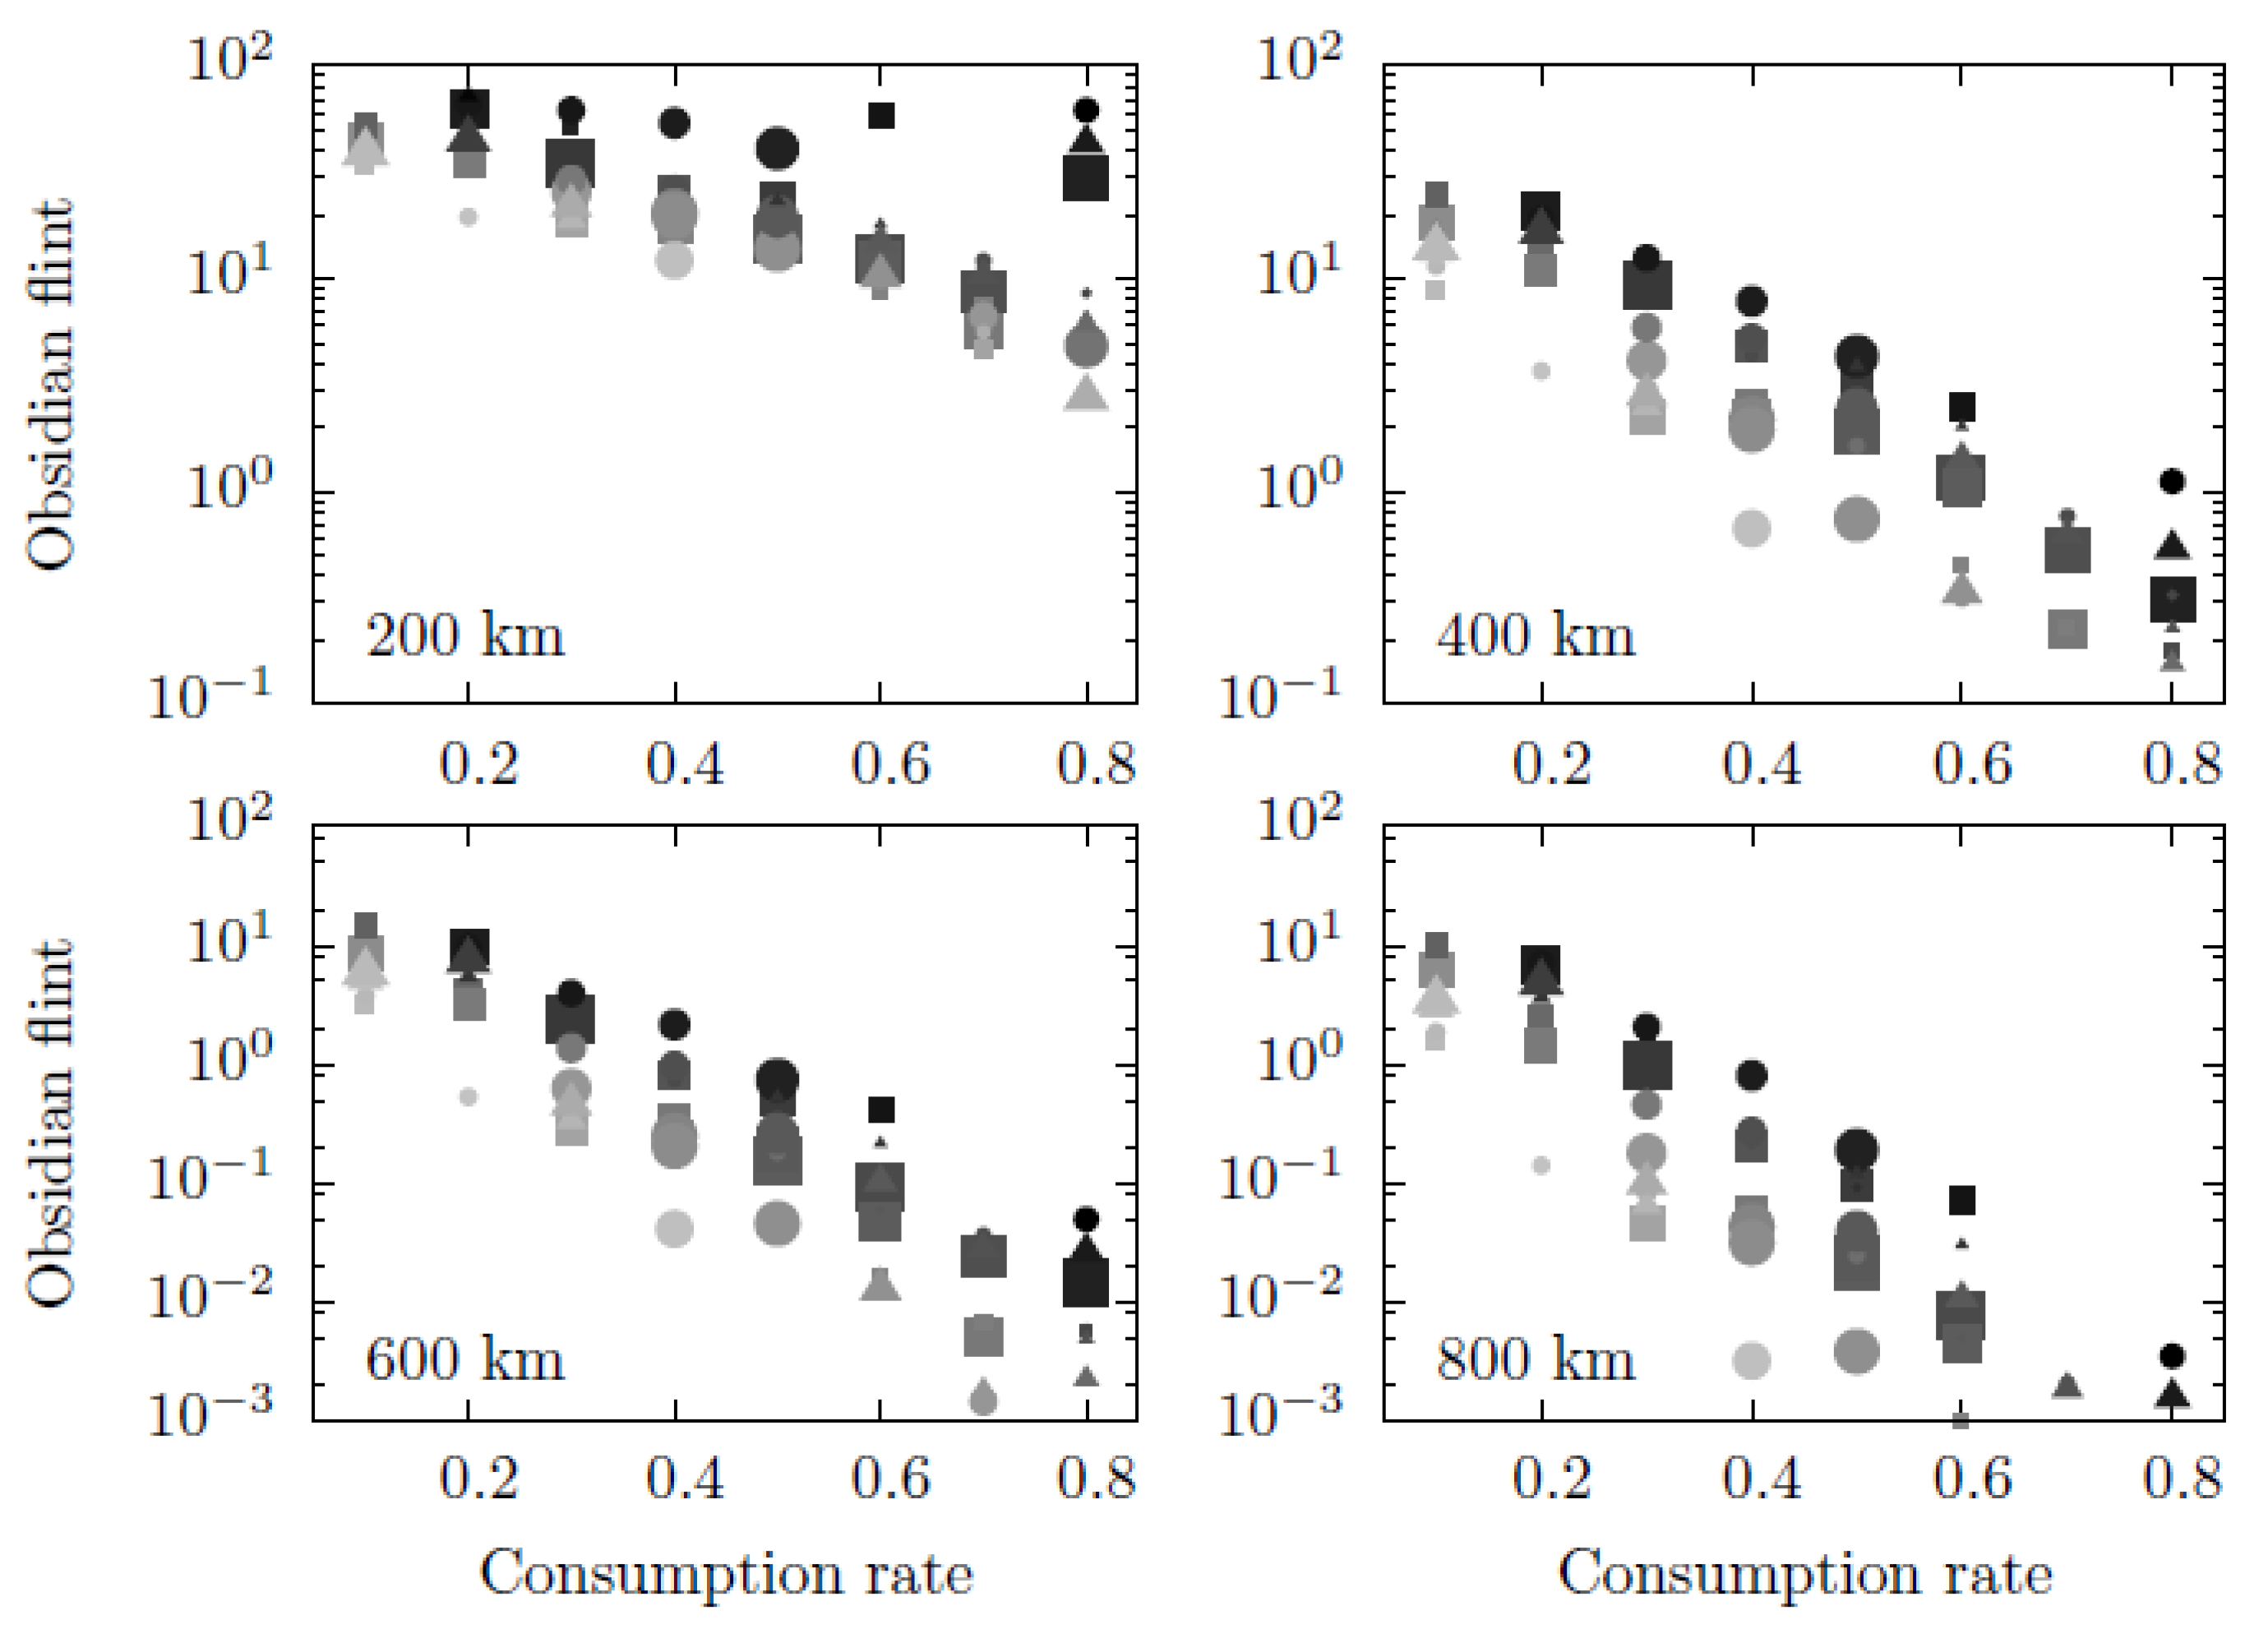
First, we show the results for the sampling results in a compact form by means of a 5D-plot (
Figure 3) in which we show the obsidian quantity reaching several distances (200, 400, 600 and 800 km from the northern production region) as a function of different parameters. The different dependences included in these panels read as follows: (i) the independent coordinate (horizontal axis) shows the dependence on the rate of exchange
; (ii) the shape of points represent the dependence on the number of distant links
(squares correspond to
, circles to
and triangles to
); (iii) the size of the points shows the dependence on the number of villages
(so larger points correspond to larger
); and (iv) the opacity of the points shows the dependence on the distance
(with darker points corresponding to larger
). As observed, the two parameters for which a clear tendency is found are
and
; accordingly, smaller values of
and longer distances clearly lead to higher obsidian quantities at all distances from the production region. Instead, for the other parameters, tendencies are barely observed in
Figure 3; of course, this does not necessarily mean that such tendencies do not exist but that they are possibly masked by the strong influence that the parameters
and
exert in the multi-parameter analysis. An analogous plot to
Figure 3, in which the opacity shows the dependence of
, has been also carried out (not shown here), basically shows that
does not yield any clear tendency, either. We can therefore conclude that the results in the model are strongly dominated by the two parameters
and
.
To present these results in a more systematic and understandable way, we have also used the results from the LHS simulations to represent the explicit dependence of obsidian flint on each parameter from the aforementioned ones. The explicit dependence of each parameter is averaged and shown in a graph (
Figure 4,
Figure 5,
Figure 6,
Figure 7,
Figure 8 and
Figure 9). These parameters have been tested for the two scenarios of our model, the ODLa, where the improvement of the exchange partners is guided by the quantity of distant links of the potential new partner, and the ODLb, where it is guided by the quantity of obsidian owned by the potential new partner. This analysis confirms the results already reported from the 5D-plot above on the relative importance of each parameter on the obsidian distribution; in particular, the parameters have been classified as insensitive, relatively sensitive (when if we double its value, the quantity of obsidian arriving to the Southern Levant, at 800 km from the sources, is up to 10 times higher) and highly sensitive (when if we double its value, the quantity of obsidian arriving to the Southern Levant is up to 100 times higher).
The results of the simulation have shown that some of the parameters in our model of obsidian exchange are insensitive to shifting. These parameters are:
One parameter, the number of distant links per village (n) (
Figure 6), is insensitive in the ODLb scenario and relatively sensitive in ODLa scenario.
One parameter, the distance defining neighborhood (
), is relatively sensitive in both scenarios: the higher the distance the more efficient the distribution of obsidian (
Figure 7).
Finally, two parameters are highly relevant for obsidian distribution:
The limit for distance of exchange/production link (
) (
Figure 8).
The rate of obsidian exchange/consumption in each village (
) (
Figure 9).
5. Comparing Model Results and the Archaeological Data
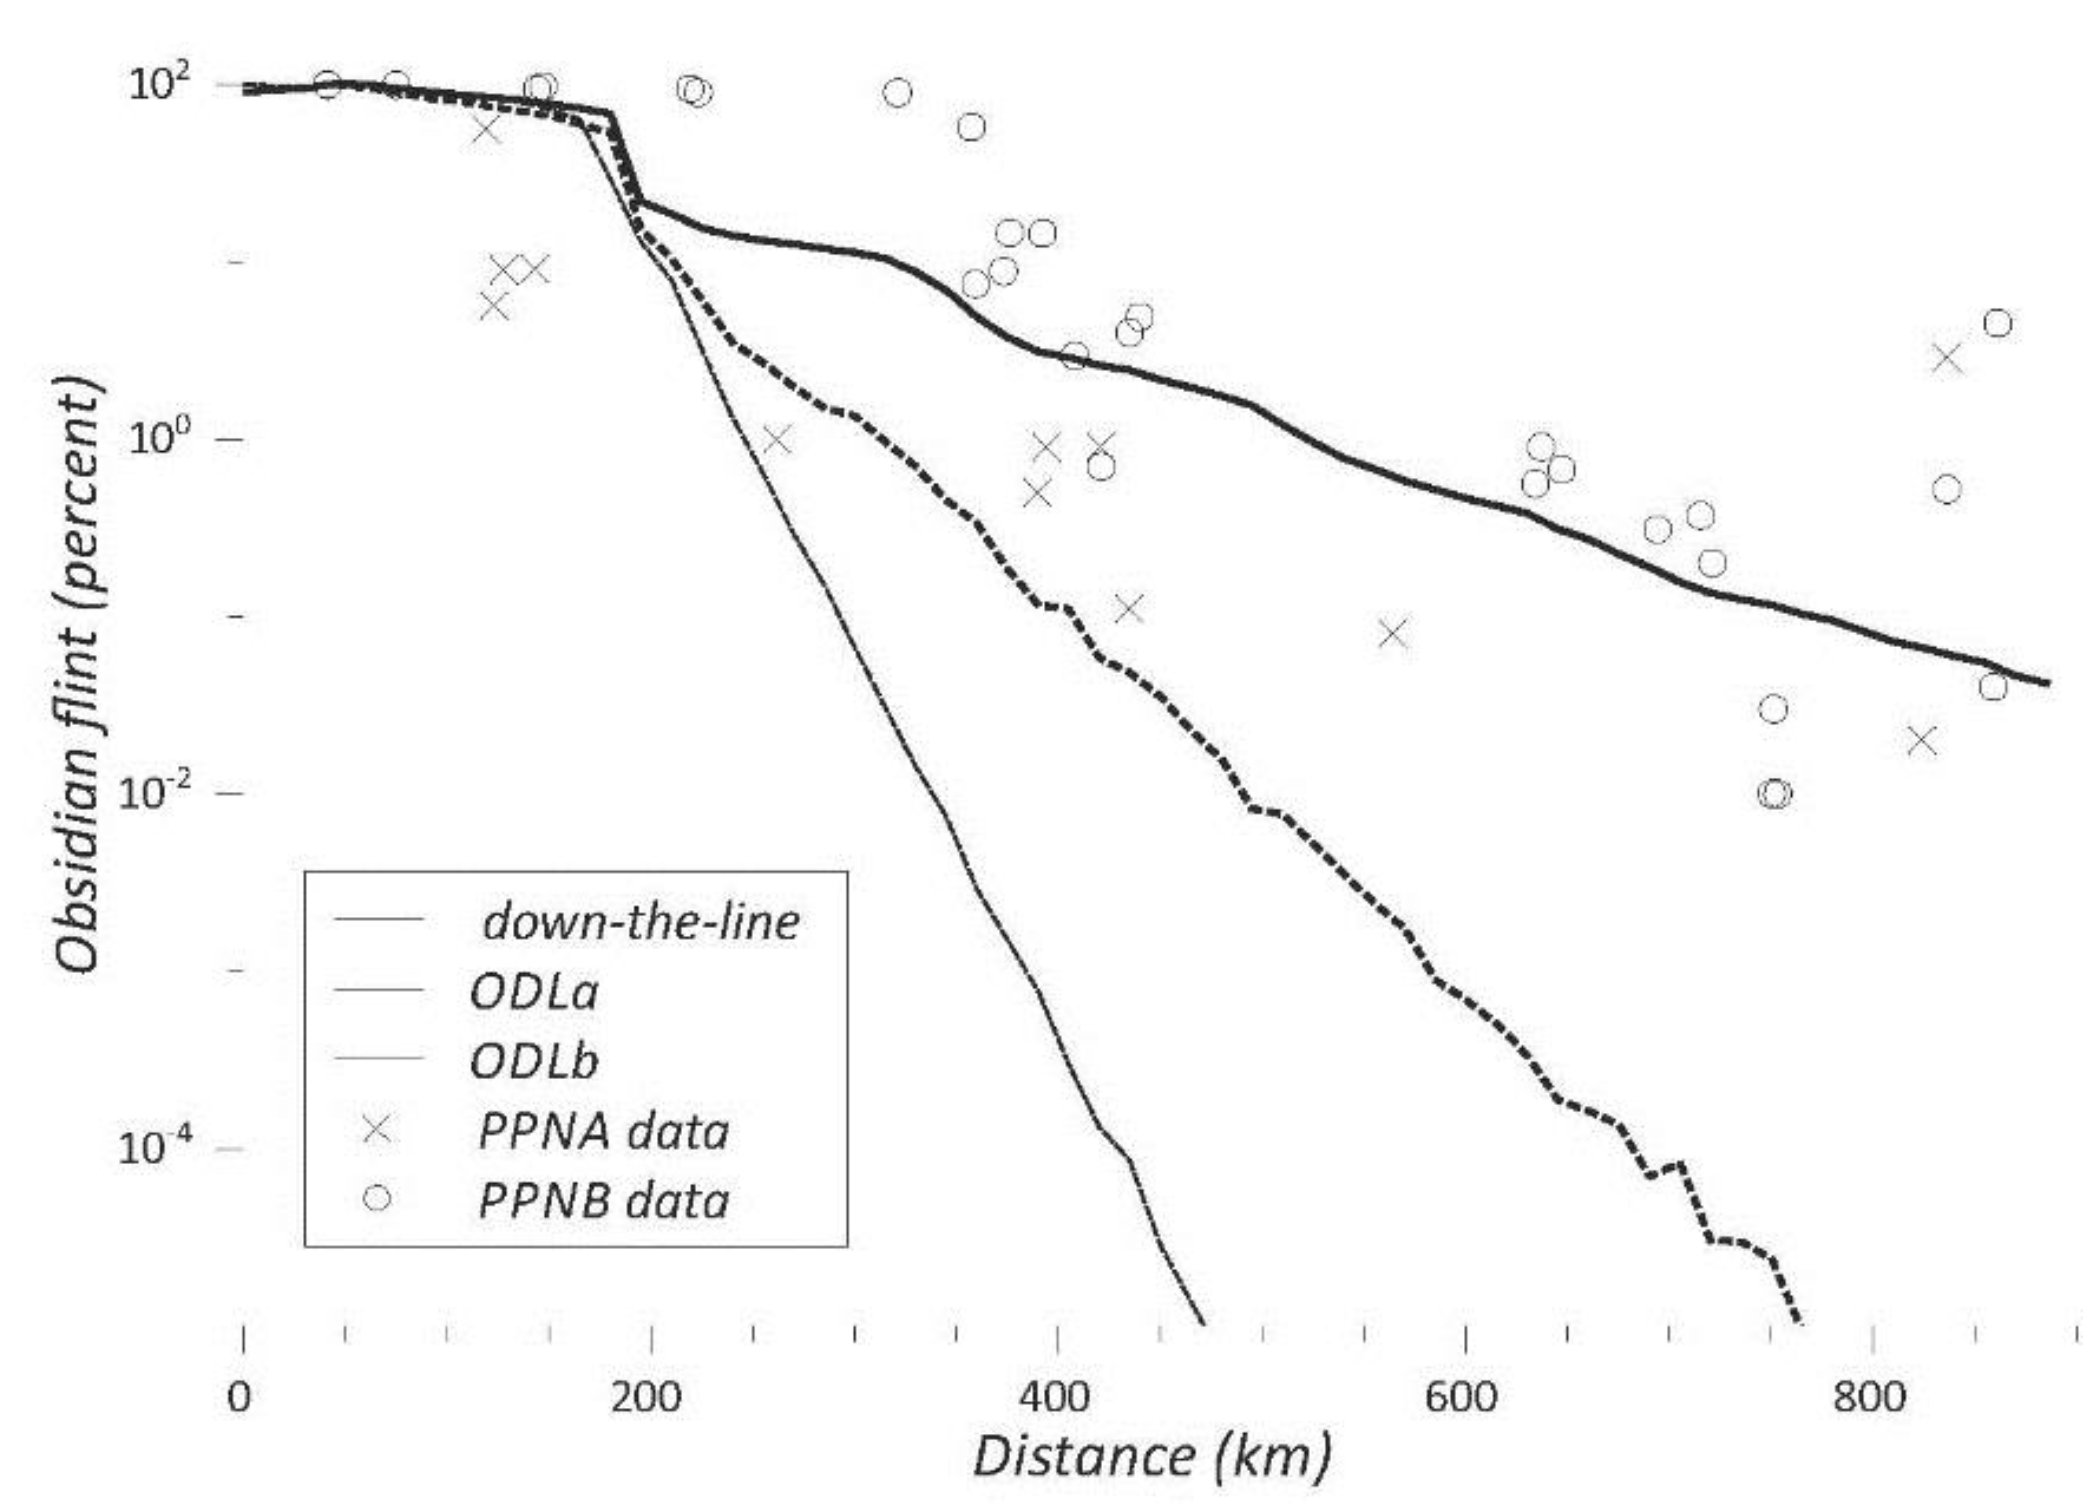
Once these three parameters are restricted in their magnitudes, we can analyze the characteristics of the network of exchange, comparing the results of our models with those recovered in the archaeological record (
Figure 10).
The first hypothesized model that sought to explain obsidian exchange proposed the existence of such a kind of regular network of exchange, where Neolithic villages exchanged obsidian with their neighbors and the long distances the material reached was possible via the successive transmission of the material through neighboring villages. This was called the “down-the-line” model [
33]. However, our results indicate that a regular network of exchange, such as the down-the-line model, cannot explain the distribution of obsidian during the PPNA or the PPNB. On the contrary, our modelling shows that complex networks of exchange, where some long distance links between non-neighboring villages are present, should have existed. This possibility enables a match between our modelling and the archaeological data.
The dichotomy regarding local and distant exchange links which is at the base of our complex network models can be compared to ethnographic examples from NG. In the case of NG, two models of acquisition of stone axes and other trade goods have been documented: one slow, local and continuous circulation associated with payments and compensations which mostly took place between allies inside the war confederation, and a quick, distant and occasional circulation for economic benefit, when shells or pigs to be obtained by exchange were needed. These expeditions of around 15 persons could take place twice a year [
32]. Competitive exchange associated with feasting can be another occasion for sporadic, substantial and distant reaching exchange. A complex network comprising local, regional and intertribal trade similar to the one identified in NG [
29] most probably existed at the onset of the Neolithic.
If nodes are allowed to improve their exchange partners, our model with distant links results in a network where a hierarchy of nodes exists, with some of them concentrating more distant links and quantity of obsidian than others. In this model, path length drops considerably, while the clustering coefficient is still quite high (
Table 1).
The archaeological data from the PPNB can only be matched in our ODLb model, when the quantity of obsidian is the criterion for improving the quality of the distant exchange links (
Table 2).
In the ODLa model, where villages improved their exchange links based on the quantity of distant links of their potential partners, distant links are established in an isotropic way and obsidian cannot reach the Southern Levant in the quantities that were present in the PPNB archaeological record. The spread of obsidian as it appeared in the PPNB can only be explained if exchange tracks are preferentially oriented along a north-south axis, joining Anatolia with the Southern Levant. This can best be explained by the fact that obsidian circulating along the north-south axis was likely the major determinant in shaping the exchange network.
However, in the previous PPNA period, the distribution of obsidian was not as efficient as in the PPNB. In our models, results similar to PPNA archaeological data can be obtained, if the maximum travel distance is reduced from 180 km to around 120 km. This could be one explanation for the shifts observed in the obsidian exchange network from the PPNA to the PPNB. During the PPNB, larger settled communities, using transport innovations such as oxen that are documented for the first time in this period [
34], may have established and maintained more distant exchange links which could not have been reached in the PPNA. The PPNA data can also be replicated in our OLDa model, when the quantity of distant links was the criterion for optimization of exchange links, instead of the quantity of obsidian (
Table 2). As a second alternative, changes from PPNA to PPNB can also be explained by a shift in the status of obsidian among Early Neolithic communities. While in the PPNA obsidian was one among many commodities used for exchange, during the PPNB obsidian could have attained a special status, and have been more intensively desired and sought after. This hypothesis can be supported by changes observed in the technology and use of obsidian. During the PPNA, obsidian was used to make the same types of tools made from flint and, like flint tools, was used for a wide variety of activities. During the PPNB, obsidian was used in the form of small bladelets produced by pressure flaking, which were mainly intended for cutting flesh and skin. As flint knives are also efficient for cutting flesh and skin, we hypothesize that the activities which would have made obsidian more desirable during the PPNB were, most probably, of a ritualistic/symbolic nature.
6. Archaeological Implications
As we have seen, complex networks with distant links and a hierarchy of nodes better explain the distribution of obsidian in Neolithic Near East, while exchange networks became more complex as the Neolithic period developed. The matches between our models and the archaeological data imply that Neolithic villages most probably played different roles within the obsidian exchange system, with some of them promoting regional exchange, while others were just responsible for the local distribution of the commodity. This would explain why obsidian quantities are unusually high in some Early Neolithic sites of the Southern Levant [
35,
36], or even in Cyprus [
37], as these sites would have been privileged partners in obsidian exchange networks of the period. In fact, the role of hub in obsidian exchange seems to be related to the size of the site, which is clearly visible in the PPNB. If we compare the mean ratio of obsidian to flint recovered from PPNB sites located more than 500 km from the obsidian sources (
i.e., in the Central and Southern Levant), considering three site size categories (
Table 3), we observe that the bigger the site, the higher the proportion of obsidian it contained.
Why was this complex network of exchange and interaction between villages displayed during the Early Neolithic? The process of “settling down” started as early as 12,000 BC in the Near East and was accomplished by the first half of the 10th millennium BC (beginning of the PPNA) when the first sedentary villages such as Jerf el Ahmar, Tell Mureybet and Jericho appeared, each hosting hundreds of people [
33,
34]. Living in year-round villages represented new challenges. Most probably, the process of sedentarization induced human groups to establish new networks of interaction between communities through long-distance exchange of objects, ideas and genes, as a way of re-establishing or maintaining intergroup relations.
We think that the Neolithic cannot be understood without taking account of the existence of such complex networks of interaction, as such networks could explain the efficient and rapid spread of innovations across the Near East. Some of these innovations, which included funerary rituals, plant and animal domestication, the organization of villages around collective/ritual buildings, and the transition from round to square houses, appeared almost contemporaneously across an extended area of the Fertile Crescent [
3,
35]. The exchange of ideas and experiences which were enabled by such networks, allowed human communities to be highly dynamic, while the network itself acted as a repository of innovations, reducing risks of involution [
36]. The transmission of these innovations would have been slower and less reliable in a regular network of interaction. By the PPNB, the preferential attachment of a core group of villages responsible for long distance exchange enabled a better transmission of objects and ideas, resulting in the increase of cultural similarities between farming communities.
7. Conclusions
ABM modelling can be a powerful tool for deciphering complex behaviors in the past, especially when series of quantitative archaeological data are at our disposal and the results obtained in the modelling can be compared to archaeological information.
In our model, the following parameters have been identified as sensitive or highly sensitive to explain the capacity to transfer obsidian: the distance of the exchange link, the rate of obsidian exchange/consumption in each village and the distance defining neighborhood. If these parameters remain “reasonable”, that is to say if they stay true to dimensions demonstrated during the Neolithic, taking account of the technological developments of the period and applicable archaeological and ethnographical information, we can evaluate the characteristics of the exchange network which existed at that period. It is important to stress that, in mathematical terms, any model of obsidian exchange could work reproducing the fall-off curve of obsidian quantity which is observed in the archaeological record. For example, a regular network of exchange, such as the down-the-line model, could offer matching results if most of the obsidian was intended for exchange and only a very small quantity was used by Neolithic communities, making it a kind of primitive money across the Levant. However, this can hardly be accepted considering anthropological and historical information available to us. When the sensitive parameters are modulated using anthropological and historical data, we can propose more realistic scenarios. Thus, while we cannot pretend to reach a strictly accurate reconstruction of these exchange networks using ABM, especially with so many unknown sensitive parameters and a significant degree of incertitude, the comparison of the models with the archaeological data allows us to discard the less probable scenarios and to choose the most realistic ones, following an explicit and transmissible reasoning procedure.
Following this methodology, we have shown that the down-the-line model of obsidian exchange, a regular network where obsidian traveled many hundreds of kilometers via successive transfer between neighboring villages, and which was hypothesized as the mechanism that distributed the volcanic rock to Neolithic sites in the Near East, cannot reasonably explain the phenomenon. On the contrary, a kind of complex network of exchange allowing the transfer of obsidian over long distances should have existed. The comparison between our models and the archaeological data suggests that when Neolithic innovations were first being experimented with in the PPNA, a complex network of interaction developed between villages. In this network, neighboring villages were interconnected, but regular distant links between villages also existed. During the PPNB, this network became more complex and included a small group of interconnected sites or hubs that dictated long-distance obsidian trade. The presence of an interconnected core group appears to have provided the network complexity needed for obsidian to reach further into the Southern Levant. The conclusion on the complex nature of the exchange networks, which most probably showed higher capacities of long distance interaction than we previously supposed, has deep implications for our understanding of the origins and spread of the farming way of life. When human populations became sedentary and the first network of Neolithic villages appeared, their interconnection was crucial for the success of the system. In this way, complex social networking, considered a major catalyst to current innovation [
38], has revealed itself to be one catalyst for the decisive cultural changes that took place around 12,000 years ago in the Near East.
Defining our hypothesis quantitatively through the modelling of these complex exchange systems that appeared during the Neolithic, and their comparison with the archaeological data has brought us closer to an understanding of the problem. However, new methodological explorations could reinforce our inferential capacity to hone in on more detailed characteristics of these prehistoric obsidian exchange networks. We have considered the distance to obsidian sources as the only variable affecting the quantity of obsidian present in any Neolithic village. However, other variables could also partially explain the data, such as the size of the village, its distance to the sea or the availability of alternative raw materials for making tools. Moreover, we have compared the results of the modelling and the archaeological data in terms of a regression line, thus considering a bidimensional spatial phenomenon as a unidimensional linear one. In this way, we lose information on its regional variability. To answer these questions that have developed over the course of this exploration, future research will include the use of Bayesian geo-statistics in order to deal with the archaeological data and with the comparison of these data to the ones resulting from modelling. In this way, ABM can become a more powerful tool for deciphering the interaction system which was established at the onset of the Near Eastern Neolithic.


