Article

An Integrated Architecture, Methods and Some Tools for Enhancing Sustainable Enterprises and Systems

Mechanical and Industrial Engineering Department, New Jersey Institute of Technology, The Public Research University, Newark, NJ 07102, USA
Systems 2015, 3(2), 27-44; https://doi.org/10.3390/systems3020027
Submission received: 9 February 2015 / Revised: 14 April 2015 / Accepted: 24 April 2015 / Published: 4 May 2015

Abstract

:
Sustainability and, in particular, green sustainability are very complex subjects, because they typically include several integrated sub-systems. Many of these contain dynamically changing objects and variables, which are often difficult to measure and calibrate. Green sustainability means waste reduction and optimization with a non-toxic process focus that can be maintained over time, for a very long time. Furthermore, it means the ability of an ecosystem to maintain ecological processes and functions, biological diversity and productivity over time. Sustainable, green engineering design, manufacturing, demanufacturing and re-engineering are changing every aspect of our lives. In this paper, we offer an overview, a systems engineering framework, as well as some methodology and concrete results.

1. Introduction

Sustainability and, in particular, green sustainability, are very complex subjects, because they typically include several sub-systems, many dynamically changing objects and variables that are often difficult to measure, and have values that are difficult to calibrate. Green sustainability means waste reduction and optimization, therefore advocating for lean six-sigma concepts and methods. In terms of green sustainability, we consider an eco-friendly state or non-toxic process that can be maintained over time, for a very long time, as well as the ability of an ecosystem to maintain ecological processes and functions, biological diversity and productivity over time [1,2,3].
Furthermore, green sustainability encompasses the concept of meeting present needs without compromising the ability of future generations to meet their needs. In other words, the characteristics of green, sustainable systems engineering, advanced quality design, manufacturing, service, system design and architecture are able to coexist with another system indefinitely, without either system being damaged.
The green sustainability concept also emphasizes that the creation of wealth within a community considers the well-being of both the human, as well as the natural environments, and is focused on the more complex processes of development rather than on simple growth or accumulation only. In other words, being profitable might be sustainable, but it might not be simultaneously green.
Advanced, sustainable green activities are used in many areas, including product and process design, factory control, fabrication, quality assurance, quality control, product testing, assembly, disassembly, remanufacturing/recycling, energy generation and energy management, eco-tourism, sustainable green living and mobility, sustainable architecture in villages, large cities/mega cities and many others [4,5,6].
According to the EPA (Environmental Protection Agency, USA, epa.gov), sustainability is defined as “Everything that we need for our survival and well-being depends, either directly or indirectly, on our natural environment. Sustainability creates and maintains the conditions under which humans and nature can exist in productive harmony, that permit fulfilling the social, economic and other requirements of present and future generations. Sustainability is important to making sure that we have and will continue to have the water, air, materials, and resources to protect human health and our environment” [7].
EPA’s mission (in the USA) is to protect human health and the natural environment. They accomplish this mission with approximately 17,000 employees and another 7000 contractors, fellows and Senior Environmental Employment program participants working in more than 10.1 million square feet of office buildings and laboratories located across the United States. To ensure that EPA’s buildings and practices reflect this mission, the agency implements a range of strategies to reduce the environmental impact of its facilities and operations, from building new, environmentally-sustainable structures to improving the energy efficiency of older buildings.
According to the EPA, “Sustainability has emerged as a result of significant concerns about the unintended social, environmental, and economic consequences of rapid population growth, economic growth and consumption of our natural resources. In its early years, EPA acted primarily as the nation’s environmental watchdog, striving to ensure that industries met legal requirements to control pollution.
In subsequent years, EPA began to develop theory, tools, and practices that enabled it to move from controlling pollution to preventing it. Today EPA aims to make sustainability the next level of environmental protection by drawing on advances in science and technology to protect human health and the environment, and promoting innovative green business practices.” [7].
“Sustainability has evolved over several decades to become a mainstream concept. For example, countless US and international corporations, such as Apple, Google, Amazon, Walmart and DuPont, now recognize the benefits of sustainable practices that minimize environmental impacts, use resources more efficiently, and save them money to increase profits. Individuals, small businesses, universities, local governments, national governments, and the United Nations have all adopted or promoted sustainability in different ways.” [8].
In the USA, the Federal Leadership in Environmental, Energy and Economic Performance includes several key aspects. The USA Government Executive Order 13514 specifically addresses these aspects of sustainability: GHG (greenhouse gas) emissions; building performance and high-performance sustainable buildings; water conservation; strategic planning; storm-water management; local planning; waste diversion and pollution prevention; procurement; electronics stewardship; environmental management; and others.
All of the above is critically important for sustainable green enterprises and systems.

2. Research Objectives

The objective of our research in this field is to find the key scientific aspects, models, system engineering frameworks and methods, as well as the research opportunities of sustainable green design, manufacturing and enterprise system engineering. This is a huge task, and considering the limited space in this article, we can summarize our findings as follows [3,9,10,11,12,13,14,15,16]:
  • Sustainable green engineering covers all aspects of energy management, including the modeling and control of energy management systems (i.e., energy management of raw material production, manufacturing processes, energy optimization of machines, entire factories, warehouses, computer data centers and server silos, automobiles, aircraft and other transportation systems, and many others, that are all related to a global manufacturing system).
  • Renewable energy and alternative energy.
  • Machine and process optimization, development and testing, using real-time machine and system health-check/monitoring systems, with sustainability statistics integrated into a feedback-controlled system, helping to avoid out-of-control situations in any process step and, eventually, preventing recalls.
  • Asset management, asset health-checks by means of smart sensor networks and model-driven adaptive control systems, as well as asset utilization and energy reduction/optimization.
  • Comprehensive greening frameworks, integrated architectures and system analysis/design models for chartering and managing a green program in any organization to achieve iSEE:Green, or intelligent sustainable enterprise engineering with a green focus.
  • Multi-variable optimization models, requirements and risk analysis models with uncertainty and fuzzy logic and sustainability statistics, accepting the scientifically proven fact that by just working with nominal values, we cannot achieve sustainable results.
  • Deterministic, as well as stochastic modeling of systems.
  • Waste reduction at all levels of the enterprise, including waste reduction in terms of energy, processes, machines, including the lack of manufacturing/assembly process optimization and even talent.
  • Biodegradable materials and industrial ecology throughout the global supply chain to eliminate the toxic output of any manufacturing process.
  • Green product/process design and rapid prototyping, with digital design and digital manufacturing simulation methods, that can handle close-to-real-world modeling challenges, including machine and process dynamics, error prevention, integration between design, manufacturing, assembly and testing processes, automatic optimized code generation for computer-controlled devices, and others.
  • Internet communication and collaboration to reduce communication, collaboration and travel time, cost and the related carbon footprint; the Industrial Internet of Things (IIoT), the networking system that links many devices into a communication system.
  • Alternative energy sources for mobility (hence the term ‘green mobility’), such as hybrid cars, electric cars, including new control algorithms for real-time energy management in automobiles, power trains, batteries and other alternative renewable energy systems.
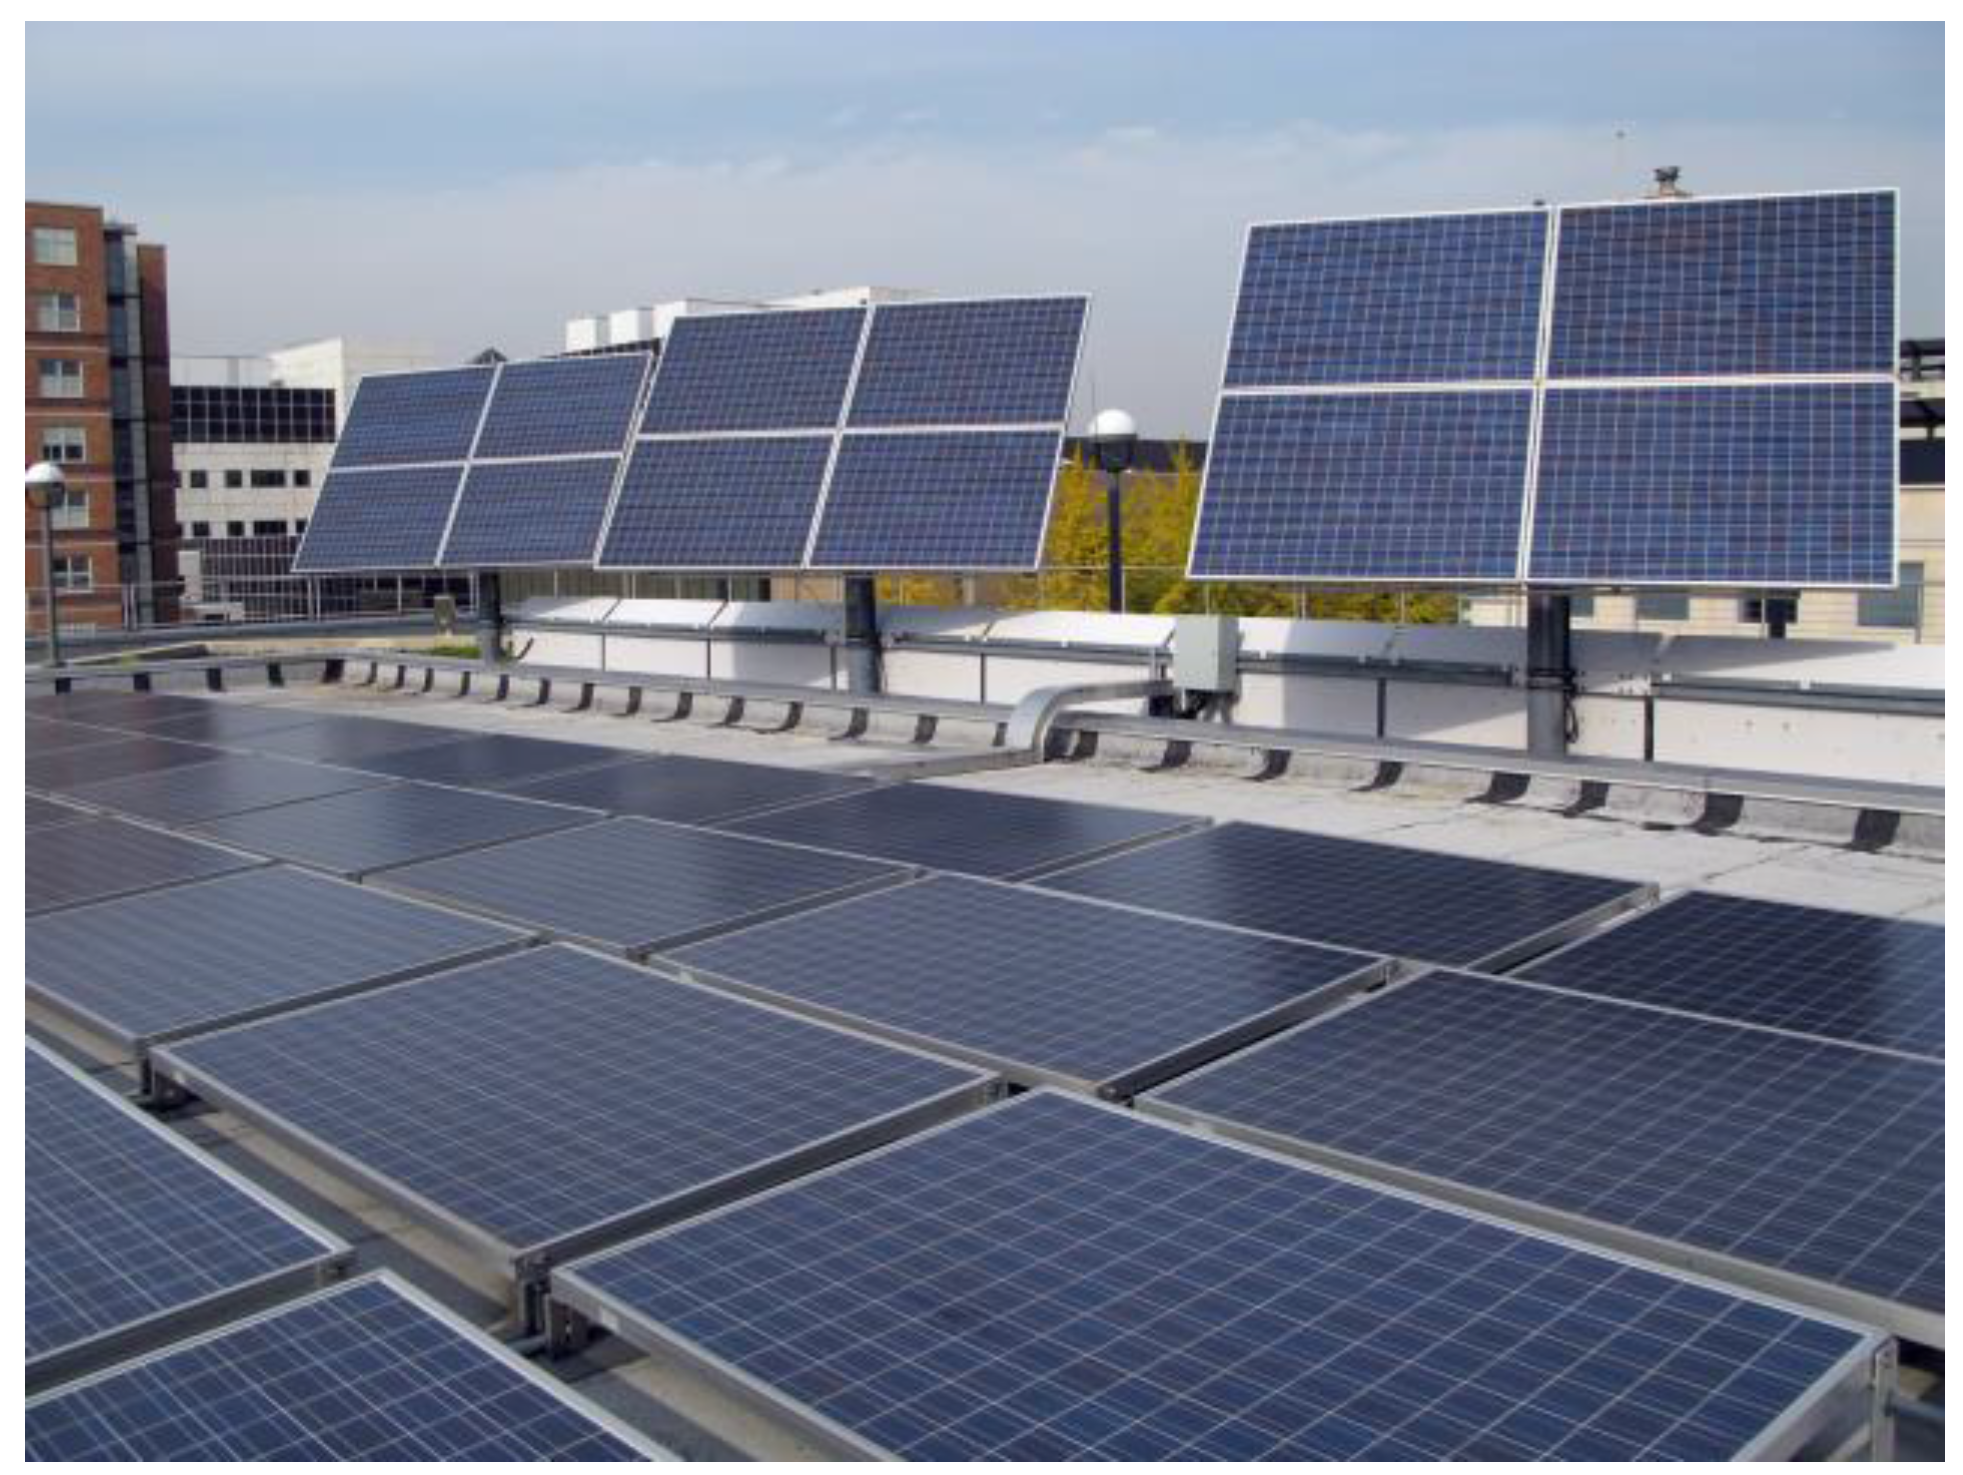
  • Efficient solar and wind power generators and their design and manufacturing processes, including micro-inverter networks and grid optimization methods for effective energy conversion and transportation.
  • Green product, process, factory and system auditing methods to find and eliminate/replace wasteful/toxic processes, parts and systems that can fail.
  • Sustainability statistical analysis methods integrated with real-time sensory feedback-controlled networks to locate and change processes before they go out of control and therefore become wasteful.
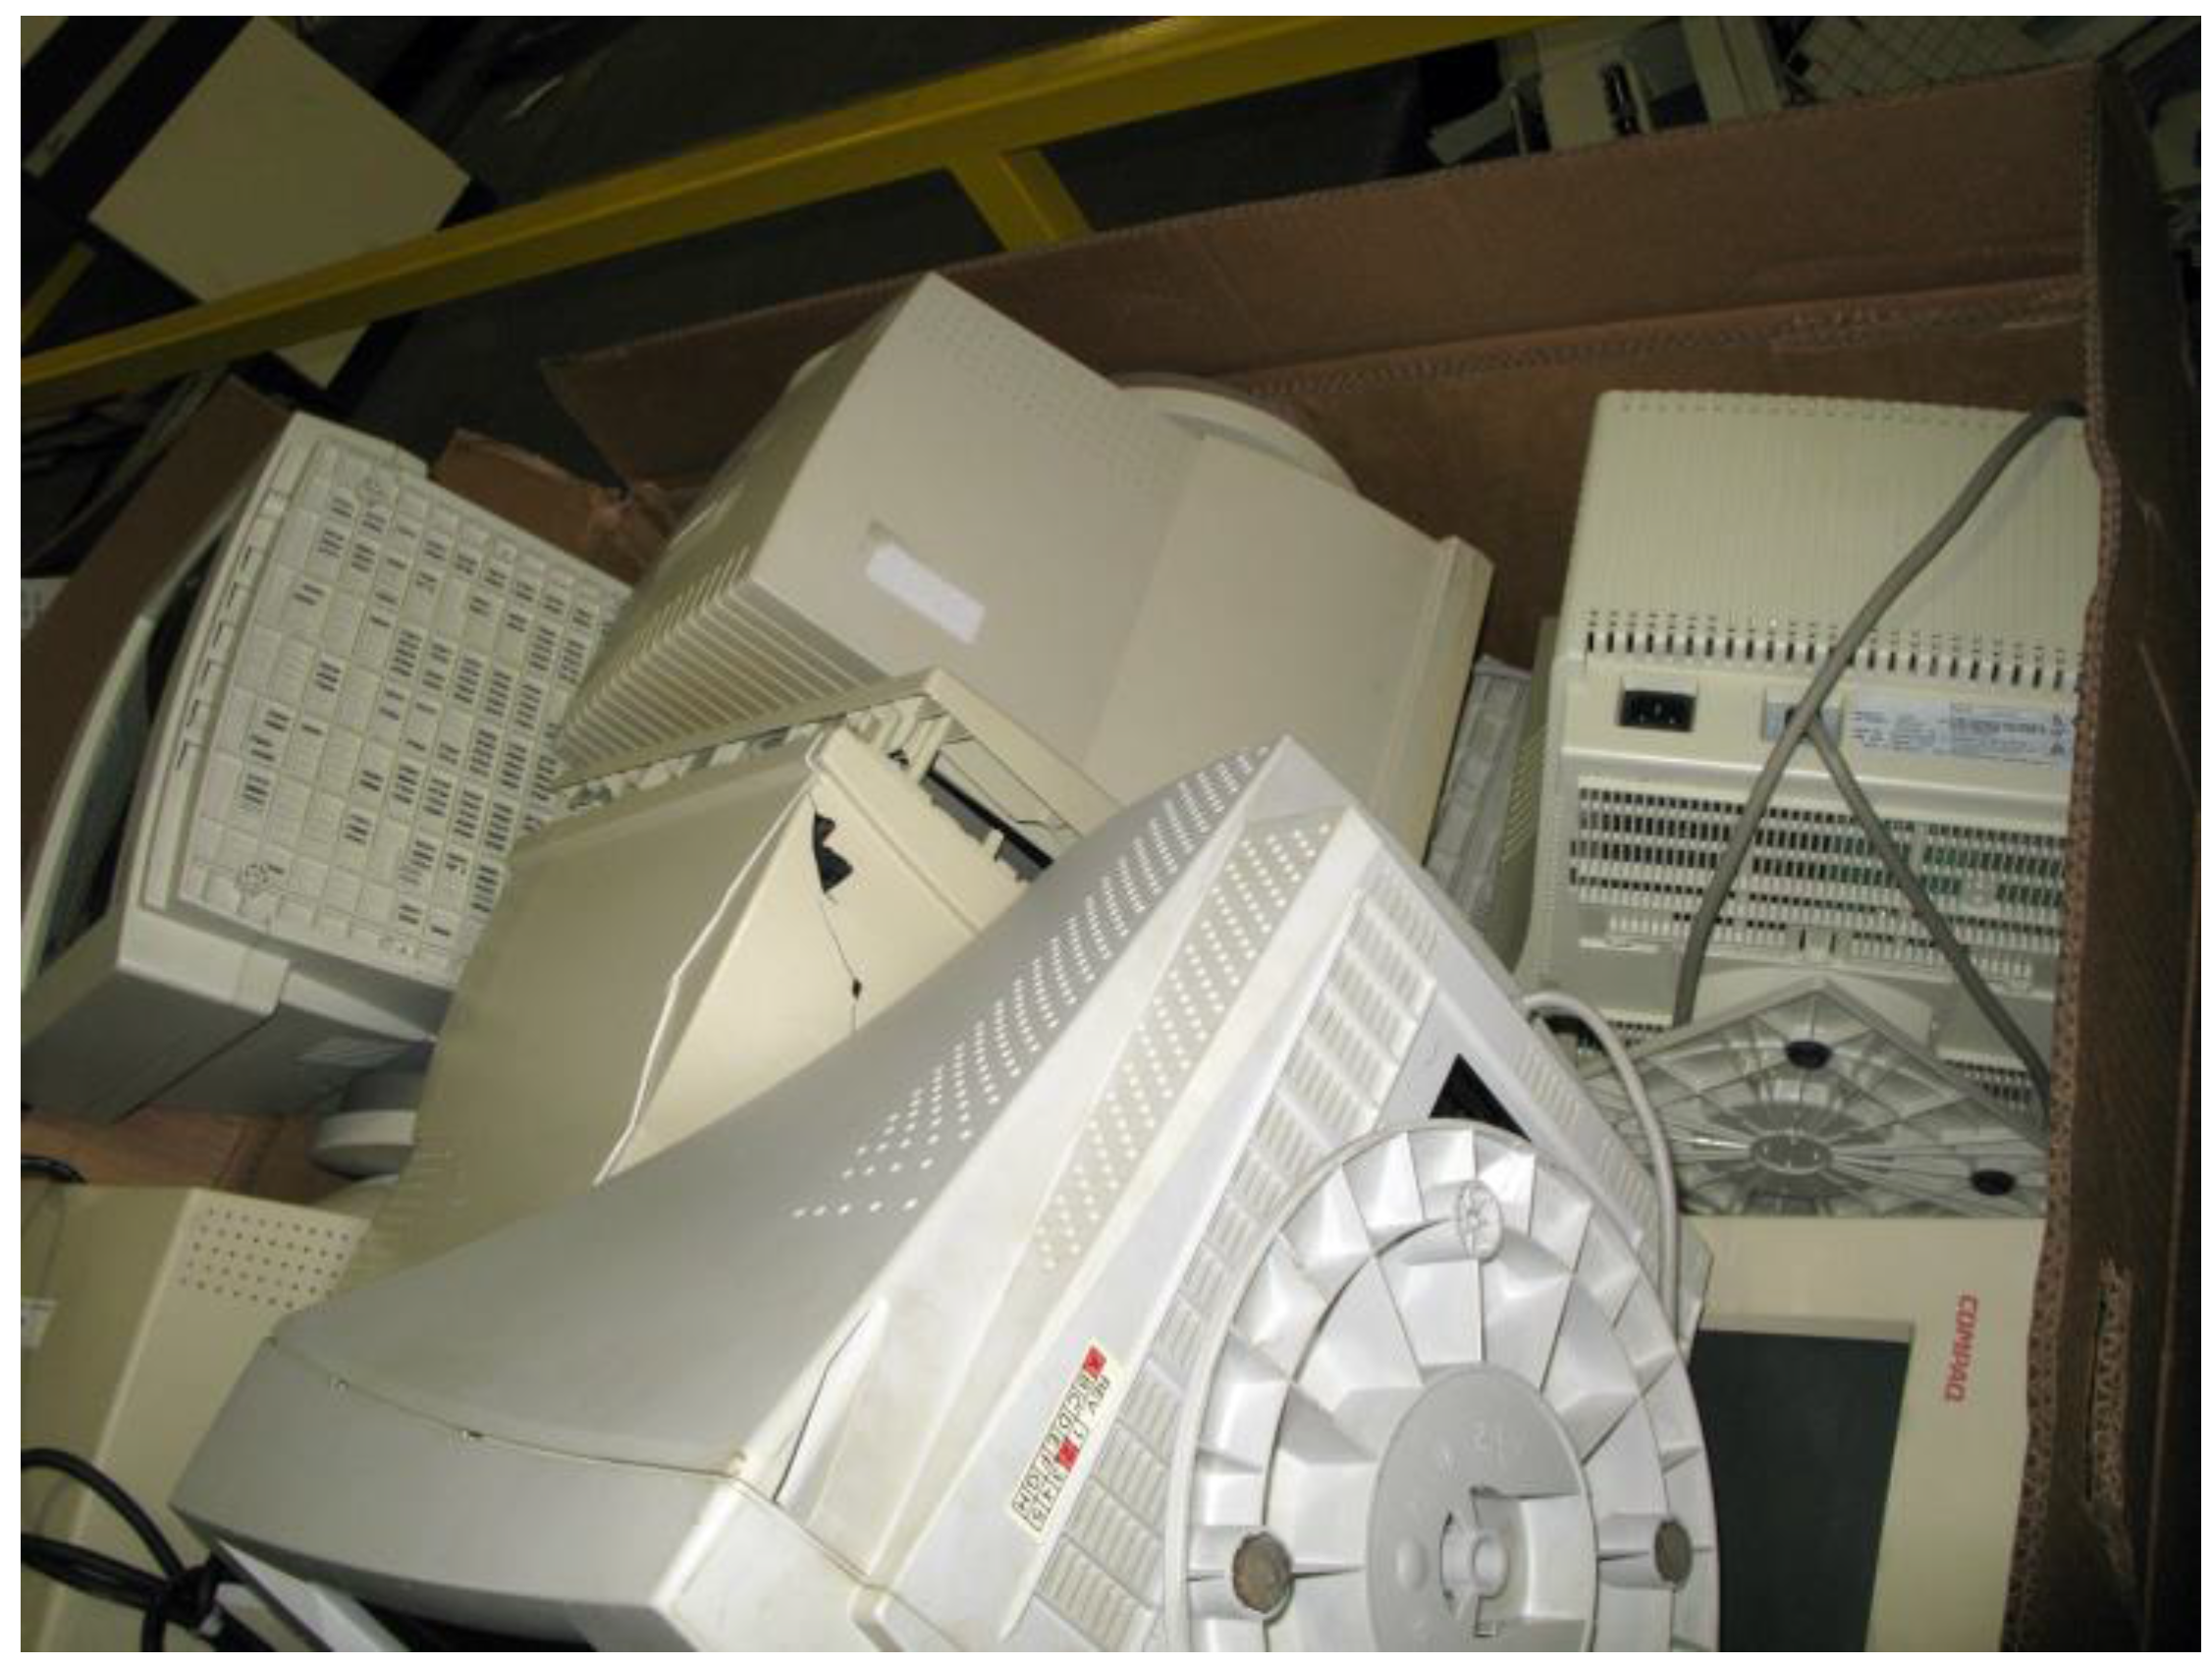
  • IT and IS (information technology and information systems) is a big part of modern sustainable green manufacturing. The impact that IT operations have on the environment has increased. The driving factors are the increased power consumption of today’s advanced computer hardware and the mounting wasteland of discarded PCs and other obsolete hardware in control systems, data centers and others. Therefore, there is a huge research need towards energy consumption reduction, reuse, recycling, remanufacturing, consolidated green data center cooling and reduced energy requirements analysis and even designing IT and IS systems that actively reduce energy needs [3].
  • Industrial ecology and resource recovery/reuse de-manufacturing and re-manufacturing approaches are becoming increasingly important within the manufacturing industry as a result of water scarcity, the rising costs of some key materials, tightening controls on various pollutants (notably air pollutants) and the possibility for new discharge standards linked to various trade waste reviews conducted in different countries.
Internationally, industrial ecology in sustainable green manufacturing is gaining momentum as a research field in response to global resource constraints, particularly energy, water and minerals, and a growing need for companies to show that they are responding to these challenges and not putting out any toxic waste.
Industrial ecology is a complex area of highly integrated science that responsible sustainability-focused designers and manufacturing systems engineers must understand. It is a collection of concepts and approaches that seek to reduce the impact of industrial systems. Scientifically-proven ecological concepts, such as closing the loop, adaptation and resilience, are used to guide the approaches used to lead to improved sustainability of industrial manufacturing and related processes.

3. Methodology and Some Results

The fundamental methodology that our research found to be very successful stems from a quantified lean six-sigma approach, integrated with advanced process modeling, requirements analysis and risk analysis embedded in sustainability statistics, simulation and others, communicated and validated through various advanced simulation and web-based multimedia methods (Figure 1 and Figure 2).
Figure 1. Sustainable green processes are typically complex and can be viewed from many different perspectives (in this diagram, we illustrate two different perspectives).
Systems 03 00027 g001
Figure 2. Our system model for sustainable green systems is comprised of several interacting modules, including the process mapping, modeling and analysis sub-system, the green engineering requirements analysis subsystem, the green engineering failure mode and risk analysis subsystem, simulation, statistical analysis, design of experiments and multimedia communication sub-systems.
Systems 03 00027 g002
As stated, the fundamental purpose of sustainable green engineering is to create and operate systems that meet the needs of the present without compromising the ability of future generations to meet their own needs [2,3]. This must of course include small process steps, like avoiding toxic paint for protecting a device, as well as large problems, such as global warming.
After this broad introduction, we discuss our process modeling methods with sustainable green system model examples.

3.1. Our View of a System

A system is a complex grouping involving men, machines, materials, data/information and financial resources, too. Systems are typically dynamic; nevertheless, for modeling purposes, slow changing systems can be modeled as static systems.
Systems can be broken into sub-systems, and sub-systems can be modeled as interacting objects and components, layer-by-layer. An object is a ‘thing’ that has a name, an identifier, has behavior or process, and attributes, such as inputs, outputs, controls and resources. Individual sub-systems built from objects can interact with each other, as well as with themselves at defined interfaces, by input/output matching.
Sustainability and, in particular, green sustainability are very complex subjects, because they typically include several sub-systems, many dynamically changing processes, objects, containing variables that are often difficult to measure and values that are difficult to calibrate. The proposed greening method is heavily reliant on object-oriented process modeling. The modeling method can describe very small challenges, as well as large systems, because it is built of components, objects and layered sets of objects, interacting with each other; like objects in the real world. The methodology is extended by requirements analysis, risk analysis, statistical process control simulation and multimedia for communication. (Please note that in this article, only the process modeling aspect is discussed in some detail. The entire model description can be found in an eBook [3]).
It is important to recognize that most sustainable green challenges are based on some kind of process challenge or issues. This means that if we can model each important process step, we can capture toxic, unsustainable and/or non-green objects and activities before they can cause harm to humanity and/or the environment. Then, we can move on to focus on larger systems and challenges, too, object-by-object, layer-by-layer, including global warming [3,9,10,11,12,13,14,15,16,17] (this is a very large system and a huge challenge).
A system forms part of a hierarchy of systems with definable interfaces. A system must have an overall objective. The maximum effectiveness of a system is only possible after effective design. This is clearly visible when designing sustainable green engineered systems. Due to complexity, every object in such a system must have sustainable green engineering built into its design to be effective. Since most systems become complex, one should be careful about two key issues:
  • Often, systems engineers are trying to solve the wrong problem. This is because they do not clearly understand the requirements. Often, the solution to a real problem is much simpler than what it first appears to be. Because some system analysts fail to recognize the above issues, industry’s frustration with quality IT and IS (information technology/information systems) has been chronic and, more than often, disappointing (some good examples of poor IT/IS software systems include some social networking sites).
  • There is a bigger picture to be considered, too. When designing a sustainable green quality system, one should first perform system analysis of the ‘as is’ system (if this exists) and then design the new system (also known as the ‘to be’ system). The typical phases in this development cycle are planning (this includes customer requirements analysis), System analysis, system design and system implementation/integration/testing.
Systems, like other products, can have multiple life cycles. A sustainable green systems development lifecycle (SG-SDLC) is the process of understanding how an eco-friendly system can support business/customer needs, how such a system should be designed, built, delivered to customers, maintained and even re-used/re-cycled as any other multi-lifecycle product.

3.2. What Is a Process?

A process can be defined as the transformation of one or more inputs (data, raw materials, customer requests, etc.) into outputs (processed data, processed materials, satisfied customers, as a service). In Figure 3 and Figure 4, we illustrate some good process examples, which are relatively easy to describe, model and control.
The transformation involves the addition or creation of value, typically by processing data, improving cycle time, reducing failure rates, increasing robustness, reducing cost, changing places, changing the form or shape, or others. (Note that our process modeling methodology refines the way we look at processes, in that it separates inputs, outputs, controls and resources, as well as offers layering for complex projects.) Unfortunately many managers think that when quality engineers talk about process improvement, they only think about manufacturing or assembly processes. Any process can be improved in any system, including design, manufacturing, marketing, legal, service, financial, administrative, and others. Figure 5 and Figure 6 illustrate real-world sustainable processes of solar panels on NJIT’s (New Jersey Institute of Technology) roof. In this example, also, the energy flow from solar to consumption can be process modeled relatively easily (this should be done by means of step-by-step, object-by-object transfer function analysis).
Figure 3. Examples of old computers to be re-manufactured. Such processes are relatively simple to model, because most variables are well defined.
Systems 03 00027 g003
Figure 4. Example of shredded particles of an old computers (this illustrates the end product of re-manufactured old computers).
Systems 03 00027 g004
Figure 5. Examples of static solar panels on NJIT’s (New Jersey Institute of Technology) roof. In this example too, the energy flow from solar to consumption can be process modeled relatively easily.
Systems 03 00027 g005
Figure 6. Examples of solar panels that follow the sun, on NJIT’s roof. In this example, also, the energy flow from solar to consumption can be process modeled relatively easily.
Systems 03 00027 g006
Process mapping is a core method in lean six-sigma-focused greening and sustainability research. It is an approach for creating a process, or more likely a process step, that can describe material or information flow in a graphical format. It defines key process input(s), output(s), control(s) and resource(s).
This is the basic method when creating a process map for sustainable green processes:
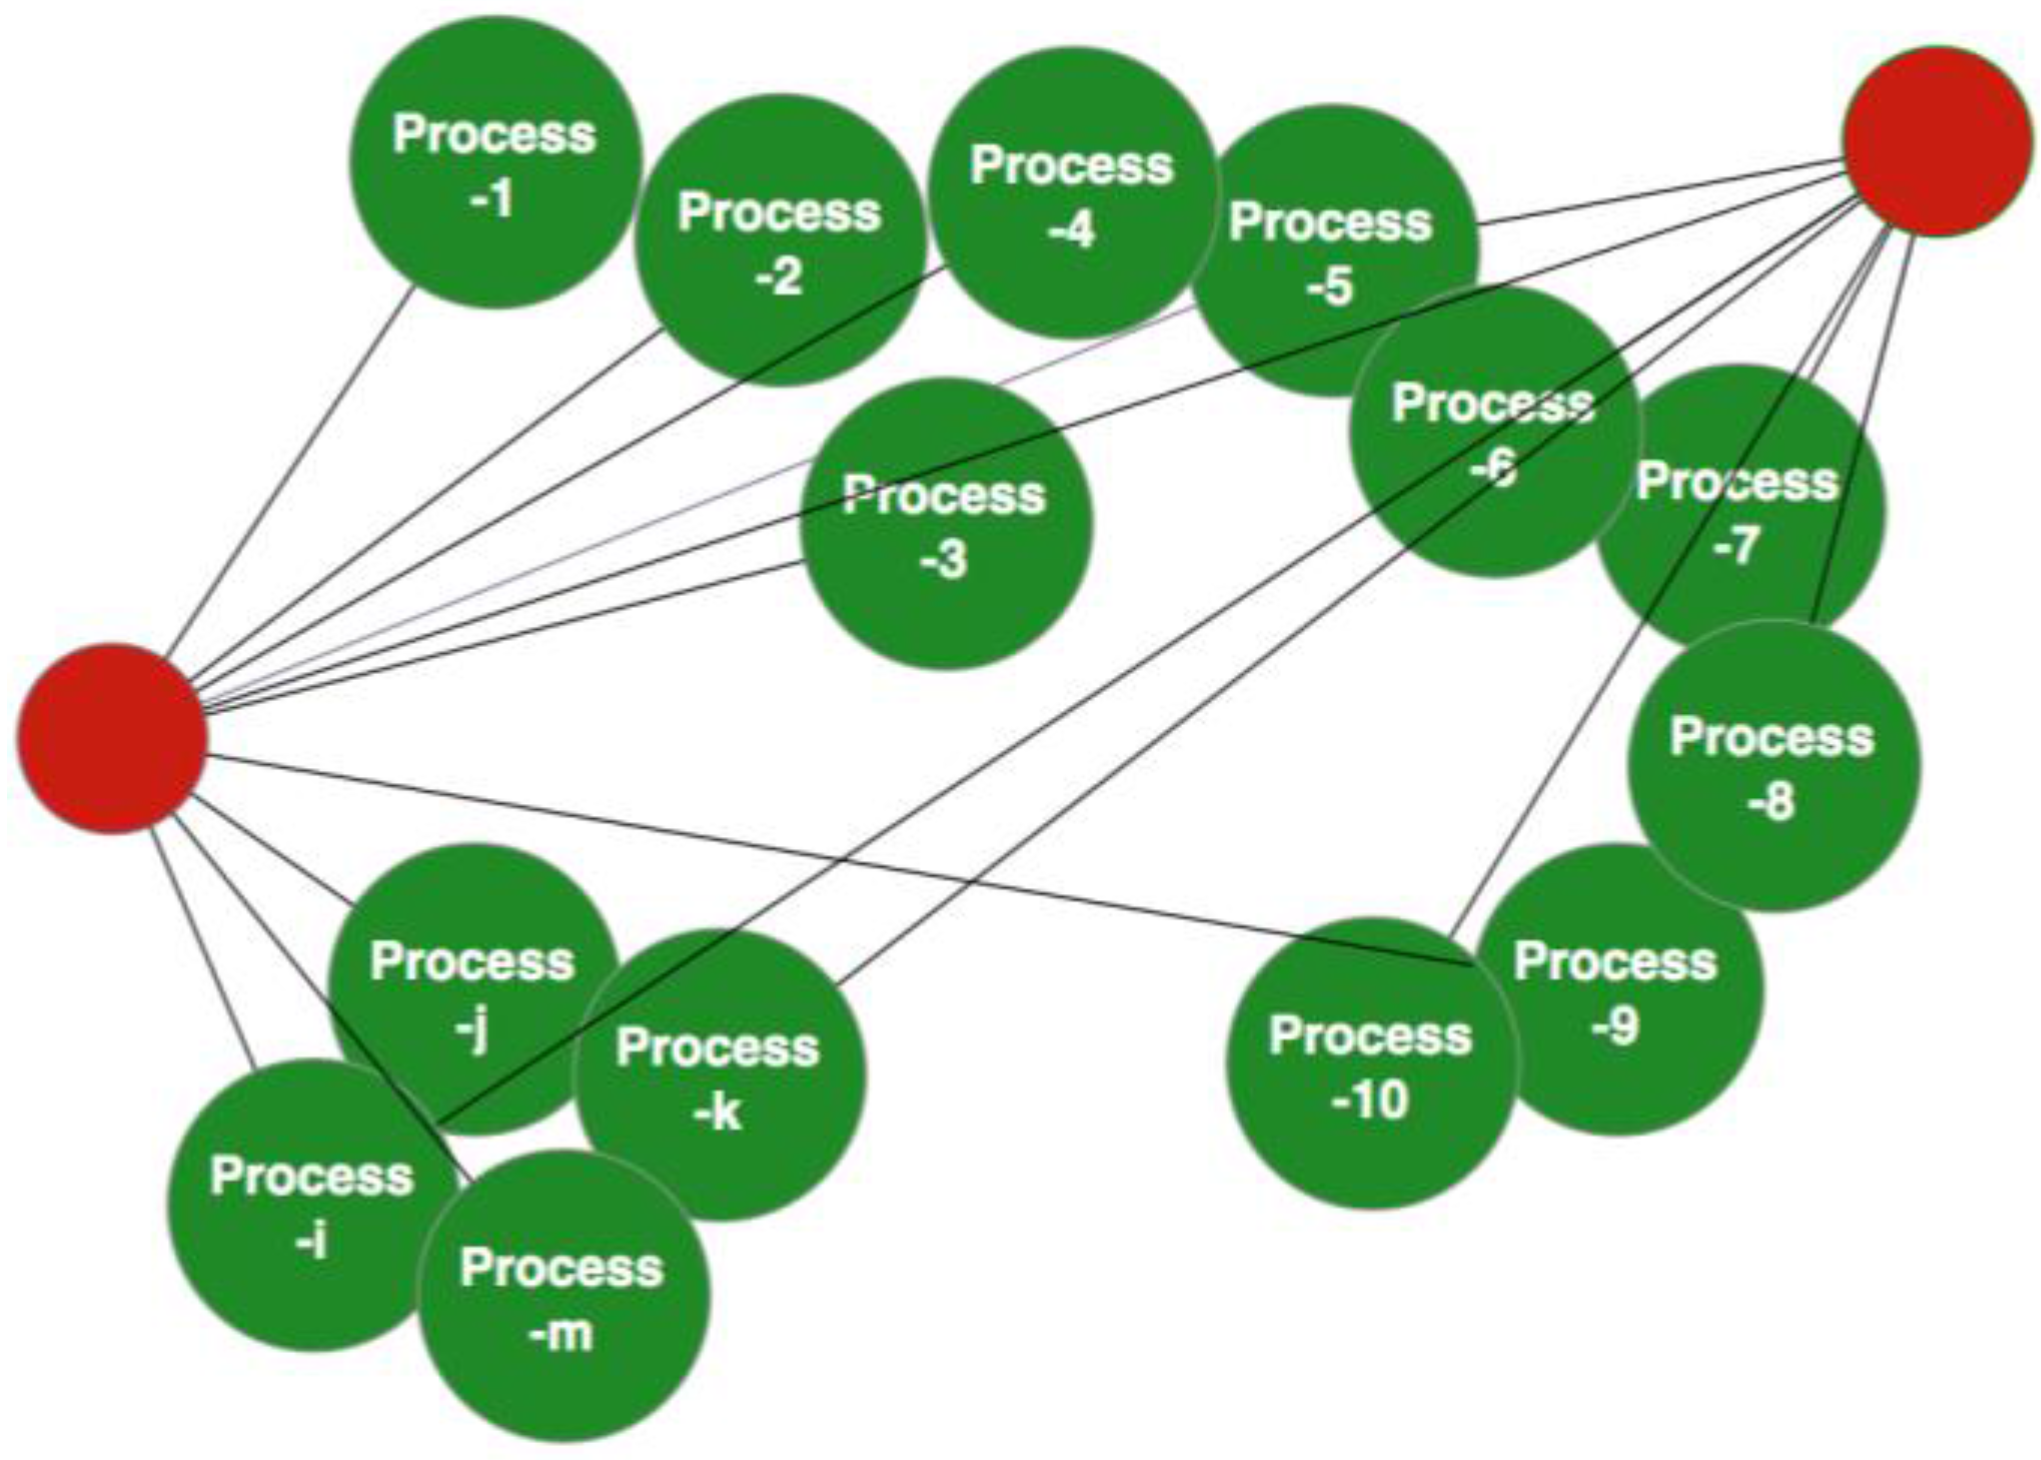
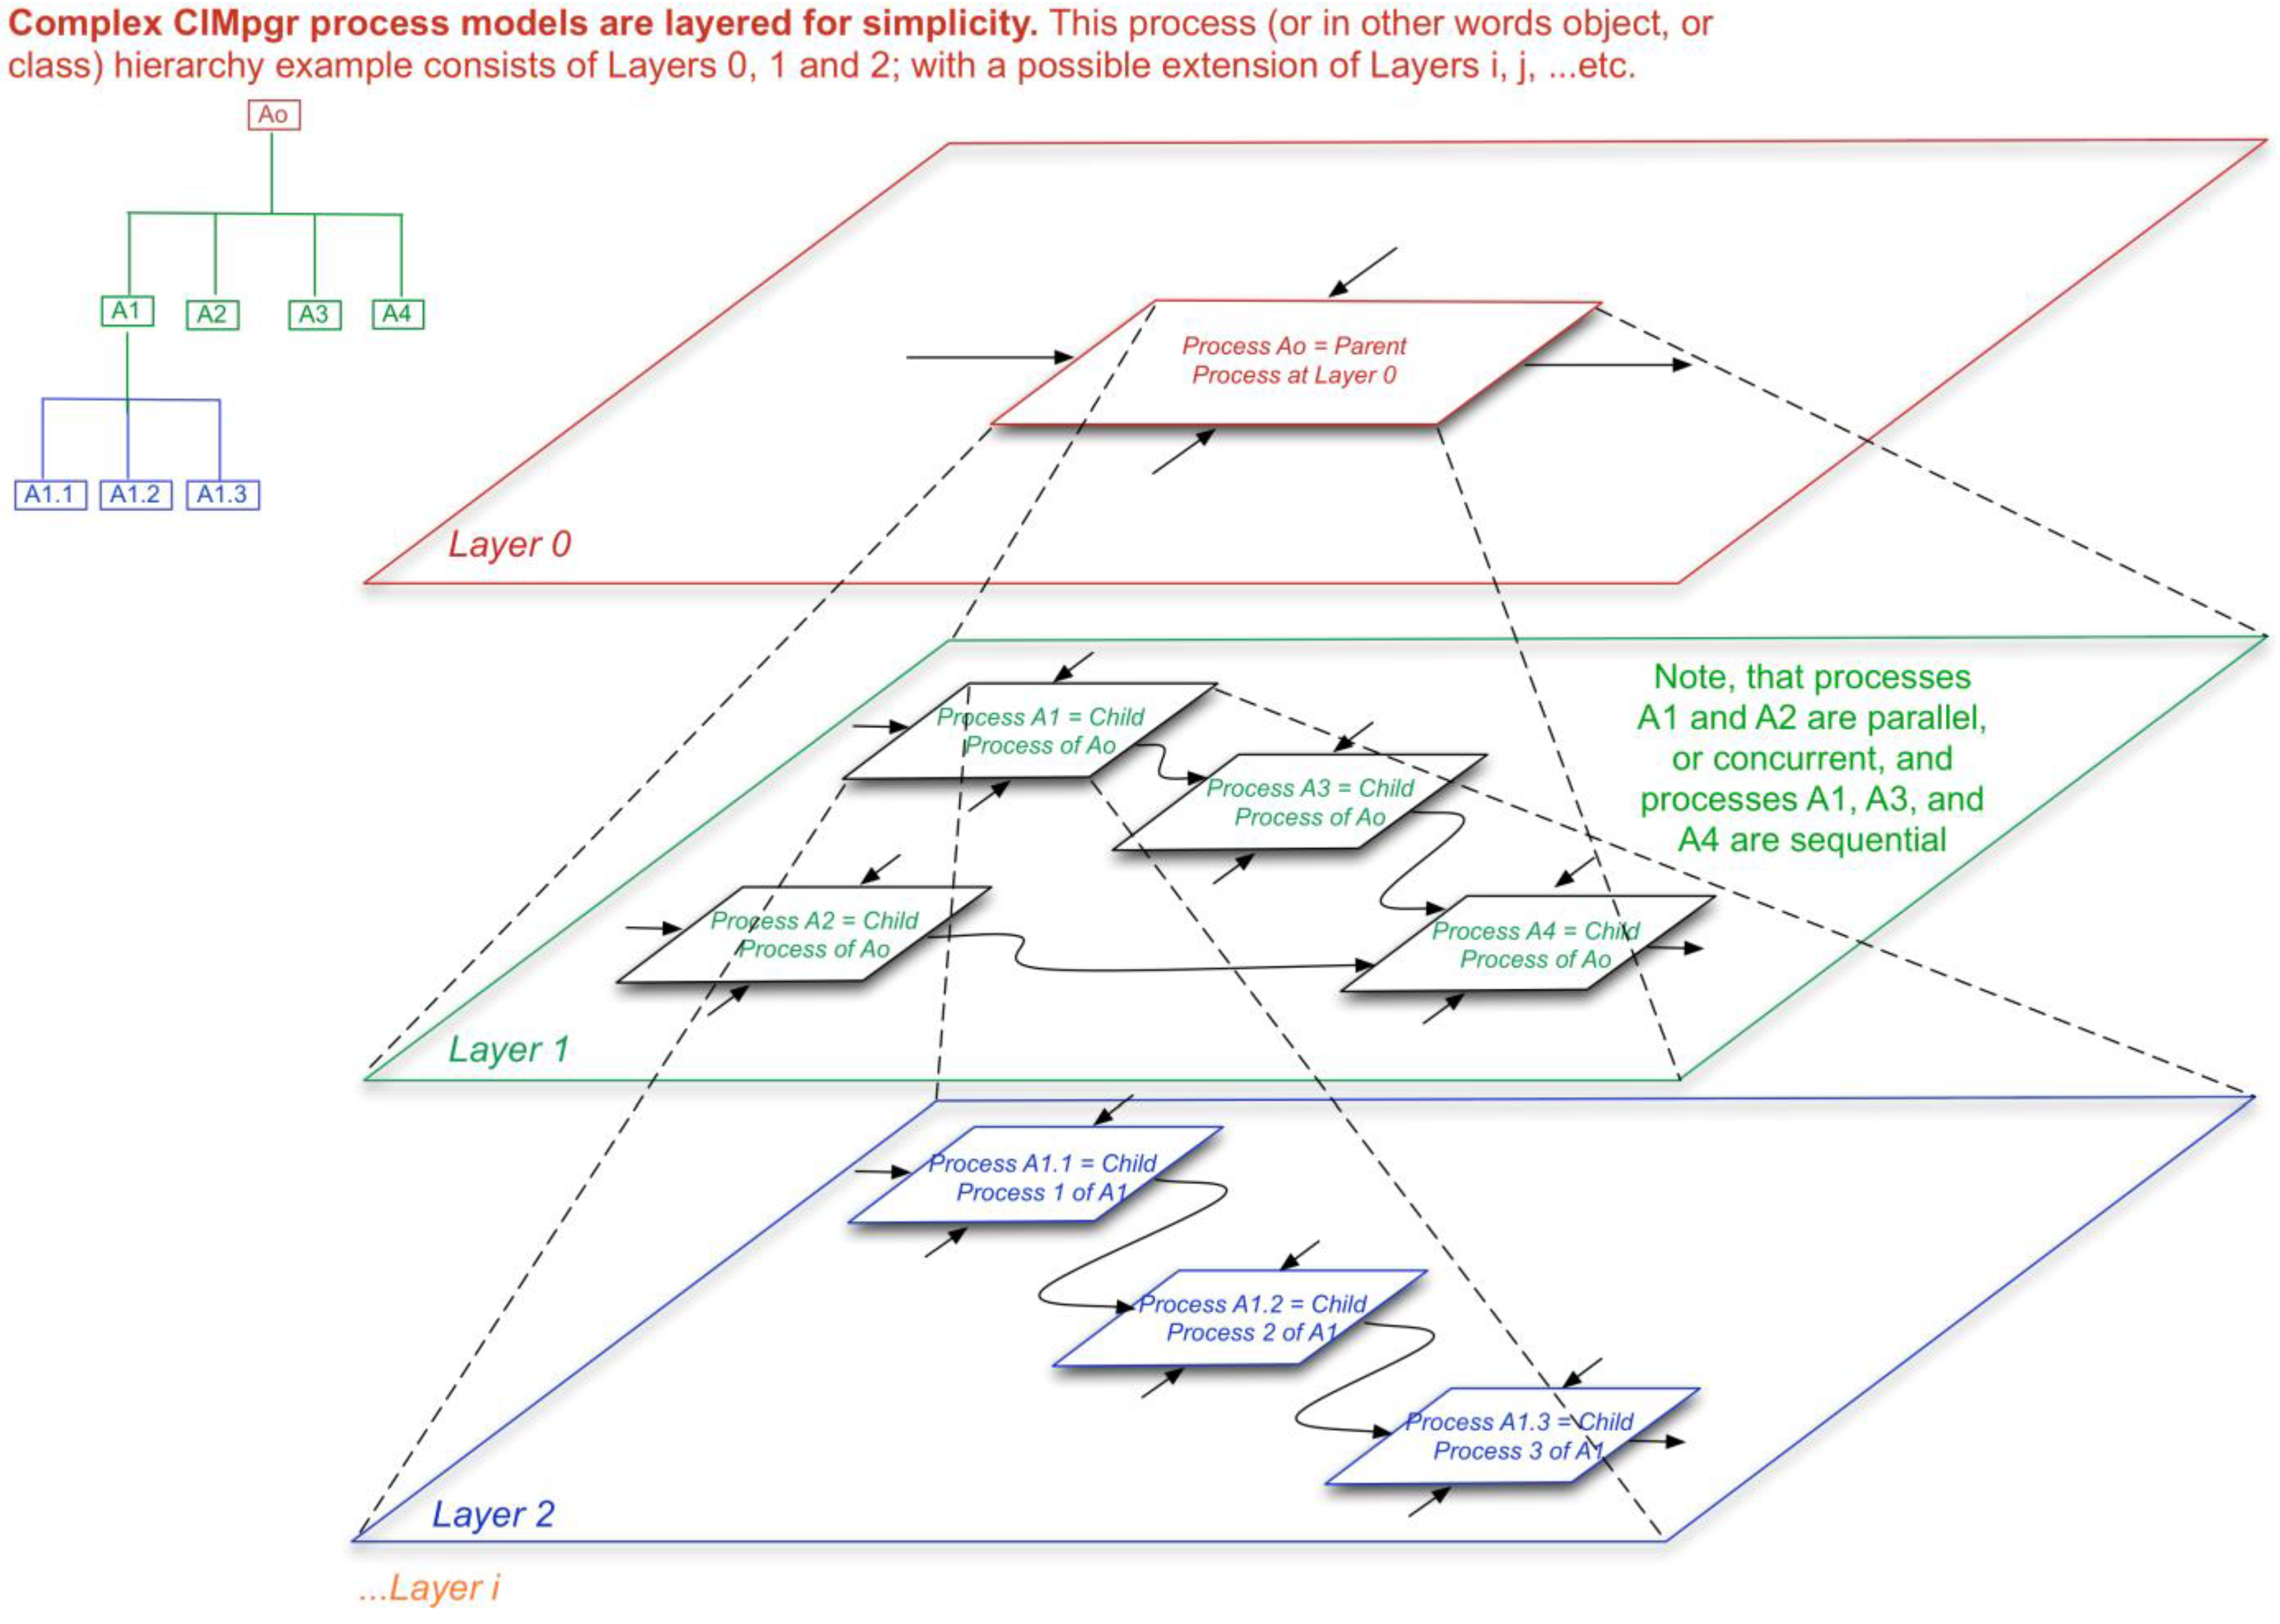
  • Think of layers, meaning at which level do you want to create your process map. See the real-world system as a big ‘onion’ that you could gradually peel. Each of these can be modeled as a layer. (Stay focused, and do not miss the reasons for creating a process map, e.g., to describe and document the process, for the purpose of improving them, determining the best method, educating others, etc.)
  • Define the boundaries of the real-world activities or process you want to model. State: ‘this process begins with ABC and ends with XYZ’.
  • The first boundary becomes the first step of your process.
  • The last boundary is going to be the last step of your process.
  • List all of the major steps that occur between.
  • Analyze, review and refine your work (follow continuous quality improvement methods).
Note that process maps are not flowcharts. Flowcharts are good for displaying an algorithm or a simple, sequential process flow graphically, but they do not take it to the next level of analysis.
A process map modeled using our methodology gives the attributes for each process step; therefore, you can analyze and answer the following:
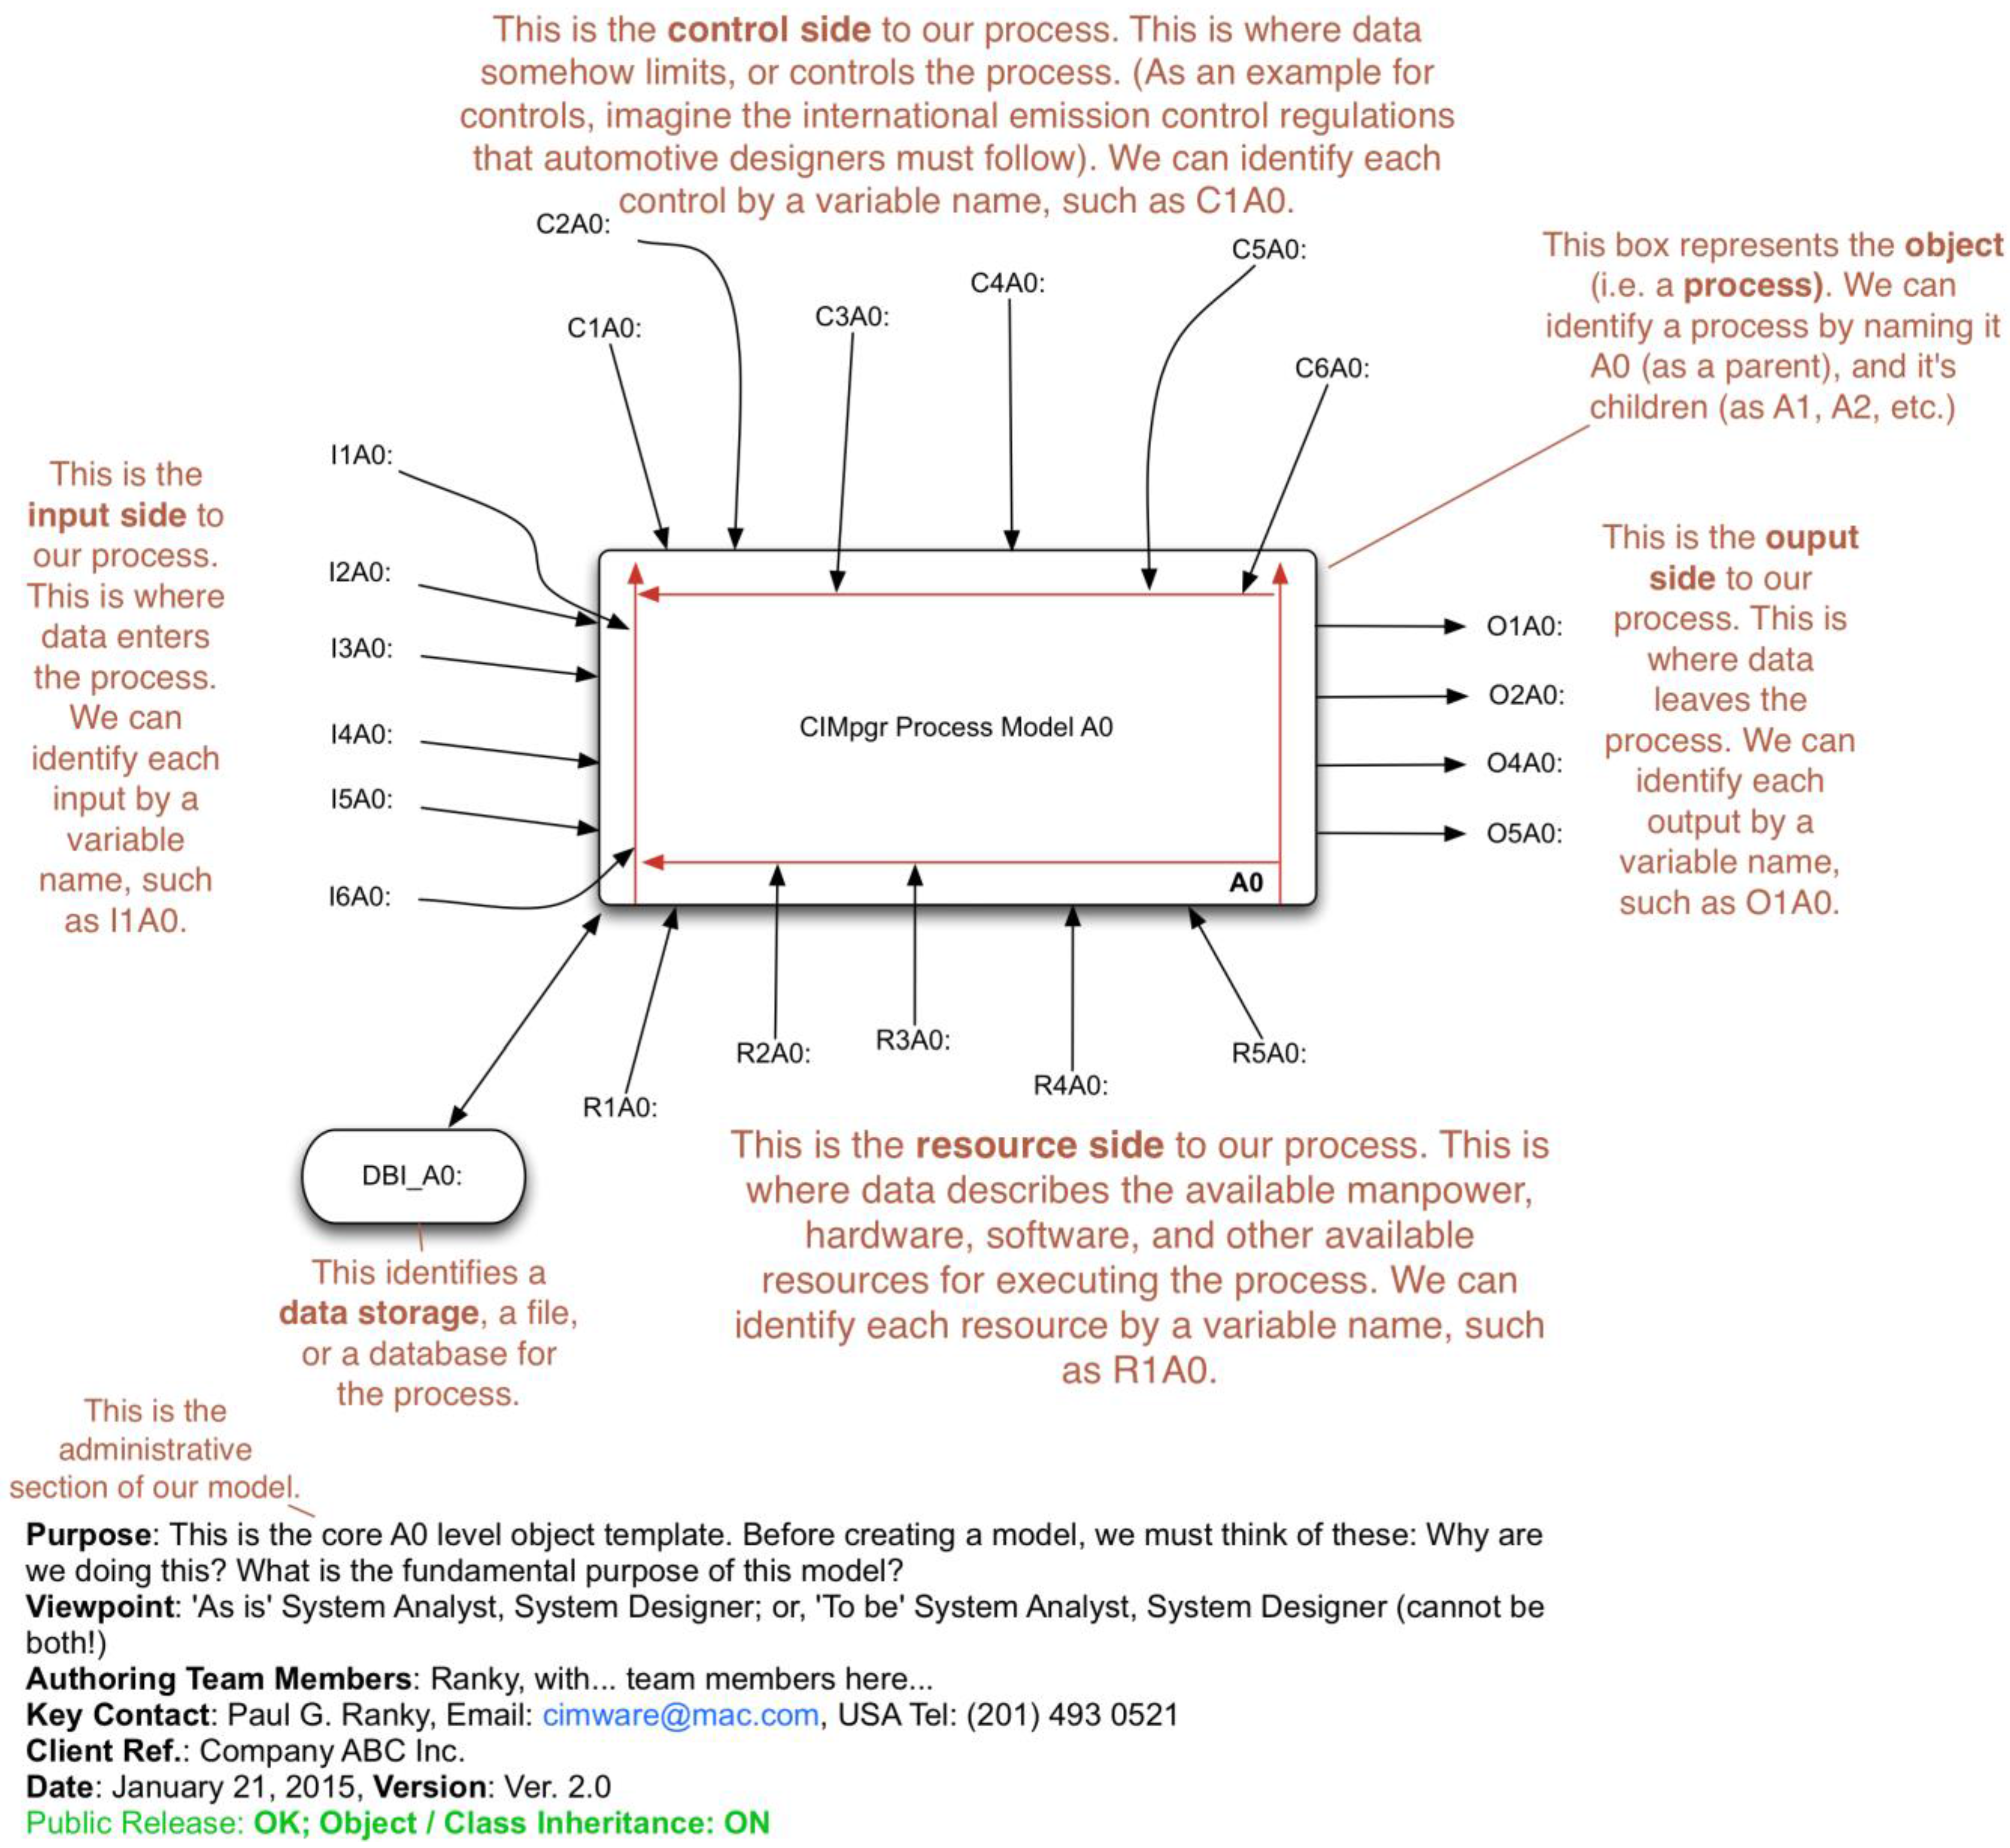
  • Who is responsible for each process step?
  • What goes in, what comes out (i.e., the transfer function), under what constraints (controls) using what resources?
  • What is the cycle time? (Note that this is very useful for object-by-object cost analysis.)
  • Where are the delays?
  • Where is the waste and potential toxicity generated?
  • Are there any duplications of effort?
  • How many defects are there per unit?
  • Is the process step adding value or only cost? etc.
A complete process model is a set of diagrams, which systematically illustrate the object-to-object relationships between the objects, their functions and entities.
The diagrams are often arranged in a layered, unbalanced tree-like fashion, illustrating a parent-child relationship, which together can be thought of as a collection of carefully-coordinated objects, describing a system under investigation or design. (Note that this is particularly useful if it is a new system.)
Following the layered approach of decomposing/identifying objects in a complex system, at the top of the tree, there is a very high-level description of the entire system, and the further down the tree one navigates, the descriptions of the individual parts (objects) of the system become more detailed.
For example, in Figure 7, the parent diagram can describe a quality process in a machine shop as an activity that converts materials and an engineering drawing into the finished component by use of engineering expertise and the appropriate production machine(s).
Figure 7. Following Ranky’s CIMpgr object-oriented process modeling method, object-to-object relationships can be graphically modeled following a 3D layered approach to deal with complexity. (Note that traditional process models do not have such layered 3D capabilities.
Systems 03 00027 g007
Decomposing this, the child diagrams then can detail the information in the parent diagram by identifying the major activities involved in manufacturing the particular component, e.g., studying the engineering drawing, determining the manufacturing process or processes required and manufacturing the component. Thus, the overall activity described in the top diagram is gradually detailed by the child diagram in this layered architecture.
Similarly, as shown in Figure 7, Figure 8 and Figure 9, each box (or object) on the child diagram can be described in greater detail by further child diagrams of its own. This process of showing greater and greater detail of integrated objects (until the required level of system description is reached) is called decomposition.
It is important to mention that if inheritance is on, attributes affecting objects at higher level classes (layers) get inherited by lower level child objects. This is a good feature because OO (object-oriented) visual programs or object/class diagrams (like CIMpgr diagrams) do not become crowded, making them difficult to interpret.
Figure 8. Object definition diagram in Ranky’s CIMpgr object-oriented process modeling method. (Note that objects have an identifier, input, output, control and resource attributes that drive the process (the behavior of the object). The diagram defines these attributes.)
Systems 03 00027 g008
Figure 9 illustrates a sequential approach, whereas Figure 10 has some parallel process activity to reduce time-to-market. In all cases, the first process step is requirements analysis, followed by system analysis, then system design, then the implementation/integration process, and last, but not least, the testing and validation process. Furthermore, note that most processes have feedback-controlled loops. These enable continuous quality improvements and system design refinements in our dynamically changing sustainable green world.
Figure 9. These are actual examples of a Level 1 system design model in Ranky’s CIMpgr, for sustainable green systems.
Systems 03 00027 g009
Figure 10. An example of a Level 1 system design model in Ranky’s CIMpgr, for sustainable green systems with some parallel processes and feedback control loops.
Systems 03 00027 g010

3.3. System Analysis and Design Methods

Most system analysts, as well as designers think in terms of interacting objects that can express some behavior or, in other words, one or more process steps.
Both analysts, as well as designers, use several different techniques to create a quality sustainable system. These include the following:
  • Informal techniques: This is probably the simplest and most widely-used method, since it uses natural language and human interaction skills. On the other hand, this is probably the most unreliable method. (As an example, imagine discussing a sustainable green system requirement with people you meet in a public place. How accurate can your findings be? Can you responsibly design a new system or improve an existing system based on such inputs?)
  • Formal techniques: These include the use of formal mathematical notation with variable names and calibrated values, visual modeling, simulation and theorems and, therefore, become more precise. On the other hand, such techniques need experienced analysts/designers.
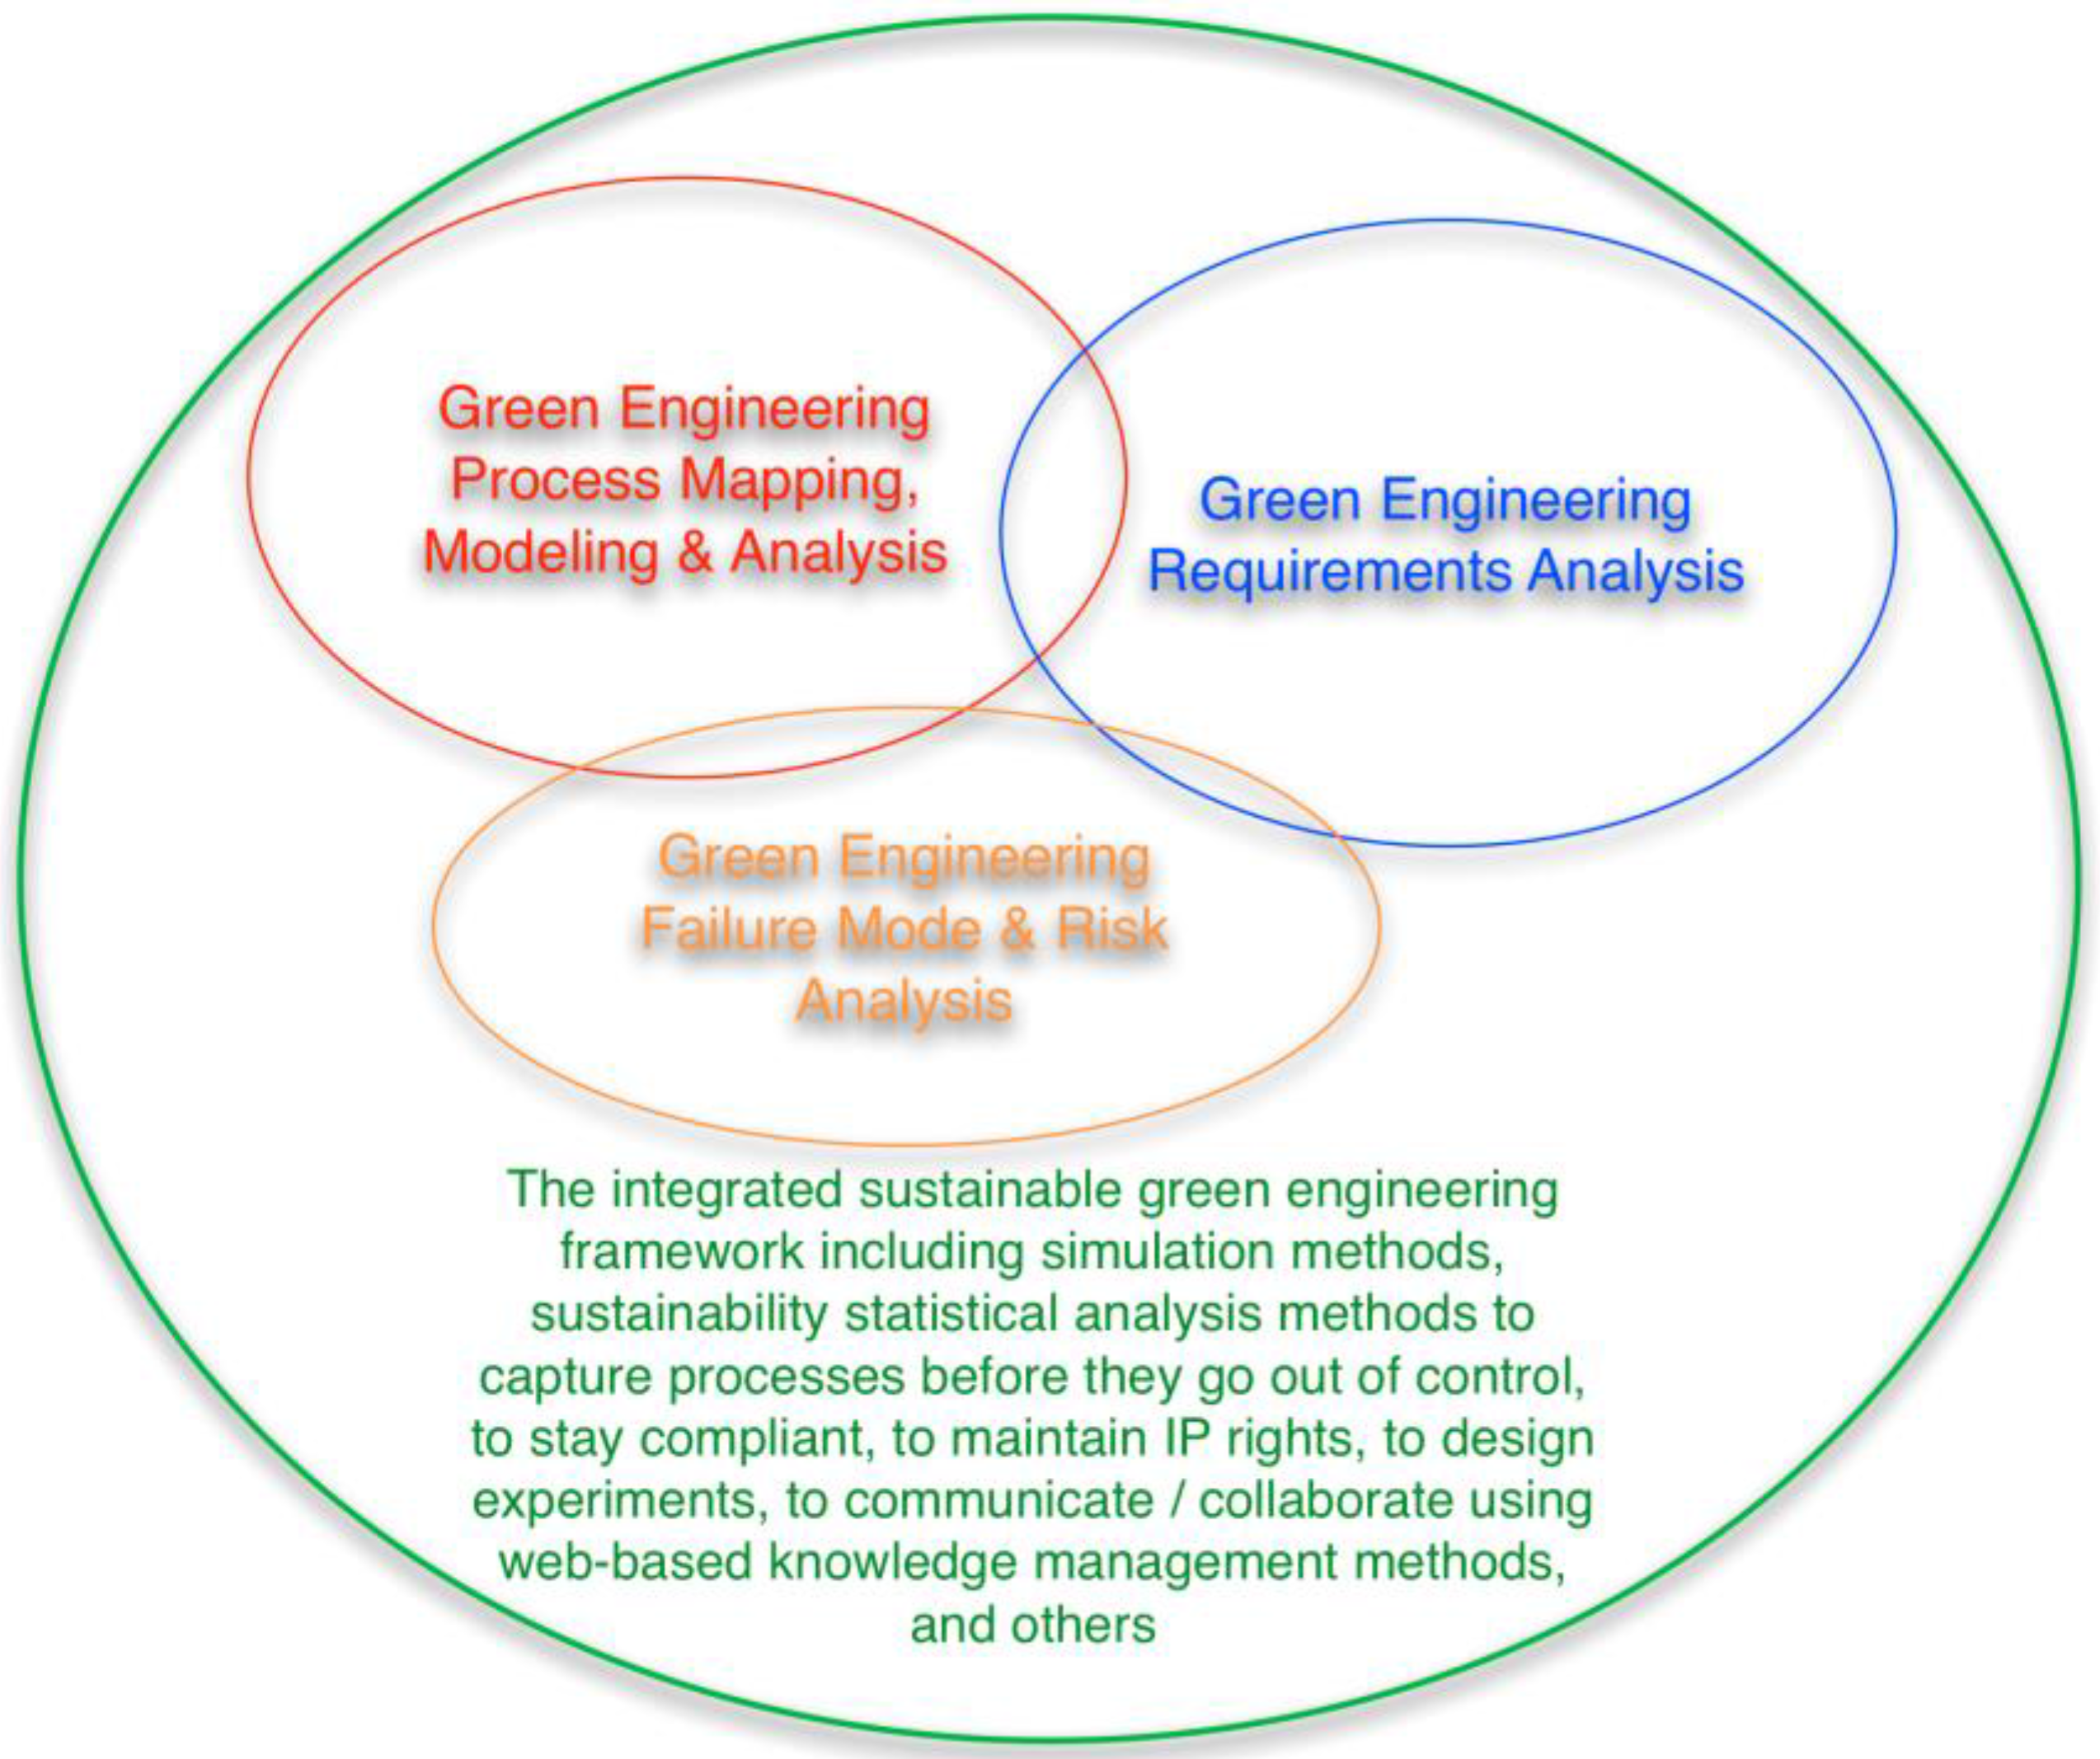
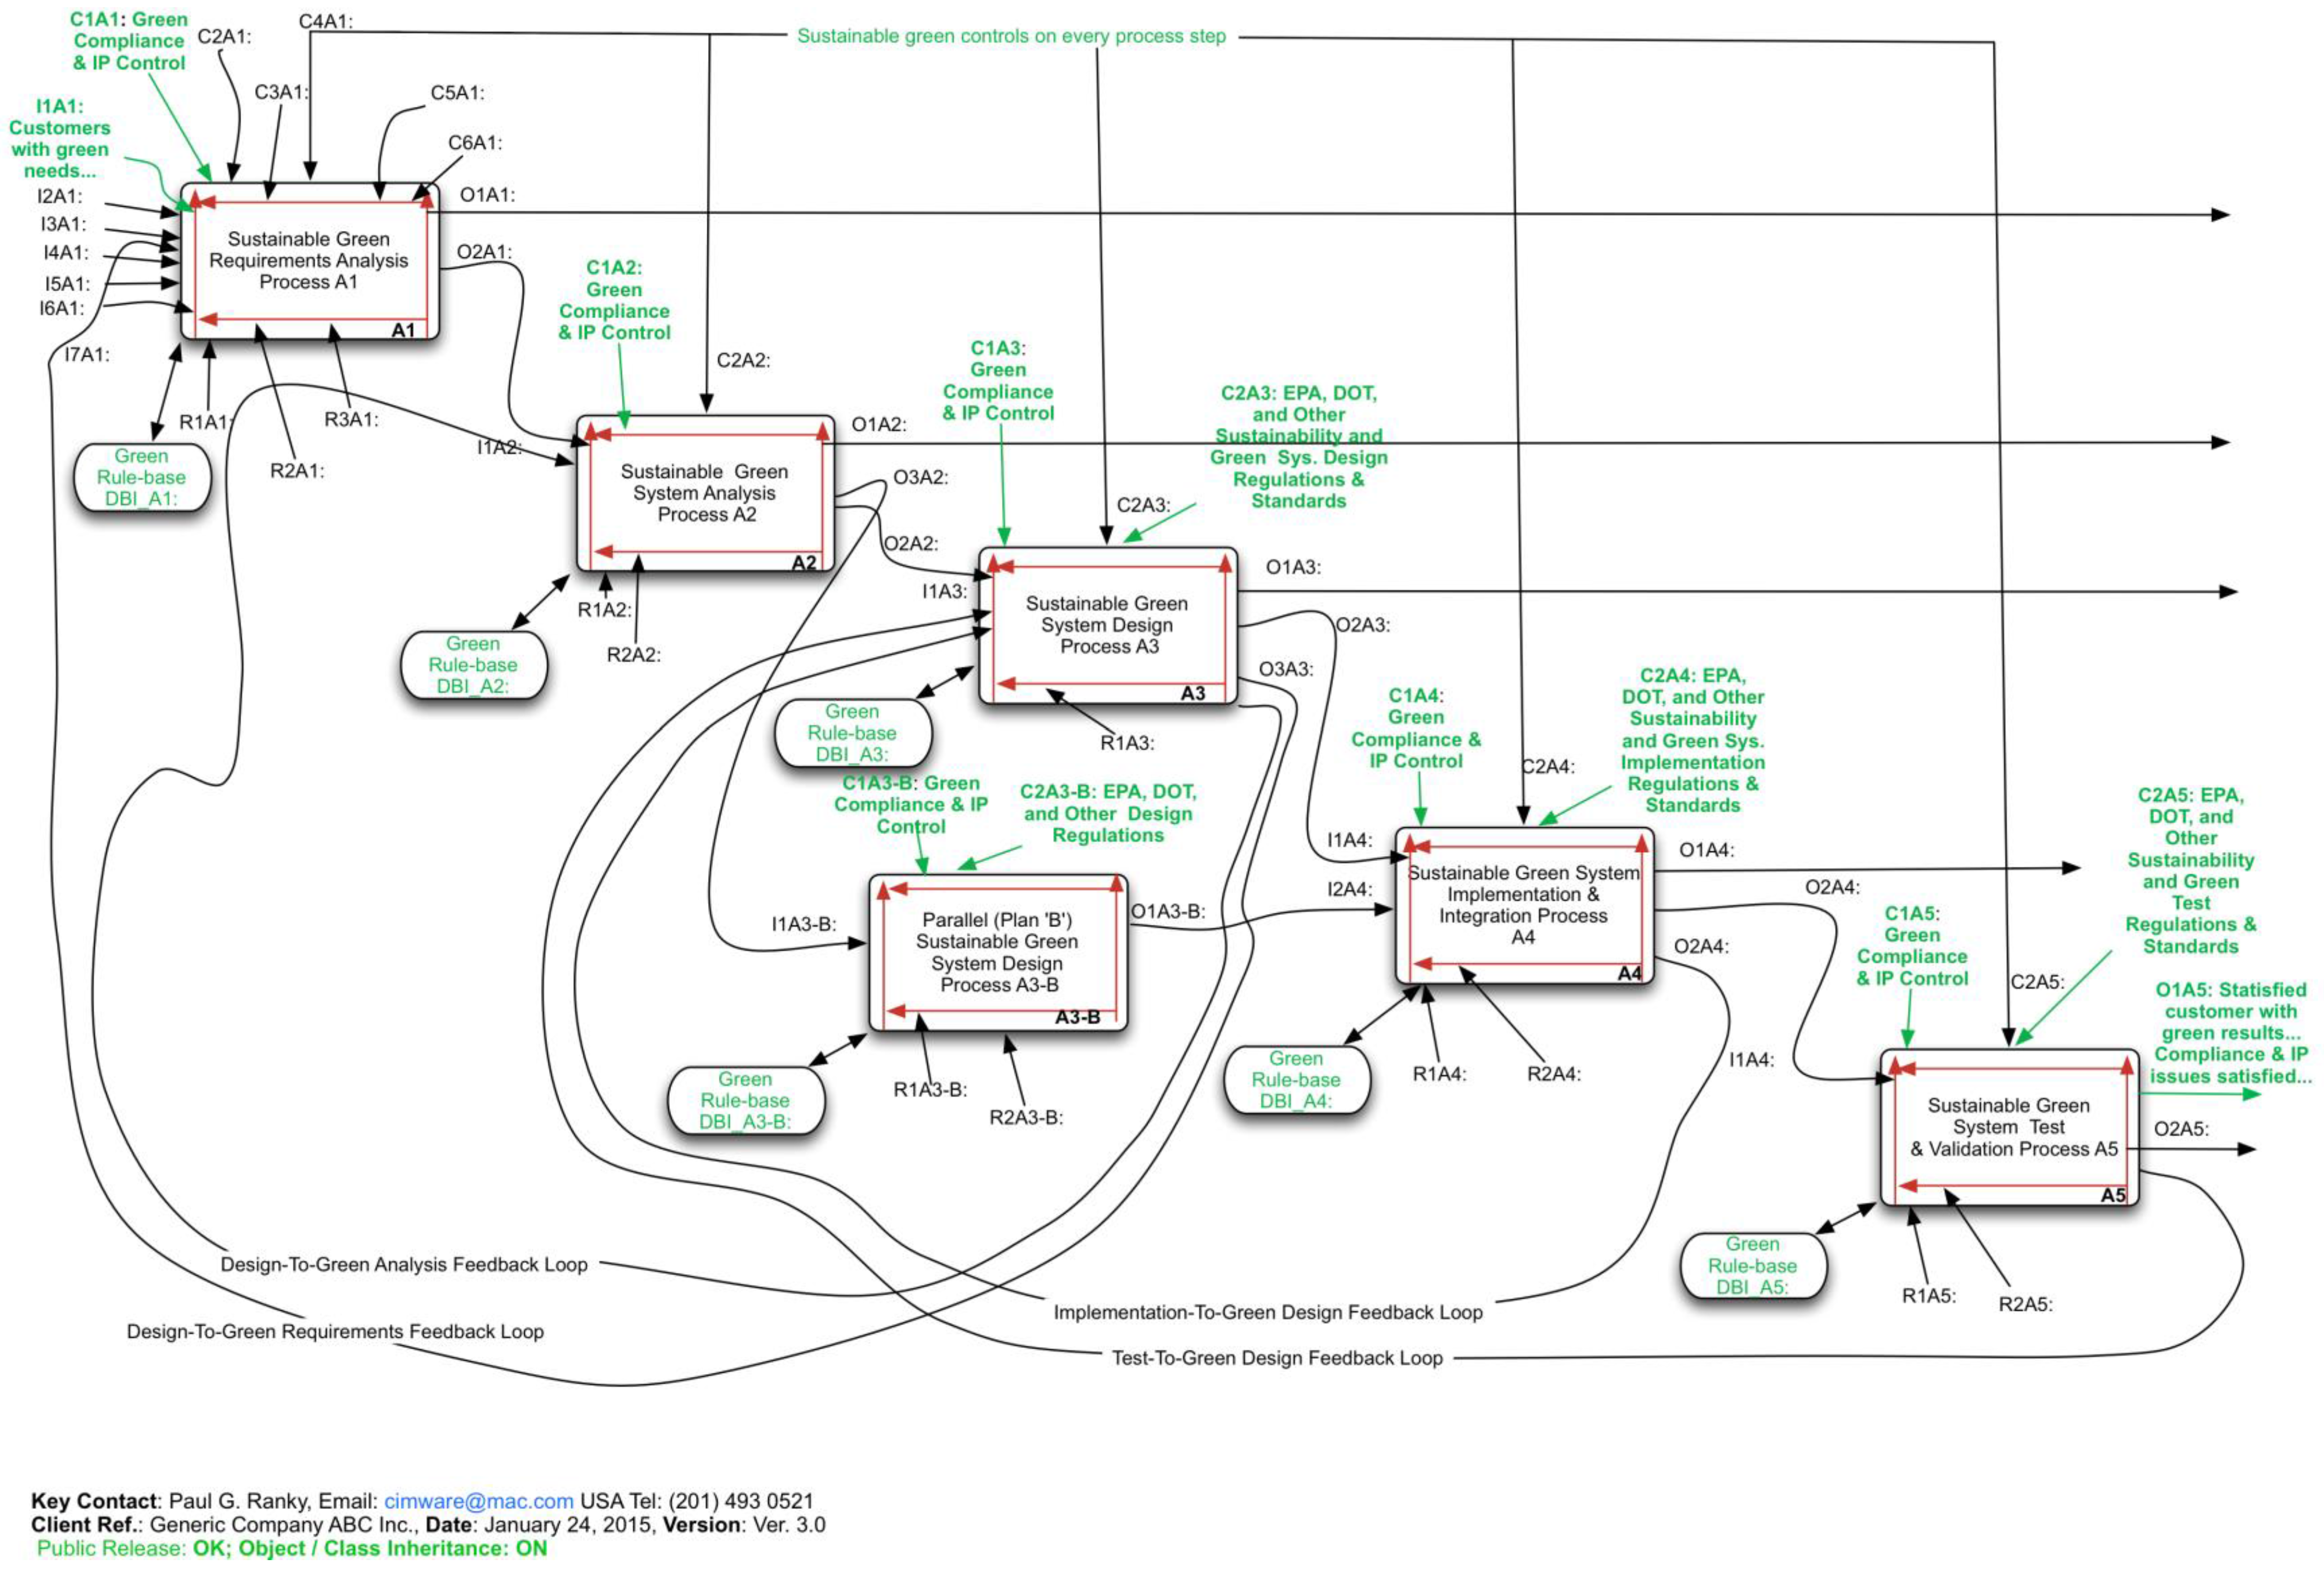
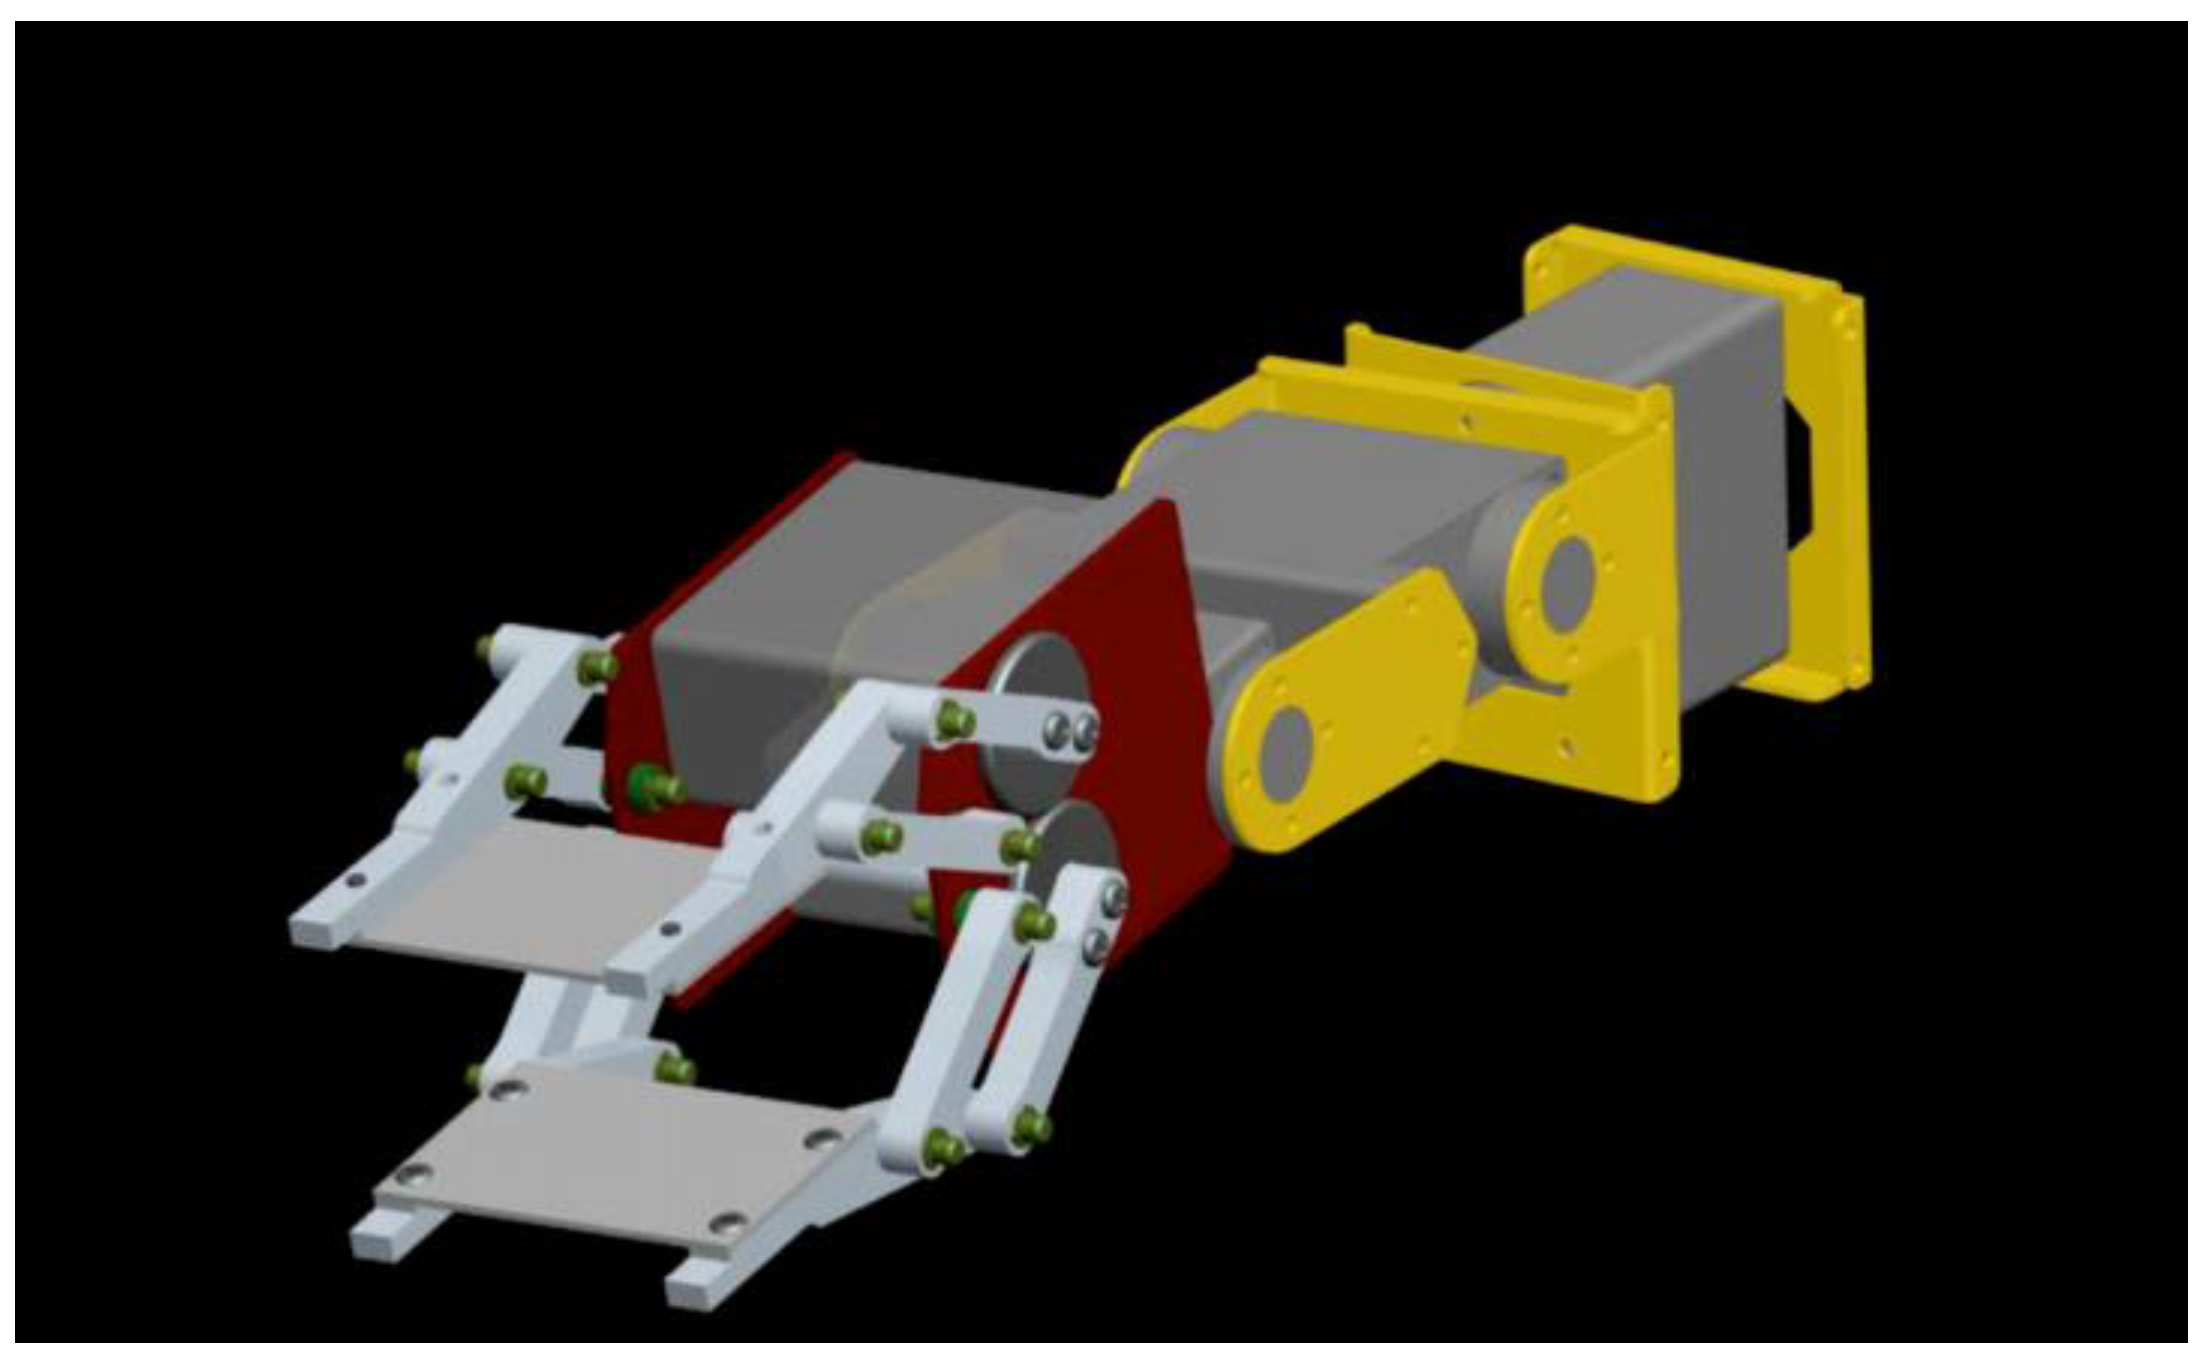
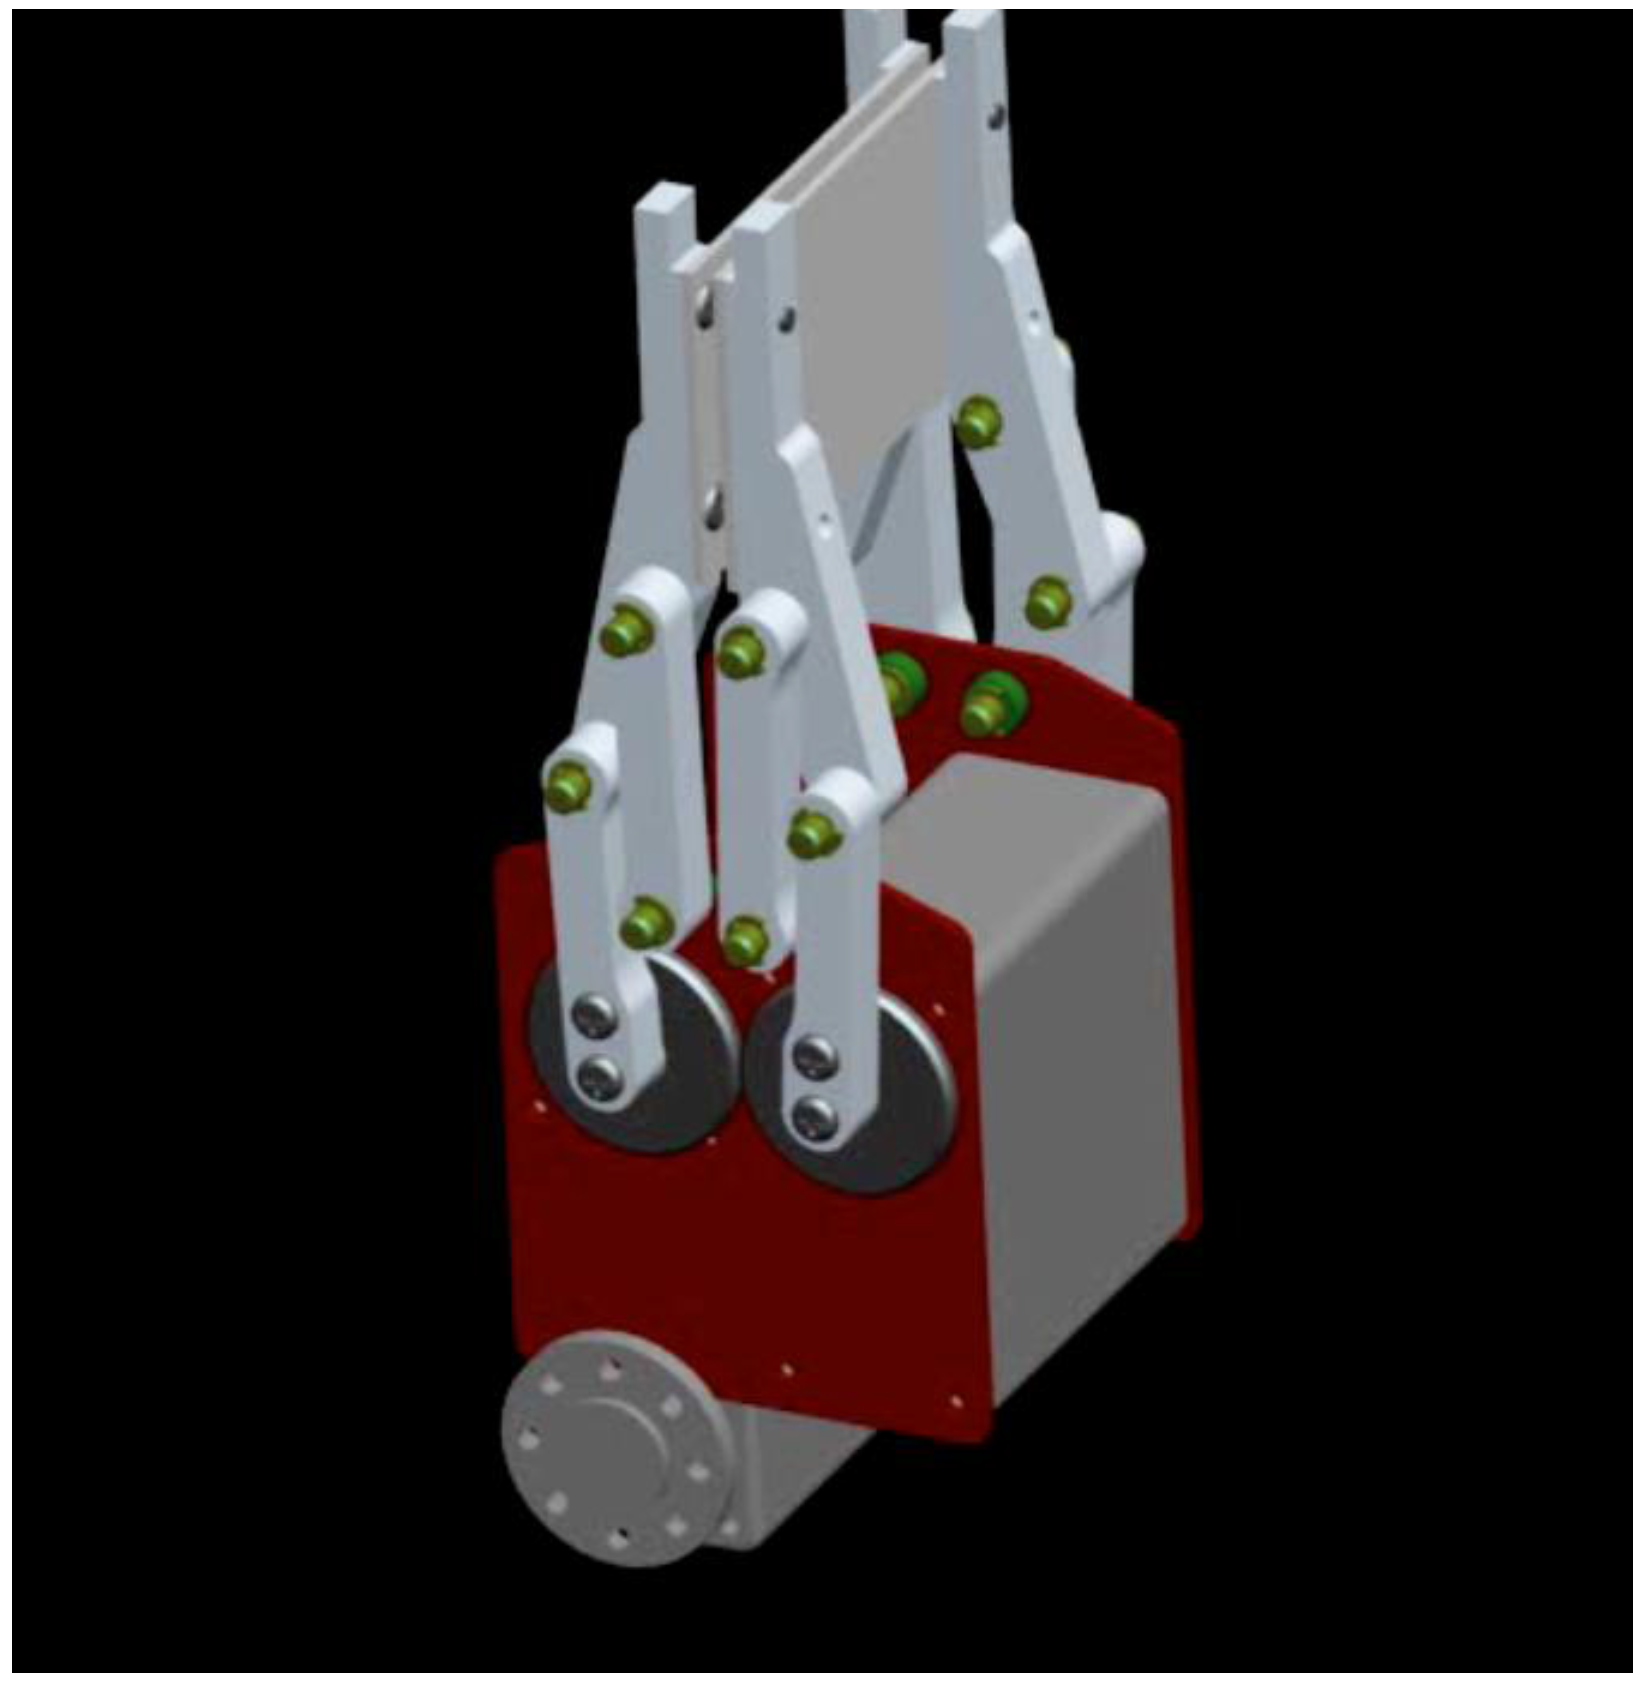
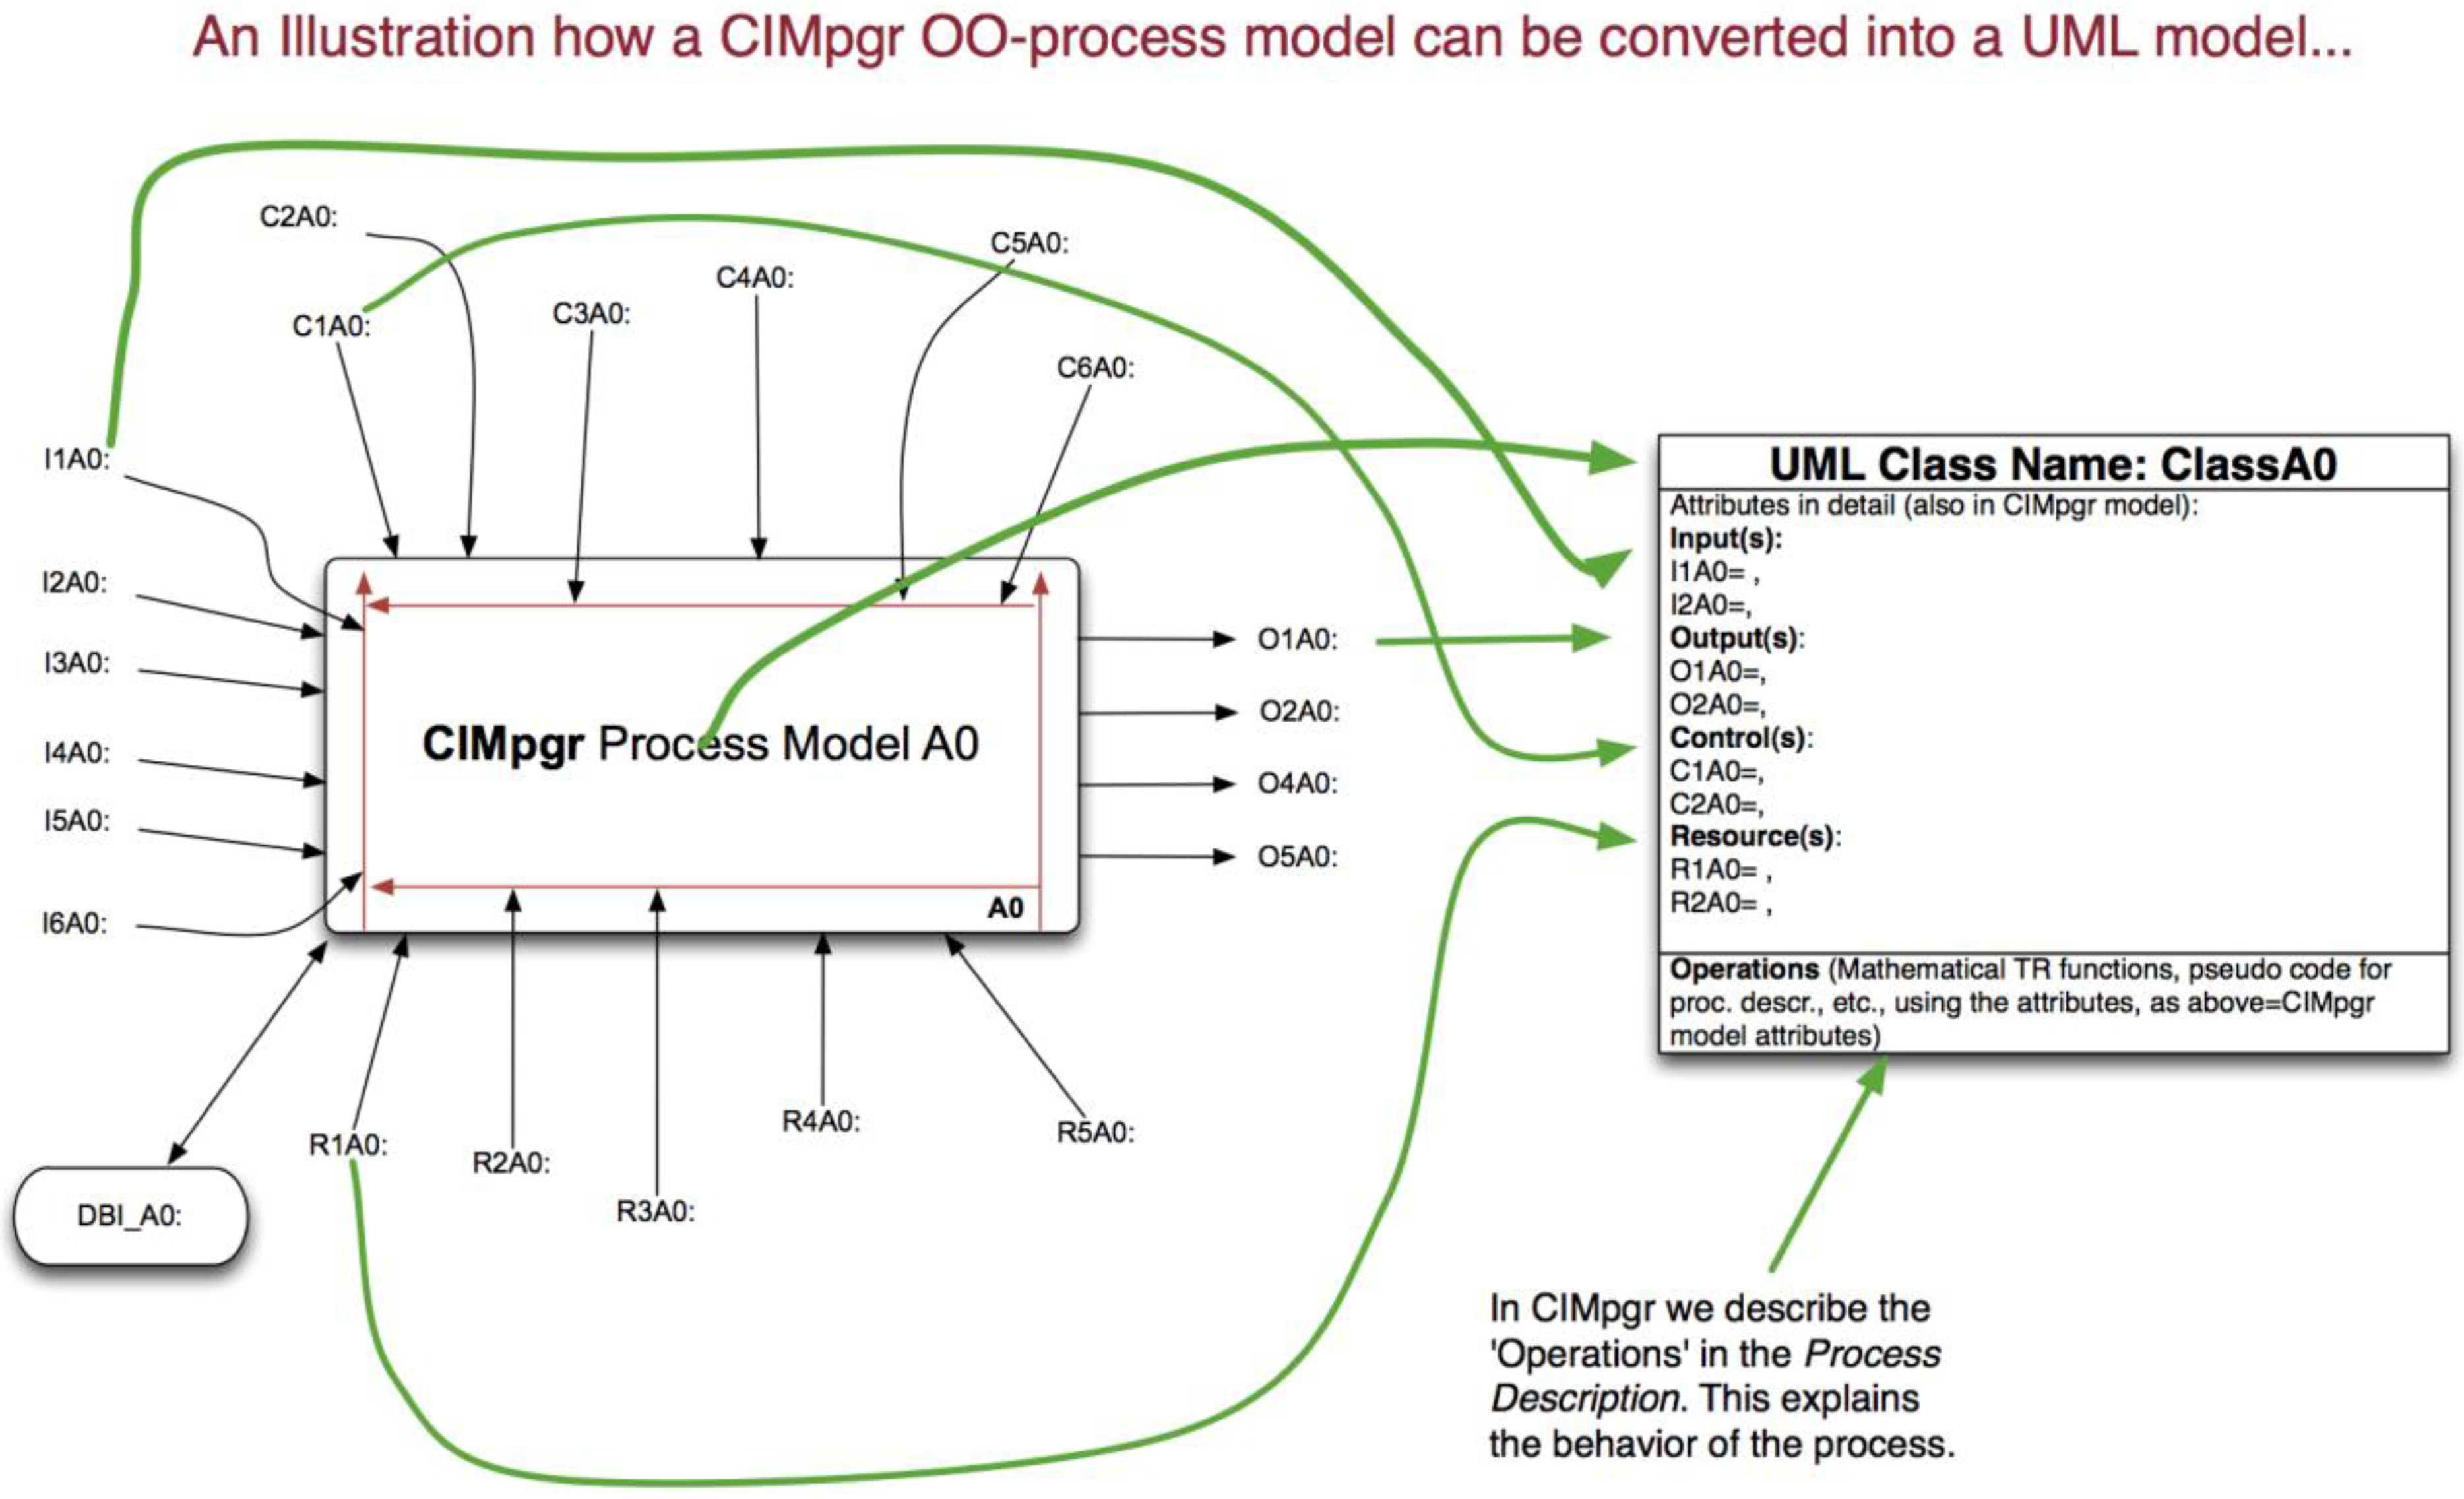
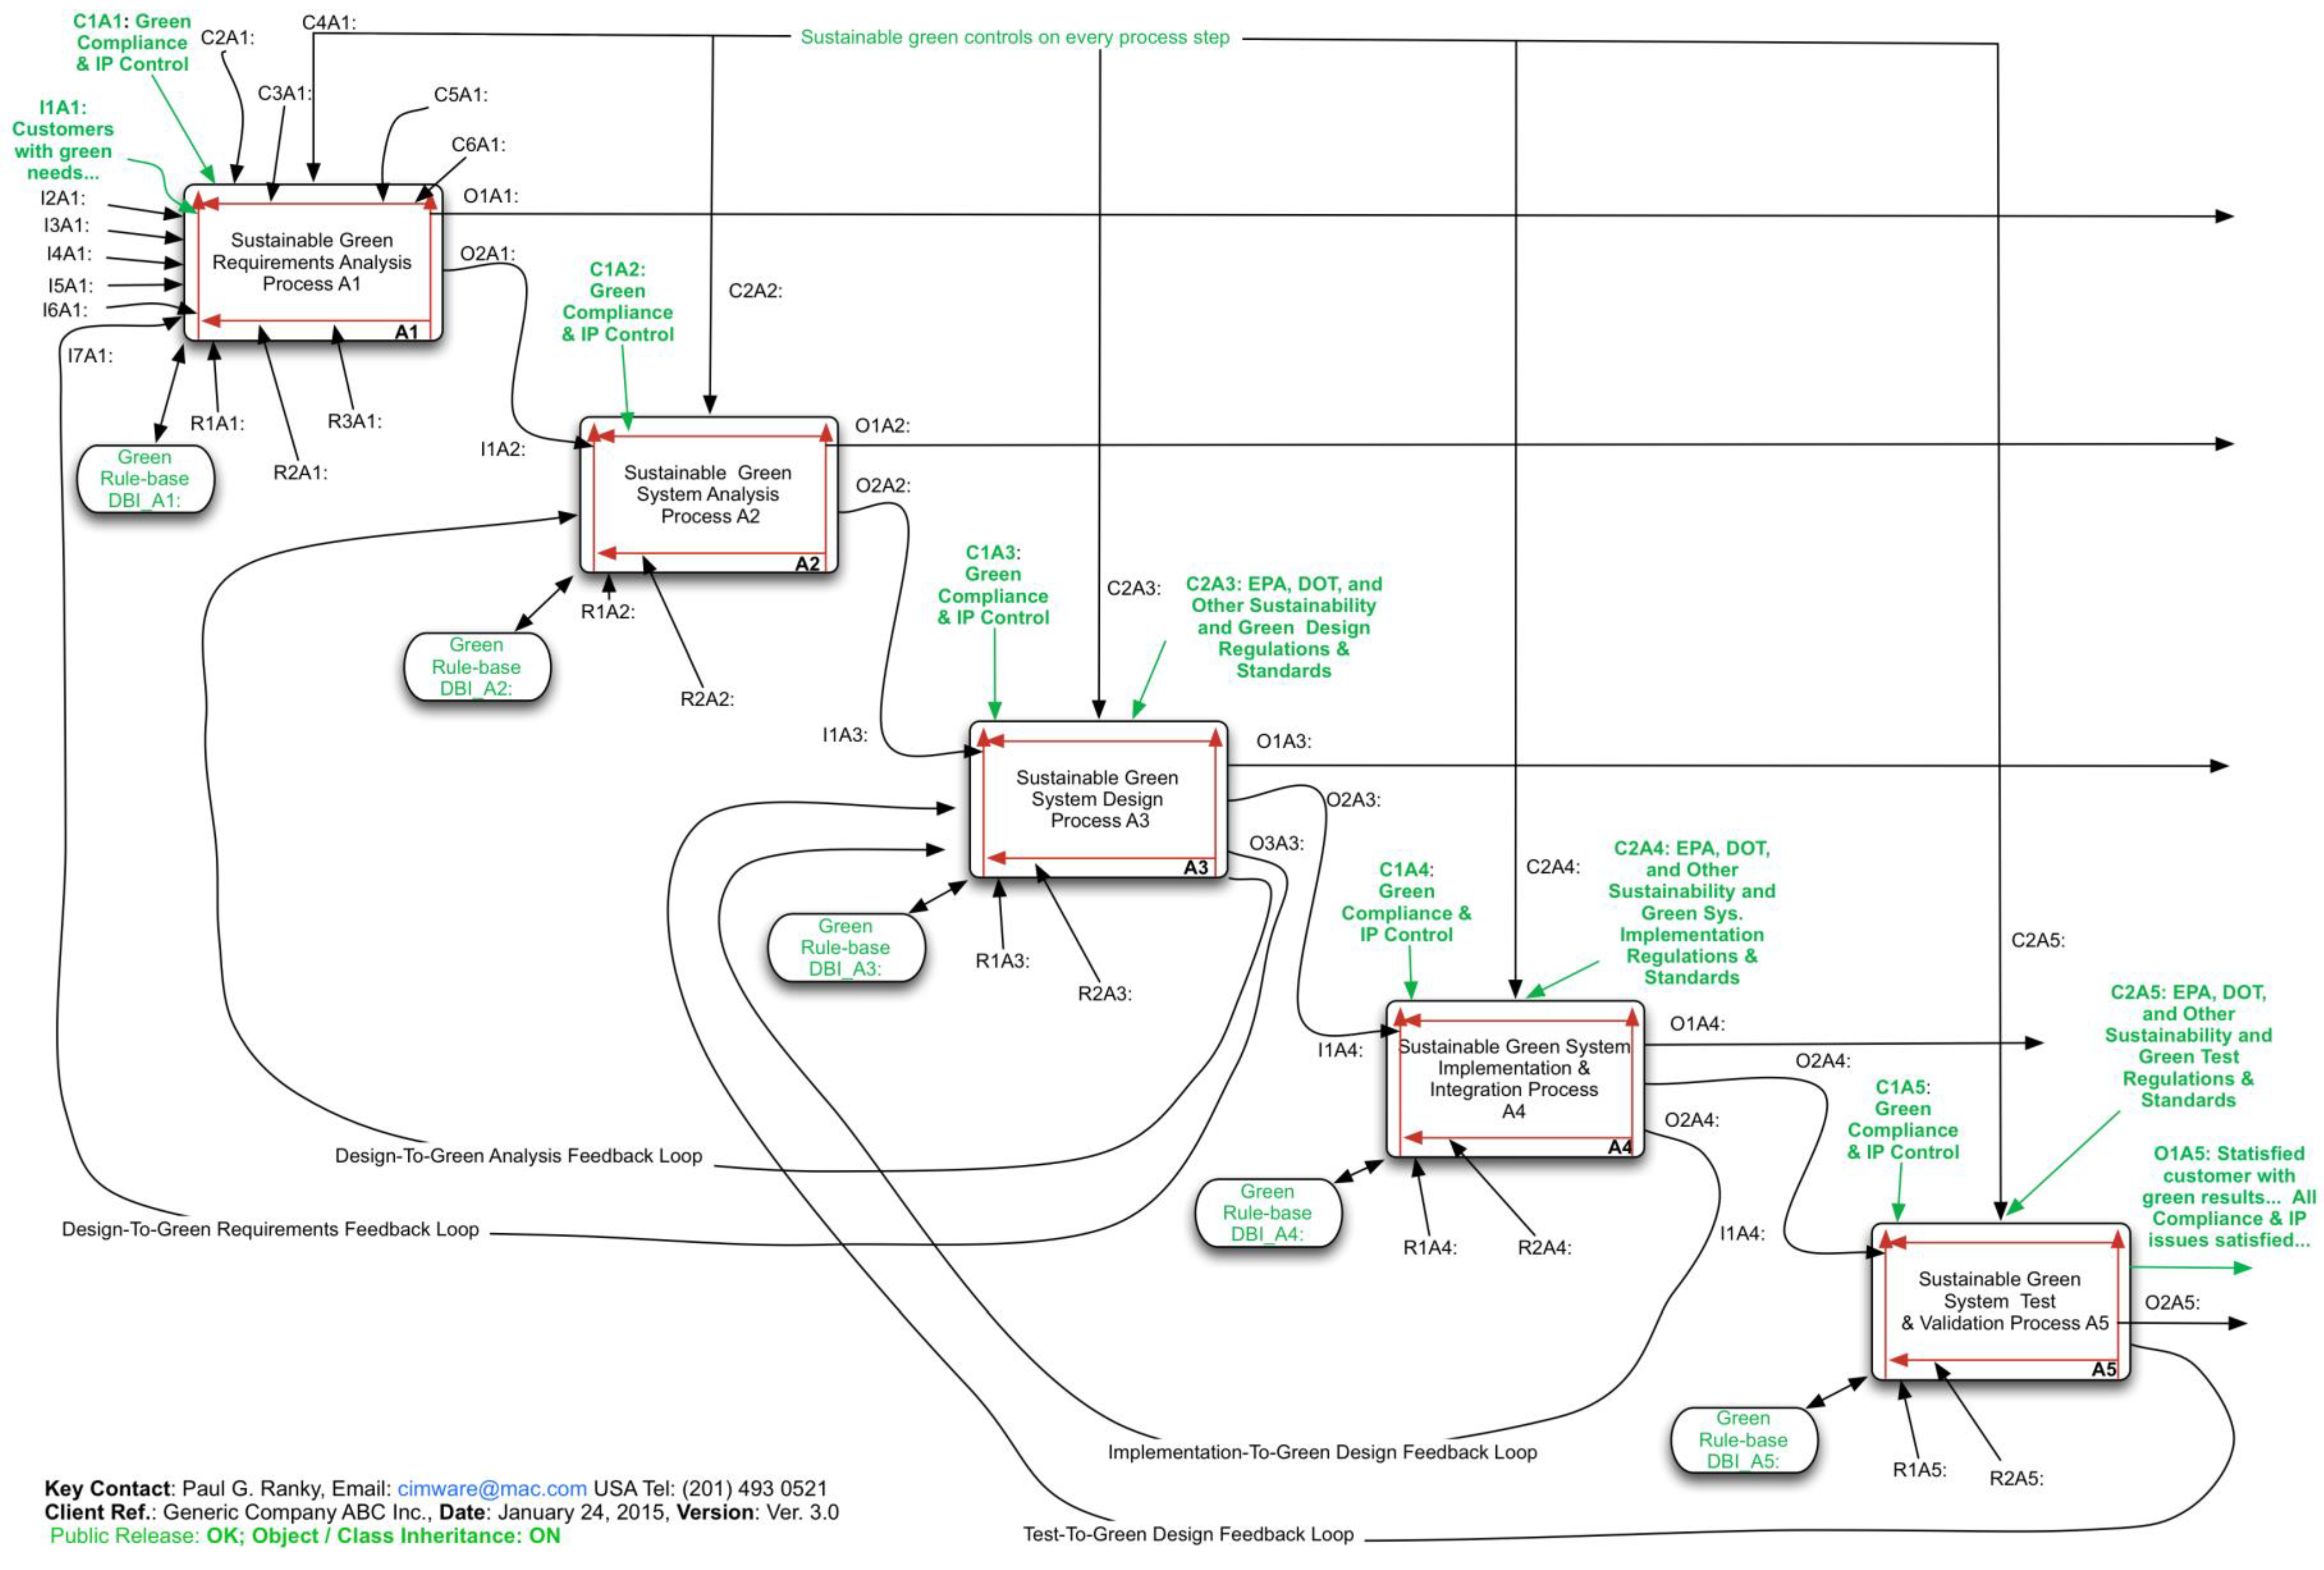
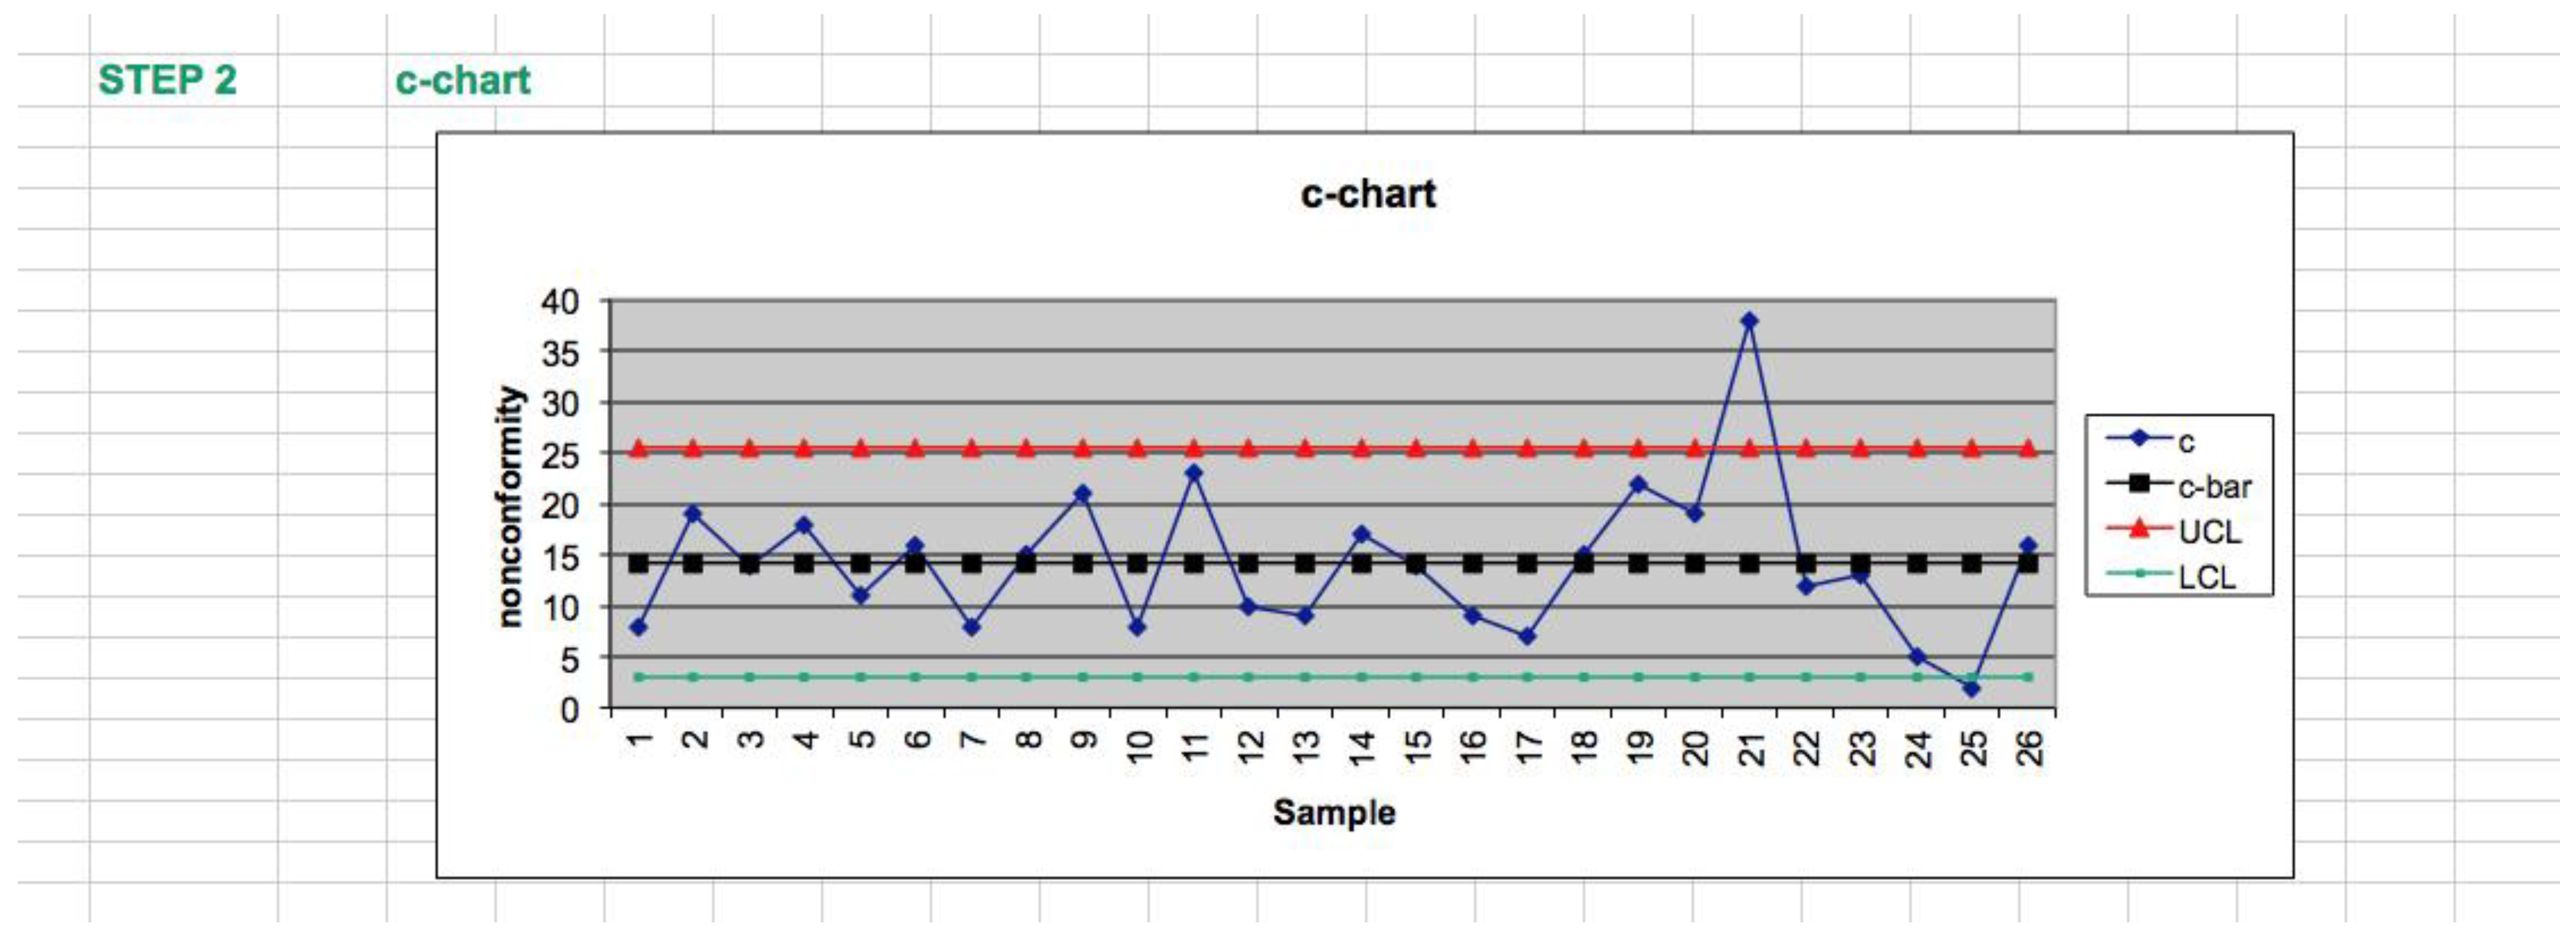
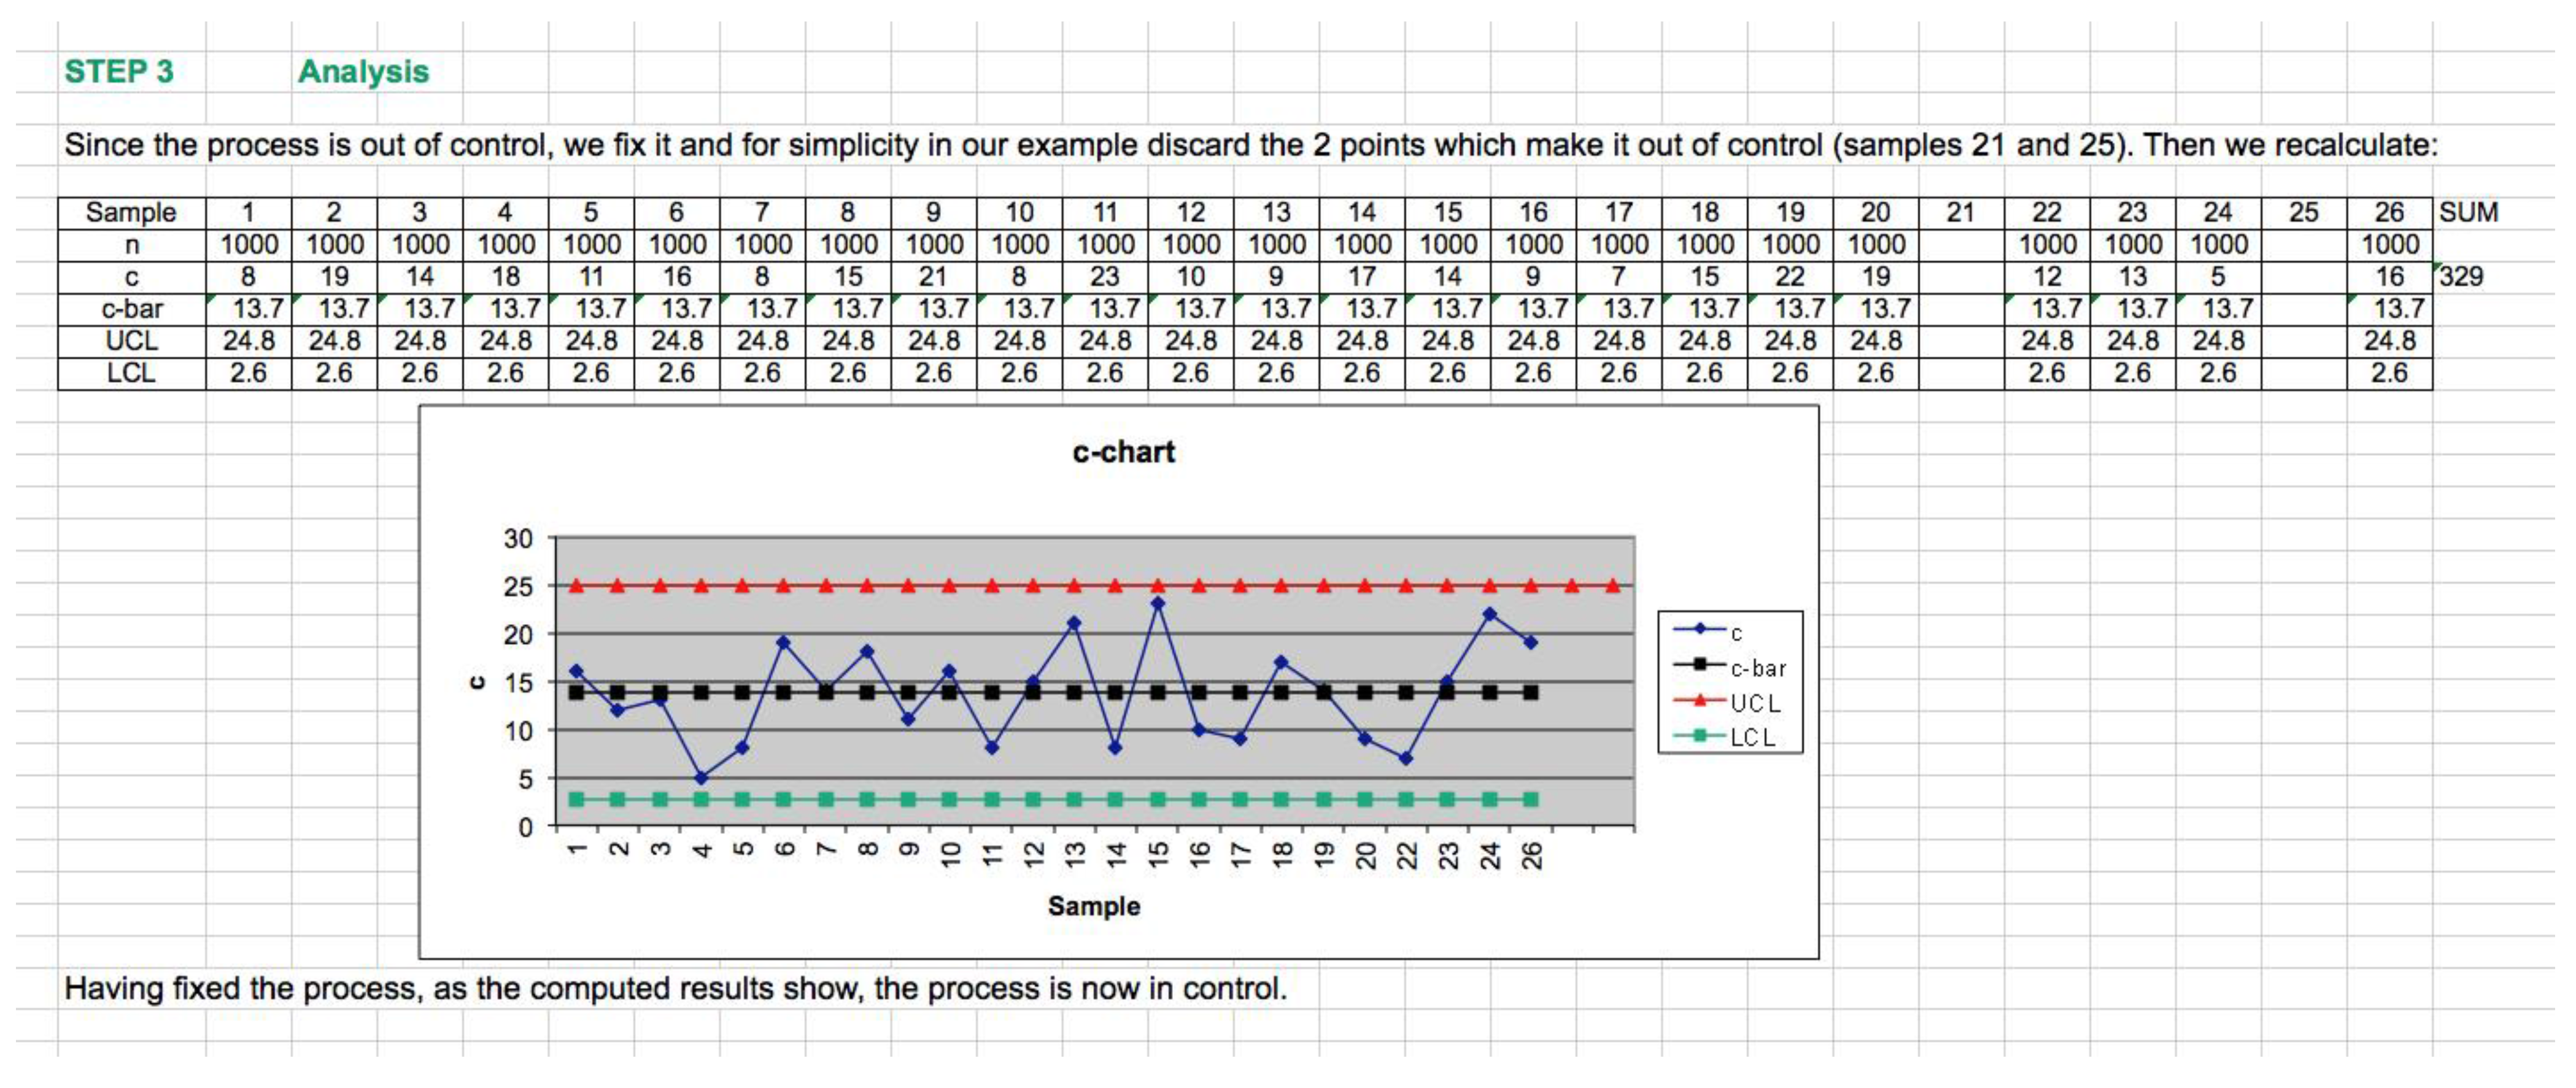
  • Special input techniques: These often require specially designed visual modeling (static) and/or simulation (dynamic) modeling languages/systems. As examples, consider visual system analysis, or design using graphical modeling, or simulation programming in the field of energy management, or assembly process optimization (Figure 11, Figure 12 and Figure 13).
In terms of modeling methods, both for system analysis, as well as for design, industry has widely adopted the DFD (dataflow diagramming) method, as well as the structured analysis and design technique (SADT), following new object- and component-oriented principles. (Please note that our CIMpgr method used in this article is a member of the above family of methods.)
The key approach with all of these system analysis and design methods is that (in terms of analysis in particular) they are trying to decompose a complex system into smaller building blocks, or more precisely, objects.
Please note that the modern object orientation (OO) we follow is based on the concept that every system requirement eventually must belong to an object. In this context, an object is defined as any cohesive whole made up of two essential components: data and process(es).
By following these methods, the complexity becomes simpler, more ordered and clearer, too, layer-by-layer. Other major benefits include systematic documentation and visual communication with team members and management at various levels.
It is important to realize that, at a minimum, system analysis, as well as system design models typically consist of model diagrams (examples are shown in Figure 8, Figure 9 and Figure 10), as well as process descriptions and a data dictionary. (Please note that these methods are discussed with examples in more detail in [3]).
In terms of the other parts of the integrated iSEE:Green framework, Figure 11, Figure 12 and Figure 13 show advanced optimization and simulation models of a robotic gripper, designed for manipulating/assembly/disassembly of parts. Visual system analysis or design using graphical modeling, or simulation programming in the field of energy management, manufacturing/assembly/disassembly process optimization, and others, plays a very important part in sustainable green enterprise design.
Figure 11. Advanced simulation models are often helpful for designing and validating sustainable product and process designs for design reviews in the digital domain (robotic gripper simulation phases are shown).
Systems 03 00027 g011
Figure 12. Advanced simulation models are often helpful for designing and validating sustainable product and process designs (robotic gripper simulation phases are shown).
Systems 03 00027 g012
Figure 13. Advanced simulation models are often helpful for designing and validating sustainable product and process designs (robotic gripper simulation phases are shown).
Systems 03 00027 g013
In terms of other methods and tools, Figure 14 and Figure 15 illustrate an advanced statistical process modeling method with out-of-control and then in-control solutions. In our sustainable green enterprise analysis, design and optimization method and tool database, LSS (lean six-sigma) statistical methods and tools are also critical, since in most practical cases, processes must be planned to cope with dynamic environmental changes.
Figure 14. Out-of-control, non-sustainable process control chart.
Systems 03 00027 g014
Figure 15. In-control, sustainable process control chart.
Systems 03 00027 g015
As illustrated in Figure 16, in terms of sustainable green enterprise modeling, process models can be easily mapped into international standard UML (Unified Modeling Language) models. This helps sustainability engineers, as well as IT/IS engineers to understand each others’ language and, therefore, avoid any mistakes. This mapping opportunity between the two different system modeling worlds is very important, since we must recognize that most sustainable green challenges are based on some kind of process issues. This means that if we can model each important process step, we can capture toxic objects and activities before they can cause harm to humanity and/or the environment. Then, we can move on to focus on larger systems and challenges, too; object-by-object, layer-by-layer, up to global warming [3,11,12,16,17].
Figure 16. Ranky’s CIMpgr process models can be easily mapped into UML (Unified Modeling Language) models (UML is a widely known system analysis/design method and tool).
Systems 03 00027 g016

4. Conclusion

Sustainable green engineering enterprise analysis, modeling and design represent a complex field of integrated science and engineering. In this article, after a broad overview, we have introduced an integrated analytical framework, which can easily be implemented in most real-life situations, and discussed some detailed methodology by focusing on novel object-oriented 3D process modeling.

Conflicts of Interest

The author declares no conflict of interest.

References and Notes

  1. Ranky, P.G. The Design and Operation of FMS: Flexible Manufacturing Systems; IFS (Publications) Ltd. and North-Holland Publ. Co.: London, UK, 1983. [Google Scholar]
  2. Ranky, P.G. Visual Factory Design & Management Principles with DENSO, Fanuc, GE Fanuc, Mori-Seiki, and Other Industrial Examples in the USA and in Japan; A virtual factory tour presentation in DVD videos, parts 1 and 2 (totaling 62 minutes); CIMware USA, Inc.: New York, NY, USA, 2014. [Google Scholar]
  3. Ranky, P.G. Total Quality Management 3D Interactive eBook; CIMware USA Inc.: New York, NY, USA, 2015; p. 740. [Google Scholar]
  4. Ranky, P.G. NJIT course syllabi URLs for green PLM/Concurrent/Simultaneous Engineering. Available online: http://www.cimwareukandusa.com/All_IE655/IE655Spring2014.html (accessed on 2 April 2015).
  5. Ranky, P.G. Total Quality Management. Available online: http://www.cimwareukandusa.com/All_IE673/IE673Spring2014.html (accessed on 2 April 2015).
  6. Ranky, P.G. Interactive Talking Panoramas for capturing VOC (Voice of the Customer) sustainability examples, for education, and for other purposes. Available online: http://www.cimwareukandusa.com/RW-Street-PanoSiteNavig-Upload/RW-Street-PanoSiteNavigation-Map.html (accessed on 3 April 2015).
  7. EPA (Environmental Protection Agency). 2015. Available online: http://www.epa.gov/sustainability/basicinfo.htm (accessed on 3 April 2015).
  8. ICLEIUSA. Available online: http://www.icleiusa.org/about-iclei/faqs/faq-sustainability-and-local-governments (accessed on 2 April 2015).
  9. Blanchard, B.S.; Fabrycky, W.J. Systems Engineering and Analysis, 5th ed.; Prentice-Hall: Englewood Cliffs, NJ, USA, 2011. [Google Scholar]
  10. Elliott, C.; Deasley, P. Creating Systems that Work--Principles of Engineering Systems for the 21st Century; Royal Academy of Engineering: London, UK, 2007. [Google Scholar]
  11. Rebovich, G.; White, B.E. Enterprise Systems Engineering: Advances in the Theory and Practice; CRC Press, Taylor and Francis Group: Boca Raton, FL, USA, 2014. [Google Scholar]
  12. Bernus, P.; Nemes, L.; Schmidt, G. Handbook on Enterprise Architecture; Springer-Verlag: Berlin/Heidelberg, Germany, 2003. [Google Scholar]
  13. Rebovich, G.; White, B.E. Enterprise Systems Engineering: Advances in the Theory and Practice; CRC Press, Taylor & Francis Group: Boca Raton, FL, USA, 2011. [Google Scholar]
  14. Rouse, W.B. Engineering the Enterprise as a System. In Handbook of Systems Engineering and Management, 2nd ed.; Sage, A.P., Rouse, W.B., Eds.; Wiley and Sons, Inc.: New York, NY, USA, 2009. [Google Scholar]
  15. Valerdi, R.; Nightingale, D.J. An Introduction to the Journal of Enterprise Transformation. J. Enterp. Transform. 2011, 1, 1–6. [Google Scholar] [CrossRef]
  16. Ranky, P.G. Sustainable Energy Management and Quality Process Models and Technology Based on ISO50001: 2011, The International Energy Management Standard. In Proceedings of ISST2012, IEEE International Symposium on Sustainable Systems and Technology ISSST, Boston, MA, USA, May 2012.
  17. Ranky, P.G. (Editor) A Multimedia R&D Resource Library of Videos, 3D eBooks, and Active Code Objects for Sustainable Engineering Focused Education, Academic Research and Professional Engineering Management. 2015. Available online: http://www.cimwareukandusa.com (accessed on 3 April 2015).

