Article

Measuring the Construction Efficiency of Zero-Waste City Clusters Based on an Undesirable Super-Efficiency Model and Kernel Density Estimation Method

1
Business School, Shandong University of Technology, Zibo 255049, China
2
International Business School, Hainan University, Haikou 570228, China
3
Department of Construction Management and Real Estate, Faculty of Civil Engineering, Vilnius Gediminas Technical University, Saulėtekio Al. 11, LT-10223 Vilnius, Lithuania
4
Faculty of Civil and Environmental Engineering and Architecture, Bydgoszcz University of Science and Technology, 85-796 Bydgoszcz, Poland
5
Department of Civil & Environmental Engineering, University of Maryland, College Park, MD 20742, USA
*
Author to whom correspondence should be addressed.
Systems 2023, 11(9), 473; https://doi.org/10.3390/systems11090473
Submission received: 23 July 2023 / Revised: 28 August 2023 / Accepted: 8 September 2023 / Published: 14 September 2023

Abstract

:
The global total amount of generated solid waste is currently on a rapid growth trend. China, as the largest developing country, promulgated its Pilot Work Plan for the Construction of Zero-Waste Cities led by the new development concept in 2018 after recognizing the inadequacy and urgency of solid waste management, and the lack of valuable experience and benchmark cities for the construction of zero-waste cities. This study uses the undesirable super-efficiency model and kernel density estimation method to measure the efficiency of zero-waste city construction in 16 prefecture-level cities in Shandong Province and analyze their spatial and temporal differences. Three major problems were found, namely, low regional coordination, the rigid policies of some local governments, and the unbalanced development of scale efficiency and pure technical efficiency. Results show that the zero-waste city construction efficiency as a whole shows a declining and then fluctuating growth trend, and that low-scale efficiency is the main reason behind the decrease in construction efficiency. Suggestions are then provided considering three aspects: improving regional synergy; improving government quality and capacity, and strengthening government supervision and revitalizing the market; and introducing social capital for environmental pollution treatment. These suggestions ultimately help improve the level of zero-waste city construction.

1. Introduction

The world’s total amount of generated solid waste is currently experiencing a rapid growth trend. With the advancement of industrialization and urbanization, the rapid growth of municipal waste poses a serious challenge to environmental protection and health risk prevention. This is especially the case for developing countries who, while facing the huge demand for economic development, also need to take into account the enormous pressure of protecting the environment. The World Bank’s What is Waste: 2.0 report shows that generated municipal solid waste will grow from 2.01 to 3.4 billion tons from 2016 to 2050 [1]. Solid waste generated in low-income countries is expected to increase by 300% by 2050 compared with its 2016 figures, with low- and middle-income countries experiencing the largest increase in generation, whereas high-income countries will experience the smallest generation increase by 2030.
In 2018, the Chinese government acknowledged the insufficiency and pressing nature of solid waste management and therefore released the Pilot Work Plan for the Construction of “Zero-waste cities”. This plan outlines three essential criteria for the establishment of zero-waste (ZW) cities: reduction, recycling, and harmless disposal [2]. Shandong Province has notable strengths in the implementation of China’s ecological conservation and high-quality development policy within the Yellow River Basin. Out of the nine provinces within the Yellow River Basin, Shandong is the only province situated within the eastern and coastal regions. The ecological conservation and high-quality development of the Yellow River Basin are of significant concern to national authorities. They have explicitly emphasized the need for the Shandong Peninsula Urban Agglomeration to have a leadership role in this endeavor [3]. In response to the simultaneous presence of several contextual factors, Shandong Province initiated the strategic development of urban clusters according to the zero-waste (ZW) principle in 2022, and subsequently released relevant official documents pertaining to this endeavor.
Studies on zero-waste (ZW) cities mainly include policy recommendations for urban solid waste management and measuring the efficiency of solid waste management or treatment. Previous studies show that the concept of ZW is an effective method to solve the problem of solid waste and that combining digitization with waste management makes the best decisions and other valuable conclusions. However, the existing literature on ZW cities has also been found to generally focus more on the management of urban solid waste, with less focus on measuring the efficiency of comprehensive ZW city construction. This article further explores this gap using a more systematic and comprehensive indicator system to identify hidden problems in the construction of ZW cities.
This study believes that China’s key strategic choice to establish ZW cities is an attempt to explore ways in which economic development and environmental conservation might be combined. Measuring the efficiency of ZW city construction should not be limited to focusing solely on a single type of waste, specifically solid waste. From an input and output perspective, this article creatively constructs an evaluation system for the efficiency of ZW city construction, including eight dimensions: personnel, funds, facilities, environmental pressure, energy consumption, the effectiveness of various waste, environmental illegal behavior governance, and the level of waste output. Moreover, the undesirable super-efficiency SBM (US-SBM) model was applied to measure the efficiency of ZW city construction in 16 prefecture-level cities in Shandong Province, and construction efficiency was further divided into pure technical and scale efficiency for detailed analysis. Additionally, the kernel density estimation (KDE) and natural breakpoint methods were used to deeply analyze each city’s spatial–temporal evolution of ZW urban construction efficiency, explore the shortcomings and deficiencies in the process of building ZW cities in Shandong Province, and forward targeted suggestions to provide possible reference value for the construction of ZW cities.
This research has three primary contributions. (1) This study developed an evaluation index system for measuring the construction efficiency of zero-waste (ZW) cities in China, taking into account the three requirements and realistic situations. (2) The index system is not limited to the solid waste category, allowing for theoretical reliance and expansion. This research employs the undesirable super-efficiency SBM (US-SBM) model, the kernel density estimation technique, and the natural discontinuity grading method. By doing so, it broadens the potential applications of these three approaches in assessing and evaluating the efficacy of ZW city building. (3) This study focuses on the 16 prefecture-level cities within the ZW urban agglomeration of Shandong Province. These cities are pivotal in implementing the ecological protection and high-quality development strategy of the Yellow River Basin. By selecting these cities as the research object, this paper offers more practical guidance and relevance compared with previous studies that have focused on provinces or a limited number of key cities.
Both the undesirable super-efficiency SBM (US-SBM) model and the kernel density estimation (KDE) method were used to measure the efficiency of ZW urban construction and analyze their temporal and spatial dissimilarities. This study’s remainder is as follows: An overview of the literature on the construction of ZW cities is provided in Section 2; Section 3 introduces the study’s research object and methods; Section 4 elaborates on the constructed evaluation index system for the efficiency of ZW city construction in Shandong Province and explains each indicator; Section 5 measures the construction efficiency of ZW cities in Shandong Province, analyzes its spatiotemporal evolution characteristics, and discovers its hidden problems and shortcomings; Section 6 provides targeted recommendations based on the problems and shortcomings identified in the previous chapter; Section 7 presents the study’s summary and outlines its contributions and shortcomings, ultimately emphasizing expectations that provide possible reference for the construction of ZW cities.

2. The Literature Review

2.1. Research on “ZW” and “ZW City”

The definition of a “ZW city” cannot be separated from the elaboration of “ZW”. The most widely recognized definition of “ZW” is the one followed by the International Alliance for ZW, who believe that the concept refers to the conservation of all resources by means of responsible production, consumption, reuse, and recovery of products, packaging, and materials without burning and without land, water, or air discharges that endanger the environment or human health [4]. It is necessary to designate cities that generate frequent production activities and have a large population as the first areas to implement “ZW” management [5]. Therefore, a large number of countries, regions, and cities have begun proposing their own connotations and key tasks for ZW city construction.
ZW is an effective way to solve the problem of solid waste, but the construction of a ZW city requires a detailed understanding of the production processes of various products and the forms of waste generated from these processes. Otherwise, achieving ZW in the city will remain a utopian pursuit [6]. Therefore, many countries, regions, and cities (or even scholars) will combine the actual situation while largely conforming to the ZW International Alliance’s definition of “ZW” when elaborating on the kind of ZW city to build. For example, in the Japanese capital of Tokyo, a ZW city is expressed as a vision of integrating industry, society, and nature to promote changes in business practices, lifestyles, and consumption patterns [7]. Zaman and Lehmann believed that the concept of a ZW city originated from the concept of an ecological city, which requires a 100% waste recycling rate. The core of a ZW city involves economics, politics, technology, and society—all of which are related to environmental sustainability [8]. China defines a ZW city as an urban development model that minimizes the environmental impact of solid waste by focusing on source reduction and resource utilization of solid waste [2].
The history of ZW city development is an arduous one that stretches far back. Since the term “ZW” was first proposed in 1973, some developed countries have taken the lead in implementing waste management. For example, the US state of California established the Integrated Waste Management Act in 1989 to set waste landfill reduction targets. In 1996, the Australian capital of Canberra passed the No Waste by 2010 Act, becoming the first city in the world to officially establish a “ZW” goal [9]. Currently, waste management in developed and developing countries presents different characteristics: the main difference is that developed countries generate higher amounts of waste, whereas developing countries have larger increases in waste. Faced with the constraints of economic goals, developing countries find ways to maintain a balance between ecology and economy. In response, building ZW cities has become an important proposition to achieve this balance. Thus, in 2018, the Chinese government introduced the Pilot Work Plan for the Establishment of Zero-Waste (ZW) Cities, marking the start of a proactive investigation into the construction of ZW cities. This plan outlined three fundamental prerequisites for the development of ZW cities, namely: reduction, recycling, and the safe and environmentally friendly disposal of waste. China’s initiatives have played a role in addressing the need for constructing zero-waste (ZW) cities in developing nations, while also sharing China’s expertise in this area. Consequently, the approach of establishing ZW cities has gained momentum throughout several provinces and cities in China [10]. The global community has now acknowledged the significance of solid waste management in the context of promoting sustainable development. In the document titled “Transforming our world: 2030 agenda for sustainable development” published in 2015, a global objective was established concerning solid waste management, with a focus on sustainable development [11]. UN Habitat has supported cities in improving waste management practices via initiatives such as the “waste smart city” and “African clean city platform” to contribute towards the attainment of the sustainable development target pertaining to solid waste. To date, almost four hundred cities and sixty partners have become members of these networks [12,13].

2.2. Research on the Evaluation of the Construction Level of ZW Cities

The evaluation of the construction level of ZW cities measures the effectiveness of construction and provides guidance for the future construction of ZW cities. In the current research on the construction level of ZW cities, some scholars have constructed different evaluation systems for the construction level of ZW cities from different perspectives. These scholars also applied different methods to measure the construction level of ZW cities.
Rao et al. used a binary entropy weight method as an indicator for weighting to comprehensively evaluate ZW cities. Combining the conventional grey correlation analysis method and TOPSIS, the study proposed a decision-making method for evaluating “ZW cities” based on the 39 cities in China’s Yangtze River Basin. Specific aspects included economic level, environmental pollution, and resource consumption. A “ZW city” evaluation index system was also constructed from four aspects of waste utilization [14].
Zhao et al. evaluated the level of ZW city construction in coal resource-based areas. Using 11 prefecture-level cities in Shanxi Province, the entropy weight method was applied to calculate indicator weights, and each indicator variable was linearly weighted to achieve quantification of the level of ZW city construction. A comprehensive indicator system was constructed which included solid waste reduction, solid waste utilization, final disposal of solid waste, and development support capabilities by combining the solid waste management goals and policy backgrounds [15].
Ren et al. constructed an evaluation index system that included investment in industrial solid waste disposal, industrial solid waste output, disposal amount, reuse amount, and untreated amount. The dynamic DEA model was used to measure the treatment efficiency of industrial solid waste in 30 Chinese provinces, and a regional study explored the gap between the treatment efficiency of industrial solid waste in Yangtze River Basin-based and non-Yangtze River Basin-based provinces [16].

2.3. Research on the Construction Strategy of ZW Cities

The process of building ZW cities is usually led by the government, which can put significant financial pressure on said institution. Thus, the government should strengthen public–private cooperation, attract multiple investments, and reduce the cost of government management of solid waste during the entire process. Moreover, the construction of ZW cities should also simultaneously receive more investment [17].
Digitalization is also considered a key element in solving the increasingly serious solid waste problem within the framework of a circular economy, which can improve time efficiency and cost effectiveness. However, existing studies still lack an understanding of the development trend and the key role of digitization in waste management. Therefore, the government should act as a promoter and apply digital technology to empower waste management, thus improving the construction level of ZW cities [18].
Social involvement is a crucial step for evaluating the level of ZW city construction. The government should: (1) utilize social media to enhance communication on environmental policies, enabling the public to pay more attention to policies and participate more in environmental governance; (2) disseminate policy content that focuses on people’s livelihood interests; and (3) utilize a user-friendly public discourse system to strengthen the interaction between the public and policy content, foster the involvement of many social entities in the dissemination of policies, and boost cross-cultural communication of “zero waste” ideas [19].
A summary of existing studies found that there has been some exploration and contribution to the evaluation and policy research of the construction level of ZW cities. Although these studies have played a guiding role in the exploration of ZW city construction, no specific instructions have been given for the efficiency level, main problems, and future main construction directions of ZW city construction in Shandong Province. The following is a summary of the gaps found in the existing literature, as well as the work carried out in this article.
First, in the research on the effectiveness of ZW city construction, more attention has been paid to the effectiveness of ZW city construction in either the provincial level or on a small number of key cities. Further exploration is thus needed for the study of urban clusters in certain regions.
Second, in the existing indicator settings for the effectiveness of ZW city construction, most of the attention has been paid to indicators related to solid waste and government support capacity. However, the fundamental goal of ZW city construction is to improve energy utilization efficiency by strengthening waste management and promoting waste utilization, prevent resource waste while reducing resource exploitation, and protect the environment. Therefore, when measuring the effectiveness of ZW city construction, other indicators related to waste should also be considered to comprehensively measure the effectiveness of ZW city construction.
Third, existing methods for measuring the effectiveness of ZW city construction often use the entropy weight method to assign weights to indicators. This method cannot measure the effectiveness of ZW city construction from the perspective of input and output, and different measurement units or dimensions of indicators can also affect the accuracy of entropy weight method’s calculation results.
In order to address the aforementioned limitations, the present research has undertaken the following investigations:
(1)
The present study focuses on the 16 prefecture level cities within the ZW city cluster in Shandong Province. Its objective is to investigate the patterns of effectiveness in ZW city construction within Shandong Province. This is achieved by assessing the efficiency of ZW city construction in each individual city. The aim is to identify appropriate strategies for the development of the ZW city cluster.
(2)
This work presents a more complete index system for the purpose of index setting, drawing upon and combining the index setting approaches found in earlier relevant research. The system considers essential financial and human resources, the efficacy of environmental law enforcement, energy use, and other relevant metrics. It extends beyond solid waste and includes indicators for wastewater and waste gas production and disposal.
(3)
This research utilizes the US-SBM model to assess the building efficiency of ZW cities, taking into account the input and output viewpoint. This approach aligns better with the actual transformation connection between input and output in ZW cities.

3. Research Objects and Methods

3.1. Research Object

Currently, China’s economy has transitioned from a period of rapid expansion to a phase of high-quality development. Moreover, there is a noticeable trend towards concentrating economic activity inside metropolitan clusters as the primary spatial carriers. In forthcoming years, the economic and environmental consequences linked to the establishment of urban clusters will become more intricate [20]. The creation of substantial trash will emerge as the pivotal determinant impeding the construction of zero-waste (ZW) cities.
The province of Shandong has notable strengths in terms of ecological preservation and the implementation of a high-quality development plan within the Yellow River Basin. Out of all the nine provinces within the Yellow River Basin, Shandong is the only province situated inside the eastern coastline region. The ecological preservation and high-quality development of the Yellow River Basin have significant significance in the eyes of national authorities. They explicitly emphasize the role of the Shandong Peninsula urban agglomeration in leading the efforts towards ecological protection and high-quality development in the Yellow River Basin [3]. In the present environment, Shandong Province initiated the planning process for the ZW urban agglomeration in 2022 and subsequently released the relevant official papers. This study focuses on the 16 prefecture-level cities within the Shandong ZW urban agglomeration as the subject of investigation. It examines the efficiency of construction and the temporal and spatial variations within the ZW urban agglomeration. Based on the findings, policy recommendations are proposed to offer guidance for the development of ZW cities. The aim is to contribute valuable insights to the construction efforts of ZW cities.

3.2. Research Methods and Feasibility Analysis

3.2.1. Kernel Density Estimation (KDE) Method

KDE is a non-parametric statistical method for probability density estimation proposed by Rosenblatt and Parzen [21]. It is similar to histogram—it improves the discontinuity issue in the histogram and uses higher analysis accuracy. It can help users infer the shape of its probability distribution from a group of sample data. KDE also provides a very effective data visualization method for some data sets that cannot be described through explicit distribution.
Overall, KDE has the advantages of non-parametric estimation, continuity, and smoothness and can be used to process unrestricted data without needing to make assumptions about the data distribution beforehand. It is widely used in the daily interval dispatch strategy of power systems [22], regional differences and dynamic evolution of the development quality of China’s power industry [23], and recommendation systems that provide personalized content based on users’ historical interactions [24].
When analyzing the efficiency of ZW city construction in Shandong Province, this method is not limited by data and does not need to assume the probability distribution law of the data beforehand. Instead, it uses the characteristics of data itself to study probability distribution, lending it strong adaptability and flexibility. The smooth peak function is used to fit the KDE of all sample observations. At the same time, a continuous density curve is drawn which reveals the dynamic change law of the time sequence of the ZW urban construction efficiency of cities in Shandong.

3.2.2. Undesirable Super-Efficiency SBM (US-SBM) Model

Data envelopment analysis (DEA) is a performance evaluation technique created by Charnes, Cooper, and Rhodes in 1978 and is a non-parametric mathematical model used to evaluate relative efficiency [25]. It conducts research on decision-making units (DMUs) that either provide the same service or produce the same product. In the DEA model, the output and input of each DMU constitute two types of variables. Using linear programming technology, DEA aims to find a set of coefficients that can link the output and input of each DMU and evaluates the efficiency level of each DMU relative to other DMUs. Meanwhile, DEA also provides each DMU with its optimal efficiency level and efficiency improvement plan relative to other DMUs. It is a cutting-edge management science method widely used to evaluate the efficiency of discussions such as enterprise resource efficiency allocation [26] and efficiency evaluation of Asia’s cultural tourism [27].
The DEA method was first proposed and named the first DEA model, the CCR model, in 1978 [25]. The BCC model was proposed. It excluded the influence of scale efficiency in the efficiency obtained by the earlier CCR model [28]. The super-efficiency model can further compare the efficiency between different and effective decision-making units [29]. Tone also proposed the SBM model (2001) and a super-efficiency model (2002) that considers unexpected outputs [30,31]. DEA and its variants can further subdivide technical efficiency (specifically referring to the efficiency of ZW city construction in this paper) into scale efficiency and pure technical efficiency [32]. Scale efficiency reflects the efficiency only affected by the input level of each factor, and pure technical efficiency reflects the efficiency only affected by factors such as management and technical level [33]. The construction efficiency is numerically equal to the scale efficiency multiplied by the pure technical efficiency [34].
The US-SBM model has gained significant popularity in the assessment of sustainability efficiency among listed businesses [35]. It has also been used for evaluating the efficiency of green development in the manufacturing industry [36], as well as measuring ecological efficiency in coal mining regions [37].

3.2.3. Geographic Information Science Method

Geographic information science (GIS) can perform various geospatial data analysis, such as spatial distribution, spatial relationships, spatial clustering, etc., and these analyses can help people better understand and apply geospatial data [38]. When analyzing data, it is necessary to pay attention to factors such as accuracy, resolution, reliability, and update frequency of the data [39]. The natural discontinuity grading method used in this article is an application of GIS methods.
The natural discontinuity grading method is a map grading algorithm proposed by Jenks, who believed that data itself has discontinuities, and can be graded based on this natural property of the data [40]. The fundamental idea behind the natural breakpoint approach is to find categorization intervals based on the naturally occurring grouping of the data, group similar values properly, and maximize the differences between categories while minimizing differences within each category [41]. This method utilizes natural attributes between data, thus effectively avoiding the subjectivity of manually dividing data types [42]. Currently, this method has been widely used in research such as debris flow sensitivity assessment [43], ecological resilience assessment [41], and flood risk assessment [44].

4. Evaluation System and Data Sources

In response to the need for ecological environment preservation, governmental entities are in immediate need of suitable planning techniques in order to attain sustainable growth of urban agglomerations [45]. This article adopts the viewpoint of Fangrong Ren et al. [12] and focuses on the macro perspective of input and output. It incorporates the indicator system from the previous relevant literature and aligns with the three main requirements for establishing a zero-waste (ZW) city in China, which were also applied by Zhao et al. [15]. These requirements include reduction, resource utilization, and harmless treatment. Taking into account practical considerations, the article establishes a set of eight primary indicators and nineteen secondary indicators. These indicators encompass five input indicators and three output indicators. Figure 1 shows the relationship between input and output of ZW city construction.
Figure 1 reflects the flow chart of ZW city construction based on the indicator system constructed in this article. In terms of investment, pollution control investment and labor investment need to be used to cope with the environmental pressure of living sources, maintain the operation of domestic waste disposal facilities, and respond to the pollutant disposal needs brought by industrial energy consumption. In terms of output, after the organic integration of pollution control investment, labor input, and other input variables, the output of the ZW city includes three aspects: pollution control effectiveness—including the disposal effectiveness of domestic waste, sewage, exhaust gas, and solid waste, and the effectiveness of environmental violations of the rule of law—which refers to the number of environmental violations and punishment cases, and the level of pollutant output—which includes industrial wastewater, industrial exhaust gas, and the output level of solid waste. The output level of pollutants is non-expected output, and the remaining two variables are expected output.

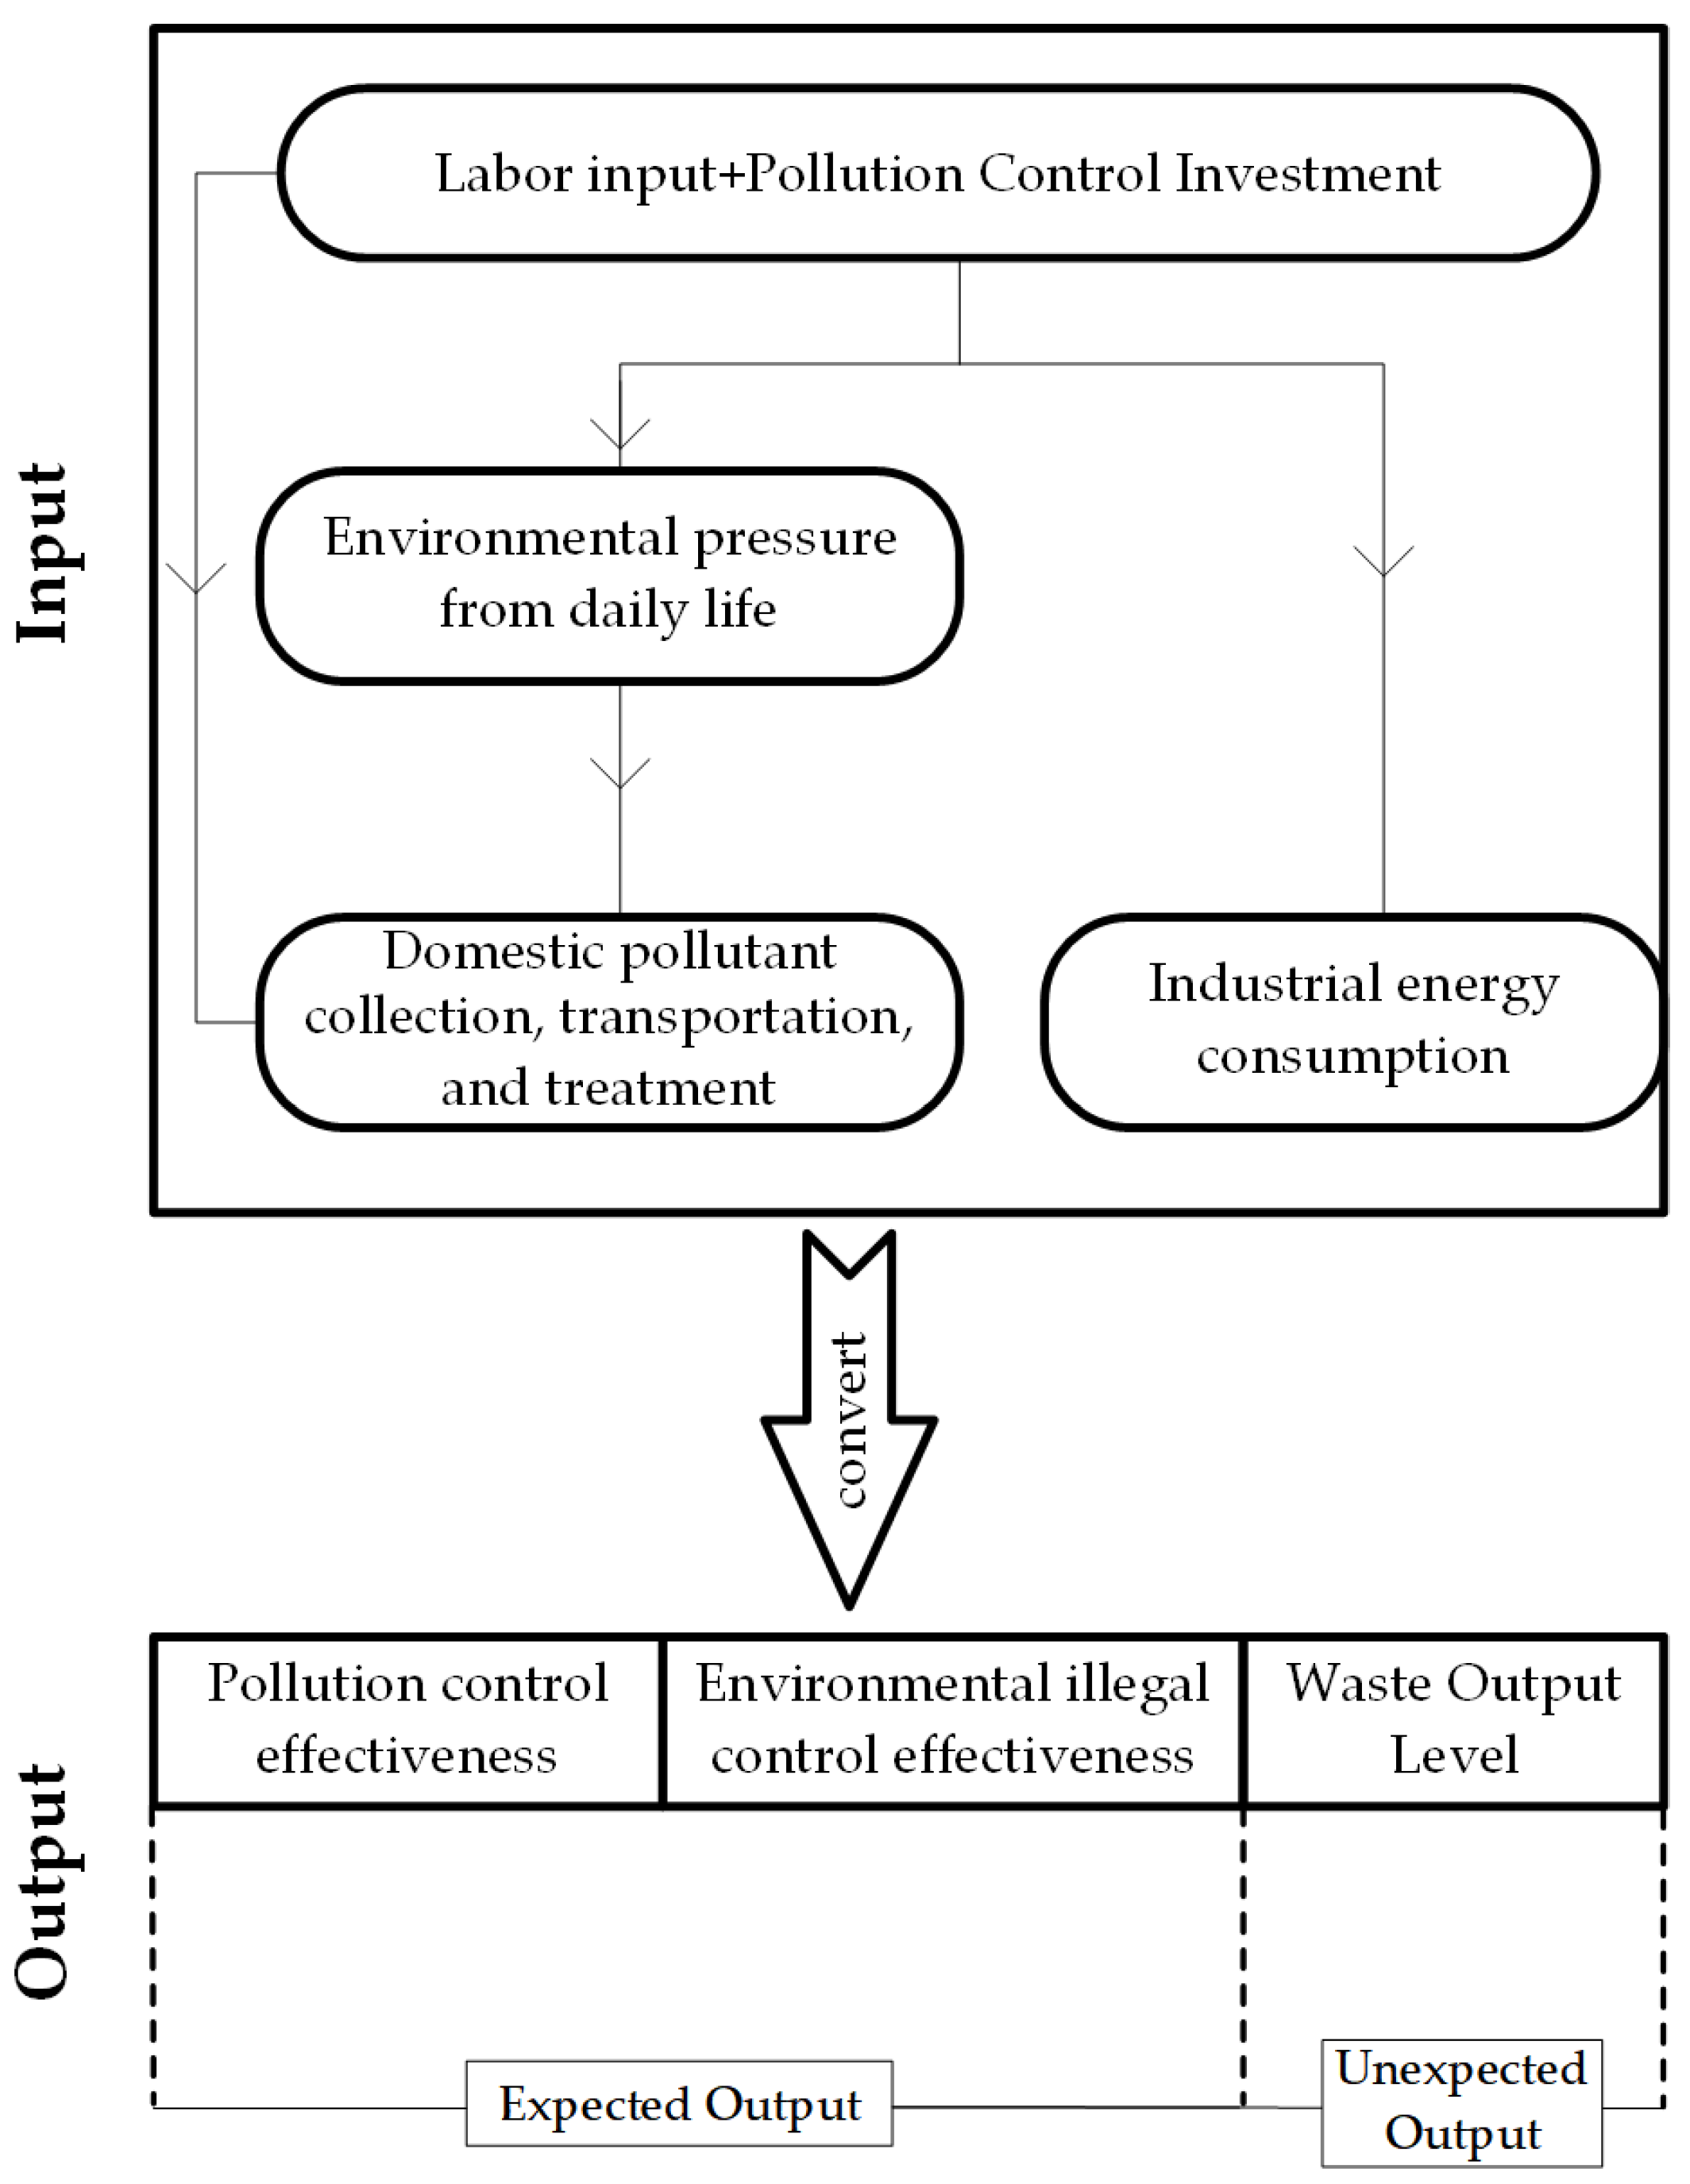
4.1. Input Indicators

This article considered the real situation of various inputs in the construction of ZW cities and represents the main inputs in the construction of ZW cities with labor, funds, facilities, environmental pressure of living sources, and energy consumption. The specific indicators are as follows:
(1)
Labor input (A1): The construction of ZW cities is hinged on human support. For labor input indicators in building ZW cities, this article considered the principles of representativeness and data availability, and uses the number of employees in the water conservancy, environment, and public facility management industries (A11) as an indicator [46,47].
(2)
Pollution control investment (A2): ZW city construction focuses on various forms of waste treatment, and the investment of funds guarantees the smooth progress of ZW city construction. This article used wastewater, waste gas, and solid waste treatment investment (A21) to characterize the pollution control investment in the process of ZW city construction. This indicator was estimated by multiplying the proportion of urban GDP to Shandong Province’s GDP by the funds for treating solid waste, wastewater, and waste gas in Shandong Province’s industrial pollution control investments [16,48].
(3)
Domestic pollutant collection, transportation, and treatment (A3): Building a ZW city requires infrastructure support for the treatment of domestic waste and sewage. Therefore, the number of harmless treatment plants for domestic waste (A31), number of sewage treatment plants (A32), and the number of dedicated vehicles for urban sanitation (A33) were used to characterize the collection, transportation, and treatment capacity of urban domestic waste pollutants [49,50].
(4)
Environmental pressure from daily life (A4) and industrial energy consumption (A5): Although the construction of ZW cities focuses on the treatment and comprehensive utilization of solid waste pollution, this article also introduced relevant indicators such as sewage, wastewater, and waste gas into the indicator system. Therefore, the environmental pressure of daily life (A4) was specifically determined by the amount of sewage discharge (A41). Two secondary indicators, namely, the amount of household waste cleared and transported (A42), were used to characterize the environmental pressure faced by cities from daily life [51,52]. Industrial energy consumption (A5) is represented by industrial energy production consumption (A51) and industrial water consumption (A52), representing the industrial energy consumption of a city [53,54].

4.2. Output Indicators

(1)
Expected output: Expected output includes two primary indicators: pollution control effectiveness (B1) and environmental illegal control effectiveness (B2). Considering the requirements for resource utilization and harmless disposal in building a ZW city, pollution control effectiveness (B1) consists of sewage treatment capacity (B11), harmless treatment capacity of household waste (B13), cleaning area of sanitation facilities (B12), comprehensive utilization amount of general solid waste (B14), and disposal amount of hazardous waste (B15). Sewage treatment capacity (B11), harmless treatment capacity of household waste (B13), and cleaning area of sanitation facilities (B12) reflect the capacity of urban household waste and sewage treatment and collection in ZW city construction, and the comprehensive utilization amount of general solid waste (B14) and the disposal amount of hazardous waste (B15) represent the city’s ability to recycle and dispose waste. These five secondary indicators reflect the pollution control effectiveness of the city under the combined action of the abovementioned input indicators [55,56,57]. This study observes the real situation of ZW city construction and believes that the effectiveness of environmental penalties is also an expected output in the process of ZW city construction. Drawing on the approach of [15], the number of environmental penalty cases (B21) is used to reflect the government’s efforts and work effectiveness in curbing environmental pollution violations while proposing the construction of ZW cities [11].
(2)
Unexpected output: For waste output level (C1), the vast production of pollution and waste is frequently the price that needs to be paid for economic development, but one of the most significant goals of constructing a ZW city is to strike a balance between preserving the environment and fostering economic growth. Thus, this article used the generation intensity of general solid waste (C13) and hazardous waste (C14), industrial sulfur dioxide (C11), and industrial wastewater discharge (C12) to measure the source generation level of urban industrial pollutants [58,59,60].
Table 1 summarizes the indicator system of this paper.

4.3. Data Sources

The aforementioned indicator data have been sourced from authoritative publications such as the “China Urban Statistical Yearbook”, “China Urban Rural Construction Statistical Yearbook”, “China Environmental Statistical Yearbook”, Shandong Provincial Statistical Yearbook, Peking University Magic Treasure Database, statistical yearbooks of various cities, and information bulletins on solid waste pollution prevention and control issued by various city governments.

5. Empirical Analysis

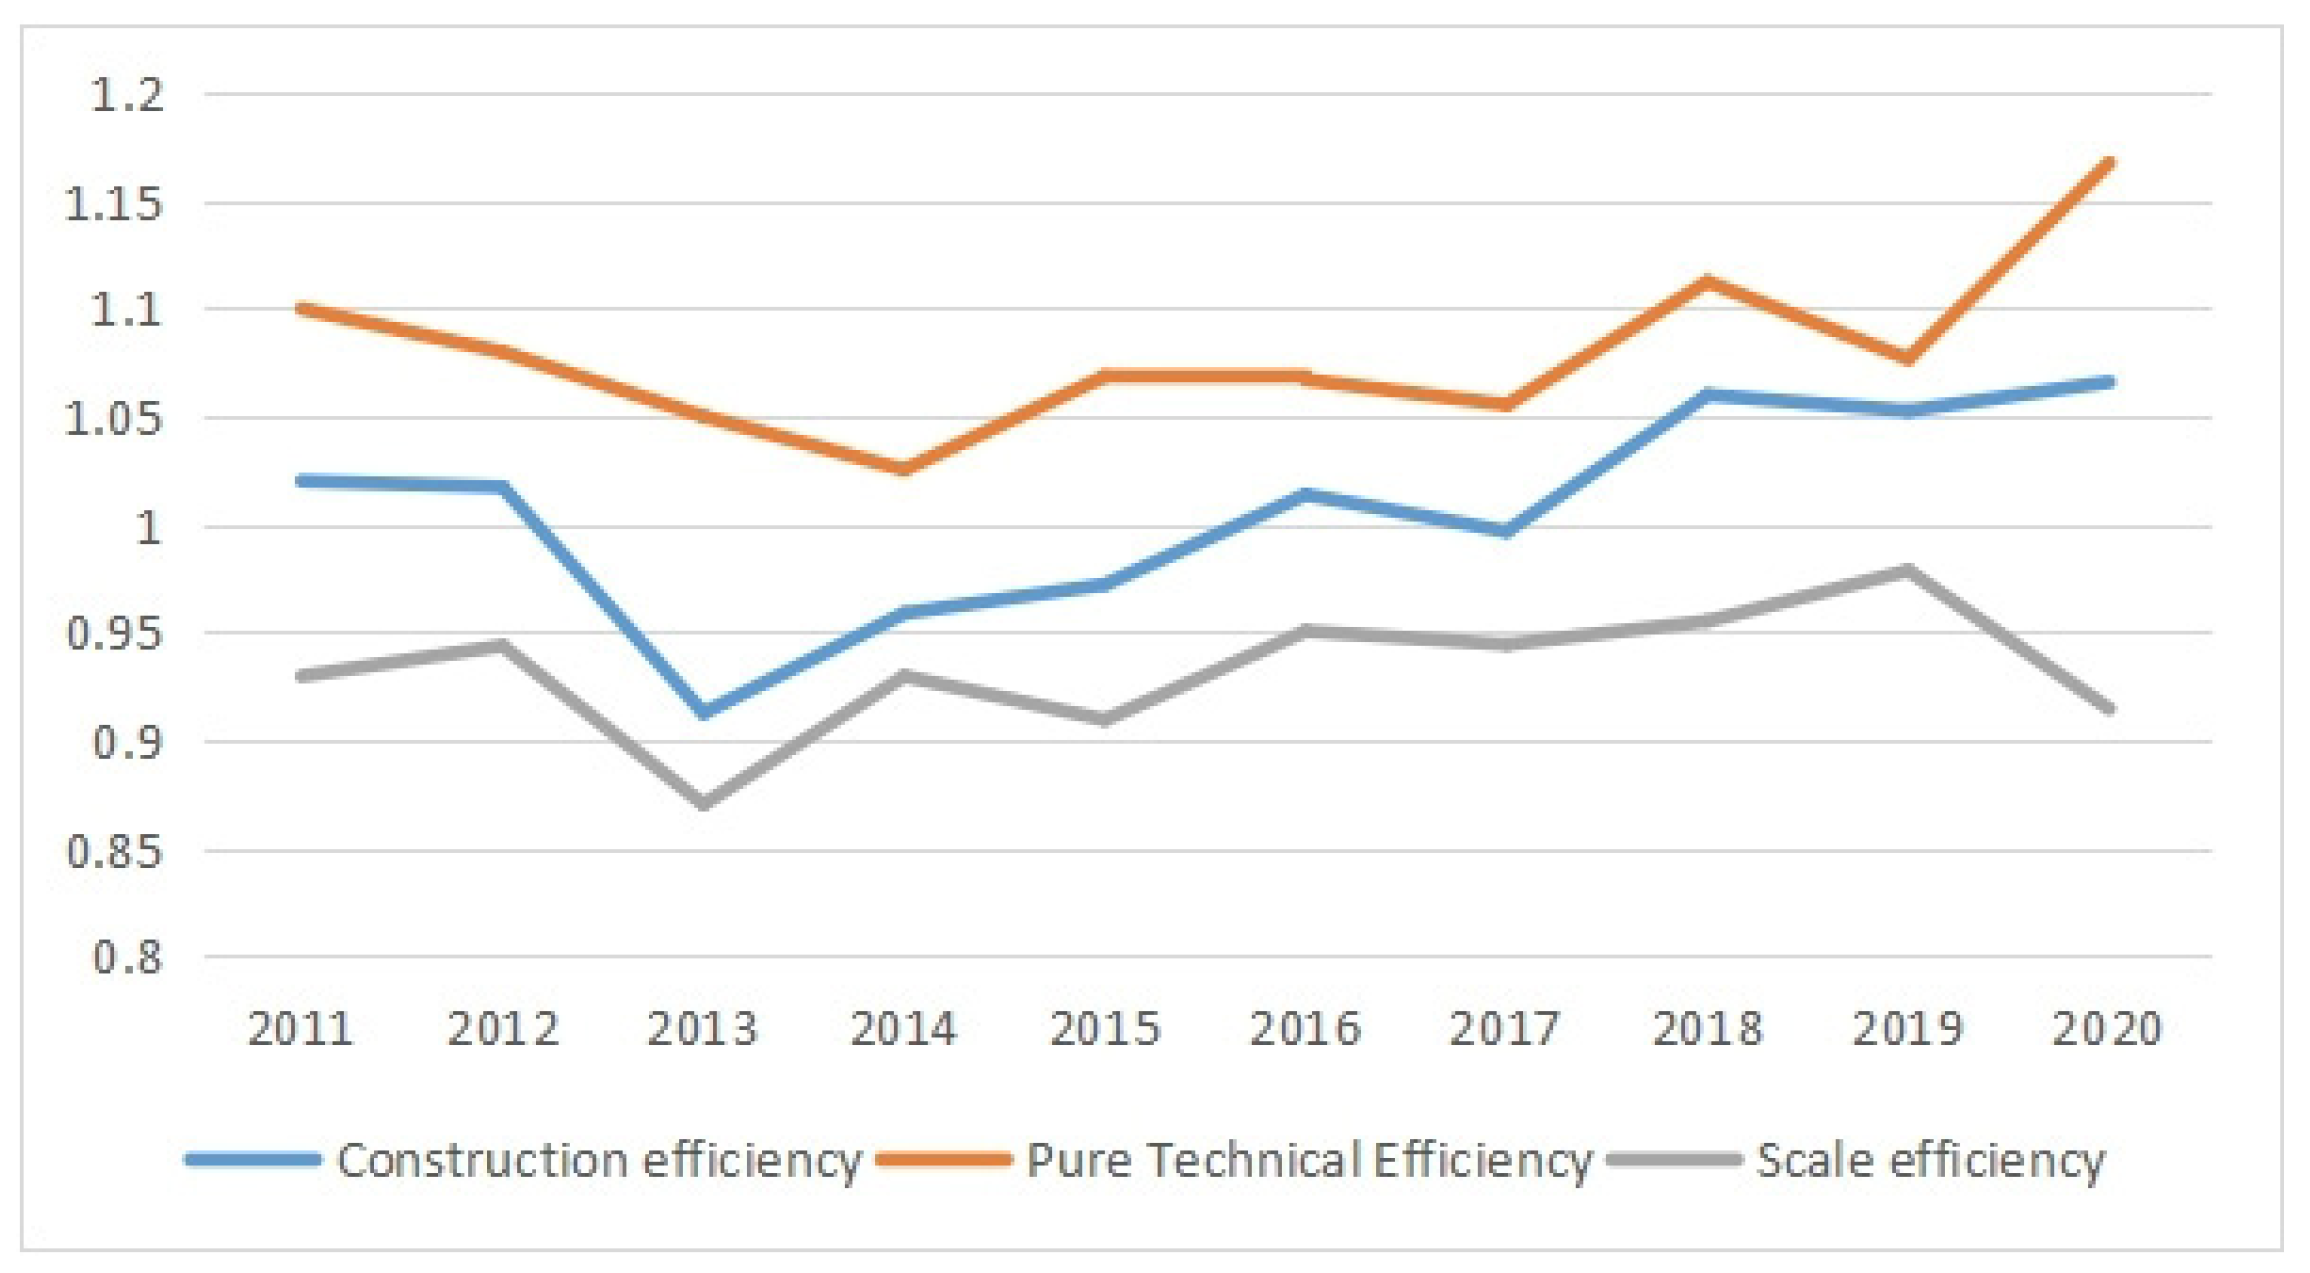
5.1. Efficiency Analysis of ZW City Construction

This article adopted the US-SBM model, which is based on the evaluation index system and data of ZW city construction efficiency, to measure the ZW city construction efficiency of various cities in Shandong Province from 2011 to 2020. Combined with the efficiency characteristics obtained from the SBM model, the said city construction efficiency is further decomposed into both scale and pure technical efficiency. The criteria for interpreting the three categories of efficiency are constant. Specifically, an efficiency score more than or equal to 1 signifies efficacy, whereas a number less than 1 suggests inadequate efficiency. The detailed efficiency values are shown in Table A1, Table A2 and Table A3 in the Appendix A. This section first introduces the overall efficiency situation of Shandong Province and then analyzes the annual efficiency situation of various cities. While analyzing the efficiency situation of each part, this section also explains the changes in scale efficiency and pure technical efficiency.

5.1.1. Analysis of Overall Efficiency in Shandong Province

The efficiency values of various cities in Shandong Province in a certain year were summated and used as the average value of the construction efficiency of Shandong Province for said year. The technical and scale efficiency of Shandong Province were also calculated in a similar way, and the variation curves of construction efficiency, pure technical efficiency, and standard efficiency in Shandong Province over the past decade were depicted to provide a detailed analysis of the overall construction efficiency of Shandong Province and explore the overall trend of ZW city construction efficiency, as shown in Figure 2. Moreover, the scale efficiency in this article reflects whether the allocation of input–output ratio was reasonable and whether the scale was coordinated during the construction of ZW cities. Meanwhile, pure technological efficiency represents the management level of various resources and the effects of required technology on the construction of a ZW city.
First, the development trend of the average construction efficiency is shown in Figure 2 above. The construction efficiency of ZW cities in Shandong province first showed a decreasing and then fluctuating upward trend, reaching a minimum value of 0.912 in 2013 and an effective construction efficiency value of 1.05 in 2020. Additionally, a careful analysis of the yearly construction efficiency of Shandong Province shows that after decreasing from 1.02 in 2011 to 0.91 in 2013, the construction efficiency of Shandong Province fluctuated up to 1.059 in 2018, reaching the maximum efficiency value during the study period. After experiencing a slight decrease, the efficiency stabilized at 1.05 or below during the years 2019 and 2020. The research period included two significant turning moments, namely in the years 2013 and 2017. The enhancement of average construction efficiency in 2013 mostly resulted from the advancement of average scale efficiency, but the increase in efficiency in 2017 primarily stemmed from the average pure technical efficiency. The aforementioned statement pertains to the official document titled “Letter of Responsibility for Air Pollution Prevention and Control Objectives” which was endorsed by Shandong Province in the year 2013, as well as the document titled “13th Five-Year Plan for Ecological Environment Protection in Shandong Province” that was published in 2017.
The letter of responsibility for air pollution prevention and control objectives issued in 2013 is to implement the action plan for air pollution prevention and control, which was signed by the Ministry of Environmental Protection and 31 provinces (autonomous regions and municipalities) across the country. The objective responsibility statement defines the quantitative objectives of coal reduction, elimination of backward production capacity, comprehensive treatment of air pollution and other work, reducing the output of solid waste to a certain extent.
The 13th five-year plan for ecological and environmental protection of Shandong Province, issued in 2017, clearly proposed to promote joint prevention and treatment of regional watersheds and collaborative control of multiple pollutants with improving environmental quality as the core, which laid a good foundation for the subsequent proposal of Shandong Province to build a “ZW” city in the whole region.
The release of both documents has promoted and stabilized the overall efficiency of “ZW” urban construction in Shandong Province.
The development of pure technical efficiency and scale efficiency can also be observed in Figure 2. From the numerical characteristics and fluctuation range of both efficiencies, the annual pure technical efficiency is greater than 1 and the scale efficiency is less than 1. The fluctuation ranges of both efficiencies are 1.03 to 1.17 and 0.87 to 0.98, respectively. Their development trends show that in periods such as 2012–2013 and 2016–2018, pure technical efficiency and scale efficiency showed the same trend as construction efficiency. However, in the three time periods of 2011–2012, 2013–2014, and 2015–2016, construction efficiency showed either stable or increasing trends, pure technical efficiency showed a decreasing or stable trend, and scale efficiency showed an increasing trend. This indicates that due to the lack of scale efficiency, the difficulty of improving scale efficiency is less than that of improving pure technical efficiency. Improving scale efficiency is the key to improving and stabilizing construction efficiency. Therefore, to better improve the efficiency of ZW city construction, the Shandong Provincial Government should pay more attention to increasing investment scale, improving scale efficiency, and promoting the better development of ZW city construction.

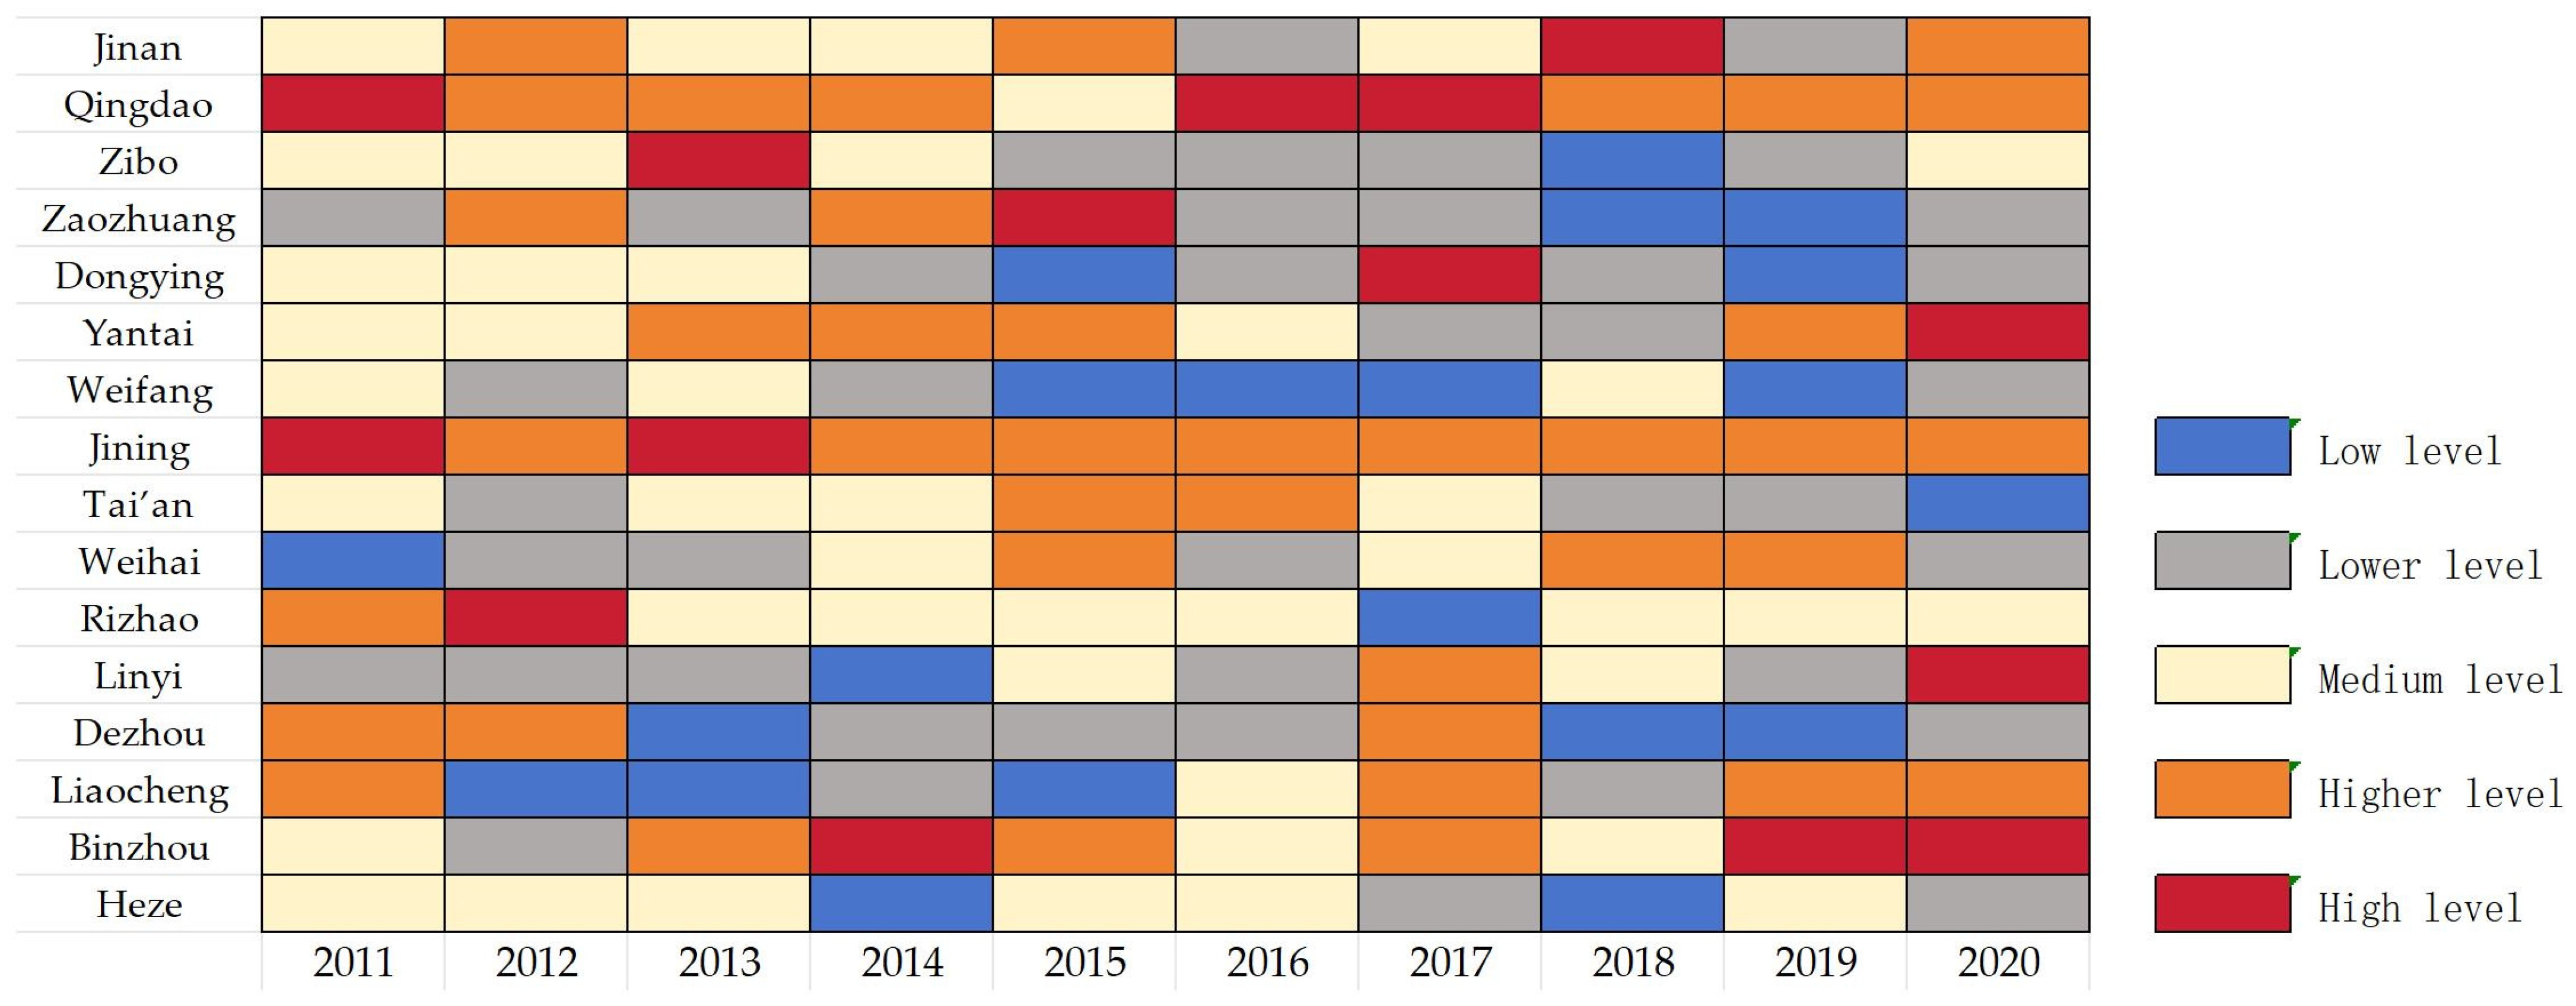
5.1.2. Efficiency Analysis of Various Cities in Shandong Province

This section calculates the average values of construction efficiency, pure technical efficiency, and scale efficiency for each city over the past decade and ranks the cities based on the three types of efficiency (see Table 2 for details). This presents a detailed analysis of the construction efficiency, pure technical efficiency, and scale efficiency of each city and explores the underlying information therein.
The efficiency of these 16 prefecture-level cities over the past decade can divide them into two parts: first, the construction efficiency of ZW cities in places such as Jinan, Qingdao, Zibo, Yantai, Jining, and Binzhou has never dropped below 1 during the research period; second (which is complementary to the first part), cities such as Zaozhuang, Dongying, Weifang, Tai’an, Weihai, Rizhao, Linyi, and Heze have all experienced situations during the research period where the construction efficiency of ZW cities is below 1.
Each section shows that there are generally similar but slightly different trends in the development of ZW city construction efficiency between each city.
For the first group of cities, the performance of Jinan, Zibo, and Yantai are very similar. The fluctuations in construction efficiency are roughly between 1.01 and 1.14, and these cities rank fifth, sixth, and fourth, respectively, in terms of average construction efficiency. Similarly, they rank thirteenth, fourth, and eleventh, respectively, regarding average pure technical efficiency, and rank first, second, and fifth, respectively, in terms of average scale efficiency. The average pure technical efficiency performance of these three cities is significantly lower than the average pure technical efficiency level of the entire Shandong Province.
Other cities in the same group such as Jining and Binzhou performed brilliantly. Both cities rank second and third, respectively, in terms of average construction efficiency, with Binzhou reaching its highest efficiency among all sampled cities during the study period in 2019. Additionally, although Jining and Binzhou are at either ends of the average pure technical efficiency and average scale efficiency rankings, both cities show that one efficiency ranks excellent, while the other ranks average. The city of Qingdao has also performed excellently, ranking first in average construction efficiency, and having a fluctuation range between 1.018 and 1.18. As a core city in Shandong Province, the development situation of the construction efficiency of Qingdao’s ZW city is stable.
In the second group of cities, the construction efficiency of ZW cities in Zaozhuang, Dongying, Weihai, Linyi, and Heze fluctuated significantly before 2016, and the efficiency developed steadily and exceeded 1 from 2016 to 2020. However, the efficiency development laws of ZW city construction in cities such as Tai’an, Weifang, and Rizhao are different from earlier mentioned cities.
Among the cities that experienced significant fluctuations in construction efficiency before 2016, the cities of Liaocheng and Linyi experienced more frequent fluctuations in efficiency. The construction efficiency of Liaocheng experienced two declines: the first decline lasted for two years where, in 2013, it reached the lowest efficiency value of Liaocheng during the research period. Despite experiencing a brief rise, it decreased again in 2015. However, the second decline in magnitude and duration is better than the first, with the city’s construction pure technical and scale efficiency steadily developing since 2016, both of which are above 1. Meanwhile, Linyi experienced a continuous two-year decline in efficiency in 2012, which was a year after the first consecutive decline in Liaocheng City. Similarly, Linyi’s construction efficiency has also been steadily developing since 2016 and is consistently above 1.
The construction efficiency of other cities such as Zaozhuang, Dongying, Dezhou, and Heze only experienced a year of decline before 2016 and remained stable at approximately 1 during its subsequent years.
For the remaining cities in the second group, the efficiency development laws of ZW city construction in cities such as Tai’an, Weifang, and Rizhao are different from the aforementioned cities. The efficiency of ZW city construction in Tai’an remained stable at over 1 before 2019 with stable fluctuations. However, it experienced a significant decline in 2020 with efficiency falling below 1 and becoming the lowest efficiency value of Tai’an during the research period. The efficiency of Weifang was less than 1 for three consecutive years (2015, 2016, 2017). However, the construction efficiency of ZW cities after 2016 showed an upward trend and remained stable at over 1 until 2018. Meanwhile, the construction efficiency of a ZW city in Rizhao decreased significantly in 2017, but the efficiency remained stable at over 1 during other years.

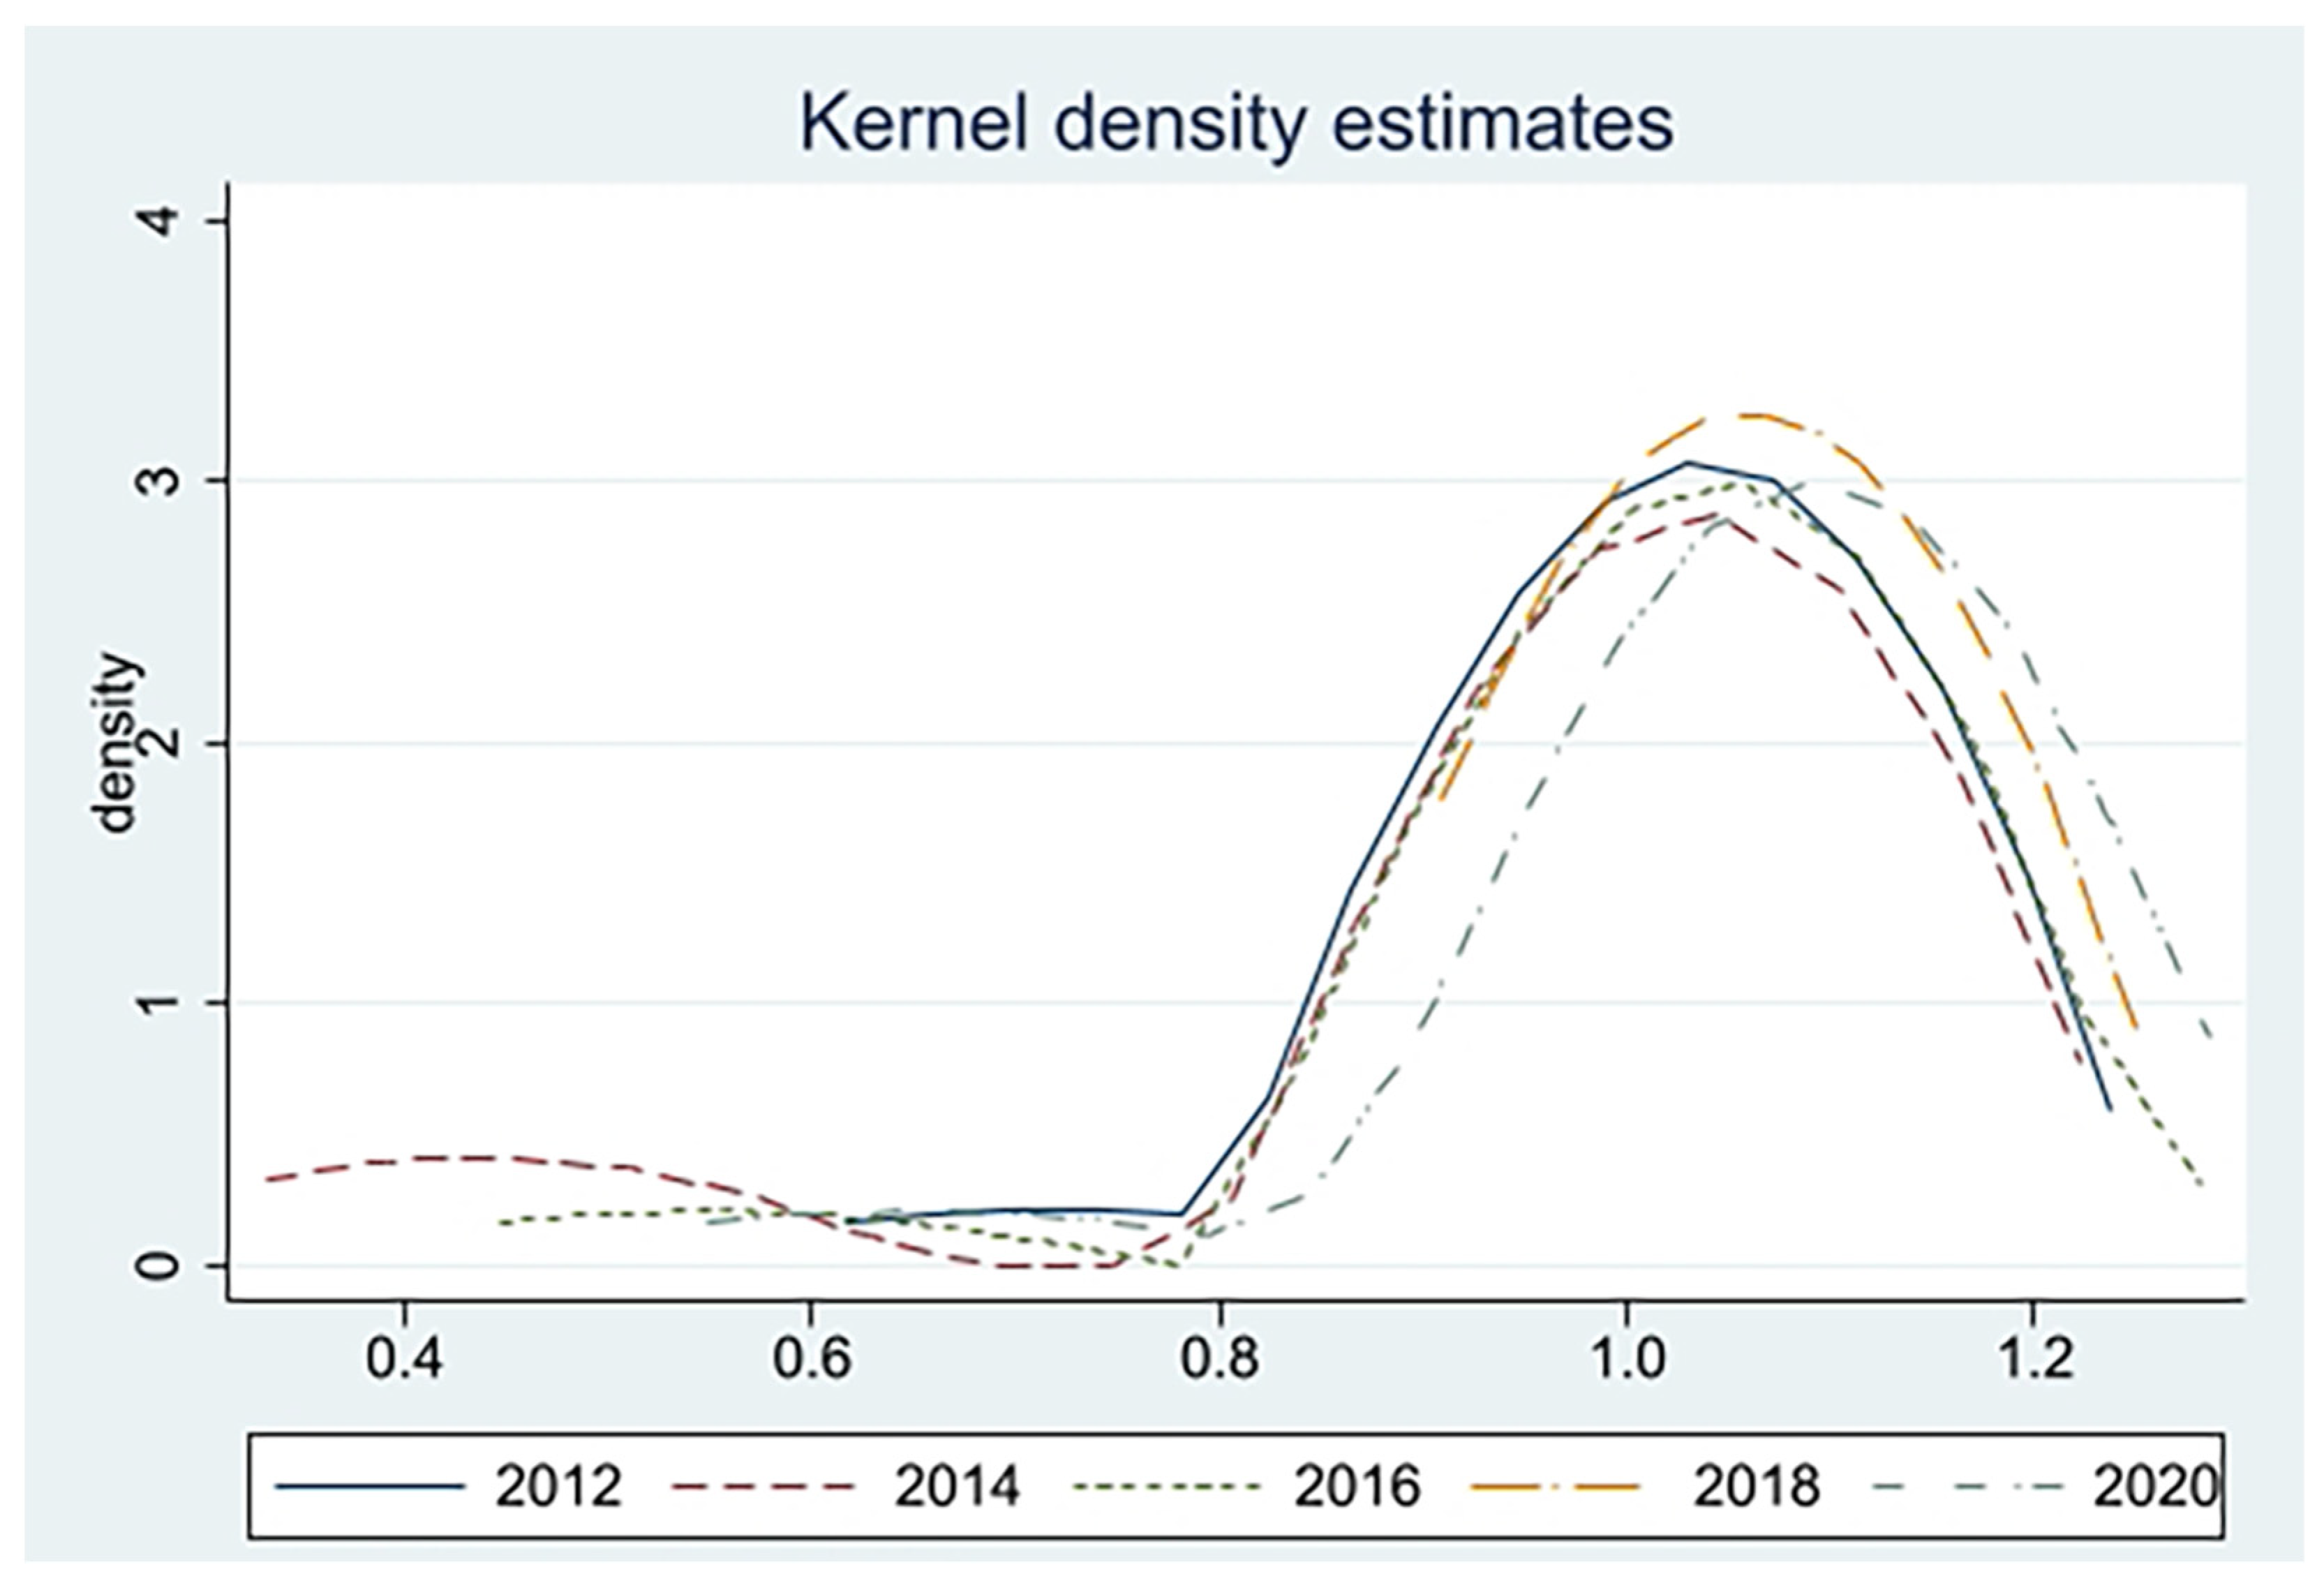
5.2. Time-Series Variance Analysis

Stata 17.0 was used to draw Shandong Province’s KDE distribution in 2012, 2014, 2016, 2018, and 2020 (as shown in Figure 3). This study investigated the absolute differences in the efficiency of ZW city construction in terms of the shape, position, and kurtosis extension of the KDE curve, and further studied the temporal variation pattern of ZW city construction efficiency in the province.
From 2012 to 2014, the KDE curve showed an inverted U-shaped shape with left trailing. However, the peak height of the curve in 2013 was lower and the curve width was larger than in 2012 and 2014. In 2014, the curve became more pronounced with left trailing characteristics with a wider extension range as compared with 2012. The water level position of the peak shifted slightly to the right, but the peak value decreased. This indicates that between 2012 and 2014, as the efficiency gap between high-efficiency cities and low-efficiency cities increases, the number of low-efficiency cities increases and the phenomenon of efficiency distribution agglomeration weakens.
Compared with 2014, the KDE curve in 2016 also showed an inverted U-shaped shape with a left trailing tail, slightly shifting to the right and shortening the left trailing tail. The peak height and width increased slightly, and the KDE curve extended to the right. This indicates that compared with 2014, the construction efficiency of ZW cities in Shandong Province in 2016 improved overall, showing an increase in the number of high-value cities and a more concentrated construction efficiency of ZW cities.
Compared with 2016, the KDE curve in 2018 underwent significant changes. From a shape perspective, the KDE curve still showed an inverted U-shaped shape, but the left trailing phenomenon disappeared and showed a trend of extending to the right. The peak height increased and the curve width significantly decreased; this indicates that the overall efficiency of ZW city construction in various cities in Shandong Province greatly improved, with a significant reduction in efficiency differences and a more concentrated distribution of efficiency. These drastic changes are mainly due to the “13th Five Year Plan” in Shandong Province released in 2017. The document explicitly highlights the need of enhancing the standard of secure disposal of hazardous waste, intensifying the reduction of significant pollutants, and establishing a regional recycling and comprehensive utilization system that prioritizes general solid waste. The aforementioned three objectives effectively align with the three essential criteria of ZW urban development, namely, reduction, resource use, and harmless treatment.
Unlike in 2018, the left trailing phenomenon of the KDE curve in 2020 reappeared with the wave peak shifting to the right, the peak decreasing, and the curve width significantly increasing. This indicates that while the distribution points of efficiency clusters in the construction of ZW cities in some cities in Shandong Province have increased compared with 2018, the number of cities with efficiency clusters has unfortunately decreased, the efficiency distribution has become more dispersed, and the gap between high-efficiency cities and low-efficiency cities has increased.
However, the peak position of the wave shifted to the right and had no significant change in height when compared with 2012, although the curve extension range did expand and the left tail phenomenon became more obvious. This indicates that at the end of the research period, the agglomeration degree of ZW city construction efficiency in various cities in Shandong Province did not change much, but the concentrated efficiency value increased and that the lower limit of efficiency, again, decreased. Moreover, this phenomenon becomes accompanied by the widening of the efficiency gap.

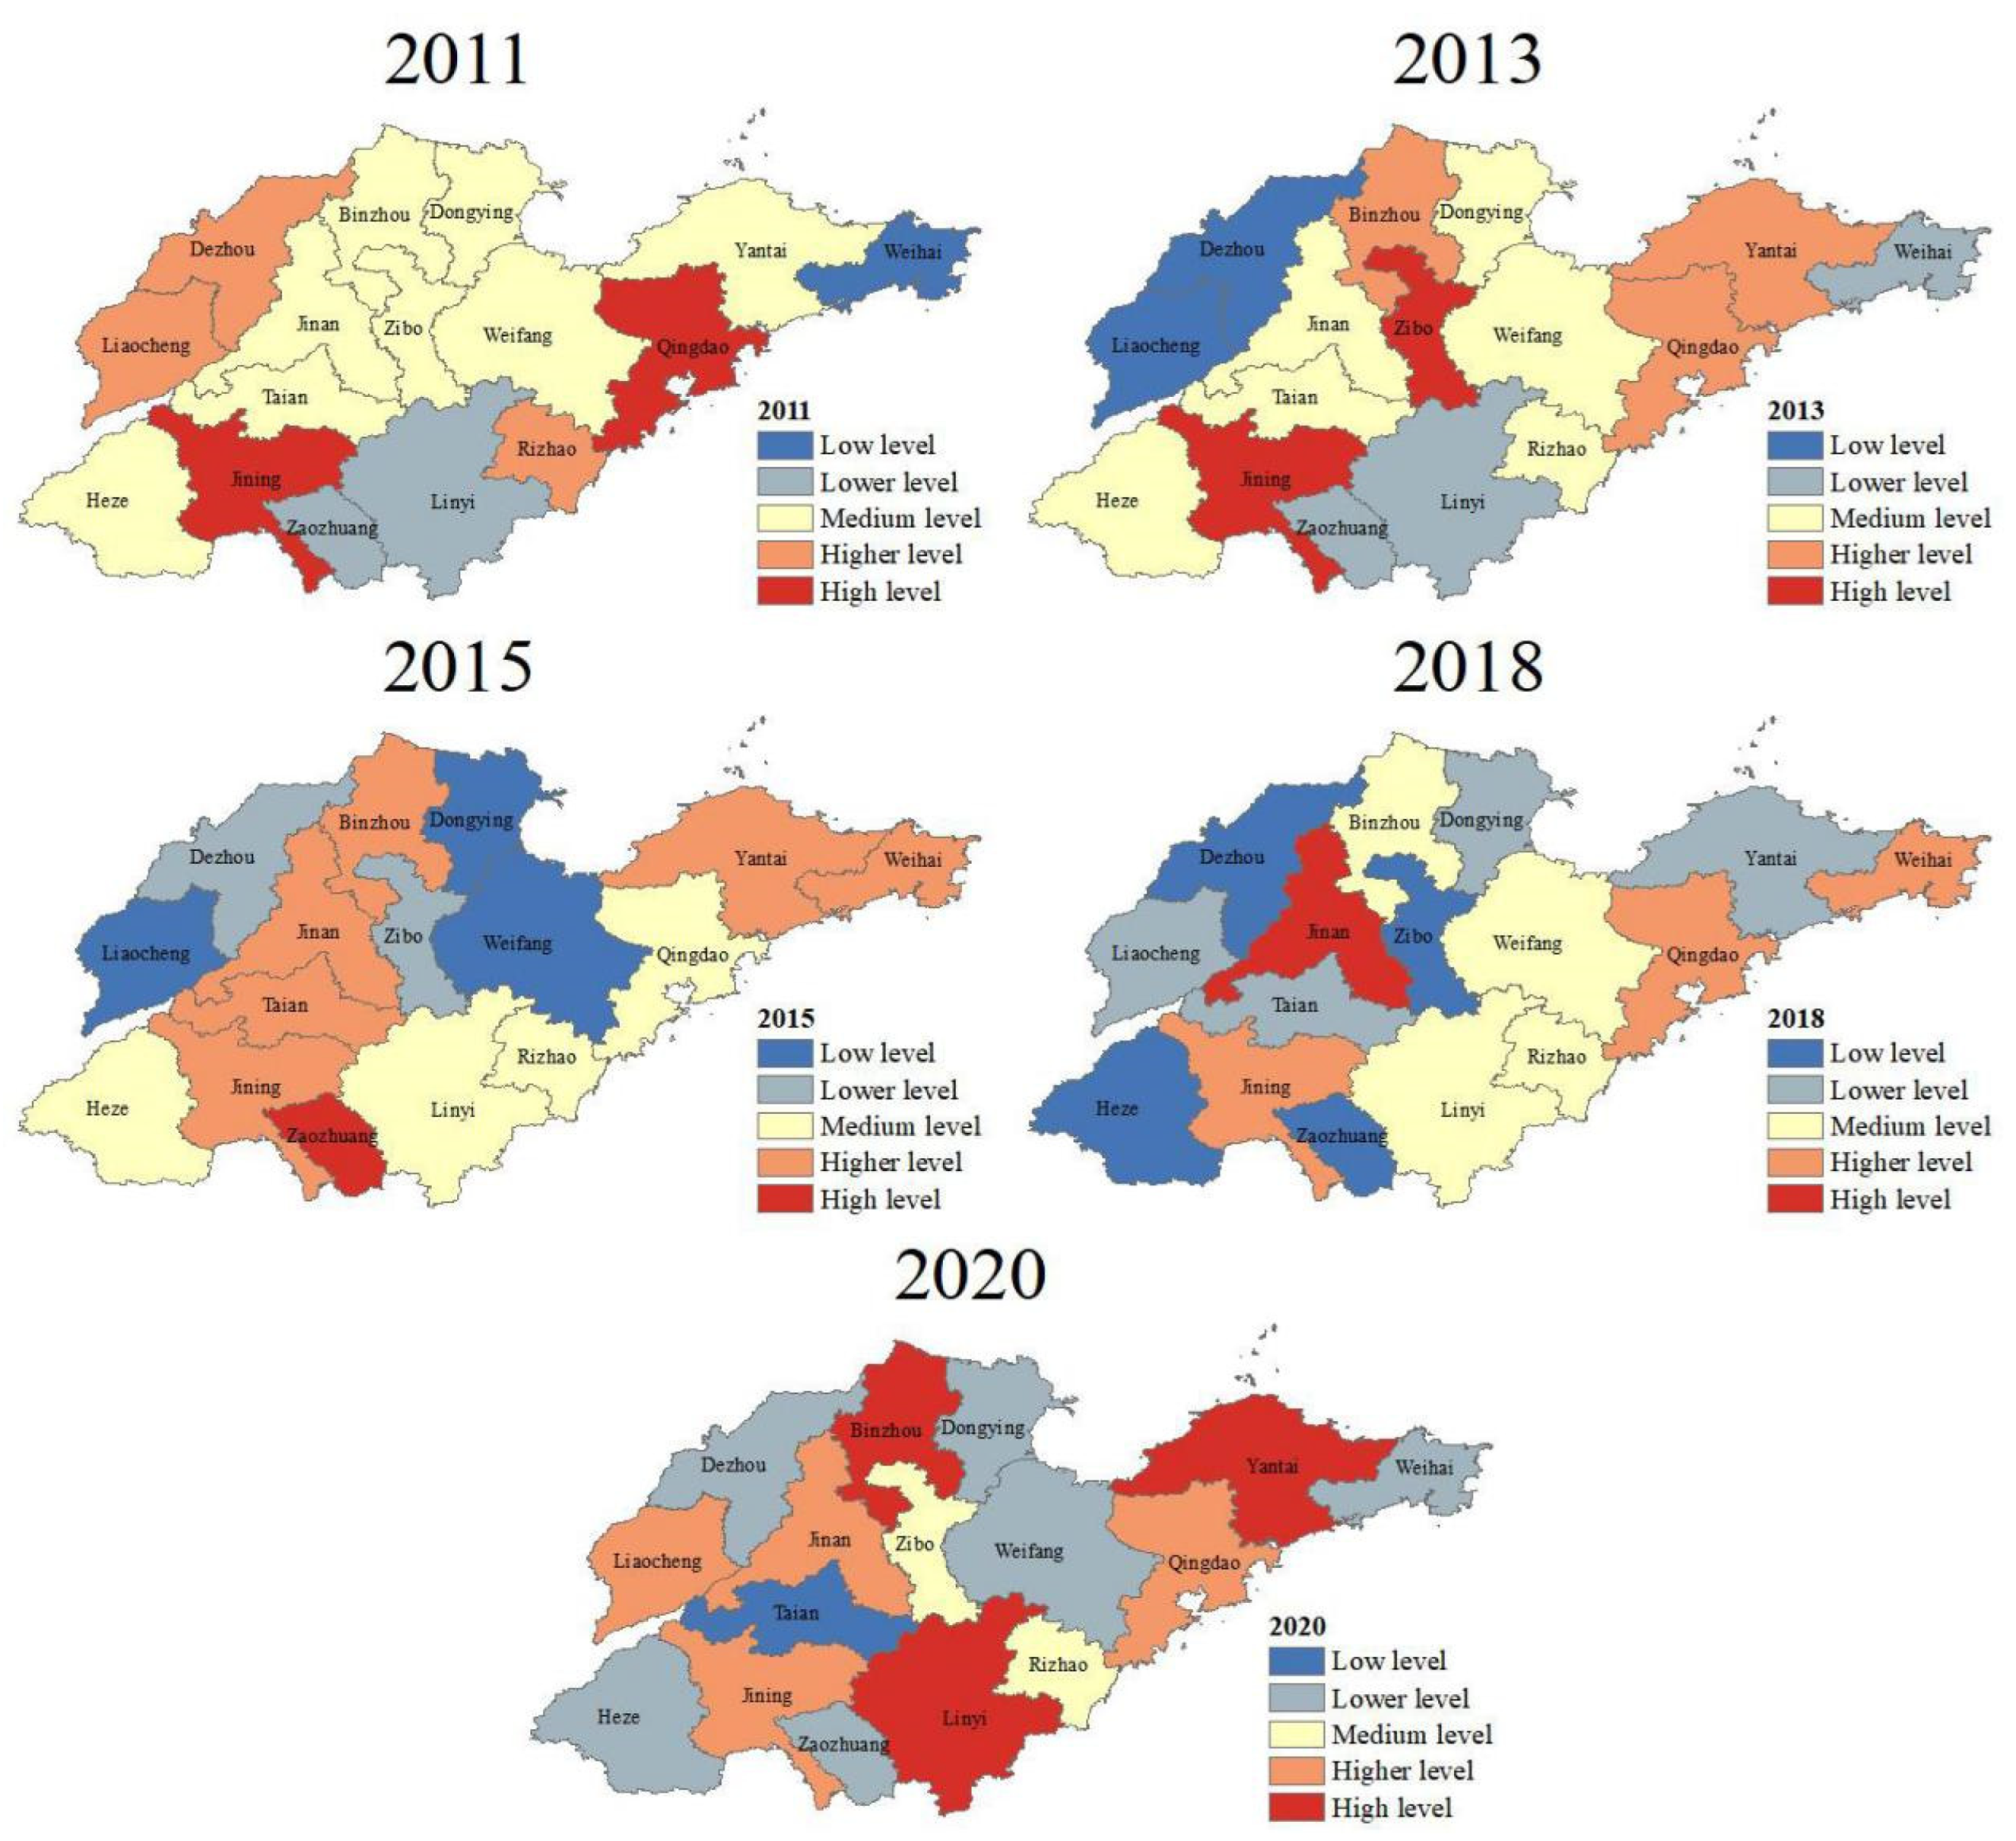
5.3. Spatial Evolution Analysis

Due to the relative nature of efficiency levels, this article classifies sixteen prefecture-level administrative units in Shandong Province according to the efficiency of ZW city construction during the research period. The results were divided into five categories: low-level, lower-level, medium-level, higher-level, and high-level cities. Five of these years were selected to represent the spatial pattern evolution of ZW city construction efficiency in Shandong Province during the research period. This study also calculated the yearly distribution of efficiency levels in each city to explore in detail the dynamic evolution process of ZW city construction efficiency in various cities in Shandong Province.
The natural discontinuity grading method is a map grading algorithm proposed by Jenks, who believed that data itself has discontinuities, and can be graded based on this natural property of the data [42]. The fundamental idea behind the natural breakpoint approach is to find categorization intervals based on the naturally occurring grouping of the data, group similar values properly, and maximize the differences between categories while minimizing differences within each category. This method utilizes natural attributes between data, thus effectively avoiding the subjectivity of manually dividing data types [42]. The application of ArcGIS geostatistical software achieves the natural breakpoint classification of efficiency data.

5.3.1. Spatial Evolution of the Construction Efficiency of ZW Cities

This study categorizes the construction efficiency of ZW cities in 2011, 2013, 2015, 2018, and 2020 (as shown in Figure 4).
From a geographical standpoint, Jinan, Zibo, Dongying, Jining, Tai’an, Dezhou, Liaocheng, Binzhou, and Heze are nine cities situated along the course of the Yellow River. In the context of national policy, these nine cities assume a significant role in establishing a prominent region for the development of ecological civilization within the Yellow River Basin, in comparison with other urban areas. Hence, whether driven by the need of environmental conservation or the mandate to execute national policies, it is imperative for these nine cities to expeditiously undertake collaborative regional development of zero-waste (ZW) cities. However, it can be shown from Figure 3 that, with the exception of the high-level and medium-water-level ZW city clusters depicted in 2011 and 2015, the majority of the other years exhibit a pattern of intermittent distribution of ZW cities across different levels. This tendency was most pronounced in the year 2020. There are many potential factors that might contribute to this phenomenon. Jinan, serving as the capital of Shandong Province, has a very limited influence as a regional core city, hence hindering its ability to sustain a sustained high-level or efficient building of ZW city. There is a need for enhancing the economic prowess of the majority of these nine cities. The creation of zero-waste (ZW) communities may be influenced by local governments’ focus on growth pressure.
Qingdao, Weihai, Weifang, Rizhao, and Yantai are coastal municipalities in China that have comparable geographical characteristics. Qingdao, as a prominent urban center within Shandong Province, exhibits robust economic prowess. In pursuit of establishing a zero-waste (ZW) city cluster within Shandong Province, the regional government has allocated additional financial resources and efforts towards investing in environmental management and enhancement. This encompasses several aspects such as urban infrastructure development, waste management initiatives, and the implementation of legislation aimed at safeguarding the environment. Hence, during the course of the five-year period shown in Figure 4, the efficacy of constructing a zero-waste (ZW) city has constantly surpassed a significant threshold. Nevertheless, it is apparent that the cities of Qingdao, Weihai, Weifang, Rizhao, and Yantai exhibit a notable pattern of intercity distribution across all levels. Consequently, it is imperative to enhance regional cooperation in the development of ZW cities.

5.3.2. Evolution of Efficiency Levels for ZW City Construction in Various Cities

Figure 5 shown above illustrates the variations in efficiency levels observed in each city during the duration of the research. Based on the provided diagram, a comprehensive account of the variations in building efficiency for each city is shown below.
During the research period, Qingdao and Jining were often at a high or higher level every year and displayed excellent performance. Rizhao City has been at a medium level during most years and displayed a certain degree of class solidification.
Zaozhuang, Weihai, Dezhou, Liaocheng, and Binzhou have risen by one level in 2014, especially Binzhou, which has further become a high-level city at par with original high-level cities.
Binzhou, Liaocheng, Linyi, Yantai, and Zibo all rose by at least two levels from 2018 to mid-2020. Most especially, Binzhou has consistently placed at a high level for two consecutive years in 2019 and 2020 and provides a promising development situation of ZW city construction. Linyi leaped from being a lower-level city in 2019 to being a higher-level city in 2020 and has a strong momentum of development in the construction of a ZW city. Zibo gradually developed from being a low-level city in 2018 to becoming a medium-sized city in 2020, showing a momentum of catching up.
Jinan, Weihai, and Tai’an experienced a decline of at least two levels from 2018 to 2020, showing a certain trend of development decline. Most especially, in Tai’an, the development of ZW urban construction began to decline in 2016 and it became a low-level city by 2020.
Dongying and Dezhou have been declining since 2017 and have since remained stable at either low or lower levels from 2018 to 2020. Meanwhile, Zaozhuang regressed since 2015 and remained stable at either a low or lower level from 2016 to 2020. Weifang has always been at a medium level or below, even reaching to being lower level or below in most years.
This study also found that after Jinan becomes a high-level city or above in a certain year, its efficiency level during subsequent years will experience either continuous or significant decline. Similar to the situation in Jinan, cities such as Zibo, Zaozhuang, Dongying, Tai’an, and Dezhou show that although the construction of ZW cities has been effective in some years, there is a lack of long-term planning. Because of this, it is vital to provide a summary of the flaws in the construction process while simultaneously learning about more sophisticated practices from leading regions.

5.4. Comprehensive Analysis of the Efficiency of ZW City Construction

This article takes 16 prefecture-level administrative units in Shandong Province as the research object and uses the US-SBM model to measure the efficiency of ZW city construction. Using the KDE curve and natural breakpoint classification method, the time series dynamic distribution characteristics and spatial agglomeration dynamic evolution of ZW city construction efficiency in Shandong Province were studied. After providing a summary and analysis, the study’s conclusions include the following:
The regional development synergy and cooperation of the construction of ZW cities in Shandong Province are insufficient, the efficient collaborative development mechanism is imperfect, and the performance of core cities is weak. Referring to Figure 3 and Table A1, Table A2 and Table A3, (1) from a geographical standpoint, it can be observed that, in 2015, Shandong Province formed urban agglomeration areas with a high level of ZW city construction efficiency in certain parts of the central, northern, and southern regions. However, during the remaining period, there was a lack of large-scale high-level ZW city construction effect in agglomeration areas, with most cities exhibiting a trend of interval distribution at varying levels. The aforementioned tendency was quite conspicuous throughout the year 2020. On one side, this phenomenon exemplifies the recognition of the significance of solid waste management by a limited number of cities, leading them to proactively implement policies aimed at establishing zero-waste (ZW) cities. However, it also indicates that the majority of cities have not prioritized regional coordination in their approach to developing a ZW city. This means that when making decisions regarding waste management, municipal governments primarily focus on managing waste within their own administrative regions and have limited policy coordination with other cities. Additionally, there is a lack of knowledge sharing and experience exchange on waste management practices between cities. Consequently, there are significant disparities in the level of attention and policy preferences given to the construction of a ZW city among different cities. (2) Phenomena such as “isolated islands” and “class solidification” can also be seen in the data. The efficiency of ZW city construction is manifested by how high-level cities are mostly surrounded by cities with medium or lower construction levels. This indicates that the sensitivity of surrounding cities to the driving effect of high-level cities is different and low-level cities lack the motivation to learn from high-level cities. Additionally, cities such as Rizhao are consistently at a medium level, which requires finding new breakthroughs to further build ZW cities. (3) As a core city, Jinan achieved effective ZW city construction during the research period. However, it was at a medium to low level in most years, which indicates that Jinan’s own ZW city construction efficiency was not very impressive among the other 16 prefecture-level cities.
Most cities face policy rigidity issues. Following Figure 2 and Figure 3, and Table A1, Table A2 and Table A3 in Appendix A, the release of two documents on ecological environment governance in 2013 and 2018 led to the improvement and stabilization of Shandong Province’s overall construction efficiency in both peak height and agglomeration degree in a certain period of time. For example, previously underperforming cities achieved a transformation of excellent performance. This also led to a difficult transition from previously being a high-level city to becoming a higher-level city for those such as Binzhou. However, most cities find it difficult to maintain long-term good performance, and the efficiency levels and values for some cities even decrease after policy issuance. For example, Tai’an has been in a continuous decline in efficiency levels from 2016 to 2020 and became the only city with insufficient construction of a ZW city in 2020. Therefore, some cities still need to recognize the importance and necessity of building ZW cities, adjust policies in a timely manner, learn from efficient and high-value cities while summarizing their own experiences, and create a blueprint for long-term construction of ZW cities according to local conditions.
The development of pure technological efficiency and scale efficiency in the construction of ZW cities is imbalanced, and insufficient scale efficiency is the main reason restricting the construction of ZW cities. The efficiency breakdown table shows that during the research period, regardless of the effectiveness of the construction of ZW cities in each city, its scale efficiency is less than 1. This low-scale efficiency is mainly due to insufficient investment and unreasonable allocation of investment factors. First, for the government, as a newly implemented urban management concept in China, the construction and maintenance of ZW cities require high technological content. Government finance has continuously been the main channel for investment in the construction of ZW cities. However, a single government financial support has obvious shortcomings, such as insufficient sustainability and severe policy repercussions. Additionally, the investment of some heavily polluting cities in the construction of ZW cities is far from being commensurate with the negative externalities (environmental damage) from their activities, resulting in insufficient investment in the construction of ZW cities. Second, the lack of scientific allocation of input factors is another important reason for low-scale efficiency. Cities with lower allocation levels do not learn from cities with higher allocation levels, and there is a lack of communication between cities in terms of resource allocation and investment.
Typical case analysis: Upon analyzing the efficiency level of ZW city construction in different cities over the past decade, it is evident that Qingdao and Jining consistently maintained a high level or above. Conversely, Binzhou, Linyi, and Zibo have demonstrated commendable progress in ZW city development in the last two years. This article focuses on five cities that have shown exceptional performance, hence garnering significant attention. (1) Upon conducting a comprehensive analysis of pertinent data pertaining to the establishment of ZW cities in five representative urban areas, it was ascertained that the municipalities of Qingdao and Jining embarked on initiatives aimed at solid waste management as early as the 10th five-year plan (2000–2005) and the subsequent 11th five-year plan (2006–2010). During the initial phase, Qingdao City prioritized the enhancement of its environmental infrastructure, and allocated greater resources towards the development of urban environmental infrastructure during the 10th five-year-plan period. This resulted in the establishment of several new facilities dedicated to the treatment of sewage, hazardous waste, domestic garbage, and general solid waste. These developments laid the foundation for the subsequent construction of a zero-waste (ZW) city in Qingdao. During the initial phase, Jining City established a strong basis for the development of a zero-waste (ZW) city. This has been accomplished through a concentrated effort to enhance environmental oversight and foster the growth of environmental protection sectors. Consequently, a notable concentration of environmentally sustainable industries with unique regional attributes has emerged. Moreover, significant progress has been made in achieving continuous monitoring of the emissions from major pollution sources throughout the 11th five-year-plan period. Furthermore, both urban areas have placed significant emphasis on enhancing their industrial structure as part of their respective environmental conservation strategies. This entails implementing crucial initiatives such as facilitating the adoption of environmentally friendly practices in key sectors and actively encouraging the implementation of sustainable production methods. (2) By analyzing the strategies used by Binzhou, Linyi, and Zibo in the management of solid waste between 2018 and 2020, it is evident that the commendable performance of Binzhou and Linyi may be attributed to their favorable market-oriented approach. In 2019, Binzhou municipality made public its efforts in establishing and using hazardous waste disposal facilities. This disclosure aimed to encourage social capital to invest in specific projects dedicated to the disposal of hazardous waste. In the year 2019, Linyi City approved the implementation of approximately 30 projects pertaining to solid waste disposal facilities. The execution of these projects is spearheaded by private firms, while the government offers specific financial assistance and assumes responsibility for project approval. The implementation of these projects has significantly enhanced the efficiency and capacity for the management and use of solid waste in Linyi City. Furthermore, Binzhou City has allocated a substantial amount of 39.5 million yuan towards the establishment of a sophisticated smart environmental protection supervision platform, aimed at enhancing the efficiency and effectiveness of regulatory practices. Additionally, Binzhou City has collaborated with the Environmental Assessment Center of the Ministry of Ecology and Environment to conduct specialized training programs focused on the enforcement of ecological and environmental protection laws. In 2018, the city of Zibo implemented the “Shandong Zibo City Hazardous Waste Pollution Prevention and Control Plan (2018–2020)”. This plan provided explicit directives regarding the advancement of hazardous waste disposal infrastructure, the digitalization of solid waste monitoring, and the diversification of funding sources to facilitate the effective management of hazardous waste.

6. Recommendations

Shandong Province has a key role in the strategic initiatives pertaining to ecological preservation and the pursuit of high-quality development within the Yellow River Basin. Out of the nine provinces and regions including the Yellow River Basin, Shandong is the only representative belonging to the eastern and coastal regions. National authorities also place significant emphasis on the pivotal role of the Shandong Peninsula urban agglomeration in the ecological preservation and high-caliber development of the Yellow River Basin. Against this backdrop, Shandong Province has formulated plans to establish a comprehensive ZW urban cluster encompassing the whole area by the year 2022.
This study focuses on the 16 prefecture-level cities within the ZW urban agglomeration located in Shandong Province. The objective is to investigate the building efficiency and temporal and geographical variations among the cities within the urban agglomeration of ZW. Considering the possible challenges in conjunction with a pragmatic examination of common scenarios. This research presents recommendations in three key areas: expanding regional synergy, bolstering government capacity, and strengthening oversight and market revitalization. Furthermore, this research offers additional recommendations that have implications at the worldwide level, serving as a valuable resource for decision making in a broader range of nations and areas.

6.1. Improve Regional Synergy

The research revealed that the province of Shandong did not exhibit a consistent and sustained high-level ZW urban agglomeration. Instead, it frequently displayed a pattern of cities being distributed across various levels. This indicates that the current level of regional coordination in urban development within the Lingling District of Shandong Province is not sufficiently satisfactory. Therefore, it is imperative to establish a long-term mechanism for collaborative governance and enhance the quality of environmental infrastructure provision and operational efficiency.
(1)
Establish a long-term mechanism for collaborative governance
During the majority of the study period, Shandong Province did not establish a significant agglomeration area for high-level ZW city construction efficiency. This is primarily evident in the dispersion pattern of cities at various levels or the concentration of lower-level cities. In 2020, the dispersion pattern of cities at different levels exhibited a particularly pronounced trend. The development of the “ZW cities” cluster in Shandong Province necessitates the systematic coordination of various stakeholders, including the government, the public, and enterprises in the region. This coordination aims to facilitate policy alignment, resource sharing, and technology exchange within the “ZW cities” cluster. Ultimately, the objective is to establish a sustainable framework for collaborative governance in the “ZW cities” cluster.
(2)
Improve the quality of environmental infrastructure supply and operational efficiency
The environmental infrastructure plays a crucial role in the development of a “ZW city” by providing essential support for enhancing the synergistic effects of pollution reduction and carbon reduction. In the process of constructing ZW cities, it is imperative to enhance the optimization of the layout of environmental infrastructure. This can be achieved by implementing systematic planning and comprehensive promotion, with a particular focus on strengthening the scientific and technological aspects of environmental infrastructure. It is essential to construct environmental infrastructure in accordance with local conditions, aiming to enhance the supply capacity and technical proficiency of urban environmental infrastructure. By doing so, we can effectively facilitate the integrated, intelligent, and sustainable development of environmental infrastructure within “ZW cities”.
Policy extension: Coordinating regional development has always been a major global issue and displays long-term characteristics mainly due to the varying natural resource endowments among different global regions. This fragmented development will inevitably lead to imbalanced development, with the resulting social instability posing a huge threat to global peace and security. Governments of various countries can narrow regional differences by combining regional advantages, while also building new growth points for economic development to ease social conflicts and build a stable environment for development.

6.2. Enhancing the Government’s Own Capacity and Strengthening Supervision

The aforementioned study reveals that some cities have challenges pertaining to inflexible rules. This issue may be attributed, in part, to the inadequacies of the regional collaborative governance structure, as well as the limited managerial capabilities and insufficient control of the government over the construction progress of zero-waste (ZW) cities.
(1)
Strengthen training on grassroots pollutant management capabilities.
As a newly implemented urban management method in China, ZW cities often require a lot of interdisciplinary professional knowledge when formulating relevant policies, and some local government civil service teams often lack said professional knowledge. Therefore, this study draws on the successful experience of Binzhou, summarized in Section 5.4, and suggests that local governments should formulate scientific training plans, expand training channels, and accelerate the solution to the shortcomings of cadre team capacity building through business training and competitions. The abilities of civil service teams can be enhanced by exchanging experiences or through other similar platforms. This means focusing on promoting responsible behavior and establishing advanced models to stimulate the work enthusiasm of civil servants. A professional team for the construction of “ZW cities” in multiple industries and fields can also be simultaneously formed to issue professional technical documents for various pollutants.
(2)
Building an information-based smart regulatory platform
During the construction of ZW City, the low degree of information circulation among government departments due to the large number of pollutant types and industries involved, and the joint management and control of ZW city construction are not excellent. Thus, there is a need to build an information-based intelligent supervision platform that combines various advanced digital technologies to form real-time, dynamic, and complete data information. This platform will provide reliable technical support for scientific decision making and also enable the supervision of enterprises to punish enterprises practicing concealment, underreporting, illegal transfer, dumping, and disposal of pollutants in accordance with the law, and also achieve evidence-based law enforcement.
The smart regulatory platform provides real data for policy makers, while the professionally trained policy makers can summarize and analyze effective information from the data, and finally make flexible, reasonable, and effective decisions.
Policy extension: In the construction process of ZW cities, the government plays a guiding role in industries, and policy formulation cannot be separated from the support of data and knowledge. Policymakers in different nations should provide the groundwork for regional progress by making data-driven decisions guided by well-defined objectives. This requires combining professional insight with relevant and actionable information.

6.3. Revitalizing the Market and Introducing Social Capital to Jointly Carry Out ZW City Construction

The development of efficiency in the construction of ZW cities in Shandong Province is mainly constrained by insufficient scale efficiency. Thus, it is necessary to increase investment and resource allocation in the construction of ZW cities.
However, relying solely on government investment for the construction of ZW cities in Shandong Province is, under current conditions, still unsustainable. Increasing construction investment through the social subject is an important means to optimize resource allocation and improve scale efficiency. In the typical case analysis in Section 5.4, Jining, Binzhou, and Linyi are good examples. The government should guide financial institutions to provide credit support for green transformation of enterprises and encourage social capital to invest in the construction of pollutant comprehensive utilization industries. The government must increase its support towards preferential policies for green industries to provide a fertile ground for enterprises to smoothly achieve green transformation and for the vigorous development of ecological industries.
Policy extension: During the early stage of the implementation of ZW city construction, the government will account for a large proportion of investment. However, it is necessary to change the situation from a government-led to a market-led construction in future development, with the government changing its original leading role to a guiding one. More investment subjects for ZW city construction will mean more investment made in ZW city construction, in turn leading to more efficient allocation of resources. When formulating a development strategy for economic or environmental protection, governments of various countries should greatly consider planning from early government leadership to later market leadership and government guidance and exploring a multi-agent development model.

7. Conclusions

This paper reviews the relevant literature on ZW city construction and designs the evaluation index system of ZW city construction efficiency in Shandong Province based on previous studies, combined with the three requirements and realistic situations of building ZW cities in China, and uses a US-SBM model, KDE method, and natural discontinuity grading method to measure and analyze the ZW city construction efficiency of all 16 prefecture-level cities included in the ZW city cluster planning in Shandong Province, The study found that there were three problems in the construction of ZW cities in Shandong Province: insufficient regional development synergy, rigid policies in some prefecture level cities, and the imbalance between pure technical efficiency and scale efficiency; the government itself should improve its quality and ability and strengthen government supervision; and revitalize the market and introduce social capital to jointly carry out the construction of ZW cities.
This research has three primary contributions: (1) theoretical contribution: this study has developed an evaluation index system for measuring the construction efficiency of zero-waste (ZW) cities in China, taking into account the three requirements and realistic situations. Unlike previous approaches that focused solely on solid waste, this index system encompasses a broader range of factors, thereby drawing on existing theory and expanding its scope; (2) methodological contribution: this work presents a novel approach by integrating the US-SBM model, KDE technique, and natural discontinuity grading method. This integration broadens the potential applications of these three approaches in the measurement and analysis of the efficacy of ZW city building; (3) the practical contribution of this study lies in its selection of all 16 prefecture-level cities in the ZW urban agglomeration of Shandong Province as the research object. These cities are of great importance in the ecological protection and high-quality development strategy of the Yellow River Basin. This approach offers more practical guidance and relevance compared with the previous literature that focused on provinces or a limited number of key cities.
However, as an advanced urban management concept in China, the construction of ZW cities is in its nascency, and there is relatively little indicator data related to ZW city construction. Therefore, to comprehensively measure the efficiency of ZW city construction, further improvement of the indicator system should be considered in subsequent research to provide more scientific guidance for ZW city construction.
Finally, it is hoped that the research ideas and methods designed herein can ultimately provide possible references for subsequent research on the construction of ZW cities.

Author Contributions

Conceptualization, X.C. and L.W.; methodology, L.W. and P.S.; software, S.W. and P.S.; validation, X.C., S.W., and P.S.; formal analysis, X.C., P.S., and Z.Q.; investigation, X.C. and P.S.; data curation, P.S.; writing—original draft preparation, X.C., L.W., and P.S.; writing—review and editing, J.Š., J.G., and M.J.S.; visualization, P.S. All authors have read and agreed to the published version of the manuscript.

Funding

The funding of this study was supported by the Special Project of Shandong Social Science Planning Fund Program (No. 21CSDJ03); Youth Innovation Team of Shandong Higher Education Institutions (No. 2021RW021); Hainan Provincial Natural Science Foundation of China (No. 523QN214); Shandong Province Social Science Planning Research Project (No. 23DGLJ21).

Data Availability Statement

Not applicable.

Acknowledgments

The authors would like to thank the anonymous referees for their valuable comments and suggestions.

Conflicts of Interest

The authors declare no conflict of interest.

Appendix A

Specific formulas and content of research methods are discussed herein.
Non-expectation super-efficiency SBM model was used to measure the efficiency of ZW urban construction in cities at all levels in Shandong Province. Using the kernel density estimation curve, the space–time difference in the development of ZW urban construction efficiency was also analyzed. The specific formula is as follows:
(1)
A Super-Efficient SBM Model Considering Unexpected Output
  θ * = min λ , s , s + 1 + 1 m i = 1 m s i x i o t 1 1 q + h ( r = 1 q s r + y r o t + k = 1 h s k b k o t ) s . t .   x i o t t = 1 T j = 1 , j 0 n λ j t x i j t s i i = 1 , 2 , , m ; y r o t t = 1 T j = 1 , j 0 n λ j t y r j t + s r + r = 1 , 2 , , q ; b k o t t = 1 T j = 1 , j 0 n λ j t b k j t s k k = 1 , 2 , , h ; λ j t 0 ( j ) , s i 0 ( i ) , s r + 0 ( r ) , s k 0 ( k )
In the above formula, 16 prefecture-level cities in Shandong Province were taken as decision-making units, θ * represents the efficiency of ZW city construction, θ * 1 represents that the construction of a ZW city is effective, and θ * < 1 represents insufficient efficiency.
Each decision-making unit contains three variables: input, expected output, and unexpected output, represented by three vectors:
x R m , y R q , b R h
The matrix is defined as follows:
X = [ x 1 , x 2 , , x 16 ] R m × 16 , Y = [ y 1 , y 2 , , y 16 ] R q × 16 , B = [ b 1 , b 2 , b 16 ] R k × 16
s i , s r + , s k represent the slacks of inputs, expected outputs, and unexpected outputs, respectively.
(2)
Kernel Density Estimation
The kernel density estimation method can describe the distribution form of random variables with continuous density curves and has thus become one of the important tools in studying spatial distribution imbalance. The specific formula is as follows:
f ( x , y ) = 1 n h 2 i = 1 n K ( x x i h , y y i h )
f ( x , y ) is the kernel density estimation of point (x, y), n is the total amount of sample data in the study area. h is the band width. K is the kernel function. ( x i , y i ) is the coordinate of the ith sample.
Table A1. Efficiency of ZW city construction.
2011201220132014201520162017201820192020Average
Jinan1.031.041.011.041.071.021.011.151.031.111.05
Qingdao1.111.081.031.041.021.181.151.121.071.121.09
Zibo1.021.021.131.021.001.011.001.031.031.091.03
Zaozhuang1.001.040.691.061.191.011.001.021.011.051.01
Dongying1.031.021.001.000.611.011.121.051.011.040.99
Yantai1.021.031.031.041.101.031.001.041.101.161.06
Weifang1.031.021.001.000.610.550.651.071.001.050.90
Jining1.111.051.121.061.041.091.081.101.081.131.09
Tai’an1.031.011.001.031.041.111.031.041.020.651.00
Weihai0.721.010.771.031.051.021.011.091.091.050.98
Rizhao1.061.141.011.021.011.030.541.061.051.071.00
Linyi1.011.000.740.441.011.011.081.061.031.190.96
Dezhou1.041.050.571.001.001.001.071.011.001.030.98
Liaocheng1.070.720.431.000.751.061.091.041.081.130.94
Binzhou1.021.011.051.121.051.061.101.061.191.151.08
Heze1.021.031.000.431.011.031.011.021.051.060.97
average1.021.020.910.960.971.011.001.061.051.07
Table A2. Pure technical efficiency of ZW city construction.
City2011201220132014201520162017201820192020Average
Jinan1.041.041.021.041.071.021.021.161.031.111.06
Qingdao1.151.101.041.051.031.181.181.141.071.131.11
Zibo1.021.031.141.021.001.011.011.041.031.141.04
Zaozhuang1.021.081.021.131.251.041.041.121.051.351.11
Dongying1.101.111.041.031.111.031.221.131.021.171.09
Yantai1.051.041.031.051.131.051.001.061.121.181.07
Weifang1.051.061.021.021.021.020.681.071.001.051.00
Jining1.111.071.131.071.061.091.091.111.081.171.10
Tai’an1.161.071.041.071.091.261.091.201.131.111.12
Weihai1.071.181.071.051.081.031.021.291.131.171.11
Rizhao1.211.151.011.051.041.111.011.111.141.121.09
Linyi1.011.000.810.571.031.011.081.061.041.200.98
Dezhou1.151.101.031.041.031.021.171.051.021.201.08
Liaocheng1.241.101.051.051.011.071.111.081.131.201.10
Binzhou1.151.071.301.181.121.071.131.071.191.231.15
Heze1.071.071.041.011.041.051.031.091.061.161.06
average1.101.081.051.031.071.071.061.111.081.17
Table A3. Scale efficiency of ZW city construction.
2011201220132014201520162017201820192020Average
Jinan0.9911.0001.0000.9990.9990.9980.9940.9880.9991.0000.997
Qingdao0.9660.9870.9890.9990.9870.9980.9710.9760.9990.9920.986
Zibo0.9990.9940.9911.0001.0001.0000.9990.9850.9980.9570.992
Zaozhuang0.9810.9670.6740.9400.9520.9780.9660.9090.9620.7790.911
Dongying0.9380.9210.9620.9770.5480.9800.9160.9270.9900.8900.905
Yantai0.9770.9870.9960.9910.9740.9800.9970.9860.9880.9840.986
Weifang0.9780.9610.9780.9860.5980.5340.9570.9981.0000.9990.899
Jining0.9990.9780.9970.9940.9840.9990.9920.9891.0000.9610.989
Tai’an0.8880.9490.9650.9670.9560.8780.9480.8660.9030.5860.891
Weihai0.6730.8530.7230.9790.9760.9910.9890.8430.9630.8950.889
Rizhao0.8760.9920.9960.9680.9710.9260.5320.9530.9260.9560.909
Linyi0.9970.9970.9160.7730.9840.9981.0000.9970.9990.9910.965
Dezhou0.9080.9510.5540.9630.9720.9810.9090.9610.9870.8570.904
Liaocheng0.8630.6490.4120.9550.7440.9920.9830.9620.9550.9360.845
Binzhou0.8870.9450.8070.9550.9350.9900.9740.9930.9960.9340.941
Heze0.9490.9640.9620.4260.9690.9810.9800.9440.9880.9130.908
average0.9290.9430.8700.9290.9090.9500.9440.9550.9780.914

References

  1. Kaza, S.; Yao, L.C.; Bhada-Tata, P.; Van Woerden, F. What a Waste 2.0; World Bank: Washington, DC, USA, 2018; ISBN 978-1-4648-1329-0. [Google Scholar]
  2. Ma, W.; de Jong, M.; Zisopoulos, F.; Hoppe, T. Introducing a Classification Framework to Urban Waste Policy: Analysis of Sixteen Zero-Waste Cities in China. Waste Manag. 2023, 165, 94–107. [Google Scholar] [CrossRef] [PubMed]
  3. XINHUANET Jinping Xi Presided over the Sixth Meeting of the Central Committee on Finance and Economics. 2020. Available online: https://www.gov.cn/xinwen/2020-01/03/content_5466363.htm (accessed on 15 August 2023).
  4. ZWIA Zero Waste Definition Adopted by Zero Waste International Alliance. 2018. Available online: https://zwia.org/zero-waste-definition/ (accessed on 19 May 2023).
  5. Zaman, A.U.; Lehmann, S. Challenges and Opportunities in Transforming a City into a “Zero Waste City”. Challenges 2011, 2, 73–93. [Google Scholar] [CrossRef]
  6. Awasthi, A.K.; Cheela, V.S.; D’adamo, I.; Iacovidou, E.; Islam, M.R.; Johnson, M.; Miller, T.R.; Parajuly, K.; Parchomenko, A.; Radhakrishan, L.; et al. Zero Waste Approach towards a Sustainable Waste Management. Resour. Environ. Sustain. 2021, 3, 100014. [Google Scholar] [CrossRef]
  7. Fujita, K.; Hill, R.C. The Zero Waste City: Tokyo’s Quest for a Sustainable Environment. J. Comp. Policy Anal. Res. Pr. 2007, 9, 405–425. [Google Scholar] [CrossRef]
  8. Zaman, A.U.; Lehmann, S. Urban Growth and Waste Management Optimization towards ‘Zero Waste City’. City Cult. Soc. 2011, 2, 177–187. [Google Scholar] [CrossRef]
  9. Zaman, A.U. A Comprehensive Review of the Development of Zero Waste Management: Lessons Learned and Guidelines. J. Clean. Prod. 2015, 91, 12–25. [Google Scholar] [CrossRef]
  10. Yang, G.; Zhang, Q.; Zhao, Z.; Zhou, C. How Does the “Zero-Waste City” Strategy Contribute to Carbon Footprint Reduction in China? Waste Management 2023, 156, 227–235. [Google Scholar] [CrossRef]
  11. UN Transforming Our World: The 2030 Agenda for Sustainable Development. 2015. Available online: https://sdgs.un.org/2030agenda (accessed on 14 August 2023).
  12. UNEP Cities Embrace “Zero Waste” Philosophy amidst Torrents of Trash. 2021. Available online: https://www.unep.org/news-and-stories/story/cities-embrace-zero-waste-philosophy-amidst-torrents-trash (accessed on 14 August 2023).
  13. UN-Habitat UN-Habitat Launches the Waste Wise Cities Tool (WaCT). Available online: https://unhabitat.org/news/08-feb-2021/un-habitat-launches-the-waste-wise-cities-tool-wact (accessed on 14 August 2023).
  14. Rao, C.; He, Y.; Wang, X. Comprehensive Evaluation of Non-Waste Cities Based on Two-Tuple Mixed Correlation Degree. Int. J. Fuzzy Syst. 2020, 23, 369–391. [Google Scholar] [CrossRef]
  15. Zhao, W.; Yang, D.; Duan, Y. Measuring Zero-Waste City Performance of a Coal Resource-Based Area in China with MCDM Approach. Math. Probl. Eng. 2022, 2022, 8479760. [Google Scholar] [CrossRef]
  16. Ren, F.-R.; Chen, K.-J.; Tian, Z.; Zhang, Y. The Investment and Treatment Efficiencies of Industrial Solid Waste in China’s Yangtze and Non-Yangtze River Economic Belts. J. Mater. Cycles Waste Manag. 2022, 24, 900–916. [Google Scholar] [CrossRef]
  17. Nepal, M.; Nepal, A.K.; Khadayat, M.S.; Rai, R.K.; Shyamsundar, P.; Somanathan, E. Low-Cost Strategies to Improve Municipal Solid Waste Management in Developing Countries: Experimental Evidence from Nepal. Environ. Resour. Econ. 2023, 84, 729–752. [Google Scholar] [CrossRef]
  18. Kurniawan, T.A.; Othman, M.H.D.; Liang, X.; Goh, H.H.; Gikas, P.; Kusworo, T.D.; Anouzla, A.; Chew, K.W. Decarbonization in Waste Recycling Industry Using Digitalization to Promote net-Zero Emissions and Its Implications on Sustainability. J. Environ. Manag. 2023, 338, 117765. [Google Scholar] [CrossRef] [PubMed]
  19. Gong, P.; Wang, L.; Liu, X.; Wei, Y. The Value of Social Media Tool for Monitoring and Evaluating Environment Policy Communication: A Case Study of the ‘Zero-Waste City’ Initiative in China. Energy Ecol. Environ. 2022, 7, 614–629. [Google Scholar] [CrossRef] [PubMed]
  20. Bosker, M.; Park, J.; Roberts, M. Definition Matters. Metropolitan Areas and Agglomeration Economies in a Large-Developing Country. J. Urban Econ. 2021, 125, 103275. [Google Scholar] [CrossRef]
  21. Chen, Y.-C. A Tutorial on Kernel Density Estimation and Recent Advances. Biostat. Epidemiol. 2017, 1, 161–187. [Google Scholar] [CrossRef]
  22. Zeng, L.; Xu, J.; Wang, Y.; Liu, Y.; Tang, J.; Wen, M.; Chen, Z. Day-Ahead Interval Scheduling Strategy of Power Systems Based on Improved Adaptive Diffusion Kernel Density Estimation. Int. J. Electr. Power Energy Syst. 2023, 147, 108850. [Google Scholar] [CrossRef]
  23. Yu, S.; Pu, Y.; Shi, L.; Yu, H.; Huang, Y. Regional Difference and Dynamic Evolution of Development Quality of Power Industry in China. Chin. J. Popul. Resour. Environ. 2023, 21, 1–12. [Google Scholar] [CrossRef]
  24. Wang, J.; Shi, Y.; Yu, H.; Zhang, K.; Wang, X.; Yan, Z.; Li, H. Temporal Density-Aware Sequential Recommendation Networks with Contrastive Learning. Expert Syst. Appl. 2023, 211, 118563. [Google Scholar] [CrossRef]
  25. Charnes, A.; Cooper, W.W.; Rhodes, E. Measuring the efficiency of decision making units. Eur. J. Oper. Res. 1978, 2, 429–444. [Google Scholar] [CrossRef]
  26. Banker, R.D.; Charnes, A.; Cooper, W.W. Some Models for Estimating Technical and Scale Inefficiencies in Data Envelopment Analysis. Manag. Sci. 1984, 30, 1078–1092. [Google Scholar] [CrossRef]
  27. Cheng, L.T.W.; Lee, S.K.; Li, S.K.; Tsang, C.K. Understanding Resource Deployment Efficiency for ESG and Financial Performance: A DEA Approach. Res. Int. Bus. Financ. 2023, 65, 101941. [Google Scholar] [CrossRef]
  28. Wu, Y.-C.; Lin, S.-W. Efficiency Evaluation of Asia’s Cultural Tourism Using a Dynamic DEA Approach. Socio-Econ. Plan. Sci. 2022, 84, 101426. [Google Scholar] [CrossRef]
  29. Andersen, P.; Petersen, N.C. A Procedure for Ranking Efficient Units in Data Envelopment Analysis. Manag. Sci. 1993, 39, 1261–1264. [Google Scholar] [CrossRef]
  30. Tone, K. A Slacks-Based Measure of Efficiency in Data Envelopment Analysis. Eur. J. Operat. Res. 2001, 130, 498–509. [Google Scholar] [CrossRef]
  31. Tone, K. A Slacks-Based Measure of Super-Efficiency in Data Envelopment Analysis. Eur. J. Operat. Res. 2002, 143, 32–41. [Google Scholar] [CrossRef]
  32. Seiford, L.M.; Thrall, R.M. Recent Developments in DEA: The Mathematical Programming Approach to Frontier Analysis. J. Econ. 1990, 46, 7–38. [Google Scholar] [CrossRef]
  33. Alam, K.M.; Xuemei, L.; Baig, S.; Yadong, L.; Shah, A.A. Analysis of Technical, Pure Technical and Scale Efficiencies of Pakistan Railways Using Data Envelopment Analysis and Tobit Regression Model. Netw. Spat. Econ. 2020, 20, 989–1014. [Google Scholar] [CrossRef]
  34. Kao, C. Interval Efficiency Measures in Data Envelopment Analysis with Imprecise Data. Eur. J. Oper. Res. 2006, 174, 1087–1099. [Google Scholar] [CrossRef]
  35. Jiang, T.; Zhang, Y.; Jin, Q. Sustainability Efficiency Assessment of Listed Companies in China: A Super-Efficiency SBM-DEA Model Considering Undesirable Output. Environ. Sci. Pollut. Res. 2021, 28, 47588–47604. [Google Scholar] [CrossRef]
  36. Li, G.; Zhou, Y.; Liu, F.; Wang, T. Regional Differences of Manufacturing Green Development Efficiency Considering Undesirable Outputs in the Yangtze River Economic Belt Based on Super-SBM and WSR System Methodology. Front. Environ. Sci. 2021, 8, 631911. [Google Scholar] [CrossRef]
  37. Chen, Y.; Liu, L. Improving Eco-Efficiency in Coal Mining Area for Sustainability Development: An Emergy and Super-Efficiency SBM-DEA with Undesirable Output. J. Clean. Prod. 2022, 339, 130701. [Google Scholar] [CrossRef]
  38. Sahar, L.; Foster, S.L.; Sherman, R.L.; Henry, K.A.; Goldberg, D.W.; Stinchcomb, D.G.; Bauer, J.E. GIScience and Cancer: State of the Art and Trends for Cancer Surveillance and Epidemiology. Cancer 2019, 125, 2544–2560. [Google Scholar] [CrossRef] [PubMed]
  39. Henriques, R.; Bacao, F.; Lobo, V. Exploratory Geospatial Data Analysis Using the GeoSOM Suite. Comput. Environ. Urban Syst. 2012, 36, 218–232. [Google Scholar] [CrossRef]
  40. Jenks, G.F. Generalization in statistical mapping. Ann. Assoc. Am. Geogr. 1963, 53, 15–26. [Google Scholar] [CrossRef]
  41. Xiao, W.; Lv, X.; Zhao, Y.; Sun, H.; Li, J. Ecological Resilience Assessment of an Arid Coal Mining Area Using Index of Entropy and Linear Weighted Analysis: A Case Study of Shendong Coalfield, China. Ecol. Indic. 2020, 109, 105843. [Google Scholar] [CrossRef]
  42. Cong, X.; Wang, S.; Wang, L.; Šaparauskas, J.; Górecki, J.; Skibniewski, M.J. Allocation Efficiency Measurement and Spatio-Temporal Differences Analysis of Digital Infrastructure: The Case of China’s Shandong Province. Systems 2022, 10, 205. [Google Scholar] [CrossRef]
  43. Xu, W.; Yu, W.; Jing, S.; Zhang, G.; Huang, J. Debris Flow Susceptibility Assessment by Gis And Information Value Model in a Large-Scale Region, Sichuan Province (China). Nat. Hazards 2013, 65, 1379–1392. [Google Scholar] [CrossRef]
  44. Zhu, Z.; Zhang, Y. Flood Disaster Risk Assessment Based on Random Forest Algorithm. Neural Comput. Appl. 2022, 34, 3443–3455. [Google Scholar] [CrossRef]
  45. Feng, Y.; Wu, S.; Wu, P.; Su, S.; Weng, M.; Bian, M. Spatiotemporal Characterization of Megaregional Poly-Centrality: Evidence for New Urban Hypotheses and Implications for Polycentric Policies. Land Use Policy 2018, 77, 712–731. [Google Scholar] [CrossRef]
  46. Chakraborty, P.; Chakrabarti, A.S.; Chatterjee, C. Cross-Border Environmental Regulation and Firm Labor Demand. J. Environ. Econ. Manag. 2023, 117, 102753. [Google Scholar] [CrossRef]
  47. Nagarajan, R.; Thirumalaisamy, S.; Lakshumanan, E. Impact of Leachate on Groundwater Pollution due to Non-Engineered Municipal Solid Waste Landfill Sites of Erode City, Tamil Nadu, India. Iran. J. Environ. Heal. Sci. Eng. 2012, 9, 35. [Google Scholar] [CrossRef] [PubMed]
  48. Guo, K.; Cao, Y.; Wang, Z.; Li, Z. Urban and Industrial Environmental Pollution Control in China: An Analysis of Capital Input, Efficiency and Influencing Factors. J. Environ. Manag. 2022, 316, 115198. [Google Scholar] [CrossRef] [PubMed]
  49. Petts, J.; Eduljee, G. Environmental Impact Assessment for Waste Treatment and Disposal Facilities. Fuel Energy Abstr. 1995, 4, 293. [Google Scholar]
  50. Zhang, B.; Lai, K.-H.; Wang, B.; Wang, Z. From Intention to Action: How Do Personal Attitudes, Facilities Accessibility, and Government Stimulus Matter for Household Waste sorting? J. Environ. Manag. 2019, 233, 447–458. [Google Scholar] [CrossRef]
  51. Liu, B.; Zhang, L.; Wang, Q. Demand Gap Analysis of Municipal Solid Waste Landfill in Beijing: Based on the Municipal Solid Waste Generation. Waste Manag. 2021, 134, 42–51. [Google Scholar] [CrossRef]
  52. Chai, M.; Jiao, J.; Han, Y. A Qualitative Study on the Influencing Factors of Public Participation in the Construction of “Waste-Free City” Exploratory Analysis Based on Grounded Theory. E3S Web Conf. 2021, 290, 03018. [Google Scholar] [CrossRef]
  53. Caglar, A.E.; Askin, B.E. A Path towards Green Revolution: How Do Competitive Industrial Performance and Renewable Energy Consumption Influence Environmental Quality Indicators? Renew. Energy 2023, 205, 273–280. [Google Scholar] [CrossRef]
  54. Puntoon, W.; Tarkhamtham, P.; Tansuchat, R. The Impacts of Economic Growth, Industrial Production, and Energy Consumption on CO2 Emissions: A Case Study of Leading CO2 Emitting Countries. Energy Rep. 2022, 8, 414–419. [Google Scholar] [CrossRef]
  55. Kacprzak, M.; Neczaj, E.; Fijałkowski, K.; Grobelak, A.; Grosser, A.; Worwag, M.; Rorat, A.; Brattebo, H.; Almås, Å.; Singh, B.R. Sewage Sludge Disposal Strategies for Sustainable Development. Environ. Res. 2017, 156, 39–46. [Google Scholar] [CrossRef]
  56. Mukherjee, A.G.; Wanjari, U.R.; Chakraborty, R.; Renu, K.; Vellingiri, B.; George, A.; C.R., S.R.; Gopalakrishnan, A.V. A Review on Modern and Smart Technologies For Efficient Waste Disposal and Management. J. Environ. Manag. 2021, 297, 113347. [Google Scholar] [CrossRef]
  57. Duan, N.; Li, D.; Wang, P.; Ma, W.; Wenga, T.; Zhong, L.; Chen, G. Comparative Study of Municipal Solid Waste Disposal in Three Chinese Representative Cities. J. Clean. Prod. 2020, 254, 120134. [Google Scholar] [CrossRef]
  58. Al-Akeel, K.A.; Al-Fredan, M.A.; Desoky, E.-S.M. Impact of Wastewater Discharge on The Plant Diversity, Community Structure and Heavy Metal Pollution of Range Plants in Eastern Saudi Arabia. Saudi J. Biol. Sci. 2021, 28, 7367–7372. [Google Scholar] [CrossRef] [PubMed]
  59. He, R.; Sandoval-Reyes, M.; Scott, I.; Semeano, R.; Ferrão, P.; Matthews, S.; Small, M.J. Global Knowledge Base for Municipal Solid Waste Management: Framework Development and Application in Waste Generation Prediction. J. Clean. Prod. 2022, 377, 134501. [Google Scholar] [CrossRef]
  60. Yuan, X.; Teng, Y.; Yuan, Q.; Liu, M.; Fan, X.; Wang, Q.; Ma, Q.; Hong, J.; Zuo, J. Economic Transition and Industrial Sulfur Dioxide Emissions in the Chinese Economy. Sci. Total. Environ. 2020, 744, 140826. [Google Scholar] [CrossRef] [PubMed]
Figure 1. Flow chart of ZW city construction.
Systems 11 00473 g001
Figure 2. Transformation curves of three types of efficiency in Shandong Province.
Systems 11 00473 g002
Figure 3. KDE curve.
Systems 11 00473 g003
Figure 4. Spatial classification of construction efficiency in ZW cities.
Systems 11 00473 g004
Figure 5. City distribution at each efficiency level.
Systems 11 00473 g005
Table 1. Evaluation system for efficiency indicators of zero-waste city construction.
Indicator TypePrimary IndicatorsSecondary Indicators
Input indicatorsLabor input A1Number of employees in the water conservancy, environment, and public facility management industries A11
Pollution control investment A2Wastewater, waste gas, and solid waste treatment investment A21
Domestic pollutant collection, transportation, and treatment A3Number of harmless treatment plants for domestic waste A31
Number of sewage treatment plants A32
Number of dedicated vehicles for urban sanitation A33
Environmental pressure from daily life A4Amount of sewage discharge A41
Amount of household waste cleared and transported A42
Industrial energy consumption A5Industrial energy production consumption A51
Industrial water consumption A52
Expected OutputPollution control effectiveness B1Sewage treatment capacity B11
Cleaning area of sanitation facilities B12
harmless treatment capacity of household waste B13
Comprehensive utilization amount of general solid waste B14
Disposal amount of hazardous waste B15
Environmental illegal control effectiveness B2Number of environmental penalty cases B21
Unexpected OutputWaste output level C1Industrial sulfur dioxide C11
Industrial wastewater discharge C12
Generation intensity of general solid waste C13
Generation intensity of hazardous waste C14
Table 2. Ranking of each city for three average efficiencies.
NameAverage Construction EfficiencyRankingAverage Pure Technical EfficiencyRankingAverage Scale EfficiencyRanking
Qingdao1.09211.10750.9864
Jining1.08721.09970.9893
Binzhou1.08131.15110.9417
Yantai1.05641.072110.9865
Jinan1.05251.055130.9971
Zibo1.03561.043140.9922
Zaozhuang1.00771.10840.9118
Rizhao0.99781.09490.9099
Tai’an0.99691.12020.89114
Dongying0.988101.09580.90511
Weihai0.983111.10830.88915
Dezhou0.978121.082100.90412
Heze0.967131.063120.90810
Linyi0.956140.980160.9656
Liaocheng0.936151.10360.84516
Weifang0.897160.998150.89913
Disclaimer/Publisher’s Note: The statements, opinions and data contained in all publications are solely those of the individual author(s) and contributor(s) and not of MDPI and/or the editor(s). MDPI and/or the editor(s) disclaim responsibility for any injury to people or property resulting from any ideas, methods, instructions or products referred to in the content.

