
Spillover Effects and Performance Optimization of Air Pollution Control Policies: Evidence from the Yangtze River Delta Region, China


1
Institute for Global Innovation and Development, East China Normal University, Shanghai 200062, China
2
School of Urban and Regional Science, East China Normal University, Shanghai 200241, China
3
Institute of Eco-Chongming, East China Normal University, Shanghai 202162, China
*
Author to whom correspondence should be addressed.
Systems 2023, 11(8), 418; https://doi.org/10.3390/systems11080418
Submission received: 10 June 2023
/
Revised: 27 July 2023
/
Accepted: 7 August 2023
/
Published: 11 August 2023
Abstract
:Government policy is crucial to control air pollution, while industrial structure upgrading and green technology progress are needed to optimize air pollution control performance (APCP). Meanwhile, policy spillovers from one region to another affect the APCP. This study applied systems theory to explain the mechanisms that drive both environmental policy spillover and APCP. We evaluated the APCPs of 41 cities in the Yangtze River Delta region from 2006 to 2020 using a super-efficiency SBM-DEA model. We then analyzed the paths by which industry and technology drive APCP using a spatial Durbin model (SDM) and investigated heterogeneity across different regional governance groups. The effects generated by the regulatory spillover of air pollutants were decomposed into four subsystems: chain transmission effect, vibration effect, ripple effect, and halo effect. The results show the following: (1) Throughout the study period, the APCP of most of the regional governance groups in the Yangtze River Delta region showed a fluctuating trend with continuous improvement. The APCP was higher and more stable in the Zhejiang Province in the southeast, and lower and more drastic in the Jiangsu and Anhui Provinces in the north, and shows a significant positive spatial correlation. (2) Industrial structure upgrading and green technology progress had different impact paths on the APCP. Industrial structure upgrading had a significant indirect contribution to the APCP, but the direct effect was not significant. Green technology progress had a significant direct inhibitory effect and an indirect promoting effect on the APCP. (3) In the optimization path of the APCP, industrial structure upgrading played a more important role than green technology progress, but they did not reinforce each other’s enhancement of the APCP. (4) There was regional heterogeneity in the impacts of industry and technology on the APCP. The paths and actual effects of industry and technology on the APCP varied greatly among different regional governance groups.
1. Introduction
China has become the world’s largest energy consumer [1], and fossil fuels are the main cause of both greenhouse gas emissions and air pollution (“haze”) in the nation. Therefore, air pollution and climate change have become the most important environmental issues in China [2]. Since 2012, China’s economic development model has gradually changed from high-speed development to high-quality development, and a consensus has formed around the concept of protecting the environment [3]. However, economic growth and pollution are often symbiotic, and China is still in the industrialization and urbanization stage, which poses a great threat to the environment [4]. Due to the public good character of the environment, the government should be the main provider of environmental protection [5].
Among air pollution events, fine particulate matter (PM2.5) pollution is particularly problematic [6]. PM2.5 poses a serious risk to human life, livelihoods, and life satisfaction [7]. It can reduce visibility, leading to frequent traffic accidents [8]. PM2.5 aggravates chronic respiratory and cardiovascular diseases, damages human lung tissue, increases the risk of emergency hospitalization, and is a carcinogen [9,10,11]. Air pollution can increase the prevalence of asthma in children and affect the cognitive abilities of older women [12,13].
Haze pollution has strong spatial spillover and spatial correlation characteristics and is more likely to spread rapidly in a larger spatial area with more complex spatial structural characteristics and stronger spatial interaction. Therefore, air pollution control requires a collaborative governance system with the participation of multiple subjects [14]. As early as 1998, China proposed the “two control zones” for acid rain and sulfur dioxide governance, and has since issued several air pollution control policies, with emphasis on joint cross-regional air pollution control [15]. In 2013, the State Council of China released the Air Pollution Prevention and Control Action Plan. In 2014, three provinces (Jiangsu, Zhejiang, and Anhui) and one city in the Yangtze River Delta region (Shanghai), together with eight ministries and commissions of the State Council, formed the Yangtze River Delta Regional Air Pollution Prevention and Control Coordination Mechanism. The development and implementation of these policies are crucial for the Yangtze River Delta region to win the battle for blue skies.
Regional air pollution control is led by the government, with participation by business enterprises and the public [16]. Because of the government’s leadership role, it is important to analyze both the linkages generated by government agencies in making policies and the externalities generated by the policies themselves. Between or within regions, more mature policies create spillover effects of policy-making subjects on policy-making receptors [17]. This study used systems theory to depict the spillover phenomenon of air pollution control policies in the Yangtze River Delta region.
Under the current administrative system in China, the government’s financial allocation is the main source of funding for environmental governance, which is very limited relative to the need for environmental governance. Therefore, an evaluation of air pollution control performance (APCP) can provide a basis for the government to improve the allocation of this limited funding. The existing literature on performance evaluation methods includes data envelopment analysis (DEA) [18], the Malmquist production index [19], parametric stochastic frontier analysis (SFA) [20], and the standardized mathematical form of ERRS [21] for evaluation from both input and output aspects, as well as entropy, hierarchical analysis (AHP), and factor analysis (PCA) for unilateral evaluation [22]. In terms of evaluation perspectives, there have been studies on wastewater treatment efficiency [23], rural environmental governance efficiency [24], and urban environmental governance efficiency [25].
Despite government intervention in environmental protection, air pollution is still severe in the Yangtze River Delta region due to both population growth and economic activities. This raises an urgent need to optimize the performance of air pollution control. Because reducing air pollution depends on energy conservation and emissions reduction, industrial transformation and scientific and technological progress are key [26,27]. Industrial restructuring and green technology innovation have the potential to achieve long-term, sustainable economic growth [28]. Therefore, industry and technology can serve as twin engines for air pollution control performance optimization.
Green technological innovation is conducive to the improvement in environmental quality [29,30]. The available literature shows that green technologies are effective in reducing emissions of greenhouse gases and other pollutants and are an important tool for haze control [31,32]. The Porter hypothesis was the first to suggest that environmental regulation has a catalytic effect on technological innovation that compensates for the environmental compliance costs of firms, improves their competitiveness, and reduces polluting emissions [33]. At the micro level, environmental policies create incentives for enterprises to upgrade their production processes. As environmental regulations intensify, the production and management costs of high-energy and high-polluting enterprises will increase, and their profits will shrink; therefore, they may choose to relocate to other areas, and thus, upgrade the industrial structure at the local city level [34]. At the macro level, local governments are expected to systematically adjust the industrial structure of cities to promote an increase in the proportion of tertiary (service) industries in cities and to encourage the low-carbon transformation of traditional industries [35]. In general, industrial structure upgrading has a negative moderating effect on the relationship between economic growth and environmental pollution [36]. Technology spillovers affect the concentration of polluting firms, and the type of technology spillover determines the validity of the pollution haven hypothesis [37]. But stricter environmental policies do not necessarily lead to the emergence of a pollution haven [38]. Under a given level of production technology, technological innovation brought about by environmental policies can increase the rate of economic growth, and the indirect effect dominates the direct effect [39]. Therefore, this study focused on revealing the intertwined role played by industrial structure upgrading and green technology progress in the evolution of air pollution control performance in the Yangtze River Delta region from the perspective of spatial spillover effects.
In summary, this study expanded upon and complemented previous research in the following ways: (1) Systems theory was applied to explain the mechanism of environmental policy spillover to depict the phenomenon of regional policy spillover and to explore the association between air pollution governance performance and policy enactment. (2) Since pollutants shift geographically and spatially, using evidence for all polluting emissions would cause a large bias between air pollution control performance and actual values; therefore, this study avoided these errors by using the urban PM2.5 concentration as the unexpected output of air pollution control performance (APCP). (3) In terms of a research perspective, this study took industry and technology as the entry point to explore the improvement path of air pollution control performance and used the spatial Durbin model to examine the direct and indirect effects of industrial structure upgrading and green technology progress on air pollution control performance optimization. (4) Based on the existing collaborative air pollution governance plan in the Yangtze River Delta region, this study analyzed the effects and pathways of industry and technology on air pollution control performance in different regional governance groups.
This paper is divided into the following sections: Section 2 uses system theory to describe the spillover effects of air pollution control policies. Section 3 presents the study methods and research data, as well as the existing regional air pollution collaborative governance plan in the study area. Section 4 evaluates air pollution control performance. Section 5 presents the results of the empirical analysis of the optimization path of air pollution control performance. Section 6 is the conclusion and discussion.
2. Regional Air Pollution Control Policy Spillover Effects
2.1. Mechanism of Policy Spillover Effect
Among the systems theory doctrines, Prigogine, who is the founder of dissipative structure theory, was the first to accurately propose and use the concept of “self-organization” [40]. In systems theory, the self-organization theory and dissipative structure theory provide new perspectives and tools for analyzing the mechanisms of policy spillover realization, thus better describing those processes that form ordered structures [41,42]. Rising or falling and collaboration, as forms of self-organization, are the two most important mechanisms in policy spillover. Based on systems theory, the effects generated by the upward and downward regulatory spillover of air pollutants are decomposed into four subsystems: chain transmission effect, vibration effect, ripple effect, and halo effect. As shown in Figure 1, the chain transmission time, vibration amplitude, ripple range, and halo intensity involved in each subsystem are constantly changing, and the collaborative mechanism can make the subsystems reach a new steady state.
2.2. Chain Transmission Effect
The chain transmission effect of policy spillover refers to the process of continuous transfer of policy energy from point to point within the same environmental regulation region. The more mature policy development within a policy-rich region will have a demonstration effect on a less-developed point. Since the points are located in the same policy growth environment and the compatibility between policies is high, the policy of the spillover subject can easily develop in the receptor. After the original spillover parent’s example spills over to the original receptor, the original spillover receptor becomes a new spillover subject and generates a force on the new receptor, forming an energy-driven policy spillover.
This study empirically analyzed the chain transmission effect of peer-to-peer policy spillover in the same region by taking the policy documents of environmental regulation in several cities in the Yangtze River Delta region as examples. As shown in Figure 2, Suzhou City promulgated the Measures for the Prevention and Control of Dust Pollution in 2012, which were the earliest promulgated measures among the cities in the region and spatially correlated regions in the policy designation for air pollution control in the 12th Five-Year Plan period. After 2014, Shanghai promulgated the Shanghai Air Pollution Prevention Regulations, and it can be inferred that the chain transmission effect of Shanghai’s policy spillover to Suzhou’s policy was relatively rapid. This spillover is often achieved by a government seeking new ideas in the short term and bringing in policies with greater energy than in the policy pioneer region. This saves the cost of repeated efforts to formulate similar policies, thereby promoting the green development of the regional economy. When the Shanghai policy reaches the energy threshold for the chain transmission effect to occur, it will act as a new spillover subject, allowing the policy spillover chain to continue.
2.3. Vibration Effect
The vibration effect of policy spillover refers to the fact that when a policy is implemented in a pilot environmental regulation site in the same region, it implicitly affects other cities that have not directly enacted policy documents on environmental regulation, and it is constantly fine-tuned by the policy implementation performance of the policy spillover parent and the compatibility of the policy spillover recipient. During this process, the utility of the policy spillover can appear unstable or even negative in this process.
This study took the promulgation of the Hangzhou Air Pollution Control Regulations in 2016 as the entry point to explore the changes in PM2.5 concentrations in Hangzhou and other cities in this province before and after the implementation of the regulations in order to describe the vibration effects of policy spillover. As shown in Figure 3, Wenzhou and Quzhou showed an increase in atmospheric PM2.5 concentration levels during the same period, which was considered a negative vibration. This occurred for two main reasons: (1) Quzhou’s ecological environment itself remained relatively good, and therefore, it did not adopt a stronger environmental regulation policy in the short term. (2) Wenzhou is geographically and spatially distant from Hangzhou, and the policy structure was less compatible due to the difference in industrial structure; therefore, the relevant regulatory policies had not been implemented there. The atmospheric PM2.5 concentration levels in the rest of the cities were decreasing during the same period and were considered positive vibrations.
2.4. Ripple Effect
The ripple effect of policy spillover refers to the subtle force of one region’s policy on another region’s policy after its implementation. Due to the development cycle of the environmental policy of the policy spillover subject itself and the long duration of air pollution control, the policy of the region can be effectively imparted to another region only after a period of practical testing; too hasty an introduction will, instead, cause deviation between the policy goals and policy effects of the receptor. At the same time, due to the very different policy environment and natural environment in each region, the initial recognition of the policy spillover by the regional spillover receptors is weak, and it is not until the policy environment of the spillover receptors is gradually followed up that the environmental policies of the spillover subjects can have a substantial impact on air pollution in the receptor regions.
Figure 4 illustrates the temporal trends of average PM2.5 concentrations in the Shanghai, Jiangsu, Zhejiang, and Anhui Provinces from 2006 to 2020. This study used the Three-Year Action Plan for Environmental Protection implemented in Shanghai as the starting point to illustrate the ripple effect of policy spillover. In the fifth round of the Three-Year Action Plan for Environmental Protection, it is stated that the implementation of a special focus on air environment protection should strengthen the prevention and control of compound air pollution, such as PM2.5. Because of the ripple effect of policy spillover between regions, the effect of air pollution control in the four regions has not been the same. Due to the spatial correlation of air pollution, the average PM2.5 concentrations in the Yangtze River Delta region have all decreased to varying degrees since 2011, and the average PM2.5 concentration changes in the future are likely to maintain the same declining trend [43]. Overall, the air quality in the Yangtze River Delta region was ranked from highest to lowest as follows: Zhejiang, Shanghai, Anhui, and Jiangsu.
2.5. Halo Effect
The halo effect of policy spillover refers to the rapid indirect diffusion of environmental regulation from point to point in some environmental-regulation-rich regions and the indirect diffusion of policy follow-up from point to point in non-environmental-regulation-rich regions in the process of integrated regional planning. We measured the strength of local environmental governance by selecting “environmental protection” words from government work reports and calculating their proportion of the frequency of words in the government working reports [44].
First, based on the above indicators, we selected the year when 41 cities in the Yangtze River Delta region had the strongest environmental governance during the study period and took that year as the richest year in terms of environmental regulation in that city. We then divided the richest year in terms of environmental regulation policies in all cities by three five-year plans. Second, the environmental management intensity (%) of each city in the year with the richest environmental regulation policy was marked on the map with black dots, and the environmental management intensity of each city was indicated by size. Again, the stages of each city in the year with the richest environmental regulation policy were indicated by the base color, from dark to light, to indicate the time sequence. Finally, the evolution of the sequential order was used to determine the direction of policy transmission in geographic space, and the intensity of the halo was judged by the peak of local environmental governance efforts. The results are shown in Figure 5.
Figure 5 shows that the peak of the local environmental management efforts during the 11th Five-Year Plan period (2006–2010) was mainly concentrated in southern Jiangsu Province and northeastern Zhejiang Province, but the policy implementation during this period was not as strong as during the 12th Five-Year Plan period (2011–2015). The main diffusion direction of environmental regulation during this period was northwest and southwest, i.e., to the southwest of Zhejiang Province and the northern cities of Jiangsu Province, such as Lishui, Quzhou, and Yancheng. During the 12th Five-Year Plan period (2011–2015), local environmental regulation reached its maximum, mainly in the southwest of Zhejiang and the northern part of Jiangsu. At the same time, the main diffusion direction of environmental regulation during this period was toward Anhui Province, and thus, most of the areas in Anhui Province reached their peak in the 13th Five-Year Plan period (2016–2020). However, the peak was smaller than that in Jiangsu, Zhejiang, and Shanghai. This indicates that the intensity of the policy diffusion halo in the first phase (2006–2010) was greater than that in the second phase (2011–2015).
3. Methods and Data
3.1. Methods
3.1.1. Data Envelopment Analysis
In this study, a non-radial SBM model based on slack variables was used to measure air pollution control performance. This not only solved the problem of slack changes in inputs and outputs but also incorporated unexpected outputs into the efficiency evaluation [45]. A super-efficiency model that could more accurately rank multiple decision-making units (DMUs) was also introduced. Here, the evaluated DMUs were removed from the boundaries of efficiency and the distances from the removed DMUs to the new efficiency boundaries, which were formed on the basis of the remaining DMUs, were recalculated [46]. Therefore, this study incorporated the unexpected output into the SBM model and combined it with the super-efficiency DEA model to ensure the accuracy of the measurement results and to better compare and rank the regions. The numerical expression of the super-efficiency model is given as Equation (1):
where denotes the number of decision units, i.e., the number of cities; each DMU consists of input , expected output , and unexpected output ; denotes an element in the input matrix; denotes an element in the expected output matrix; denotes an element in the unexpected output matrix; and is the air pollution control performance value. A larger indicates a higher level of air pollution control performance.
3.1.2. Malmquist Index
The air pollution control performance value measured by the super-efficiency SBM-DEA model is only a static description of air pollution control performance, while the Malmquist model, as a non-parametric linear programming method, is a good complement to the SBM model. The Malmquist method dynamically analyzes the changes in efficiency values between the two years before and after. This bridges the gap created by the limitation that the traditional DEA model cannot dynamically analyze the changes in efficiency.
In this study, the global Malmquist index (GML) model was selected. It is the sum of the periods as the reference set, as denoted by Equation (2):
Although the two adjacent periods refer to the same global frontier in the calculation of the Malmquist index, the efficiency changes are still calculated using the respective frontiers: Equation (3) for the GML, Equation (4) for the efficiency change index (EC), and Equation (5) for the technology change index (TC).
where indicates the change in technology change from period to period . When , it means that technological change has increased, and vice versa. indicates the effect of the efficiency change index on the trend of efficiency change from period to period . When , it means that the efficiency has improved, and vice versa.
3.1.3. Spatial Econometric Model
Because of the spatial correlation of air pollution and the spillover effect of air pollution control policies, air pollution control performance might also be spatially correlated. Since traditional econometric models are not applicable, this study used spatial econometric models in the empirical analysis of the optimal path of air pollution control performance [47,48]. Equation (6) gives the method of ordinary least squares (OLS), Equation (7) gives the spatial lag model (SLM), Equation (8) gives the spatial error model (SEM), and Equation (9) gives the spatial Durbin model (SDM). Equation (9) includes the spatial lag term of the dependent and independent variables, which was the main measurement method of this study. The Euclidean distance between cities was calculated based on the latitude and longitude coordinates of each city in the Yangtze River Delta region, and the inverse of this distance was used as the element of the weight matrix to construct the geographic distance spatial weight matrix.
where represents the dependent variable; represents the independent variables; represents an spatial weight matrix; represents the coefficient of independent variables; and represent the coefficients of spatial lag terms of dependent variables and independent variables, respectively; and and are the error terms.
3.2. Variable Settings
3.2.1. Dependent Variable
The measurement of air pollution control performance (APCP) in the Yangtze River Delta region based on the DEA should not only consider the economic benefits of policy implementation but also reflect the ecological benefits. Therefore, this study constructed an evaluation system that focused on the air pollution control performance in the Yangtze River Delta region. The system included three aspects of inputs, expected outputs, and unexpected outputs. The indicators are shown in Table 1. In terms of air pollution control inputs, labor, capital, and land were mainly considered. Among them, the proportion of total employment in water, environment, public facilities management, and non-private employment was used as a proxy for the labor factor; the proportion of investment in environmental pollution control relative to GDP was used as a proxy for the capital factor; and the greening coverage of built-up areas was employed to indicate the land factor input [49]. In terms of the expected output, the GDP produced per unit of CO2 emissions was adopted to measure economic benefits, which is also known as carbon productivity [50]. Ecological benefits are measured by the harmless domestic waste treatment rate and industrial solid waste treatment rate [51]. In terms of the unexpected output, mainly considering air pollution, the annual average concentration of fine particulate matter (PM2.5) was taken as the output of air pollution control [52].
3.2.2. Independent Variables
The core explanatory variables included upgrading industrial structure (IS) and green technology progress (TP). The upgrading of industrial structure indicators reflects the internal adjustments of industry and the changes in the whole industrial structure. Therefore, we used the proportion of output value of the tertiary industry to characterize the upgrading of industrial structure [53]. The green technology progress indicator reflects green substantive innovation. Therefore, according to the International Patent Classification (IPC) code of green patents, the number of green patent applications was searched for in the patent database of the State Intellectual Property Office of China by year and region. The level of substantive green innovation was measured using the number of green invention patent applications [54]. In addition, an interaction term (IS*TP) of industrial structure upgrading and green technology progress was introduced to examine whether their combined effect enhanced their impact on air pollution control policy performance (APCP).
The control variables were the economic development level (ED), urbanization (UR), traffic density (TD), temperature (TE), and precipitation (PR). Because the level of economic development is an important factor that affects air quality, GDP per capita was used to measure the level of economic development (ED) [55]. Because urbanization changes the natural environment and also affects the diffusion of PM2.5, the urban population ratio was used to characterize the level of urbanization (UR) [56]. Urban transportation facilities can have an impact on haze pollution, and increasing urban transportation infrastructure can improve air quality in cities; therefore, the ratio of highway area to urban land area was used to measure the traffic density (TD) [57]. It is well documented that climate has an impact on atmospheric PM2.5 pollution, with rising temperatures worsening PM2.5 pollution and precipitation causing atmospheric fine particulate matter to sink to the ground (rather than remain as ambient air pollution) [58,59]. Therefore, this study used the annual average temperature of the region as the temperature variable (TE) and the annual precipitation of the region as the precipitation variable (PR). In addition, to reduce the heteroscedasticity, the two variables of green technological progress (TP) and economic development level (ED) were logarithmically treated in the empirical model. Descriptive statistics of the respective variables are shown in Table 2.
In summary, the spatial Durbin model that tested the impact of industry and technology on air pollution control performance constructed in this study is shown in Equation (10):
3.2.3. Study Data and Area
Data for the study were obtained from the China City Statistical Yearbook (2007–2021) and the statistical yearbooks of each province (2007–2021). Green patent data applications were obtained from the patent search system of the State Intellectual Property Office (SIPO), and CO2 emissions were obtained from the China Carbon Emissions Database (CEADs). Fine particulate matter (PM2.5) data were obtained from the haze concentration raster data (annual average 0.01° × 0.01° resolution) from the website of the Atmospheric Composition Analysis Group at Dalhousie University (http://fizz.phys.dal.ca/-atmos/martin/ (accessed on 1 October 2022)) and parsed into urban PM2.5 concentration data using ArcGIS software. The amount of investment in pollution control was obtained from the China Environmental Statistics Yearbook (2006–2020). The investment amount of each province was decomposed to the city level using nighttime lighting data. Some missing values were supplemented by linear interpolation.
The Yangtze River Delta region is located in the lower reaches of the Yangtze River, bordering the Yellow Sea and the East China Sea. It is one of the regions with the most active economic development, the highest degree of openness, and the strongest innovation capacity in China. The specific location of the study area is shown in Figure 6. With reference to the existing literature for the Yangtze River Delta regional air pollution collaborative governance plan, the 41 cities in the Yangtze River Delta are divided into six regional governance groups [60], namely, the Shanghai regional governance group, Shaoxing regional governance group, Hangzhou regional governance group, Nanjing regional governance group, Hefei regional governance group, and Xuzhou regional governance group.
4. Spatial and Temporal Dynamics of Air Pollution Control Performance
4.1. Measuring the Air Pollution Control Performance
The air pollution control performance of 41 cities in the Yangtze River Delta region from 2006 to 2020 was measured based on the theoretical approach of the super-efficiency SBM-DEA model and MAXDEA software. Due to the limitation of space and for the convenience of analysis, the average performance values of each city from 2006 to 2020 were ranked, and the results are shown in Table 3. It can be observed that the cities at the top were mainly from Zhejiang Province, while the cities at the bottom were mainly from Anhui Province. Most of the cities in Jiangsu Province were in the middle position in terms of air pollution control performance. Overall, Zhejiang Province has the highest value and Anhui Province has the lowest value in terms of urban air pollution control performance.
Meanwhile, the performance values of each regional governance group from 2006 to 2020 were averaged year by year, and a line graph was drawn, as shown in Figure 7. The Shaoxing regional governance group, compared with the other five groups, fluctuated the least throughout the study period, with little change in performance values in the first and second periods; it generally maintained a stable trend and was ranked first among the six regional governance groups. The Hangzhou regional governance group, which fluctuated more throughout the study period, had relatively large declines in 2010 and 2017 but showed a slow upward trend overall. The Shanghai regional governance group had a similar trend to the Hangzhou regional governance group. However, it is noteworthy that Shanghai had a more obvious peak in 2008, followed by a decline until 2011, and then a fluctuating upward trend in the middle and later part of the study period; the performance value began to exceed that of the Hangzhou group after 2016. This indicates that the Shanghai regional governance group and Hangzhou regional governance group had a higher degree of linkage in atmospheric environmental regulation, but both were lower than the Shaoxing regional governance group in terms of governance performance. The Nanjing regional governance group, Hefei regional governance group, and Xuzhou regional governance group were close to overlapping in overall trends, and all of them were lower than Shanghai, Shaoxing, and Hangzhou regional governance groups. It is noteworthy that regions other than the Hangzhou and Shaoxing regional governance group reached a more obvious peak in 2008. This feature is similar to the curve of the Shanghai regional governance group, which shows an overall fluctuating upward trend after 2011, but does not exceed the curve of the Hangzhou governance group. Therefore, it was presumed that the southeast region of the Yangtze River Delta had better air pollution control performance than the northwest region. In addition, the outbreak of the novel coronavirus in China at the end of 2019 could have caused some impact on the data during our study period. However, many existing studies showed that the epidemic outbreak has generated both a negative impact on the economy and income, as well as a positive slow-down impact on air pollution due to the shutdown of many enterprises’ productions in China. There was also a reduction in pollution controls during the epidemic period, resulting in a non-drastic change in the APCP between 2019 and 2020 [61,62].
4.2. Decomposition of Air Pollution Control Performance and Analysis of Its Temporal Evolution
In the previous section, the measured air pollution control performance of each region in each year is only a static efficiency value. In order to better measure the change in technology level and observe the dynamic change in air pollution control performance level each year, the global Malmquist index (GML) was chosen to measure the change in technology level in different periods. The global Malmquist index can be decomposed into the efficiency change index (EC) and technology change index (TC). The EC indicates the advantages and disadvantages of urban air pollution control methods and structures, and the TC indicates the innovation of urban air pollution control technologies. When the GML is greater than 1, total factor productivity has improved. When the GML is less than 1, the total factor productivity has decreased. Finally, the geometric mean of each year is taken to reflect the average change in the total factor productivity in the Yangtze River Delta region from 2006 to 2020 in a more representative way.
As can be seen from Table 4, the GML in the Yangtze River Delta region grew by 6.1% from 2006 to 2020, with the EC growing by 7.6% and TC by 4.2%. The overall increase in the TC was not large, which indicates that additional green technological innovation is needed to combat air pollution in the Yangtze River Delta region. The growth in the EC was large; the EC was less than 1 only in 2016–2017, and all three indices were greater than 1 in the remaining years. This indicates that the air pollution control performance in the Yangtze River Delta region improved over the long term.
As Figure 8 shows, the fluctuation of the GML and TC were almost synchronized and differed significantly from the fluctuation of the EC. It is noteworthy that the average value of the TC and the average value of the GML of the Shanghai regional governance group were less than 1. The average total factor productivity index and the EC and TC of the other five regional governance groups, except the Shanghai regional governance group, were all greater than 1. This indicates that, overall, the air pollution control performance in the Yangtze River Delta region improved.
4.3. Spatial Analysis of Air Pollution Control Performance
Based on the geographic distance weight matrix already constructed in Section 3.1.3, this section used Moran’s I to test for the region-wide spatial correlation of air pollution control performance. The results are shown in Table 5. During the study period, Moran’s I was positive in all years except for 2017, 2018, and 2019, and passed the 1% significance level for the positive years. Thus, as a whole, the interregional air pollution control performance had a positive spatial correlation, i.e., cities with higher levels of air pollution control performance and cities with the same high values were geographically and spatially proximate and not independently distributed. In view of the spatial correlation exhibited by the air pollution control performance, the spatial factor could not be neglected when studying its optimization path and performance improvement. A spatial panel econometric model could be used to avoid this bias caused by controlling the spatial factor as much as possible.
According to the air pollution control performance evaluation results of 41 cities in the Yangtze River Delta region from 2006 to 2020, the performance values in 2006, 2011, 2016, and 2020 were selected for visualization and graded by the natural fracture method using ArcGIS 10.6. The grading and visualization results are shown in Figure 9. The air pollution control performance of the Yangtze River Delta region was relatively high and stable in the cities in the southeast region, while the cities in the northwest region changed dramatically and unevenly, showing the characteristics of contiguous clustering development on the whole. From 2006 to 2011, cities in Anhui Province, such as Bozhou and Chizhou, had significant declines, while cities in southern Jiangsu, such as Suzhou, Wuxi, and Changzhou, had more significant increases. Cities in northern Jiangsu also increased but not significantly, and none of the cities in Zhejiang Province changed much. From 2011 to 2016, cities in the central Yangtze River Delta region experienced dramatic changes, with Xuancheng, Huzhou, and Jiaxing decreasing in performance values, while Hefei, Nanjing, and Nantong increased. Cities in northern Anhui and Jiangsu, such as Xuzhou, Huaibei, and Bozhou, also increased in performance values. However, Zhejiang Province remained in a relatively stable state. From 2016 to 2020, the performance value of Jinhua in Zhejiang Province decreased, and there was a significant change in Zhejiang Province compared with the previous two phases of that period. The performance values in central regions, such as southern Jiangsu and Anhui, increased significantly and tended to be spatially balanced. Most cities in the northern part of the Yangtze River Delta, such as Lianyungang, Suqian, and Suizhou, remained at a lower level.
5. Impact of Industry and Technology on Air Pollution Control Performance
5.1. Results of Spatial Econometric Analysis
5.1.1. Parameter Estimation
According to the results of Section 4.3 regarding the global Moran’s I, the air pollution control performance in the Yangtze River Delta shows a relatively strong spatial correlation, and thus, the spatial econometric model was applicable. Based on the above evidence that air pollution control performance had spatial spillover effects, this study adopted relevant spatial measures for parameter estimation based on controlling for both temporal and spatial effects, i.e., a spatial econometric model with spatio-temporal dual fixed effects. In order to enhance the precision and accuracy of the parameter estimation results, the least squares method, spatial lag model, and spatial error model were first used to estimate the parameters of the effects of industrial structure upgrading, green technology progress, and related control variables on air pollution control performance.
According to the OLS model results in column (1) of Table 5, the industrial structure upgrading and related control variables had different degrees of influence on air pollution control performance and passed different levels of significance tests. According to the SLM and SEM in columns (2) and (3) of Table 6, green technological progress and interaction terms had significant effects on air pollution control performance. The Lagrangian multiplier (LM) test for both the spatial lag model and the spatial error model passed the 1% significance test, and the results indicate that both the spatial lag and residual terms of the dependent variable were spatially correlated. According to the results of the LR tests in columns (2) and (3), the spatial Durbin model could not be reduced to the spatial lag model (SLM) or the spatial error model (SEM), i.e., SLM and SEM were not applicable in this study.
The possibility of reverse causality between the independent and dependent variables was the main source of endogeneity in the econometric model of this study, and this needed to be controlled effectively. It was very difficult to find instrumental variables that satisfy correlation, exogeneity, and exclusion for each explanatory variable, and the existing literature indicates that if the error term of the model is determined by the current period perturbation only, endogenous variables with a one-period lag can be taken to replace the current period values to cope with the endogeneity problem [63]. Therefore, on the basis of the baseline regression analysis, the parameters were further re-estimated after taking a one-period lag of the explanatory variables to mitigate possible endogeneity due to bidirectional causality. In Table 7, columns (1) and (3) represent the same model, and columns (2) and (4) represent the model with one period lag of the explanatory variables. The Wald tests were all passed at the 1% significance level, which was consistent with the LR test; therefore, we focused on the estimation results of the spatial Durbin model. The Hausman test was also used, and the Hausman statistics obtained were 29.81 and 37.63 for the models without and with a lag, respectively, which passed the 1% significance test; because the true model did not become an individual random effects model, it was reasonable to use spatio-temporal double fixed effects. From the parameter estimation results, all the core explanatory variables that passed the significance test had the same direction of influence on air pollution control performance, whether or not the explanatory variables lagged. This indicates that the estimation results of each variable were relatively robust.
5.1.2. Spatial Effect Decomposition
Owing to the significant non-zero coefficient of the spatial lag term of air pollution control performance, the parameter estimation results of the spatial Durbin model for the respective variables were biased by point estimates, the regression coefficients of the respective variables did not reflect the actual effects of the independent variables on the dependent variable, and the significance of the regression coefficients did not reflect whether the effects of the independent variables on the dependent variable really existed. Therefore, the direct effect, indirect effect, and total effect were used to describe the effects of the explanatory variables on the explained variable in the above spatial econometric model [47,48]. The results are shown in Table 8, with columns (1) to (3) showing the results of the baseline regression and columns (4) to (6) showing the results of the regression with a one-period lag of the explanatory variables.
- (1)
- Industrial structure upgrading had significant indirect promotion and positive spillover effects on air pollution control performance, while the direct effects were not significant. The path of the effect of industrial structure upgrading on air pollution control performance depended mainly on the spatial spillover effects. Under strict environmental regulations, resource-intensive and pollution-intensive industries are restricted by production costs and barriers to entry for enterprises, prompting the relocation and downsizing of polluting industries in the region, thereby improving air quality [64]. Since the inputs of environmental regulation are huge in comparison, the marginal output of industrial structure upgrading induced by environmental regulation in the region cannot compensate for the increase in inputs and the reduction of pollutants. The tertiary industry has a positive effect on water and air quality, and air pollutants have a significant spatial correlation; as a result, the improvement in local air quality leads to the improvement in the air quality in neighboring regions, thus optimizing the air pollution control performance of neighboring regions [65].
- (2)
- Green technological progress had a significant inhibitory direct effect on air pollution control performance, as well as a significant promotional indirect effect. It had an overall positive spillover effect on the APCP, though the coefficient of its total effect is much smaller than that of the total effect of industrial structure upgrading. The promotion of green technology requires environmental regulation to give enterprises the incentive to invest in energy-saving technologies and to adopt cleaner production methods [66]. However, the implementation of environmental regulation increases the environmental costs faced by both the government and enterprises, offsetting the effects on productive investment by enterprises and on government organization and management, thus leading to an increase in the government’s input factors in the process of controlling air pollutants. This is consistent with the “cost of compliance” in neoclassical economics [67,68,69]. In contrast, due to the loss of some economically efficient outputs resulting from the relocation of some enterprises, green technological progress will not improve the air pollution control performance of the local region. Through technology spillover, green technology progress in the local region effectively reduces pollutant emissions of energy systems in neighboring regions, improving the input–output performance to offset higher costs that result from environmental regulations, thus enhancing the overall air pollution control performance [31]. This is consistent with the “Innovation Compensation” theory of the revisionist school [70,71].
- (3)
- The interactive effects of industrial structure upgrading and green technology progress were generally seen to have a dampening effect on air pollution control performance. All effects of the interaction term were significant to different degrees, with positive coefficients for direct effects and negative coefficients for indirect effects, and with negative total effects. This shows that both industrial structure upgrading and green technology progress were conducive to the promotion of local air pollution control performance. Green technological progress can help enterprises update their production equipment and can promote the development of low-pollution industries, such as technology-intensive industries. Meanwhile, technological progress can accelerate the transformation of economic development from rough to intensive, thus changing the energy consumption structure of the economy and consequently promoting the industrial structure upgrade. However, it is worth noting that the interaction effect has a significant inhibitory effect on the improvement in air pollution control performance in the neighboring regions, indicating marginal decreasing effects of industrial structure upgrading and green technology progress on the air pollution control performance of the neighboring regions. This means that “1 + 1 < 2”.
- (4)
- With respect to the control variables, the analysis needed to be performed in conjunction with the results of OLS parameter estimation. The level of economic development significantly contributed to air pollution control performance. Compared with other regions in China, cities in the Yangtze River Delta region have generally passed the early stage of economic development, and the scale effect of economic growth has alleviated air pollution in cities. To some extent, the level of urbanization and traffic density can inhibit the improvement in air pollution control performance and can aggravate urban air pollution. By contrast, the increase in temperature and precipitation diminishes the difficulty of air pollution control and optimizes the performance; see Section 3.2.2.
5.2. Heterogeneity Analysis
The effects of industrial structure upgrading and green technology progress on air pollution control performance varied within the six regional governance groups of the Yangtze River Delta region. Table 9 shows the effects of industry and technology and their interactive effect with the control variables on the air pollution control performance for different regional governance groups.
5.2.1. Heterogeneity Analysis of Direct Effects
The direct effect of industrial structure upgrading is significantly positive in column (2) and column (6), with impact coefficients of 5.381 and 3.402, respectively, and both passed the 1% significance test. The direct effect of industrial structure upgrading was negative in the other regional governance groups, and only column (5) passed the 5% significance test with an impact coefficient of −3.277, while all other regions failed the significance test. The results show that in column (2) and column (6), the environmental protection input factors that promoted the upgrading of the industrial structure were smaller than the actual air pollution control performance output factors, which promoted the improvement in labor productivity and energy use efficiency and effectively reduced the pollution intensity of fine particulate matter. While column (5) shows an early stage of economic development compared with other regions, the upgrading of industrial structure will also reduce the performance of air pollution control when the secondary industries, mainly manufacturing and construction, and the tertiary industries, mainly services, are developed simultaneously.
The direct effect of green technological progress was significantly positive in column (2) and column (6), with impact coefficients of 0.454 and 0.224, respectively, and both passed the 1% significance test. The direct effect of green technological progress was negative in the other regional governance groups, but only column (4) and column (5) passed the significance test at different levels (5% and 1%, respectively), with impact coefficients of −0.096 and −0.193, respectively. The results show that in column (2) and column (6), the improvement in production efficiency and energy use efficiency can be achieved through green technology progress in the region, thus reducing the emission of pollutants and achieving the improvement in air pollution control performance in the local region. Column (4) and column (5), on the other hand, do not match the environmental control costs invested in the process of achieving green technological progress with the benefits obtained, and the process of environmental regulation, although it induces firms to achieve green technological progress, also causes firms to relocate.
The direct effect of the interaction term of industrial structure upgrading and green technology progress was significantly positive in column (5), with an impact coefficient of 0.516, and significantly negative in column (2) and column (6), with impact coefficients of −0.839 and −0.587, respectively, while the rest of the regions did not pass the significance test but had positive impact coefficients. This indicates that the combined effect of industrial structure upgrading and green technology progress on the improvement in air pollution control performance had a significant promoting effect in column (5) and a significant inhibiting effect in column (2) and column (6). Due to the diminishing marginal benefits of each environmental regulatory policy in the region, technological progress and industrial upgrading in column (5) could mutually promote the inhibitory effects of industrial upgrading and technological progress on local air pollution control performance, while technological progress and industrial upgrading in column (2) and column (6) could mutually inhibit the promoting effects of industrial upgrading and technological progress on local air pollution control performance.
5.2.2. Heterogeneity Analysis of Indirect Effects
The indirect effect of industrial structure upgrading had a positive impact coefficient in all regional governance groups, but only column (1), column (2), and column (6) passed the significance test, with impact coefficients of 19.97, 7.573, and 5.582, respectively. It is worth noting that the coefficient of column (1) was much larger than other regional governance groups, confirming that Shanghai, as the economic growth pole of the Yangtze River Delta region, could drive the improvement in air pollution control performance while promoting the improvement in eco-efficiency of neighboring cities [72]. Column (2), column (3), and column (4) were spillover receptors, and thus, the spillover effect of industrial structure upgrading in these regions was not significant. Column (5) and column (6), on the other hand, will become independent growth poles with significant spillover effects on the improvement in air pollution control performance because of their different stages of economic development and their geographical distance from Shanghai.
The indirect effects of green technological progress were positive in all regions except column (5), and only the results in column (1), column (3), and column (6) passed the significance tests of 1% and 5%. These results indicate that although there was a spillover effect of green technology progress in different zones of the Yangtze River Delta, there was a large inter-regional difference in the improvement effect on air pollution control performance. Local protectionism is prevalent in China, hindering the cross-regional flow of innovation factors and weakening the spillover effects of green technological progress. In addition, the receptiveness of different regions to green technologies does not match the technology spillover received, resulting in different contributions of green technology progress to air pollution control performance in spatially correlated regions [73].
The indirect effect of the interaction term of industrial structure upgrading and green technological progress had a negative impact coefficient in all regional governance groups, but only column (1) and column (6) passed the significance test (1%), with −2.46 and −1.706, respectively. The research and development of green technology requires a large amount of R&D funds and technical personnel and relies on the upgrading of various equipment. However, there is an objective exclusivity of labor and material resources among spatially connected regions. As a result, green technology progress is probably accompanied by the extrusion effect on the production factors of spatially connected regions, offsetting the positive impact of some industrial upgrading on air pollution control performance. In the process of industrial structure upgrading, when local governments lay out relevant industrial policies and environmental regulations, it will be accompanied by the imitation effect of spatially related areas, which will offset part of the positive impact of technological progress on air pollution control performance [74].
5.3. Robustness Check
The indirect effects of each explanatory variable may have insufficient robustness under the setting of the spatial weight matrix of geographical distance. Therefore, a corresponding geographic distance weight matrix was constructed using the road distance between two cities in the robustness test, replacing the spatial weight matrix used in the previous SDM, and parameter estimation was performed again. The results are shown in Table 10, with columns (1) to (3) showing the results of the baseline regressions and columns (4) to (6) showing the results of the regressions with a one-period lag of the explanatory variables. For the direct effects, the interaction term in column (1) was weakly significant, and the variable was not significant in column (4), while the rest of the variables passed the significance tests at different levels. For the indirect effects, all variables passed the significance test and the direction of the effect on the explained variables was consistent with the previous section. Overall, the model was robust.
6. Conclusions and Discussion
This study used systems theory to describe the policy spillover effects of environmental regulation policy and to explain the mechanisms of such spillovers. Furthermore, the panel data of 41 cities in the Yangtze River Delta region of China from 2006 to 2020 were used to measure air pollution control performance (APCP) using a super-efficiency SBM-DEA model, and the dynamic changes and spatio-temporal patterns of APCP were portrayed using the Malmquist index and ArcGIS software, respectively. Finally, the spatial Durbin model (SDM) was used to analyze the optimization path of APCP in the Yangtze River Delta region from both industrial and technological perspectives and to explore its regional heterogeneity in depth.
The following conclusions from this study apply to the Yangtze River Delta region of China: (1) In terms of the temporal pattern, the APCP in the Yangtze River Delta region, except for the Shaoxing regional governance group, which had been at a high level, showed a fluctuating upward trend throughout the study period. Meanwhile, the mean values of the efficiency change index (EC), the technology change index (TC), and the global Malmquist index (GML) were all greater than 1 from 2006 to 2020. (2) In terms of the spatial pattern, the APCP in the Yangtze River Delta region was at a higher and more stable value in Zhejiang Province in the southeast and a lower and highly variable value in Jiangsu and Anhui provinces in the north. In addition, according to the results of spatial correlation analysis of the Moran index, the APCP in the Yangtze River Delta region showed a significant positive spatial correlation. (3) Industrial structure upgrading and green technology progress had different impact paths on the APCP. Industrial structure upgrading had a significant indirect promotion effect and a positive spillover effect on the APCP, while the direct effect was not significant. Green technology progress had a significant direct inhibitory effect on the APCP, as well as a significant indirect promoting effect and a positive spillover effect on the APCP. (4) In the optimization path of the APCP, industrial structure upgrading played a more important role than green technology progress. Due to the existence of the policy’s diminishing marginal effects, industrial structure upgrading and green technology progress did not mutually reinforce each other for APCP enhancement. (5) There was regional heterogeneity in the impacts of industry and technology on the APCP. The paths and actual effects of industrial structure upgrading and green technology progress on the APCP varied widely among the six different regional governance groups within the Yangtze River Delta region.
This study took a different approach by applying systems theory to explain the mechanism of air pollution control policy spillover in the Yangtze River Delta region; depicting the chain transmission effect, vibration effect, ripple effect, and halo effect of policy spillover; and analyzing the spatial and temporal patterns of the APCP in the Yangtze River Delta region from static and dynamic perspectives. In addition, the optimization path of the APCP was studied based on the perspective of industrial structure upgrading and green technology progress. It is both an empirical test of the reality of the APCP in the Yangtze River Delta region and a useful complement to the development of the APCP by industry and technology.
However, there were some shortcomings of this study: first, the spillover effects of air pollution control policies were not measured; second, a finer delineation of the indicator settings for industrial structure upgrading and green technology progress was lacking. Therefore, in future studies, a more comprehensive examination of the contribution of industry and technology to the APCP enhancement should be undertaken.
Author Contributions
Conceptualization, Y.S.; methodology, B.X.; software, B.X.; validation, B.X.; formal analysis, Y.S.; investigation, B.X.; resources, Y.S.; data curation, Y.S.; writing—original draft preparation, B.X.; writing—review and editing, Y.S.; visualization, B.X.; supervision, Y.S.; project administration, Y.S.; funding acquisition, Y.S. All authors have read and agreed to the published version of the manuscript.
Funding
This research was funded by the National Social Science Foundation of China, grant number 22BJL135.
Institutional Review Board Statement
Not applicable.
Informed Consent Statement
Not applicable.
Data Availability Statement
The data used to support the findings of this study are available from the corresponding author upon request (e-mail: [email protected]).
Conflicts of Interest
The authors declare no conflict of interest.
References
- Piovani, C. The “Greening” of China: Progress, Limitations, and Contradictions. J. Contemp. Asia 2017, 47, 93–115. [Google Scholar] [CrossRef]
- Xu, B.; Sun, Y. The Impact of Industrial Agglomeration on Urban Land Green Use Efficiency and Its Spatio-Temporal Pattern: Evidence from 283 Cities in China. Land 2023, 12, 824. [Google Scholar] [CrossRef]
- Geniaux, G.; Martinetti, D. A new method for dealing simultaneously with spatial autocorrelation and spatial heterogeneity in regression models. Reg. Sci. Urban Econ. 2018, 72, 74–85. [Google Scholar] [CrossRef]
- Liang, W.; Yang, M. Urbanization, economic growth and environmental pollution: Evidence from China. Sustain. Comput.-Inform. Syst. 2019, 21, 1–9. [Google Scholar] [CrossRef]
- Langbein, L. Economics, Public Service Motivation, and Pay for Performance: Complements or Substitutes? Int. Public Manag. J. 2010, 13, 9–23. [Google Scholar] [CrossRef]
- Fang, C.L.; Wang, Z.B.; Xu, G. Spatial-temporal characteristics of PM2.5 in China: A city-level perspective analysis. J. Geogr. Sci. 2016, 26, 1519–1532. [Google Scholar] [CrossRef]
- Ambrey, C.L.; Fleming, C.M.; Chan, A.Y.C. Estimating the cost of air pollution in South East Queensland: An application of the life satisfaction non-market valuation approach. Ecol. Econ. 2014, 97, 172–181. [Google Scholar] [CrossRef]
- Zhou, Y.; Zhu, B.; Han, Z.; Pan, C.; Guo, T.; Wei, J.; Liu, D. Analysis of visibility characteristics and connecting factors over the Yangtze River Delta Region during winter time. China Environ. Sci. 2016, 36, 660–669. (In Chinese) [Google Scholar]
- Xie, Y.Y.; Zhao, B.; Zhang, L.; Luo, R. Spatiotemporal variations of PM2.5 and PM10 concentrations between 31 Chinese cities and their relationships with SO2, NO2, CO and O-3. Particuology 2015, 20, 141–149. [Google Scholar] [CrossRef]
- Chen, C.; Zhao, B. Review of relationship between indoor and outdoor particles: I/O ratio, infiltration factor and penetration factor. Atmos. Environ. 2011, 45, 275–288. [Google Scholar] [CrossRef]
- Xu, P.; Chen, Y.F.; Ye, X.J. Haze, air pollution, and health in China. Lancet 2013, 382, 2067. [Google Scholar] [CrossRef]
- Zora, J.E.; Sarnat, S.E.; Raysoni, A.U.; Johnson, B.A.; Li, W.W.; Greenwald, R.; Holguin, F.; Stock, T.H.; Sarnat, J.A. Associations between urban air pollution and pediatric asthma control in El Paso, Texas. Sci. Total Environ. 2013, 448, 56–65. [Google Scholar] [CrossRef] [PubMed]
- Schikowski, T.; Vossoughi, M.; Vierkotter, A.; Schulte, T.; Teichert, T.; Sugiri, D.; Fehsel, K.; Tzivian, L.; Bae, I.S.; Ranft, U.; et al. Association of air pollution with cognitive functions and its modification by APOE gene variants in elderly women. Environ. Res. 2015, 142, 10–16. [Google Scholar] [CrossRef]
- Liu, H.; Sun, Y.; Chen, M. Dynamic correlation and causes of urban haze pollution. China Popul. Resour. Environ. 2017, 27, 74–81. (In Chinese) [Google Scholar]
- Hu, Z.; Li, G.; Cao, J. Air Pollution Regional Linkage Control and Prevention from the Perspective of Environmental Regulation——The Scheme Design, State Evaluation and Influencing Factors Analysis. China Ind. Econ. 2019, 5, 24–42. (In Chinese) [Google Scholar] [CrossRef]
- Liu, H.; Lei, M. The dilemma of the regional collaborative governance of haze pollution and its solution ideas in China. China Popul. Resour. Environ. 2018, 28, 88–95. (In Chinese) [Google Scholar]
- Yuan, Y.; Huang, X.; Song, W. Study on the Policy Overflow Effect of the Intellectual Property Rich Regions in China. Sci. Sci. Manag. S. T. 2010, 31, 15–21. (In Chinese) [Google Scholar]
- Lan, Q.; Chen, C. Soft Institution, Public Recognition and Efficiency of Air Pollution Abatement. China Popul. Resour. Environ. 2015, 25, 145–152. (In Chinese) [Google Scholar]
- Guo, K.; Cao, Y.Q.; Wang, Z.F.; Li, Z.Y. Urban and industrial environmental pollution control in China: An analysis of capital input, efficiency and influencing factors. J. Environ. Manag. 2022, 316, 115198. [Google Scholar] [CrossRef]
- Hollingsworth, B. Non parametric efficiency measurement. Econ. J. 2004, 114, F307–F311. [Google Scholar] [CrossRef]
- Brandt, A.R.; Dale, M. A General Mathematical Framework for Calculating Systems-Scale Efficiency of Energy Extraction and Conversion: Energy Return on Investment (EROI) and Other Energy Return Ratios. Energies 2011, 4, 1211–1245. [Google Scholar] [CrossRef]
- Xu, B.; Liu, L.; Sun, Y. The Spatio-Temporal Pattern of Regional Coordinated Development in the Common Prosperity Demonstration Zone—Evidence from Zhejiang Province. Sustainability 2023, 15, 2939. [Google Scholar] [CrossRef]
- Lou, J.C.; Lin, Y.C. Assessing the feasibility of wastewater recycling and treatment efficiency of wastewater treatment units. Environ. Monit. Assess. 2008, 137, 471–479. [Google Scholar] [CrossRef]
- Su, Y.; Qi, Y.; Xiao, Z.Y.; Wei, Y. Contributing institutional factors of rural environmental pollution in the process of modernization in China -In the perspective of the efficiency of environmental management system. Front. Environ. Sci. Eng. China 2009, 3, 75–90. [Google Scholar] [CrossRef]
- Zeng, X.; Niu, M. Evaluation of urban environmental efficiency in China under high quality development conditions. China Environ. Sci. 2019, 39, 2667–2677. (In Chinese) [Google Scholar]
- Zhou, X.Y.; Zhang, J.; Li, J.P. Industrial structural transformation and carbon dioxide emissions in China. Energy Policy 2013, 57, 43–51. [Google Scholar] [CrossRef]
- Du, K.R.; Cheng, Y.Y.; Yao, X. Environmental regulation, green technology innovation, and industrial structure upgrading: The road to the green transformation of Chinese cities. Energy Econ. 2021, 98, 105247. [Google Scholar] [CrossRef]
- Timmer, M.P.; Szirmai, A. Productivity growth in Asian manufacturing: The structural bonus hypothesis examined. Struct. Chang. Econ. Dyn. 2000, 11, 371–392. [Google Scholar] [CrossRef]
- Herdt, R.W. A RETROSPECTIVE VIEW OF TECHNOLOGICAL AND OTHER CHANGES IN PHILIPPINE RICE FARMING, 1965–1982. Econ. Dev. Cult. Change 1987, 35, 329–349. [Google Scholar] [CrossRef]
- Dong, Z.; Wang, H. Local-Neighborhood Effect of Green Technology of Environmental Regulation. China Ind. Econ. 2019, 370, 100–118. [Google Scholar] [CrossRef]
- Lee, K.H.; Min, B. Green R&D for eco-innovation and its impact on carbon emissions and firm performance. J. Clean. Prod. 2015, 108, 534–542. [Google Scholar] [CrossRef]
- Zhang, Y.; Cheng, J.; Xu, Z.; Song, Q.; Li, W.; Pan, T. Whether green innovation can adapt to climate change: An empirical study of China’s patent and GHG emission data. China Popul. Resour. Environ. 2021, 31, 48–56. (In Chinese) [Google Scholar]
- Porter, M.E.; Vanderlinde, C. TOWARD A New Conception of the Environment-Competitiveness Relationship. J. Econ. Perspect. 1995, 9, 97–118. [Google Scholar] [CrossRef]
- Chen, K.; Wan, Q.; Kang, Y. State governance system and innovation efficiency of state-owned enterprises A quasi natural experiment based on inspection supervision. Sci. Res. Manag. 2020, 41, 211–219. (In Chinese) [Google Scholar]
- Cheng, J.H.; Yi, J.H.; Dai, S.; Xiong, Y. Can low-carbon city construction facilitate green growth? Evidence from China’s pilot low-carbon city initiative. J. Clean. Prod. 2019, 231, 1158–1170. [Google Scholar] [CrossRef]
- Xi, B.; Zhai, P.Y. Economic growth, industrial structure upgrading and environmental pollution: Evidence from China. Kybernetes 2023, 52, 518–553. [Google Scholar] [CrossRef]
- Hamaguchi, Y. Pollution havens and agglomeration: The effect of globalization and technological spillover. Appl. Econ. 2023, 1–18. [Google Scholar] [CrossRef]
- Zeng, D.Z.; Zhao, L.X. Pollution havens and industrial agglomeration. J. Environ. Econ. Manag. 2009, 58, 141–153. [Google Scholar] [CrossRef]
- Hamaguchi, Y. Environmental policy effects: An R&D-based economic growth model with endogenous labour supply. J. Econ. Policy Reform 2021, 24, 236–252. [Google Scholar] [CrossRef]
- Prigogine, I.; Lefever, R. Stability and Self-Organization in Open Systems; Wiley: New York, NY, USA, 1975; pp. 1–28. [Google Scholar]
- Prigogine, N.G. Self-Organization in Non-Equilibrium System from Dissipative Structures to Order Through Fluctuation; Wiley: New York, NY, USA, 1977; pp. 491–492. [Google Scholar]
- Song, W.; Xu, F.; Zhang, X. Research on Regional Performance Improvement of Intellectual Property Policy from Perspective of Policy Overflow: Based on Empirical Analysis of China’s 29 Provinces. Sci. Sci. Manag. S. T. 2012, 33, 77–83. (In Chinese) [Google Scholar]
- Shao, S.; Li, X.; Cao, J.; Yang, L. China’s Economic Policy Choices for Governing Smog Pollution Based on Spatial Spillover Effects. Econ. Res. J. 2016, 51, 73–88. (In Chinese) [Google Scholar]
- Deng, H.; Yang, L. Haze Governance, Local Competition and Industrial Green Transformation. China Ind. Econ. 2019, 10, 118–136. (In Chinese) [Google Scholar]
- Tone, K. A slacks-based measure of super-efficiency in data envelopment analysis. Eur. J. Oper. Res. 2002, 143, 32–41. [Google Scholar] [CrossRef]
- Andersen, P.; Petersen, N.C. A procedure for ranking efficient units in data envelopment analysis. Manag. Sci. 1993, 39, 1261–1265. [Google Scholar] [CrossRef]
- Elhorst, J.P. Dynamic spatial panels: Models, methods, and inferences. J. Geogr. Syst. 2014, 14, 5–28. [Google Scholar] [CrossRef]
- Pace, R.K.; LeSage, J.P. A sampling approach to estimate the log determinant used in spatial likelihood problems. J. Geogr. Syst. 2009, 11, 209–225. [Google Scholar] [CrossRef]
- Peng, G.; Zhang, X.D.; Liu, F.; Ruan, L.J.; Tian, K.Y. Spatial-temporal evolution and regional difference decomposition of urban environmental governance efficiency in China. Environ. Dev. Sustain. 2021, 23, 8974–8990. [Google Scholar] [CrossRef]
- Murshed, M.; Apergis, N.; Alam, M.S.; Khan, U.; Mahmud, S. The impacts of renewable energy, financial inclusivity, globalization, economic growth, and urbanization on carbon productivity: Evidence from net moderation and mediation effects of energy efficiency gains. Renew. Energy 2022, 196, 824–838. [Google Scholar] [CrossRef]
- Sun, Y.; Shen, S. The spatio-temporal evolutionary pattern and driving forces mechanism of green technology innovation efficiency in the Yangtze River Delta region. Geogr. Res. 2021, 40, 2743–2759. (In Chinese) [Google Scholar]
- Du, Q.; Li, N. Efficiency and Dynamic Analysis of Urban Industrial Air Pollution Control—Based on Three-stage Super-efficiency SBM-DEA Model. J. Hebei GEO Univ. 2022, 45, 104–112. (In Chinese) [Google Scholar] [CrossRef]
- Cheng, Z.H.; Li, L.S.; Liu, J. Industrial structure, technical progress and carbon intensity in China’s provinces. Renew. Sustain. Energy Rev. 2018, 81, 2935–2946. [Google Scholar] [CrossRef]
- Du, K.R.; Li, P.Z.; Yan, Z.M. Do green technology innovations contribute to carbon dioxide emission reduction? Empirical evidence from patent data. Technol. Forecast. Soc. Chang. 2019, 146, 297–303. [Google Scholar] [CrossRef]
- Liang, R.; Gao, M.; Wu, X. Further Inspection towards the Relationship between Environmental Regulation and Air Pollution Abatement: Threshold Effect Analysis Based on Economic Growth. Ecol. Econ. 2020, 36, 182–187. (In Chinese) [Google Scholar]
- Guo, Y.; Lin, X.; Bian, Y. The Spatial-Temporal Characteristics and Influencing Factors of Air Quality in China’s Urban Agglomerations. Ecol. Econ. 2019, 35, 167–175. (In Chinese) [Google Scholar]
- Zhang, M.; Liu, X.X.; Ding, Y.T. Assessing the influence of urban transportation infrastructure construction on haze pollution in China: A case study of Beijing-Tianjin-Hebei region. Environ. Impact Assess. Rev. 2021, 87, 106547. [Google Scholar] [CrossRef]
- Tie, X.; Long, X.; Dai, W.; Brasseur, G.P. Surface PM2.5, Satellite Distribution of Atmospheric Optical Depth and Related; Springer: Berlin/Heidelberg, Germany, 2017; Volume 16, pp. 479–488. [Google Scholar]
- Jin, J.Q.; Du, Y.; Xu, L.J.; Chen, Z.Y.; Chen, J.J.; Wu, Y.; Ou, C.Q. Using Bayesian spatio-temporal model to determine the socio-economic and meteorological factors influencing ambient PM2.5 levels in 109 Chinese cities. Environ. Pollut. 2019, 254, 113023. [Google Scholar] [CrossRef]
- Sun, Y.; Zhou, C. The spatio-temporal evolution characteristics and influencing factors of collaborative governance of air pollution in the Yangtze River Delta region. Geogr. Res. 2022, 41, 2742–2759. (In Chinese) [Google Scholar]
- Duan, H.; Bao, Q.; Tian, K.; Wang, S.; Yang, C.; Cai, Z. The hit of the novel coronavirus outbreak to China’s economy. China Econ. Rev. 2021, 67, 101606. [Google Scholar] [CrossRef]
- Li, C.; Chen, Z.; Wang, X.; Wan, Y.; Zhao, Z. The impact of COVID-19 on economy, air pollution and income: Evidence from China. Stoch. Environ. Res. Risk Assess. 2023, 1–12. [Google Scholar] [CrossRef]
- Christopeit, N. Econometric analysis of cross section and panel data. J. Econ. Z. Fur Natl. 2003, 80, 206–209. [Google Scholar] [CrossRef]
- Zhu, X.H.; Lu, S.X. Land institution of China: Overall framework, structural evolution, and regulation intensity. Chin. J. Popul. Resour. Environ. 2018, 16, 85–95. [Google Scholar] [CrossRef]
- Tao, F.; Zhao, J.; Zhou, H. Does Environmental Regulation Improve the Quantity and Quality of Green Innovation—Evidence from the Target Responsibility System of Environmental Protection. China Ind. Econ. 2021, 395, 136–154. (In Chinese) [Google Scholar] [CrossRef]
- Panesar, A.; Abdi, M.; Hickman, D.; Ashcroft, I. Strategies for functionally graded lattice structures derived using topology optimisation for Additive Manufacturing. Addit. Manuf. 2018, 19, 81–94. [Google Scholar] [CrossRef]
- Gray, W.B.; Shadbegian, R.J. Environmental regulation, investment timing, and technology choice. J. Ind. Econ. 1998, 46, 235–256. [Google Scholar] [CrossRef]
- Dean, T.J.; Brown, R.L. Pollution regulation as a barrier to new firm entry—Initial evidence and implications for future-research. Acad. Manag. J. 1995, 38, 288–303. [Google Scholar] [CrossRef]
- Copeland, B.R.; Taylor, M.S. North-South trade and the environment. Q. J. Econ. 1994, 109, 755–787. [Google Scholar] [CrossRef]
- Taylor, M.R.; Rubin, E.S.; Hounshell, D.A. Control of SO2 emissions from power plants: A case of induced technological innovation in the US. Technol. Forecast. Soc. Chang. 2005, 72, 697–718. [Google Scholar] [CrossRef]
- Lanoie, P.; Patry, M.; Lajeunesse, R. Environmental regulation and productivity: Testing the Porter hypothesis. J. Product. Anal. 2008, 30, 121–128. [Google Scholar] [CrossRef]
- Liu, M.; Zhang, A.; Xiong, Y. Spatial differences of urban land use ecological efficiency in the Yangtze River Economic Belt and its interactive spillover effects with industrial structure upgrading. China Popul. Resour. Environ. 2022, 32, 125–139. (In Chinese) [Google Scholar]
- Han, F.; Ke, S. Tracing the Spatial Sources of Manufacturing Agglomeration in China:An Integrated Perspective Based on Marshall Externalities and New Economic Geography. J. Manag. World 2012, 229, 55–70. (In Chinese) [Google Scholar] [CrossRef]
- Gao, Y.; Deng, Y. Does cross-regional natural conservation reduce the investment of conservation funds: Spatial effect analysis based on Conservation Biology. J. Nat. Resour. 2023, 38, 1040–1057. (In Chinese) [Google Scholar]
Figure 1.
Schematic diagram of regional air pollution control linkage process system analysis.

Figure 2.
Chain transmission diagram of environmental regulation policy spillover in the Yangtze River Delta region.
Figure 2.
Chain transmission diagram of environmental regulation policy spillover in the Yangtze River Delta region.

Figure 3.
PM2.5 concentrations in individual cities in Zhejiang Province in 2016 and 2017.

Figure 4.
Changes in PM2.5 concentrations in Shanghai, Jiangsu, Zhejiang, and Anhui from 2006 to 2020.
Figure 4.
Changes in PM2.5 concentrations in Shanghai, Jiangsu, Zhejiang, and Anhui from 2006 to 2020.
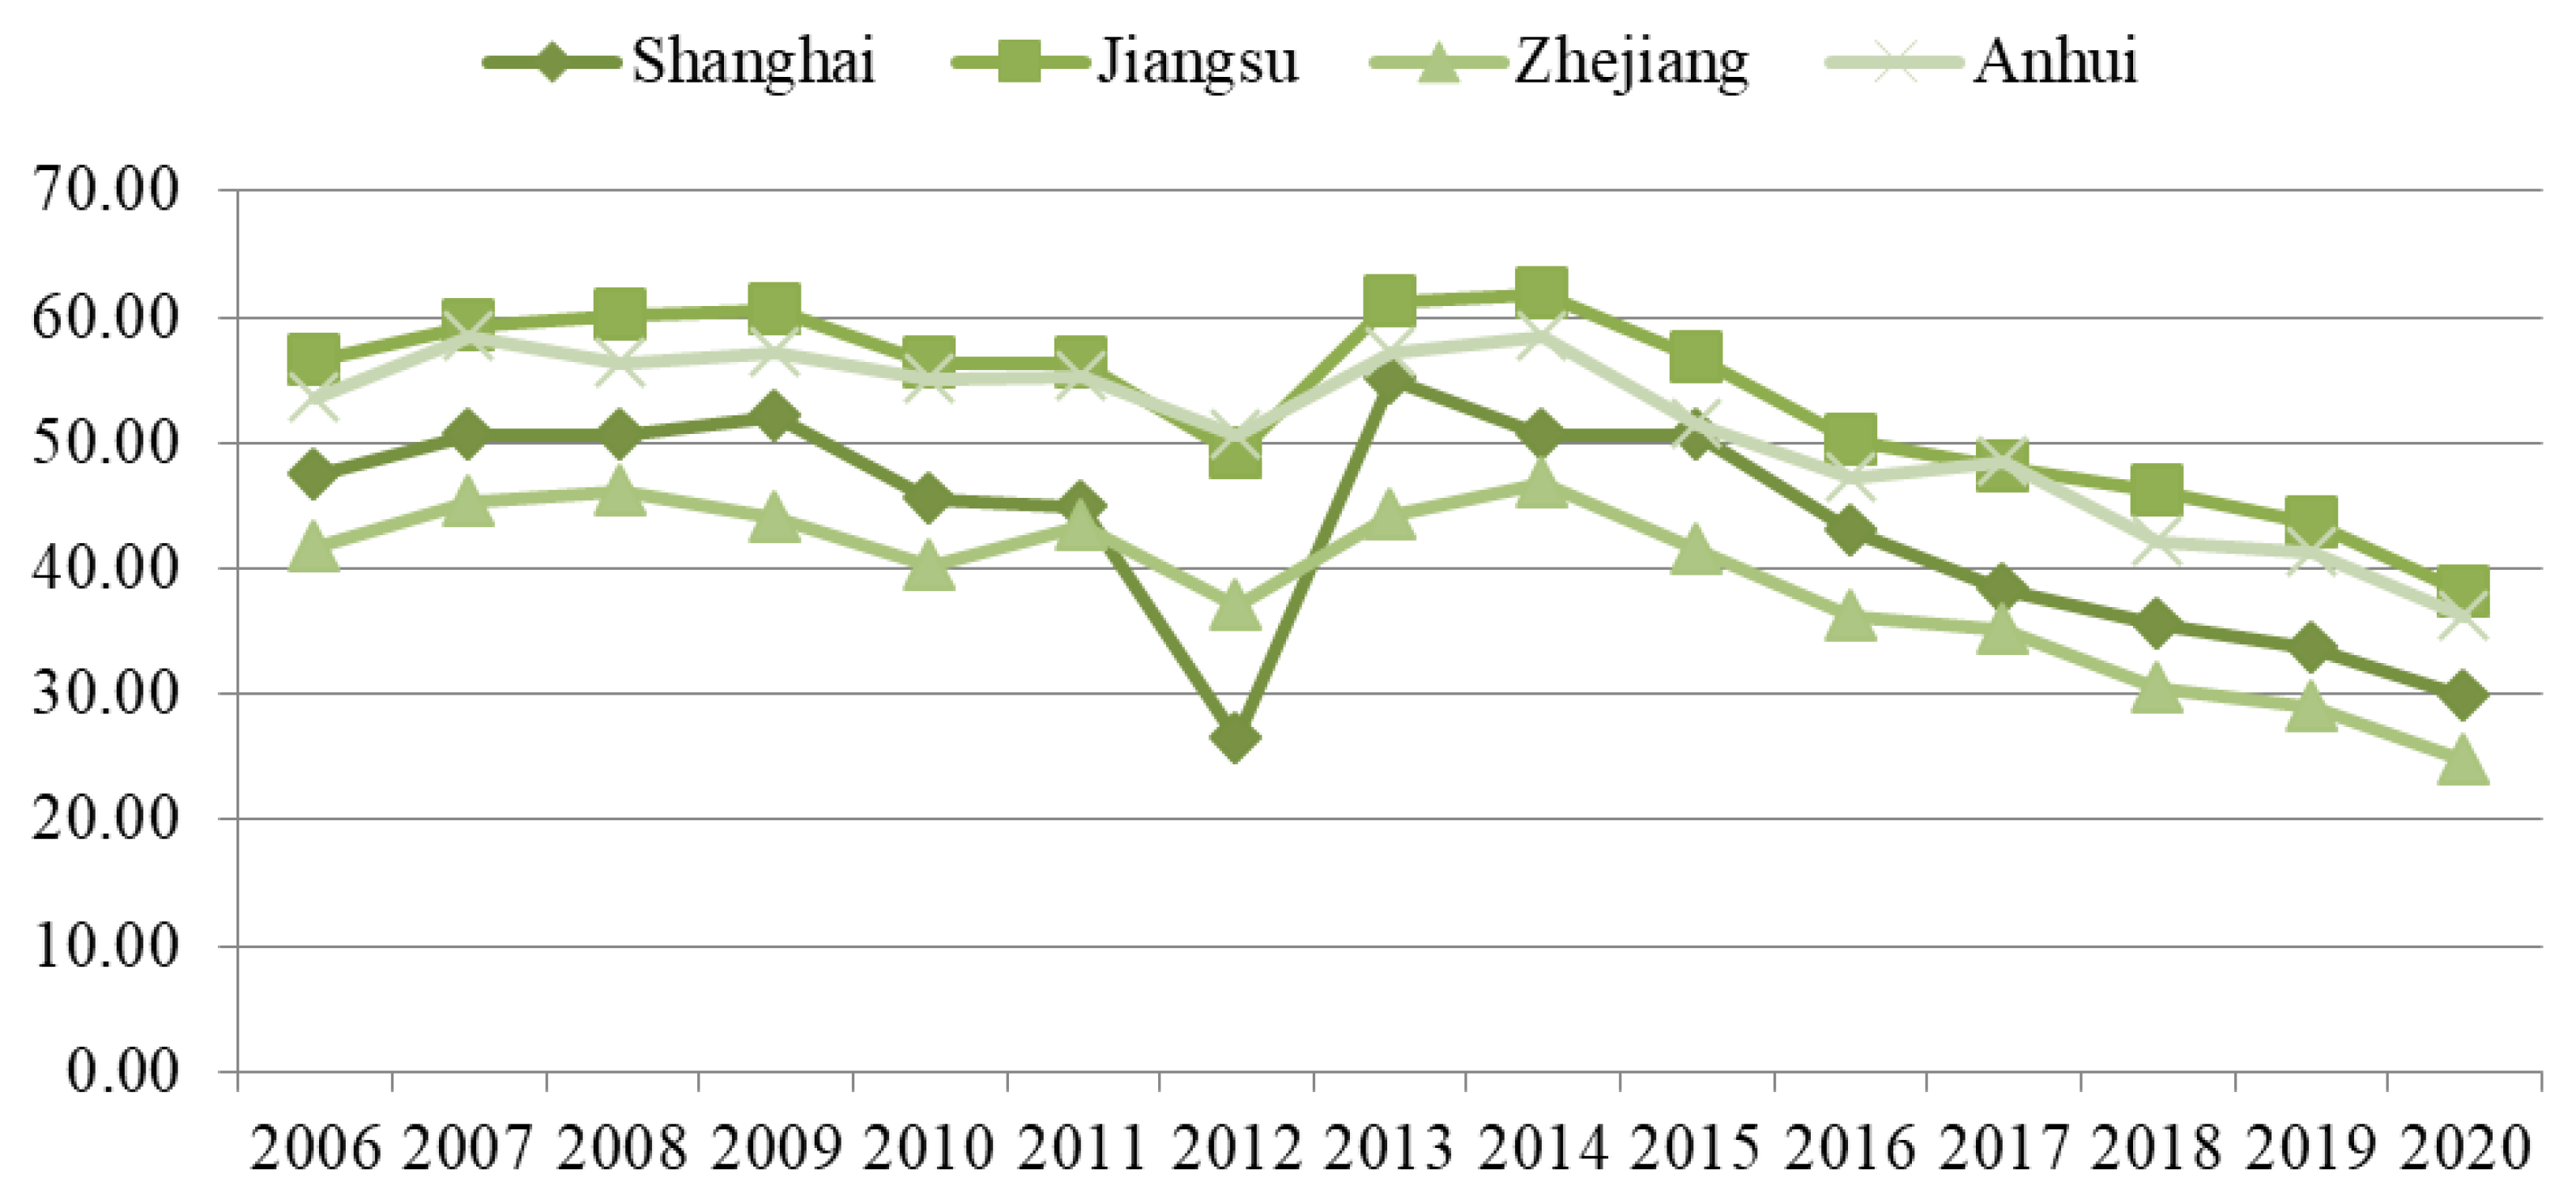
Figure 5.
Diffraction direction and halo intensity of policy spillover halo effect.
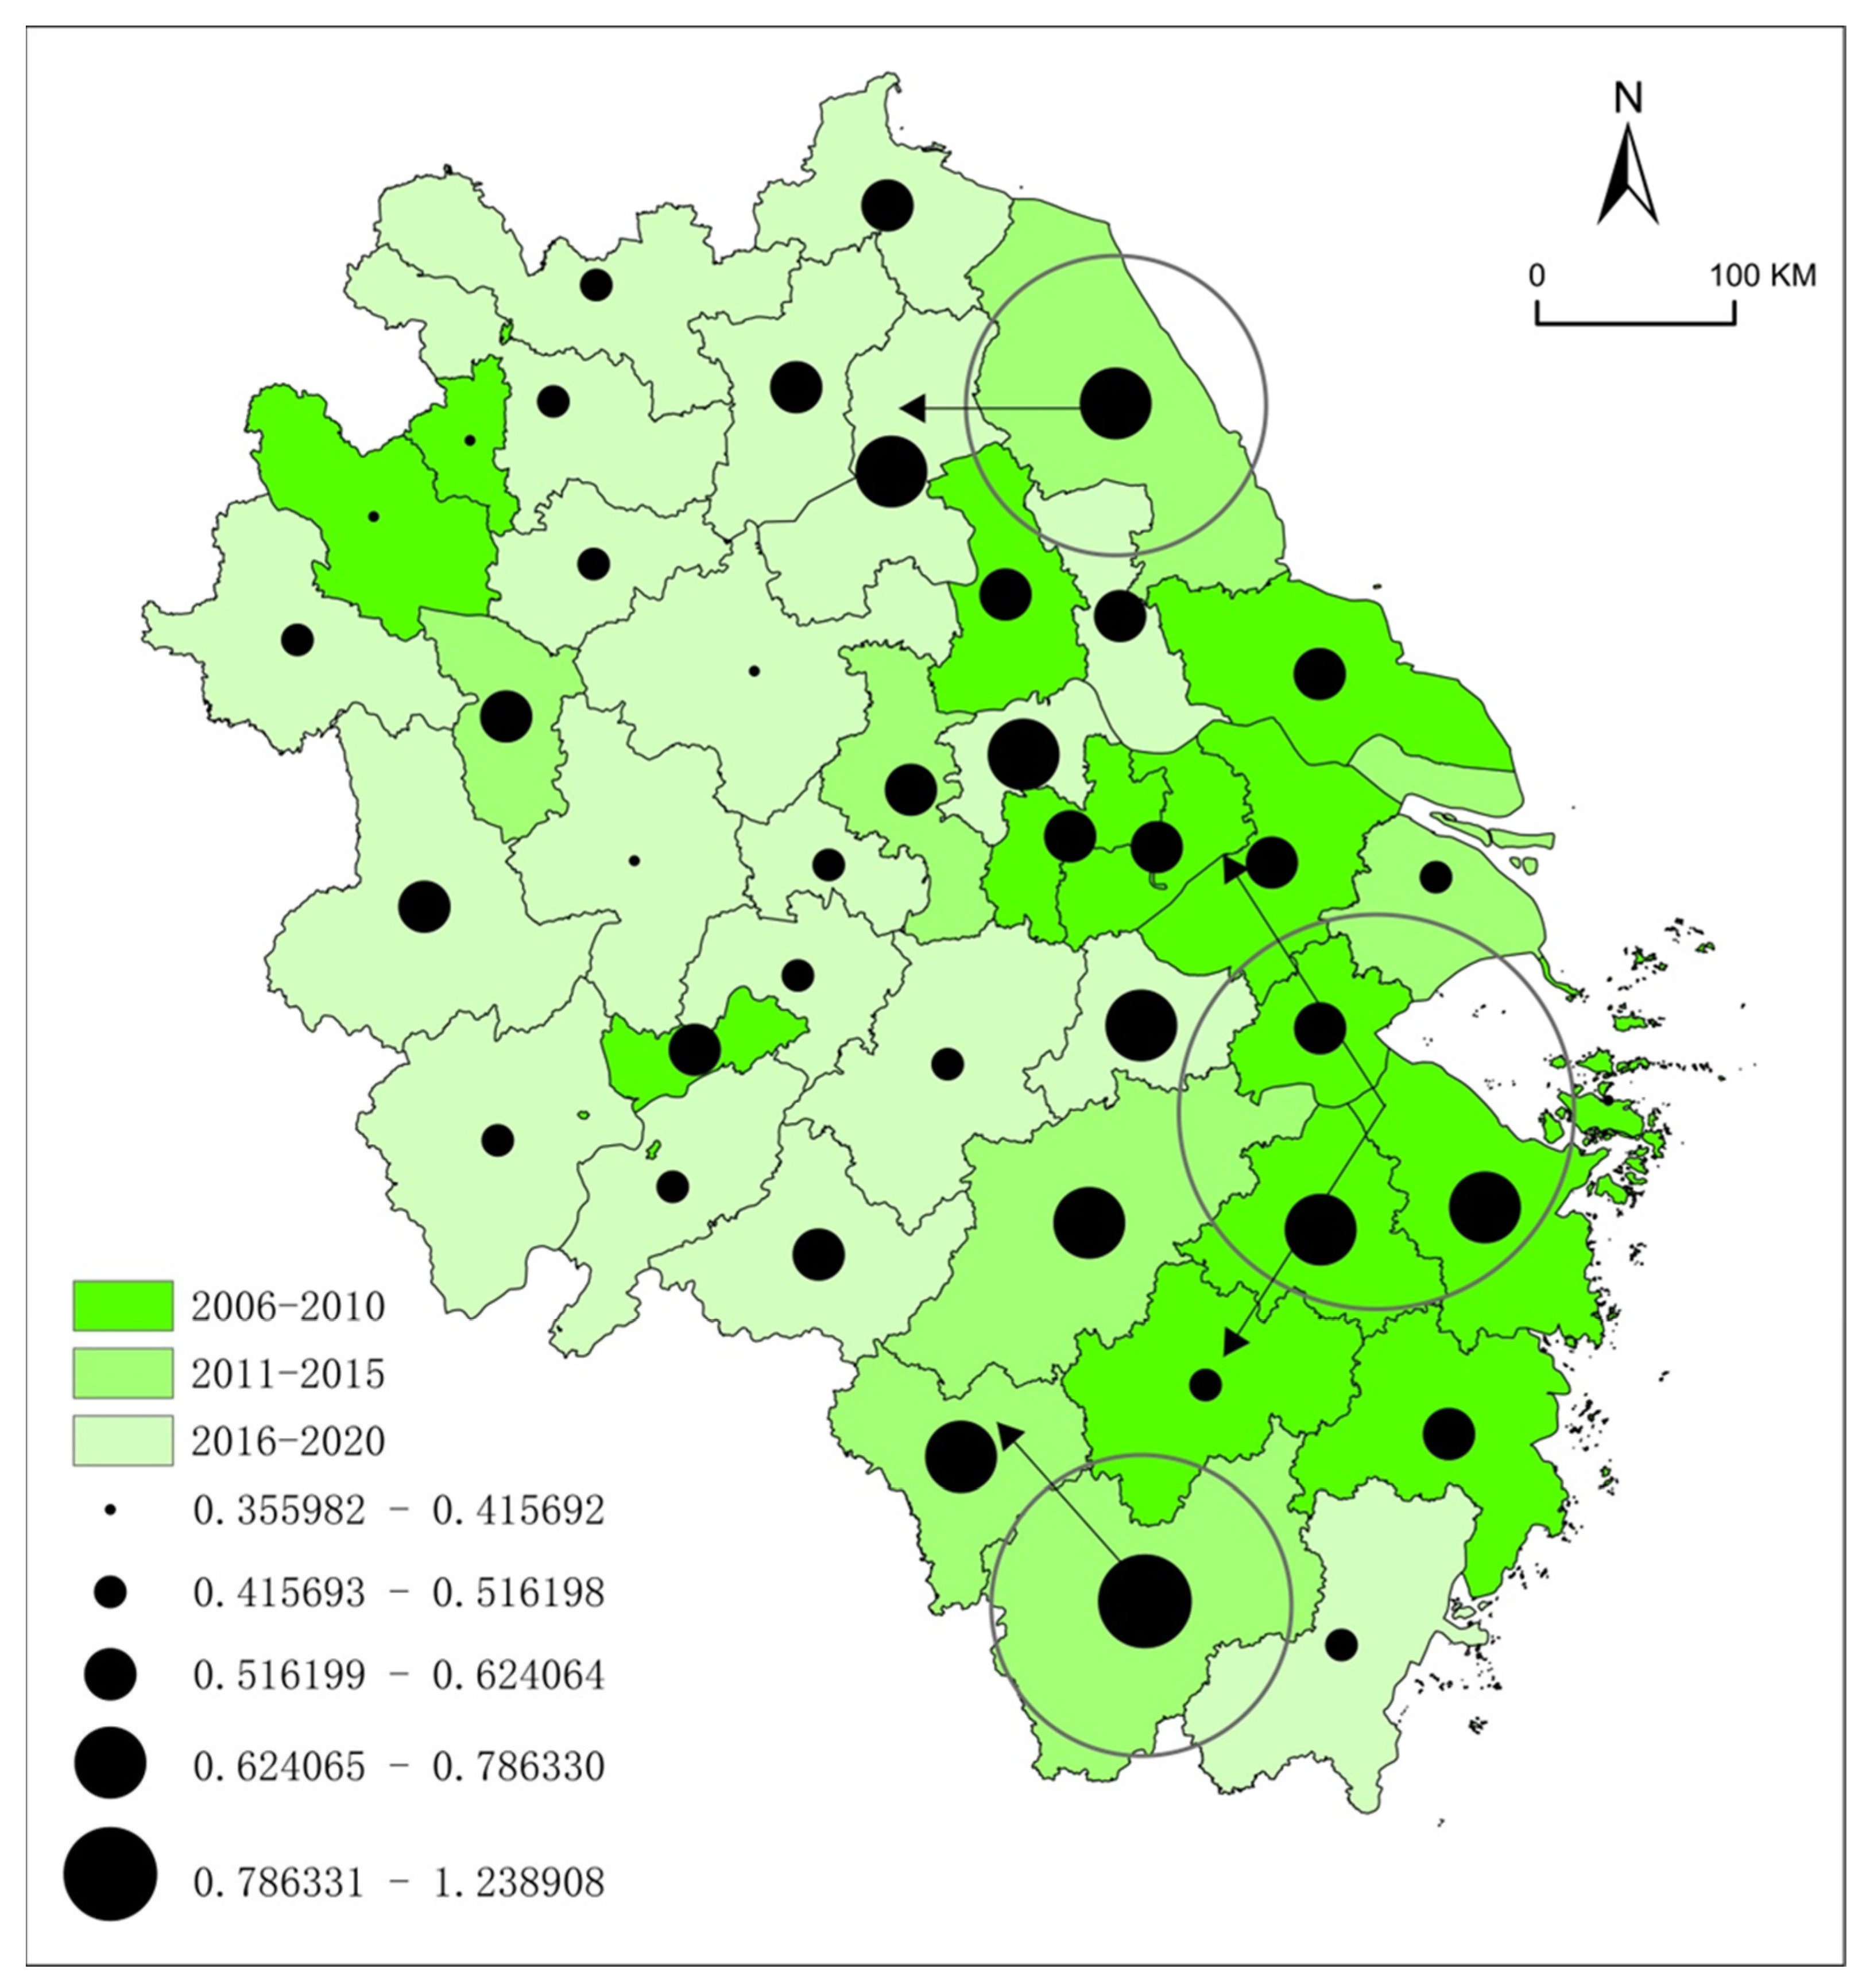
Figure 6.
Study area and Yangtze River Delta regional air pollution collaborative governance plan.
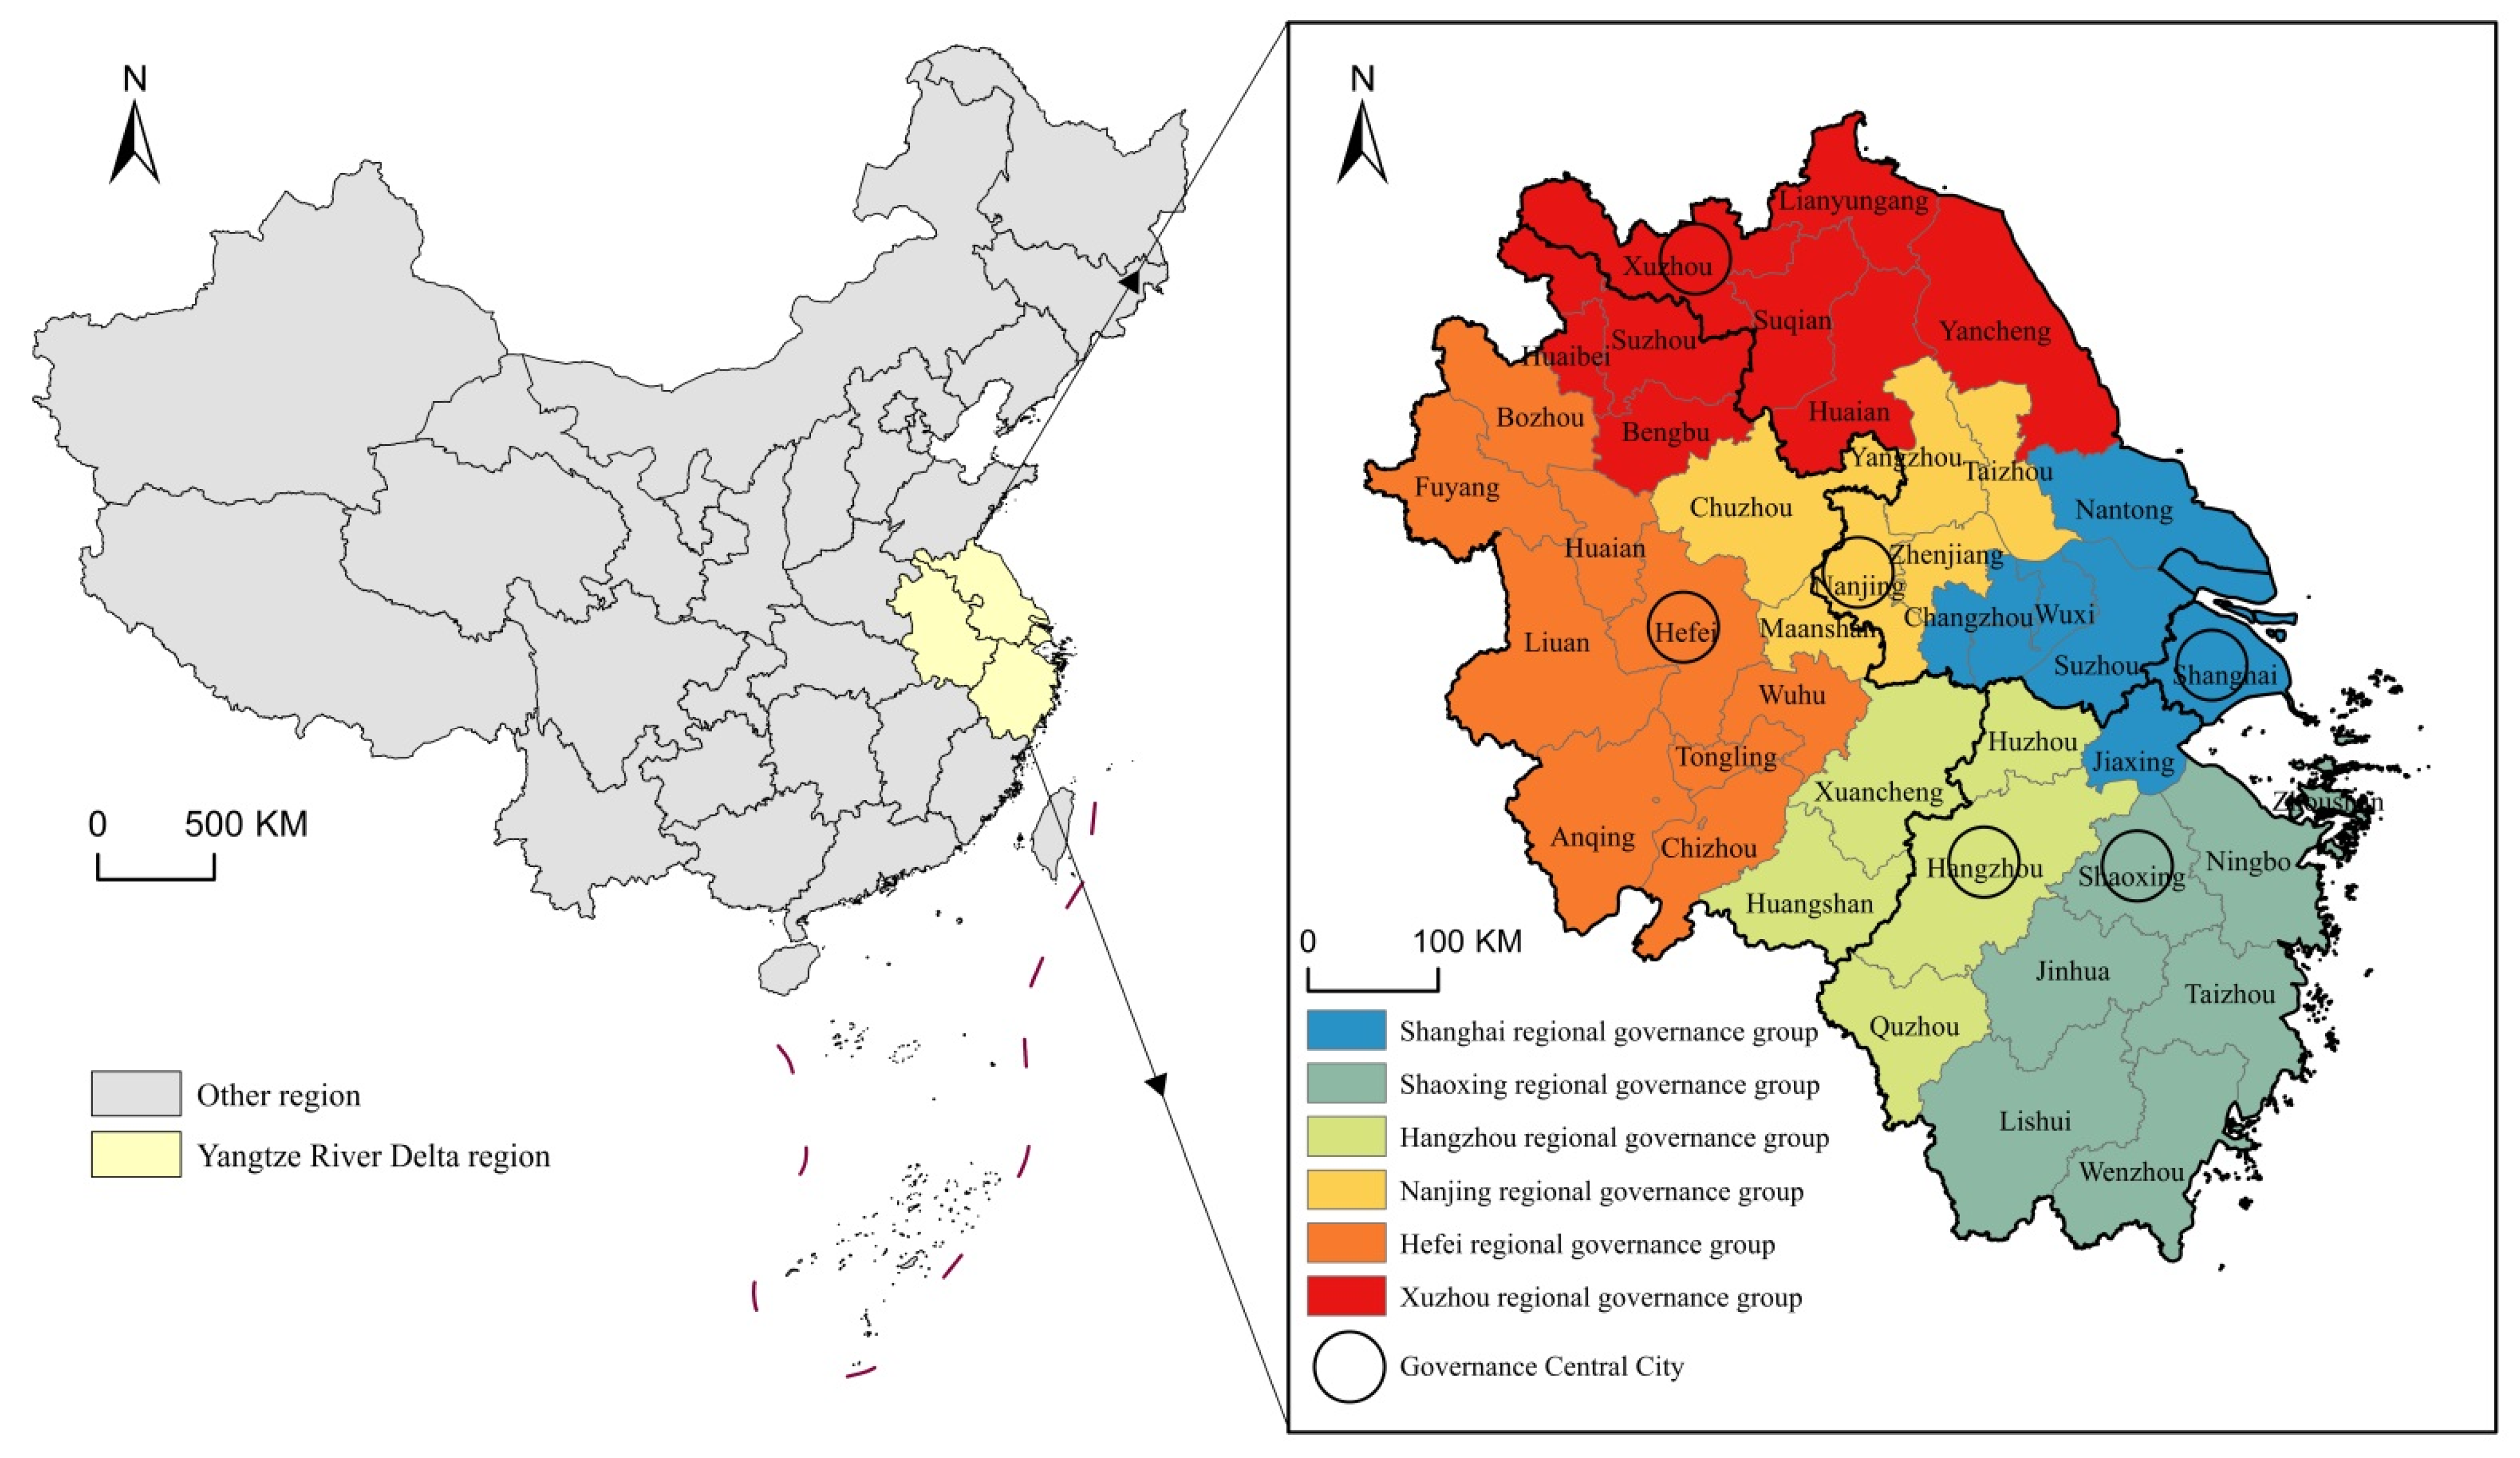
Figure 7.
Air pollution control performance in the Yangtze River Delta region from 2006 to 2020.
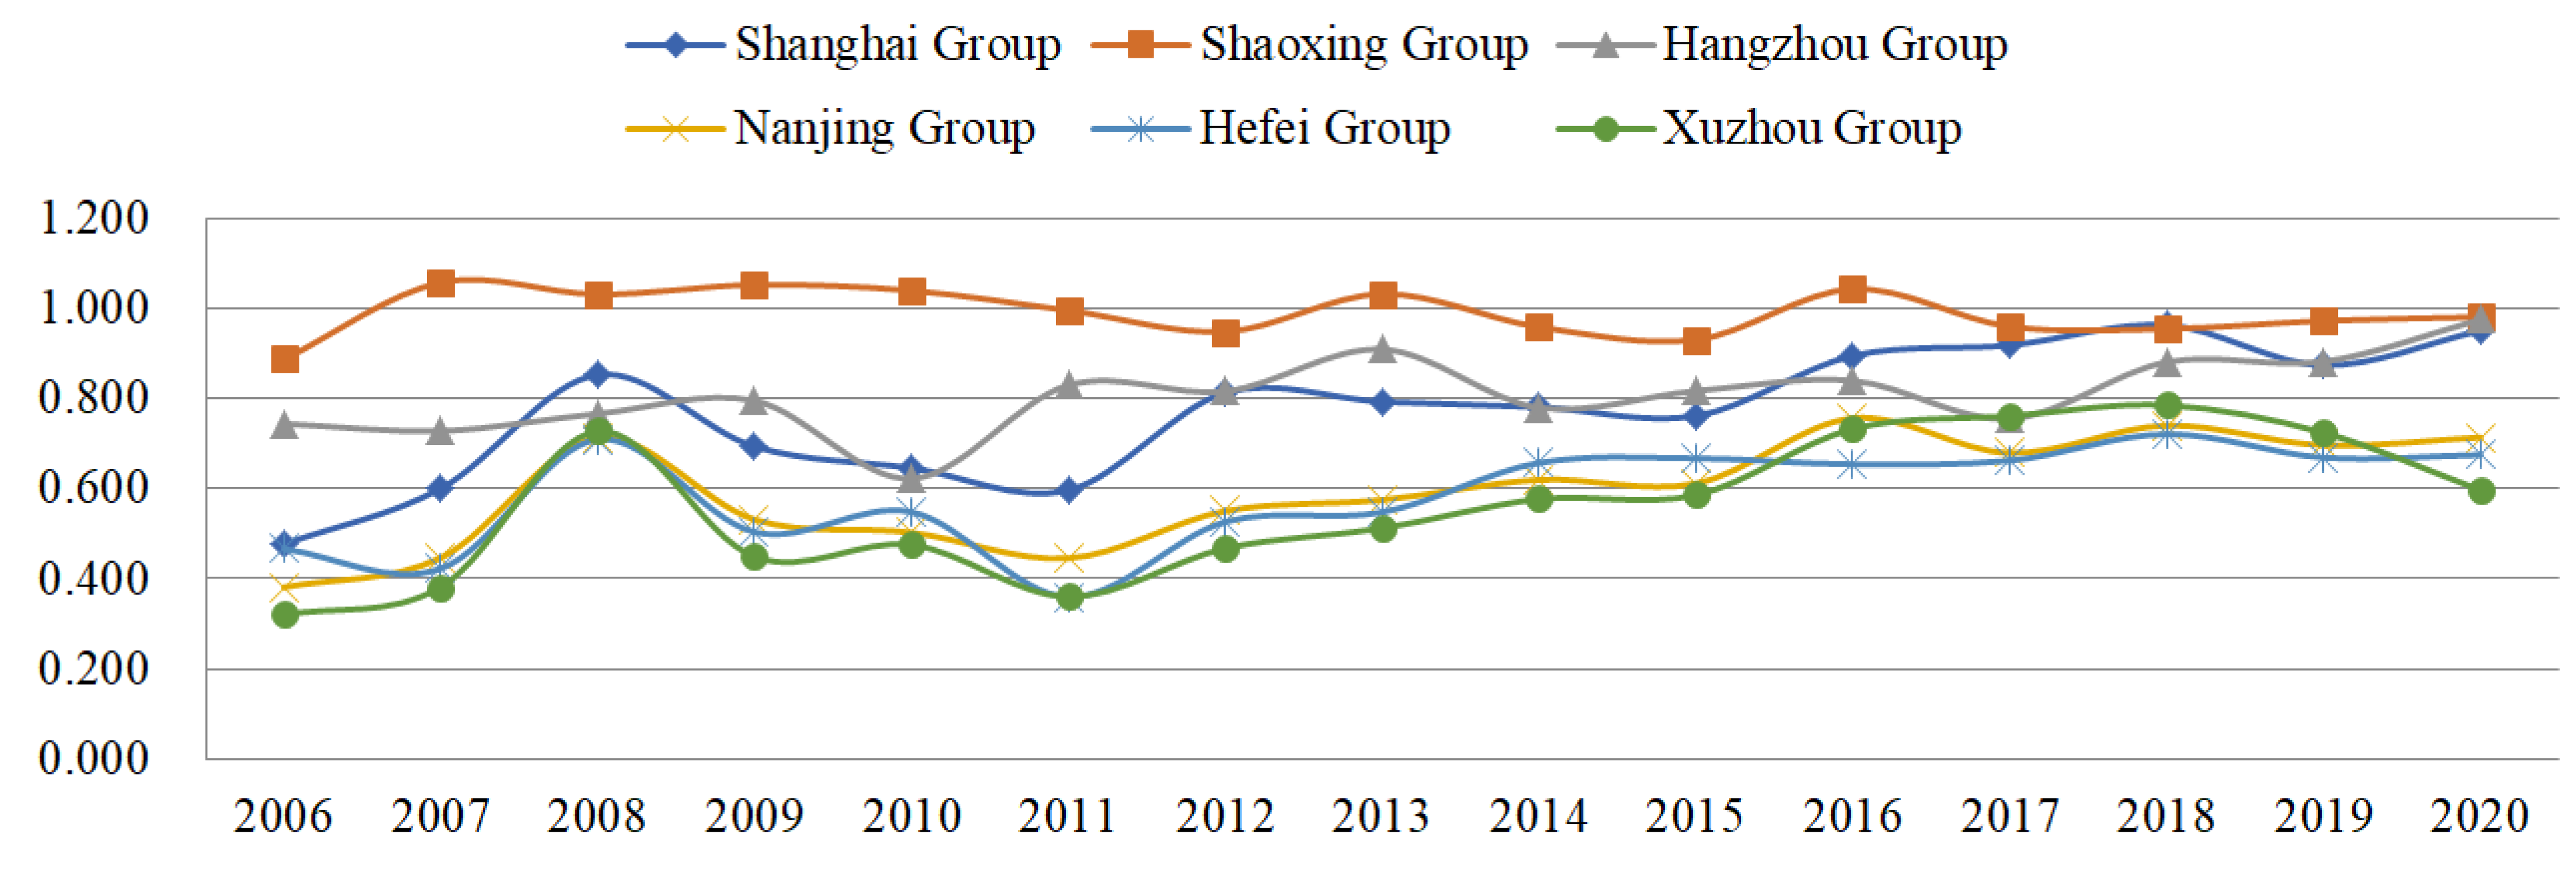
Figure 8.
Malmquist index and its decomposition of the air pollution control performance of each governance group.
Figure 8.
Malmquist index and its decomposition of the air pollution control performance of each governance group.
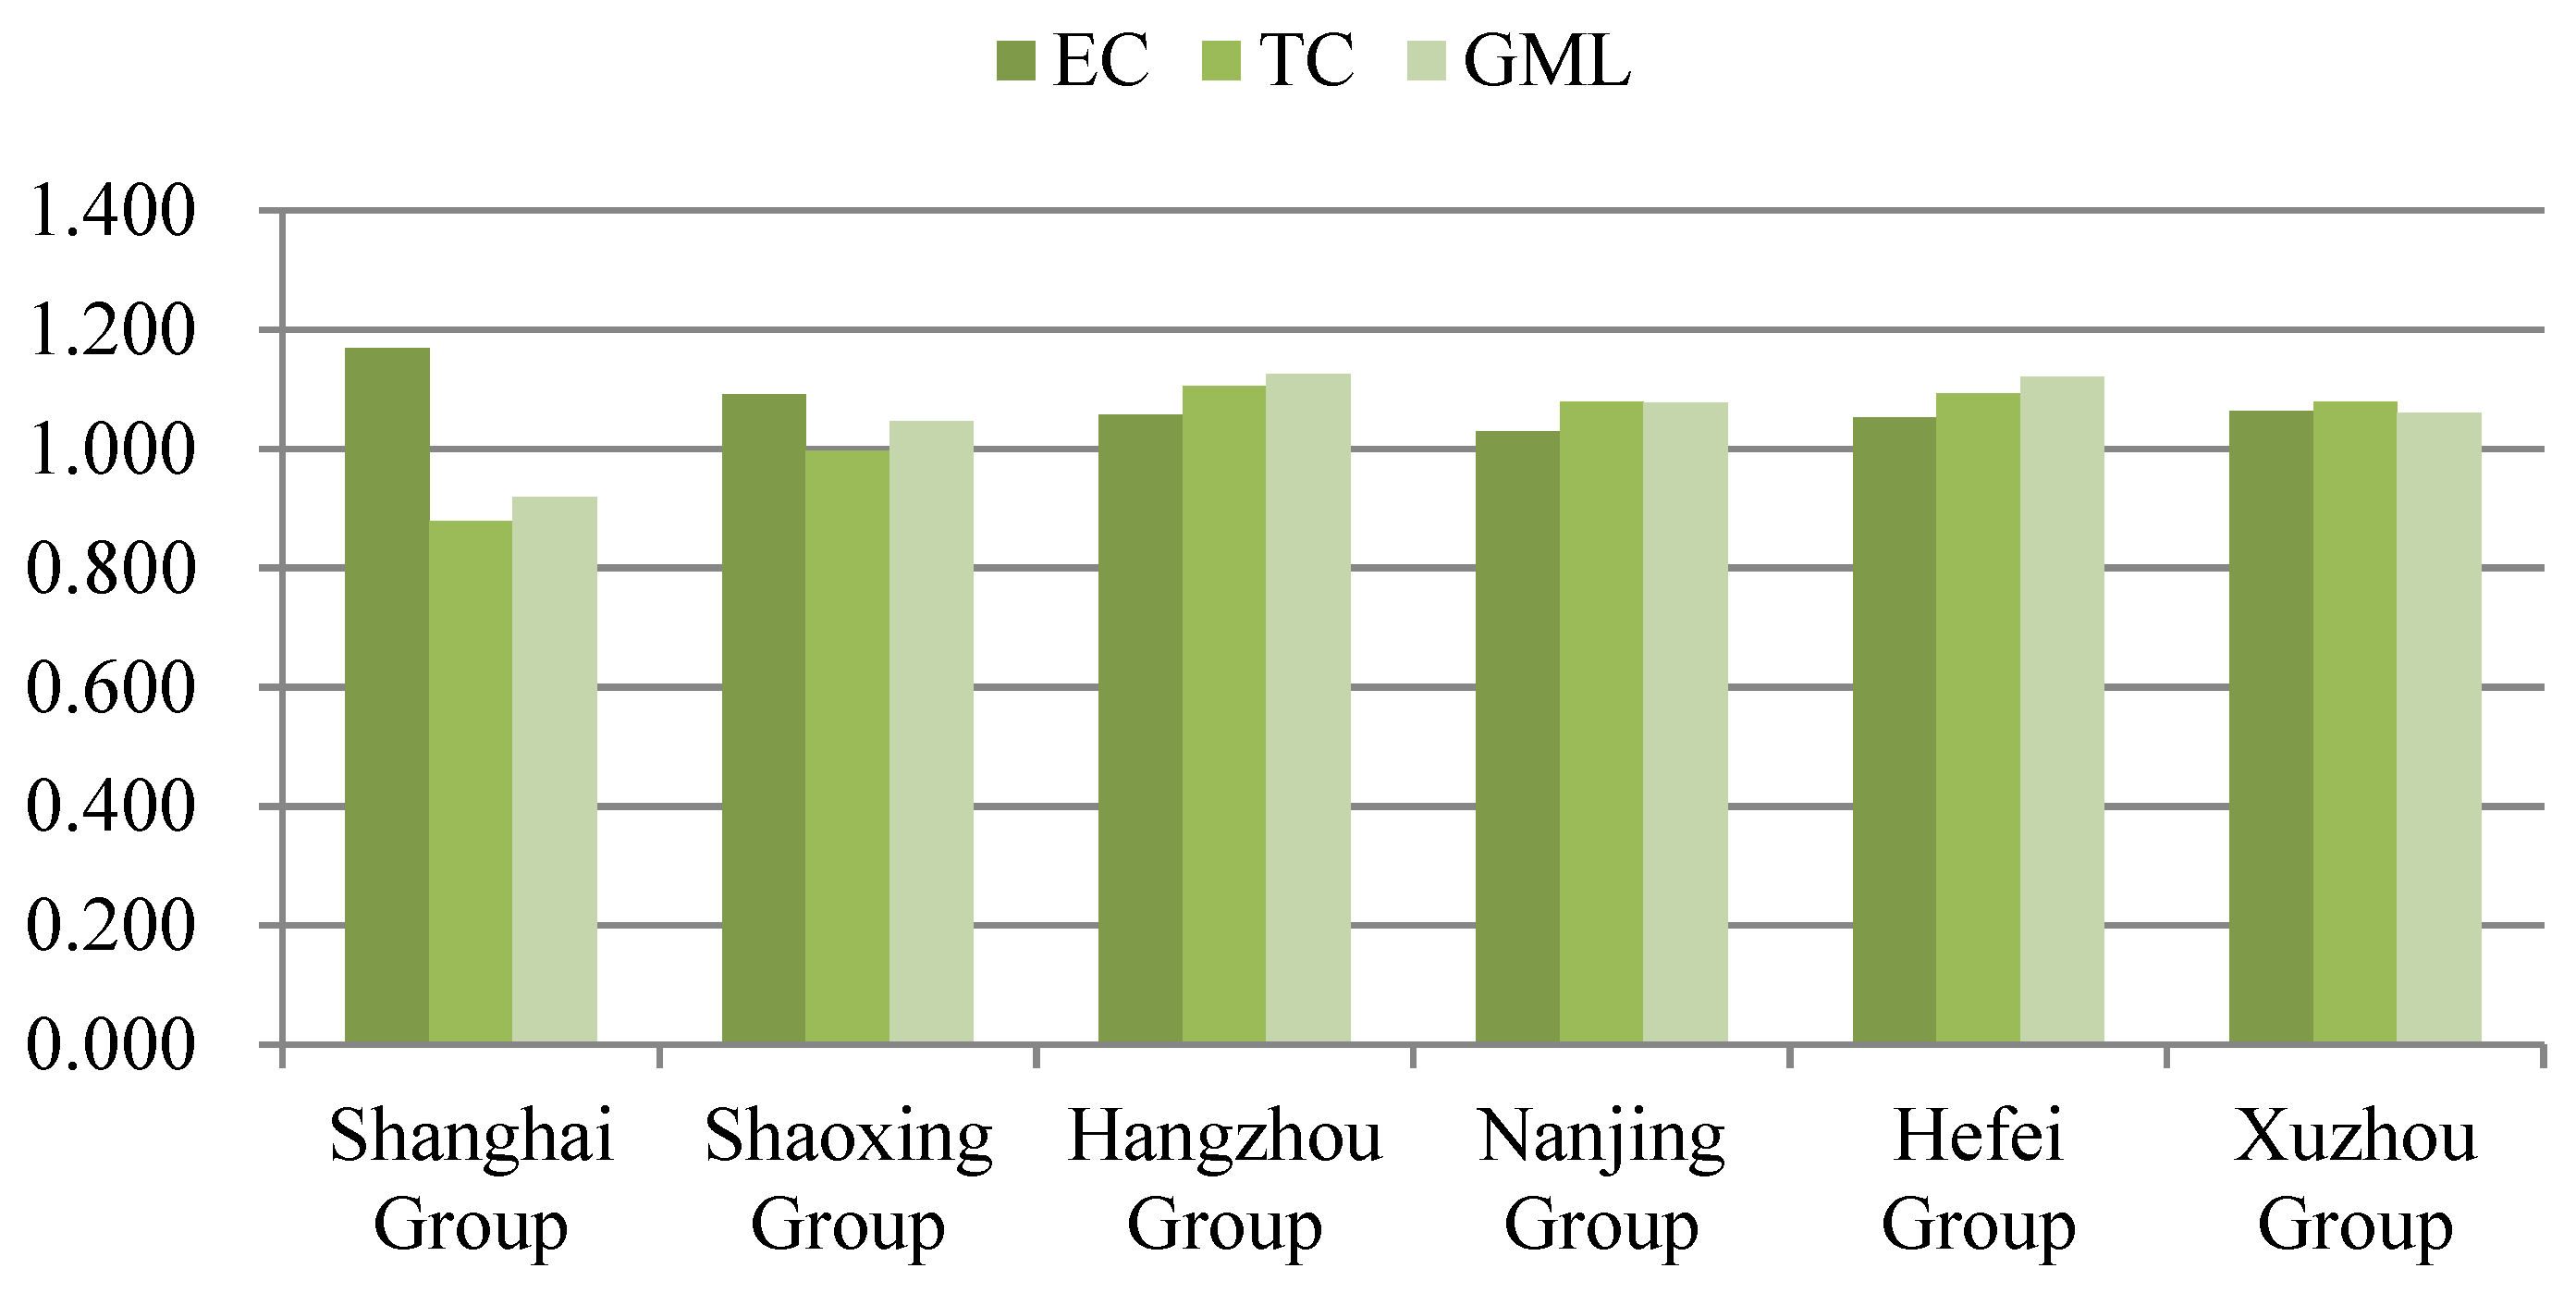
Figure 9.
Spatial evolution of air pollution control performance in the Yangtze River Delta region from 2006 to 2020. (a) Result for air pollution control performance in 2006. (b) Result for air pollution control performance in 2011. (c) Result for air pollution control performance in 2016. (d) Result for air pollution control performance in 2020.
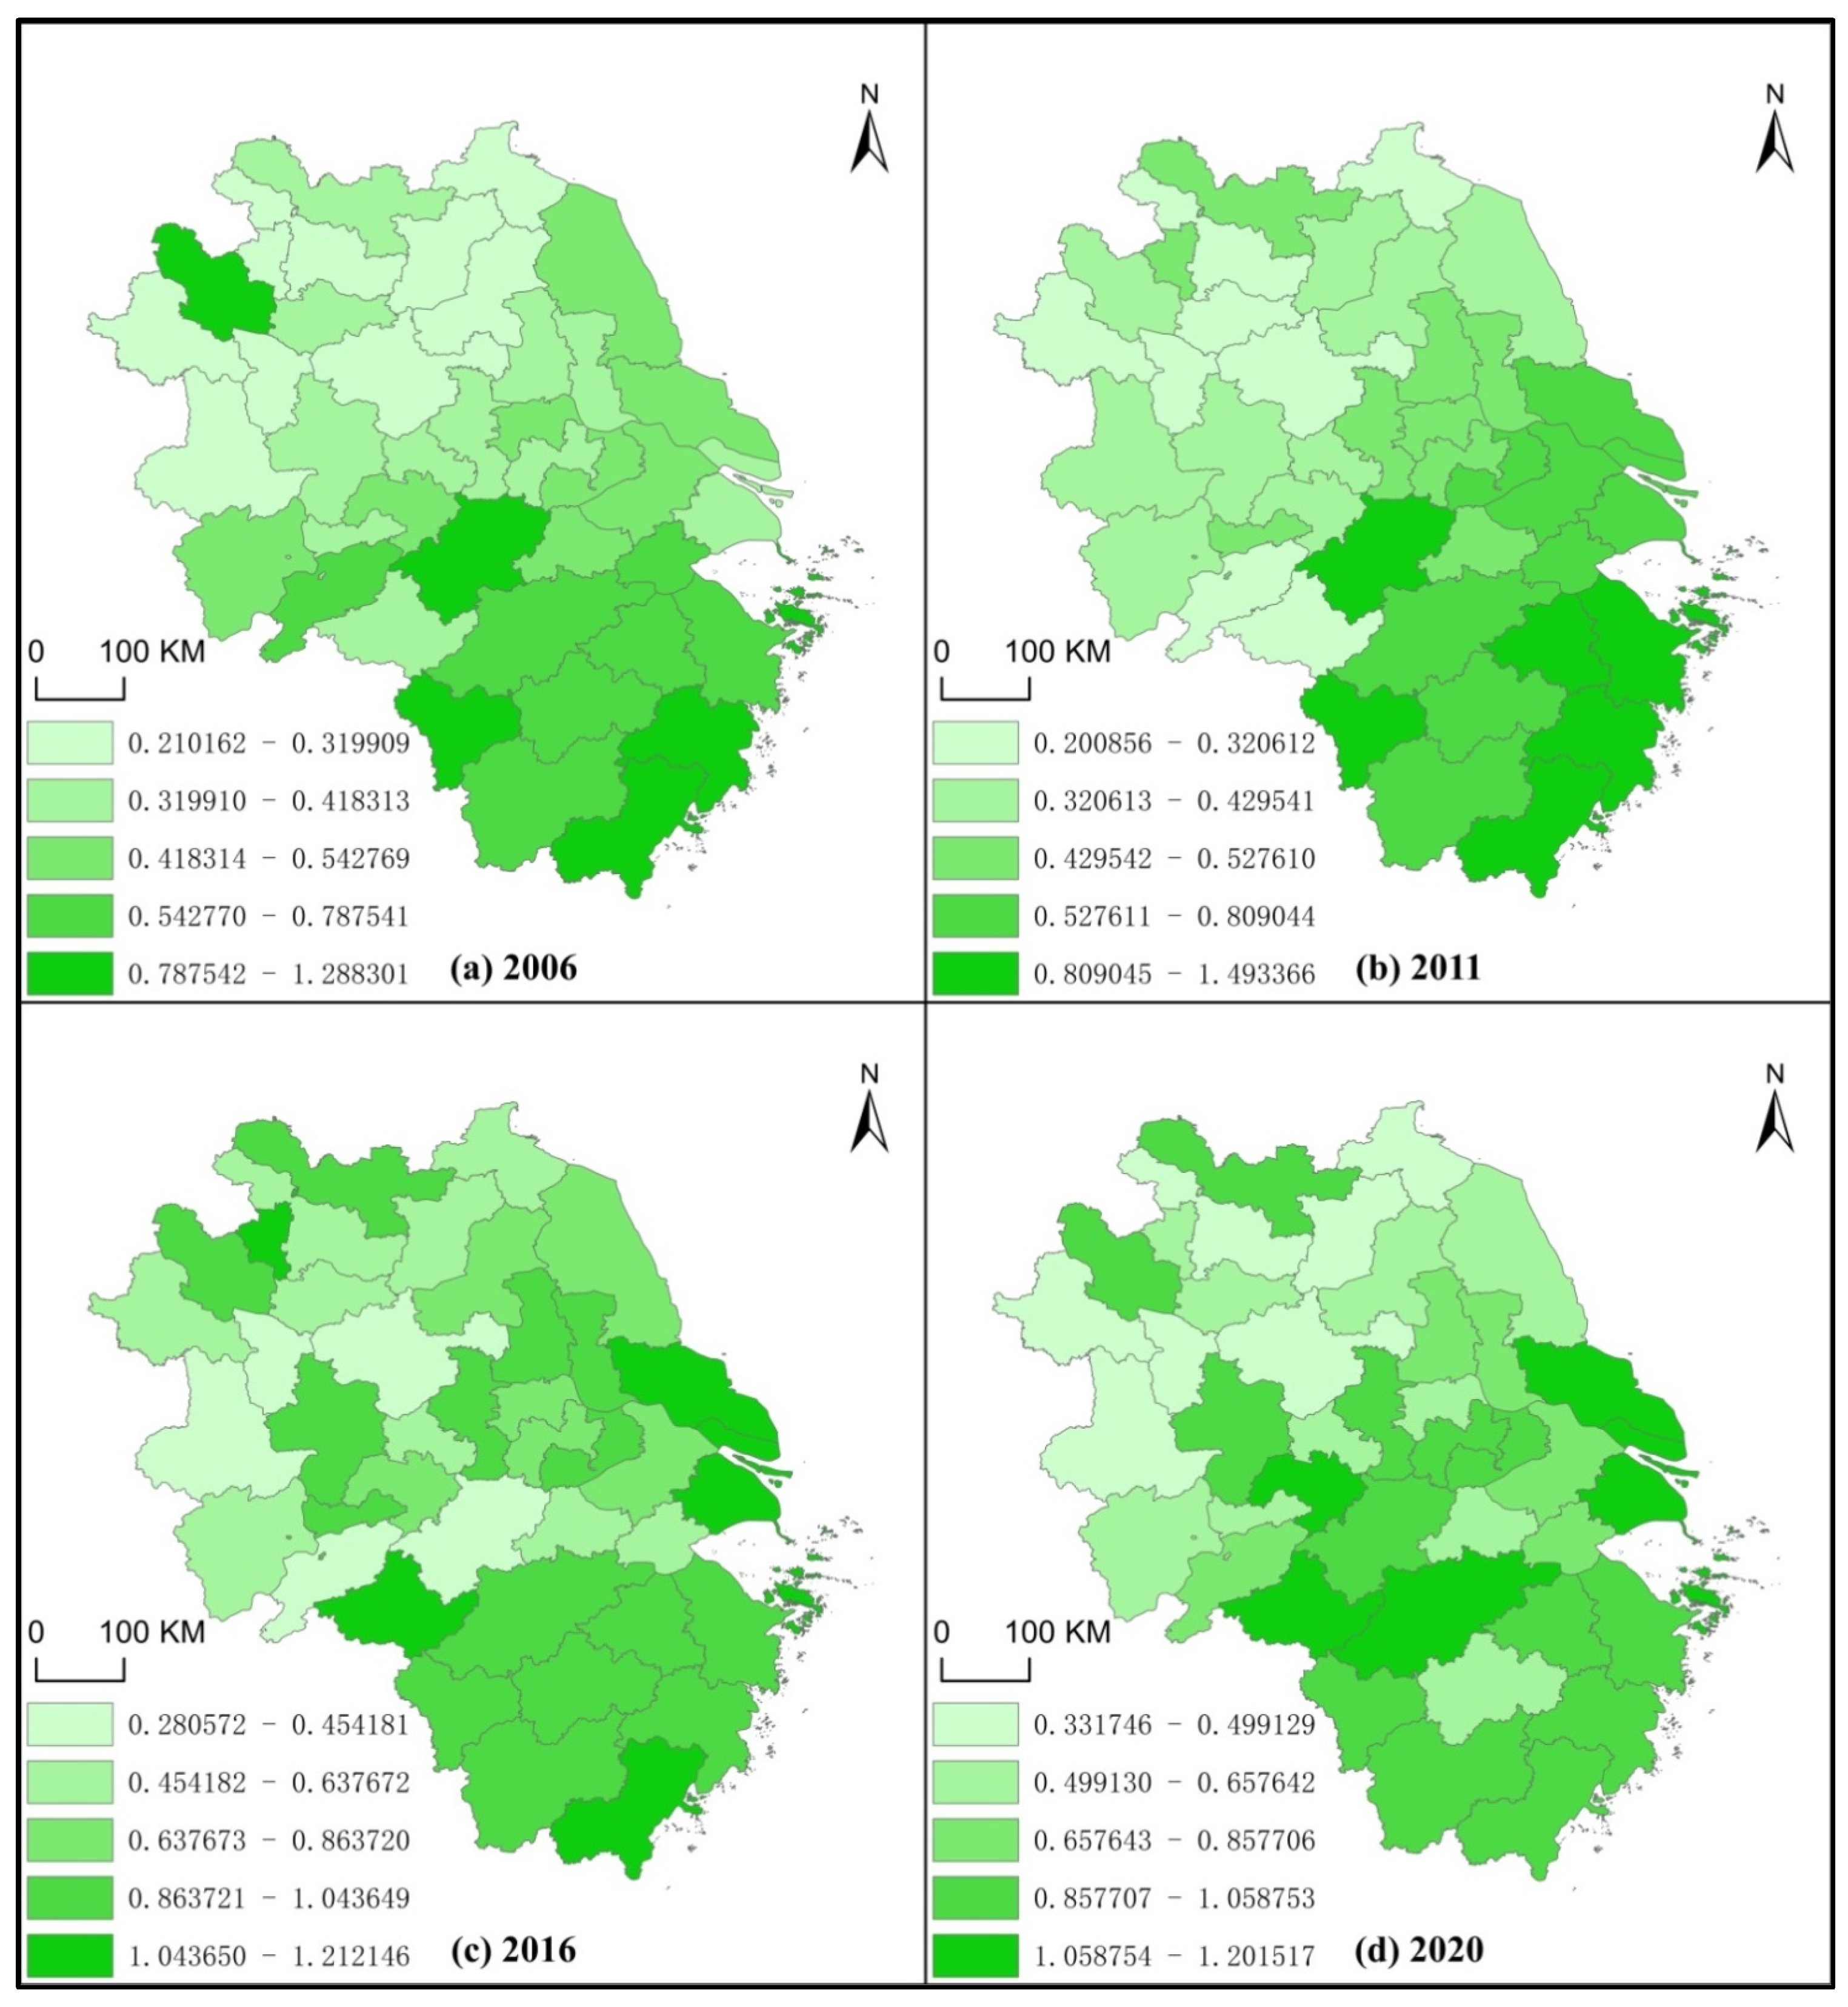

Table 1.
Air pollution control performance evaluation index system.
| Primary | Secondary | Tertiary | Indicator Variables |
|---|---|---|---|
| Input | Labor | The proportion of total employment in water, environment, public facilities management, and non-private employment (%) | |
| Capital | The proportion of investment in environmental pollution control relative to GDP (%) | ||
| Land | The greening coverage of built-up areas (%) | ||
| Output | Expected | Economic | The GDP produced per unit of CO2 emissions (billion CNY/million tons) |
| Ecological | The harmless domestic waste treatment rate (%) and the industrial solid waste treatment rate (%) | ||
| Unexpected | PM2.5 | Annual average concentration of fine particulate matter (PM2.5) (µg/m3) |
Table 2.
Descriptive statistics for the independent variables.
| IS | TP | IS*TP | ED | UR | TD | TE | PR | |
|---|---|---|---|---|---|---|---|---|
| Obs. | 615 | 615 | 615 | 615 | 615 | 615 | 615 | 615 |
| Mean | 0.4244 | 5.0136 | 2.2303 | 10.7422 | 0.5804 | 1.3707 | 16.2677 | 1.3160 |
| Std.Dev. | 0.0820 | 2.0023 | 1.2167 | 0.7515 | 0.1336 | 0.4976 | 0.7073 | 0.3708 |
| Min | 0.2340 | 0.0000 | 0.0000 | 8.2963 | 0.2453 | 0.5358 | 14.1942 | 0.5741 |
| Max | 0.7315 | 9.2697 | 6.6928 | 12.2011 | 0.8970 | 4.8317 | 18.0906 | 2.4998 |
Table 3.
Air pollution control performance of 41 cities in the Yangtze River Delta region.
| Province | City | Group | Average Score | Rank |
|---|---|---|---|---|
| Zhejiang | Wenzhou | Shaoxing regional governance group | 1.222 | 1 |
| Zhejiang | Zhoushan | Shaoxing regional governance group | 1.183 | 2 |
| Zhejiang | Quzhou | Hangzhou regional governance group | 1.077 | 3 |
| Zhejiang | Shaoxing | Shaoxing regional governance group | 0.975 | 4 |
| Zhejiang | Ningbo | Shaoxing regional governance group | 0.962 | 5 |
| Zhejiang | Taizhou | Shaoxing regional governance group | 0.961 | 6 |
| Zhejiang | Lishui | Shaoxing regional governance group | 0.95 | 7 |
| Jiangsu | Nantong | Shanghai regional governance group | 0.919 | 8 |
| Zhejiang | Hangzhou | Hangzhou regional governance group | 0.879 | 9 |
| Anhui | Xuancheng | Hangzhou regional governance group | 0.863 | 10 |
| Jiangsu | Wuxi | Shanghai regional governance group | 0.852 | 11 |
| Anhui | Bozhou | Hefei regional governance group | 0.826 | 12 |
| Shanghai | Shanghai | Shanghai regional governance group | 0.807 | 13 |
| Anhui | Hefei | Hefei regional governance group | 0.759 | 14 |
| Jiangsu | Nanjing | Nanjing regional governance group | 0.742 | 15 |
| Jiangsu | Suzhou | Shanghai regional governance group | 0.734 | 16 |
| Jiangsu | Taizhou | Nanjing regional governance group | 0.725 | 17 |
| Jiangsu | Yangzhou | Nanjing regional governance group | 0.719 | 18 |
| Jiangsu | Xuzhou | Xuzhou regional governance group | 0.706 | 19 |
| Anhui | Huaibei | Xuzhou regional governance group | 0.689 | 20 |
| Zhejiang | Jinhua | Shaoxing regional governance group | 0.682 | 21 |
| Anhui | Wuhu | Hefei regional governance group | 0.679 | 22 |
| Jiangsu | Changzhou | Shanghai regional governance group | 0.675 | 23 |
| Anhui | Tongling | Hefei regional governance group | 0.671 | 24 |
| Zhejiang | Jiaxing | Shanghai regional governance group | 0.663 | 25 |
| Anhui | Huangshan | Hangzhou regional governance group | 0.655 | 26 |
| Jiangsu | Yancheng | Xuzhou regional governance group | 0.636 | 27 |
| Jiangsu | Zhenjiang | Nanjing regional governance group | 0.615 | 28 |
| Anhui | Anqing | Hefei regional governance group | 0.603 | 29 |
| Zhejiang | Huzhou | Hangzhou regional governance group | 0.576 | 30 |
| Jiangsu | Huaian | Xuzhou regional governance group | 0.574 | 31 |
| Anhui | Fuyang | Hefei regional governance group | 0.537 | 32 |
| Anhui | Suzhou | Xuzhou regional governance group | 0.515 | 33 |
| Jiangsu | Suqian | Xuzhou regional governance group | 0.503 | 34 |
| Anhui | Maanshan | Nanjing regional governance group | 0.482 | 35 |
| Anhui | Chizhou | Hefei regional governance group | 0.466 | 36 |
| Anhui | Bengbu | Xuzhou regional governance group | 0.447 | 37 |
| Jiangsu | Lianyungang | Xuzhou regional governance group | 0.445 | 38 |
| Anhui | Liuan | Hefei regional governance group | 0.42 | 39 |
| Anhui | Huaian | Hefei regional governance group | 0.32 | 40 |
| Anhui | Chuzhou | Nanjing regional governance group | 0.306 | 41 |
Table 4.
Malmquist index and its decomposition of air pollution control performance from 2006 to 2020.
Table 4.
Malmquist index and its decomposition of air pollution control performance from 2006 to 2020.
| Period | EC | TC | GML |
|---|---|---|---|
| 2006–2007 | 1.053 | 1.075 | 1.060 |
| 2007–2008 | 1.166 | 1.004 | 1.103 |
| 2008–2009 | 1.124 | 1.017 | 1.038 |
| 2009–2010 | 1.098 | 1.064 | 1.066 |
| 2010–2011 | 1.049 | 1.003 | 1.020 |
| 2011–2012 | 1.018 | 1.064 | 1.037 |
| 2012–2013 | 1.060 | 1.094 | 1.074 |
| 2013–2014 | 1.056 | 1.026 | 1.026 |
| 2014–2015 | 1.152 | 1.008 | 1.119 |
| 2015–2016 | 1.065 | 1.045 | 1.050 |
| 2016–2017 | 0.986 | 1.067 | 1.016 |
| 2017–2018 | 1.028 | 1.008 | 1.013 |
| 2018–2019 | 1.102 | 1.073 | 1.124 |
| 2019–2020 | 1.104 | 1.043 | 1.111 |
| Mean | 1.076 | 1.042 | 1.061 |
Table 5.
Global Moran’s index statistics of the air pollution control performance from 2006 to 2020.
Table 5.
Global Moran’s index statistics of the air pollution control performance from 2006 to 2020.
| Year | Moran’s I | Z | p-Value |
|---|---|---|---|
| 2006 | 0.1106 | 6.2487 | 0.000 |
| 2007 | 0.1911 | 9.9349 | 0.000 |
| 2008 | 0.0427 | 3.0758 | 0.002 |
| 2009 | 0.1447 | 7.7435 | 0.000 |
| 2010 | 0.1133 | 6.2987 | 0.000 |
| 2011 | 0.1617 | 8.6148 | 0.000 |
| 2012 | 0.1158 | 6.375 | 0.000 |
| 2013 | 0.1355 | 7.2326 | 0.000 |
| 2014 | 0.0417 | 2.9969 | 0.003 |
| 2015 | 0.0338 | 2.6379 | 0.008 |
| 2016 | 0.0408 | 2.9558 | 0.003 |
| 2017 | −0.0054 | 0.9177 | 0.359 |
| 2018 | 0.0095 | 1.5536 | 0.120 |
| 2019 | −0.0001 | 1.1113 | 0.266 |
| 2020 | 0.0757 | 4.5024 | 0.000 |
Table 6.
Regression results of the OLS, SLM, and SEM.
| Variables | OLS (1) | SLM (2) | SEM (3) |
|---|---|---|---|
| IS | 1.251 *** | −0.205 | −0.219 |
| (0.398) | (0.469) | (0.470) | |
| TP | −0.0126 | −0.0877 *** | −0.0884 *** |
| (0.0286) | (0.0280) | (0.0286) | |
| IS*TP | −0.0243 | 0.116 * | 0.118 * |
| (0.0632) | (0.0679) | (0.0692) | |
| ED | 0.184 *** | 0.135 ** | 0.134 ** |
| (0.0347) | (0.0587) | (0.0586) | |
| UR | −0.454 *** | −0.163 | −0.166 |
| (0.171) | (0.293) | (0.294) | |
| TD | −0.0674 *** | 0.0439 | 0.0437 |
| (0.0226) | (0.0355) | (0.0356) | |
| TE | 0.0635 *** | 0.0294 | 0.0300 |
| (0.0162) | (0.0700) | (0.0699) | |
| PR | 0.0764 ** | −0.00110 | −0.000273 |
| (0.0318) | (0.0467) | (0.0468) | |
| Constant | −2.462 *** | ||
| (0.337) | |||
| Rho | −0.0839 | ||
| (0.185) | |||
| lambda | −0.0194 | ||
| (0.187) | |||
| sigma2_e | 0.0279 *** | 0.0279 *** | |
| (0.00159) | (0.00159) | ||
| LM | 13.70 *** | 106.75 *** | |
| LR | 63.62 *** | 63.82 *** | |
| Observations | 615 | 615 | 615 |
| R-squared | 0.319 | 0.188 | 0.190 |
Notes: standard errors in parentheses; *** p < 0.01, ** p < 0.05, * p < 0.1.
Table 7.
Regression results of the SDM.
| Variables | (1) | (2) | Variables | (3) | (4) |
|---|---|---|---|---|---|
| IS | −0.0564 | 0.166 | W*IS | 13.22 *** | 12.60 *** |
| (0.530) | (0.562) | (3.735) | (4.108) | ||
| TP | −0.100 *** | −0.0918 *** | W*TP | 0.876 *** | 1.038 *** |
| (0.0280) | (0.0300) | (0.222) | (0.248) | ||
| IS*TP | 0.108 | 0.0952 | W*IS*TP | −2.998 *** | −3.519 *** |
| (0.0684) | (0.0744) | (0.617) | (0.685) | ||
| ED | −0.0535 | 0.0300 | W*ED | −0.406 | −0.652 |
| (0.0686) | (0.0746) | (0.367) | (0.460) | ||
| UR | −0.0516 | −0.369 | W*UR | 2.952 | 0.494 |
| (0.290) | (0.314) | (2.620) | (3.024) | ||
| TD | 0.000213 | −0.00172 | W*TD | 0.169 | −0.0782 |
| (0.0355) | (0.0404) | (0.323) | (0.385) | ||
| TE | 0.121 | 0.0661 | W*TE | −0.274 | −0.320 |
| (0.103) | (0.106) | (0.450) | (0.470) | ||
| PR | 0.236 *** | 0.128 | W*PR | −1.003 *** | −0.331 |
| (0.0826) | (0.0906) | (0.331) | (0.349) | ||
| sigma2_e | 0.0249 *** | 0.0250 *** | Rho | −0.537 ** | −0.552 ** |
| (0.00143) | (0.00148) | (0.217) | (0.229) | ||
| Wald | 67.28 *** | 60.52 *** | Hausman | 29.81 *** | 37.63 *** |
| Observations | 615 | 574 | 615 | 574 | |
| R-squared | 0.188 | 0.084 | 0.188 | 0.084 |
Notes: standard errors in parentheses; *** p < 0.01, ** p < 0.05.
Table 8.
Direct and indirect effects of the SDM.
| Variables | Direct (1) | Indirect (2) | Total (3) | Direct (4) | Indirect (5) | Total (6) |
|---|---|---|---|---|---|---|
| IS | −0.215 | 9.144 *** | 8.929 *** | 0.0139 | 8.570 *** | 8.584 *** |
| (0.554) | (2.648) | (2.618) | (0.587) | (2.878) | (2.837) | |
| TP | −0.113 *** | 0.644 *** | 0.531 *** | −0.107 *** | 0.746 *** | 0.639 *** |
| (0.0277) | (0.161) | (0.161) | (0.0297) | (0.177) | (0.179) | |
| IS*TP | 0.152 ** | −2.118 *** | −1.966 *** | 0.148 ** | −2.448 *** | −2.300 *** |
| (0.0678) | (0.466) | (0.478) | (0.0735) | (0.517) | (0.530) | |
| ED | −0.0476 | −0.255 | −0.303 | 0.0398 | −0.447 | −0.407 |
| (0.0698) | (0.270) | (0.244) | (0.0757) | (0.334) | (0.310) | |
| UR | −0.0828 | 1.848 | 1.766 | −0.370 | 0.258 | −0.112 |
| (0.270) | (1.808) | (1.834) | (0.289) | (2.024) | (2.066) | |
| TD | −3.64 × 10⁻⁵ | 0.103 | 0.103 | 0.00170 | −0.0661 | −0.0644 |
| (0.0341) | (0.216) | (0.216) | (0.0386) | (0.253) | (0.255) | |
| TE | 0.126 | −0.240 | −0.114 | 0.0718 | −0.252 | −0.180 |
| (0.113) | (0.338) | (0.252) | (0.116) | (0.351) | (0.264) | |
| PR | 0.249 *** | −0.760 *** | −0.511 *** | 0.131 | −0.266 | −0.135 |
| (0.0891) | (0.269) | (0.198) | (0.0970) | (0.279) | (0.199) | |
| Observations | 615 | 615 | 615 | 574 | 574 | 574 |
| Number of IDs | 41 | 41 | 41 | 41 | 41 | 41 |
Notes: standard errors in parentheses; *** p < 0.01, ** p < 0.05.
Table 9.
Direct and indirect effects of the SDM in the six regional governance groups of the Yangtze River Delta region.
Table 9.
Direct and indirect effects of the SDM in the six regional governance groups of the Yangtze River Delta region.
| Variables | (1) | (2) | (3) | (4) | (5) | (6) | |
|---|---|---|---|---|---|---|---|
| IS | Direct | −1.51 | 5.381 *** | −2.153 | −0.481 | −3.277 ** | 3.402 *** |
| (−2.779) | (−1.774) | (−1.72) | (−0.882) | (−1.329) | (−1.151) | ||
| Indirect | 15.97 *** | 4.784 | 5.487 | 3.248 | 7.573 ** | 5.582 ** | |
| (−5.983) | (−5.11) | (−3.972) | (−2.648) | (−3.257) | (−2.606) | ||
| Total | 14.46 ** | 10.16 * | 3.334 | 2.767 | 4.295 | 8.984 *** | |
| (−6.432) | (−5.535) | (−3.31) | (−2.87) | (−3.562) | (−2.724) | ||
| TP | Direct | −0.181 | 0.454 *** | −0.135 | −0.0957 ** | −0.193 *** | 0.224 *** |
| (−0.141) | (−0.155) | (−0.0924) | (−0.0441) | (−0.0663) | (−0.0843) | ||
| Indirect | 0.972 *** | 0.221 | 0.485 ** | 0.0846 | −0.0858 | 0.642 *** | |
| (−0.282) | (−0.32) | (−0.205) | (−0.143) | (−0.163) | (−0.184) | ||
| Total | 0.790 *** | 0.674 | 0.349 | −0.0112 | −0.279 * | 0.866 *** | |
| (−0.288) | (−0.41) | (−0.226) | (−0.159) | (−0.151) | (−0.202) | ||
| IS*TP | Direct | 0.309 | −0.839 *** | 0.337 | 0.107 | 0.516 *** | −0.587 *** |
| (−0.33) | (−0.321) | (−0.229) | (−0.136) | (−0.161) | (−0.215) | ||
| Indirect | −2.460 *** | −0.284 | −0.651 | −0.347 | −0.451 | −1.706 *** | |
| (−0.649) | (−0.734) | (−0.492) | (−0.419) | (−0.445) | (−0.504) | ||
| Total | −2.151 *** | −1.123 | −0.314 | −0.24 | 0.0653 | −2.292 *** | |
| (−0.65) | (−0.88) | (−0.585) | (−0.461) | (−0.417) | (−0.522) | ||
| Observations | 90 | 105 | 75 | 90 | 135 | 120 | |
| Number of IDs | 6 | 7 | 5 | 6 | 9 | 8 | |
Notes: standard errors in parentheses; *** p < 0.01, ** p < 0.05, * p < 0.1; column (1) represents the Shanghai regional governance group; column (2) represents the Shaoxing regional governance group; column (3) represents the Hangzhou regional governance group; column (4) represents the Nanjing regional governance group; column (5) represents the Hefei regional governance group; column (6) represents the Xuzhou regional governance group.
Table 10.
Estimation results after replacing the spatial weight matrix.
| Variables | Direct (1) | Indirect (2) | Total (3) | Direct (4) | Indirect (5) | Total (6) |
|---|---|---|---|---|---|---|
| IS | −0.364 | 5.349 * | 4.985 * | −0.167 | 7.263 ** | 7.096 ** |
| (0.536) | (2.947) | (2.927) | (0.563) | (3.248) | (3.226) | |
| TP | −0.0894 *** | 0.303 * | 0.214 | −0.0779 *** | 0.470 ** | 0.392 ** |
| (0.0282) | (0.168) | (0.170) | (0.0297) | (0.194) | (0.196) | |
| IS*TP | 0.121 * | −0.815 * | −0.694 | 0.0976 | −1.698 *** | −1.600 *** |
| (0.0686) | (0.478) | (0.493) | (0.0734) | (0.547) | (0.563) | |
| Observations | 615 | 615 | 615 | 574 | 574 | 574 |
| Number of IDs | 41 | 41 | 41 | 41 | 41 | 41 |
Notes: standard errors in parentheses; *** p < 0.01, ** p < 0.05, * p < 0.1.
Disclaimer/Publisher’s Note: The statements, opinions and data contained in all publications are solely those of the individual author(s) and contributor(s) and not of MDPI and/or the editor(s). MDPI and/or the editor(s) disclaim responsibility for any injury to people or property resulting from any ideas, methods, instructions or products referred to in the content. |
© 2023 by the authors. Licensee MDPI, Basel, Switzerland. This article is an open access article distributed under the terms and conditions of the Creative Commons Attribution (CC BY) license (https://creativecommons.org/licenses/by/4.0/).
Share and Cite
MDPI and ACS Style
Sun, Y.; Xu, B. Spillover Effects and Performance Optimization of Air Pollution Control Policies: Evidence from the Yangtze River Delta Region, China. Systems 2023, 11, 418. https://doi.org/10.3390/systems11080418
AMA Style
Sun Y, Xu B. Spillover Effects and Performance Optimization of Air Pollution Control Policies: Evidence from the Yangtze River Delta Region, China. Systems. 2023; 11(8):418. https://doi.org/10.3390/systems11080418
Chicago/Turabian StyleSun, Yanming, and Binkai Xu. 2023. "Spillover Effects and Performance Optimization of Air Pollution Control Policies: Evidence from the Yangtze River Delta Region, China" Systems 11, no. 8: 418. https://doi.org/10.3390/systems11080418
Note that from the first issue of 2016, this journal uses article numbers instead of page numbers. See further details here.