Article

Urban Networks in the Yangtze River Delta from the Perspective of Transaction Linkages in Manufacturing Industries: Characteristics, Determinants, and Strategies for Intercity Integration Development

School of Architecture, Southeast University, Nanjing 210096, China
*
Author to whom correspondence should be addressed.
Systems 2023, 11(8), 401; https://doi.org/10.3390/systems11080401
Submission received: 29 May 2023 / Revised: 27 July 2023 / Accepted: 31 July 2023 / Published: 3 August 2023
(This article belongs to the Special Issue Frontiers in Complex Network Theory and Its Applications)

Abstract

:
In recent years, manufacturing development has received renewed attention from developing and developed countries alike. As mega-city regions (MCRs) are where manufacturing industries converge, the research on urban networks of MCRs under the dominance of manufacturing transaction linkages is currently insufficient. Based on the buyer–supplier linkages of listed manufacturing firms, this paper investigated the characteristics of the urban network in the Yangtze River Delta region (YRDR) in China using the social network analysis method; explored the determinants of nodal centrality and city dyads of the urban network by the stepwise regression and quadratic assignment procedures, respectively; and proposes a “characteristics-determinants-strategies” technical framework for the analysis and optimization of interurban collaboration in manufacturing transactions within MCRs. The findings were as follows: (1) The characteristics of the urban manufacturing transaction networks differed from those of transaction linkages of advanced producer services (APS) firms, intra-firm organization hierarchies, and innovation cooperation networks; (2) the network and geographical “core-periphery” structure of urban power and the circulation corridor of the urban manufacturing transaction network was formed within the YRDR; (3) cooperation parks, innovation collaboration, high-speed rail (HSR) linkage, and geographical proximity between cities were found to facilitate the formation of urban manufacturing transaction networks, and the similarity of industry structures and driving distance between cities inhibits the network; (4) the number of urban industrial firms, GDP per capita, and city government spending on science and technology contributed to the centrality of a city in urban manufacturing transaction networks, while the urban population in a city had a negative impact. The research provides a complementary perspective to the urban network research of MCRs under the perspective of production factors and product circulation and provides policy and urban planning insights for the synergistic development of interurban manufacturing in MCRs.

1. Introduction

Since the 1990s, with the rapid development of logistics, information, and communication technology, the international trade system led by the globalized industrial division of labor of transnational corporations has been gradually established [1]. The manufacturing capacity of developed countries has been generally shifting to developing countries with lower production costs. In recent years, with the impact of global public health events, regional conflicts, and sluggish local employment, some developed countries have begun to attach new importance to the manufacturing industries for their domestic economic development and have put forward policies to “move back” manufacturing industries [2,3]. The development of manufacturing industries is not only valued by developed countries [4] but has also received attention from developing countries [4,5,6]. As an important indicator of international competitiveness, manufacturing industries have received widespread attention from developing countries such as China, Thailand, and Vietnam.
For developing countries, manufacturing firms tend to be concentrated in MCRs. Manufacturing firms tend to reduce transaction costs through spatial agglomeration; thus, manufacturing firms tend to be concentrated in a country’s major mega-city regions (MCRs). MCRs began to develop into important participating units in global economic competition in the early 21st century by relying on functional and spatial intercity connections. Synergistic development among cities in the manufacturing sector is related to the sustainable industrial development of MCRs and the country’s global competitiveness. Networked linkages between cities are the main manifestation of synergistic development between cities within the MCR, while the research on the intercity linkages within MCRs in the manufacturing sector remains insufficient. Firstly, urban network research within MCRs is influenced by the research path of world city network (WCN) research and pays more attention to the urban network led by advanced producer services (APS), while paying less attention to the manufacturing sector. Secondly, the research related to the urban network in the manufacturing sector pays more attention to the organizational characteristics of the urban network from the perspectives of intra-firm headquarters–branch relationships and inter-firm investment relationships and lacks sufficient research on the widespread transactional relationship among manufacturing enterprises. Therefore, this study focuses on the following questions: (1) What do the characteristics of the urban network led by the transaction linkages of leading manufacturing firms within MCRs look like? (2) What are the determinants of the interurban linkage? (3) How can policy and regional planning strategies be optimized based on the results of the analysis of the characteristics and the determinants of the urban network?

2. Literature Review

2.1. From WCN Research to Urban Networks of MCRs

The field of urban networks has a long history of interest in the flow of factors of production between cities. With the rise of economic globalization, the study of the WCN has gained widespread attention as an important approach to understanding globalization, and urban networks originated from the study of the WCN. Thus, the early stage of urban network research followed the attention of WCN research on the headquarters–branch relationship of advanced producer services (APS) and transnational corporations (TNC) [7,8,9,10,11], and the scale of urban network research in this period was also mainly at the global macro scale. For example, the Taylor and GaWC group has conducted a large number of empirical studies on WCNs since the 1990s [12,13,14], and a small number of them have expanded the analytical perspective from the economic dimension to the cultural, political, and social dimensions [15]. In recent years, some scholars have questioned the inclusiveness of the scope of WCN research and called for the introduction of global value chain (GVC) and global commodity chain (GCC) perspectives. Alternative analytical perspectives of urban networks with headquarters–branch relationships in APS have gradually begun to develop, and the attention of manufacturing industries has begun to increase in the study of urban networks. For example, Vind and Fold [16] argued that while APS may have initially led cities to globalization, manufacturing may also have established significant global linkages among cities, which has been particularly prominent in the case of “third world cities” whose globalization is based on export-oriented industrialization. A more inclusive analytical perspective to include these cities in the study of the WCN is required. To this end, they examined Ho Chi Minh City’s integration into economic globalization through the international division of labor in the production of electronic components, using the electronics industry’s commodity chains as an entry point [17]. Kraetke extended the perspective of the study of the WCN by empirically analyzing the characteristics of city networks dominated by globally operating manufacturing firms at the global macro scale [18].

2.2. Analytical Perspectives of Urban Network Reaserch of Mega-City Regions

Influenced by the study of the WCN, the study of urban systems is gradually drawing on the research methods of the WCN [19]. The perspectives of urban network research have also been greatly expanded: in addition to the perspective of the headquarters–branch relationship of intra-firm hierarchical organization, perspectives such as intra-company relationship data provide an alternative perspective to urban network research [20]. Related studies have focused on inter-company venture capital relationships [21], corporate public offerings [22], inter-firm project partnerships in the film industry [22], and freight forwarding services [23]. Urban network research perspectives can be grouped into the following categories: infrastructure and traffic flow perspectives, such as high-speed railroads [24], population movement measured by Tencent’s migration big data [25], and cell phone signaling data [26]. Sociocultural perspectives include Taylor’s study of world cities from an integrated economic, cultural, political, and social perspective [15]. Innovative collaboration perspectives focus on patent collaboration [27] and patent transfer [28,29,30]. Comprehensive studies of multidimensional networks, such as by Zhang et al. [31], have explored the influencing factors of different types of urban networks based on the analytical perspectives of transportation infrastructure linkages, producer service firm linkages, and leisure mobility in the YRDR.
However, although the development of manufacturing industries has received extensive attention from developed and developing countries alike, urban network research in the MCRs of the manufacturing sector remains relatively weak. It is worth mentioning that Wang et al. [32] focused on the urban network structure and influence mechanism under the domination of the headquarters–branch of listed manufacturing firms in the Beijing–Tianjin–Hebei region. A few studies in Chinese analyzed the characteristics of regional urban networks led by buyer–supplier relationship in the supply chains of leading firms in specific manufacturing industries, such as the automobile manufacturing industry [33] and the cell phone manufacturing industry [34]. For the research of interurban transaction linkages, most studies have focused on transactions of virtual products such as services, technology, etc. Hanssens et al. [35] introduced the transaction linkage of APS to study the functional polycentricity of the Central Belgium MCR. Rossi et al. identified decision cities and service cities in the APS using the transaction links of Brazilian headquarter companies and their customers [36]. Pan et al. [37] used the partnership of initial public offerings in APS as an entry point to study the network of financial centers among Chinese cities dominated by high-end financial transactions. In addition, technology transaction linkages between cities have received attention from researchers [38,39,40]. It is worth mentioning that Burger et al. [41] studied the functional linkages between cities within the Randstad MCR, which includes a focus on inter-firm buyer–supplier relations, but did not specialize in the functional linkages among cities dominated by inter-firm transaction relations in the manufacturing sector. Collectively, there are few studies in urban network research that use transactional relationships in the integrated manufacturing sector as an analytical lens.

2.3. Research Method of Urban Networks of Maga-City Region

Numerous scholars have studied the influencing factors of urban network formation in MCRs, and the influencing factors and mechanisms of urban networks differ from different analytical perspectives. However, the research methods of driving mechanisms of urban network structure mainly include the following categories: for the influencing factors and formation mechanisms of urban networks in MCRs, many scholars have carried out research based on multidimensional networks. For the micro mechanism of the urban network, the ERGM [42,43] and SAOM [44] models are widely used, and the QAP method [45] and its optimized method [46] are used to study the influencing factors of the formation of links between cities. There is a lack of research on the determinants of urban networks led by the transactional relationships of major manufacturing firms, and relatively little comprehensive research on the formation of city dyads and nodal centralities alike.

2.4. Urban Network Governance in Mega-City Regions

“Urban networks” have been introduced into national spatial policies in many countries, where governments expect more than two cities to cooperate for mutual benefit to become functionally integrated urban areas. In many countries or regions, such as Switzerland, the Netherlands, Germany, Poland, etc., cities in urban networks promote each other to enhance the overall competitiveness of the region. Many European countries have incorporated the idea of “networks” into their urban planning policies, but in different countries they have different names, such as urban networks (Belgium, Estonia, and the Netherlands), polycentric national centers (Denmark), twin cities (Greece), and linking gateways (Ireland) [47]. The logic of urban networking and polycentric development is also fully reflected in various types of regional spatial planning in MCRs in China, such as the YRDR and the Pearl River Delta [48]. Although the idea of urban networks has been incorporated into regional planning, the studies on urban network governance are still at the stage of theoretical discussions. In recent years, some scholars have discussed potential urban network research for coordination in fragmented and polycentric regions [49]. Some scholars have also focused on intercity cooperation in MCRs, such as Luo and Shen, who classified the patterns of intercity cooperation into three types: vertical partnership, spontaneous partnership, and hybrid partnership, based on empirical research of the YRDR [50]. However, few studies have proposed an integrated technical framework from analysis to strategy based on the empirical research of characteristics and determinants of cooperative relationships among MCR cities.

2.5. Research Gap

Based on a systematic review of WCN studies to MCR city network studies, regional-scale city network studies still need to be improved. First, urban network studies originated from WCN studies, thus continuing the preference for APS and TNC. Although the analytical perspectives of urban network studies at the regional scale have been greatly expanded, urban network research from the manufacturing industry’s perspective is still insufficient, and even fewer studies have been conducted on the transactional relationships of manufacturing firms. In contrast to the headquarters–branch linkages or investment relationships dominated by major manufacturing firms [32], the distribution of transaction linkages under the domination of major manufacturing firms is more extensive and frequent, and compared with urban network studies dominated by supply chains of specific manufacturing sectors, urban network studies based on the transaction relationships of manufacturing sectors as a whole are more representative of the overall picture of interurban flows of industrial products. Therefore, the lack of research on transaction linkages in the manufacturing sector is not conducive to the formation of a complete knowledge of intercity manufacturing collaboration within MCRs. Second, as an industry sector that is highly valued by both developing and developed countries, manufacturing cooperation between cities in MCRs is an important support for the sustainable development of regional industries. However, few studies have constructed a strategic framework for integrated manufacturing development among cities in MCRs based on the results of the characteristics and determinants of MCR city networks.
To address the above research deficiencies, this study established intercity manufacturing transaction networks based on the buyer–supplier linkage between listed manufacturing enterprises and their suppliers in China’s YRDR, and it explored the characteristics and determinants of urban networks dominated by the transaction relationships of leading manufacturing enterprises. In addition, this study established the strategic framework of intercity integration development of the MCR manufacturing industry based on the research results of urban network characteristics and determinants, which can provide policy reference for the sustainable development of the manufacturing industry in other MCRs around the world.

3. Materials and Methods
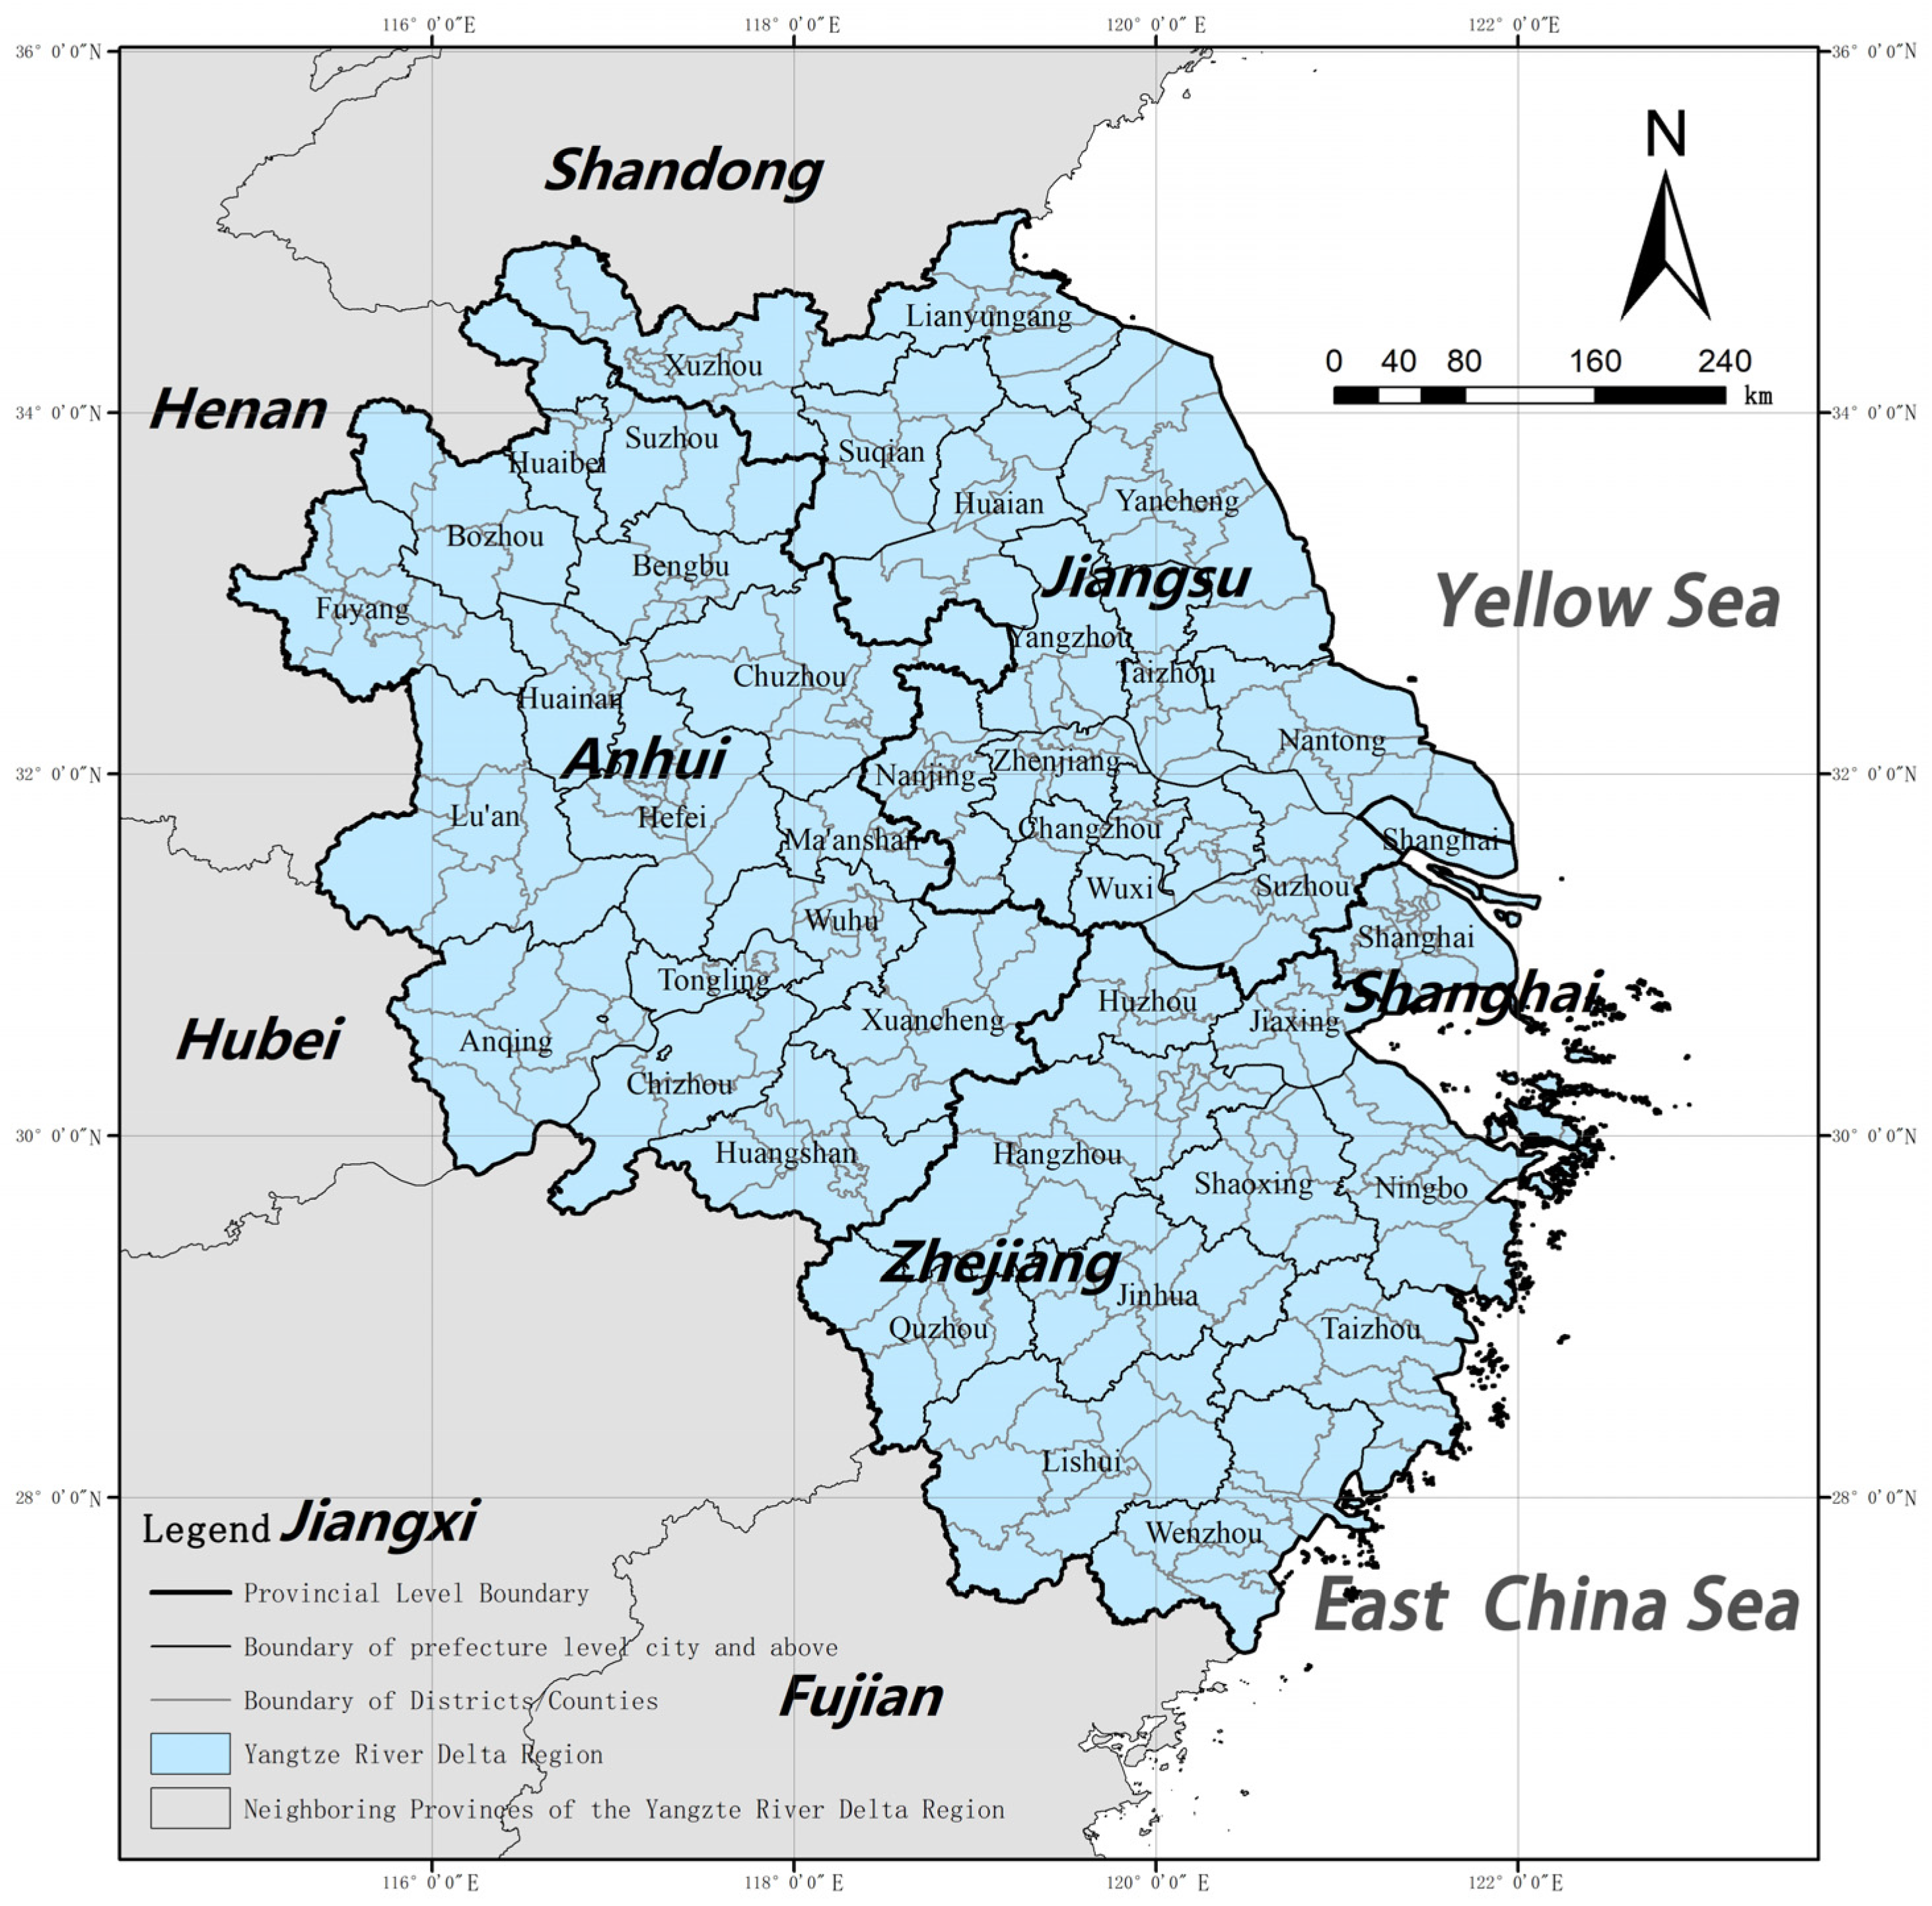
3.1. Research Area

China has developed many high-quality manufacturing companies during the past three decades. According to a report by southmoney.com, the total revenue of China’s top 500 manufacturing companies in 2020 accounted for 36.84% of China’s GDP that year. The YRDR, with 25.1% of the country’s GDP in the secondary sector, is one of the most developed manufacturing regions in China. The YRDR is one of the regions with the most active real economies in China. In 2020, the YRDR had a GDP of CNY 9660 billion in secondary industry and a total profit of CNY 1801 billion for industrial enterprises above a designated size, contributing 25.1% of the country’s gross domestic product in secondary industry and 27.9% of the total profit of industrial enterprises above a designated size, with 16.7% of the country’s permanent population.
In December 2019, China’s central government released the Outline of the Yangtze River Delta Regional Integrated Development Plan, which calls for the comprehensive enhancement of the collaborative development between cities and manufacturing industries of the YRDR and the establishment of a high level of manufacturing agglomeration. According to the Outline of the Yangtze River Delta Regional Integrated Development Plan issued by the Central Committee of the Communist Party of China and the State Council in December 2019, the YRDR covers four provincial administrative units, which are Shanghai (municipality directly under the Central Government), Jiangsu Province, Zhejiang Province, and Anhui Province. This paper takes the area of the YRDR delineated in this document as the research area. In the research area, there are 41 prefecture-level cities and above (abbreviated as “cities/city”), which contain 153 municipal districts, 50 county-level cities, 101 counties, and one autonomous county, totaling 305 sub-city divisions (Figure 1).

3.2. Data Acquisition and Processing

Cities increasingly exist as a system of relationships, where the network structure and network locality confer differences in their functions and status, and even in their development prospects. In urban networks, a city node is not an actor. Based on WCN research, the relationship between cities depends on “agents”, i.e., multinational corporations, APS firms, etc. The relationship between city agents derives from the exchange of capital, technology, funds, resources, and personnel. Links exist between cities, which often become channels for information transfer, service supply and demand, or commodity circulation. In this sense, city networks can be seen as the spatial structures on which the dissemination of information, capital, etc. needs to depend. The theoretical basis for the use of APS and TNC as “agents” of urban networks in the study of the WCN is the relationship between city power and the functional hierarchy of corporate organizations, where different levels of corporate headquarters have different powers [51], and corporate headquarters construct urban networks with locational decision-making, by which defining the power of control and association at the urban level. Knoke [52] pointed out that the essence of power is domination and control. This study drew on the idea that headquarters firms in WCNs bring greater city power, arguing that firms with greater dominance in the manufacturing commodity chain also bring more power to the city in the city’s manufacturing transaction network. Based on this, this study drew on the city network construct approach in Kraetke’s study of WCNs dominated by manufacturing firms [18] and used listed manufacturing firms (A share, Chinese concept share, Hong Kong stock, sci-tech innovation board, and new over-the-counter market) in the YRDR as an entry point to map the buyer–supplier linkages between listed manufacturing firms and their suppliers to the city scale, thereby transforming the transaction relationships dominated by major manufacturing firms into city relationships.
The data were acquired, processed, and analyzed in the following manner. The first step was to obtain the list of listed manufacturing companies in the YRDR through the advanced search function of Qichacha (https://www.qcc.com, accessed on 16 February 2022). Qichacha is a one-stop enterprise credit information query platform in China, with the total number of users exceeding 300 million in 2021. The platform is based on the existing database and the State Administration for Industry and Commerce of China synchronous updates. The search criteria are as follows: set “Industry” to “Manufacturing”, “Province” to Shanghai, Jiangsu, Zhejiang, and Anhui, “Registration Status” to “Normal”. “Registration Status” is set to “Normal Status”, and “Listing Sector” is set to “A stocks, Hong Kong stock, U.S. Stocks, and National Equities Exchange and Quotations (NEEQ)”. Accordingly, this study obtained the number of listed manufacturing companies in the YRDR as 1983.
The second step was the acquiring of the suppliers of listed manufacturing companies. This study acquired the suppliers of the listed manufacturing companies in the YRDR through the API interface of the “Supplier Query” function of the open platform of Qichacha (https://openapi.qcc.com/data, accessed on 16 February 2022). To reduce the changes caused by the long time span, the study was limited to the suppliers of listed manufacturing companies from 2016 to 2021. We obtained access to 1983 listed manufacturing companies and 27,948 transaction linkages between listed manufacturing firms and their suppliers within the YRDR. According to the information on the official website of Qichacha, the list of suppliers of leading manufacturing firms came from its capture of public data, and the main sources of supplier information were enterprise prospectuses, bidding announcements, enterprise annual and semi-annual reports, supplier announcements, and judicial data.
The third step was the transforming the inter-firm connections into interurban linkages. By mapping the addresses of manufacturing companies and suppliers to cities and sub-city divisions, the buyer–supplier linkages were transformed into a matrix of intercity connections. For example, Gw Electric (Shanghai, China) Co., Ltd., a listed manufacturing enterprise on the NEEQ in Fengxian District of Shanghai, was found to have 22 purchasing behaviors between 2016 and 2021 by the above method (Table 1). Thus, the linkage strength between Shanghai and Suzhou is 3, and the linkage strength between Fengxian District of Shanghai and Wujiang District of Suzhou is 3. Based on this approach, the buyer–supplier relationships of all 1983 listed manufacturing enterprises were processed and aggregated to obtain the matrix of intercity and intercity–division linkages, respectively.
The fourth step was data analysis. This study was based on the matrix formed in the previous step, which we analyzed and visualized with the software of UCINET (Version 6.365, Analytic Technologies, Lexington, KY, USA), Gephi (version 0.10.1 for Windows, Gephi.org), and ArcGIS (Version 10.5, Esri, Redlands, CA, USA) (Figure 2).

3.3. Research Methods

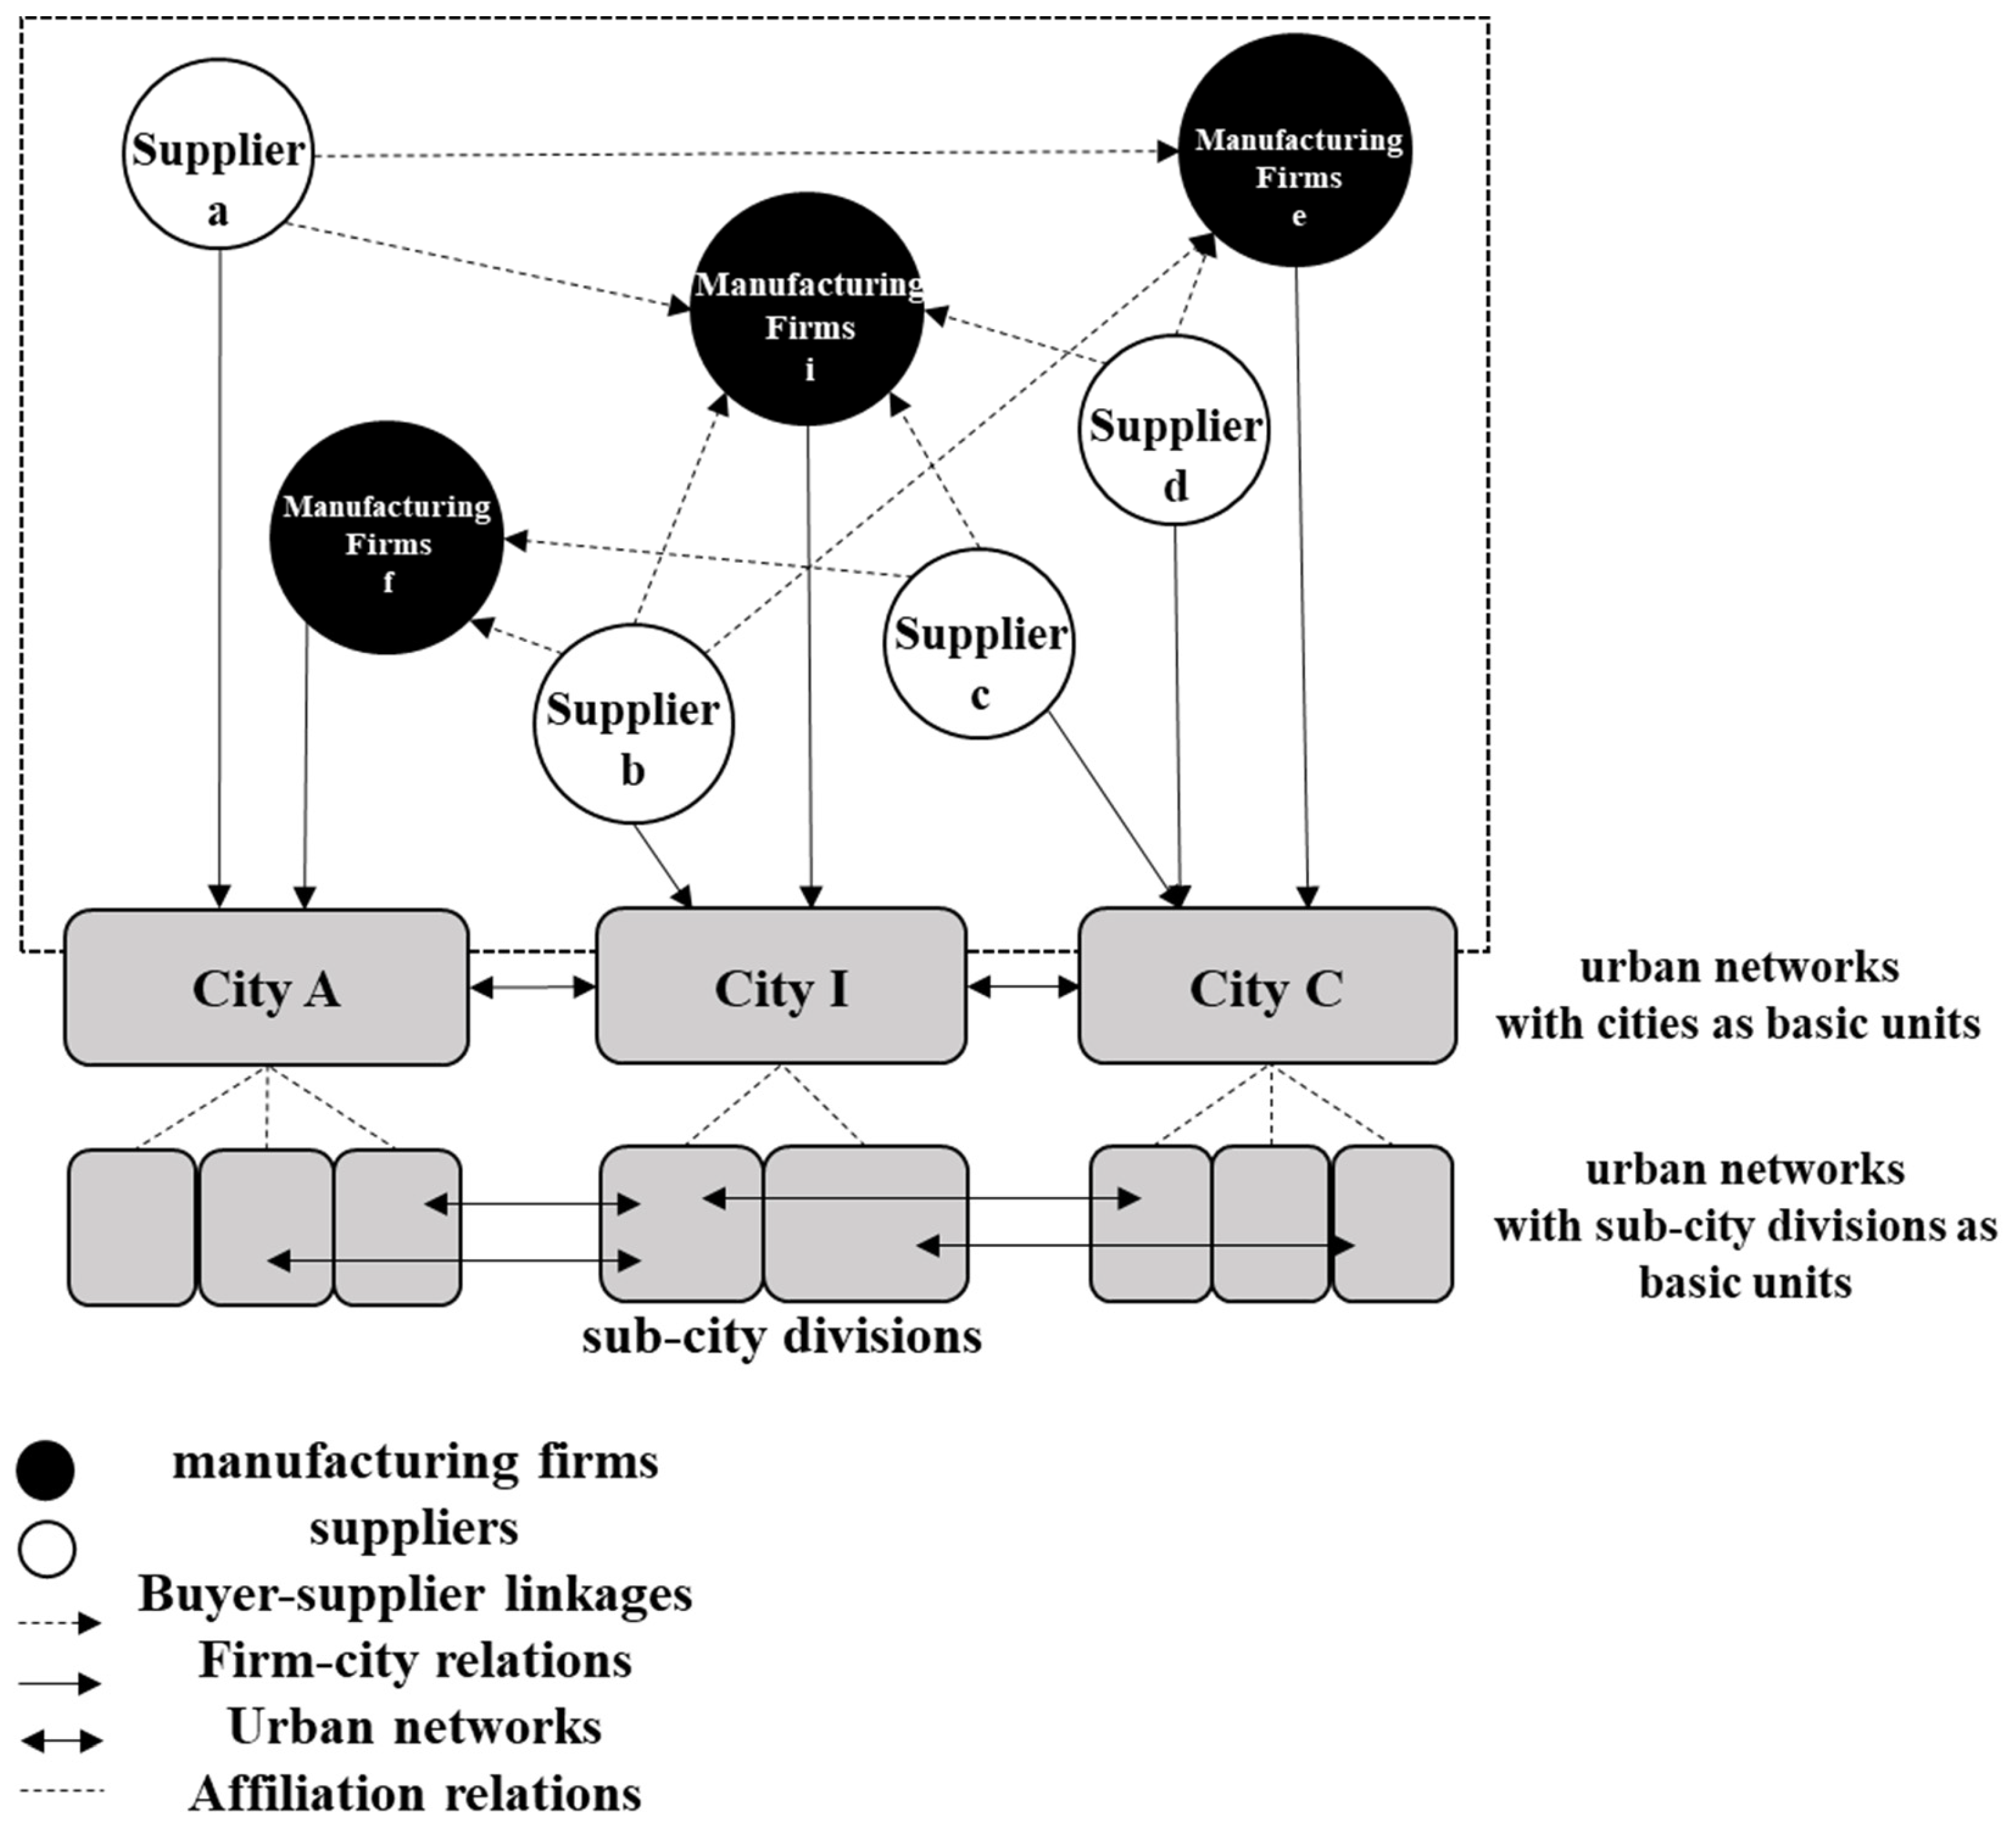
3.3.1. Social Network Analysis (SNA)

SNA was first introduced by Alderson et al. in 2004 [10] and has been widely used in the study of urban networks. Degree centrality, betweenness centrality, and “core-periphery” structural analysis in SNA are important for understanding the organization of urban networks. In this study, degree centrality and betweenness centrality were used to explore the influence and intermediary function of nodes in the urban network.
  • Degree centrality
Degree centrality can be used to measure the clustering and radiation capacity of a node in a network. The degree centrality of urban networks indicates how many linkages are directly connected to the city. The equation is as follows:
C D n i = n N 1
where C D n i represents the degree centrality of node i ; n represents how many linkages directly connected with the node; and N represents the total number of network nodes.
  • Betweenness centrality
The percentage of all shortest paths in the network that travel through the node is referred to as betweenness centrality. It is used to quantify how much a node controls or depends on other nodes and how crucial a node is to act as a go-between for other “node pairs”. The equation is as follows:
C B n i = j n k n g i k n i g j k , j k i
where C B n i represents the betweenness centrality of a node; n represents the number of nodes in the network; g j k represents the number of shortcuts from node j to node k ; and g j k n i represents the number of shortcuts from node j to node k through node i .
  • Linkage value between cities
This study mapped the transactional relationships between firms to city-to-city relationships (Figure 2). The inter-firm links were converted into intercity links. In one scenario, Supplier a and Supplier c were in City A and City C, and their supporting manufacturing firm i was in City I. The strength of the link between City A and City I, and the link between City I and City C, was the sum of the relationships between Supplier a and manufacturing firm i , and between Supplier c and Supplier i , respectively. In another scenario, Supplier b , with supporting manufacturing firm i in the same City I, the relationship between Supplier b and Manufacturing Firm i belonged to the relationship within City I and was not considered when constructing the city network. Based on the above method, a Boolean matrix and an undirected weighted matrix were constructed for the distribution cities of transaction linkages in manufacturing industries. Similarly, the relationships between sub-city divisions were constructed.
  • Community Detection
Community detection is a technique used to reveal the network aggregation. The high density of connections within the community and the low degree of connections to nodes outside are the most crucial characteristics of a complex network community. The main community detection algorithms include modularity [53], infomap [54], and fast unfolding [55]. Fast unfolding is used to classify the communities in the urban network, i.e., small groups with strong internal ties but weak external ties. Fast unfolding clustering is based on the principle of continuous division by iterative operations. Gephi software is relied on to ensure maximum modularity. The larger the modularity value, the better the division result of the community [54].

3.3.2. Spatial Autocorrelation

Spatial autocorrelation is the spatial aggregation of objects with similar properties. A binary symmetric spatial weight matrix is typically used to indicate how close two geographical items are to one another. Equation (3) displays the spatial weight matrix for a spatial unit with n objects.
W = W 11 W 12 W 1 n W 21 W 22 W 2 n W 31 W 32 W 3 n W 41 W 42 W 4 n
A variety of methods are available for proximity measurement. In this study, a spatial weight matrix was created based on the queen coefficients. When there were shared edges or points of basic spatial units, spatial adjacency was identified, and its rank was set to 1. Local and global spatial autocorrelation are both types of spatial autocorrelation.
Global spatial autocorrelation is a description of features over the entire study region to indicate the overall trend of spatial correlation of the observed variables. It is quantified by Moran’s I, which ranges within −1 to 1. Moran’s I greater than zero indicates no significant spatial difference between the region and its surrounding areas; that is, there is aggregation (“high–high” or “low–low” clusters) in regions with similar characteristic values, and there is a smaller spatial difference when the value is close to 1. Moran’s I less than zero indicates that the region shows significant spatial characteristics compared to its surrounding areas and that there is a larger spatial difference when the value is close to −1; that is, there is aggregation (“low–high” or “high–low” outliers) in regions with dissimilar characteristic values. Moran’s I equal to zero indicates no spatial aggregation. To analyze the spatial pattern of observed variables with Moran’s I, significance tests are required to ensure correct inferred conclusions in a certain probability. Judgments to accept or reject the null hypothesis are made at set significance levels based on the P-value and Z-test results.
The local Moran’s I is typically employed as the local indicator of spatial association (LISA), as indicated in Equation (4), to quantify the degree of local spatial connection and the spatial difference between each region and its neighboring areas:
I i = X i X ¯ S 2 j = 1 , i j n W i j X i X ¯ = Z i j = 1 , i j n W i j Z j
where I i is the local Moran value; X i is the value of region i ; X ¯ is the mean value; S 2 is the variance of the attribute values; W i j represents the spatial proximity of regions i and j ; and Z i and Z j are the normalized values of the attributes of regions i and j . Statistical tests are also based on the P-value and Z-test.

3.3.3. Quadratic Assignment Procedure (QAP)

QAP, originally an important method to study social relationships, is an approach for comparing the similarity of elements in two square arrays [56]. To avoid the problem of multicollinearity, traditional multiple regression statistical testing requires the independent variables to remain independent, but it does not work for testing the “relationship between relations”. The relevance between the independent and the dependent variable matrix was tested in this study using QAP correlation, and the level of influence of the independent variable matrices on the dependent variable matrix was tested using QAP regression.
The selection of the independent variables and the construction of the independent variable matrix were achieved in the following way. The two indexes of geographical proximity (Geoproximity) and driving distance (Drivingdis) were used in the study, as geographically close regions are more closely connected [57]. Since China’s economy is obviously characterized by administrative district economies, the study explored the impact of provincial administrative boundaries on the urban network (Admineco). It is easier to form industrial ties between cities with similar economic policies and business environments [58].
In view of the fact that development zones are important institutional innovation and spatial carriers of industrial development in China [59], and that development zones have an important impact on the investment and business environments of cities, this study represented the differences in the business environments of two cities by the differences in the number of national-level development zones (Developmentzone). Established studies have shown that co-built industrial parks can consolidate intercity industrial cooperation [60]. Cooperation parks (Copark) were also included in this study. As cities at higher administrative levels tend to have more access to policy resources in China, the study examined the impact of administrative level (Adminlevel) differences among cities on urban manufacturing transaction networks.
High-speed rail (HSR) is a crucial mode of transportation for people to move between cities, and face-to-face communication can foster trust between industrial buyers and suppliers [61]. Both innovation partnerships and buyer–supplier partnerships are important forms of formal inter-firm cooperation [62], and intercity innovation cooperation has a potential impact on transaction collaboration. This study incorporated HSR linkage (Highspeedrail) and paper co-authorship (Coauthorship) as well. Industrial structure is related to the formation of urban polycentric networks [63], so the industrial structure similarity index was employed to investigate the connection of the industrial structure similarities between cities with intercity transaction collaboration in manufacturing industries (Industrystruc) (Table 2).

3.3.4. Stepwise Regression Method

In ordinary multiple regression, covariance among independent variables can lead to an inaccurate estimation of the model, and the problem of covariance can be better solved by using stepwise regression. The combination of variables with significant explanatory effects from multiple factors is extracted by taking the natural logarithm for standardization and then using stepwise regression.
In this study, the degree centrality of cities was used as the dependent variable, and eight independent variables related to the ability of cities to connect with each other in the manufacturing sector were selected (Table 3).
The economic performance is related to the connectivity of a city [64]. The urban population, urban GDP per capita, and the advanced degree of industry structure are all indicators of urban economic performance. There is a homogeneity between a city’s manufacturing competitiveness and its technological innovation capability [65]. The stronger a city’s manufacturing competitiveness is, the more firms from other cities will form transaction links with firms in that city. This study characterized the city government’s ability to invest in science and technology innovation and the overall science and technology level by the city government’s science and technology expenditures and the number of patents granted in the city, respectively.
The agglomeration of industrial enterprises in a city forms industrial clusters, and efficient clusters tend to have network openness characteristics [66]. Thus, it is suggested that the more local industrial firms in a city, the more likely it is to form clusters and thus have more opportunities to trade and cooperate with firms from other cities within the MCR. Supply chain integration has a catalytic effect on cooperation between firms [67], and the city’s traffic, transport, storage, and post industries are large enough to serve local firms to establish external transaction relationships more easily in the manufacturing industries. Public support, which includes financial support, can increase the external cooperation of firms [68], and the development of the city’s financial sector can facilitate the buyer–supplier linkage of local manufacturing enterprises with enterprises in other cities.
This study selected the average data for the intermediate years from 2016 to 2021, i.e., 2018 and 2019, and the data were obtained from the China City Statistical Yearbook.

4. Results

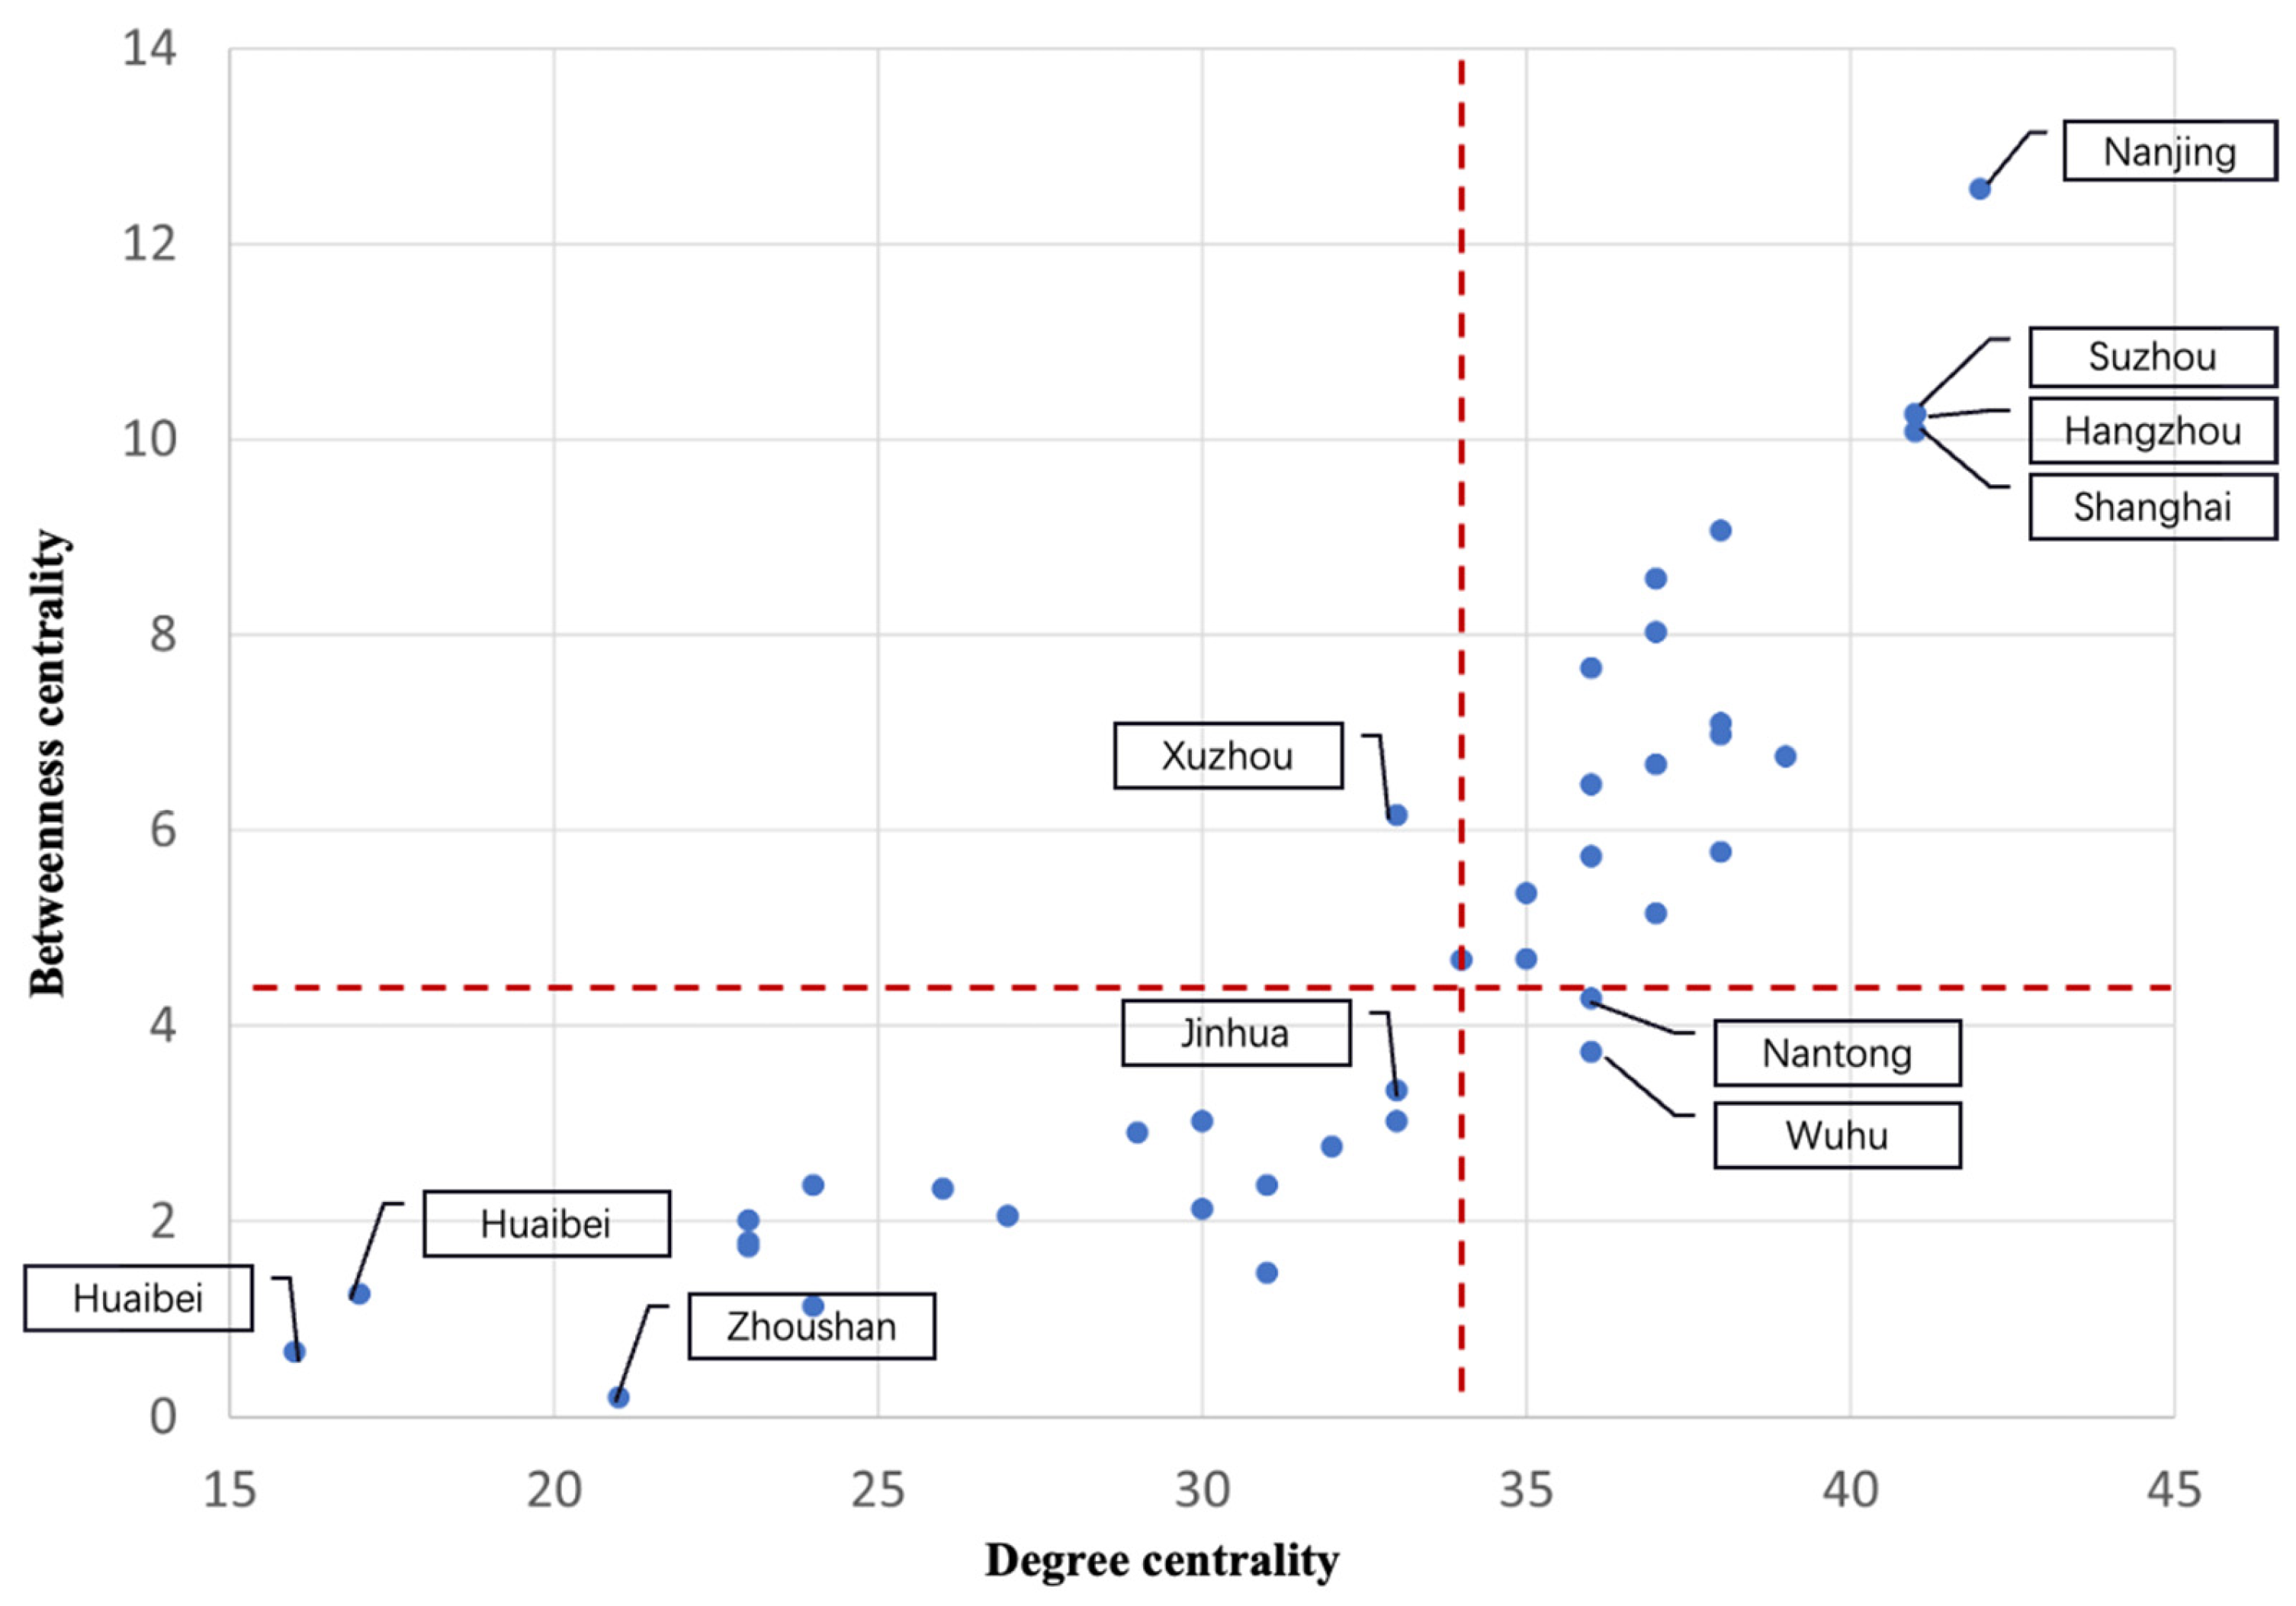
4.1. Nodal Centralities, City Dyads, and Their Geographical Distribution

The urban networks led by the transaction linkages of leading manufacturing firms in the YRDR of China show a polycentric and networked structure centered on Shanghai and cities in southern Jiangsu and northern Zhejiang provinces, and the geographical structure of the network is characterized by an apparent “core-periphery” distribution. Shanghai, together with the southern Jiangsu and northern Zhejiang regions, is the densest area of the network, and the five city dyads with the highest strength are all located in this area (Shanghai–Suzhou (Jiangsu province), Suzhou (Jiangsu province)–Wuxi, Shanghai–Wuxi, Shanghai–Hangzhou, and Suzhou (Jiangsu province)–Changzhou), while the density of urban networks in northern Jiangsu and northern Anhui is generally lower. Three corridors of the transaction linkage of manufacturing industries have been formed, which are Shanghai–Suzhou–Wuxi–Changzhou–Nanjing, Shanghai–Jiaxing–Hangzhou, and Shanghai–Ningbo–Taizhou. Although Hefei, Chuzhou, Taizhou (Zhejiang province), and Wenzhou are in the peripheral circle of the dense area of the network, these cities also have a high level of external connectivity in the network (Figure 3). The group of city dyads with the highest strength is Shanghai and Suzhou, followed by Suzhou and Wuxi, Shanghai and Wuxi, Shanghai and Hangzhou, and Suzhou and Changzhou, all located in the central region of the YRDR.
The nodal centralities of the urban networks in the YRDR are hierarchical, but there are differences in the city hierarchy of degree centrality and betweenness centrality. The node degree centrality and betweenness centrality of the network of the cities in the YRDR can be classified into five levels by the natural breaks method (Jenks). The first level of degree centrality contains five cities, namely Nanjing, Hangzhou, Shanghai, Suzhou (Jiangsu province), and Taizhou (Zhejiang province), while Chuzhou, Hefei, and Bengbu are ranked in the first level of betweenness centrality, indicating that the network intermediary status of these three cities in the network is higher than their absolute linkage strength status. Some cities have a lower degree of betweenness centrality and are at the edge of the network, such as Chizhou, Lu’an, Huainan, Huaibei, etc. (Table 4).
The median of city degree centrality and betweenness centrality (the vertical red dashed line and horizontal red dashed line respectively in Figure 4) were used to divide the coordinates into horizontal and vertical axes, respectively, thus dividing the coordinates into four quadrants. As Figure 4 shows, the degree centrality and betweenness centrality of most cities match each other, such as Nanjing, Suzhou (Jiangsu province), Hangzhou, and Shanghai, which have high degree centrality and betweenness centrality, while Huainan, Huaibei, and Zhoushan have low degree centrality and betweenness centrality. A few cities differ in the degree and betweenness centralities, e.g., Xuzhou has a higher intermediation function than its connection strength in the network, while Nantong and Wuhu have a higher connection strength but a weaker position in the intermediation function.
Spatial autocorrelation methods were used to explore the differences of the geographical distribution of degree centrality and betweenness centrality in the urban network of the YRDR. The cities in the YRDR showed significant clustering of similar attributes in both the degree centrality and betweenness centrality indexes, with a Moran’s index of 0.6077 and 0.1635, respectively, where the global Moran’s indexes were both positive, with a P-value less than 0.01 and Z-score of 16.2137 and 4.5727, respectively, and the Moran’s I value was statistically significant.
The results of local spatial autocorrelation showed that the YRDR, with sub-city divisions as the basic unit, exhibits the characteristics of high value agglomeration in the central region and low value agglomeration in northern Jiangsu, northern Anhui, southern Anhui, and southwestern Zhejiang, indicating that the nodes with a high degree of network connection and network betweenness in the transaction linkage in manufacturing industries are mainly located in the central region of the YRDR, while the areas with a low degree of network connection and network betweenness are generally distributed in the peripheral regions. There are sub-city divisions of the low–high outlier pattern in the surrounding areas of the central YRDR. For the spatial autocorrelation of the degree centrality of sub-city divisions, a high–low outlier pattern took shape in Yuhui District of Bengbu City, indicating that some sub-city divisions in Bengbu play a certain role as the “gateway” to the transaction linkages in the sub-region (Figure 5).

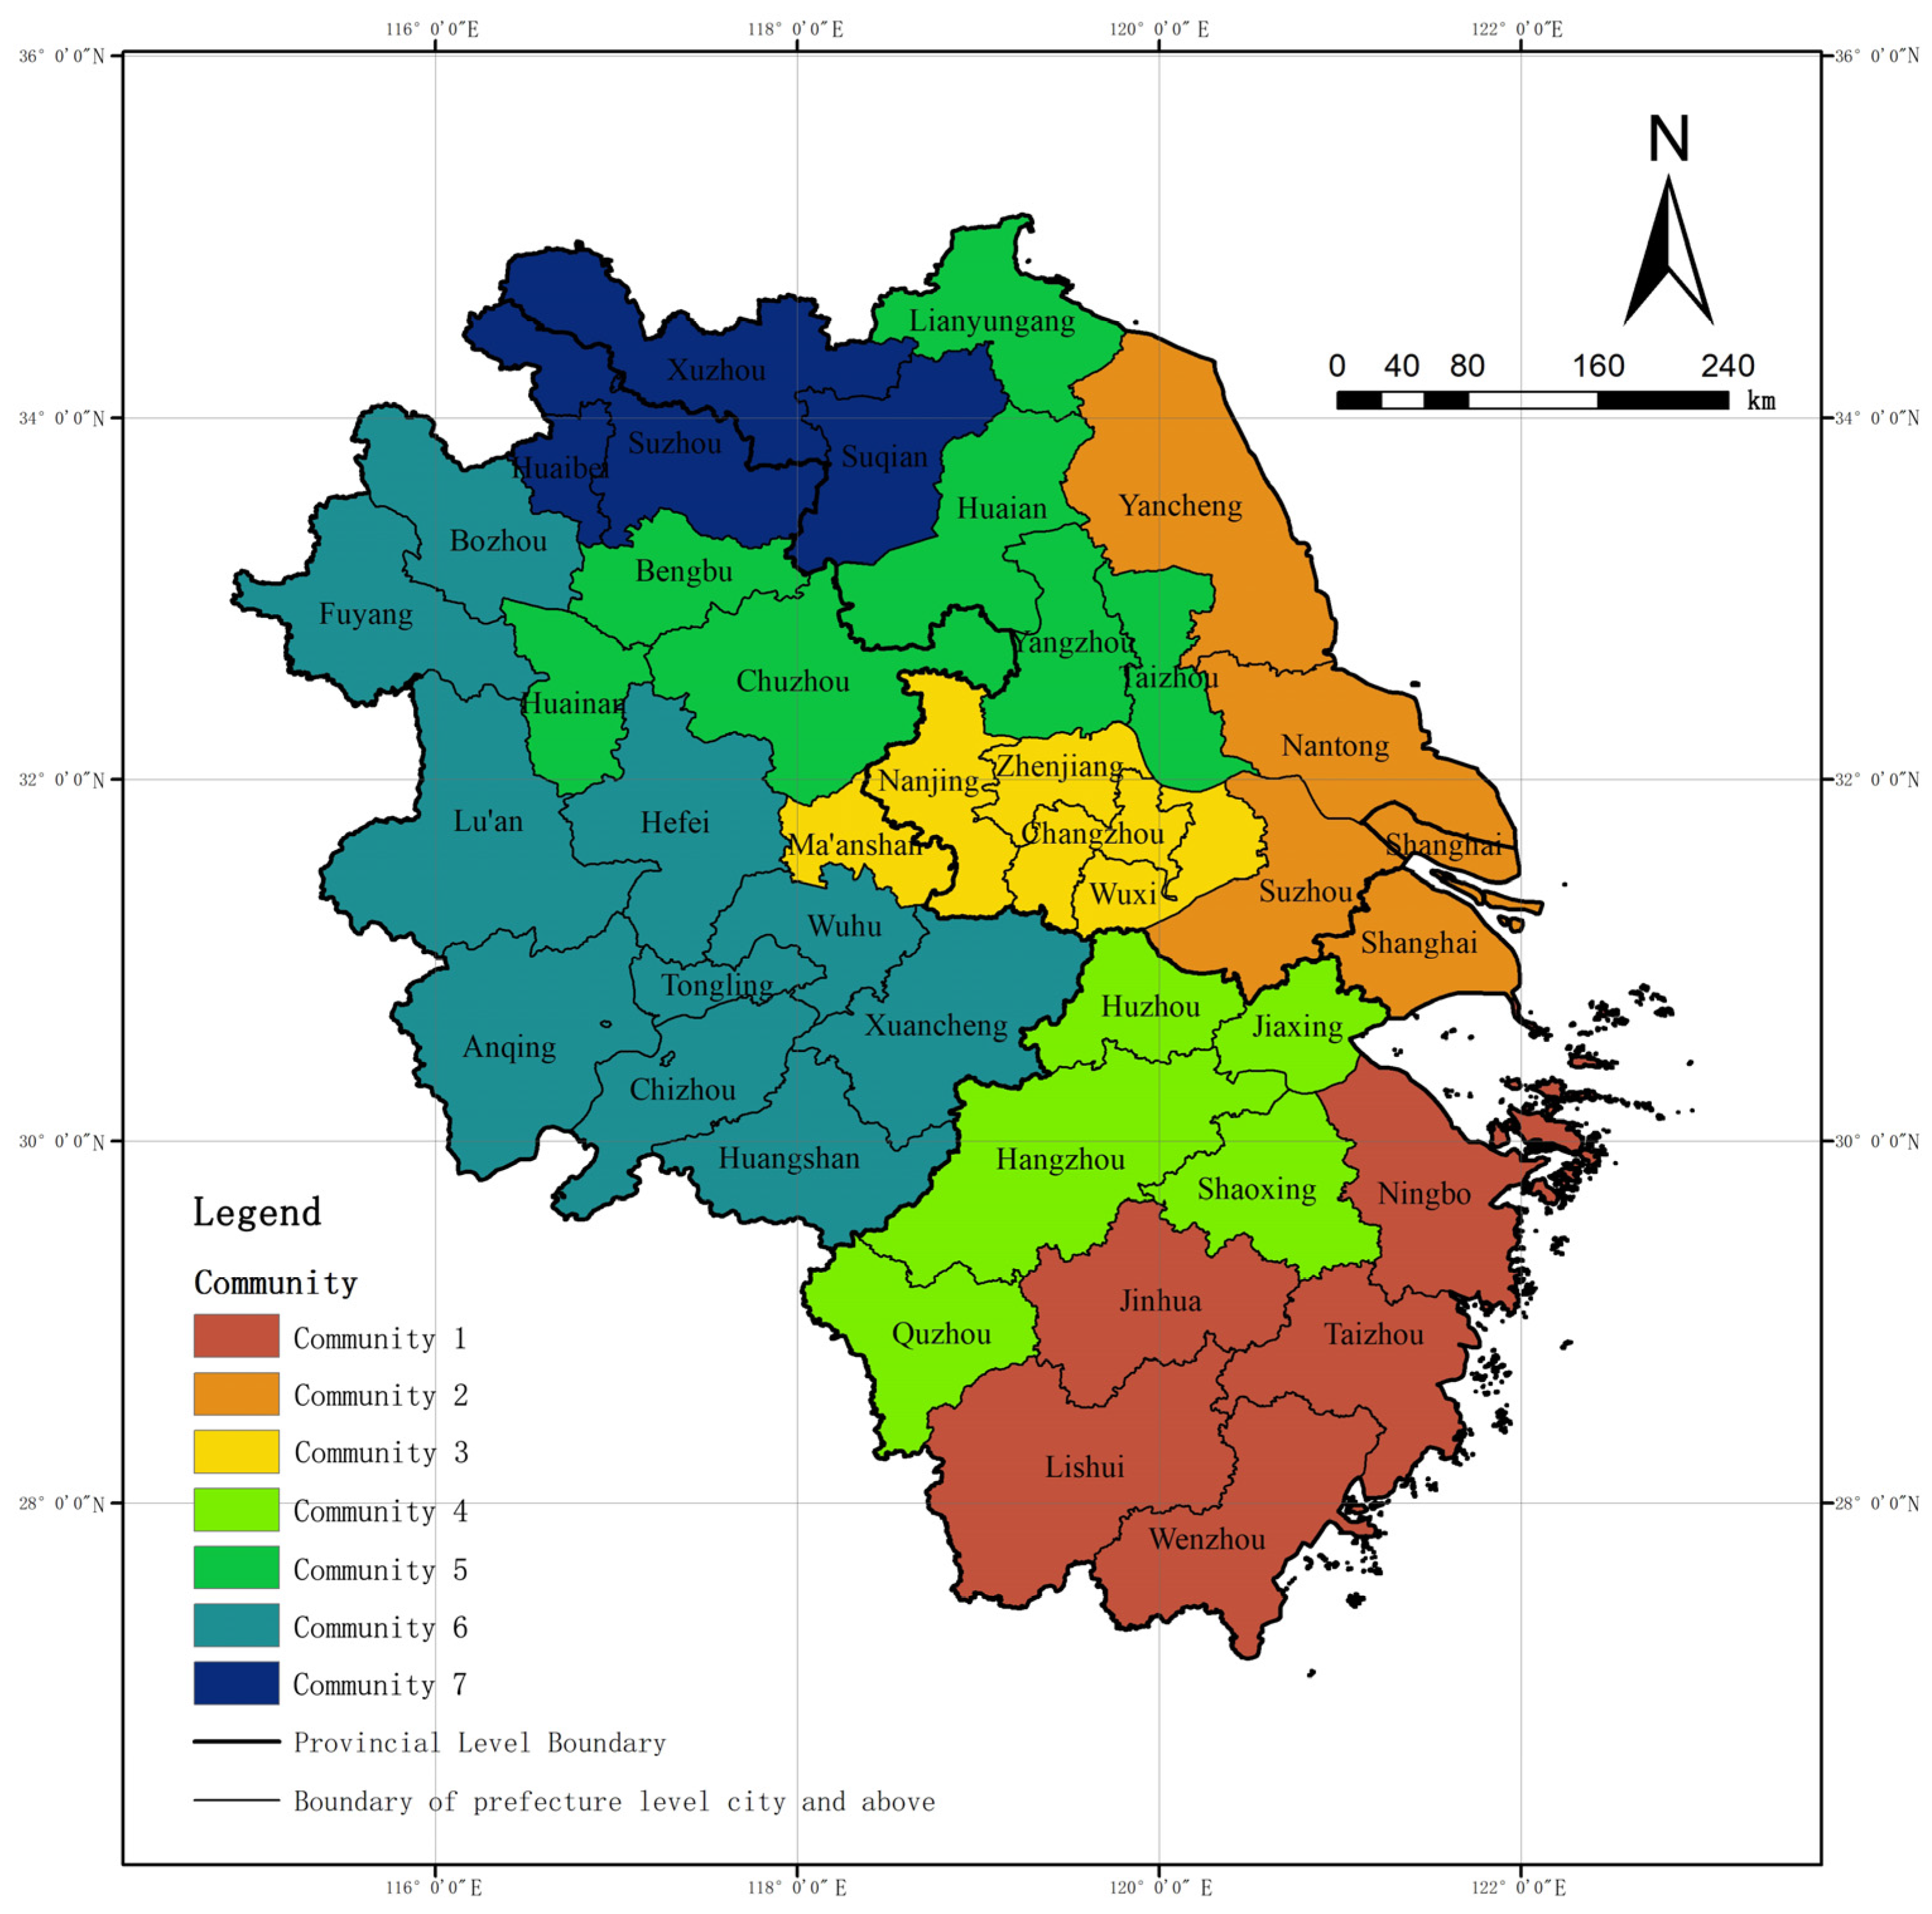
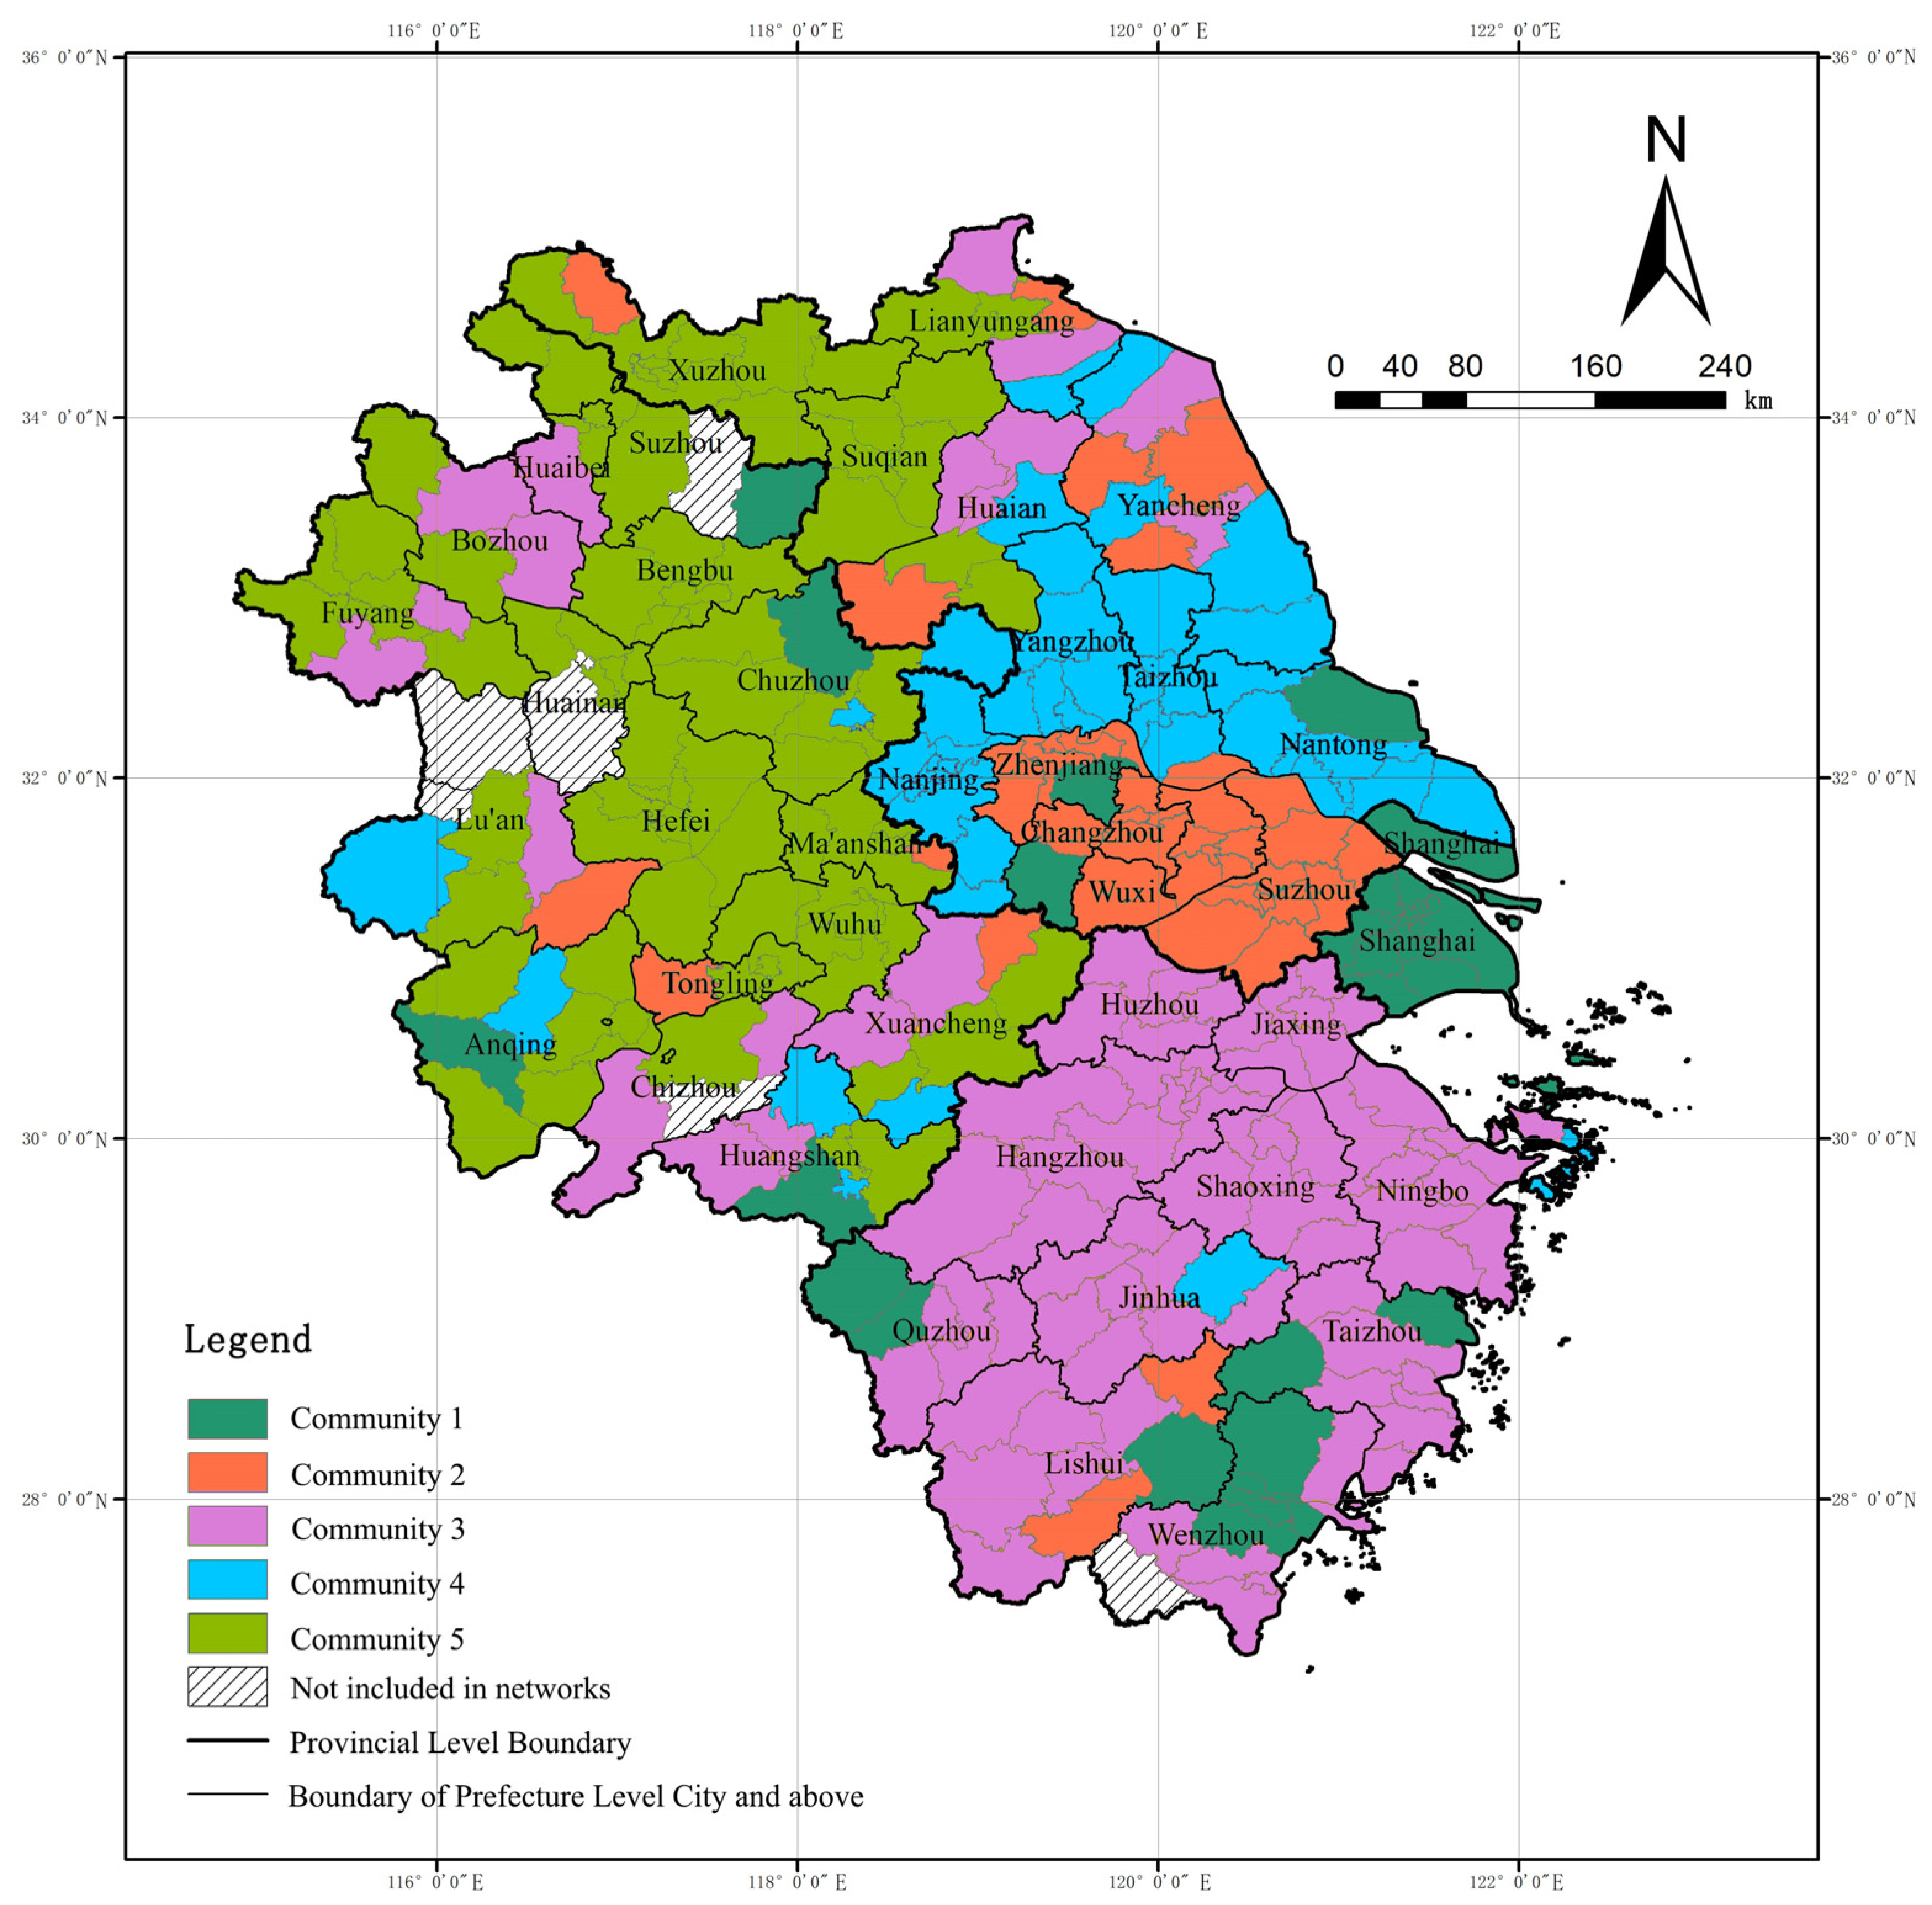
4.2. Community Structure and Geographical Distribution

The community detection algorithm was used to study the community division of the network using cities and sub-city divisions as the basic nodes, respectively (in Gephi with the resolution set to 1).
Taking the cities as the basic units of the network, we detected that the urban network of the YRDR contains seven communities, including three cross-provincial communities, between Jiangsu and Anhui provinces. Shanghai is more closely connected with Suzhou (Jiangsu province) and Nantong, and two network communities have formed within Zhejiang province, with Hangzhou and Ningbo as the leading cities, respectively (Figure 6). Community 1 consists of cities in southern Zhejiang, containing Ningbo, Taizhou, Jinhua, Wenzhou, and Lishui. Community 2 is a coastal network community in the northern YRDR led by Shanghai, containing the three prefecture-level cities of Suzhou, Nantong, and Yancheng. Community 3 is dominated by cities in southern Jiangsu, containing Ma’anshan in Anhui and Nanjing, Zhenjiang, Changzhou, and Wuxi in Jiangsu. Community 4 is mainly composed of cities in northern Zhejiang, including Hangzhou, Shaoxing, Jiaxing, Huzhou, and Quzhou. Community 5 is also a cross-provincial network community located in central Jiangsu and Anhui, consisting of Huai’an, Yangzhou, Taizhou, and Lianyungang in Jiangsu and Chuzhou, Bengbu, and Huainan in Anhui. Community 6 is mainly composed of cities in central, western, and southern Anhui, with Hefei as the main node, and also including cities such as Lu’an, Anqing, Chizhou, Fuyang, and Bozhou. Community 7 is a cross-provincial community in northern Jiangsu, containing Xuzhou and Suqian in Jiangsu, and Suzhou and Huabei in Anhui.
We found that the network includes five communities when taking sub-city divisions as the basic units. The core nodes of Community 1 and Community 2 hold the core circles of the network, according to the topology of the network. Pudong New Area and Jiading District in Shanghai are the core nodes of Community 1, and Wuzhong District and Kunshan City in Suzhou and Jiangyin City in Wuxi are the core nodes of Community 2. These two communities are in critical network locations. Yuhang District and Xiaoshan District in Hangzhou and Jiangning District in Nanjing lead Community 3 and Community 4, respectively. Baohe District and Shushan District in Hefei are critical nodes of Community 5, but its location in the network is marginal (Figure 7).
In terms of the geographical distribution of network communities in sub-city divisions, sub-city divisions in the same community were roughly geographically adjacent to each other, and there are enclave sub-city divisions that were not adjacent to the main part of the community as well. Specifically, Community 1 and Community 2 showed more obvious spatial dispersion than other communities in spatial distribution. For example, the hinterland sub-city regions of Community 1, with Shanghai municipal districts as the core nodes, are distributed in southern Anhui, southern Zhejiang and the junction area of Anhui and Suzhou, while the hinterland sub-city divisions of Community 2, with sub-city divisions in southern Jiangsu as the core nodes, are distributed in northern Jiangsu, southern Zhejiang, and central Anhui. Community 3 is mainly located in Jiangsu, and many of the “enclave” sub-city regions in the network community are located in northern Jiangsu, northern Anhui, and southern Anhui. The main area of Community 4 is located in Nanjing, Yangzhou, Taizhou, and Nantong and contains a small number of “enclave” units located in northern Jiangsu, western Anhui, southern Anhui, and southern Zhejiang. Community 5, led by some sub-city divisions of Hefei, is relatively concentrated in spatial distribution, but there are many internal “perforations”, with its hinterland sub-city divisions seriously captured by other central cities (Figure 8).

4.3. Determinants of the Urban Networks

4.3.1. Determinants of Interurban Links

Based on the selected independent and dependent variables, the correlation and regression results of QAP were obtained by 2000 random permutations, relying on Ucinet software (Table 5). The results showed that the correlation and regression results of all indexes were significant at the level of 1% or 5%, except for the cooperation park (Copark). The R2 of the model was 0.546, indicating that the model explains the dependent variable well.
The index that had the greatest impact on the urban network was HSR linkage (Highspeedrail). The regression coefficient of the impact of similarity of the urban business environment on urban supply chain networks, as represented by the number of national development zones, ranked second. Paper co-authorship (Coauthorship) also had a significant impact on the network. The fourth and fifth most influential indexes were driving distance (Drivingdis) and administrative district economy (Admineco), which had a higher degree of influence than geographical proximity (Geoproximity). Local cities were more inclined to form supply chain cooperation with cities in other provinces. Similarity in industry structure among cities had a negative effect on the formation of urban networks, suggesting that transaction linkages tend to arise more between cities with large gaps in industry structure. The difference in administrative level (Adminlevel) inhibits the shaping of the networks; that is, the supply chain network tends to come into being among cities at similar administrative levels. However, the regression results were not significant, although the city relationship led by the cooperation industrial park relationship and the urban network relationship passed the correlation test, indicating that in a statistical sense, the cooperation park has no effect on the establishment of transaction linkages in manufacturing industries among cities in the YRDR.

4.3.2. Determinants of Nodal Centralities

The stepwise method in stepwise regression was used to identify significant independent variables, and those with a VIF greater than 5 were excluded. The results of the stepwise regression analysis showed that the four independent variables of ln P o p , ln P e r _ G D P , ln T e c h , and ln I n d u s f i r m passed the regression model and had a good fit (R² = 0.919), as these four independent variables passed the significance and covariance tests. The regression coefficient of the independent variable of ln P o p was negative, which indicated that the growth of the urban population is not conducive to the formation of manufacturing transaction relationships between a city and its neighboring cities. The three independent variables of ln P e r _ G D P , ln T e c h , and ln I n d u s f i r m contribute to the degree centrality of urban networks from the perspective of manufacturing firms’ transaction relationships. Comparing the standardized regression coefficients of the positively influenced independent variables, the intensity of the influence was ln I n d u s f i r m > ln P e r _ G D P > ln T e c h (Table 6).

5. Discussion

5.1. Urban Networks Led by Transaction Linkages in Manufacturing Industries and Other Related Dimensions

The urban networks led by the buyer–supplier linkages of listed manufacturing companies are essentially an interurban flow of industrial products. This study provides a complementary perspective to studies related to functional linkages between cities within MCRs. Admittedly, some scholars have already carried out some research on functional linkages between cities within MCRs from the perspective of functional polycentricity, such as Burger et al. [41], who studied the functional linkages between cities in MCRs from multiple perspectives, which paid attention to buyer–supplier linkages in manufacturing, wholesale, and business service industries, and found significant differences in the overall picture of urban network within MCRs dominated by different functional linkages. The characteristics of intercity functional linkages are highly correlated with the type of functional linkages [69], and only by synthesized research from multiple perspectives can the complete knowledge of interurban functional linkages within the MCR be formed.
Therefore, the results of this study can provide a complement to extant urban network studies. Shanghai is the center of the urban network in the YRDR in the dimensions of corporate headquarter–branch linkage [70] and knowledge cooperation [27]. The study revealed that the urban network, from the perspective of transaction linkages in manufacturing industries in the YRDR, shows a multi-core structure, and the degree of nodal centralities of Nanjing, Suzhou (Jiangsu province), Hangzhou, and other cities was not much different from that of Shanghai, indicating that global cities such as Shanghai may not be as prominent in the urban transaction network in manufacturing industries in MCRs as they are global APS. In terms of the spatial distribution characteristics of network communities, there is a difference in the pattern between the urban network created by transaction linkages in manufacturing industries and the urban network from the perspective of highway traffic flow. The spatial distribution of the latter’s network communities is presented as several complete plates [71]. In our study, although most of the sub-city divisions of the same network community were geographically adjacent, some sub-city divisions in the community were not adjacent to the main plate, indicating that the formation mechanism of an urban network dominated by the transaction linkage of leading manufacturing companies is more complex than interurban cargo and people flow. The reason may lie in the multi-scale purchasing behavior of some head manufacturing companies, if distance is not the primary factor affecting the trading relationship of manufacturing companies [72].
Secondly, some of the findings corroborate the findings of other scholars. Some urban network studies based on typical Chinese urban agglomerations have found that provincial administrative boundaries have significant negative effects on the formation of urban networks from the perspective of intercity consumption [73], transportation infrastructure, business interaction of firms in producer services, daily travel [31], international freight forwarding services [25], intercity coaches [74], and tourist flow [75], while the boundary effects on urban networks from the perspectives of patent transfer [76] are not significant. However, this study found that the interurban buyer–supplier linkages in manufacturing industries tend to form among cross-provincial cities, which is inconsistent with the findings of urban network studies based on cross-city people mobility [77,78] and international freight forwarding services [23] perspectives of the YRDR. Shanghai and the cities of Jiangsu, Zhejiang, and Anhui provinces are the basic units of the QAP analysis, and the large amount of cross-provincial transaction linkages may be due to Shanghai’s frequent transaction collaborations with other cities in the YRDR, such as the research and development services provided by technology companies and research institutions. In addition, this study further took the sub-city divisions as the basic units of the urban network. By establishing a Boolean matrix of whether sub-city divisions belong to the same city or province, the relationship between these two matrices and the urban network was verified using QAP analysis. The results showed that the relationship of whether sub-city divisions belong to the same city or province was significantly correlated with the formation of urban networks in the YRDR at the 1% confidence interval, and the standardized coefficients of QAP regression were 0.2011 and 0.0330, respectively. This finding corroborated the conclusions of other scholars, indicating that Shanghai is the leading city in cross-provincial transactions in manufacturing industries in the YRDR.

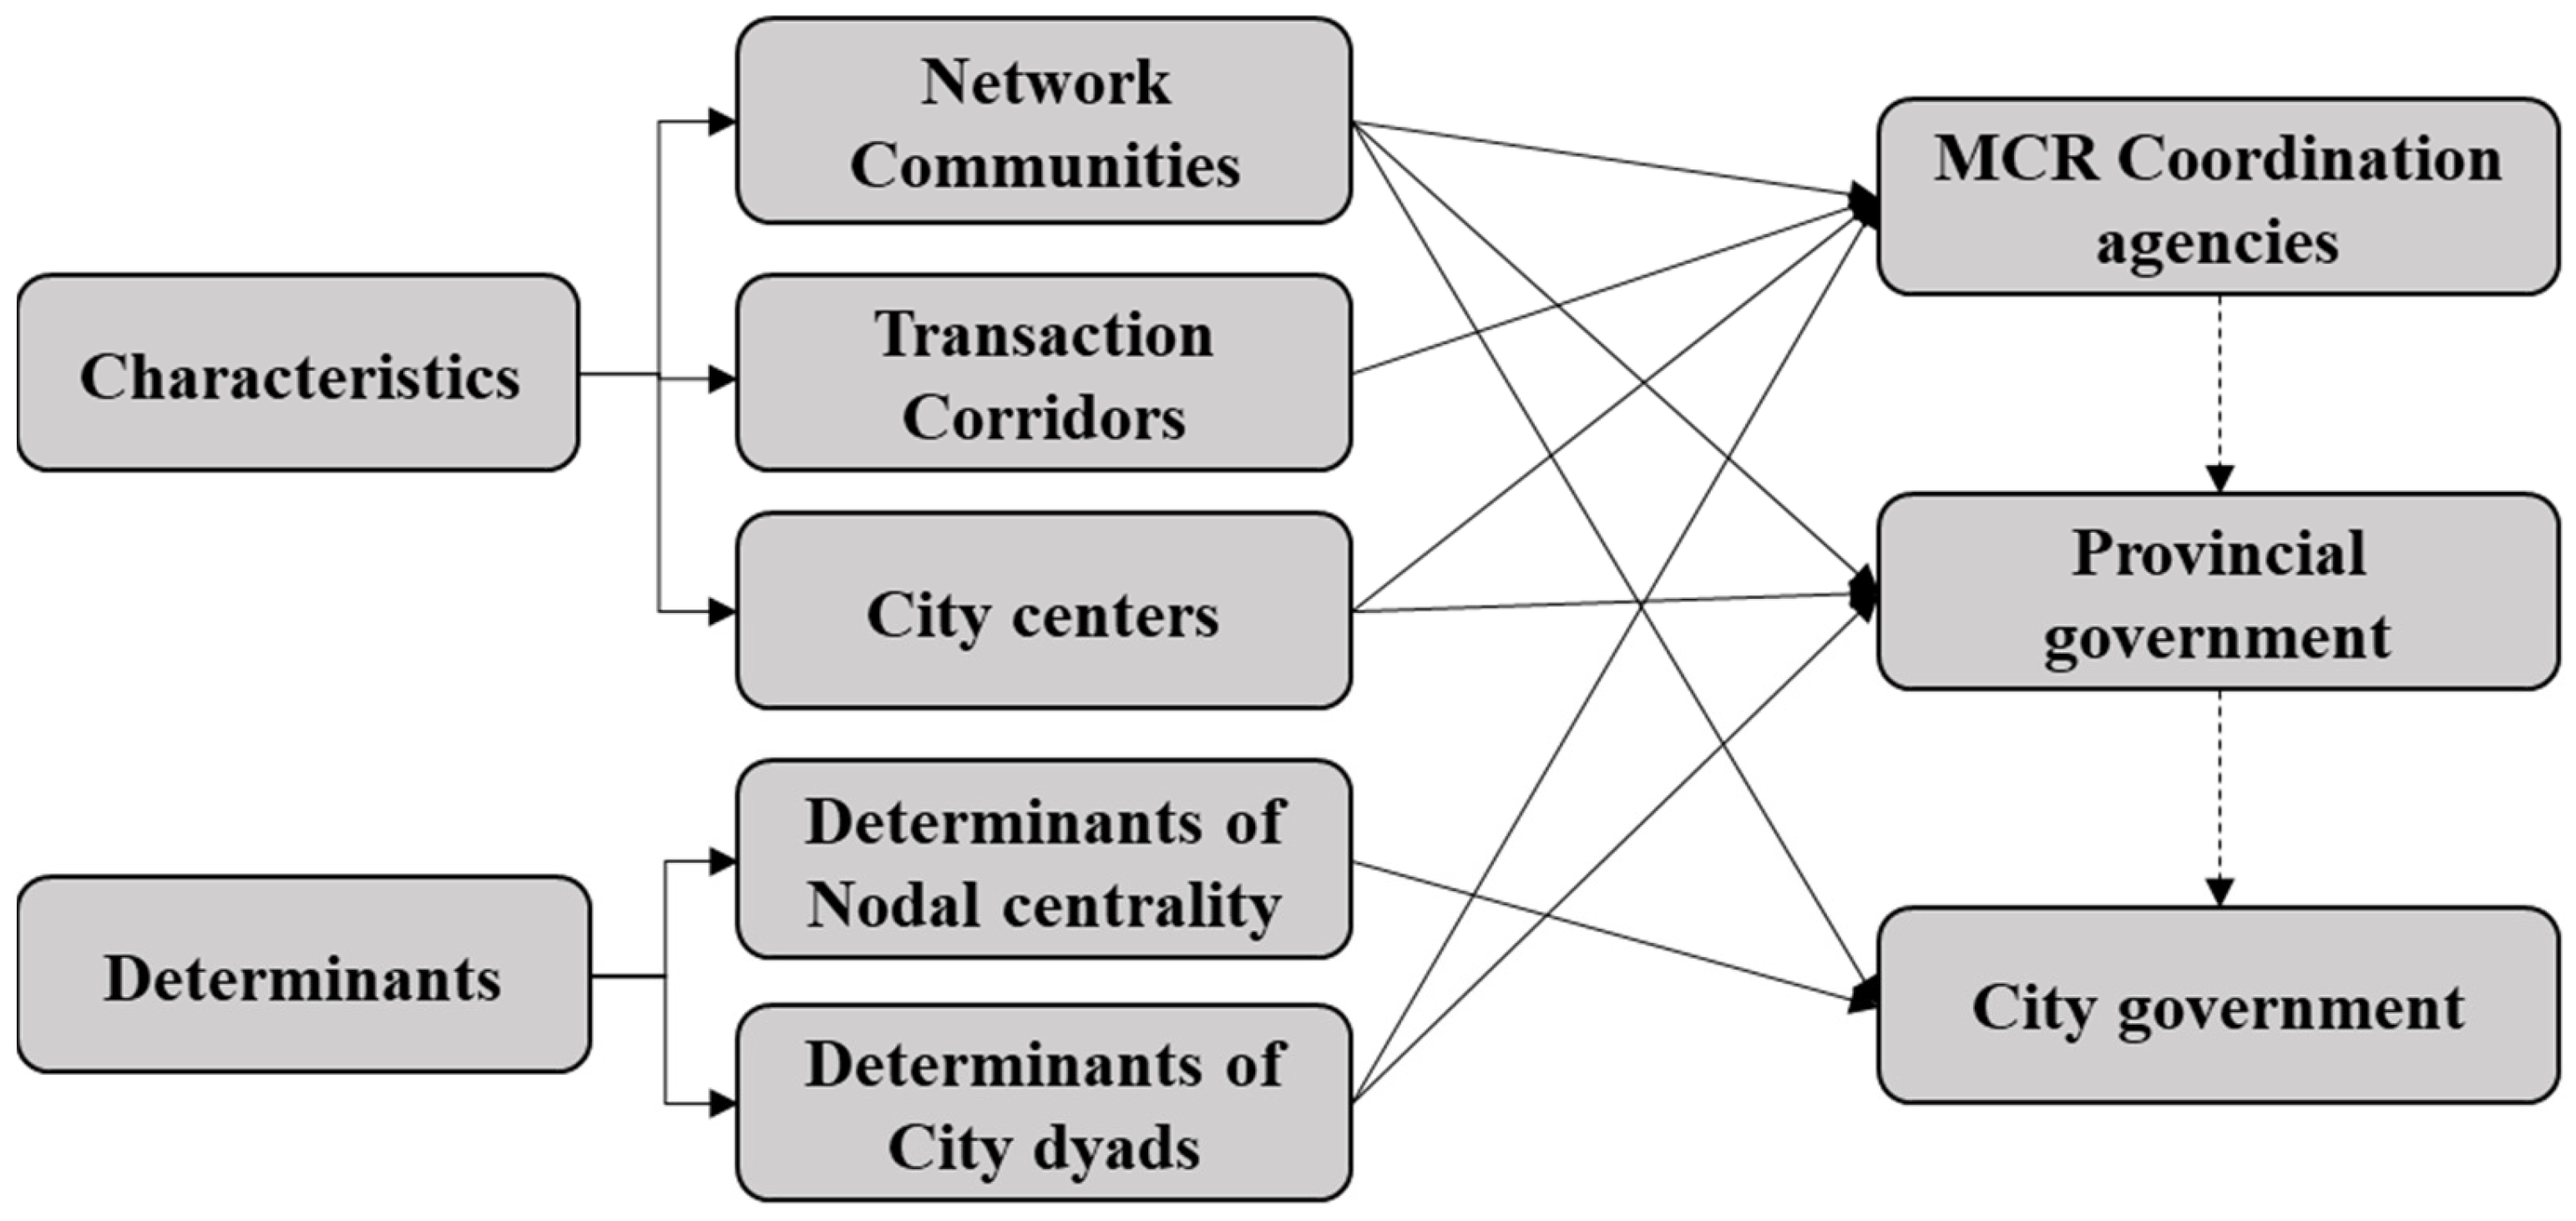
5.2. Implications for Policy and Regional Planning toward the Integrated Development of Manufacturing Industries in MCRs

The networked connection between cities is the law of regional development [79]. The interurban transaction links dominated by the major manufacturing companies are one of the most common aspects of urban networks in MCRs. Based on the research results of the characteristics and determinants of the urban networks from the perspective of manufacturing transaction linkages in MCRs, this study proposed a technical framework of policy and urban planning toward the integrated development of MCRs in manufacturing industries for policymakers at the multi-administrative level (Figure 9).
Policy recommendations and strategies for urban planning are presented at the MCR level and provincial and city government levels, respectively.
At the level of MCRs, first, city and provincial boundaries impede interurban manufacturing transaction linkages, thus inter-provincial governmental synergies and regular dialogue mechanisms should be established with coordination from the higher-level government to jointly negotiate the construction of transportation infrastructure, urban systems, etc. Secondly, emphasis should be placed on infrastructure development such as HSR within the MCR. This study finds that the interurban manufacturing transaction linkages in the YRDR are characterized by “core-periphery” in both network and geospatial aspects, i.e., the cities that are on the periphery of the network tend to be located at the geographical periphery of the MCR. At the same time, this study finds that HSR contributes significantly to intercity manufacturing trade linkages. By improving the HSR network and highway network between the core areas and peripheral areas, we could promote the formation of interurban collaboration of manufacturing transactions within the MCR. Thirdly, the integrated development areas of manufacturing transaction linkages near provincial boundaries within the MCR need to be emphasized. From the perspective of the geographical distribution of the network communities, three collaborative development areas of manufacturing transaction linkages have been formed between Jiangsu and Anhui provinces. At the scale of the sub-city division, the associated hinterland of manufacturing transactions in the core areas of the urban network, such as Shanghai and southern Jiangsu province, penetrates the external areas of the MCR. Finally, based on the spatial distribution of the network community, the MCR coordination agency needs to coordinate the planning and construction of cooperative industrial parks from the MCR level as a whole. Meanwhile, this study found that the co-built industrial parks between cities have no significant effect on the urban network. This indicated that the current policy of co-built industrial parks in the YRDR results from a lack of unified planning at the MCR level. Therefore, the integration of manufacturing transactions between cities can be enhanced through purposeful co-built industrial parks between the core areas and hinterlands.
At the provincial level, provincial governments (comparable to state governments in the U.S. and Canadian governments) in MCRs should strengthen transportation links between major city dyads under the coordination of the MCR coordination agency and formulate their own regional plans based on the plan of urban manufacturing division of labor of the MCR. This study found that provincial governments can strengthen the manufacturing transaction collaboration between cities in the form of co-built industrial parks. This study also found that the network community of sub-city divisions in south Jiangsu province includes some sub-city divisions in the north of Jiangsu province, which demonstrates the existence of a long-distance interurban manufacturing transaction network within the province. In response to this phenomenon, the joint construction of industrial parks between southern cities and northern cities in Jiangsu province was started in 2006, which was a feasible path to promoting the intercity integrated development from the perspective of manufacturing transactions [60].
For city governments, firstly, under the goal of integrated development of manufacturing industries among cities in MCRs, city governments should focus on creating industrial clusters around the leading manufacturing firms to enhance the function of manufacturing industries’ external linkages. Secondly, the city government should focus on investment in local science and technology to enhance the participation of the city in the manufacturing transaction network through the improvement of industrial competitiveness.

6. Conclusions

This study investigated the characteristics and determinants of the urban networks in the YRDR based on the transaction linkages of listed manufacturing firms. The main findings were as follows.
(1) The organizational characteristics of the urban manufacturing transaction networks differed from those of APS corporate transactions, intra-firm organization hierarchies, and innovation cooperation networks, and a global city such as Shanghai is not prominent in the network centrality in the urban manufacturing transaction networks in MCRs. (2) The geographical “core-periphery” structure of urban power and the circulation corridor of urban manufacturing transaction networks were formed within the YRDR. (3) This study identified the spatial dispersion characteristics of the centers and hinterlands of the urban manufacturing transaction network in the YRDR by community detection with sub-city divisions as the basic units. (4) Cooperation parks, innovation collaboration, HSR linkage, and geographical proximity between cities facilitate the formation of urban manufacturing transaction networks, and the similarity of industry structure and driving distance between cities inhibits the network. (5) The number of urban industrial firms, GDP per capita, and city government spending on science and technology contribute to the centrality of a city in urban manufacturing transaction networks, while the urban population in a city has a negative impact.
The major contributions of this research were as follows. (1) By introducing the transaction links in manufacturing industries, this study provides a complementary perspective to the urban network research of MCRs under the perspective of production factors and product circulation, and the characteristics and determinants of urban networks from the perspective of transactional linkages in manufacturing sectors is discovered. (2) This study establishes a “characteristics-determinants-strategies” technical framework for the analysis and optimization of interurban collaboration in manufacturing transactions within MCRs. It is worth mentioning that the YRDR is one of the six largest MCRs in the world; however, the analysis method and some of the results and strategies of the interurban collaboration in manufacturing transactions can be applied to other MCRs, especially those in developing countries that integrate GVCs with manufacturing, such as the Bangkok Metropolitan Area of Thailand, Ho Chi Minh Metropolitan Area of Vietnam, Greater Cairo Metropolitan Area of Egypt, etc.
There are some limitations of this research. Firstly, this study was an attempt to recognize the characteristics and determinants using the data of intercity transaction linkages in manufacturing industries, and subsequent studies could further refine the transaction linkages into production services, intermediate product transactions, etc. Secondly, the study did not investigate the evolutionary characteristics of the urban network, so follow-up studies could carry out a comparison of the intercity manufacturing transaction networks before and after the outbreak of the COVID-19 epidemic.

Author Contributions

Conceptualization, X.W. and Y.Y.; methodology, Y.Y.; software, Y.Y.; validation, X.W. and Y.Y.; formal analysis, Y.Y. and K.L.; investigation, Y.Y. and K.L.; resources, Y.Y. and K.L.; data curation, Y.Y. and K.L.; writing—original draft preparation, Y.Y. and K.L.; writing—review and editing, Y.Y. and X.W.; visualization, Y.Y.; supervision, X.W.; project administration, X.W.; funding acquisition, X.W. All authors have read and agreed to the published version of the manuscript.

Funding

This research was funded by the National Natural Science Foundation of China, grant number 52078115.

Data Availability Statement

The data used to support the findings of this study are available from the first author or the corresponding author upon request.

Conflicts of Interest

The authors declare no conflict of interest.

References

  1. Kordos, M.; Vojtovic, S. Transnational corporations in the global world economic environment. In Proceedings of the 3rd International Conference on New Challenges in Management and Organization: Organization and Leadership, Dubai, United Arab Emirates, 2 May 2016; pp. 150–158. [Google Scholar]
  2. Dachs, B.; Kinkel, S.; Jager, A.; Palcic, I. Backshoring of production activities in European manufacturing. J. Purch. Supply Manag. 2019, 25, 100531. [Google Scholar] [CrossRef] [Green Version]
  3. Stentoft, J.; Olhager, J.; Heikkila, J.; Thoms, L. Manufacturing backshoring: A systematic literature review. Oper. Manag. Res. 2016, 9, 53–61. [Google Scholar] [CrossRef]
  4. Wu, Y.; Sheng, J.C.; Huang, F. China’s future investments in environmental protection and control of manufacturing industry: Lessons from developed countries. Nat. Hazards 2015, 77, 1889–1901. [Google Scholar] [CrossRef]
  5. Gokan, T.; Kuroiwa, I.; Laksanapanyakul, N.; Ueki, Y. Spatial structures of manufacturing clusters in Thailand, Cambodia and Lao People’s Democratic Republic. J. Asia Pac. Econ. 2020, 25, 418–446. [Google Scholar] [CrossRef]
  6. Huyen, L. Internal Factors Influencing Firm Profitability in the COVID-19 Pandemic: An Empirical Evidence from Vietnam. J. Asian Financ. Econ. Bus. 2022, 9, 81–88. [Google Scholar] [CrossRef]
  7. Zhao, J.; Zhang, X.; Song, J. The Changing Geography of Domestic Financial City Network in China, 1995–2015. Growth Change 2018, 49, 490–511. [Google Scholar] [CrossRef]
  8. Sigler, T.J.; Martinus, K. Extending beyond “world cities” in World City Network (WCN) research: Urban positionality and economic linkages through the Australia-based corporate network. Environ. Plan. A Econ. Space 2017, 49, 2916–2937. [Google Scholar] [CrossRef]
  9. Antoine, S.; Sillig, C.; Ghiara, H. Advanced Logistics in Italy: A City Network Analysis. Tijdschr. Voor Econ. Soc. Geogr. 2017, 108, 753–767. [Google Scholar] [CrossRef]
  10. Alderson, A.S.; Beckfield, J. Power and position in the world city system. Am. J. Sociol. 2004, 109, 811–851. [Google Scholar] [CrossRef] [Green Version]
  11. Jacobs, W.; Koster, H.; Hall, P. The Location and Global Network Structure of Maritime Advanced Producer Services. Urban Stud. 2011, 48, 2749–2769. [Google Scholar] [CrossRef]
  12. Taylor, P.J.; Catalano, G.; Walker, D.R.F. Measurement of the world city network. Urban Stud. 2002, 39, 2367–2376. [Google Scholar] [CrossRef]
  13. Taylor, P.J.; Catalano, G.; Gane, N. A geography of global change: Cities and services, 2000–2001. Urban Geogr. 2003, 24, 431–441. [Google Scholar] [CrossRef]
  14. Derudder, B.; Taylor, P.J.; Witlox, F.; Catalano, G. Hierarchical tendencies and regional patterns in the world city network: A global urban analysis of 234 cities. Reg. Stud. 2003, 37, 875–886. [Google Scholar] [CrossRef]
  15. Taylor, P.J. Leading world cities: Empirical evaluations of urban nodes in multiple networks. Urban Stud. 2005, 42, 1593–1608. [Google Scholar] [CrossRef]
  16. Vind, I.; Fold, N. Multi-level modularity vs. hierarchy: Global production networks in Singapore’s electronics industry. Geogr. Tidsskr. Dan. J. Geogr. 2007, 107, 69–83. [Google Scholar] [CrossRef]
  17. Vind, I.; Fold, N. City networks and commodity chains: Identifying global flows and local connections in Ho Chi Minh City. Glob. Netw. J. Transnatl. Aff. 2010, 10, 54–74. [Google Scholar] [CrossRef]
  18. Kraetke, S. How manufacturing industries connect cities across the world: Extending research on ‘multiple globalizations’. Glob. Netw. J. Transnatl. Aff. 2014, 14, 121–147. [Google Scholar] [CrossRef]
  19. Tonts, M.; Taylor, M. Corporate Location, Concentration and Performance: Large Company Headquarters in the Australian Urban System. Urban Stud. 2010, 47, 2641–2664. [Google Scholar] [CrossRef]
  20. Hoyler, M.; Watson, A. Framing city networks through temporary projects: (Trans)national film production beyond “Global Hollywood”. Urban Stud. 2019, 56, 943–959. [Google Scholar] [CrossRef]
  21. Pan, F.; Zhao, S.X.B.; Wojcik, D. The rise of venture capital centres in China: A spatial and network analysis. Geoforum 2016, 75, 148–158. [Google Scholar] [CrossRef] [Green Version]
  22. Pan, F.; Bi, W.; Lenzer, J.; Zhao, S. Mapping urban networks through inter-firm service relationships: The case of China. Urban Stud. 2017, 54, 3639–3654. [Google Scholar] [CrossRef]
  23. Liang, S.; Cao, Y.; Wu, W.; Gao, J.; Liu, W.; Zhang, W. International Freight Forwarding Services Network in the Yangtze River Delta, 2005–2015: Patterns and Mechanisms. Chin. Geogr. Sci. 2019, 29, 112–126. [Google Scholar] [CrossRef] [Green Version]
  24. Wei, S.; Jiao, J.; Wang, L.; Xu, J. Evolving Characteristics of High-Speed Railway Network Structure in Yangtze River Delta, China: The Perspective of Passenger Flows. Appl. Spat. Anal. Policy 2020, 13, 925–943. [Google Scholar] [CrossRef]
  25. Lin, J.; Wu, K.; Yang, S.; Liu, Q. The Asymmetric Pattern of Population Mobility during the Spring Festival in the Yangtze River Delta Based on Complex Network Analysis: An Empirical Analysis of “Tencent Migration” Big Data. ISPRS Int. J. Geo-Inf. 2021, 10, 582. [Google Scholar] [CrossRef]
  26. Li, K.; Niu, X. Delineation of the Shanghai Megacity Region of China from a Commuting Perspective: Study Based on Cell Phone Network Data in the Yangtze River Delta. J. Urban Plan. Dev. 2021, 147, 04021022. [Google Scholar] [CrossRef]
  27. Li, Y.; Phelps, N.A. Articulating China’s Science and Technology: Knowledge Collaboration Networks Within and Beyond the Yangtze River Delta Megalopolis in China. Chin. Geogr. Sci. 2018, 28, 247–260. [Google Scholar] [CrossRef] [Green Version]
  28. Liu, C.; Niu, C.; Han, J. Spatial Dynamics of Intercity Technology Transfer Networks in China’s Three Urban Agglomerations: A Patent Transaction Perspective. Sustainability 2019, 11, 1647. [Google Scholar] [CrossRef] [Green Version]
  29. Seo, I.; Sonn, J.W. The persistence of inter-regional hierarchy in technology transfer networks: An analysis of Chinese patent licensing data. Growth Change 2019, 50, 145–163. [Google Scholar] [CrossRef] [Green Version]
  30. Jin, P.Z.; Wu, H.Y.; Yin, D.S.; Zhang, Y.P. Macroeconomic uncertainty and the spatiotemporal evolution of innovation networks: Evidence from China’s urban technology supply chain. J. Enterp. Inf. Manag. 2021, 34, 598–623. [Google Scholar] [CrossRef]
  31. Zhang, W.; Derudder, B.; Wang, J.; Witlox, F. An Analysis of the Determinants of the Multiplex Urban Networks in the Yangtze River Delta. Tijdschr. Voor Econ. Soc. Geogr. 2020, 111, 117–133. [Google Scholar] [CrossRef]
  32. Wang, W.; Miao, C.; Yu, H.; Li, C. Research on the characteristics and influencing factors of the Beijing-Tianjin-Hebei urban network structure from the perspective of listed manufacturing enterprises. PLoS ONE 2023, 18, e0279588. [Google Scholar] [CrossRef]
  33. Chen, X.; Yang, J.; Wang, E.; Miao, C. The characteristics of China’s urban network based on the supply chain system of automobile industry. Geogr. Res. 2020, 39, 370–383. [Google Scholar]
  34. Kang, J.; Lin, B.; Ning, Y. Spatial organization and Influencing Factors of Apple’s Component Supply Chain in China. Econ. Geogr. 2021, 41, 138–145. [Google Scholar]
  35. Hanssens, H.; Derudder, B.; Van Aelst, S.; Witlox, F. Assessing the Functional Polycentricity of the Mega-City-Region of Central Belgium Based on Advanced Producer Service Transaction Links. Reg. Stud. 2014, 48, 1939–1953. [Google Scholar] [CrossRef]
  36. Rossi, E.C.; Beaverstock, J.V.; Taylor, P.J. Transaction links through cities: ‘decision cities’ and ‘service cities’ in outsourcing by leading Brazilian firms. Geoforum 2007, 38, 628–642. [Google Scholar] [CrossRef]
  37. Pan, F.H.; Bi, W.K.; Liu, X.J.; Sigler, T. Exploring financial centre networks through inter-urban collaboration in high-end financial transactions in China. Reg. Stud. 2020, 54, 162–172. [Google Scholar] [CrossRef]
  38. Guan, M.M.; Wu, S.Y.; Liu, C.L. Comparing China’s urban aviation and innovation networks. Growth Change 2022, 53, 470–486. [Google Scholar] [CrossRef]
  39. Gui, Q.C.; Du, D.B.; Liu, C.L. The geography of intercity technology transfer networks in China. Reg. Stud. Reg. Sci. 2019, 6, 395–398. [Google Scholar] [CrossRef] [Green Version]
  40. Sun, Y.T.; Grimes, S. The actors and relations in evolving networks: The determinants of inter-regional technology transaction in China. Technol. Forecast. Soc. Change 2017, 125, 125–136. [Google Scholar] [CrossRef]
  41. Burger, M.J.; Meijers, E.J.; Van Oort, F.G. Multiple Perspectives on Functional Coherence: Heterogeneity and Multiplexity in the Randstad. Tijdschr. Voor Econ. Soc. Geogr. 2014, 105, 444–464. [Google Scholar] [CrossRef]
  42. Zhang, W.L.; Chong, Z.H.; Li, X.J.; Nie, G.B. Spatial patterns and determinant factors of population flow networks in China: Analysis on Tencent Location Big Data. Cities 2020, 99, 2640. [Google Scholar] [CrossRef]
  43. Zhang, F.; Ning, Y.M.; Lou, X.Y. The evolutionary mechanism of China’s urban network from 1997 to 2015: An analysis of air passenger flows. Cities 2021, 109, 3005. [Google Scholar] [CrossRef]
  44. Hu, Z.B.; Wu, G.D.; Han, Y.L.; Niu, Y.L. Unraveling the dynamic changes of high-speed rail network with urban development: Evidence from China. Socio-Econ. Plan. Sci. 2023, 85, 101380. [Google Scholar] [CrossRef]
  45. Xiao, C.W.; Liu, C.X.; Li, Y.C. Directional and Weighted Urban Network Analysis in the Chengdu-Chongqing Economic Circle from the Perspective of New Media Information Flow. ISPRS Int. J. Geo-Inf. 2023, 12, 1. [Google Scholar] [CrossRef]
  46. Yang, L.J.; Wang, J.; Yang, Y.C. Spatial evolution and growth mechanism of urban networks in western China: A multi-scale perspective. J. Geogr. Sci. 2022, 32, 517–536. [Google Scholar] [CrossRef]
  47. Meijers, E. Polycentric urban regions and the quest for synergy: Is a network of cities more than the sum of the parts? Urban Stud. 2005, 42, 765–781. [Google Scholar] [CrossRef]
  48. Wu, F.L.; Zhang, J.X. Planning the competitive city-region—The emergence of strategic development plan in China. Urban Aff. Rev. 2007, 42, 714–740. [Google Scholar] [CrossRef]
  49. Neal, Z.; Derudder, B.; Liu, X.J. Using urban networks to gain new insight into old questions: Community, economy, bureaucracy. J. Urban Aff. 2021, 43, 2–15. [Google Scholar] [CrossRef]
  50. Luo, X.L.; Shen, J.F. A study on inter-city cooperation in the Yangtze river delta region, China. Habitat Int. 2009, 33, 52–62. [Google Scholar] [CrossRef]
  51. Sassen, S. The Global City: New York, London, Tokyo; Princeton University Press: Princeton, NJ, USA, 2001. [Google Scholar]
  52. Knoke, D. Political Networks: The Structural Perspective; Cambridge University Press: Oxford, UK, 1994; p. 308. [Google Scholar]
  53. Girvan, M.; Newman, M.E.J. Community structure in social and biological networks. Proc. Natl. Acad. Sci. USA 2002, 99, 7821–7826. [Google Scholar] [CrossRef]
  54. Rosvall, M.; Bergstrom, C.T. Maps of random walks on complex networks reveal community structure. Proc. Natl. Acad. Sci. USA 2008, 105, 1118–1123. [Google Scholar] [CrossRef] [PubMed]
  55. Blondel, V.D.; Guillaume, J.-L.; Lambiotte, R.; Lefebvre, E. Fast unfolding of communities in large networks. J. Stat. Mech. Theory Exp. 2008, 2008, P10008. [Google Scholar] [CrossRef] [Green Version]
  56. Hubert, L.; Schultz, J. Quadratic Assignment as a General Data—Analysis Strategy. Br. J. Math. Stat. Psychol. 1976, 29, 190–241. [Google Scholar] [CrossRef]
  57. Tobler, W.R. A Computer Movie Simulating Urban Growth in the Detroit Region. Econ. Geogr. 1970, 46, 234–240. [Google Scholar] [CrossRef]
  58. Gaulier, G.; Lemoine, F.; Ünal-Kesenci, D. China’s Integration in East Asia: Production Sharing, FDI & High-Tech Trade. Econ. Change Restruct. 2007, 40, 27–63. [Google Scholar] [CrossRef] [Green Version]
  59. Wang, X.; Zhu, K.; Li, Y.; Xu, J. Applicability and prospect of China’s development zone model in Africa. Chin. Geogr. Sci. 2017, 27, 860–874. [Google Scholar] [CrossRef] [Green Version]
  60. Chan, R.C.K.; Xian, S. Assessing the incentives in regional city-to-city cooperation: A case study of Jiangyin-Jingjiang Industrial Park of Jiangsu Province in the Yangtze River Delta region. Asia Pac. Viewp. 2012, 53, 56–69. [Google Scholar] [CrossRef]
  61. Gattiker, T.F.; Huang, X.; Schwarz, J.L. Negotiation, email, and Internet reverse auctions: How sourcing mechanisms deployed by buyers affect suppliers’ trust. J. Oper. Manag. 2007, 25, 184–202. [Google Scholar] [CrossRef] [Green Version]
  62. Turkina, E.; Van Assche, A.; Kali, R. Structure and evolution of global cluster networks: Evidence from the aerospace industry. J. Econ. Geogr. 2016, 16, 1211–1234. [Google Scholar] [CrossRef] [Green Version]
  63. Lu, F.; Liu, M.; Wang, W.; Liu, M. Impact of Polycentric Urban Network on Industrial Structure Upgrades: Evidence from the Yangtze River Economic Belt. J. Urban Plan. Dev. 2022, 148, 04022024. [Google Scholar] [CrossRef]
  64. Pain, K.; Van Hamme, G.; Vinciguerra, S.; David, Q. Global networks, cities and economic performance: Observations from an analysis of cities in Europe and the USA. Urban Stud. 2016, 53, 1137–1161. [Google Scholar] [CrossRef]
  65. Huang, L.; Zhang, H. Study on the harmony between Beijing manufacturing’s competitiveness and technology innovation. Sci. Res. Manag. 2007, 28, 14. [Google Scholar]
  66. Eisingerich, A.B.; Bell, S.J.; Tracey, P. How can clusters sustain performance? The role of network strength, network openness, and environmental uncertainty. Res. Policy 2010, 39, 239–253. [Google Scholar] [CrossRef] [Green Version]
  67. Tsai, W.C. Explore the Effects of Interfirm Cooperation and Collaboration Between Supply Chain Integration and Service Innovation Performance. In Proceedings of the IEEE International Conference on Industrial Engineering and Engineering Management IEEM, Singapore, 6–9 December 2015; pp. 559–563. [Google Scholar]
  68. Kim, K.; Choi, S.O.; Lee, S. The Effect of a Financial Support on Firm Innovation Collaboration and Output: Does Policy Work on the Diverse Nature of Firm Innovation? J. Knowl. Econ. 2021, 12, 645–675. [Google Scholar] [CrossRef]
  69. Burger, M.J.; Van der Knaap, B.; Wall, R.S. Polycentricity and the Multiplexity of Urban Networks. Eur. Plan. Stud. 2014, 22, 816–840. [Google Scholar] [CrossRef]
  70. Cheng, Y.; LeGates, R. China’s hybrid global city region pathway: Evidence from the Yangtze River Delta. Cities 2018, 77, 81–91. [Google Scholar] [CrossRef]
  71. Ke, W.; Chen, W.; Yu, Z. Uncovering Spatial Structures of Regional City Networks from Expressway Traffic Flow Data: A Case Study from Jiangsu Province, China. Sustainability 2017, 9, 1541. [Google Scholar] [CrossRef] [Green Version]
  72. Wu, J.; Zhang, P.; Zhao, Z. Production Industry Chain, Production Matching Radius and Self-development Capability of an Enterprise. China Ind. Econ. 2005, 2, 44–50. [Google Scholar]
  73. Wang, L.; Yang, W.; Yuan, Y.; Liu, C. Interurban Consumption Flows of Urban Agglomeration in the Middle Reaches of the Yangtze River: A Network Approach. Sustainability 2019, 11, 268. [Google Scholar] [CrossRef] [Green Version]
  74. Wang, J.; Du, D.; Huang, J. Inter-city connections in China: High-speed train vs. inter-city coach. J. Transp. Geogr. 2020, 82, 102619. [Google Scholar] [CrossRef]
  75. Peng, H.; Zhang, J.; Liu, Z.; Lu, L.; Yang, L. Network analysis of tourist flows: A cross-provincial boundary perspective. Tour. Geogr. 2016, 18, 561–586. [Google Scholar] [CrossRef]
  76. Duan, D.; Zhang, Y.; Chen, Y.; Du, D. Regional Integration in the Inter-City Technology Transfer System of the Yangtze River Delta, China. Sustainability 2019, 11, 2941. [Google Scholar] [CrossRef] [Green Version]
  77. Zhang, W.; Derudder, B.; Wang, J.; Shen, W.; Witlox, F. Using Location-Based Social Media to Chart the Patterns of People Moving between Cities: The Case of Weibo-Users in the Yangtze River Delta. J. Urban Technol. 2016, 23, 91–111. [Google Scholar] [CrossRef]
  78. Zhang, W.; Derudder, B.; Wang, J.; Shen, W. Regionalization in the Yangtze River Delta, China, from the perspective of inter-city daily mobility. Reg. Stud. 2018, 52, 528–541. [Google Scholar] [CrossRef]
  79. Wang, L.; Zhang, F.; Zang, Y.; Duan, J. Understanding the Regional Integration Process from the Perspective of Agglomeration and Urban Networks: Case Study in Central China. Int. J. Environ. Res. Public Health 2022, 19, 2834. [Google Scholar] [CrossRef] [PubMed]
Figure 1. Research area.
Systems 11 00401 g001
Figure 2. Establishment of the interurban manufacturing transaction network.
Systems 11 00401 g002
Figure 3. Spatial characteristics of the urban networks in the YRDR.
Systems 11 00401 g003
Figure 4. Distribution of degree centrality and betweenness centrality in cities.
Systems 11 00401 g004
Figure 5. Spatial autocorrelation of degree centrality (a) and betweenness centrality (b) of sub-city divisions in the YRDR.
Systems 11 00401 g005
Figure 6. Geographical distribution of the network communities of the urban network in the YRDR (cities as basic units).
Systems 11 00401 g006
Figure 7. Community division and node centralities of the urban networks in the YRDR (sub-city divisions as basic nodes, in the Force Atlas layout in Gephi).
Systems 11 00401 g007
Figure 8. Geographical distribution of the network communities of the urban networks in the YRDR (sub-city divisions as basic units).
Systems 11 00401 g008
Figure 9. A “characteristics-determinants-strategies” technical framework for the interurban collaboration in manufacturing transactions within MCRs.
Systems 11 00401 g009
Table 1. Suppliers of Gw Electric (Shanghai) Co., Ltd., in the YRDR during 2016 to 2021.
SupplierProvinceCitySub-City DivisionPurchase TimePurchase Amount (Ten Thousand Yuan)Percentage of Current Year’s Purchases (%)Source of Information
Shanghai Yufei Metal Product Co., Ltd.ShanghaiShanghaiPudong New Area1 April 2020967.516.14annual report
Xiandeng HI-TECH Electric Co., Ltd.ZhejiangHuzhouWuxing District1 April 2020662.454.21annual report
Suzhou Liangji Motor Co., Ltd.JiangsuSuzhouChangshu City1 April 2020571.263.63annual report
Shanghai Bingte Electromechanical Co., Ltd.ShanghaiShanghaiFengxian District1 April 2020515.943.28annual report
Shanghai Yingdu Information Technology Co., Ltd.ShanghaiShanghaiYangpu District1 April 20193791.0721.33prospectus
Shanghai Yufei Metal Product Co., Ltd.ShanghaiShanghaiPudong New Area1 April 20191200.876.76prospectus
Wujiang Ruifeng Machinery Co., Ltd.JiangsuSuzhouWujiang District1 April 2019648.283.65prospectus
Shanghai Bingte Electromechanical Co., Ltd.ShanghaiShanghaiFengxian District1 April 2019648.53.65prospectus
Shanghai Yingdu Information Technology Co., Ltd.ShanghaiShanghaiYangpu District1 April 20181903.913.11prospectus
Shanghai Yufei Metal Product Co., Ltd.ShanghaiShanghaiPudong New Area1 April 20181297.668.94prospectus
Jiangsu Yanling Electric Appliance FactoryJiangsuTaizhouTaixing City1 April 20181278.158.8prospectus
Suzhou Goldway Electromechanical Technology Co., Ltd.JiangsuSuzhouWujiang District1 April 2018764.825.27prospectus
Suzhou Goldway Electromechanical Technology Co., Ltd.JiangsuSuzhouWujiang District1 April 20171969.6318.92prospectus
Shanghai Yufei Metal Product Co., Ltd.ShanghaiShanghaiPudong New Area1 April 20171015.99.76prospectus
Xiandeng HI-TECH Electric Co., Ltd.ZhejiangHuzhouWuxing District1 April 2017700.636.73prospectus
Jiangsu Yanling Electric Appliance FactoryJiangsuTaizhouTaixing City1 April 2017700.916.73prospectus
Shanghai Greenwoods Electric
MOTOR Co., Ltd.
ShanghaiShanghaiChongming District1 April 2017637.426.12prospectus
Shanghai Yufei Metal Product Co., Ltd.ShanghaiShanghaiPudong New Area1 April 2016848.3610prospectus
Jiangsu Yanling Electric Appliance FactoryJiangsuTaizhouTaixing City1 April 2016615.498prospectus
Shanghai Hualong Longbao Electrician Equipment Co., Ltd.ShanghaiShanghaiMinhang District1 April 2016654.368prospectus
Yixing Nuofu Electrical Materials Co., Ltd.JiangsuWuxiYixing District1 April 2016577.747prospectus
Shanghai Dishan Lamps & Lanterns FactoryShanghaiShanghaiPudong New Area1 April 2016422.415prospectus
Table 2. Index definition and independent variable matrix construction.
Meaning of IndexSelection of IndexVariable SymbolInterpretation of IndexConstruction of Matrix
Geographical adjacencyGeographical proximityGeoproximityWhether the two cities are administratively adjacentIf the two cities are geographically adjacent, the value is 1, otherwise 0
Driving distance aDrivingdisMinimum driving distance between two citiesSymmetric matrix formed by the driving distance between any two cities
Administrative district economyAdminecoWhether the two cities are in the same provinceIf the two cities are in the same province, the value is 1, otherwise 0
Administrative resourcesNational-level development zonesDevelopmentzoneDifferences in the number of national-level development zones (economic and technological development zones, high-tech industrial development zones, and special customs supervision areas) between citiesSymmetric matrix of the difference in the number of national-level development zones between two cities
Cooperation parks bCoparkNumber of cooperation parks between two citiesSymmetric matrix of the number of cooperation parks between cities
Administrative levelAdminlevelDifferences in administrative levels between two citiesIf the two cities are municipalities directly under the central government, provincial capitals, or cities specifically designated in the state plan, the value is 1, otherwise 0
People mobilityHSR linkage cHighspeedrailDaily HSR service between two citiesSymmetric matrix formed by the daily HSR service between cities
Innovation cooperationPaper co-authorshipCoauthorshipNumber of collaborative papers between two cities in Web of Science (total number of papers for the period 2016–2021)Symmetric matrix of the number of collaborative papers between cities
Technological baseIndustry structure dIndustrystrucSimilarity of the industry structure between two citiesSymmetric matrix based on the industrial structural similarity coefficient between cities
a Driving distances between cities of government locations were acquired in batches via lbs.amap.com. b By referring to the official websites of Shanghai, Jiangsu, Zhejiang, and Anhui, and collecting various news and reports for supplementation, we obtained data for 101 cooperation parks in total. c The data of daily HSR services between cities were from China Railway (https://www.12306.cn/, accessed on 16 February 2022). d Industry structure: the similarity of industry structure of each pair of cities was measured according to the industrial structural similarity coefficient proposed by the United Nations Industrial Development Organization (UNIDO) in 1979. The equation is: S i j = X i 1 X j 1 + X i 2 X j 2 + X i 3 X j 3 / X i 1 2 + X i 2 2 + X i 3 2 × X j 1 2 + X j 2 2 + X j 3 2 , where S i j represents the industry structure similarity of City i and City j; X i 1 ,   X i 2 ,   X i 3 represents the output value proportion of the primary, secondary, and tertiary industries of City i; and X j 1 ,   X j 2 ,   X j 3 represents the output value proportion of the primary, secondary, and tertiary industries of City j. The value of S i j is between 0 and 1, and a value closer to 1 indicates that the industrial structure is more similar between two cities.
Table 3. Determinants of the degree centrality of urban manufacturing transaction networks.
TypeSymbolsDefinition of VariablesImplication of VariablesObserved ValueAverage ValueStandard Deviation (SD)
Dependent variable ln D e g r e e Degree centrality of citiesInfluence in network415.36071.0551
Independent variables ln P o p Population in urban areasPopulation size415.10610.7406
ln P e r _ G D P GDP per capitaEconomic level4111.20250.5443
ln I n d u s _ s t r u c t u r e Advanced degree of industry structure (ratio of tertiary industry GDP to secondary industry GDP)Industry level410.06840.2649
ln T e c h Science and technology input from city governmentTechnology input4112.03781.1519
ln P a t e n t Number of granted patents of city Technology capabilities419.18891.2208
ln I n d u s f i r m Number of industrial enterprises in the cityIndustrial clustering417.60240.8333
ln L o g i s t i c s Number of employees in the traffic, transport, storage, and postProduction services419.86201.0649
ln F i n a n c e Number of employees in financial intermediationProduction services4110.02090.8203
Table 4. Degree centralities and betweenness centralities of cities of urban networks in the YRDR.
LevelDegree CentralityBetweenness Centrality
Number of CitiesCitiesNumber of CitiesCities
Level 15Nanjing, Hangzhou, Shanghai, Suzhou (Jiangsu province), Taizhou (Zhejiang province)7Nanjing, Hangzhou, Suzhou (Jiangsu province), Shanghai, Chuzhou, Hefei, Bengbu
Level 215Chuzhou, Huzhou, Changzhou, Ningbo, Hefei, Bengbu, Jiaxing, Wuxi, Anqing, Wuhu, Shaoxing, Nantong, Wenzhou, Taizhou (Jiangsu province), Yangzhou10Anqing, Changzhou, Ningbo, Taizhou (Zhejiang province), Wuxi, Shaoxing, Xuzhou, Wenzhou, Huzhou, Taizhou (Jiangsu province)
Level 311Xuancheng, Huaian, Xuzhou, Zhenjiang, Jinhua, Yancheng, Lianyungang, Quzhou, Huangshan, Ma’anshan, Tongling7Jiaxing, Yangzhou, Xuancheng, Huaian, Nantong, Wuhu, Jinhua
Level 48Suqian, Lishui, Suzhou (Anhui province), Lu’an, Fuyang, Chizhou, Bozhou, Zhoushan11Zhenjiang, Ma’anshan, Tongling, Yancheng, Quzhou, Suizhou, Lishui, Huangshan, Suqian, Fuyang, Bozhou
Level 52Huaibei, Huainan6Chizhou, Lianyungang, Huaibei, Lu’an, Huainan, Zhoushan
Table 5. QAP correlation and regression results.
Variable SymbolCorrelation
Coefficient
Standardized
Regression Coefficient
P (Large)P (Small)
Geoproximity0.2322 ***0.07481 **0.010000.99050
Drivingdis−0.2919 ***−0.09057 **0.981010.01949
Admineco0.0809 **−0.08506 ***0.998000.00250
Developmentzone0.2731 **0.12000 **0.034480.96602
Copark0.1269 **0.024030.105950.89455
Adminlevel0.2292 ***−0.06936 **0.984010.01649
Highspeedrail0.7109 ***0.59425 ***0.000501.00000
Coauthorship0.4722 ***0.11129 **0.010990.98951
Industrystruc−0.2584 ***−0.05324 *0.915540.08496
R-Square0.546
Note: ***, **, and * represent significance at the 1%, 5%, and 10% levels, respectively.
Table 6. Results of stepwise regression analysis.
Dependent Variable and Independent VariablesStandardized Coefficients and SignificanceVIFR2
ln P o p −0.250 **2.0030.919
ln P e r _ G D P 0.578 ***2.253
ln T e c h 0.368 ***4.335
ln I n d u s f i r m 0.601 ***2.884
β 0 −8.834——
Note: *** and ** represent significance at the 1% and 5% levels, respectively.
Disclaimer/Publisher’s Note: The statements, opinions and data contained in all publications are solely those of the individual author(s) and contributor(s) and not of MDPI and/or the editor(s). MDPI and/or the editor(s) disclaim responsibility for any injury to people or property resulting from any ideas, methods, instructions or products referred to in the content.

