
Research on Supply and Demand of Aged Services Resource Allocation in China: A System Dynamics Model

1
School of Economics and Management, Yanshan University, Qinhuangdao 066004, China
2
Department of Public Education, Hebei University of Chinese Medicine, Shijiazhuang 050200, China
3
School of Mechanical Engineering, Yanshan University, Qinhuangdao 066004, China
*
Author to whom correspondence should be addressed.
Systems 2022, 10(3), 59; https://doi.org/10.3390/systems10030059
Submission received: 29 March 2022
/
Revised: 28 April 2022
/
Accepted: 29 April 2022
/
Published: 2 May 2022
(This article belongs to the Special Issue Research Trends on the Development of Integrated and Robust Social Development Management Systems)
Abstract
:With the rapid growth of the elderly population of China in recent years, the service demands of older Chinese people continue to increase. The increasingly severe situation with respect to the elderly population is an important social problem that China will face for a long time into the future. It is urgent to solve the problem of how to scientifically carry out allocation planning of service resources for the aged and guide the effective supply of service resources. This paper analyzes the factors affecting service resources for the aged, divides China’s service resource supply and demand system into a supply subsystem, a demand subsystem, and a population and economy subsystem. Using system dynamics methods to analyze the causal relationship between variables and the state space method to build a mathematical model and perform simulation analysis, we research the the current situation of China’s service resources supply and demand balance for the aged. In addition, we put forward resource configuration optimization measures for the future allocation of service resources for the aged, providing a practical basis for future decision-making.
1. Introduction
Aged service resources is a general term for the material elements (such as human, material, financial, environmental, and other resources) which provide various services for older people. The total aged service resource is the core that measure that guarantees the supply of services for older people, while the service development level determines the quality of services provided for older people. Compared with the developed countries, where the level of economic development is in keeping with aging, China has entered the aging society stage ahead of time, when the economy has not yet reached the developed level. High-level designs and strategic planning to deal with the elderly population are lagging behind, and the levels of aged service security and medical security remain relatively low. There are problems in the allocation of service resources, such as uneven allocation and insufficient supply. These problems lead to higher requirements for efficient and reasonable allocation of the aged service resources. Therefore, it is of great theoretical and practical significance to accurately grasp the relationship between the supply and demand of aged service resources and promote their balanced and effective allocation.
At present, there is no authoritative and clear definition in academic circles that connotes service resources allocation for the aged, and the related research results mainly focus on the demand and supply of such services. In the 1950s, several scholars attended to the problem of aging [1]. Population and aging dynamics is one of the most studied topics in system dynamics. There are many studies of population dynamics based on different models, including nonlinear models [2], the von Foerster–McKendrick model [3], mathematical models considering environmental disturbances [4], etc. According to this research, declining fertility rates lead to a decline in the population growth rate [5], which makes the proportion of elderly persons in the population structure increase continuously. In recent years, the fertility rate in China has been declining. Some studies show that even after the implementation of the universal three-child policy in 2021 the fertility rate may continue to decline [6], indicating that the aging level may be further deepened. However, the current supply of service resources for the elderly in China remains relatively backward; the long-term care insurance system has been implemented only in certain cities, and there are problems such as narrow coverage and lack of dynamic adjustment mechanisms in service provision [7]. In the face of the increasing demand for pension services, it is urgent to study the current situation of pension service resources and find the optimization direction of these service resources in the future.
The demand for aged care has been summarized as “3M” in previous studies, referring to money, medical care, and mental health services. Later, scholars expanded this concept to five dimensions: social resources, economic resources, mental health, physical health, and daily activities [8]. Changes int the political, economic, and demographic landscape have led to the demand for aged services by the elderly becoming more prominent, especially among elderly persons with fragile health and advanced age [9]. During the COVID-19 pandemic and social distancing restrictions, the elderly are often not able to access timely medical care. Although the elderly population may benefit the most from telehealth services, not enough services have been developed and implemented to satisfy the needs of this growing population [10].
In the other hand, studies have shown that more than 50% of the elderly population’s long-term care service demands have not been met and that the related service infrastructure needs to be further strengthened [11]. Compared with those who choose home-based care, those who stay in institutions offering services for the elderly show a variety of pathologies and complex health care and social care needs [12]. The demand for aged services can be divided by physical and psychological services [13]. Beginning in the early 1990s, New Zealand has been advocating home-based care for the elderly. The success of this policy largely depends on whether there is a proper family environment, supportive social network, and regular assessments to determine changes in health status and consequent need for support. While family members can provide “light housework”, most care services and heavy housework need professional nursing staff [14]. The emergence of the pension community has greatly reduced the pressure on informal aged service providers, and has developed rapidly in developed countries. At present, developed countries already have a relatively advanced system in terms of pension communities. Scholars hold that the scale and service content of the pension community should be designed according to the characteristics of the population structure [15]. Furthermore, is believed to be conducive to the balance of supply and demand to issue vouchers for aged services, allowing the aged to enjoy the pension community [16]. Combining the management of complex chronic diseases with pension communities for comprehensive management has improved the efficiency of medical services. There are differences in the demand for aged services; with increasing user age, services need to become stronger [17]. The physical health and economic situation of the elderly are important factors that affect the choice of aged service methods for them [18], and the elderly have a strong demand for heavy housework, outdoor activities, and assistance in handling personal affairs and leisure services [19]. In summarizing the literature on the supply of aged services, it was found that problems such as insufficient supply [20] and mismatches between supply and demand [21] for hardware and software facilities exist with respect to aged services in various countries; the facilities and service quality of public pension institutions are generally superior [22]. Seeking ways to improve the supply level of aged services has become a hot issue for scholars.
System dynamics is the science of studying the feedback structure and behavior of systems; it emphasizes observing things from a dynamic and systematic perspective and combining macro- and microperspectives by using the causal relationship between factors, which can explain the correlation of whole systems quite well while explaining complex cross-problems. The theory and method of system dynamics are widely used in research on environmental science, decision science, economics, and other disciplines. In research related to health and nursing, scholars have used system dynamics to study the quality of nursing work [23], emergency care assessment [24], population policy and maternity insurance [25], and the evaluation of patient expectations and perceptions [26]. Through model simulation calculations, system dynamics can deal with higher-order complex system problems involving nonlinearity and multiple feedback. By combining qualitative and quantitative analysis, it can better explain the academic and empirical relationships between different variables [27]. Therefore, this paper chose to use system dynamics to study service resource allocation for the aged.
In the study of the system dynamics of aged care services, one study based on data from the German Health Expenditure and German Federal Statistics Office established two coarse SD models to research the monetary and quality of life aspects of the social and health care system. The authors suggested that the SD model fit may be an effective method to study the impact of innovation diffusion in the health services for the elderly sector [28]. A multi-state population model was developed using system dynamics to predict changes in the population of elderly persons with cognitive impairment in China [29]. System Dynamics methodology was used in the establishment of a long-term care system in Singapore in order to investigate the effects of current long-term care policies and various alternative policy options on the labour market participation of primary family caregivers for elderly persons with disabilities [30]. These previous research efforts provide references for the research methods used in this paper.
The existing research has laid the theoretical foundation for the research carried out in this paper and, while it has provided valuable enlightenment, there are certain shortcomings. Current research on aged service resources only addresses the configuration of these resources and the logical relationship between the various influencing factors of qualitative research, not quantitative research. In addition, the system of endowment resource allocation mechanisms have not been studied. There are few studies that consider the causal relationship between multi-party participants and resource allocation from a systematic perspective or that explore the internal evolutionary mechanism of service resources allocation for the aged. Therefore, based on the basic national conditions of China this paper studies service resources allocation for the aged, enriches the extant theoretical research on service resources allocation for the aged, further expands the research tools available in this field, and puts forward differentiated optimization measures for service resources allocation of the aged in order to aid decision-makers.
The rest of this paper is structured as follows: in Section 2, the development and conceptualization of the model are described, the factors affecting the system are analyzed, and the variables used to determine their initial values are selected; in Section 3, the research hypothesis is presented, along with the boundary conditions of the model used to simulate the process of resource allocation for aged care services; in Section 4, the model is simulated and the simulation results are analyzed, and the model is tested using historical data; Section 5 provides discussions and brief conclusions as well as an in-depth analysis of measures for optimizing the allocation of old-age services resources; finally, Section 6 concludes with suggestions for future research work. Several important equations and their development along with accompanying explanations are listed in the Appendices A and B.
2. Model Conceptualisation
2.1. Subsystem of Population and Economy
Among the three subsystems of the pension service resource allocation system, the population and economic subsystem has an impact on the demand subsystem and the supply subsystem of the pension service resource. On the one hand, the elderly population determines the total demand for elder care services, and the level of economic development determines the income level of the elderly and their ability to pay for care services, which indirectly affects the demand for such services. On the other hand, the level of economic development affects the expenditure of state finances and the investment of society in pension services, and additionally affects the supply of pension service resources by influencing the social participation of state finances and pension services. The influencing factors of the system are analyzed as follows.
Gross Domestic Product (GDP): GDP is an important indicator for measuring a country’s economic level. Improving a country’s economic level can promote investment in and construction of pension services and improve the supply of pension service resources. At the same time, the economic level has an impact on incomes, and increases in income can stimulate consumption.
Per Capita Disposable Income (PCDI): PCDI is the sum of residents’ final consumption expenditures and savings, and can be used to measure people’s living standards. When the demand for aged services remains unchanged, a higher PCDI makes for stronger purchasing power on the part of users, and the willingness to purchase services increases to a certain extent. The ratio of pension expenditures to per capita disposable income (RPETP) reflects the consumption burden of the elderly. Their variation trends according to the data on Per Capita GDP (PCGDP) and PCDI in the China Statistical Yearbook 2015–2019 published by the National Bureau of Statistics are shown in Figure 1. While there is no direct relation between PCDI and PCGDP in terms of calculation, they have a positive correlation relationship in terms of the trend. By calculating the ratio of PCDI to PCGDP in recent years, it can be seen that this ratio fluctuates between 0.427 and 0.439. In this paper, the ratio of PCDI to PCGDP in the model is called FPCDI; the average value over five years is calculated to determine the parameter value of 0.43.
Consumer Price Index (CPI): CPI reflects changes in the prices of consumer goods and services purchased by residents, and is used to measure the inflation level. The price of elder care services, as well as other goods and services, increases as the consumer price index rises. Therefore, economic indicators such as the price of a service, related subsidies, and financial expenditure on the service are all related to the consumer price index.
Total population (TP): population structure is determined by the total population, which is determined by birth rate (BR) and death rate (DR). According to the China Statistical Yearbook, data show that the population of China in 2015 was 1.375 billion from 2015 to 2019. The birth rate has been decreasing year by year starting in 2016, while the mortality rate has shown little variation each year, as shown in Figure 2.
Elderly population (EP): the trend of the total EP and its proportion in the TP according to the statistical data in the China Civil Affairs’ Statistical Yearbook are shown in Figure 3. In recent years, the proportion of the EP over the age of 60 in China has been rising year by year and the growth rate of EP has shown a trend of shock and climb, reaching 5.5% in 2016. With this growth in the EP, the demand for pension service resources is expected to further increase.
2.2. Subsystem of Aged Service Resource Demand
As the main body of demand for aged service resources is the elderly, the health status, economic status, and acceptance of aged services jointly determine the demand for aged service resources. Starting from the individual differences in the health status, economic status, and willingness to pay of the elderly, this section selects variables to construct the demand subsystem of aged service resources.
Disability Rate of Elderly Population (DREP): the elderly who can take care of themselves generally have less demand for elder care services. The demand for these services is mainly concentrated in the care of the disabled and semi-disabled elderly. Decline in the basic self-care ability of elderly persons is accompanied by degradation in independent living ability; in particular, severely disabled elderly people need all-around care in their daily life and basic actions, and the demand for aged services is high. Therefore, the number and development trend in the disabled EP determine the demand for aged service resources. According to the Research Report on Long-term Care in China 2018–2019, the DREP in 2019 was 11.8%, of which 4.8% were severely disabled and 7% moderately disabled.
Per Capita Pension Expenditure (PCPE): PCPE refers to the average amount that an elderly person is willing to spend for a service every year. Under the condition that the willingness of the user to pay remains unchanged, the price of the service is affected by the annual CPI, which increases with increasing PCDI. Therefore, the PCPE has a correlation with CPI. The amount of PCPE determines RPETP directly, and a higher RPETP means a higher cost of providing for the aged, which reduces the willingness of the aged to provide for themselves to a certain extent, thus affecting their demand for services. According to the Aged Service Demand in Urban China Report (2021) jointly released by the Aging Finance Branch of China Gerontology and Geriatrics Society, the PCPE of the elderly aged 60 and above was CNY 8300 in 2015.
The willingness of the elderly to provide for the elderly. Individual differences, such as educational background, financial situation, and consumption concepts, can lead to differences in the willingness of elderly persons to provide for the aged and to different demands for the aged service; that is, the elderly choose different ways of using services. Therefore, according to the different health levels of the elderly, this paper divides their willingness to provide for the aged into Willingness of Disabled Elderly Population to Pay (WDEPP) and Willingness of Non-Disabled Elderly Population to Pay (WNEPP). According to the different models of aged care chosen, the willingness of the elderly to provide for the aged are divided into Willingness of Elderly Population to participate in Pension Institutions (WEPPI) and Willingness of Elderly Population to participate in Pension Communities (WEPPC).
Willingness of Disabled Elderly Population to Pay (WDEPP): disabled elderly persons are not able to take care of themselves, either completely or partially, and there is therefore a great demand for care services. Although PCPE is significantly related to PCDI, elderly people with higher PCDI tend to pay more for aged services. However, even if RPETP is higher, there are those who are willing to pay for aged services. Therefore, the expected range of WNEPP was set to (0.6, 0.1), that is, when the RPETP is 0 (the aged service is free), 60% of NDDEP are willing to choose institutions or communities to obtain an aged service. This proportion mainly considers that people are willing to receive aged services at home even if the cost is very low. On the contrary, when the ratio of the average pension expenditure to PCDI is 1, 10% of NDDEP are willing to choose institutions or communities for the elderly. In particular, there are two main judgments contained in the assumption that WDEPP is maintained at around 10% when the above ratio is greater than 1. First, at the level of national policy regulation, it is assumed the state subsidizes services for the disabled elderly, as well as that the phenomenon in which RPETP exceeds 1 is relatively low and not common. Second, it is assumed that even if RPETP exceeds 1 there will be people who are willing or find it necessary to choose institutions or communities for aged services.
Based on the above analysis, WDEPP is inversely proportional to RPETP and their variation trend is in the shape of “S”. Their variation relationship is in line with the arctangent function, which can be expressed as
where is the compound function, with the arctangent function as its core.
It is key to consider the approaching speed of the arctangent function approaching the upper and lower limits. The designed function that meets the requirements can be expressed as follows:
where is the magnification coefficient, GWD, of approaching speed for the disabled elderly, refers to the maximum value of disabled elderly people’s willingness to pay for the aged service, and is the minimum value of disabled elderly people’s willingness to pay for the aged service.
The arithmetic logic in Equation (2) is mainly divided into three parts:
① The first part, , mainly limits the range of the arctangent function to (−1, 1), of which the value determines the approaching speed of the arctangent function.
② The second part, , mainly limits the range of the arctangent function to (−0.25, 0.25).
③ The third part, , mainly limits the range of the final function to (0.1, 0.6) in order to realize the fitting of the final function.
Further simplification of Equation (2) can obtain the following form:
Through calculation of the software programming, the variation rules between WDEPP and RPETP are shown in Figure 4 with different values of .
Combined with the actual situation and the simulation curve of WDEPP, it is expected that the change in WDEPP is the most sensitive when the change in RPETP fluctuates around 0.5. It can be seen from Figure 1 that when is taken as 1, RPETP and WDEPP an approximately follow linear variation rules, which is obviously not the best value. When is taken as 5 or 7, the change trend in WDEPP is too fast. Based on the variation rules of different trends, this chapter selects the value of as 3.
WNEPP: non-disabled elderly people are mostly able to take care of themselves and have little demand for aged services, and they generally choose home care. The WEPPI and WEPPC of non-disabled elderly people are closely related to their family financial situation The RPETP can be set as (0, 1), and the expected range of WNAPP is (0.06, 0.01). That is, when RPETP = 0 (services for the elderly are free), 6% of the non-disabled elderly are willing to choose WEPPI and WEPPC, because most elderly people prefer to live at home with their families, no matter how cheap aged services are. On the contrary, when the RPETP is 1 or greater than 1, the willingness of the elderly people who choose WEPPI and WEPPC is 1%, because there are elderly people who prefer to live their life in a pension institution or community.
Based on the above analysis, while WNEPP and RPETP are inversely proportional and their change rule is similar to WDEPP and RPETP, they have different value ranges. The function shown in Equation (3) can be fitted according to the above rules, which can be expressed as
where is the magnification coefficient, GWN, of approaching speed for the non-disabled elderly, refers to the maximum value of disabled elderly people’s willingness to pay for the aged service, and is the minimum value of disabled elderly people’s willingness to pay for the aged service.
Through calculation of software programming, the variation rules between WNAPP and RPETP with different values are shown in Figure 5 with the different value of .
It can be seen from Figure 2 that when is taken as 1, RPETP and WNEPP show an approximately linear variation law, which is obviously not the best value. When the value of is 5 or 7, WNEPP changes too fast. Based on the changing rules of different trends, 3 is selected the value of in this chapter, which is consistent with the rule of WDEPP.
2.3. Subsystem of Aged Service Resource Supply
The supply of aged service resources can be roughly divided into three aspects: human resources, financial resources, and material resources. Human resources include nursing staff and employees of various pension institutions. Financial resources include state financial expenditures on aged services, welfare for the elderly, and subsidies for pension institutions and pension communities. Material resources include various pension institutions and pension facilities. Considering the integrity of the model and the availability of data, the following elements of aged service resources were selected.
Total National Pension Expenditure (TNPE): according to the statistical data in the China Civil Affairs’ Statistical Yearbook, the initial value of this variable was CNY 27.08 billion in 2015.
Increase Rate of National Pension Expenditure (IRNPE): by analyzing the relationship of trend and average value of GDP growth rate and IRNPE in Table 1, it was found that they had similar trends; thus, IRNPE was set as equal to the GDP growth rate.
Average Numbers of beds in Pension Institutions (ANPI): ANPI represents the average number of elderly residents that the Number of Pension Institutions (NPI) can adopt. According to the calculation of ANPI in each year based on the relevant data in the China Civil Affairs Statistical Yearbook, it was found that the annual variation in this parameter shows little change; the ANPI was 128 from 2015 to 2019.
Average Numbers of elderly population served by Pension Community (ANPC): ANPC represents how many elderly people on average can be served by one pension community in one year. Pension Communities represent a way of providing for the aged that is being vigorously promoted by the country at present. Under this mode of providing for elderly people in communities, day care service standards for the aged can be met and services for the aged provided at home in communities. The number of Pension Communities (NPC) continues to grow. Based on statistical yearbook data, the average ANPC was set to 50.
The proportion of financial funds used in pension institutions and communities: starting in 2015, China has introduced intensive policies to promote the development of pension communities and home-based elder care services, and the development of community aged care service has been strongly supported. The proportion of financial funds for elderly care services to pension institutions and communities are called the Weight Factor of Pension Expenditure for Pension Institutions (WFPEPI) and Weight Factor of Pension Expenditure for Pension Community (WFPEPC), with their value set at 0.35 and 0.65, respectively.
Subsidies for the pension communities: the government invested heavily in the early stage of pension community development, and especially after 2015 the proportion of subsidies used for the construction of pension communities was large. As the number of pension communities increased year by year, the proportion of pension community construction gradually decreased, resulting in a decline in the overall subsidy intensity. Therefore, it is believed that while the total subsidy for pension communities decreased in the past five years, the operating subsidies of pension communities (OSPC) have increased. According to the local policy information for Beijing, Wuhan, Shenyang, Hefei, and Jinan, it was comprehensively judged that the average annual OSPC in all parts of China is CNY 200,000–250,000.
Subsidies for the pension institutions: the Operating Subsidies of Pension Institutions (OSPI) and Construction Subsidies of Pension Institutions (CSPI) are two main forms of subsidies. The proportion of construction subsidies is called the Weight factor of Beds construction Subsidies of Pension Institutions (WBSPI). Because of the large amount of subsidies for the construction in pension institutions, most of them are paid either in whole or in part at one time when building these institutions; thus, the value of WBSPI was set as 0.6. At present, most local governments in China have introduced relevant policies to subsidize pension institutions. The OSPI and OSPC are state variables related to Factor of OSPI and OSPC (FOO). As to the form taken by subsidies, there are one-time construction subsidies distributed by beds, operating subsidies distributed by the number of disabled elderly residents, operating subsidies distributed by the number of nursing beds, and more. In addition, due to the different subsidy standards in different provinces and cities, after collecting data and summaries of subsidy policies in various places, we have comprehensively judged that the average OSPI of the whole country is between CNY 200,000 and 250,000 annually.
Market Engagement of Pension Institutions (MEPI): MEPI represents the marketization level of aged services. A higher MEPI means more social investment, and consequently greater demand for aged service resources. According to the statistics released by the National Office for Ageing, the proportion of pension institutions run by social forces in China reached 41.5% in 2015, and it is expected to reach 50% in 2020. Based on these data, further calculations show that the average MEPI from 2015 to 2019 was 0.3.
Market Engagement of Pension Communities (MEPC): a pension community is mainly managed by the government, with little market capital input. With the development of the internet and digital technology, pension community services based on internet platforms are gradually emerging in the developed cities. As the participation of social capital is gradually increasing, we set the average MEPC from 2015 to 2019 as 0.1.
3. Causal Loops/Dynamic Hypothesis
The goal of aged service resource allocation is to meet demand as far as possible through the supply of services in a way that achieves a balance between supply and demand. At present, the problem of the supply and demand of aged service resources is often solved from a single perspective. Therefore, it is necessary to build a system dynamics model with a clear structure and an appropriate scale in order to reflect the supply and demand of aged service resources while fully considering all of the various realities. Through the simulation of the model, current problems in the endowment of supply and demand can be found, providing a theoretical basis on which the government can set policy in a way that promotes efficient allocation of resources.
3.1. System Boundary
The allocation of aged service resources is based on the allocation of supply to demand, and its allocation process is affected by policy, economy, population, and other aspects. Therefore, the aged service resource allocation system constructed in this paper includes the aged service resource demand subsystem, aged service resource supply subsystem, and population and economy subsystem, and sets the geographical boundary and time boundary.
Geographically, the research object of this paper is the domestic aged service resource allocation system, which reflects the situation of aged service resource allocation through the ratio of supply and demand of aged service resource allocation. The paper mainly refers to China, and occasionally Hong Kong, Macao, and Taiwan.
As for the time boundary, through our analysis of historical data in the China Civil Affairs’ Statistical Yearbook, we found that the accounting methods of several statistical items changed after 2015, leading to missing data before 2015. Therefore, the system dynamics model of this paper selects the data from 2015 to 2019 as historical data for comparison with the system simulation data for discussion of the current situation of China’s aged service resource allocation.
3.2. Variable Definition
In order to determine the equation relationship of each variable in the follow research and facilitate the expression of simulation analysis in system, the variables of each subsystem mentioned above are defined. The variable name definitions and corresponding abbreviations are provided in Appendix A, Table A1.
The variables in the three tables shown in Appendix A have different attributes: the system state variables represent the model state, the system output variables represent the output of the model, the system input variables represent the input of the model, the auxiliary variables are used to help check the accuracy of the system or represent the key factors of the system, and the parameter variables determine the accuracy of the model.
3.3. Dynamic Hypothesis
The model assumes that in a single year a single elderly person chooses only one of the following three pension modes: home care, pension institution, or pension community care. Those who choose aged care services provided by the community no longer choose institutional aged care services. Although in reality these choices can be converted to each other, because of the overlap of community and home aged care services it is difficult to distinguish the needs of the elderly. Therefore, in order to simplify the model it assumes that there is no difference between the needs of community care and home-based care residents. The state financial input to pension service resources only includes the input to pension institutions and pension communities. The final output variable is the ratio of supply and demand of community aged care service resources.
This model assumes that the primary expenditure of national finances on aged care service resources is that the government uses financial funds to build pension facilities to provide services or that the government funds the purchase of services for the elderly. This variable is based on the data collected in the Chinese Civil Affairs Statistical Yearbook, and the data not included in the yearbook are not considered in this model. In addition, there are many aged care service facilities invested in by social capital to provide pension services for the elderly; therefore, the model includes the participation of social capital in pension service resources. The investment amount of these two kinds of capital in aged care service resources is affected by economic development, and better economic development leads to a higher supply level of aged care service resources.
The model assumes that the total national expenditure on the aged includes civil capital investment, capital investment in the national budget, and investment in the welfare of the elderly, which contains nursing subsidies, pension service subsidies, and comprehensive subsidies. Similarly, this variable uses the data already collected in the Chinese Civil Affairs Statistics Yearbook; the welfare of the elderly is not included in the yearbook is not considered in the model. The model assumes that the subsidies are directly allocated to pension institutions and pension community accounts, and can only be used for pension services.
A causal loop diagram (CLD) uses causality relationships and feedback loops to provide a general structure of a problem to be examined. A CLD is a qualitative method designed to capture the causes of dynamic hypotheses in order to help policy and decision-makers understand a problem’s complexity by interpreting the feedback loops. A causal diagram consists of key variables linked by arrows indicating the causal influences. Each link (arrow) connects two variables, an independent variable (at the tail of the arrow) and a dependent variable (at its head). A polarity (‘+’ or ‘−’) is assigned to each link, denoting the influence of the independent variable on the dependent variable; these polarities describe the structure of the system, not the behaviours of the variables.
A causal loop diagram (CLD) is a qualitative method that uses causality relationships and feedback loops to explain the general structure of a problem. It is a qualitative approach consisting of key variables, with arrows indicating causal effects, that helps policy- and decision-makers understand the complexity of a problem by explaining feedback loops. Each link connects two variables, an independent variable and a dependent variable at its head. The direction indicated by the arrow represents the direction in which the cause acts on the effect, and the “+” or “−” sign next to the arrow indicates whether the cause acts on the effect in a positive or a negative way.
The reasons for the change in population size and economic growth are complex. From systems perspective, identifying the problem structure is quite complex. It is necessary to take a holistic and systematic view to analyze the changes in demand for elderly care services. Figure 6 depicts the causal relationship between the change in population size and economic level.
Low birth rate has a positive influence on the number of births and the total population. It causes a decrease in the number of births, and thus affects the increase of the total population. The low birth rate and the change in population structure reduce the demographic dividend. On the one hand, this may slow down economic development speed to an extent. On the other hand, increasing the dependency ratio of the population may reduce the purchasing intention with respect to pension services. The decline in the proportion of the birth population in the total population changes the demographic structure, resulting in the continuous increase of the elderly population. The increase in GDP increases per capita disposable income and enhances the willingness of the elderly to purchase aged care services.
The increase in the elderly population leads to an increase in the demand for pension service resources; the causal relationship between the change in the demand for pension service resources is shown in Figure 7. As the disabled elderly have a higher demand for pension services, the model divides the elderly into disabled elderly and non-disabled elderly in order to calculate their different needs. According to the previous hypothesis, the elderly choose aged care services provided by institutions or the community; thus, the service needs of the elderly are divided into institutional and community aged care service needs. In addition, the demand for elderly care services is mainly affected by their willingness to consume, which increases with improvements in the economic level. At present, the economic conditions of the elderly in China are generally poor, and there are many low-income people, which limits their purchasing intention with respect to elder services.
The supply of aged care services in the model includes financial and material resources. Figure 8 describes the causal relationships in the supply of aged care services. On the one hand, improvements in the economic level can promote the expenditure of state finances on aged care services. On the other hand, it can stimulate the investment of social capital in aged care services. Financial input has increased the construction of aged care service facilities. Therefore, the number of community aged care service centers and institutions and the number of beds and subsidies have increased, promoting the supply of aged care service resources. The supply of aged care service resources is closely related to the elderly population. Due to the low income level of the elderly in China they are highly dependent on the service subsidies provided by the government, which may reduce market participation to a certain extent.
Combining Figure 7 with Figure 8, we can find the overall causality diagram of the aged service resource allocation system, as shown in Figure 9. The variables of the population subsystem simultaneously affect both the demand and supply of aged care services. The model mainly studies the impact of dynamic changes in these variables on the supply–demand ratio of institutional endowment, the supply–demand ratio of community endowment, and the supply–demand balance ratio of total endowment. According to the causality in Figure 9 build mathematical model and the relevant formula see Appendix B. The three variables are important variables for measuring the allocation status of pension service resources. The current allocation level of pension service resources can be obtained according to the model simulation, which provides a basis for further optimization measures.
4. Simulation
4.1. Initial Parameter Values and Variable States
The initial values of the simulation model parameters were set based on the analysis discussed in Section 3.2, in which all state variables have non-zero initial values and the input variable is time. The specific initial value table of the variables and parameters is shown in Table 2.
4.2. Model Validation
Prior to the simulation analysis of the endowment service resource allocation system, the modeling accuracy was first verified. After comparing the deviations between the simulation data of various variables in the mathematical model built in this paper and the actual data in the official statistics, the deviation rate between the simulation data and the actual data can be found. If it is within a certain acceptable range, the mathematical model built in this chapter can be considered to represent the allocation of pension service resources over the most recent five years.
According to the principle of data availability, six variables were selected for comparison with the actual data. The comparison results are shown in Figure 10; Origin was selected as the graphics processing software.
Figure 10 shows the comparison between the simulation values and the actual values of the different variables in the simulation model in Table 3 (S.R. is short for simulation results, and A.R. is short for actual results).
In order to quantitatively analyze the deviation between the simulation value and the actual value of each variable in the figure above, and thus represent the accuracy of simulation model, this section adopts the following two performance indicators.
(1) Relative deviation rate:
The relative deviation rate can represent the maximum absolute value of the ratio of the deviation between the simulation value and the actual value to the actual value; the specific equation is as follows:
where is the relative deviation rate, is the simulation value of simulation model, and is the actual value.
(2) Average deviation rate:
The average deviation rate can represent the average value of the absolute value of the ratio of the deviation between the simulation value and the actual value; the equation is as follows:
where is the average deviation rate.
According to Equations (5) and (6), the relative deviation rate and average deviation rate of five auxiliary or state variables can be calculated, respectively, as shown in Table 3.
Qualitatively, during the five years from 2015 to 2019 the change trend of the simulation values of the above six variables is completely consistent with the change trend of the actual values, showing an upward trend with the increase in year. Among them, the deviation between the simulation values and the actual values of EP, PCDI, and TNPE is the smallest. The actual values of the NPI, NSPI, and NPC have disordered changes in several years, resulting in a relatively large deviation between the simulation values and the actual values in these years; however, the trend is basically consistent.
Quantitatively, during 2015 to 2019, the maximum relative deviation rate of the simulation value and actual value for the worst-fitting variable among the above six variables is 7.96%, while the maximum relative deviation rate of the simulation value and actual value of the best-fitting variable is only 2.45%. The average deviation rate of the worst-fitting variable is 5.15%, while that of the best-fitting variable is only 0.64%. Specifically, the overall fitting accuracy of EP is the highest, with a maximum deviation of only 2.45% and average deviation rate of 0.64%. The fitting accuracy of the NPC is relatively poor, with a relative deviation rate of 7.36% and an average deviation rate of 3.85%. The relative deviations of the above six variables are all less than 8%; thus, the model accuracy is considered acceptable.
Qualitative and quantitative analysis results show that the model established in this chapter approximately represented the allocation of service resources for the aged in China from 2015 to 2019. In the next section, the simulation results of other important variables concerning service resources allocation for the aged, including output variables, auxiliary variables, and state variables, are analyzed.
5. Results Discussion
The three output variables in the system and several important auxiliary/state variables in each subsystem were grouped, as shown in Table 4. Further simulation analysis and comparative analysis were conducted to obtain the variation trends of each variable.
(1) Group ①
The variable simulation results of Group ① are shown in the Figure 11. The EP of the simulation value and the actual initial value, 222 million people in 2015, increased to 260 million and 254 million, respectively, in 2019, a growth rate of 17.1% and 9.9%, respectively. While the elderly population of China is growing, the overall aged service aggregate demand has increased gradually. With the development of society and economic growth, PCDI is increasing. The simulation value and actual value of PCDI were CNY 21,700 and 22,200 in 2015, respectively, and increased to CNY 31,100 yuan and 30,700 in 2019, respectively, a respective increase of 43.3% and 39.5%. As for PCDI, the simulation value and actual value of TNPE were CNY 27.08 billion in 2015, and increased to CNY 39.598 billion and 40.044 billion in 2019, respectively, with respective growth rates of 46.2% and 47.9%. With the increase in both the elderly population and social development and economic growth, financial expenditures on the elderly are rising.
(2) Groups ② and ③
In the above group, the simulation values of the two variables involved in consumption, namely, willingness to pay and demand for services, are shown in Figure 11 and Figure 12.
As can be seen in Figure 11, with the increase in related variables such as EP and PCDI, the WDEPP and WNEPP have slightly increased year by year. In 2015, the WDEPP and WNEPP are 46.6% and 4.7%, respectively, and increase to 52.8% and 5.3% in 2019, each with a growth rate of 13.3%. This indicates that with the increase in the number of EP, PCDI, and other related variables, more elderly people have the economic ability to afford pension expenses, and their willingness to provide for the elderly is increasing.
As can be seen from Figure 12, both the aged service demand of elderly with disabilities and healthy elderly increased; NDDEP and NDNEP were 12.221 million and 9.135 million, respectively. However, in 2019 they increased to 16.237 million and 12.137 million, respectively, both increasing by 32.8%. The demand is huge and is growing rapidly.
(3) Group ④
The two auxiliary variables involved in Group ④ are concern society more broadly. The simulation and actual values of NPI and NPC from 2015 to 2019 are shown in Figure 12.
From Figure 13, the NPI and the NPC in China increased with time during the period from 2015 to 2019. Taking the actual value as an example, the NPI and NPC were 25,000 and 88,100, respectively, in 2015, and they increased to 34,400 and 169,200, respectively, in 2019, with respective growth rates of 37.6% and 92.1%. The growth rates of the simulation values were 35.1% and 84.6%, respectively, with growth rate of NPC far greater than that of NPI.
(4) Groups ⑤ and ⑥
The simulation values of the two variables involved in the demand and supply of pension communities for the aged in Groups ⑤ and ⑥ are shown in Figure 13 and Figure 14.
As can be seen from Figure 14, the NSPI and NSPC increased to 3.192 million and 4.651 million, respectively, in 2015, and increased to 4.312 million and 8.587 million, respectively, in 2019. The respective growth rates of NPI and NPC are 35.1% and 84.6%, which shows state subsidies and other policy supports made available for pension communities in recent years can be expected to gradually improve the supply–demand ratio of pension communities. In addition, the growth rate of NPI is close to that of AP elderly pension demand, and the supply–demand ratio for institutional pensions can be expected to change little.
In Figure 15, NDPI and NDPC were 6.4070 million and 14.950 million, respectively, in 2015, and increased to 8.512 million and 19.862 million, respectively, in 2019, with each having a growth rate of 32.9%. The above values show, first, that the growth rate in both the supply of and demand for pension institutions has been very similar over the past five years, and the supply–demand ratio is expected to change little. However, the growth rate of the supply of pension communities over the past five years is much higher than that of the demand, and the supply–demand ratio of pension community is expected to improve gradually. Second, when compared with institutional endowments there are more people demanding pension communities. Although the supply of this service has increased greatly in recent years, the demand remains far greater than the supply from the perspective of the supply of and demand for this service.
(5) Groups ⑦ and ⑧
The simulation values of the two variables involved in the total number of supply and demand for the aged in Group ⑦ are shown in Figure 16. The simulation values of the three output variables designed to illustrate the change in supply–demand ratio in Group ⑧ are shown in Figure 17.
As can be seen from Figure 16, the TNS and TND were 7.843 million and 21.356 million, respectively, in 2015, and increased to 12.898 million and 28.374 million, respectively, in 2019, with respective growth rates of 64.5% and 32.9%. This indicates that while in recent years the supply and demand situation of the service resource allocation system for aged services has improved, the demand remains far greater than the supply, the situation of supply and demand needs to be further improved, and both policy support on the part of the nation and fund increments from communities need to be sustained.
As can be seen from Figure 17, among the three most important output variables in the service resources allocation system for aged services, the TRSD, RSDPI, and RSDPC, the RSDPI remained basically unchanged, with an increase of only 1.6% in 2015 and 2019. RSDPC increased with time, reaching 0.311 and 0.432 in 2015 and 2019, respectively, with an increase of 38.9%; TRSD increased year by year due to the increase of RSDPC, which was 0.367 in 2015 and 0.456 in 2019, an increase of 24.3%.
The supply–demand ratio characterized by these three output variables leads to three conclusions: First, the institutional supply–demand situation of service resources allocation for aged services in China has remained generally stable in recent years, the pension community supply–demand situation is gradually improving, and the overall supply–demand situation is gradually improving. However, in 2019 the TRSD was only 0.456, and the improvement of service resources allocation of services for the aged continues to face enormous challenges. Second, the supply–demand ratio of institutional pensions only fluctuates around 0.5, and there is a large gap from the balance of supply and demand; thus, it is urgent for the state to formulate relevant stimulus policies in order to break this situation. Third, although the supply–demand ratio of pension communities is gradually improving, it was only 0.432 in 2019, indicating a serious mismatch between supply and demand which is in urgent need of improvement.
According to the above analysis, the supply of aged care service resources can be improved in terms of the health level of the elderly, market participation, and state financial investment in pension service resources in order to improve the supply–demand balance ratio of aged care service resources. Market engagement is related to the demand in the existing market. When market demand is large, the enthusiasm for market participation becomes correspondingly high. On the contrary, when market supply is saturated, the enthusiasm for market participation decreases with market demand. The state should refer to the supply–demand ratio data available on institutional and community service resources to regulate the total fiscal expenditure according to the demand when determining fiscal expenditures, allocating the appropriate proportions of community and institutional support. When the ratio of supply and demand to the elderly is far from the expected value, financial support should be improved. When the ratio of supply and demand to the elderly in institutions is close to or exceeds the expected value, relevant policies should be maintained or tightened in order to promote stable or reduced participation in the market.
6. Conclusions
The aged care service resource allocation system is an extremely complex and important system, with many influencing factors and complex relationships among them. This paper has realized the simulation of the allocation process based on the establishment of the main structure and logical relationship of the pension service resource allocation system. The state space method was used to construct a dynamic model of the supply and demand system of service resources endowment. According to the establishment of the mathematical model for simulation, we simulated six state or auxiliary variables for which actual data could be found. The verification results show that the relative deviation rate of the six variables is less than 10%, which means the model conforms to the verification. In addition, the changes of eight output or auxiliary variables in the five years from 2015 to 2019 were simulated and analyzed, and the changing rules of each variable were revealed. The simulation results show that before 2019, the supply and demand of China’s aged care services were unbalanced. Although the supply and demand ratio has been gradually improving, the total supply and demand ratio was only 0.432 in 2019, and improvement in the supply and demand situation remains a very urgent priority.
Unlike previous studies that only focused on evaluation or influencing factors and degree of service resources endowment, this paper used the matching degrees of supply and demand to measure the allocation of aged care service resources. Our simulation analysis of the process of aged care service resource allocation was conducted using the system dynamics method; the influence factors of aged care service resource allocation in China were analyzed from the perspective of the system, providing a theoretical basis for measures to optimize resource allocation.
There are three aspects of this study that can be considered to be both limitations and suggested opportunities for future research channels. The first limitation is that the investment of national finance and social capital in aged care service resources is the main determinant. However, in reality more capital investment does not always mean that more or better facilities can be built. The second limitation is that the model assumes the health level of the elderly as a constant value without considering changes in the demand for aged care service resources caused by changes in the health level of elderly individuals over time. In fact, the health level of the elderly is a dynamically changing variable,. Third, human resources are a major part of aged care service resources; however, due to the difficulty of data collection, it can only be considered that human resources are highly correlated with financial resources, and a better supply of financial resources leads to a better supply of human resources. The direction of further research in the future is a further modification of the logical relationship and functional relationship of the model. In addition, it is necessary to further refine the influencing factors and debug the model in order to bring the model as close to the real system as possible.
Author Contributions
Data curation, methodology, writing of original draft Y.Z.; validation, M.Z. and H.H.; investigation, M.Z., H.H. and X.H.; funding acquisition, X.H. All authors have read and agreed to the published version of the manuscript.
Funding
This research was funded by [the Soft Science Research Project of the Innovation Competence Enhancement Plan of Hebei Province] grant number [21556105D]; [Hebei Province Graduate Innovation Funding Project], grant number [CXZZBS2021120]; [the 2021 Hebei Province Social Science Development Research Project], grant number [20210101027]. And the APC was funded by [Hebei Province Graduate Innovation Funding Project].
Institutional Review Board Statement
Not applicable.
Informed Consent Statement
Not applicable.
Data Availability Statement
Not applicable.
Conflicts of Interest
The authors declare no conflict of interest.
Appendix A

Table A1.
Variables and abbreviations used in the population and economic subsystem.
| Number | Variable | Abbreviation | Attributes |
|---|---|---|---|
| 1 | Total Population | TP | State variable |
| 2 | Increase of Total Population | ITP | Auxiliary variable |
| 3 | Born Population | BP | Auxiliary variable |
| 4 | Death Population | DP | Auxiliary variable |
| 5 | Birth Rate | BR | Parameter variable |
| 6 | Death Rate | DR | Parameter variable |
| 7 | Gross Domestic Product | GDP | State variable |
| 8 | GDP Growth | GDPG | Auxiliary variable |
| 9 | GDP Growth Rate | GDPGR | Parameter variable |
| 10 | Per Capita GDP | PCGDP | Auxiliary variable |
| 11 | Per Capita Disposable Income | PCDI | Auxiliary variable |
| 12 | Factor of Per Capita Disposable Income | FPCDI | Parameter variable |
Table A2.
Variables and abbreviations used in the pension demand subsystem.
| Number | Variable | Abbreviation | Attributes |
|---|---|---|---|
| 1 | Elderly Population | EP | State variable |
| 2 | Elderly Population Increase | EPI | Auxiliary variable |
| 3 | Rate of Increase in Elderly Population | RIEP | Parameter variable |
| 4 | Per Capita Pension Expenditure | PCPE | State variable |
| 5 | Per Capita Pension Expenditure Increase | PCPEI | Auxiliary variable |
| 6 | Willingness of Disabled Elderly Population to Pay | WDEPP | Auxiliary variable |
| 7 | Max Willingness of Disabled Elderly Population to pay | MaxWD | Auxiliary variable |
| 8 | Min Willingness of Disabled Elderly Population to pay | MinWD | Parameter variable |
| 9 | Gain of Willingness of Disabled Elderly Population to pay | GWD | Auxiliary variable |
| 10 | Numbers of Demand of Disabled Elderly Population | NDDEP | Auxiliary variable |
| 11 | Willingness of Non-disabled Elderly Population to Pay | WNEPP | Auxiliary variable |
| 12 | Max Willingness of Non-disabled Elderly Population to pay | MaxWN | Parameter variable |
| 13 | Min Willingness of Non-disabled Elderly Population to pay | MinWN | Parameter variable |
| 14 | Gain of Willingness of Non-disabled Elderly Population to pay | GWN | Parameter variable |
| 15 | Numbers of Demand of the Non-disabled Elderly Population | NDNEP | Auxiliary variable |
| 16 | Ratio of Pension Expenditure To Per capita disposable income | RPETP | Auxiliary variable |
| 17 | Average of CPI | ACPI | Parameter variable |
| 18 | Disability Rate of Elderly Population | DREP | Parameter variable |
| 19 | Willingness of Elderly Population to participate in Pension Institutions | WAPPI | Auxiliary variable |
| 20 | Numbers of Demand of the Elderly Population to participate in Pension Institutions | NDPI | Auxiliary variable |
| 21 | Willingness of Elderly Population to participate in Pension Community | WEPPC | Auxiliary variable |
| 22 | Numbers of Demand of Elderly Population to participate in Pension Community | NDPC | Auxiliary variable |
| 23 | Total Numbers of Demand of Elderly Population to participate in both pension communities and pension institutions | TND | Auxiliary variable |
Table A3.
Variables and abbreviations used in the pension supply subsystem.
| Number | Variable | Abbreviation | Attributes |
|---|---|---|---|
| 1 | Total National Pension Expenditure | TNPE | State variable |
| 2 | Increase of National Pension Expenditure | INPE | Auxiliary variable |
| 3 | Increase Rate of National Pension Expenditure | IRNPE | Parameter variable |
| 4 | Total Pension Expenditure of Pension Institutions | TPEPI | Auxiliary variable |
| 5 | Total Pension Expenditure of Pension Communities | TPEPC | Auxiliary variable |
| 6 | Market Engagement of Pension Institutions | MEPI | Parameter variable |
| 7 | Weight Factor of Pension Expenditure for Pension Institutions | WFPEPI | Parameter variable |
| 8 | Market Engagement of Pension Communities | MEPC | Parameter variable |
| 9 | Weight Factor of Pension Expenditure for Pension Communities | WFPEPC | Parameter variable |
| 10 | Numbers of Pension Institutions | NPI | Auxiliary variable |
| 11 | Operating Subsidies of Pension Institutions | OSPI | State variable |
| 12 | Weight factor of Beds construction Subsidies of Pension Institutions | WBSPI | Parameter variable |
| 13 | Average Numbers of beds in Pension Institutions | ANPI | Parameter variable |
| 14 | Numbers of Supply of Elderly Population provided by Pension Institutions | NSPI | Auxiliary variable |
| 15 | Numbers of Pension Communities | NPC | Auxiliary variable |
| 16 | Operating Subsidies of Pension Communities | OSPC | State variable |
| 17 | Average Numbers of Elderly Population served by Pension Community | ANPC | Parameter variable |
| 18 | Numbers of Supply of Elderly Population provided by Pension Communities | NSPC | Auxiliary variable |
| 19 | Factor of OSPI and OSPC | FOO | Parameter variable |
| 20 | Total Numbers of Supply of Elderly Population provided by both pension institutions and pension community | TNS | Auxiliary variable |
| 21 | Total Ratio between Supply and Demand | TRSD | Output variable |
| 22 | Ratio between Supply and Demand of Pension Institutions | RSDPI | Output variable |
| 23 | Ratio between Supply and Demand of Pension Communities | RSDPC | Output variable |
Appendix B
Appendix B.1. State Space Variable Definition
State space is a mathematical model representation method which is widely used in mathematical modeling of all kinds of things that can be represented by differential equation. In this paper, the state space method is used to build the dynamic model of China’s aged service resource allocation system.
The general expression of state space in a system is
where A is the order parameter matrix, B is the order parameter matrix, C is the order parameter matrix, D is the order parameter matrix, is the dimension state variable, is the dimension input variable, is the r dimension parameter variable, y is the dimension output variable, and t represents time.
Combining the expression of state space in Equation (A1) and the division of variables in state space of the system in Appendix A, the state variable matrix, input variable matrix, parameter variable matrix, and output variable matrix in state space can be expressed as
In Equation (A2), each state variable can be expressed as
In Equation (A3), each input variable can be expressed as
In Equation (A4), each parameter variable can be expressed as
In Equation (A5), each output variable can be expressed as
Appendix B.2. Mathematical Model of State Equation
The state space of Equation (A1) can be divided into two parts. In combination with the mathematical model, logical relationship among variables, and Equations (A2) and (A3), the equation of state can be expressed as
Equation (A6) is the system state equation, and its representation should be expressed with the standard form shown in Equation (A1); thus, all auxiliary variables should be represented by input variables, parameter variables, and state variables.
In the second line of Equation (A6), BP is an auxiliary variable which can be expressed as
In the second line of Equation (A6), DP is an auxiliary variable which can be expressed as
In the third line of Equation (A6), GGDP is an auxiliary variable which can be expressed as
In the fourth line of Equation (A6), INPE is an auxiliary variable which can be expressed as
In Equation (A10), IRNPE is an auxiliary variable which can be expressed as
Substituting Equations (A8) and (A11) into Equation (A6), the system state equation can be expressed in the following standard form:
Equation (A12) shows that the state equation of the system is not complicated, and it can be judged that the main complexity of the system lies in the output equation. In the next section, the mathematical model of the system output equation is built.
Appendix B.3. Mathematical Model of Output Equation
Combining the mathematical model, logical relationship among variables, and Equations (A2)–(A5), the state equation can be expressed as
Consistent with the treatment of state Equation (A10), write the output equation of Equation (A13) in standard form, where all auxiliary variables can only be represented by parameter variables and state variables.
TND in Equation (A13) can be expressed as
In Equation (A14), NDPI is an auxiliary variable which can be expressed as
In Equation (A15), NDNEP is an auxiliary variable which can be expressed as
In Equation (A16), WNEPP is an auxiliary variable according to Equation (A4) in Section 3.2, and can be expressed as
In Equation (A17), RPETP is an auxiliary variable which can be expressed as
In Equation (A18), PCDI is an auxiliary variable which can be expressed as
In Equation (A19), PCGDP is an auxiliary variable which can be expressed as
In Equation (A20), NDDAP is an auxiliary variable which can be expressed as
In Equation (A21), WDEPP is an auxiliary variable according to Equation (A1), and can be expressed as
Substituting Equations (A19)–(A25) into Equation (A18), the NDPI can be expressed as
In Equation (A22), NDPC is an auxiliary variable which can be expressed as
Substituting Equations (A19)–(A25) into Equation (A27), the NDPC can be expressed as
Substituting Equations (A23) and (A26) into Equation (A14), TND can be expressed as
In Equation (A12), TNS can be expressed as
In Equation (A27), NSPI is an auxiliary variable which can be expressed as
In Equation (A28), NPI is an auxiliary variable which can be expressed as
In Equation (A29), TPEPI is an auxiliary variable which can be expressed as
Substituting Equations (A29) and (A30) into Equation (A28), NSPI can be expressed as
In Equation (A27), NSPC is an auxiliary variable which can be expressed as
In Equation (A32), NPC is an auxiliary variable which can be expressed as
In Equation (A33), TPEPC is an auxiliary variable which can be expressed as
Substituting Equations (A33) and (A34) into Equation (A35), NSPC can be expressed as
Substituting Equations (A31) and (A35) into Equation (A27), TNS can be expressed as
The first line of Equation (A29) can be calculated by substituting Equations (A26) and (A26) into Equation (A12). The second line of Equation (A12) can be calculated by substituting Equations (A23) and (A31) into Equation (A12). The third line of Equation (A12) can be calculated by substituting Equations (A25) and (A35) into Equation (A12). Then, the standard expression of Equation (A16) can be expressed as
References
- Pond, A.M. Environmental health and the Elderly Population. Am. J. Public Health Nations Health 1950, 40, 27–33. [Google Scholar] [CrossRef] [Green Version]
- Sinestrari, E. Non-linear age-dependent population growth. J. Math. Biol. 1980, 9, 331–345. [Google Scholar] [CrossRef]
- Mico, J.C.; Soler, D.; Caselles, A. Age-Structured Human Population Dynamics. J. Math. Sociol. 2006, 30, 1–31. [Google Scholar] [CrossRef]
- Colchero, F.; Jones, O.R.; Conde, D.A.; Hodgson, D.; Zajitschek, F.; Schmidt, B.R.; Malo, A.F.; Alberts, S.C.; Becker, P.H.; Bouwhuis, S.; et al. The diversity of population responses to environmental change. Ecol. Lett. 2019, 22, 342–353. [Google Scholar] [CrossRef] [Green Version]
- Canudas, R.V.; Shen, T.; Payne, C.F. The Components of Change in Population Growth Rates. Demography 2022, 59, 417–431. [Google Scholar] [CrossRef]
- Yang, S.; Jiang, Q.; Sánchez-Barricarte, J.J. China’s fertility change: An analysis with multiple measures. Popul. Health Metr. 2022, 20, 12. [Google Scholar] [CrossRef]
- Han, Y.; Shen, T. Long-Term Care Insurance Pilot Programme in China: Policy Evaluation and Optimization Options-Taking the Pilot Programme in the Northeast of China as an Example. Int. J. Environ. Res. Public Health 2022, 19, 4298. [Google Scholar] [CrossRef]
- George, L.K.; Fillenbaum, G.G. OARS Methodology. J. Am. Geriatr. Soc. 1985, 33, 607–615. [Google Scholar] [CrossRef]
- Alders, P.; Schut, F.T. Trends in ageing and ageing-in-place and the future market for institutional care: Scenarios and policy implications. Health Econ. Policy Law 2019, 14, 82–100. [Google Scholar] [CrossRef] [Green Version]
- Haimi, M.; Gesser, E.A. Application and implementation of telehealth services designed for the elderly population during the COVID-19 pandemic: A systematic review. Health Inform. J. 2022, 28. [Google Scholar] [CrossRef]
- Tatsuya, N. Quantitative Properties of the Macro Supply and Demand Structure for Care Facilities for Elderly in Japan. Int. J. Environ. Res. Public Health 2017, 14, 1489. [Google Scholar]
- Reitinger, E.; Schuchter, P.; Heimerl, K.; Wegleitner, K. Palliative care culture in nursing homes: The relatives’ perspective. J. Res. Nurs. 2018, 23, 239–251. [Google Scholar] [PubMed]
- Kuo, C.L.; Wang, S.Y.; Tsai, C.H.; Pan, Y.F.; Chuang, Y.H. Nurses’ perceptions regarding providing psychological care for older residents in long-term care facilities: A qualitative study. Int. J. Older People Nurs. 2019, 14, 122–142. [Google Scholar] [CrossRef] [PubMed]
- Laura, W.M.; Paul, B.; Chris, M.; Ngaire, K. Met and unmet need for personal assistance among community-dwelling New Zealanders 75 years and over. Health Soc. Care Community 2014, 22, 317–327. [Google Scholar]
- Walsh, K.; Callan, A. Perceptions, Preferences, and Acceptance of Information and Communication Technologies in Older-Adult Community Care Settings in Ireland: A Case-Study and Ranked-Care Program Analysis. Ageing Int. 2011, 36, 102–122. [Google Scholar] [CrossRef] [Green Version]
- Menzies, L. Integrating housing into the whole system of care for older people. J. Integr. Care 2015, 21, 178–187. [Google Scholar]
- Aboagye, E.; Agyemang, O.S.; Tjerbo, T. Elderly Demand for Family-based Care and Support: Evidence from a Social Intervention Strategy. Glob. J. Health Sci. 2014, 6, 94–104. [Google Scholar] [CrossRef] [Green Version]
- Gomi, I.; Fukushima, H.; Shiraki, M.; Miwa, Y.; Ando, T.; Takai, K.; Moriwaki, H. Relationship between serum albumin level and aging in community-dwelling self-supported elderly population. J. Nutr. Sci. Vitaminol. 2007, 53, 37. [Google Scholar] [CrossRef] [Green Version]
- Valkila, N.; Saari, A. The productivity impact of the voice link between elderly and nurses: An assisted living facility pilot. Arch. Gerontol. Geriatr. 2011, 52, 44–49. [Google Scholar] [CrossRef]
- Tsukada, N. A study of japanese nursing homes that hired nursing care worker candidates from indonesia and the philippines based on economic partnership agreement (EPA). Gerontologist 2011, 51, 502. [Google Scholar]
- Hughes, N.; McDonald, J.; Barrett, B.; Parfrey, P. Planning the restructuring of long-term care: The demand, need and provision of institutional long-term care beds in Newfoundland and Labrador. Healthc. Manag. Forum 2008, 21, 6–13. [Google Scholar] [CrossRef] [Green Version]
- Barron, D.N.; West, E. The quasi-market for adult residential care in the UK: Do for-profit, not-for-profit or public sector residential care and nursing homes provide better quality care. Soc. Sci. Med. 2017, 179, 137–146. [Google Scholar] [CrossRef] [PubMed]
- Farid, M.; Purdy, N.; Neumann, W.P. Using System Dynamics Modelling to Show the Effect of Nurse Workload on Nurses’ Health and Quality of Care. Ergonomics 2019, 63, 952–964. [Google Scholar] [CrossRef] [PubMed]
- Uppal, A.; Silvestri, D.M.; Siegler, M.; Natsui, S.; Boudourakis, L.; Salway, R.J.; Parikh, M.; Agoritsas, K.; Cho, H.J.; Gulati, R.; et al. Critical Care and Emergency Department Response at The Epicenter of the COVID-19 Pandemic. Health Aff. 2020, 39, 1443–1449. [Google Scholar] [CrossRef]
- Zhang, X.; Zhou, L.; Antwi, H.A. The impact of China’s latest population policy changes on maternity insurance—A case study in Jiangsu Province. Int. J. Health Plan. Manag. 2019, 34, 617–633. [Google Scholar] [CrossRef] [Green Version]
- Kianmehr, H.; Sabounchi, N.S.; Sabounchi, S.S.; Cosler, L.E. A system dynamics model of infection risk, expectations, and perceptions on antibiotic prescribing in the United States. J. Eval. Clin. Pract. 2019, 26, 1054–1064. [Google Scholar] [CrossRef]
- Giulia, S.; Sarah, M.; Astrid, M.; Babic, S.; Shin, S. Pre-service language teacher wellbeing as a complex dynamic system. Syetem 2021, 103, 102642. [Google Scholar]
- Horsch, A.; Khoshsima, D. Towards modeling and simulation of integrated social and health care services for elderly. Stud. Health Technol. Inform. 2007, 129, 38–42. [Google Scholar]
- Ansah, J.P.; Koh, V.; Chiu, C.T.; Chei, C.L.; Zeng, Y.; Yin, Z.X.; Shi, X.M.; Matchar, D.B. Projecting the Number of Elderly with Cognitive Impairment in China Using a Multi-State Dynamic Population Model. Syst. Dyn. Rev. 2018, 22, 89–111. [Google Scholar] [CrossRef]
- Ansah, J.P.; Matchar, D.B.; Malhotra, R.; Love, S.R.; Liu, C.; Do, Y. Projecting the effects of long-term care policy on the labor market participation of primary informal family caregivers of elderly with disability: Insights from a dynamic simulation model. BMC Geriatr. 2016, 16, 69. [Google Scholar] [CrossRef] [Green Version]
Figure 1.
Growth trend of Per Capita GDP and Per Capita Disposable Income (data source: China Civil Affairs’ Statistical Yearbook).
Figure 1.
Growth trend of Per Capita GDP and Per Capita Disposable Income (data source: China Civil Affairs’ Statistical Yearbook).

Figure 2.
Trends in birth rate and death rate (data source: China Statistical Yearbook).
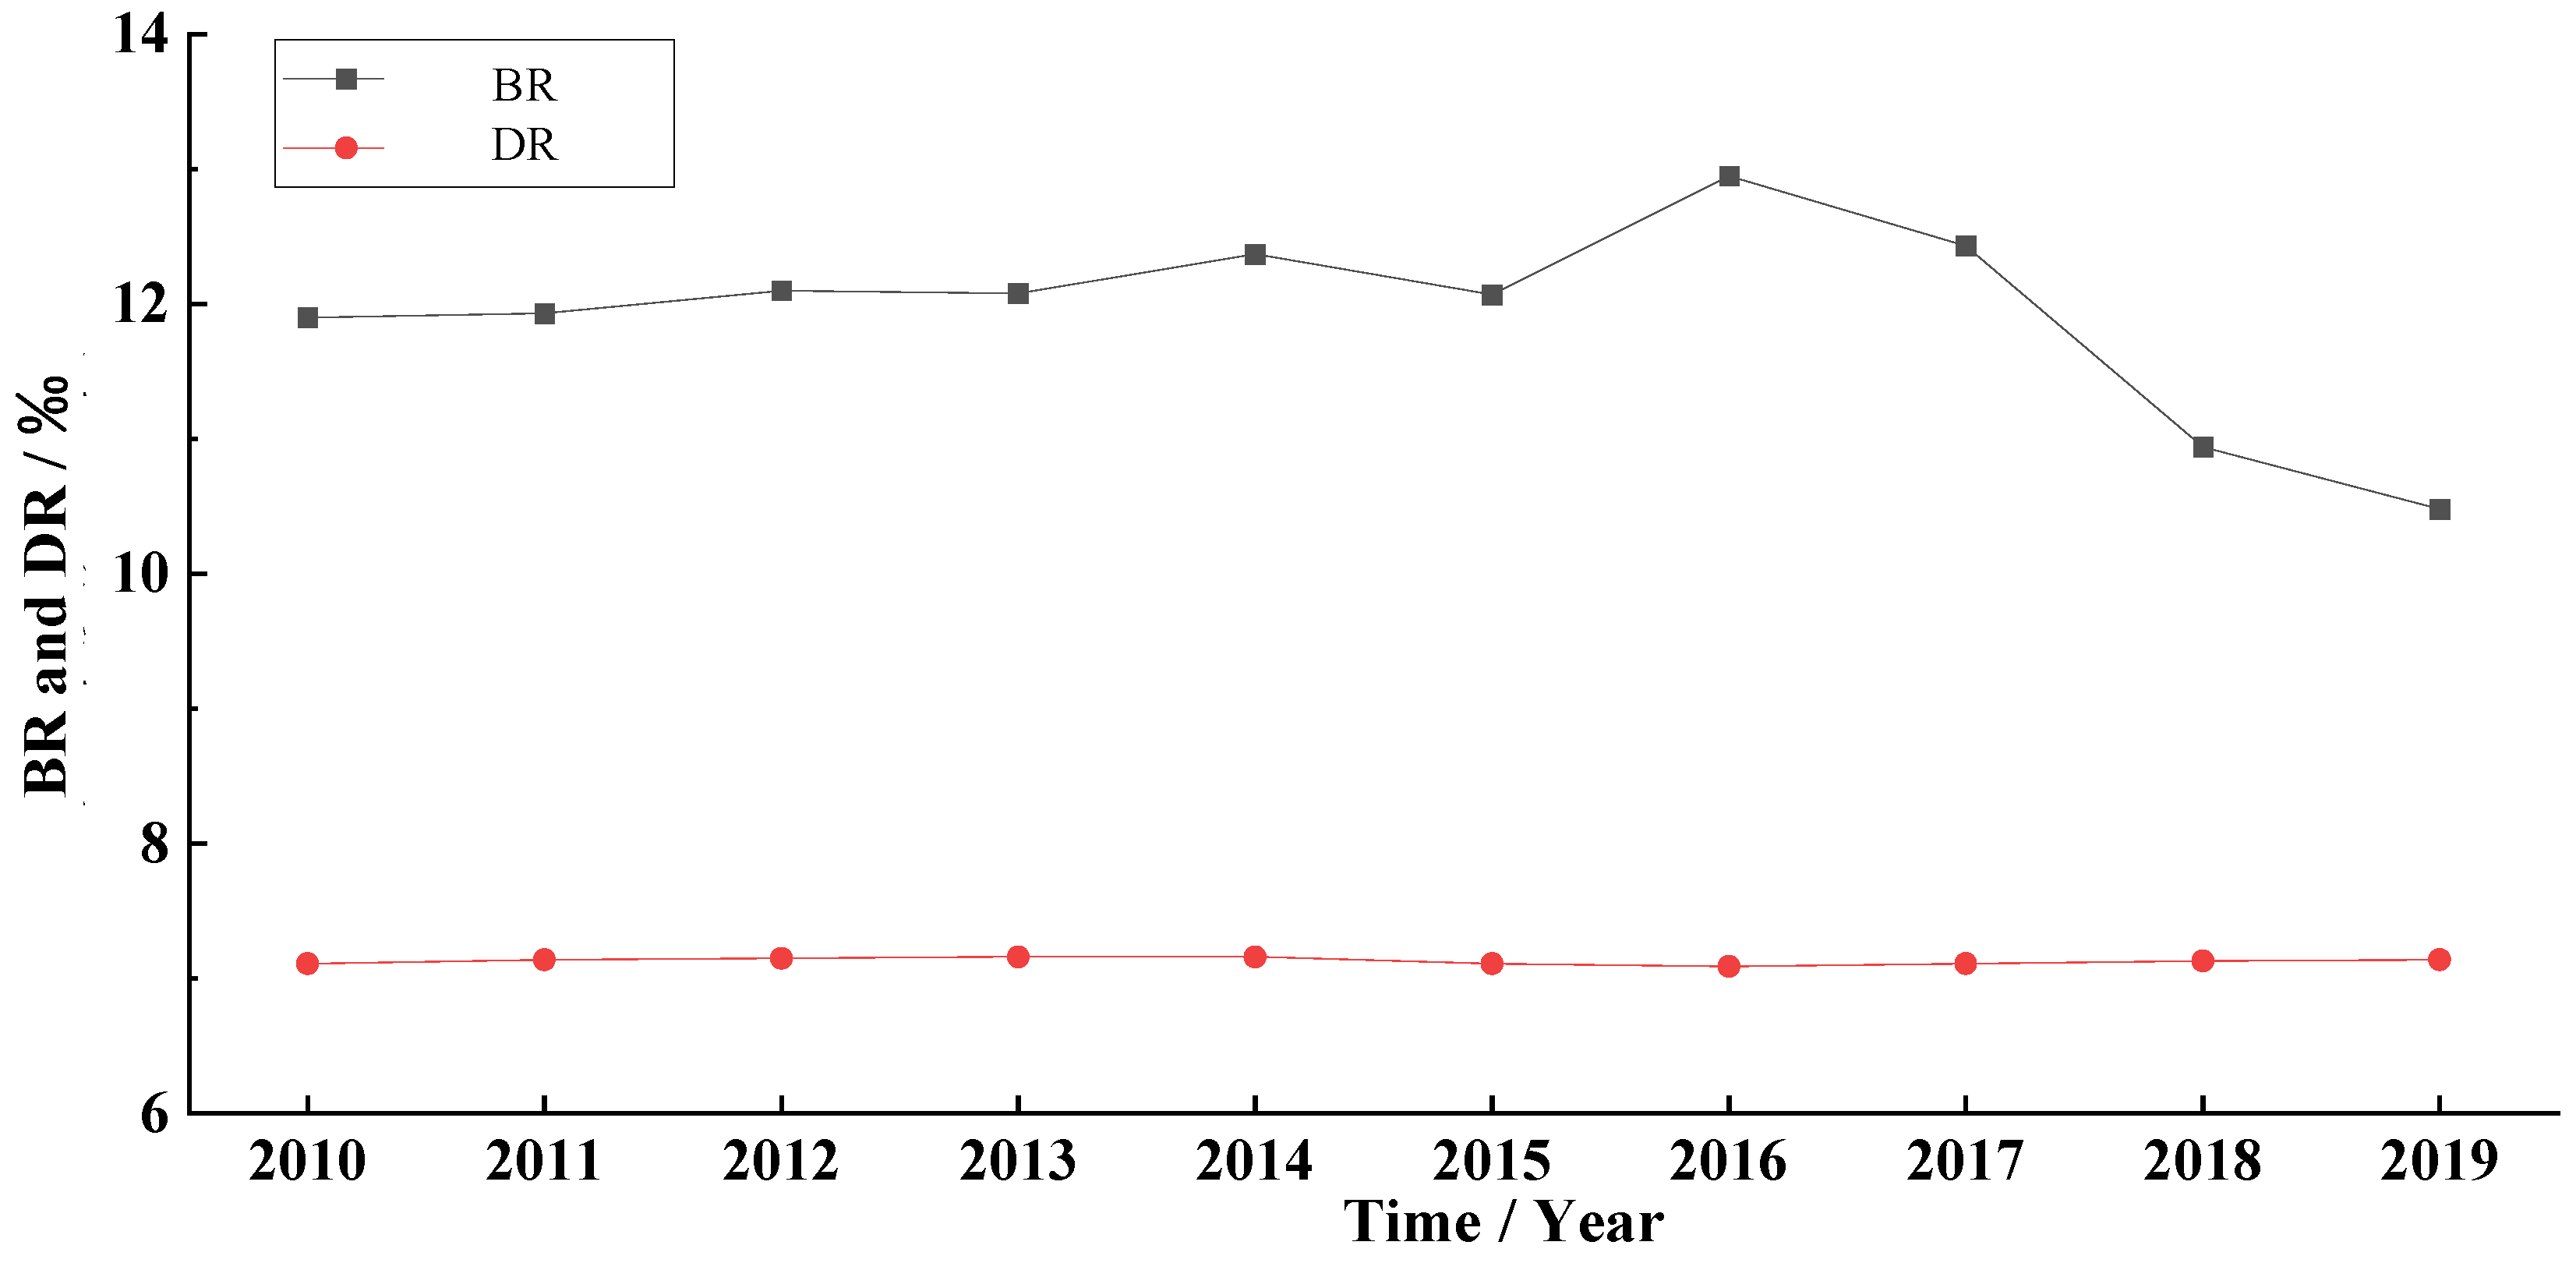
Figure 3.
Proportion of the population aged 60 and above in the TP of China (data source: China Civil Affairs’ Statistical Yearbook).
Figure 3.
Proportion of the population aged 60 and above in the TP of China (data source: China Civil Affairs’ Statistical Yearbook).
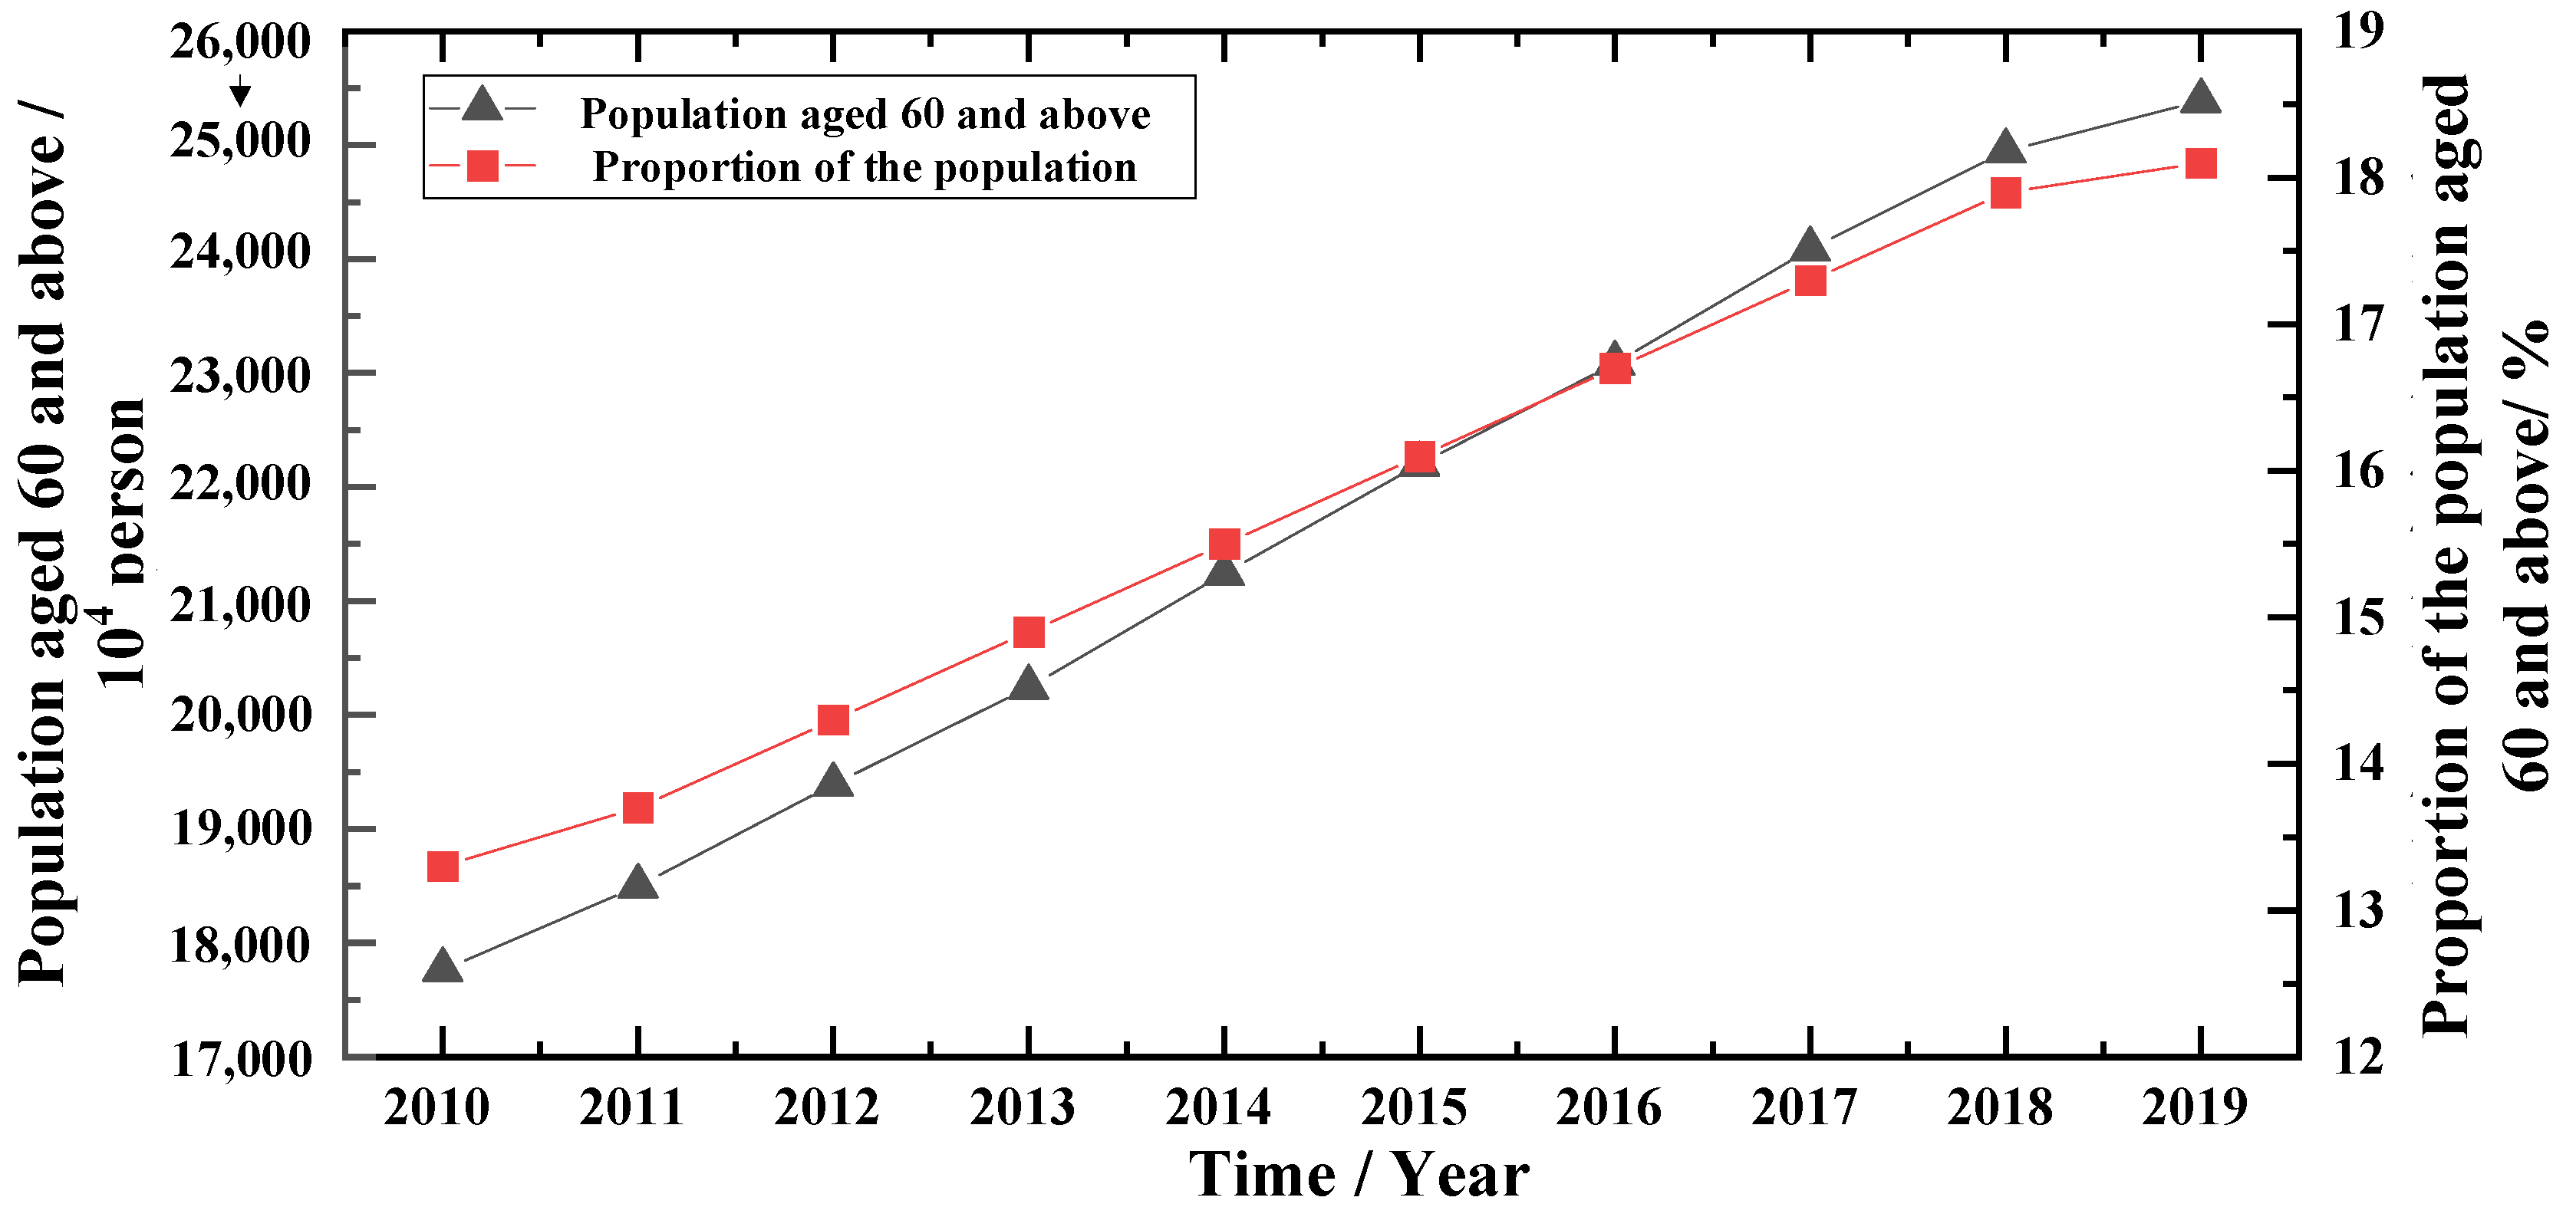
Figure 4.
The variation rules between willingness of disabled elderly population to pay and ratio of pension expenditures to per capita disposable income.
Figure 4.
The variation rules between willingness of disabled elderly population to pay and ratio of pension expenditures to per capita disposable income.

Figure 5.
The variation rules between Willingness of Non-Disabled Elderly Population to Pay and ratio of pension expenditures to per capita disposable income.
Figure 5.
The variation rules between Willingness of Non-Disabled Elderly Population to Pay and ratio of pension expenditures to per capita disposable income.
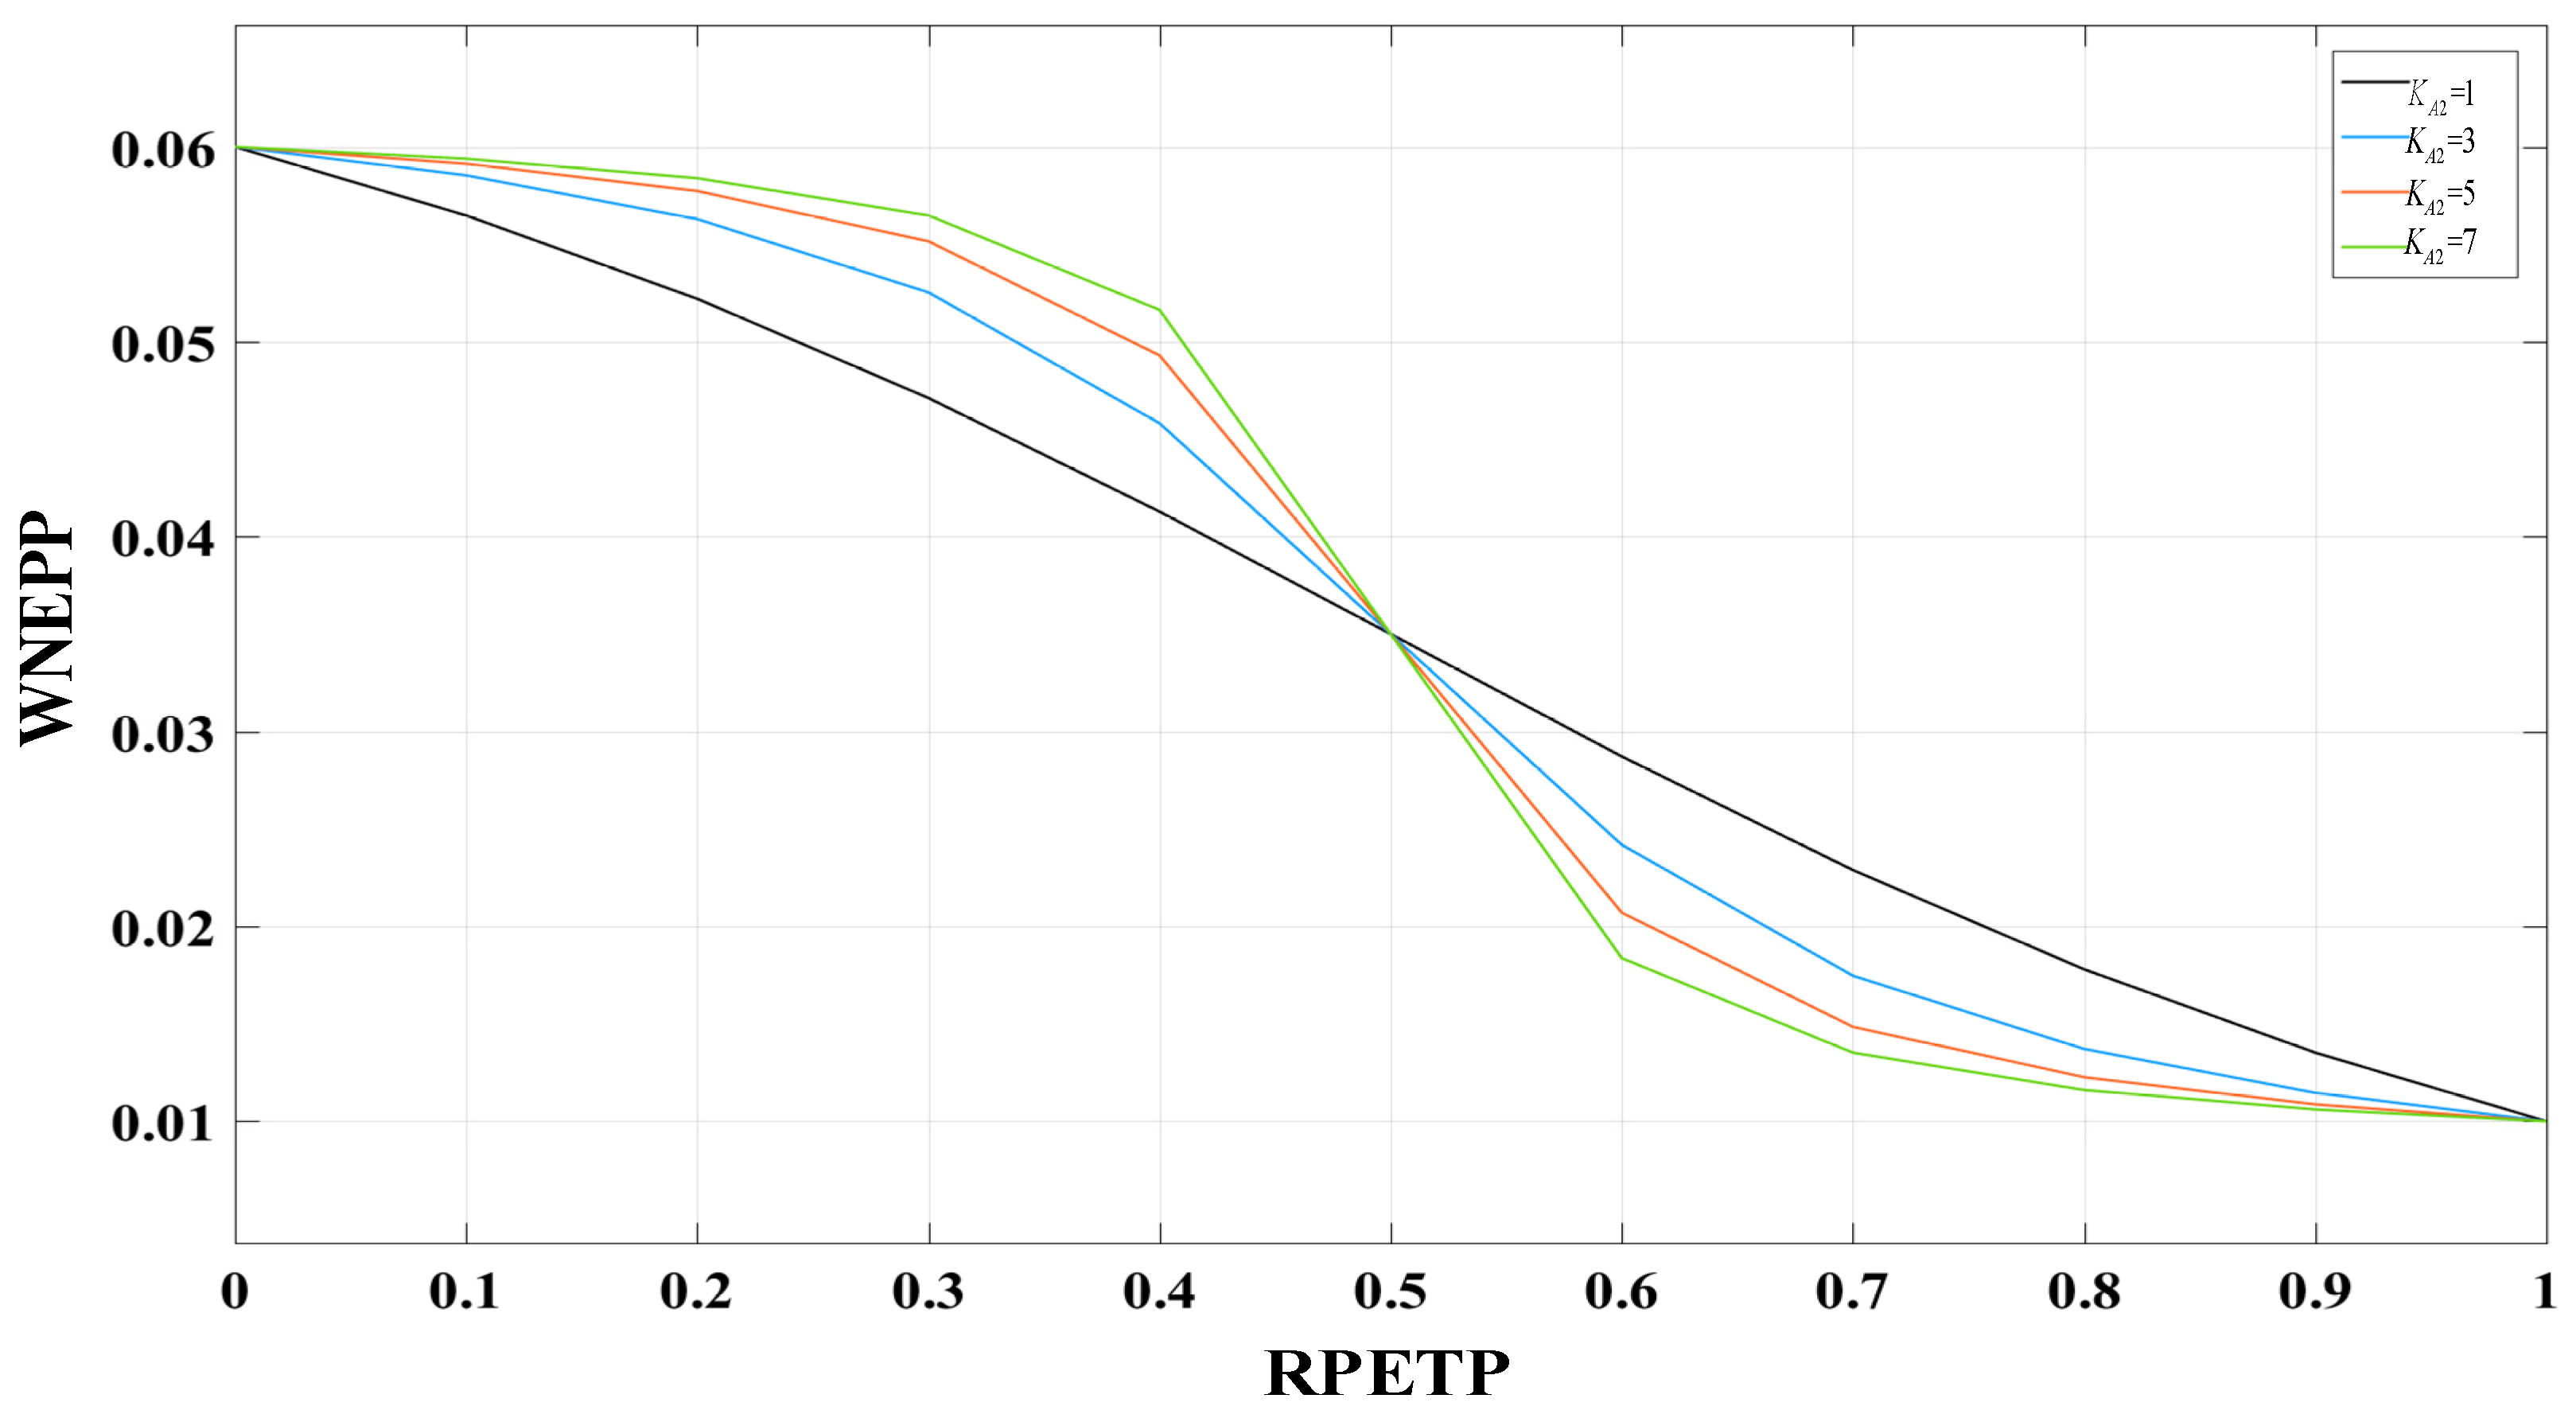
Figure 6.
Causality diagram of population and economic subsystem.
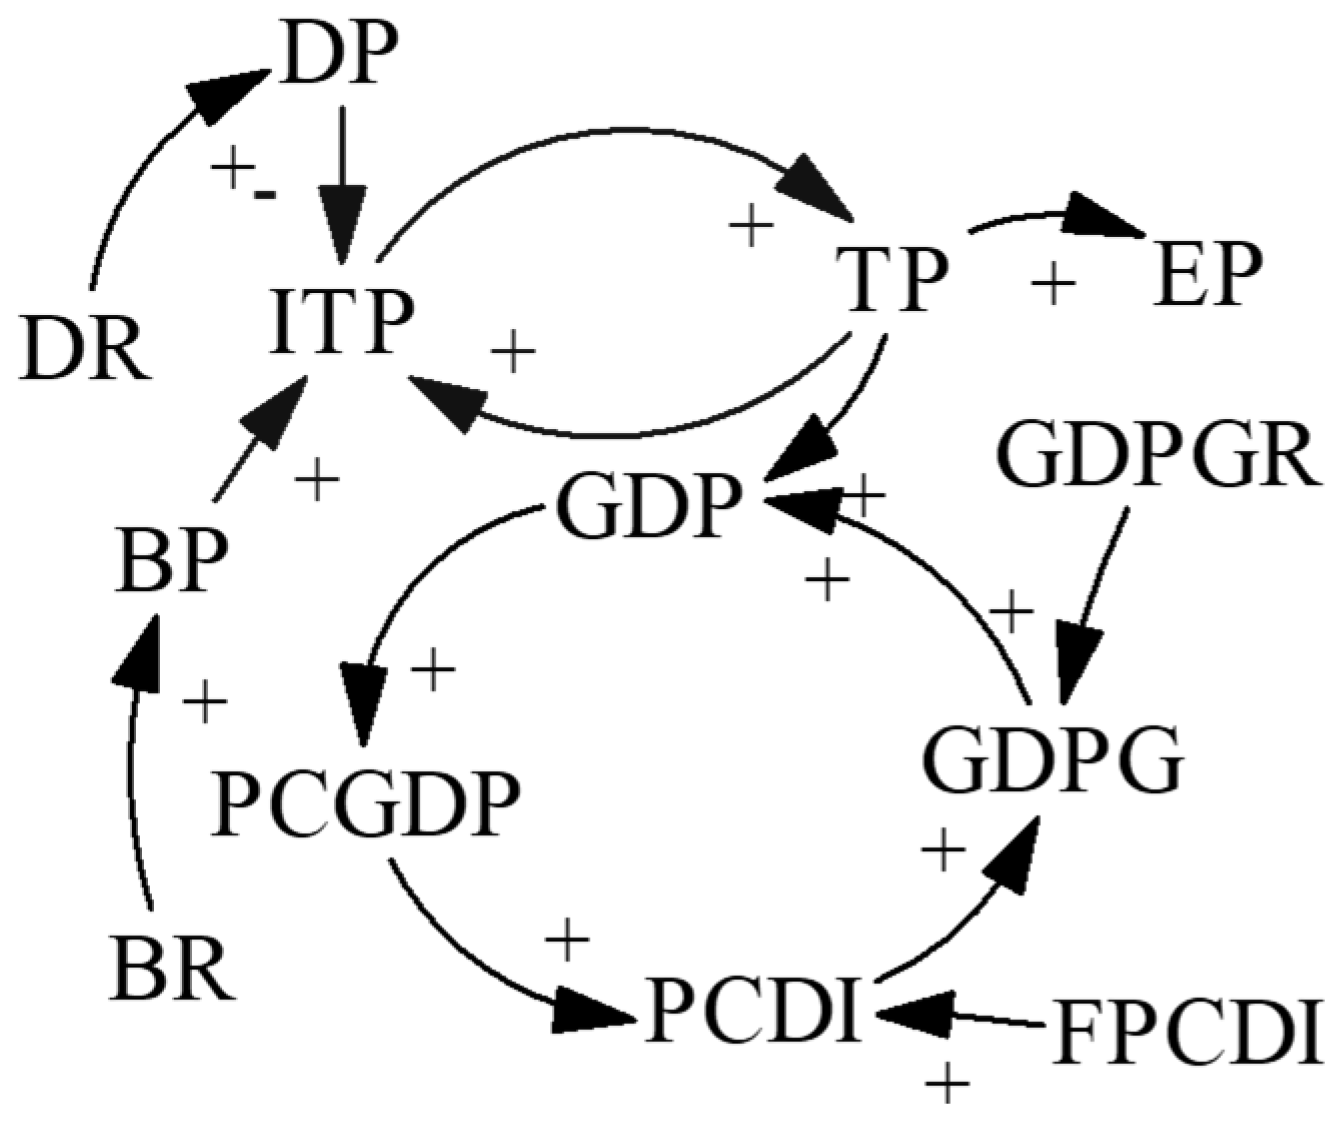
Figure 7.
Causality diagram for demand subsystem of aged service resource allocation.
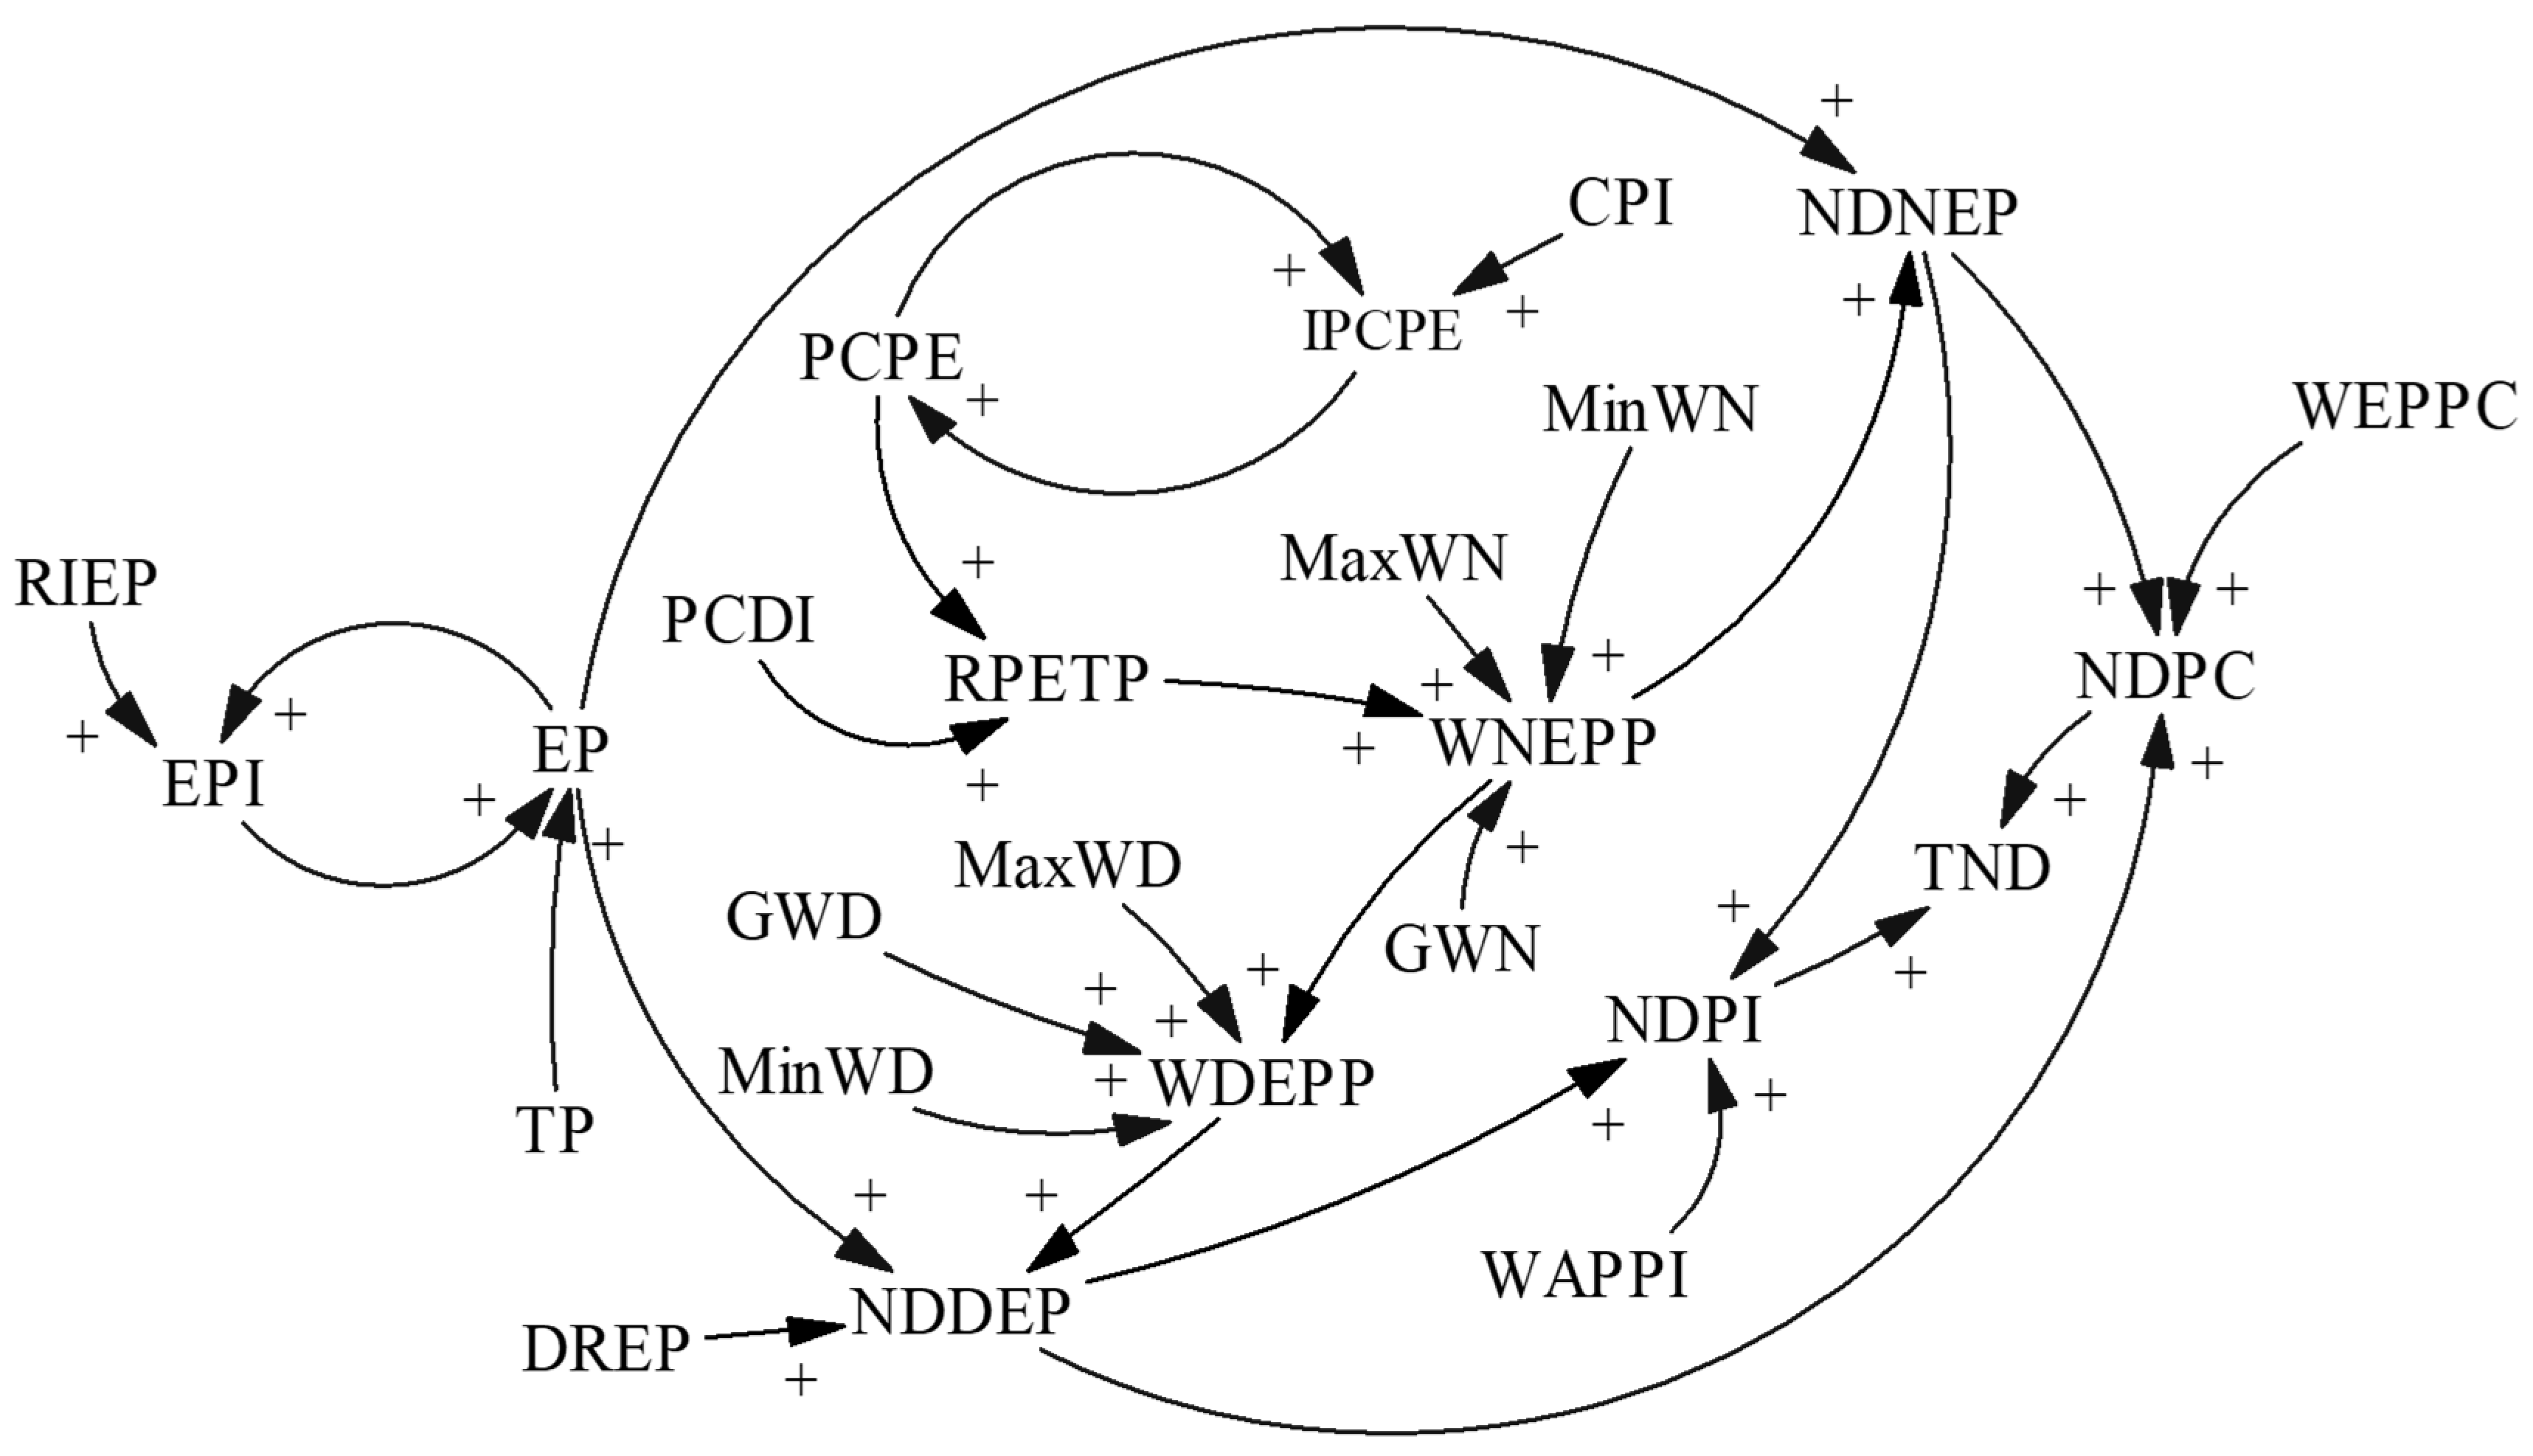
Figure 8.
Causality diagram for supply subsystem of aged service resource allocation.

Figure 9.
Causality diagram of aged service resource allocation system.

Figure 10.
Comparison between simulation values and actual values of different variables in the simulation model.
Figure 10.
Comparison between simulation values and actual values of different variables in the simulation model.
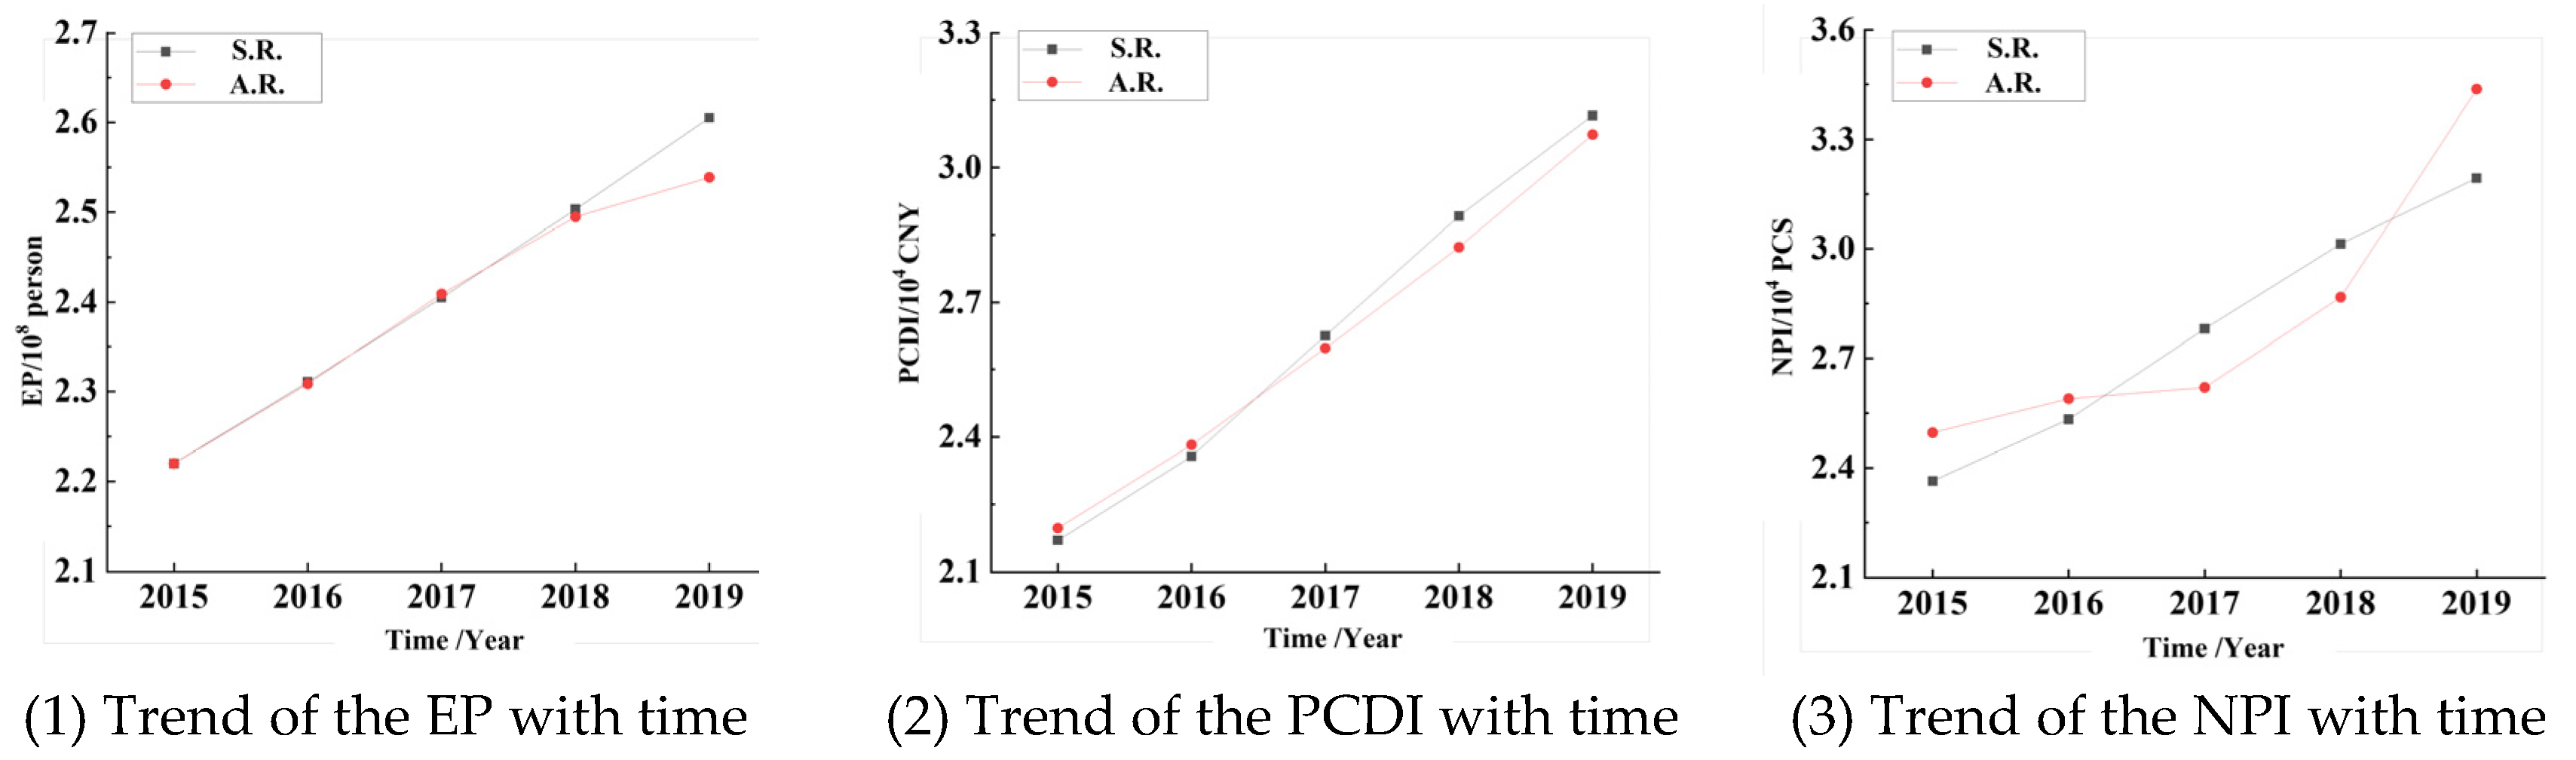

Figure 11.
Comparison of simulation values of variables in Group ②.

Figure 12.
Comparison of simulation values of variables in Group ③.

Figure 13.
Simulation and actual values of NPI and NPC from 2015 to 2020.

Figure 14.
Comparison of simulation values of variables in Group ⑤.

Figure 15.
Comparison of simulation values of variables in Group ⑥.

Figure 16.
Comparison of simulation values of variables in Group ⑦.
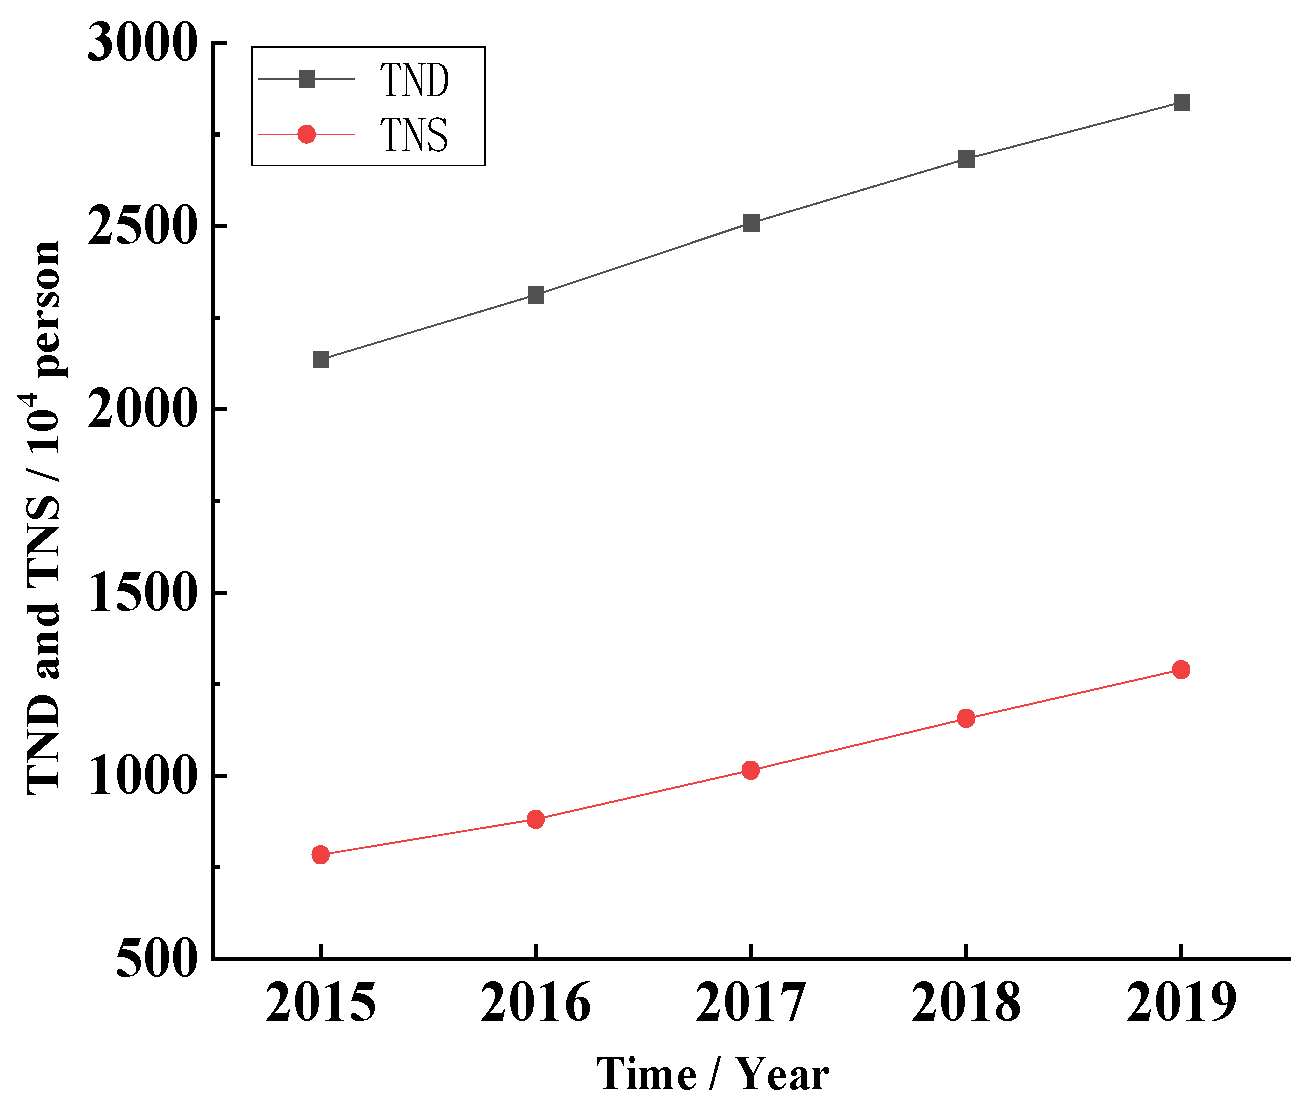
Figure 17.
Comparison of simulation values of variables in Group ⑧.

Table 1.
Data on GDP and IRNPE.
| Year | GDP | GDPGR | TNPE | IRNPE |
|---|---|---|---|---|
| 2015 | 688,858.2 | 0.070 | 270.8 | 0.047 |
| 2016 | 746,395.1 | 0.084 | 306.1 | 0.130 |
| 2017 | 832,035.9 | 0.115 | 306.9 | 0.003 |
| 2018 | 919,281.1 | 0.105 | 376.6 | 0.227 |
| 2019 | 990,865.1 | 0.078 | 400.4 | 0.063 |
Table 2.
Initial value table of variables and parameters of simulation mode.
| Variables or Parameters | Initial Value | Unit | Variables or Parameters | Initial Value | Unit |
|---|---|---|---|---|---|
| AP | 22,200 | 104 CNY | MEPI | 0.3 | — |
| TP | 137,500 | 104 CNY | WFPEPI | 0.45 | — |
| GDP | 688,858.2 | 108 CNY | MEPC | 0.1 | — |
| TNPE | 270.8 | 108 CNY | WFPEPC | 0.7 | — |
| PCPE | 0.83 | 104 CNY | WAPPI | 0.3 | — |
| OSPI | 24.5 | 104 CNY | WAPPC | 0.7 | — |
| OSPC | 24 | 104 CNY | WBSPI | 0.6 | — |
| Time | 2015 | Year | ANPI | 135 | PCS |
| GDPGR | Table function | — | ANPC | 50 | Person |
| FPCDI | 0.433 | — | MaxWD | 0.6 | — |
| ACPI | 0.02 | — | MinWD | 0.1 | — |
| BR | Table function | — | MaxWN | 0.06 | — |
| DR | Table function | — | MinWN | 0.01 | — |
| DRAP | 0.118 | — | 3 | — | |
| RIAP | 0.04 | — | 3 | — | |
| FOO | 0.02 | — |
Table 3.
Table of and of auxiliary or state variables (with two decimal places reserved).
| Variable Name | 2015 | 2016 | 2017 | 2018 | 2019 | |
|---|---|---|---|---|---|---|
| EP | Simulation value | 2.22 | 2.31 | 2.40 | 2.50 | 2.60 |
| Actual value | 2.22 | 2.31 | 2.41 | 2.49 | 2.54 | |
| 0.00% | 0.09% | −0.17% | 0.32% | 2.62% | ||
| 0.64% | ||||||
| PCDI | Simulation value | 2.17 | 2.36 | 2.62 | 2.89 | 3.11 |
| Actual value | 2.20 | 2.38 | 2.60 | 2.82 | 3.07 | |
| −1.24% | −1.06% | 1.09% | 2.45% | 1.38% | ||
| 1.45% | ||||||
| NPI | Simulation value | 2.36 | 2.53 | 2.78 | 3.01 | 3.19 |
| Actual value | 2.50 | 2.59 | 2.62 | 2.87 | 3.44 | |
| −5.28% | −2.18% | 6.12% | 5.12% | −7.06% | ||
| 5.15% | ||||||
| NSPI | Simulation value | 319.18 | 341.95 | 375.38 | 406.86 | 431.18 |
| Actual value | 331.21 | 352.93 | 358.49 | 379.40 | 438.82 | |
| −3.63% | −3.10% | 4.74% | 7.24% | −1.74% | ||
| 4.09% | ||||||
| NPC | Simulation value | 9.30 | 10.78 | 12.79 | 14.99 | 17.17 |
| Actual value | 8.81 | 11.13 | 12.59 | 13.96 | 16.92 | |
| 5.60% | −3.19% | 1.62% | 7.36% | 1.49% | ||
| 3.85% | ||||||
| TNPE | Simulation value | 270.80 | 295.92 | 331.35 | 366.32 | 395.98 |
| Actual value | 270.80 | 306.1 | 306.91 | 376.66 | 400.44 | |
| 0.00% | −3.33% | 7.96% | −2.74% | −1.11% | ||
| 3.03% | ||||||
Table 4.
Variables to be simulated and analyzed, and their grouping table.
| The Serial Number | Variable Name | Variable Property | Grouping Number |
|---|---|---|---|
| 1 | EP | State variable | ① |
| 2 | PCDI | State variable | ① |
| 3 | TNPE | State variable | ① |
| 4 | WDEPP | Auxiliary variable | ② |
| 5 | WNEPP | Auxiliary variable | ② |
| 6 | NDDEP | Auxiliary variable | ③ |
| 7 | NDNEP | Auxiliary variable | ③ |
| 8 | NPI | Auxiliary variable | ④ |
| 9 | NPC | Auxiliary variable | ④ |
| 10 | NSPI | Auxiliary variable | ⑤ |
| 11 | NSPC | Auxiliary variable | ⑤ |
| 12 | NDPI | Auxiliary variable | ⑥ |
| 13 | NDPC | Auxiliary variable | ⑥ |
| 14 | TND | Auxiliary variable | ⑦ |
| 15 | TNS | Auxiliary variable | ⑦ |
| 16 | TRSD | Output variable | ⑧ |
| 17 | RSDPI | Output variable | ⑧ |
| 18 | RSDPC | Output variable | ⑧ |
Publisher’s Note: MDPI stays neutral with regard to jurisdictional claims in published maps and institutional affiliations. |
© 2022 by the authors. Licensee MDPI, Basel, Switzerland. This article is an open access article distributed under the terms and conditions of the Creative Commons Attribution (CC BY) license (https://creativecommons.org/licenses/by/4.0/).
Share and Cite
MDPI and ACS Style
Zhang, Y.; Zhang, M.; Hu, H.; He, X. Research on Supply and Demand of Aged Services Resource Allocation in China: A System Dynamics Model. Systems 2022, 10, 59. https://doi.org/10.3390/systems10030059
AMA Style
Zhang Y, Zhang M, Hu H, He X. Research on Supply and Demand of Aged Services Resource Allocation in China: A System Dynamics Model. Systems. 2022; 10(3):59. https://doi.org/10.3390/systems10030059
Chicago/Turabian StyleZhang, Yijie, Mingli Zhang, Haiju Hu, and Xiaolong He. 2022. "Research on Supply and Demand of Aged Services Resource Allocation in China: A System Dynamics Model" Systems 10, no. 3: 59. https://doi.org/10.3390/systems10030059
Note that from the first issue of 2016, this journal uses article numbers instead of page numbers. See further details here.