
Aboveground Net Primary Productivity in a Riparian Wetland Following Restoration of Hydrology


Abstract
:1. Introduction
2. Methods
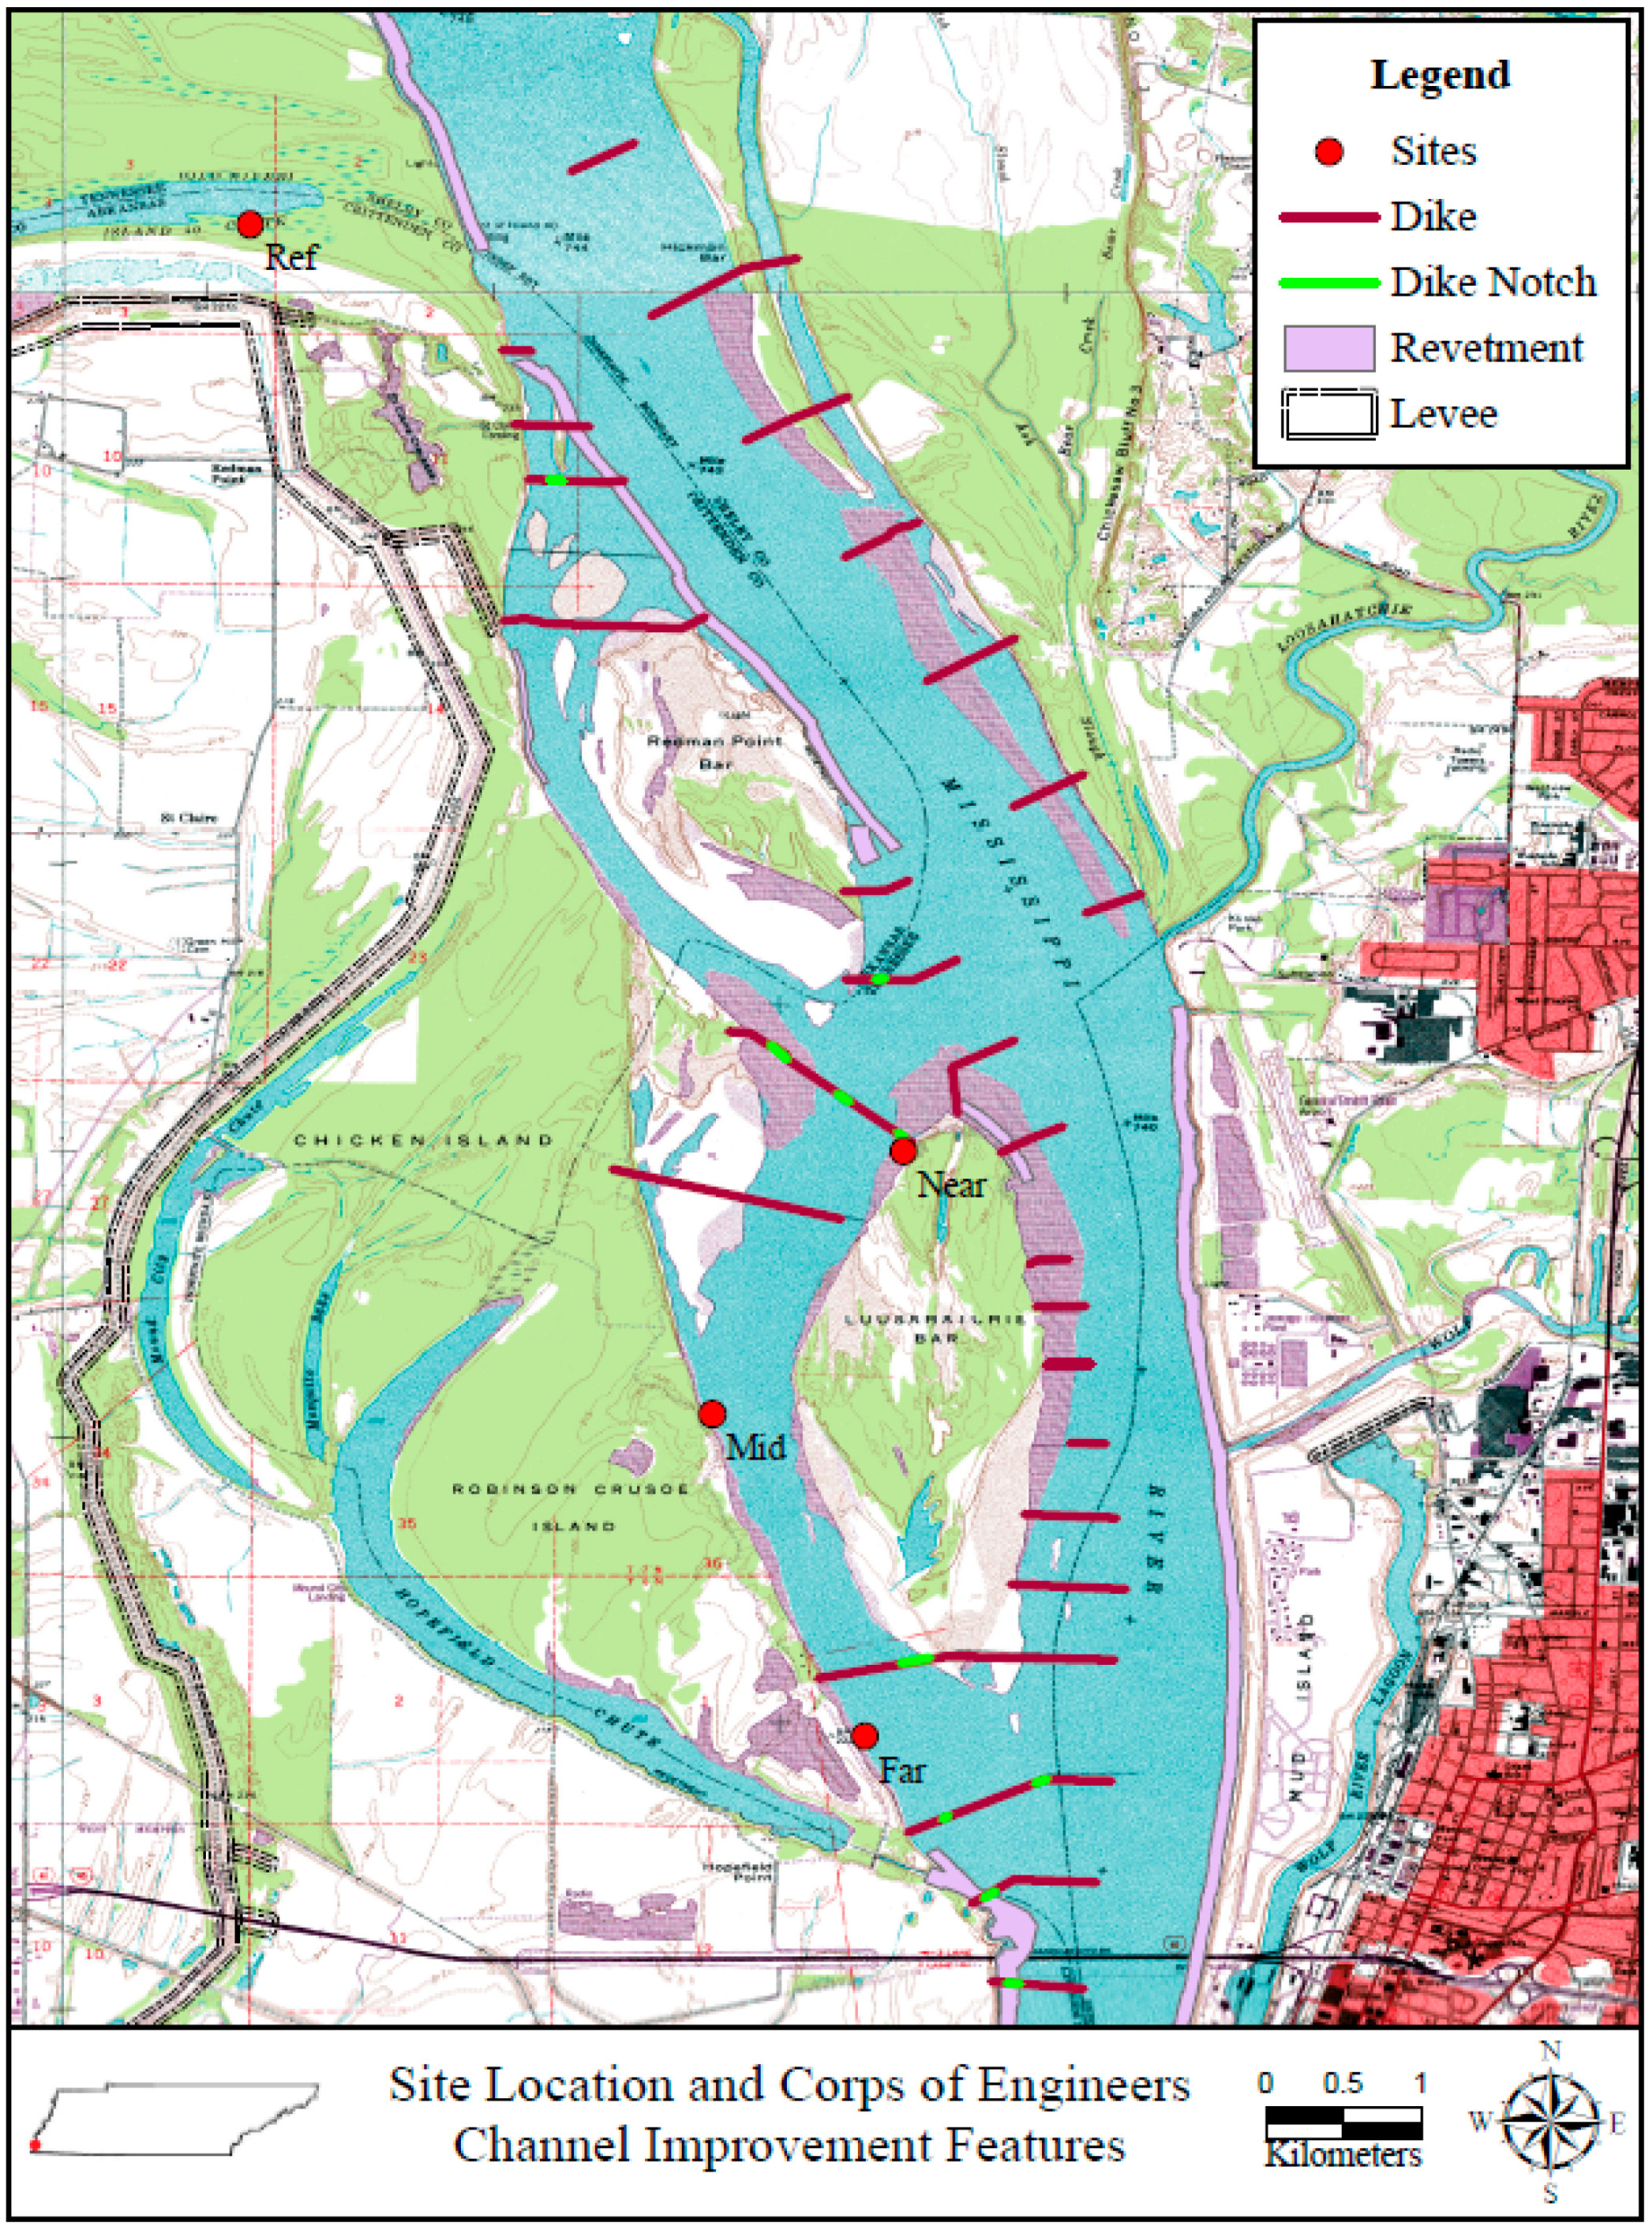
2.1. Study Area
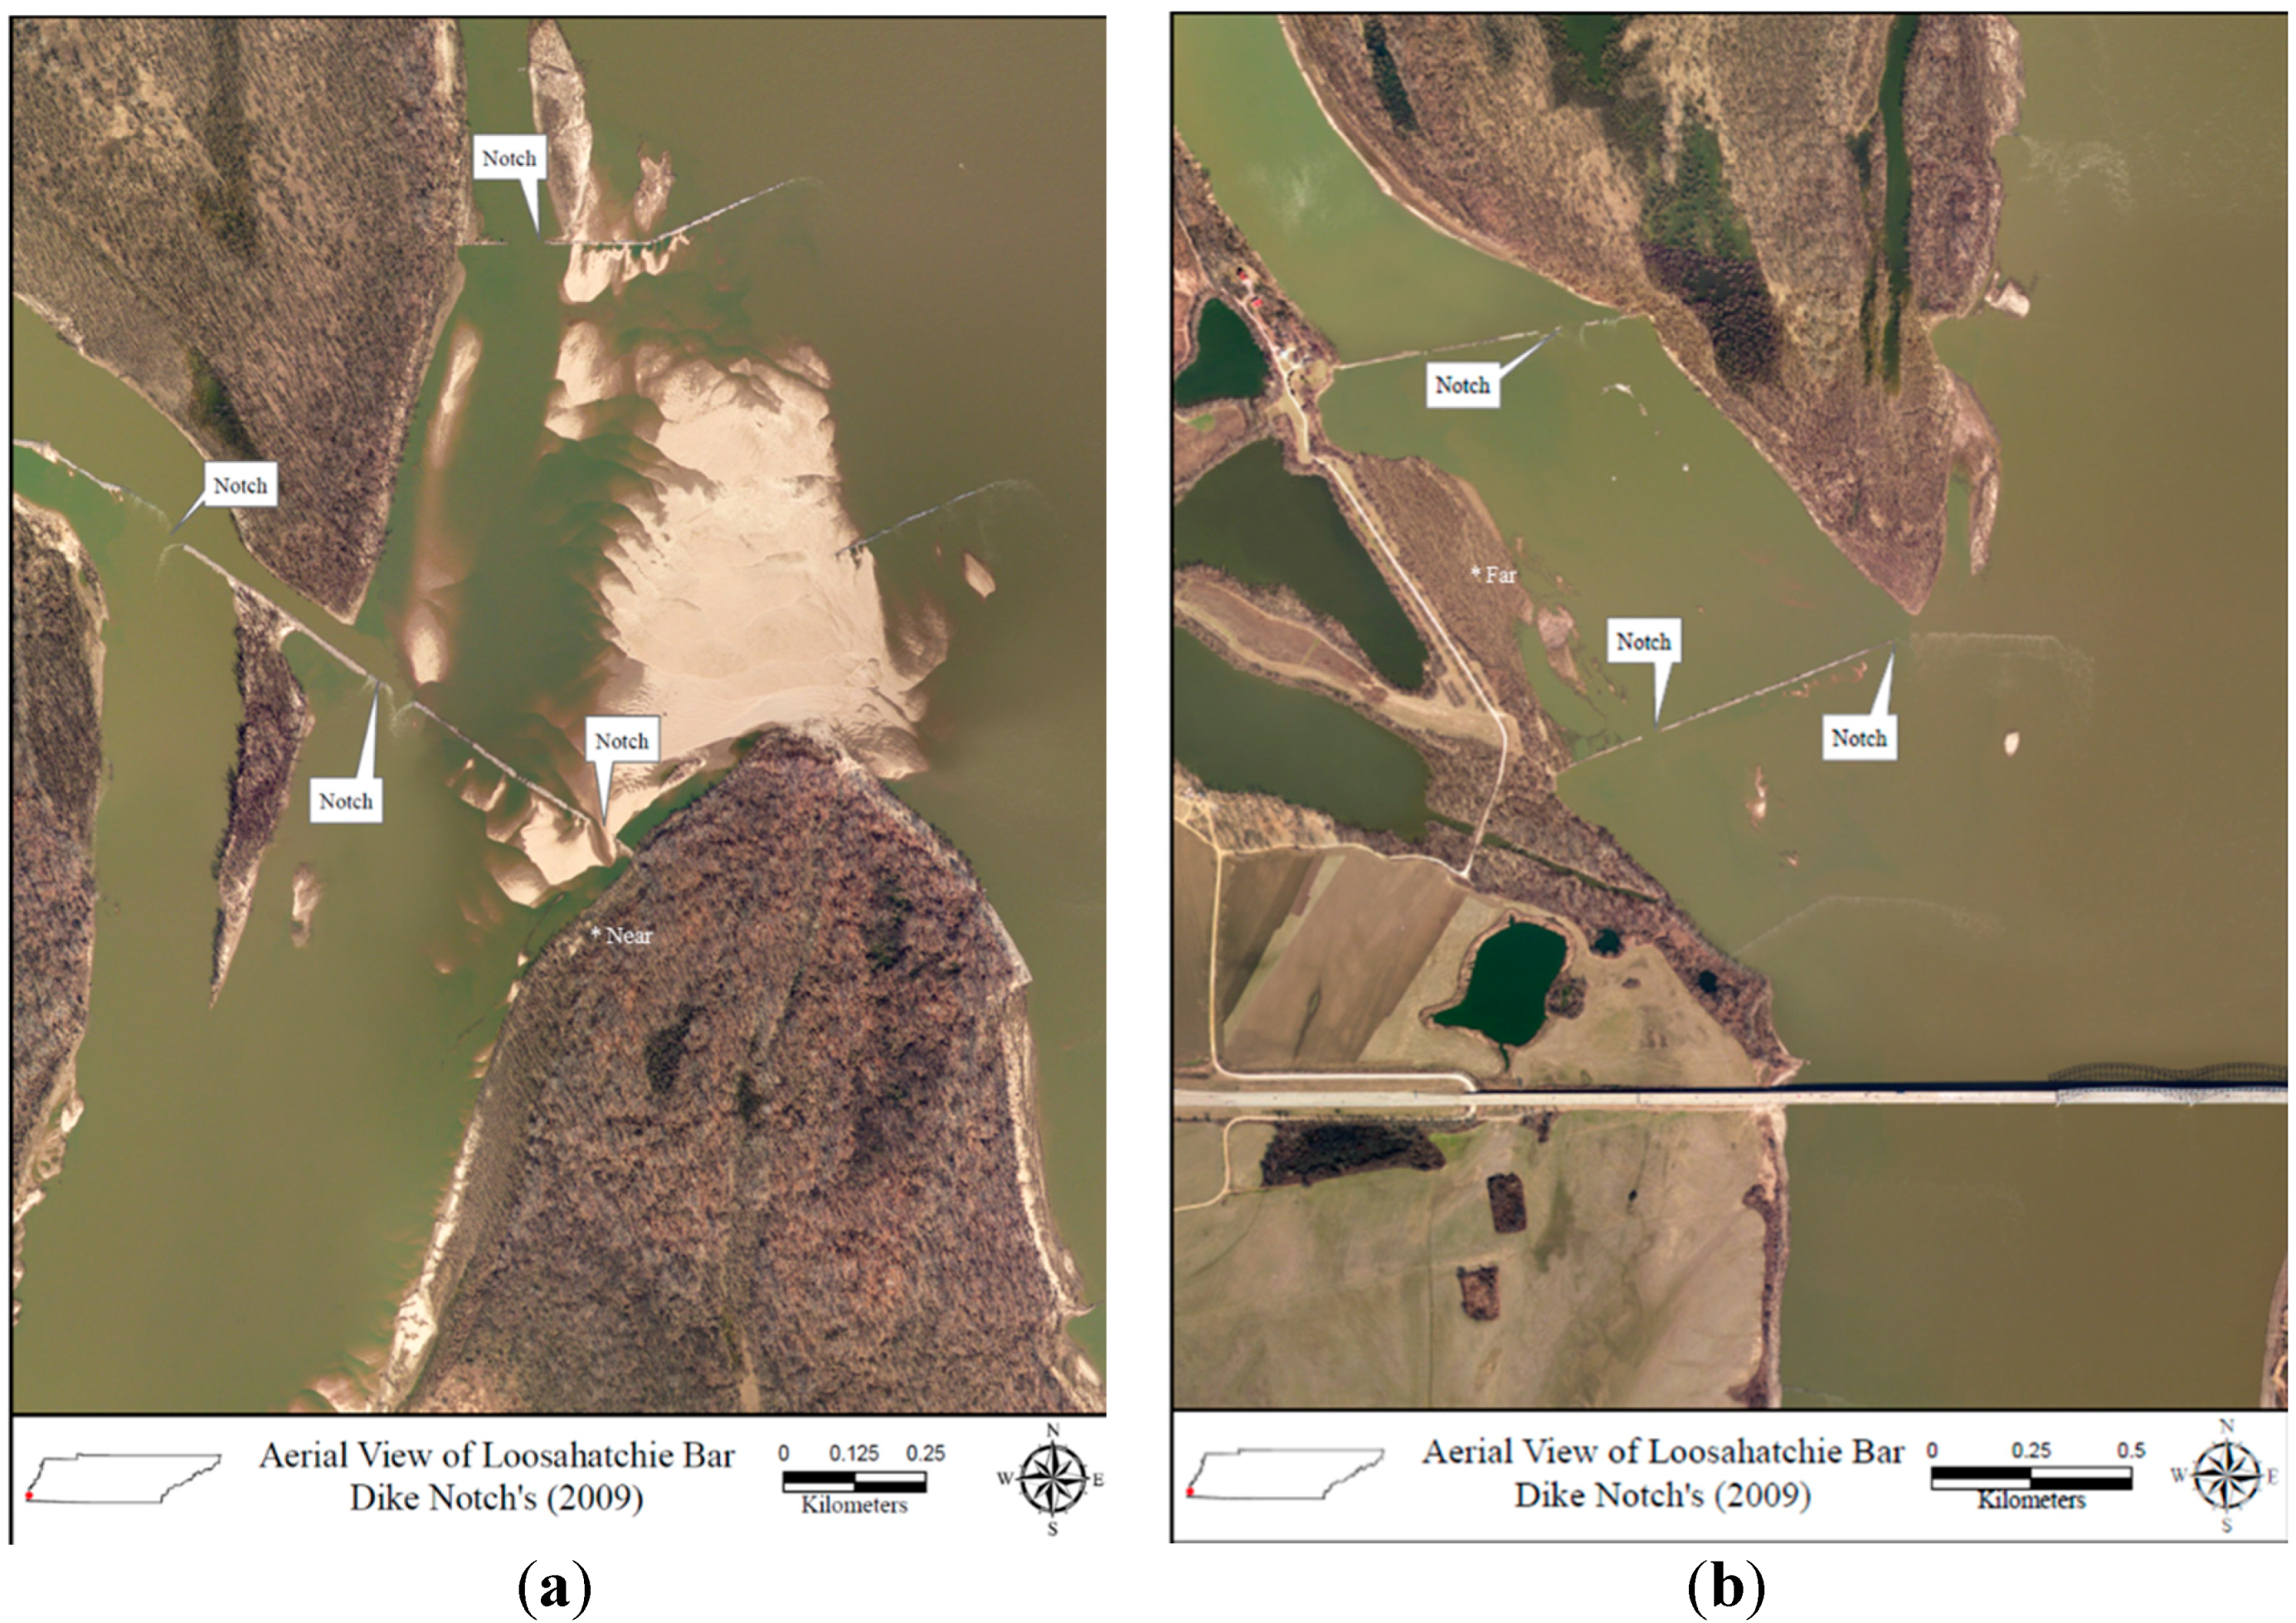
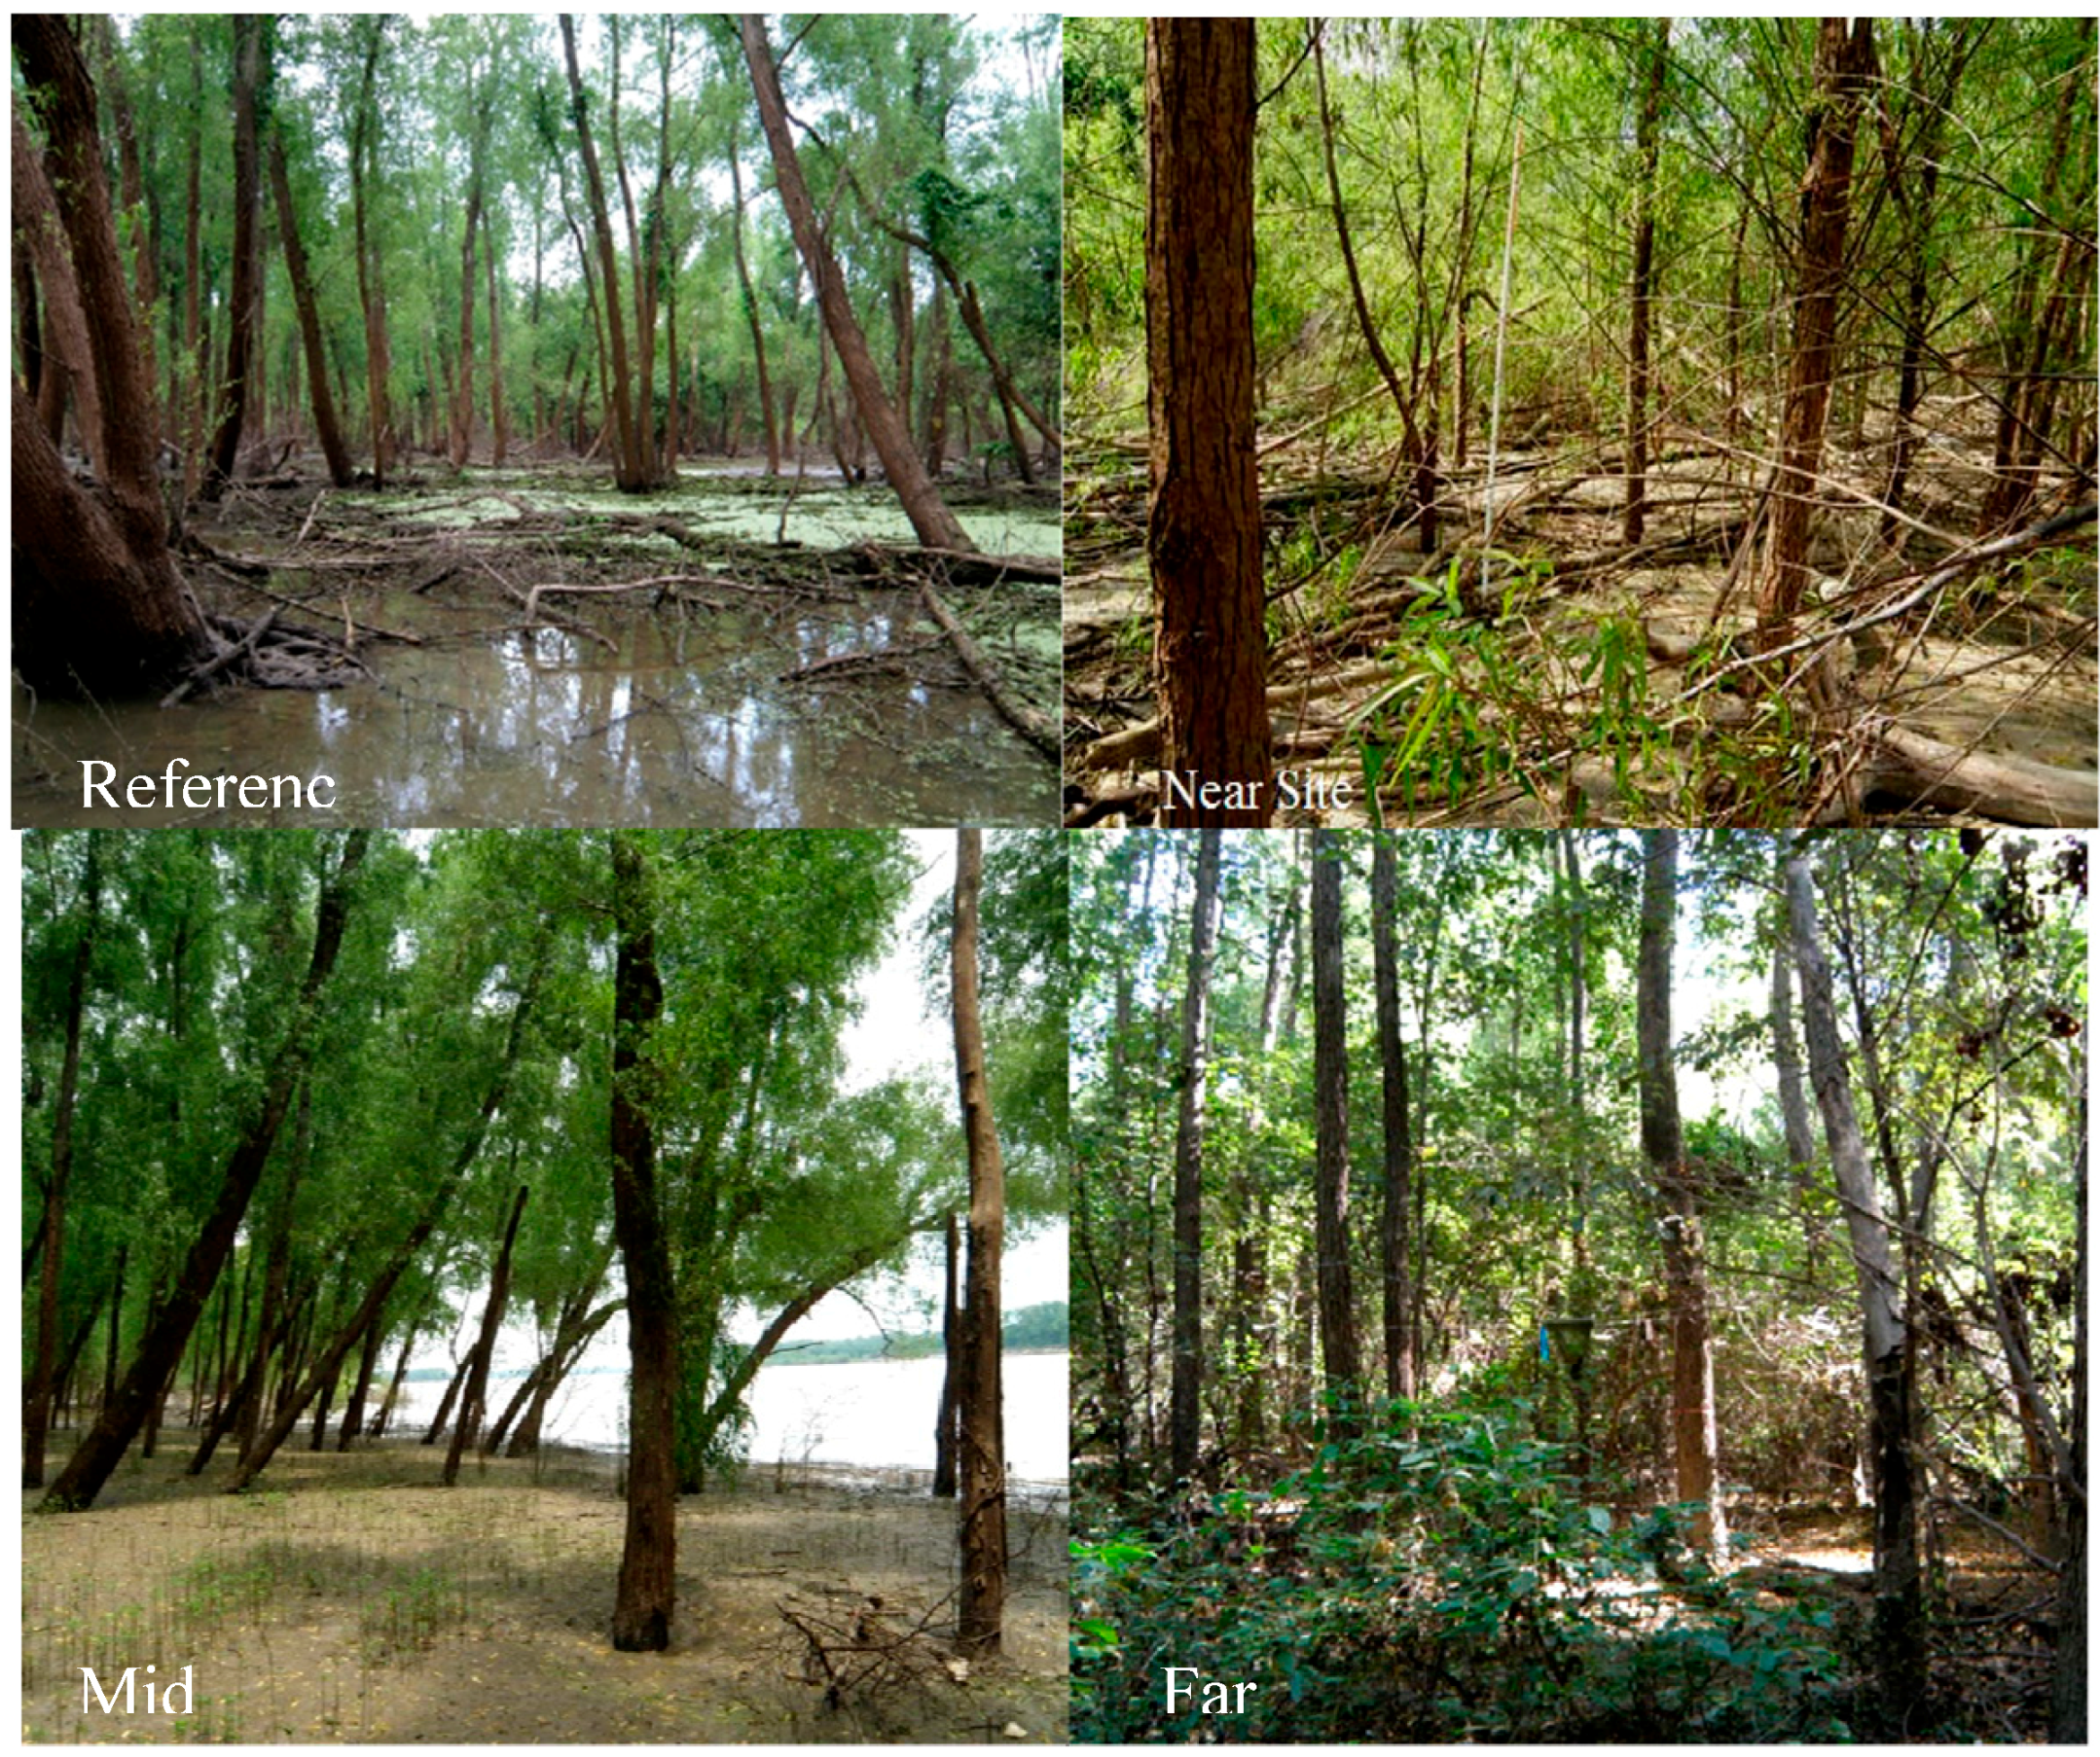
2.2. Site Description

| Site | Latitude | Longitude | Elevation (m) |
|---|---|---|---|
| Ref | 35°15′14.26″ N | 90°06′51.23″ W | 62.64 |
| Near | 35°12′00.04″ N | 90°04′34.55″ W | 61.75 |
| Mid | 35°11′05.04″ N | 90°05′14.56″ W | 61.84 |
| Far | 35°09′57.44″ N | 90°04′42.58″ W | 62.94 |
2.3. Soil
2.4. Aboveground Productivity
| Species | y = f(DBH) | DBH Range | Reference |
|---|---|---|---|
| Salix nigra | Biomass(kg) = 10^((−1.5 + 2.78 × LOG10(DBHcm))) | n.a. | [41] |
| Acer rubrum | Biomass (kg) = ((2.39959 × ((DBHcm × 0.394)^2)^1.2003)) × 0.454 | 10–28 cm | [40] |
| Other Species | Biomass (kg) = ((2.54671 × ((DBHcm × 0.394)^2)^1.20138)) × 0.45 | 10–28 cm | [40] |
2.5. Data Analyses
3. Results
| Site | Species | Tree Density (Trees ha−1) | Basal Area (cm2·m−2) | ||||
|---|---|---|---|---|---|---|---|
| 2009 | 2010 | 2011 | 2009 | 2010 | 2011 | ||
| Ref | Salix nigra | 298 | 298 | 293 | 3.26 | 3.47 | 3.67 |
| Near | Salix nigra | 533 | 528 | 496 | 0.63 | 0.76 | 0.86 |
| Near | Celtis laevigata | 10 | 10 | 10 | 0.01 | 0.02 | 0.02 |
| Mid | Salix nigra | 314 | 314 | 314 | 2.84 | 3.02 | 3.22 |
| Mid | Platanus occidentalis | 5 | 5 | 5 | 0.01 | 0.01 | 0.01 |
| Far | Salix nigra | 352 | 352 | 352 | 2.39 | 2.55 | 2.78 |
| Far | Acer rubrum | 64 | 64 | 58 | 0.10 | 0.11 | 0.12 |
| Far | Ulmus americana | 5 | 5 | 5 | 0.02 | 0.02 | 0.03 |
| Site | Species | Relative Density | Relative Dominance | Importance Value | ||||||
|---|---|---|---|---|---|---|---|---|---|---|
| 2009 | 2010 | 2011 | 2009 | 2010 | 2011 | 2009 | 2010 | 2011 | ||
| Ref | Salix nigra | 100% | 100% | 100% | 100% | 100% | 100% | 2 | 2 | 2 |
| Near | Salix nigra | 98% | 98% | 98% | 98.4% | 97.4% | 97.7% | 1.96 | 1.95 | 1.96 |
| Near | Celtis laevigata | 2% | 2% | 2% | 1.6% | 2.6% | 2.3% | 0.04 | 0.05 | 0.04 |
| Mid | Salix nigra | 98.3% | 98.3% | 98.3% | 99.6% | 99.7% | 99.7% | 1.98 | 1.98 | 1.98 |
| Mid | Platanus occidentalis | 1.7% | 1.7% | 1.7% | 0.4% | 0.3% | 0.3% | 0.02 | 0.02 | 0.02 |
| Far | Salix nigra | 83.5% | 83.5% | 84.6% | 95.2% | 95.2% | 94.9% | 1.79 | 1.79 | 1.80 |
| Far | Acer rubrum | 15.2% | 15.2% | 14.1% | 4% | 4.1% | 4.1% | 0.19 | 0.19 | 0.18 |
| Far | Ulmus americana | 1.3% | 1.3% | 1.3% | 0.8% | 0.7% | 1% | 0.02 | 0.02 | 0.02 |

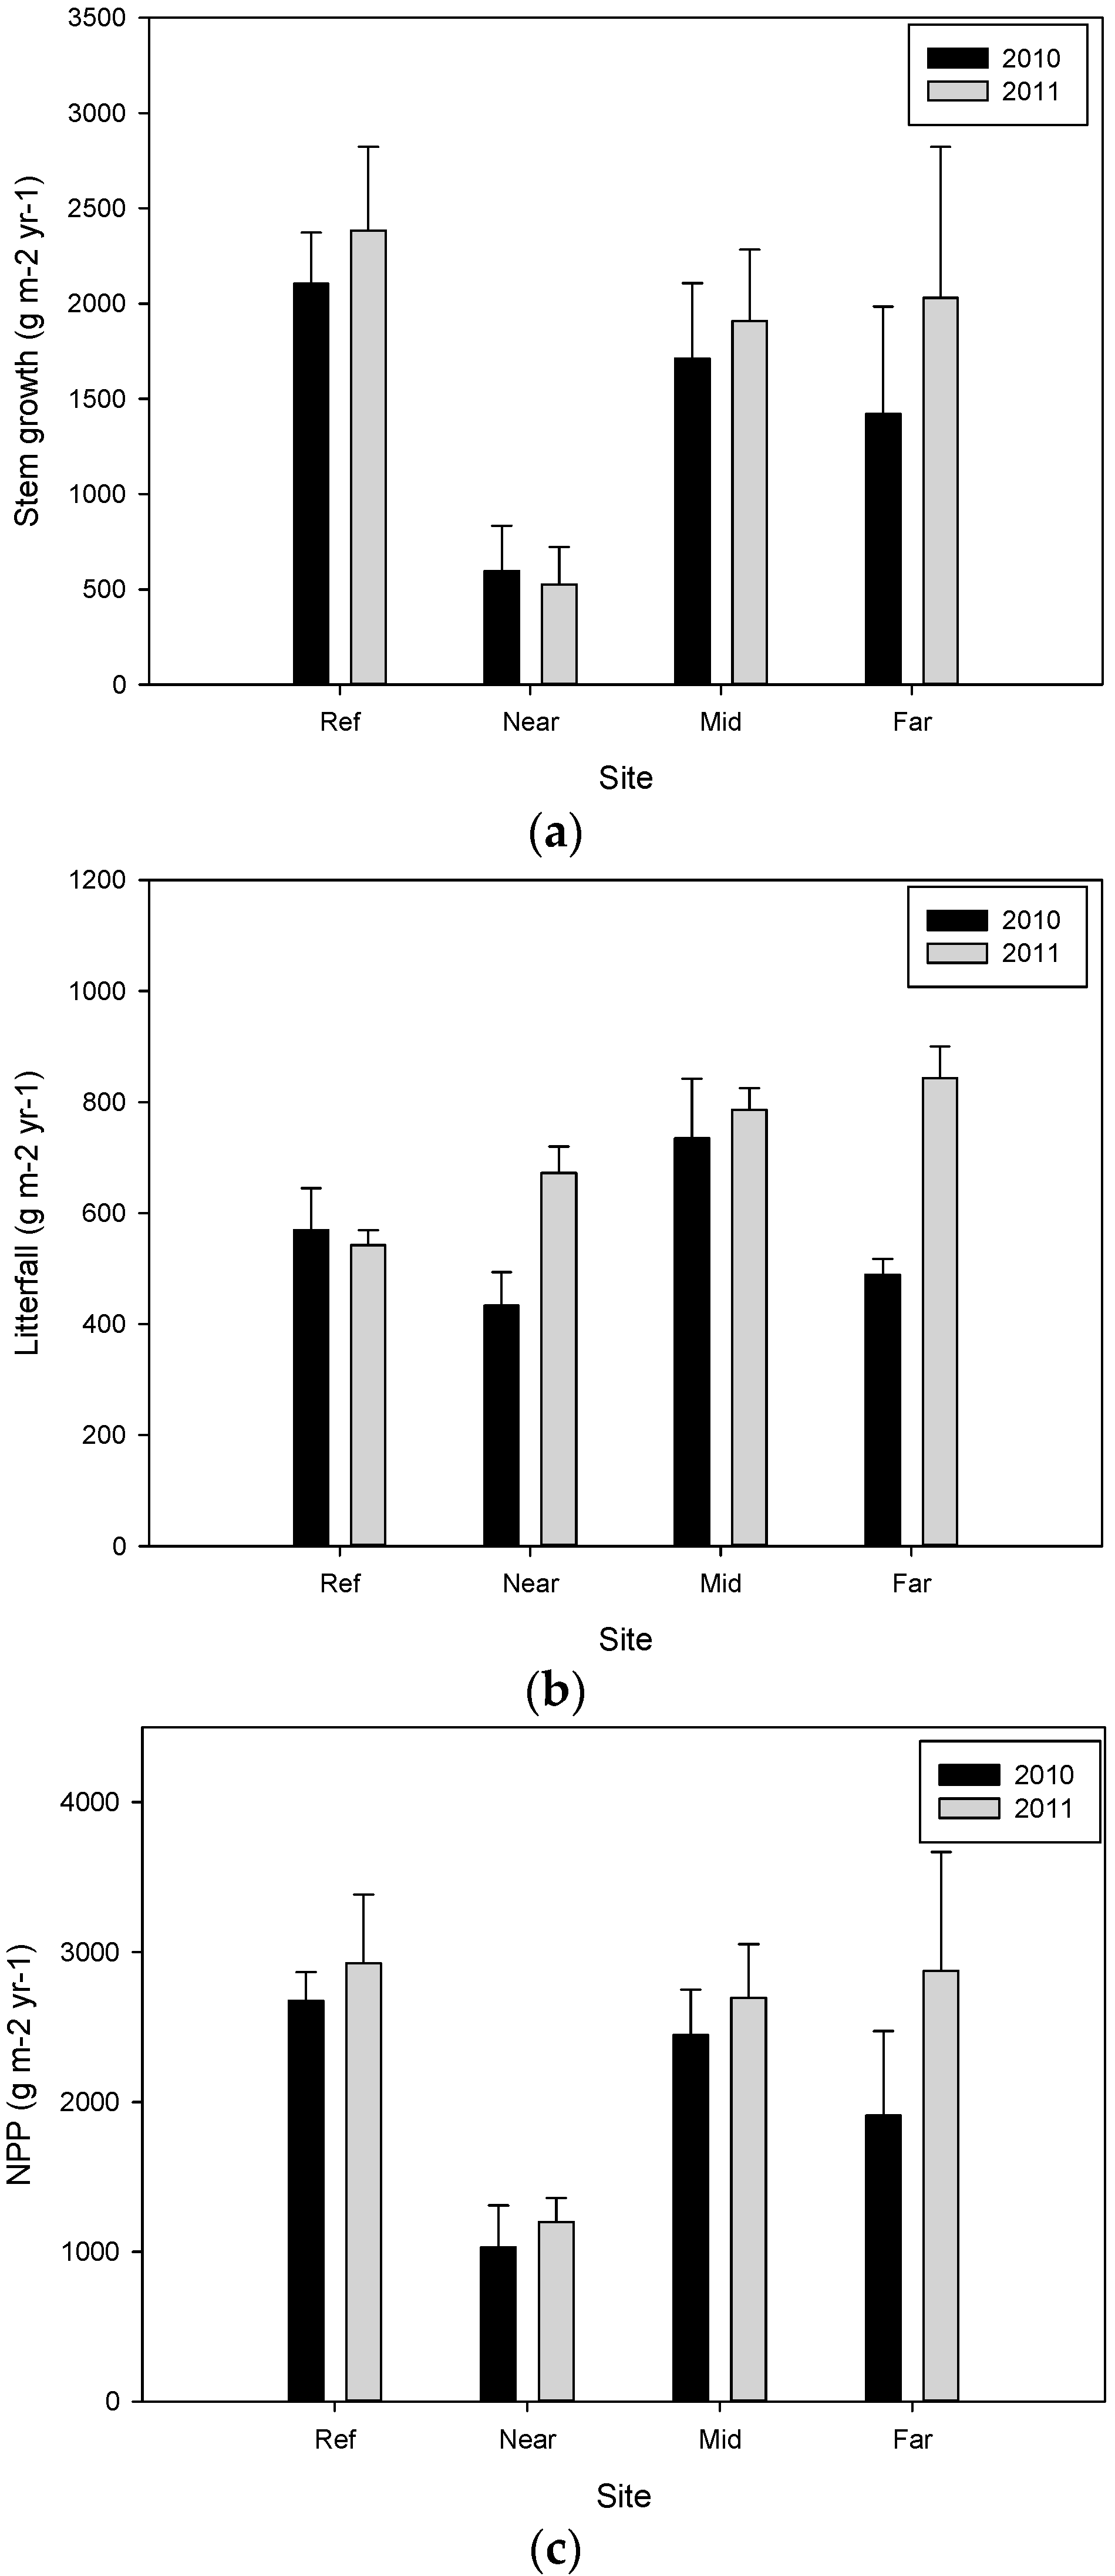
| Site | Plot Number | Year 2009–2010 (g·m−2·year−1) | Year 2010–2011 (g·m−2·year−1) | ||||
|---|---|---|---|---|---|---|---|
| Stem Growth | Litterfall | NPP | Stem Growth | Litterfall | NPP | ||
| Ref | 3 | 2105.1 ± 267.1 | 569.3 ± 75.4 | 2674.4 ± 192.6 a | 2383.4 ± 439.6 | 542.7 ± 26.5 b | 2926.1 ± 458.1 |
| Near | 3 | 595.2 ± 237.6 | 433.0 ± 60.5 | 1028.2 ± 280.8 b | 525.5 ± 195.8 | 672.2 ± 47.6 a,b | 1197.7 ± 160.0 |
| Mid | 3 | 1711.6 ± 395.8 | 734.5 ± 107.3 | 2446.1 ± 303.1 a,b | 1909.3 ± 374.6 | 786.0 ± 39.3 a | 2695.3 ± 357.9 |
| Far | 3 | 1419.2 ± 565.0 | 488.5 ± 29.0 | 1907.7 ± 564.8 a,b | 2031.1 ± 792.2 | 843.1 ± 57.0 a | 2874.2 ± 794.0 |
4. Discussion
5. Couclusions
Acknowledgements
Author Contributions
Conflicts of Interest
References
- Lower Mississippi River Sub-basin Committee on Hypoxia. Lower Mississippi River Sub-basin Nutrient Reduction Strategies; LMRSBC: Washington, DC, USA, 2007.
- King, S.L.; Twedt, D.J.; Wilson, R.R. The role of the wetland reserve program in conservation efforts in the Mississippi River Alluvial Valley. Wildlife Soc. B 2006, 34, 914–920. [Google Scholar] [CrossRef]
- Shelford, V.E. Some lower Mississippi valley flood plain biotic communities: Their age and elevation. Ecology 1954, 35, 126–142. [Google Scholar] [CrossRef]
- Interagency Floodplain Management Review Committee (IFMRC). Sharing the Challenge: Floodplain Management into the 21st Century; Interagency Floodplain Management Review Committee: Washington, DC, USA, 1994.
- Grubaugh, J.W.; Anderson, R.V. Long-term effects on navigation dams on a segment of the upper Mississippi. Regul. Rivers Res. Manag. 1989, 4, 97–104. [Google Scholar] [CrossRef]
- Mitsch, W.J.; Gosselink, J.G. Wetlands, 4th ed.; John Wiley & Sons: Franklin Township, NJ, USA, 2007. [Google Scholar]
- Rudis, V.A. Regional forest fragmentation effects on bottomland hardwood community types and resource values. Landsc. Ecol. 1995, 10, 291–307. [Google Scholar] [CrossRef]
- Fredrickson, L.H. Managing forested wetlands. In Ecosystem Management; Boyce, M.S., Haney, A., Eds.; Yale University: New Haven, CT, USA, 1997; pp. 147–177. [Google Scholar]
- David, M.B.; Drinkwater, L.E.; McIsaac, G.F. Sources of nitrate yields in the Mississippi River Basin. J. Environ. Qual. 2010, 39, 1657–1667. [Google Scholar] [CrossRef] [PubMed]
- Millennium Ecosystem Assessment (MEA). Ecosystems and Human Well-Being: Current State and Trends; Island Press: Washington, DC, USA, 2005. [Google Scholar]
- Costanza, R.; d’Arge, R.; deGroot, R.; Farber, S.; Grasso, M.; Hannon, B.; Limburg, K.; Naeem, S.; O’Neill, R.V.; Paruelo, J.; et al. The value of the world’s ecosystem services and natural capital. Nature 1987, 387, 253–260. [Google Scholar] [CrossRef]
- Farber, S.; Costanza, R.; Childers, D.L.; Erickson, J.; Gross, K.; Grove, M.; Hopkinson, C.S.; Kahn, J.; Pincetl, S.; Troy, A.; et al. Linking ecology and economics for ecosystem management. BioScience 2006, 56, 121–133. [Google Scholar] [CrossRef]
- Boelee, E.; Atapattu, S.; Barron, J.; Bindraban, P.; Bunting, S.W.; Coates, D.; Descheemaeker, K.; Eriyagama, N.; Finlayson, M.; Gordon, L. Ecosystems for Water and Food Security; United Nations Environment Programme: Colombo, Sri Lanka, 2011. [Google Scholar]
- Bratkovich, A.; Dinnel, S.P.; Goolsby, D.A. Variability and prediction of freshwater and nitrate fluxes for the Louisiana-Texas shelf: Mississippi and Atchafalaya River source functions. Estuaries 1994, 17, 766–778. [Google Scholar] [CrossRef]
- Turner, R.E.; Qureshi, N.; Rabalais, N.N.; Dortch, Q.; Justic, D.; Shaw, R.F.; Cope, J. Fluctuating silicate: Nitrate ratios and coastal plankton food webs. Proc. Natl. Acad. Sci. USA 1998, 95, 13048–13051. [Google Scholar] [CrossRef] [PubMed]
- Rabalais, N.N.; Turner, R.E.; Scavia, D. Beyond science into policy: Gulf of Mexico hypoxia and the Mississippi River. BioScience 2002, 52, 129–142. [Google Scholar] [CrossRef]
- Bianchi, T.S.; DiMarco, S.F.; Cowan, J.H., Jr.; Hetland, R.D.; Chapman, P.; Day, J.W.; Allison, M.A. The science of hypoxia in the Northern Gulf of Mexico: A review. Sci. Total Environ. 2010, 408, 1471–1484. [Google Scholar] [CrossRef] [PubMed]
- Robertson, D.M.; Shwarz, G.E.; Saad, D.A.; Alexander, R.B. Incorporating uncertainty into the ranking of SPARROW model nutrient yields from the Mississippi/Atchafalaya River basin watersheds. J. Am. Water Resour. Assoc. 2009, 45, 534–549. [Google Scholar] [CrossRef] [PubMed]
- Goolsby, D.A.; Battaglin, W.A.; Aulenbach, B.T.; Hooper, R.P. Nitrogen input to the Gulf of Mexico. J. Environ. Qual. 2001, 30, 329–336. [Google Scholar] [CrossRef] [PubMed]
- Rabalais, N.N.; Turner, R.E.; Wiseman, W.J., Jr. Hypoxia in the Gulf of Mexico. J. Environ. Qual. 2001, 30, 320–329. [Google Scholar] [CrossRef] [PubMed]
- Horrigan, L.; Lawrence, R.S.; Walker, P. How sustainable agriculture can address the environmental and health harms of industrial agriculture. Environ. Health Perspect. 2002, 110, 445–456. [Google Scholar] [CrossRef] [PubMed]
- Nolan, B.T.; Hitt, K.J.; Ruddy, B.C. Probability of nitrate contamination of recently recharged groundwaters in the conterminous United States. Environ. Sci. Technol. 2002, 36, 2138–2145. [Google Scholar] [CrossRef] [PubMed]
- Junk, W.J.; Bayley, P.B.; Sparks, R.E. The flood pulse concept in river-floodplain systems. J. Can. Fish. Aquat. Sci. 1989, 106, 11–127. [Google Scholar]
- Odum, W.E.; Odum, E.P.; Odum, H.T. Nature’s pulsing paradigm. Estuaries 1995, 18, 547–555. [Google Scholar] [CrossRef]
- Day, J.W., Jr.; Boesch, D.F.; Clairain, E.J.; Kemp, G.P.; Laska, S.B.; Mitsch, W.J.; Orth, K.; Mashriqui, H.; Reed, D.R.; Shabman, L.; et al. Restoration of the Mississippi Delta: Lessons from Hurricanes Katrina and Rita. Science 2007, 315, 1679–1684. [Google Scholar] [CrossRef] [PubMed]
- DeLaune, R.D.; Pezeshki, S.R. Relationship of mineral nutrients to growth of Spartina. alterniflora in Louisiana salt marshes. Northeast Gulf Sci. 1988, 10, 195–204. [Google Scholar]
- Day, J.W., Jr.; Pont, D.; Henzel, P.E.; Ibanez, C. The impacts of sea level rise on the deltas in the Gulf of Mexico and the Mediterranean: The importance of pulsing events to sustainability. Estuaries 1995, 18, 637–647. [Google Scholar] [CrossRef]
- Mitsch, W.J.; Day, J.W., Jr.; Gilliam, J.W.; Groffman, P.M.; Hey, D.L.; Randall, G.W.; Wang, N. Reducing nitrogen loading to the Gulf of Mexico from the Mississippi River Basin: Strategies to counter a persistent ecological problem. BioScience 2001, 51, 373–388. [Google Scholar] [CrossRef]
- Mitsch, W.J.; Day, J.W., Jr.; Zhang, L.; Lane, R. Nitrate-nitrogen retention be wetlands in the Mississippi River Basin. Ecol. Eng. 2005, 24, 267–278. [Google Scholar] [CrossRef]
- Mitsch, W.J.; Day, J.W., Jr. Restoration of wetlands in the Mississippi-Ohio-Missouri (MOM) River Basin: Experience and needed research. Ecol. Eng. 2006, 26, 55–69. [Google Scholar] [CrossRef]
- Cronk, J.K.; Fennessy, M.S. Wetland Plants: Biology and Ecology; Lewis Publishers: New York, NY, USA, 2001. [Google Scholar]
- Kadlec, R.H.; Knight, R.L. Treatment Wetlands; CRC Press: Boca Raton, FL, USA, 1996. [Google Scholar]
- Vannote, R.L.; Minshall, G.W.; Cummins, K.W.; Sedell, J.R.; Cushing, C.E. The river continuum concept. Can. J. Fish. Aquat. Sci. 1980, 37, 130–137. [Google Scholar] [CrossRef]
- Junk, W.J. The flood pulse concept of large rivers: Learning from the tropics. Arch. Hydrobiol. Suppl. 1999, 115, 261–280. [Google Scholar]
- Tockner, K.; Malard, F.; Ward, J.V. An extension of the flood pulse concept. Hydrol. Process. 2000, 14, 2861–2883. [Google Scholar] [CrossRef]
- Lundberg, C.J. Greenhouse Gas Emissions and Nutrient Dynamics in Restored Wetlands of the Mississippi River Basin. Ph.D. Thesis, Southeastern Louisiana University, Hammond, LA, USA, 2012. [Google Scholar]
- Clark, D.A.; Brown, S.; Kicklighter, D.W.; Chambers, J.Q.; Thomlinson, J.R.; Ni, J. Measuring net primary production in forests: Concepts and field methods. Ecol. Appl. 2001, 11, 356–370. [Google Scholar] [CrossRef]
- Conner, W.H.; Gosselink, J.G.; Parrondo, R.T. Comparison of the vegetation of three Louisiana swamp sites with different flooding regimes. Am. J. Bot. 1981, 68, 320–331. [Google Scholar] [CrossRef]
- Shaffer, G.P.; Wood, W.B.; Hoeppner, S.S.; Perkins, T.E.; Zoller, J.; Kandalepas, D. Degadation of baldcypress-water tupelo swamp to marsh and open water in southeastern Louisiana, U.S.A.: An irreversible trajectory? J. Coast. Res. 2009, 54, 152–165. [Google Scholar]
- Megonigal, J.P.; Conner, W.H.; Kroeger, S.; Sharitz, R.R. Aboveground production in southeastern floodplain forests: A test of the subsidy-stress hypothesis. Ecology 1995, 78, 370–384. [Google Scholar]
- Scott, M.L.; Sharitz, R.R.; Lee, L.C. Disturbance in a Cypress-Tupelo wetland: An interaction between thermal loading and hydrology. Wetlands 1985, 5, 53–68. [Google Scholar] [CrossRef]
- Barbour, M.G.; Burk, J.H.; Pitts, W.D. Terrestrial Plant Ecology; The Benjamin/Cummings Publishing Company, Inc.: Menlo Park, CA, USA, 1987. [Google Scholar]
- SYSTAT Software Inc. SYSTAT 11; SYSTAT Software Inc.: Chicago, IL, USA, 2004. [Google Scholar]
- Hinkle, D.E.; Wiersma, W.; Jurs, S.G. Applied Statistics for the Behavioral Sciences, 5th ed.; Houghton Mifflin Company: Boston, MA, USA, 2003. [Google Scholar]
- Day, J.W., Jr.; Westphal, A.; Pratt, R.; Hyfield, E.; Rybczyk, J.; Kemp, G.P.; Day, J.N.; Marx, B. Effects of long-term municipal effluent discharge on the nutrient dynamics, productivity, and benthic community structure of a tidal freshwater forested wetland in Louisiana. Ecol. Eng. 2006, 27, 242–257. [Google Scholar] [CrossRef]
- Conner, W.H.; Day, J.W., Jr. Productivity and composition of a baldcypress-water tupelo site and a bottomland hardwood site in a Louisiana swamp. Am. J. Bot. 1976, 63, 1354–1364. [Google Scholar] [CrossRef]
- Koontz, M.B.; Pezeshki, S.R.; DeLaune, R.D. Nutrient dynamics in a restored wetland. Commun. Soil Sci. Plant Anal. 2014, 45, 609–623. [Google Scholar] [CrossRef]
- Moreno-Mateos, D.; Power, M.E.; Comin, F.A.; Yocktneg, R. Structural and functional loss in restored wetland ecosystems. PLoS Biol. 2012, 10, e1001247. [Google Scholar] [CrossRef] [PubMed] [Green Version]
© 2016 by the authors; licensee MDPI, Basel, Switzerland. This article is an open access article distributed under the terms and conditions of the Creative Commons by Attribution (CC-BY) license (http://creativecommons.org/licenses/by/4.0/).
Share and Cite
Koontz, M.; Lundberg, C.; Lane, R.; Day, J.; Pezeshki, R. Aboveground Net Primary Productivity in a Riparian Wetland Following Restoration of Hydrology. Biology 2016, 5, 10. https://doi.org/10.3390/biology5010010
Koontz M, Lundberg C, Lane R, Day J, Pezeshki R. Aboveground Net Primary Productivity in a Riparian Wetland Following Restoration of Hydrology. Biology. 2016; 5(1):10. https://doi.org/10.3390/biology5010010
Chicago/Turabian StyleKoontz, Melissa, Christopher Lundberg, Robert Lane, John Day, and Reza Pezeshki. 2016. "Aboveground Net Primary Productivity in a Riparian Wetland Following Restoration of Hydrology" Biology 5, no. 1: 10. https://doi.org/10.3390/biology5010010
APA StyleKoontz, M., Lundberg, C., Lane, R., Day, J., & Pezeshki, R. (2016). Aboveground Net Primary Productivity in a Riparian Wetland Following Restoration of Hydrology. Biology, 5(1), 10. https://doi.org/10.3390/biology5010010