Article

Simultaneous Pathoproteomic Evaluation of the Dystrophin-Glycoprotein Complex and Secondary Changes in the mdx-4cv Mouse Model of Duchenne Muscular Dystrophy

1
Department of Biology, Maynooth University, Maynooth, Co. Kildare, Ireland
2
National Institute for Cellular Biotechnology, Dublin City University, Dublin 9, Ireland
3
Department of Physiology II, University of Bonn, Bonn D-53115, Germany
*
Author to whom correspondence should be addressed.
Biology 2015, 4(2), 397-423; https://doi.org/10.3390/biology4020397
Submission received: 5 March 2015 / Accepted: 28 May 2015 / Published: 10 June 2015

Abstract

:
In skeletal muscle, the dystrophin-glycoprotein complex forms a membrane-associated assembly of relatively low abundance, making its detailed proteomic characterization in normal versus dystrophic tissues technically challenging. To overcome this analytical problem, we have enriched the muscle membrane fraction by a minimal differential centrifugation step followed by the comprehensive label-free mass spectrometric analysis of microsomal membrane preparations. This organelle proteomic approach successfully identified dystrophin and its binding partners in normal versus dystrophic hind limb muscles. The introduction of a simple pre-fractionation step enabled the simultaneous proteomic comparison of the reduction in the dystrophin-glycoprotein complex and secondary changes in the mdx-4cv mouse model of dystrophinopathy in a single analytical run. The proteomic screening of the microsomal fraction from dystrophic hind limb muscle identified the full-length dystrophin isoform Dp427 as the most drastically reduced protein in dystrophinopathy, demonstrating the remarkable analytical power of comparative muscle proteomics. Secondary pathoproteomic expression patterns were established for 281 proteins, including dystrophin-associated proteins and components involved in metabolism, signalling, contraction, ion-regulation, protein folding, the extracellular matrix and the cytoskeleton. Key findings were verified by immunoblotting. Increased levels of the sarcolemmal Na+/K+-ATPase in dystrophic leg muscles were also confirmed by immunofluorescence microscopy. Thus, the reduction of sample complexity in organelle-focused proteomics can be advantageous for the profiling of supramolecular protein complexes in highly intricate systems, such as skeletal muscle tissue.

1. Introduction

Although the total number of proteins in contractile tissues is not precisely known [1], the findings from systematic cataloguing studies suggest that several thousand protein species constitute the protein repertoire of the skeletal muscle proteome [2,3,4,5,6]. Importantly, individual skeletal muscles contain a heterogeneous mixture of slow- and fast-twitching fibre types [7] with considerably different protein constellations [8,9,10]. The highly complex and species-selective combination of type I, type IIa, type IIb and type IId/x fibres, as well as a variety of hybrid fibres and satellite cell populations, changes substantially during development, muscle transformation, physiological adaptations, pathological alterations, and the natural aging process [11]. The biochemical diversity of muscles is reflected by an extensive molecular heterogeneity on the level of protein isoform expression patterns. Proteomic surveys indicate that several hundred proteins are differentially expressed in contractile tissue with a differing fibre specification [12,13,14,15]. This includes, especially, the contractile and regulatory elements of the actomyosin apparatus, such as the many isoforms of myosin heavy chains, myosin light chains, actins, troponins and tropomyosins, but also many metabolic enzymes, signalling proteins, and ion-handling proteins [16,17,18].
This molecular heterogeneity and the wide dynamic concentration range of different muscle-associated protein families represent a challenging technical obstacle to the elucidation of the molecular complexity of the skeletal muscle proteome [19]. One potential option to overcome some aspects of these analytical difficulties is the reduction of protein sample complexity through the introduction of pre-fractionation steps in the proteomic workflow [20,21,22]. Organelle proteomic approaches have been successfully applied to studying skeletal muscle tissues [23], including the nucleus [24], the cytosol [25,26], the sarcolemma [27], the sarcoplasmic reticulum [28,29] and mitochondria [30,31,32]. Building on the previous gel-based analysis of the contractile apparatus-depleted fraction from dystrophic muscle [33], we carried out here the comprehensive label-free LC-MS/MS analysis of the microsomal fraction from dystrophin-deficient hind limb muscle. The main underlying objective of this proteomic study was to attempt the simultaneous identification of the dystrophin-glycoprotein complex and the systematic cataloguing of downstream changes in low copy number proteins and their potential involvement in X-linked muscular dystrophy.
Duchenne muscular dystrophy is a monogenic disorder that is characterized by primary abnormalities in the dystrophin gene that cause the almost complete absence of the Dp427 isoform of this membrane cytoskeletal protein in muscle tissues [34]. Animal models of X-linked muscular dystrophy have been instrumental in studying fundamental aspects of the molecular pathogenesis of dystrophinopathies [35,36,37] and the evaluation of experimental treatment strategies [38]. The mdx-4cv mouse is lacking dystrophin due a mutation in exon 53 and exhibits considerably less revertant fibres as compared to the conventional mdx mouse that has a mutation in exon 23 [39,40]. Previous proteomic studies of dystrophic muscles using crude tissue extracts have established a variety of secondary changes in muscular dystrophy, such as alterations in proteins involved in excitation-contraction coupling, ion homeostasis, the contraction-relaxation cycle, signalling, metabolism and the cellular stress response [41,42,43,44,45]. Building on these extensive proteome-wide data sets on global alterations in dystrophin-deficient muscle tissues [46], our new approach has employed the microsomal membrane fraction and identified simultaneously the drastic reduction in the dystrophin-glycoprotein complex and a large number of secondarily affected proteins in X-linked muscular dystrophy in a single subproteomic analytical run.

2. Experimental Section

2.1. Chemicals and Materials

Analytical grade reagents and materials for the mass spectrometry-based proteomic profiling of mdx-4cv versus wild type hind limb muscle were obtained from GE Healthcare (Little Chalfont, UK) and Bio-Rad Laboratories (Hemel-Hempstead, UK). Ultrapure acrylamide stock solutions were attained from National Diagnostics (Atlanta, GA, USA). Sequencing grade modified trypsin and Lys-C were from Promega (Madison, WI, USA). Whatman nitrocellulose transfer membranes were purchased from Invitrogen (Carlsbad, CA, USA). The chemiluminescence substrate and protease inhibitors were obtained from Roche Diagnostics (Mannheim, Germany). Primary antibodies were purchased from Abcam, Cambridge, UK (ab2818 to the fast SERCA1 isoform of the sarcoplasmic reticulum Ca2+-ATPase; ab92721 to myosin light chain isoform MLC2; ab21754 to the β-subunit of tubulin; ab58475 to the α-subunit of the Na+/K+-ATPase; ab88184 to myozenin 1; ab52488 to lactate dehydrogenase, and ab110330 to pyruvate dehydrogenase), Santa Cruz Biotechnology, Dallas, TX, USA (sc-25607 to myoglobin, and sc-32322 to vimentin), NovoCastra, Leica Biosystems, Newcastle Upon Tyne, UK (NCL-Dys2 to the carboxy terminus of dystrophin isoform Dp427) and Novus Biologicals, Cambridge, UK (NBP1-30042 to the matricellular protein periostin). Chemicon International (Temecula, CA, USA) provided peroxidase-conjugated secondary antibodies. For immunofluorescence microscopy, normal goat serum, goat anti-rabbit Alexa Fluor 488, and goat anti-mouse IgG RRX (Rhodamine Red-X) were purchased from Molecular Probes, Life Technologies (Darmstadt, Germany) and Jackson ImmunoResearch (West Grove, PA, USA), respectively. The embedding medium Fluoromount G was from Southern Biotech (Birmingham, AL, USA). A variety of other general chemicals, including bis-benzimide Hoechst-33342, were obtained from Sigma Chemical Company (Dorset, UK).

2.2. Animal Model of X-Linked Muscular Dystrophy

The conventionally used mdx mouse model represents a naturally occurring mutant, in which the primary genetic mutation is a base substitution in exon 23 of the dystrophin gene. This substitution introduces a premature stop codon, and so in analogy to Duchenne patients, the mdx mouse model almost completely lacks the full-length dystrophin isoform Dp427 [37]. However, this study utilised an alternative model of dystrophinopathy, the mdx-4cv mouse [40], which has been generated using N-ethylnitrosourea [47]. Chemical mutagenesis was shown to result in a C to T transition at base 7916 in exon 53, generating an ochre codon [48]. The mdx-4cv model has approximately 10-fold fewer revertant fibres than the mdx model and represents a more precise genocopy of the human pathology [39]. The fact that very few dystrophin-positive revertant fibres exist in mdx-4cv skeletal muscles [49] makes this animal model attractive for the assessment of novel therapeutic approaches. Previous studies have evaluated the efficiency of antisense oligomer-induced exon skipping following intramuscular injections into the mdx-4cv tibialis anterior muscle [50] and determined the stability of dystrophin expression after lentiviral vector injection into neonatal mdx-4cv muscles [51]. The analysis of proteome-wide changes in this animal model should, therefore, provide a comprehensive list of altered proteins that may be useful as therapy-monitoring biomarkers in the future evaluation of new experimental therapies. In order to study differential protein expression patterns due to deficiency in dystrophin, hind leg muscles from 6-month old dystrophic mdx-4cv versus age-matched control C57BL6 mice were studied. Fresh tissue samples were acquired from the Bioresource Unit of the University of Bonn [52]. Cardiac tissues were used for control purposes. The mice were kept under standard conditions according to German and Irish legislation on the use of animals in experimental research. The animals were sacrificed by cervical dislocation and muscle tissues were immediately isolated. The specimens used for proteomic analysis were quick-frozen in liquid nitrogen and stored at −80 °C prior to analysis.

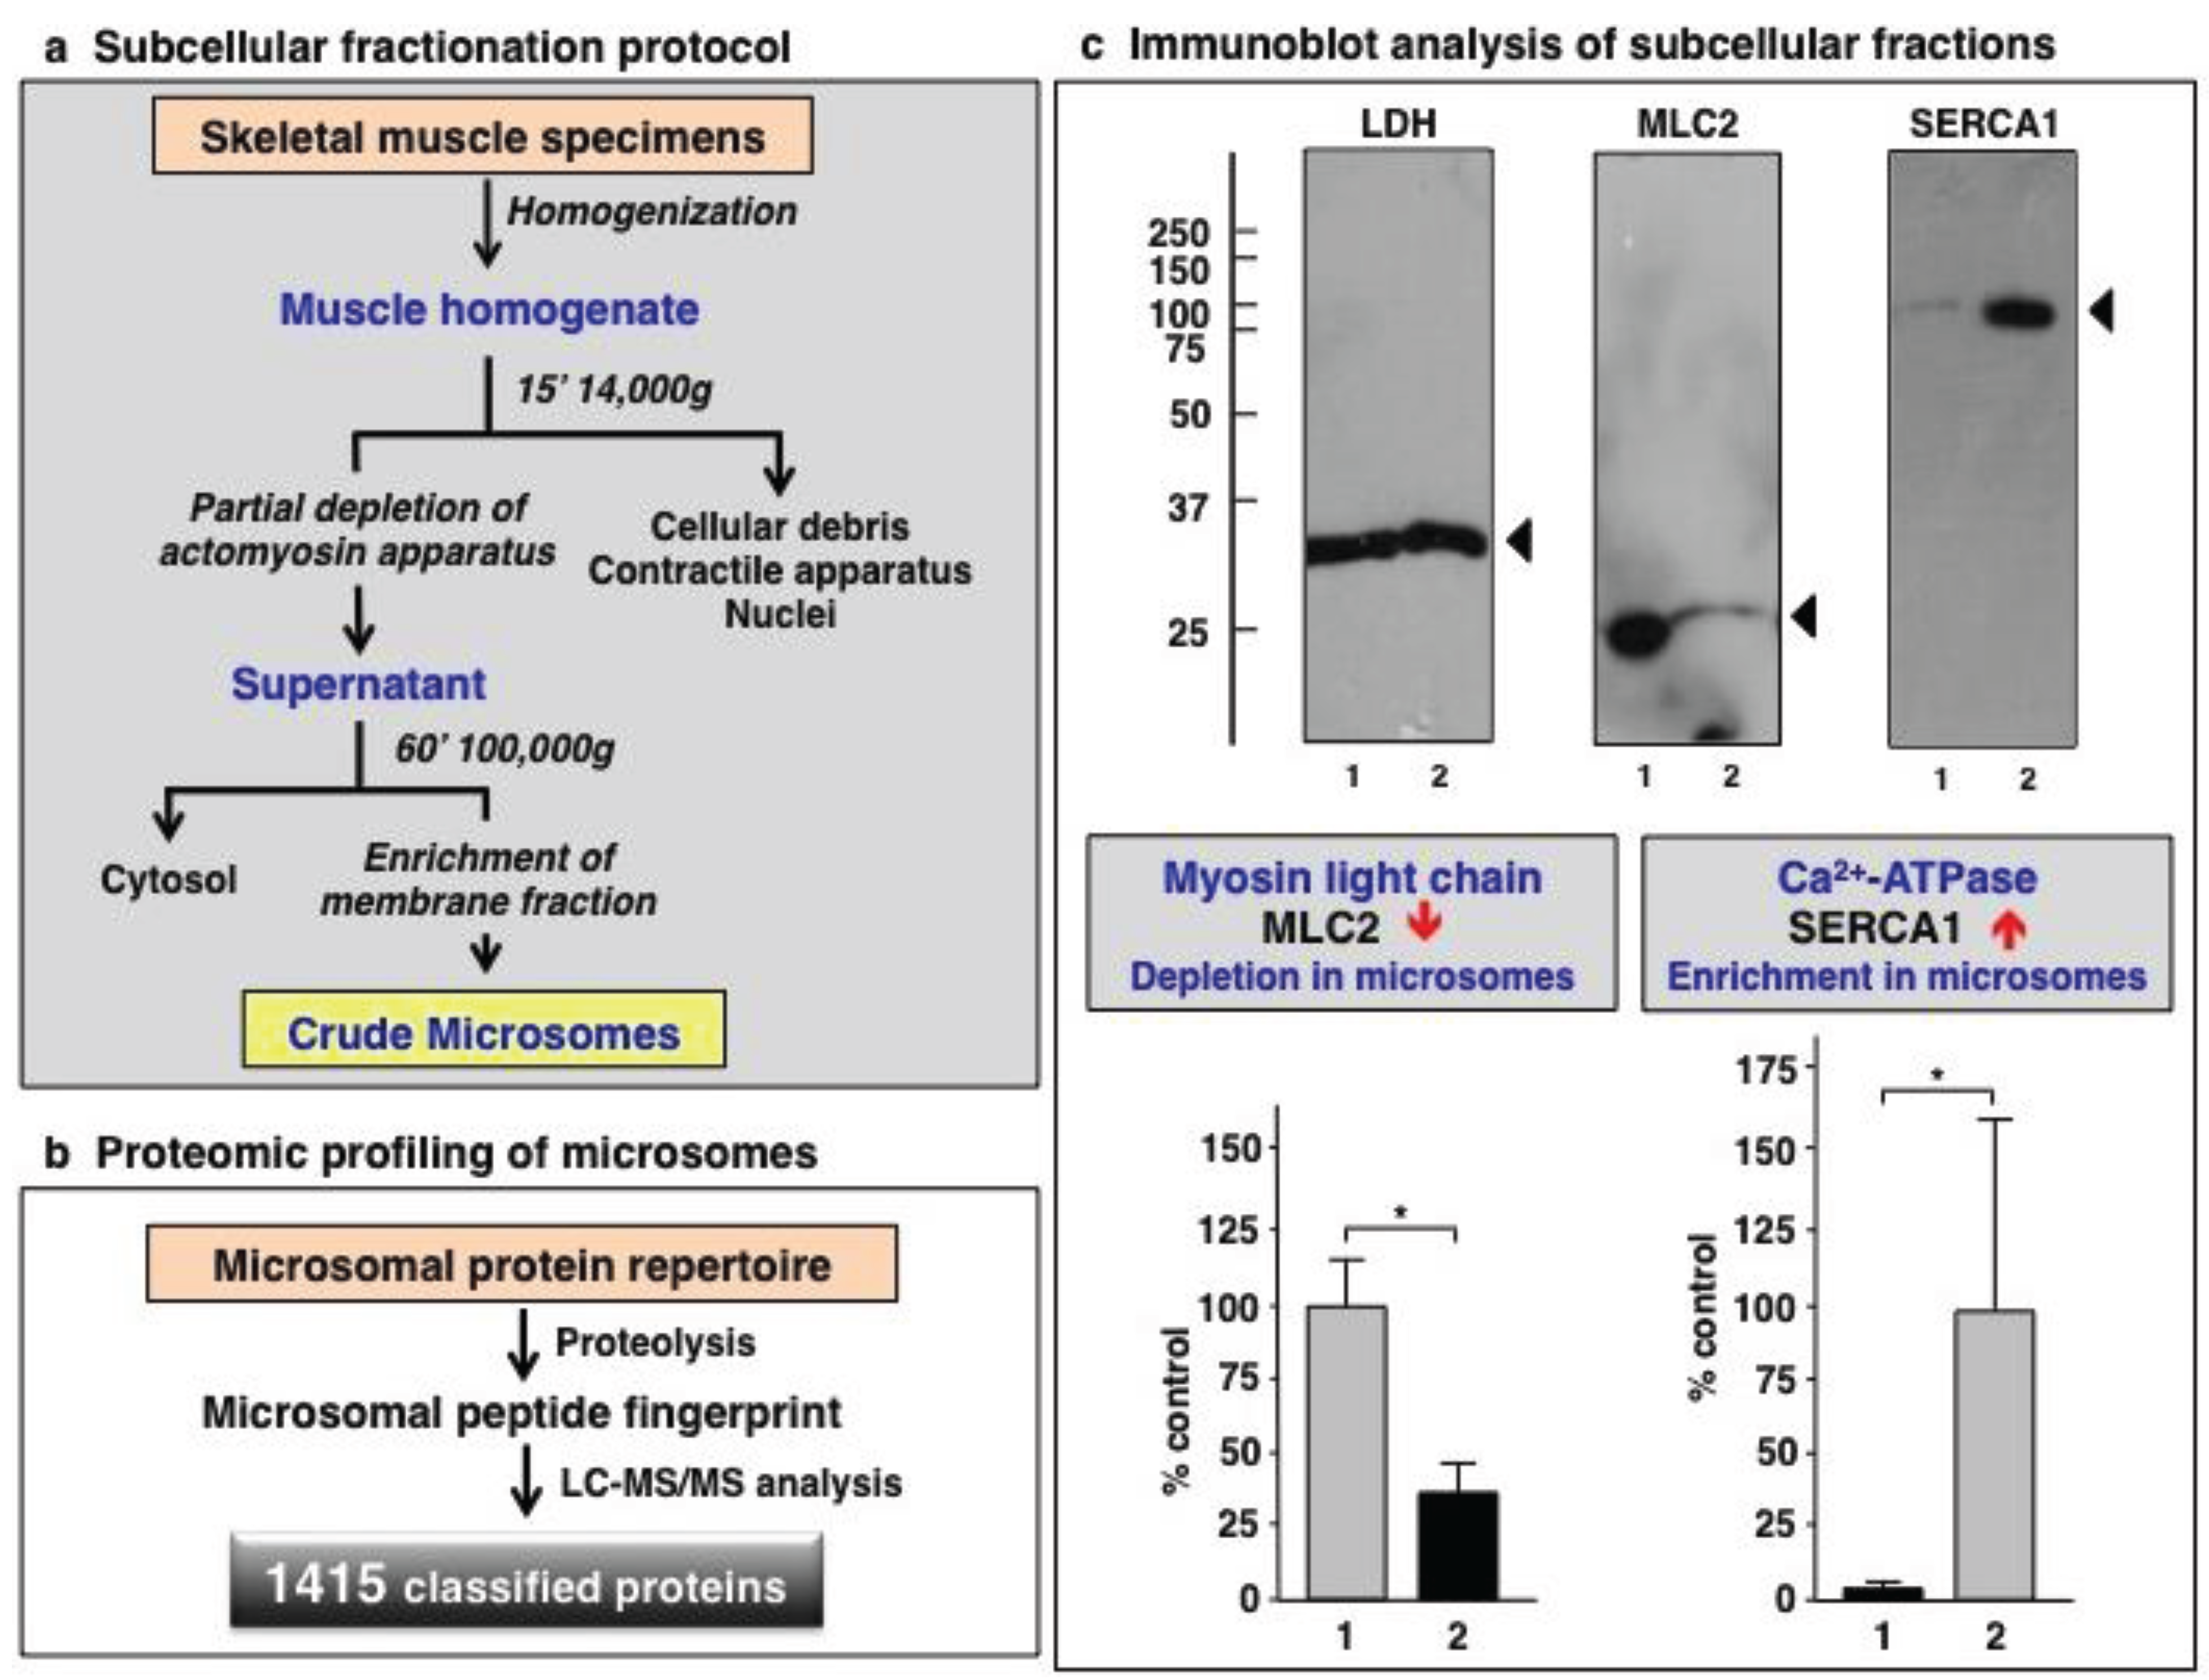
2.3. Subcellular Fractionation of Muscle Homogenates

Since this organelle proteomic study employed a differential centrifugation approach to reduce sample complexity prior to label-free mass spectrometry, a relatively large volume of starting material was a pre-requisite as compared to crude whole tissue proteomics. For this reason, proteomic analysis was conducted on combined muscles from the entire mouse hind limb. The subcellular fractionation of skeletal muscle homogenates was based on previously optimised protocols for the separation of distinct membrane-enriched parts of this highly complex and heterogeneous type of contractile tissue [33]. Muscle specimens (~750 mg wet weight) from the hind leg muscles of 6-month old mdx-4cv mice (n = 4) and age-matched normal mice (n = 4) were finely chopped and homogenised in 10 volumes of homogenisation buffer (20 mM sodium pyrophosphate, 20 mM sodium phosphate, 1 mM MgCl2, 0.303 M sucrose, 0.5 mM EDTA, pH 7.0), using a hand-held IKA T10 Basic Homogeniser (IKA Labortechnik, Staufen, Germany). To prevent degradation of sensitive skeletal muscle proteins, the buffer was supplemented with a protease inhibitor cocktail from Roche Diagnostics [41]. Crude protein extracts were gently shaken at 8 °C for 2 h using a Thermomixer from Eppendorf (Hamburg, Germany). The muscle homogenates were centrifuged at 14,000 g for 15 min at 4 °C. For comparative immunoblotting studies, crude cardiac extracts were isolated by the same procedure using 5-month old normal versus age-matched mdx-4cv hearts. For the isolation of microsomes, the supernatant was pelleted at 100,000 g for 1 h at 4 °C using an Optima L-100 XP ultracentrifuge from Beckman Coulter, Inc. (Fullerton, CA, USA) [33]. Microsomal pellets were resuspended in an appropriate volume of homogenisation buffer and characterized by label-free LC-MS/MS analysis.

2.4. Sample Preparation for Label-Free Liquid Chromatography Mass Spectrometric Analysis

Microsomal fractions were pre-treated with the Ready Prep 2D clean up kit from Bio-Rad Laboratories. The pellets obtained from this procedure were re-suspended in label-free solubilisation buffer (6 M urea, 2 M thiourea, 10 mM Tris, pH 8.0 in LC-MS grade water). Full re-suspension was aided by vortexing and sonication of the protein suspensions [52]. Protein concentrations were determined by the Bradford assay protocol [53]. Protein suspension volumes were initially equalised with label-free solubilisation buffer. Samples were reduced with 10 mM DTT for 30 min at 37 °C and were alkylated with 25 mM iodoacetamide in 50 mM ammonium bicarbonate for 20 min in the dark at room temperature [52]. To quench any unreacted iodoacetamide and thus limit potential alkylation of trypsin, samples were reduced with a further 10 mM DTT for 15 min in the dark at room temperature. Controlled proteolytic digestion was conducted using a combination of the enzymes Lys-C and trypsin. The initial digestion was carried out with sequencing-grade Lys-C at a ratio of 1:100 (protease:protein) for 4 h at 37 °C, followed by dilution with four times the initial sample volume in 50 mM ammonium bicarbonate. Samples were subsequently digested with sequencing-grade trypsin at a ratio of 1:25 (protease:protein) overnight at 37 °C. Digestion was halted by acidification with 2% trifluoroacetic acid (TFA) in 20% acetonitrile (ACN) (3:1 (v/v) dilution). Peptide suspensions were purified using Pierce C18 Spin Columns from Thermo Fisher Scientific (Dublin, Ireland) and the resulting peptide samples were dried through vacuum centrifugation and suspended in loading buffer consisting of 2% ACN and 0.05% TFA in LC-MS grade water. Samples were vortexed and sonicated to ensure an even suspension of peptides.

2.5. Label-Free Liquid Chromatography Mass Spectrometric Analysis

An Ultimate 3000 NanoLC system (Dionex Corporation, Sunnyvale, CA, USA) coupled to a Q-Exactive mass spectrometer (Thermo Fisher Scientific) was used for the label-free liquid chromatography mass spectrometric (LC-MS/MS) analysis of mdx-4cv versus wild type samples. Peptide mixtures (3 µL) were loaded by an autosampler onto a C18 trap column (C18 PepMap, 300 µm id × 5 mm, 5 µm particle size, 100 A pore size; Thermo Fisher Scientific). The trap column was switched on-line with an analytical Biobasic C18 Picofrit column (C18 PepMap, 75 µm id × 50 cm, 2 µm particle size, 100 A pore size; Dionex). Peptides generated from muscle proteins were eluted using the following gradient (solvent B: 80% (v/v) ACN and 0.1% (v/v) formic acid in LC-MS grade water): 0% solvent B for 10.5 min, 2% solvent B for 110 min, 40% solvent B for 2.5 min, 90% solvent B for 9 min and 2% solvent B for 43 min. The column flow rate was set to 0.25 µL/min. Data were acquired with Xcalibur software (Thermo Fisher Scientific). The mass spectrometer was operated in positive mode and data-dependent mode and was externally calibrated. Survey MS scans were conducted in the Q-Exactive mass spectrometer in the 300–1700 m/z range with a resolution of 140,000 (m/z 200) and lock mass set to 445.12003. CID (collision-induced dissociation) fragmentation was carried out with the fifteen most intense ions per scan and at 17,500 resolution. Within 30 s, a dynamic exclusion window was applied. An isolation window of 2 m/z and one microscan were used to collect suitable tandem mass spectra.

2.6. Quantitative Proteomic Profiling by Label-Free LC-MS/MS Analysis

Processing of the raw data generated from LC-MS/MS analysis was carried out using Progenesis QI for Proteomics software (version 3.1; Non-Linear Dynamics, a Waters company, Newcastle upon Tyne, UK). Data alignment was based on the LC retention time of each sample. Any drift in retention time was allowed for, giving an adjusted retention time for all runs in the analysis [54]. The sample run that yielded the most features (peptide ions) was selected as a reference run. The retention times of all the other runs were aligned to this reference run and peak intensities were normalised. The data was filtered using certain criteria prior to exporting the MS/MS data files to Proteome Discoverer 1.4 (Thermo Scientific); (i) peptide features with ANOVA ≤ 0.05 between experimental groups, (ii) mass peaks with charge states from +1 to +5 and (iii) greater than one isotope per peptide [55]. A PepXML generic file was generated from all exported MS/MS spectra from Progenesis software. This file was used for peptide identification using Proteome Discoverer 1.4 against Mascot (version 2.3, Matrix Science, Boston, MA, USA) and Sequest HT (SEQUEST HT algorithm, licence Thermo Scientific, registered trademark University of Washington, USA) and searched against the UniProtKB-SwissProt database (taxonomy: Mus musculus). The following search parameters were used for protein identification: (i) peptide mass tolerance set to 10 ppm, (ii) MS/MS mass tolerance set to 0.02 Da, (iii) up to two missed cleavages were allowed, (iv) carbamidomethylation set as a fixed modification and (v) methionine oxidation set as a variable modification [56]. For re-importation back into Progenesis LC-MS software for further analysis, only peptides with either ion scores of 40.00 or more (from Mascot) and peptides with XCorr scores >1.9 for singly charged ions, >2.2 for doubly charged ions and >3.75 for triply charged ions or more (from Sequest HT) were selected. Importantly, the following criteria were applied to assign a muscle-associated protein as differently expressed: (i) an ANOVA score between experimental groups of 0.05, and (ii) proteins with 2 peptides matched. Standard bioinformatics software programmes were used to group proteins based on their molecular function and to determine potential interaction patterns between altered proteins. These analyses were performed on the total protein content of wild type microsomal extracts, and on the MS-identified proteins with a changed abundance in the microsomal mdx-4cv fractions. This bioinformatics analysis was performed with the PANTHER database of protein families for the cataloguing of molecular functions [57,58] and the STRING database of known and predicted protein interactions that include direct physical and indirect functional protein associations [59,60].

2.7. Verification of Key Proteomic Findings by Comparative Immunoblot Analysis

To illustrate successful isolation of the microsomal fraction from crude muscle homogenates and to authenticate the key findings from the proteomic profiling of the accessible protein constellation of normal versus dystrophic muscle, immunoblotting with antibodies against select muscle proteins was employed. Routine 1D gel electrophoresis and immunoblot analysis was carried out using well-established methods with crude extracts from skeletal and cardiac muscles, as well as microsomal preparations from skeletal muscle [28]. Electrophoretic separation of proteins was performed with standard 10% polyacrylamide gels, followed by wet transfer at 100 V for 70 min at 4 °C to Whatman Protan nitrocellulose sheets in a Transblot Cell from Bio-Rad Laboratories. To prevent non-specific antibody binding, membranes were blocked for 1 h with a milk protein solution (5% (w/v) fat-free milk powder in 10% phosphate-buffered saline). Membranes were incubated with diluted primary antibodies overnight at 4 °C with gentle agitation. The membranes were then washed with the milk protein solution twice for 10 min, followed by incubation for 1 h with peroxidise-conjugated secondary antibodies. The antibody concentrations were optimised to facilitate immunochemical protein detection while preventing non-specific interactions. This was followed by several washing steps with the milk protein solution and with 10% phosphate-buffered saline. Visualisation of antibody-labelled protein bands was achieved using the enhanced chemiluminescence method in accordance with the manufacturer’s guidelines. Densitometric scanning and statistical analysis of immunoblots was executed using a HP PSC-2355 scanner and ImageJ software (NIH, Bethesda, MD, USA) along with Graph-Pad Prism software (San Diego, CA, USA), in which a p value < 0.05 was deemed to be statistically significant.

2.8. Immunofluorescence Microscopy

For the immunofluorescence microscopical comparison of normal versus dystrophic gastrocnemius muscles, freshly dissected tissue specimens were quick-frozen in liquid nitrogen-cooled isopentane and 10 μm sections cut in a cryostat [41]. For routine immuno-labelling, tissue sections were fixed in a 1:1 (v/v) mixture of methanol and acetone for 10 min at room temperature. For dystrophin immuno-staining, unfixed cryosections were boiled in phosphate-buffered saline for 5 min as previously described in detail [61]. Tissue sections were permeabilised in 0.1% (v/v) Triton X-100 for 10 min and then blocked with 1:20 diluted normal goat serum for 30 min at room temperature. Primary antibodies to dystrophin and the Na+/K+-ATPase were diluted 1:20 and 1:10, respectively, in phosphate-buffered saline for overnight incubation at 4 °C. Specimens were carefully washed and then incubated with fluorescently-labelled secondary antibodies, using either 1:200 diluted anti-rabbit Alexa Fluor 488 antibody or 1:200 diluted anti-mouse RRX antibody for 45 min at room temperature. Potential auto-fluorescence was quenched by incubation in 1% (w/v) Sudan Black for 10 min. Nuclei were counter-stained with 1 μg/mL bis-benzimide Hoechst 33342. Antibody-labelled tissue sections were embedded in Fluoromount G medium and viewed under a Zeiss Axioskop 2 epifluorescence microscope equipped with a digital Zeiss AxioCam HRc camera (Carl Zeiss Jena GmbH, Jena, Germany).

3. Results and Discussion

The majority of previous cataloguing or differential profiling studies of skeletal muscle tissues have failed to detect or only partially identified the main members of the dystrophin-glycoprotein complex [46]. This could be at least partially due to (i) the large size of this supramolecular assembly, (ii) its tight association with the muscle surface membrane and (iii) its relatively low abundance as compared to the entire muscle proteome. In fibre extracts, approximately half of the total protein fraction is represented by the actomyosin complex in conjunction with its regulatory proteins including troponins and tropomyosins and a variety of auxiliary filament proteins, such as nebulins, titins, the Z-disc complex and the M-zone assembly [18]. In biochemical studies of the total membrane fraction, the majority of vesicle-associated proteins derive from the abundant cohort of mitochondria and the extensive sarcoplasmic reticulum system with longitudinal tubules and terminal cisternae. On the level of the muscle cytosol, the most plentiful class of proteins are the enzymes that provide the glycolytic pathway [25]. It is, therefore, not surprising that shotgun proteomics of various skeletal muscles has not succeeded in the systematic cataloguing of all members of the dystrophin complex [2,3,4,5] and that comparative studies using total extracts from dystrophic fibres have been unsuccessful in the comprehensive identification of dystrophin and its associated glycoproteins [41,42,43,44,45,62,63]. Alternative strategies have employed extensive purification steps, such as a combination of ion exchange chromatography, lectin agglutination and density gradient centrifugation [27] or immuno precipitation protocols [64,65,66]. The proteomic quantitation of select peptides representing dystrophin within a complex protein mixture has been carried out by combining stable isotope labelled dystrophin as a spike-in standard, one-dimensional gel electrophoretic separation, and mass spectrometry [67]. However, these elaborate purification steps may introduce a large number of potential analytical artefacts prior to mass spectrometric analysis and thus do not allow the proper comparative analysis of secondary alterations downstream from the primary abnormality in muscular dystrophy [19].
To overcome these technical obstacles, we have introduced here a simple pre-fractionation step to enrich the dystrophin complex in the microsomal fraction from normal versus dystrophic muscle preparations. This enabled the simultaneous proteomic evaluation of the reduction in the dystrophin-glycoprotein complex and secondary alterations in the membrane-associated muscle proteome. The mass spectrometry-based proteomic analysis of the crude microsomal fraction obtained from six-month old hind leg muscle from mdx-4cv mice versus age-matched wild type mice revealed new protein changes in a relatively unexplored mouse model of X-linked muscular dystrophy. This included the identification of key members of the dystrophin-glycoprotein complex and various low copy number proteins. Alterations in protein expression were identified by a highly reliable label-free LC-MS/MS approach and significant changes in muscle-associated proteins of interest were verified by immunoblot analysis. Increases in the Na+/K+-ATPase were also confirmed by immunofluorescence microscopy.

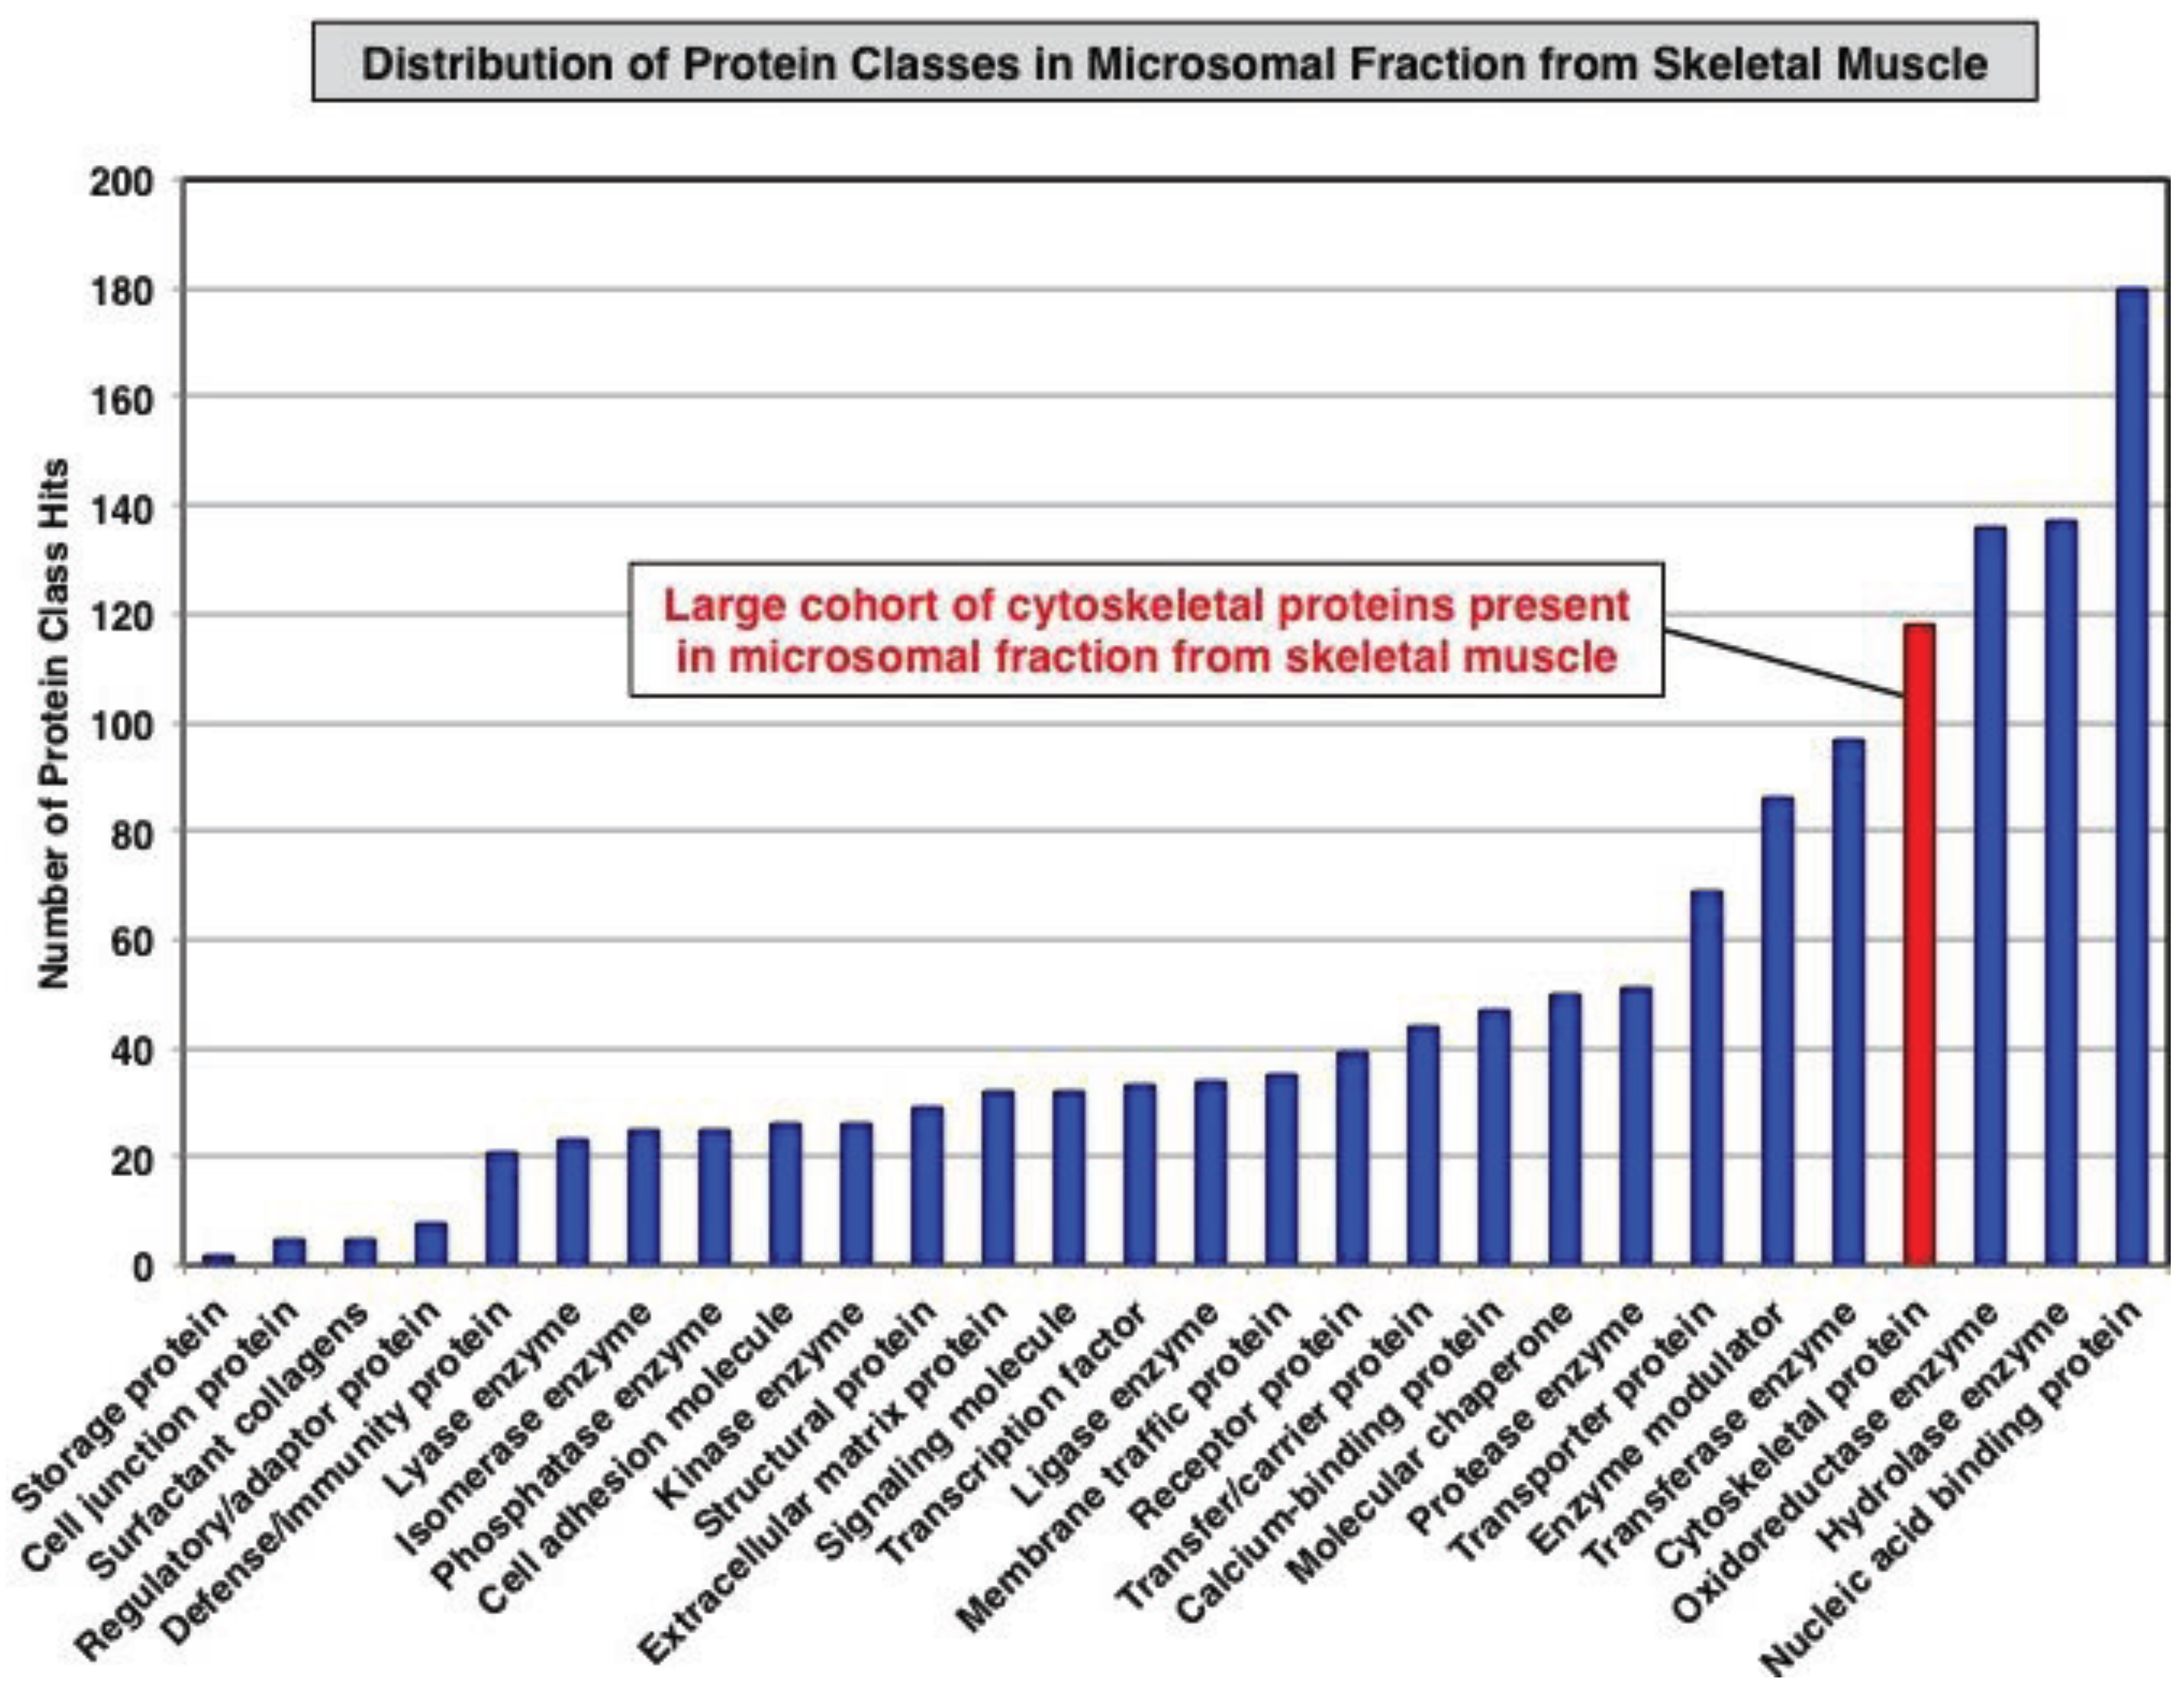
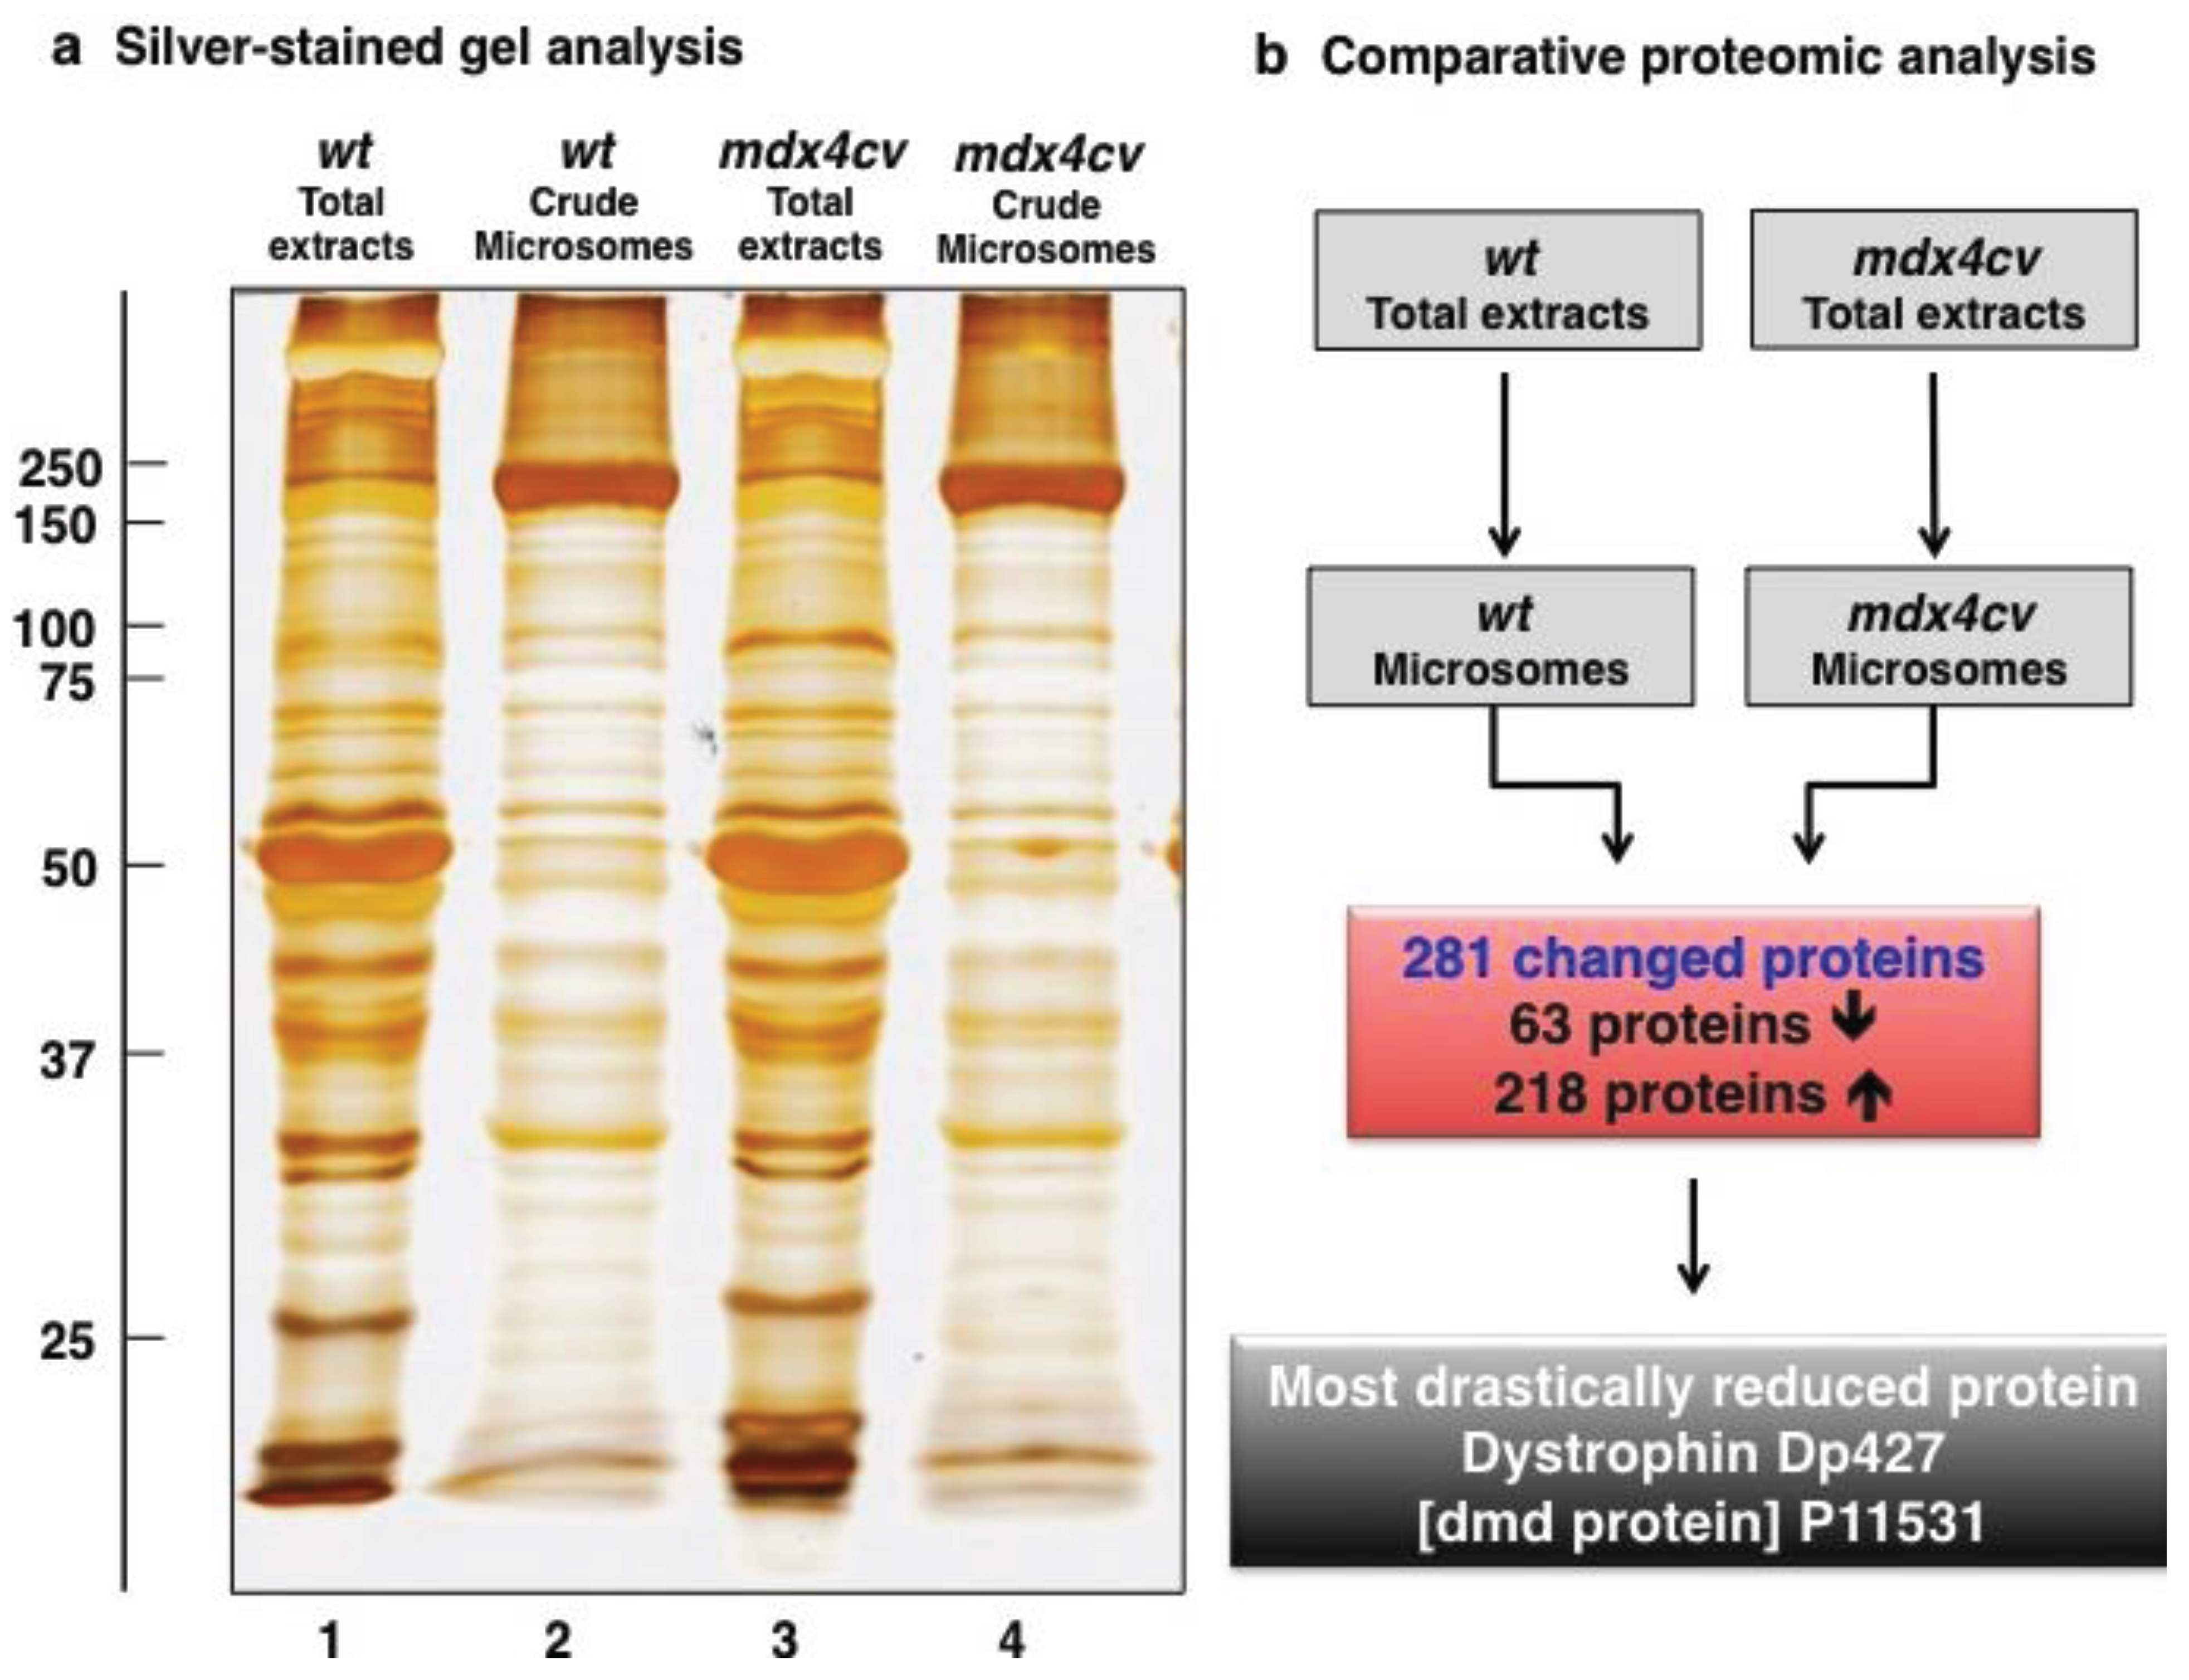
3.1. Organelle Proteomic Analysis of Skeletal Muscle

This study aimed to investigate the suitability of a simple differential centrifugation protocol for the removal of a large portion of the contractile apparatus from the muscle homogenate prior to label-free mass spectrometric analysis. This type of organelle biochemistry usually enables the exploration of low abundance proteins in the hidden proteome [20,21,22], which may otherwise be masked by the highly abundant actomyosin assembly in conventional studies of crude muscle homogenates [19]. Since low copy number proteins may represent important biomarkers of muscular dystrophy [68], the systematic profiling of the deep proteome may improve our detailed understanding of its pathogenesis [69]. The success of this subcellular fractionation technique was evaluated by gel electrophoresis and immunoblotting. The results obtained confirm the removal of a considerable part of the contractile apparatus, leaving behind a microsomal pellet enriched in many membrane-associated protein species. Figure 1 outlines the subcellular fractionation protocol, the proteomic profiling approach and the immunoblot analysis of established protein markers of the contractile apparatus versus the membrane fraction from skeletal muscle. While the MLC2 isoform of myosin light chain [70] was shown to be greatly reduced in the microsomal fraction, the concentration of the fast SERCA1 isoform of the sarcoplasmic reticulum Ca2+-ATPase [71] was clearly increased following differential centrifugation. Hence, immunoblotting clearly demonstrated the partial depletion of the actomyosin apparatus and concomitant enrichment of membrane-associated proteins in the microsomal fraction from skeletal muscle homogenates.
Figure 1. (a) Flowchart of the subcellular fractionation approach used in this proteomic study for the isolation of crude microsomes from skeletal muscle. (b) Overview of the mass spectrometric profiling of the microsomal subproteome. (c) Immunoblot analysis of lactate dehydrogenase (LDH; as loading control), myosin light chain isoform MLC2 and the sarcoplasmic reticulum Ca2+-ATPase isoform SERCA1. Arrowheads indicate immuno-labelled bands. Lanes 1 and 2 represent total muscle extracts and the microsomal fraction, respectively. Graphical presentations show the statistical analysis of immunoblotting of the contractile apparatus marker MLC2 versus the membrane fraction marker SERCA1 (Student’s t-test, unpaired; n = 4; * p < 0.05).
Biology 04 00397 g001
The proteomic classification of the entire microsomal protein repertoire identified 1415 distinct molecular species. As summarized in Figure 2, these proteins fall into a variety of functional classes, such as cell junction proteins, surfactant collagens, regulatory/adaptor proteins, defence/immunity proteins, lyases, isomerases, phosphatases, cell adhesion molecules, kinases structural proteins, extracellular matrix proteins, signalling molecules, transcription factors, ligases, membrane traffic proteins, receptor proteins, transfer/carrier proteins, Ca2+-binding proteins, molecular chaperones, proteases, transporter proteins, enzyme modulators, transferases, cytoskeletal proteins, oxidoreductases, hydrolases and nucleic acid binding proteins. Crucially, a considerable number of cytoskeletal proteins were identified in the microsomal fraction, which makes this membrane-enriched fraction highly suitable for the systematic and simultaneous screening of the molecular fate of the dystrophin-glycoproteins complex and the skeletal muscle subproteome consisting of low abundance components and integral proteins.
Figure 2. Overview of the distribution of protein classes present in the microsomal fraction from skeletal muscle as judged by label-free LC-MS/MS analysis and the bioinformatics listing according to the PANTHER database of protein families for the cataloguing of molecular functions [58].
Biology 04 00397 g002

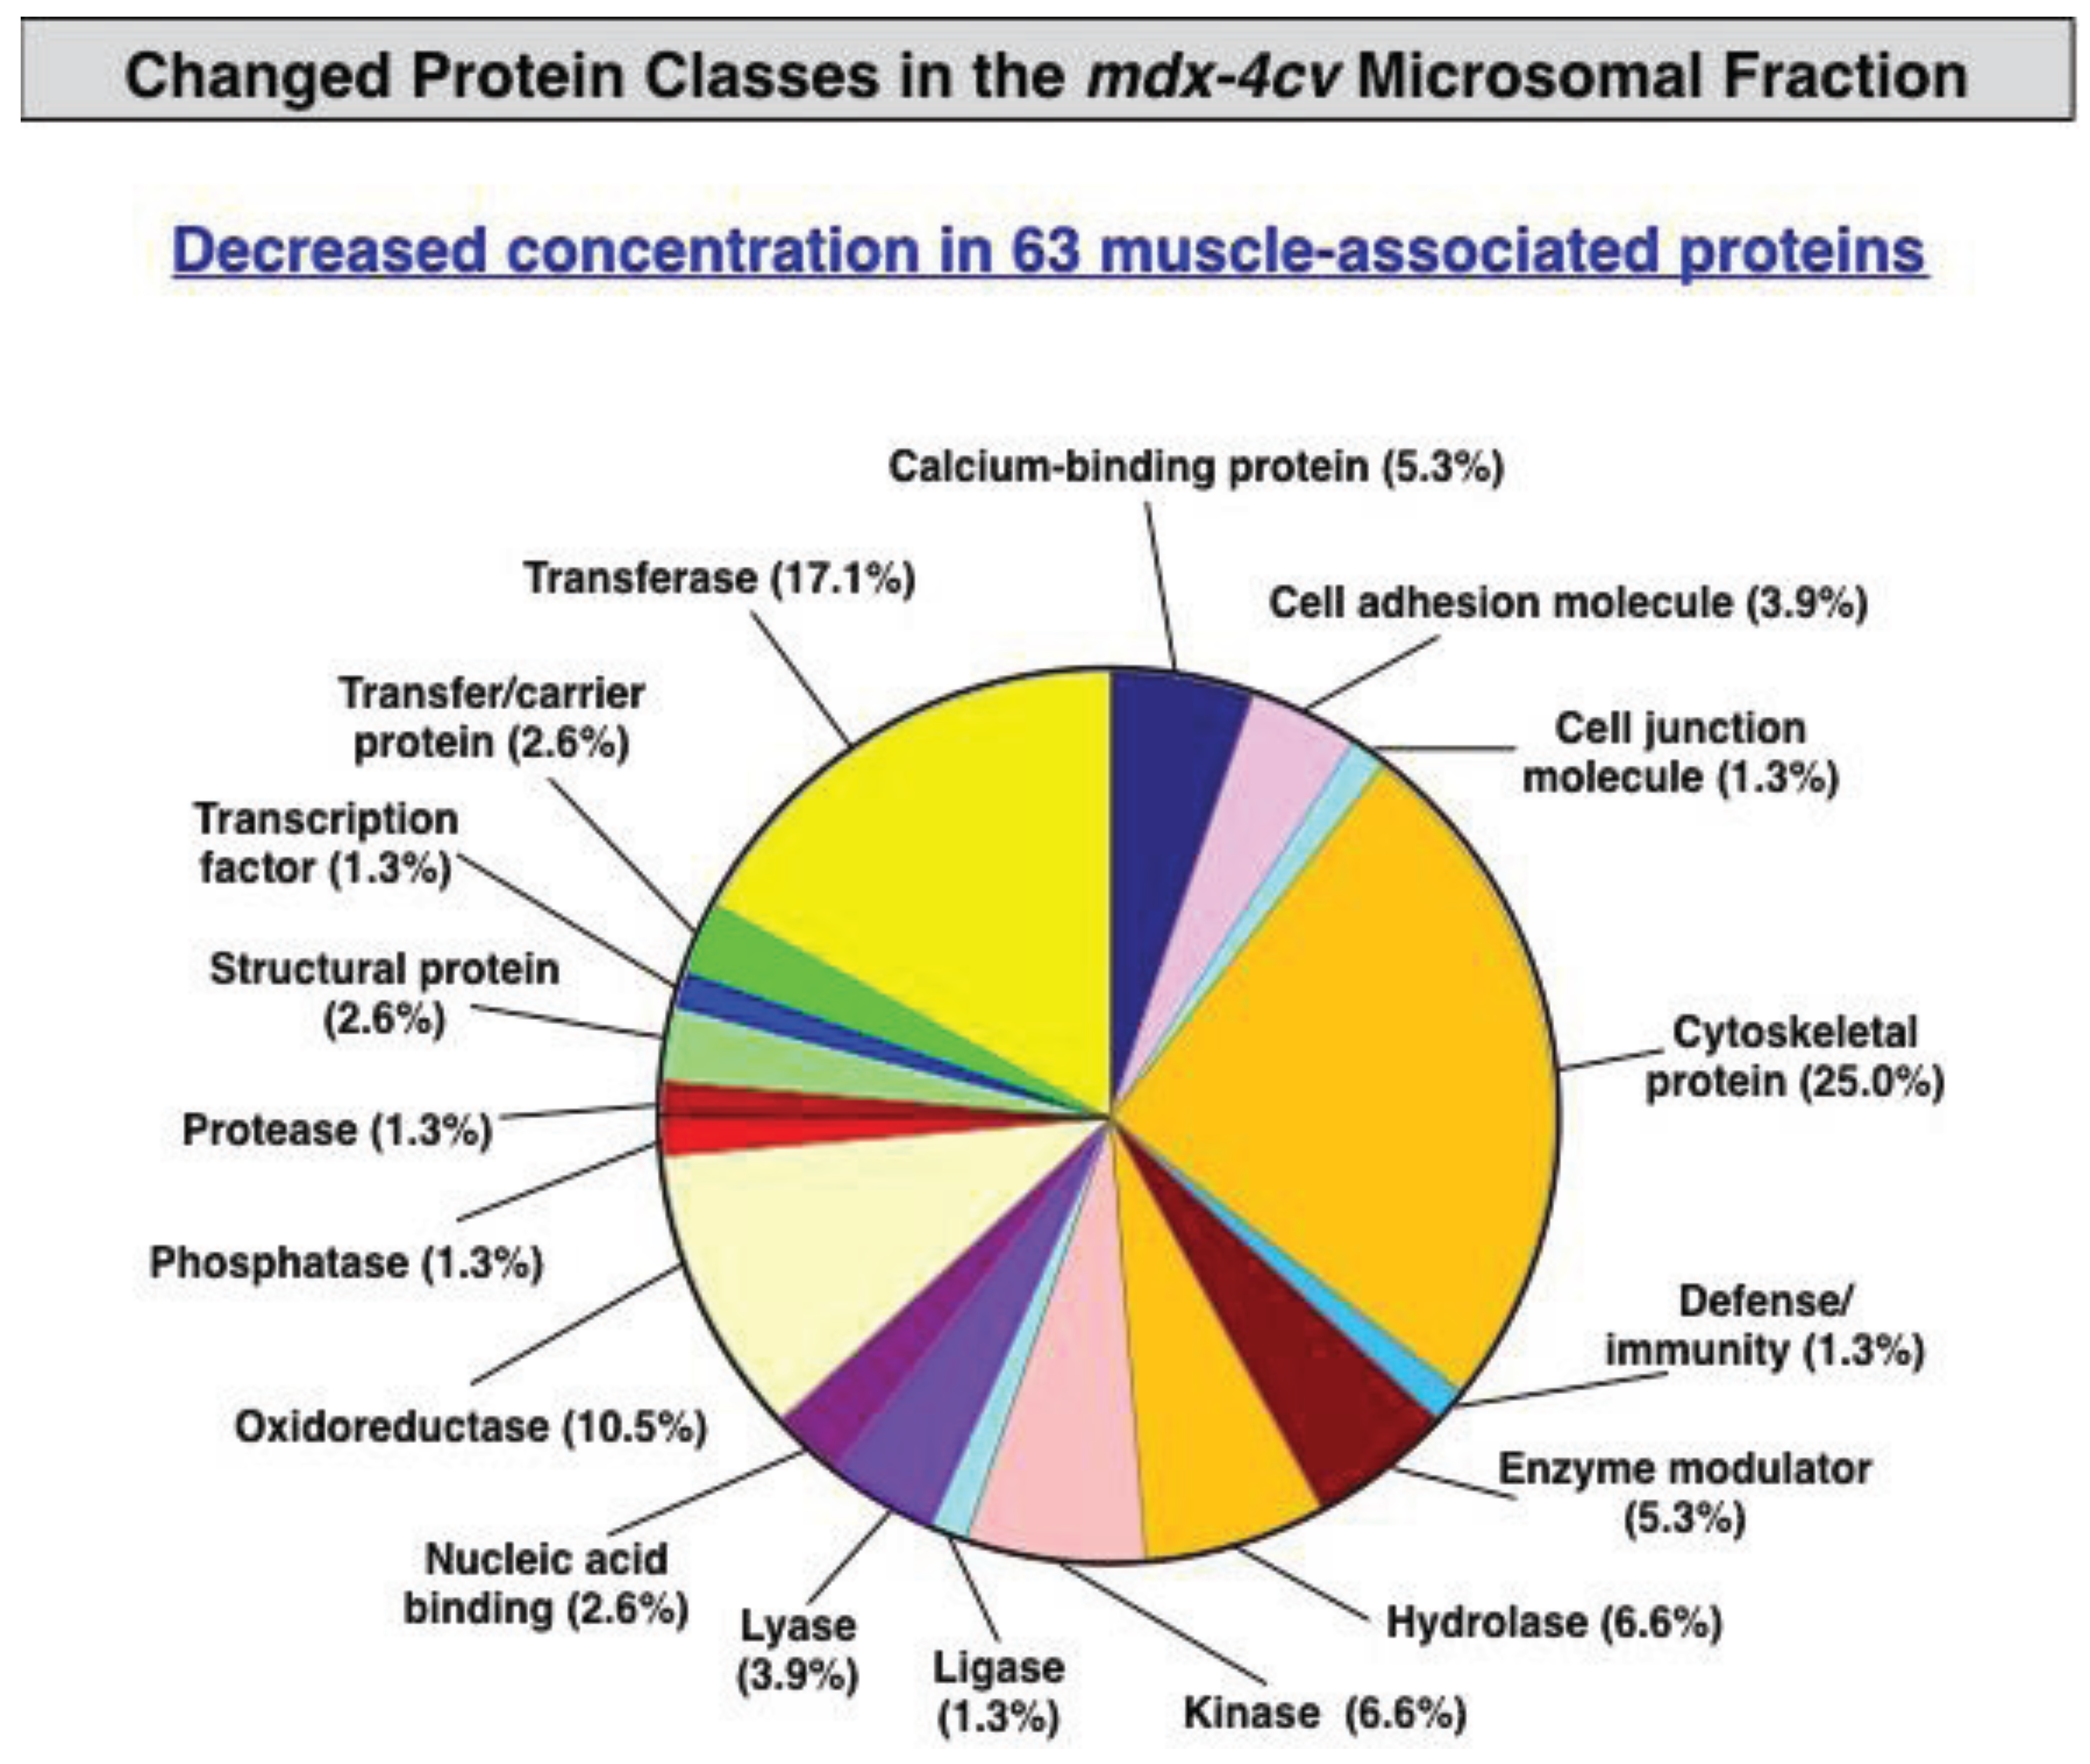
3.2. Label-Free LC-MS/MS Analysis of mdx-4cv versus Wild Type Skeletal Muscle Microsomes

The successful application of differential centrifugation for separating abundant contractile proteins from the microsomal fraction was substantiated by gel electrophoretic analysis. As illustrated in Figure 3, the total tissue extract and the microsomal fraction exhibited clearly different protein banding patterns in silver-stained 1D gels. A label-free LC-MS/MS analysis was conducted with six-month old mdx-4cv samples versus age-matched leg muscle microsomes to investigate differential protein expression patterns between dystrophic and normal skeletal muscle. The proteomic profiling of the microsomal fraction revealed altered concentration levels of 281 proteins in the dystrophic mdx-4cv mouse model. An increased abundance was detected for 218 proteins and a decrease was found for 63 proteins.
Importantly, the most drastically reduced protein in the microsomal fraction from mdx-4cv skeletal muscle was identified as the full-length isoform Dp427 of dystrophin (P11531) [34]. As listed in Table 1 and Table S1 (supplementary material), a variety of components of the dystrophin-associated glycoprotein complex were also clearly identified as being reduced in the mdx-4cv microsomal fraction, including dystroglycan (Q62165), δ-sarcoglycan (P82347), γ-sarcoglycan (P82348) and α1-syntrophin (Q61234) [46]. This is a crucial result as for the first time the primary cause of muscular dystrophy, i.e., the absence of dystrophin and resulting decrease in components of its associated glycoprotein complex, could be determined along downstream abnormalities within the one sample and using a single analytical run. Previous biochemical studies demonstrated the significant reduction of the dystrophin-glycoprotein complex in both mdx skeletal muscles [72] and biopsy specimens from patients afflicted with Duchenne muscular dystrophy [73]. These primary pathobiochemical changes within the cytoskeletal network could now be directly related to potential downstream effects on other cellular mechanisms, functions and structures. Rearrangements in the actomyosin apparatus were reflected by reduced levels of certain myosins and actins, as well as regulatory proteins of the sarcomeric structure. In addition, a variety of metabolic enzymes and metabolite transporters of both anaerobic and oxidative pathways were shown to be of lower concentration in dystrophin-deficient muscle preparations. The analysis of the mdx-4cv microsomal fraction clearly confirmed a reduced abundance of myozenin MYZ-1 (Q9JK37), carbonic anhydrase isoform CA3 (P16015), myoglobin (P04247) the fast isoform of myosin-binding protein MBP-C (Q5XKE0) and myomesin (Q62234) in dystrophin-deficient muscle tissue. This agrees with a variety of previously published proteomic studies, as critically examined in a recent review on the proteomics of the dystrophin-glycoprotein complex and dystrophinopathy [46].
Table 1. List of changed muscle proteins with a reduced concentration of more than 3-fold in the mdx-4cv microsomal fraction (Table S1 in the supplementary materials lists additional proteomic hits).
Accession No.Protein NamePeptide CountConfidence ScoreAnova (p)Fold Change
P11531Dystrophin Dp42715744.35.95E-05–16.01
Q62165Dystroglycan9396.34.50E-06–9.17
Q6P3A82-oxoisovalerate dehydrogenase subunit beta, mitochondrial2172.90.007920–7.24
P68040Guanine nucleotide-binding protein subunit beta-2-like 12113.40.007929–6.53
P51667Myosin regulatory light chain 2, ventricular/cardiac muscle isoform3167.40.037556–6.52
P62737Actin, aortic smooth muscle7407.60.008389–6.19
P501362-oxoisovalerate dehydrogenase subunit alpha, mitochondrial7360.68.15E-05–5.06
Q9Z2I8Succinyl-CoA ligase (GDP-forming) subunit beta, mitochondrial265.40.005705–4.98
P09542Myosin light chain 37435.90.021966–4.68
P82348Gamma-sarcoglycan3139.30.013191–4.08
P53395Lipoamide acyltransferase of branched alpha-keto acid dehydrogenase12531.93.36E-05–3.97
P68134Actin, alpha skeletal muscle267.60.019843–3.85
Q9WUB3Glycogen phosphorylase, muscle form458.30.006224–3.85
P70695Fructose-1,6-bisphosphatase isozyme 210604.80.002383–3.83
Q9CPP6NADH dehydrogenase [ubiquinone] 1 alpha subcomplex subunit 5248.30.027033–3.74
Q91YE8Synaptopodin-24368.30.009175–3.70
Q8K370Acyl-CoA dehydrogenase family member 1011414.00.000992–3.57
Q9JI91Alpha-actinin-28493.80.034239–3.43
Q9JK37Myozenin-15308.70.029472–3.41
O88990Alpha-actinin-3595419.60.008821–3.37
P16015Carbonic anhydrase 3221821.92.98E-05–3.31
O88492Perilipin-42130.31.58E-05–3.29
Q8BVI4Dihydropteridine reductase3206.20.000804–3.28
P6332340S ribosomal protein S122116.90.027770–3.22
Q91ZJ5UTP-glucose-1-phosphate uridylyltransferase201265.22.53E-05–3.16
Q7TPR4Alpha-actinin-1171205.80.011164–3.11
Figure 3. (a) Gel electrophoretic analysis of total muscle extracts (lanes 1 and 3) and the crude microsomal muscle fraction (lanes 2 and 4) from wild type (wt; lanes 1 and 2) versus dystrophic mdx-4cv (lanes 3 and 4) mice. Molecular mass standards (in kDa) are marked to the left of the panel. (b) Overview of the findings from the comparative proteomic analysis of the microsomal fraction from dystrophic versus wild type muscle.
Biology 04 00397 g003
A very large number of muscle-associated proteins were found to be increased in the mdx-4cv animal model of X-linked muscular dystrophy, as listed in Table 2 and Table S2 (supplementary material). This included proteins involved in cell regulation, muscle contraction, metabolite transportation, energy metabolism, maintenance of the extracellular matrix, cytoskeletal network formation, and the cellular stress response. Some of these proteome-wide changes may be compensatory mechanisms to protect the weakened surface membrane system and strengthen the instable cytoskeleton, or reflect secondary pathological changes such as myofibrosis or metabolic disturbances. A select group of these altered proteins may be suitable as indicator candidates for the establishment of a comprehensive and muscle-associated biomarker signature of Duchenne muscular dystrophy [68,69]. The most highly increased protein in dystrophin-deficient hind limb muscle was identified as alpha-1-antitrypsin (Q00898) [74], a major anti-protease, which is probably a multi-functional type of protein [75]. Besides being involved in diminishing the destructive effects of major proteases, alpha-1-antitrypsin exhibits also anti-inflammatory properties [76]. Hence, its up-regulation in muscular dystrophy could be interpreted as both an anti-protease and an anti-inflammatory response. High levels of the matricellular protein periostin (Q62009) agree with remodelling of the extracellular matrix [77]. Another characteristic feature of muscular dystrophy-associated fibrosis appears to be an increase in fibrinogen (Q8VCM7, Q8KOE8). A previous proteomic study had already established an up-regulation of fibrinogen in the aged mdx diaphragm [43] and this was confirmed here to also occur in mdx-4cv hind limb muscle. Increased fibrinogen was shown to affect the TGF-β/alternative macrophage activation pathway in dystrophin-deficient muscle and therefore plays a crucial role in fibrosis [78].
Table 2. List of changed proteins with an increased concentration of more than 5-fold in the mdx-4cv microsomal fraction (Table S2 in the supplementary materials lists additional proteomic hits).
Accession No.Protein NamePeptide CountConfidence ScoreAnova (p)Fold Change
Q00898Alpha-1-antitrypsin 1–56607.12.05E-05158.43
Q61941NAD(P) transhydrogenase, mitochondrial221020.30.00114162.16
Q8C013Trophoblast glycoprotein-like2126.070.01028552.42
Q91WC3Long-chain-fatty-acid-CoA ligase 6267.70.01225732.60
O70152Dolichol-phosphate mannosyltransferase247.50.00036920.15
Q61233Plastin-23145.40.00039318.30
P41317Mannose-binding protein C6527.31.80E-0616.38
Q62351Transferrin receptor protein 16264.20.00305316.02
P16110Galectin-36553.41.05E-0615.93
Q9D154Leukocyte elastase inhibitor A8446.31.45E-0615.48
P09541Myosin light chain 42121.10.00022113.67
Q61878Bone marrow proteoglycan280.30.00085913.43
Q69ZN7Myoferlin291.10.00086412.72
P14434H-2 class II histocompatibility antigen, A–B alpha chain3109.30.00026811.95
Q924X2Carnitine O-palmitoyltransferase 1, muscle isoform266.40.03215010.69
Q62009Periostin4156.50.0009679.92
Q8VCM7Fibrinogen gamma chain3172.55.79E-059.15
Q9DBS1Transmembrane protein 437428.60.0027218.61
Q9CQW9Interferon-induced transmembrane protein 3255.20.0026808.44
Q6PD26GPI transamidase component PIG-S4158.20.0132468.15
Q9DC16Endoplasmic reticulum-Golgi intermediate compartment protein 1 E2134.50.0169337.76
P28665Murinoglobulin-111522.10.0001397.51
P05555Integrin alpha-M6230.60.0005607.39
P09470Angiotensin-converting enzyme10450.20.0011967.28
P14483H-2 class II histocompatibility antigen, A beta chain29.30.0011787.13
Q68FD5Clathrin heavy chain 14158.90.0126827.01
Q9R069Basal cell adhesion molecule4131.20.0001346.98
Q06890Clusterin6271.70.0030516.97
P61620Protein transport protein Sec61 subunit alpha isoform 12115.90.0326576.80
P01898H-2 class I histocompatibility antigen, Q10 alpha chain245.00.0009946.47
Q6IRU2Tropomyosin alpha-4 chain259.50.0019816.39
Q8BMD8Calcium-binding mitochondrial carrier protein SCaMC-1294.80.0180726.30
Q8K0E8Fibrinogen beta chain4221.89.94E-056.28
Q8BMK4Cytoskeleton-associated protein 48529.10.0021086.27
Q9WUQ2Prolactin regulatory element-binding protein245.50.0241086.23
P11835Integrin beta-24327.70.0029316.22
Q9QZF2Glypican-16405.60.0018955.96
Q8C129Leucyl-cystinyl aminopeptidase5240.90.0098795.95
P49290Eosinophil peroxidase11581.40.0108925.67
Q9D7J6Deoxyribonuclease-1-like 12145.70.0295765.65
Q9ERD7Tubulin beta-3 chain296.30.0029345.57
P14426H-2 class I histocompatibility antigen, D–K alpha chain2156.20.0024415.47
P57716Nicastrin2114.60.0060515.43
Q61704Inter-alpha-trypsin inhibitor heavy chain H32123.40.0116445.37
Q60854Serpin B611601.51.68E-065.07
The considerable increase in tubulin (Q9ERD7; Q9D6F9; P99024), vinculin (Q64727) and vimentin (P20152) indicated a restructuring of the dystrophin-lacking cytoskeletal network system in dystrophic fibres [46]. Changed annexin isoforms A1, A2, A4, A5 and A6 (P10107; P07356; P97429; P48036; Q07076) levels strongly implied abnormalities in Ca2+-binding and overall Ca2+-homeostasis, as well as altered membrane organization [79]. Annexin A1 is closely linked to the maintenance of the muscle cytoskeleton and also extracellular matrix integrity [80] and its increased concentration might therefore represent a compensatory mechanism to stabilise the dystrophin-deficient fibre surface. A very interesting new proteomic finding of this label-free approach was the significant increase in a major integral membrane protein of the sarcolemma, the ouabain-sensitive Na+/K+-ATPase. Damaged skeletal muscle fibres appear to compensate abnormal ion fluxes by increasing the availability of this ion pumping protein in order to stabilise the membrane potential over the dystrophin-lacking plasmalemma [81]. The fact that this proteomic analysis was based on liquid chromatography and therefore enabled the detailed analysis of integral proteins, shows that disadvantages of purely gel-based methods can be partially overcome by using alternative protein separation techniques [19,20,21,22,23].

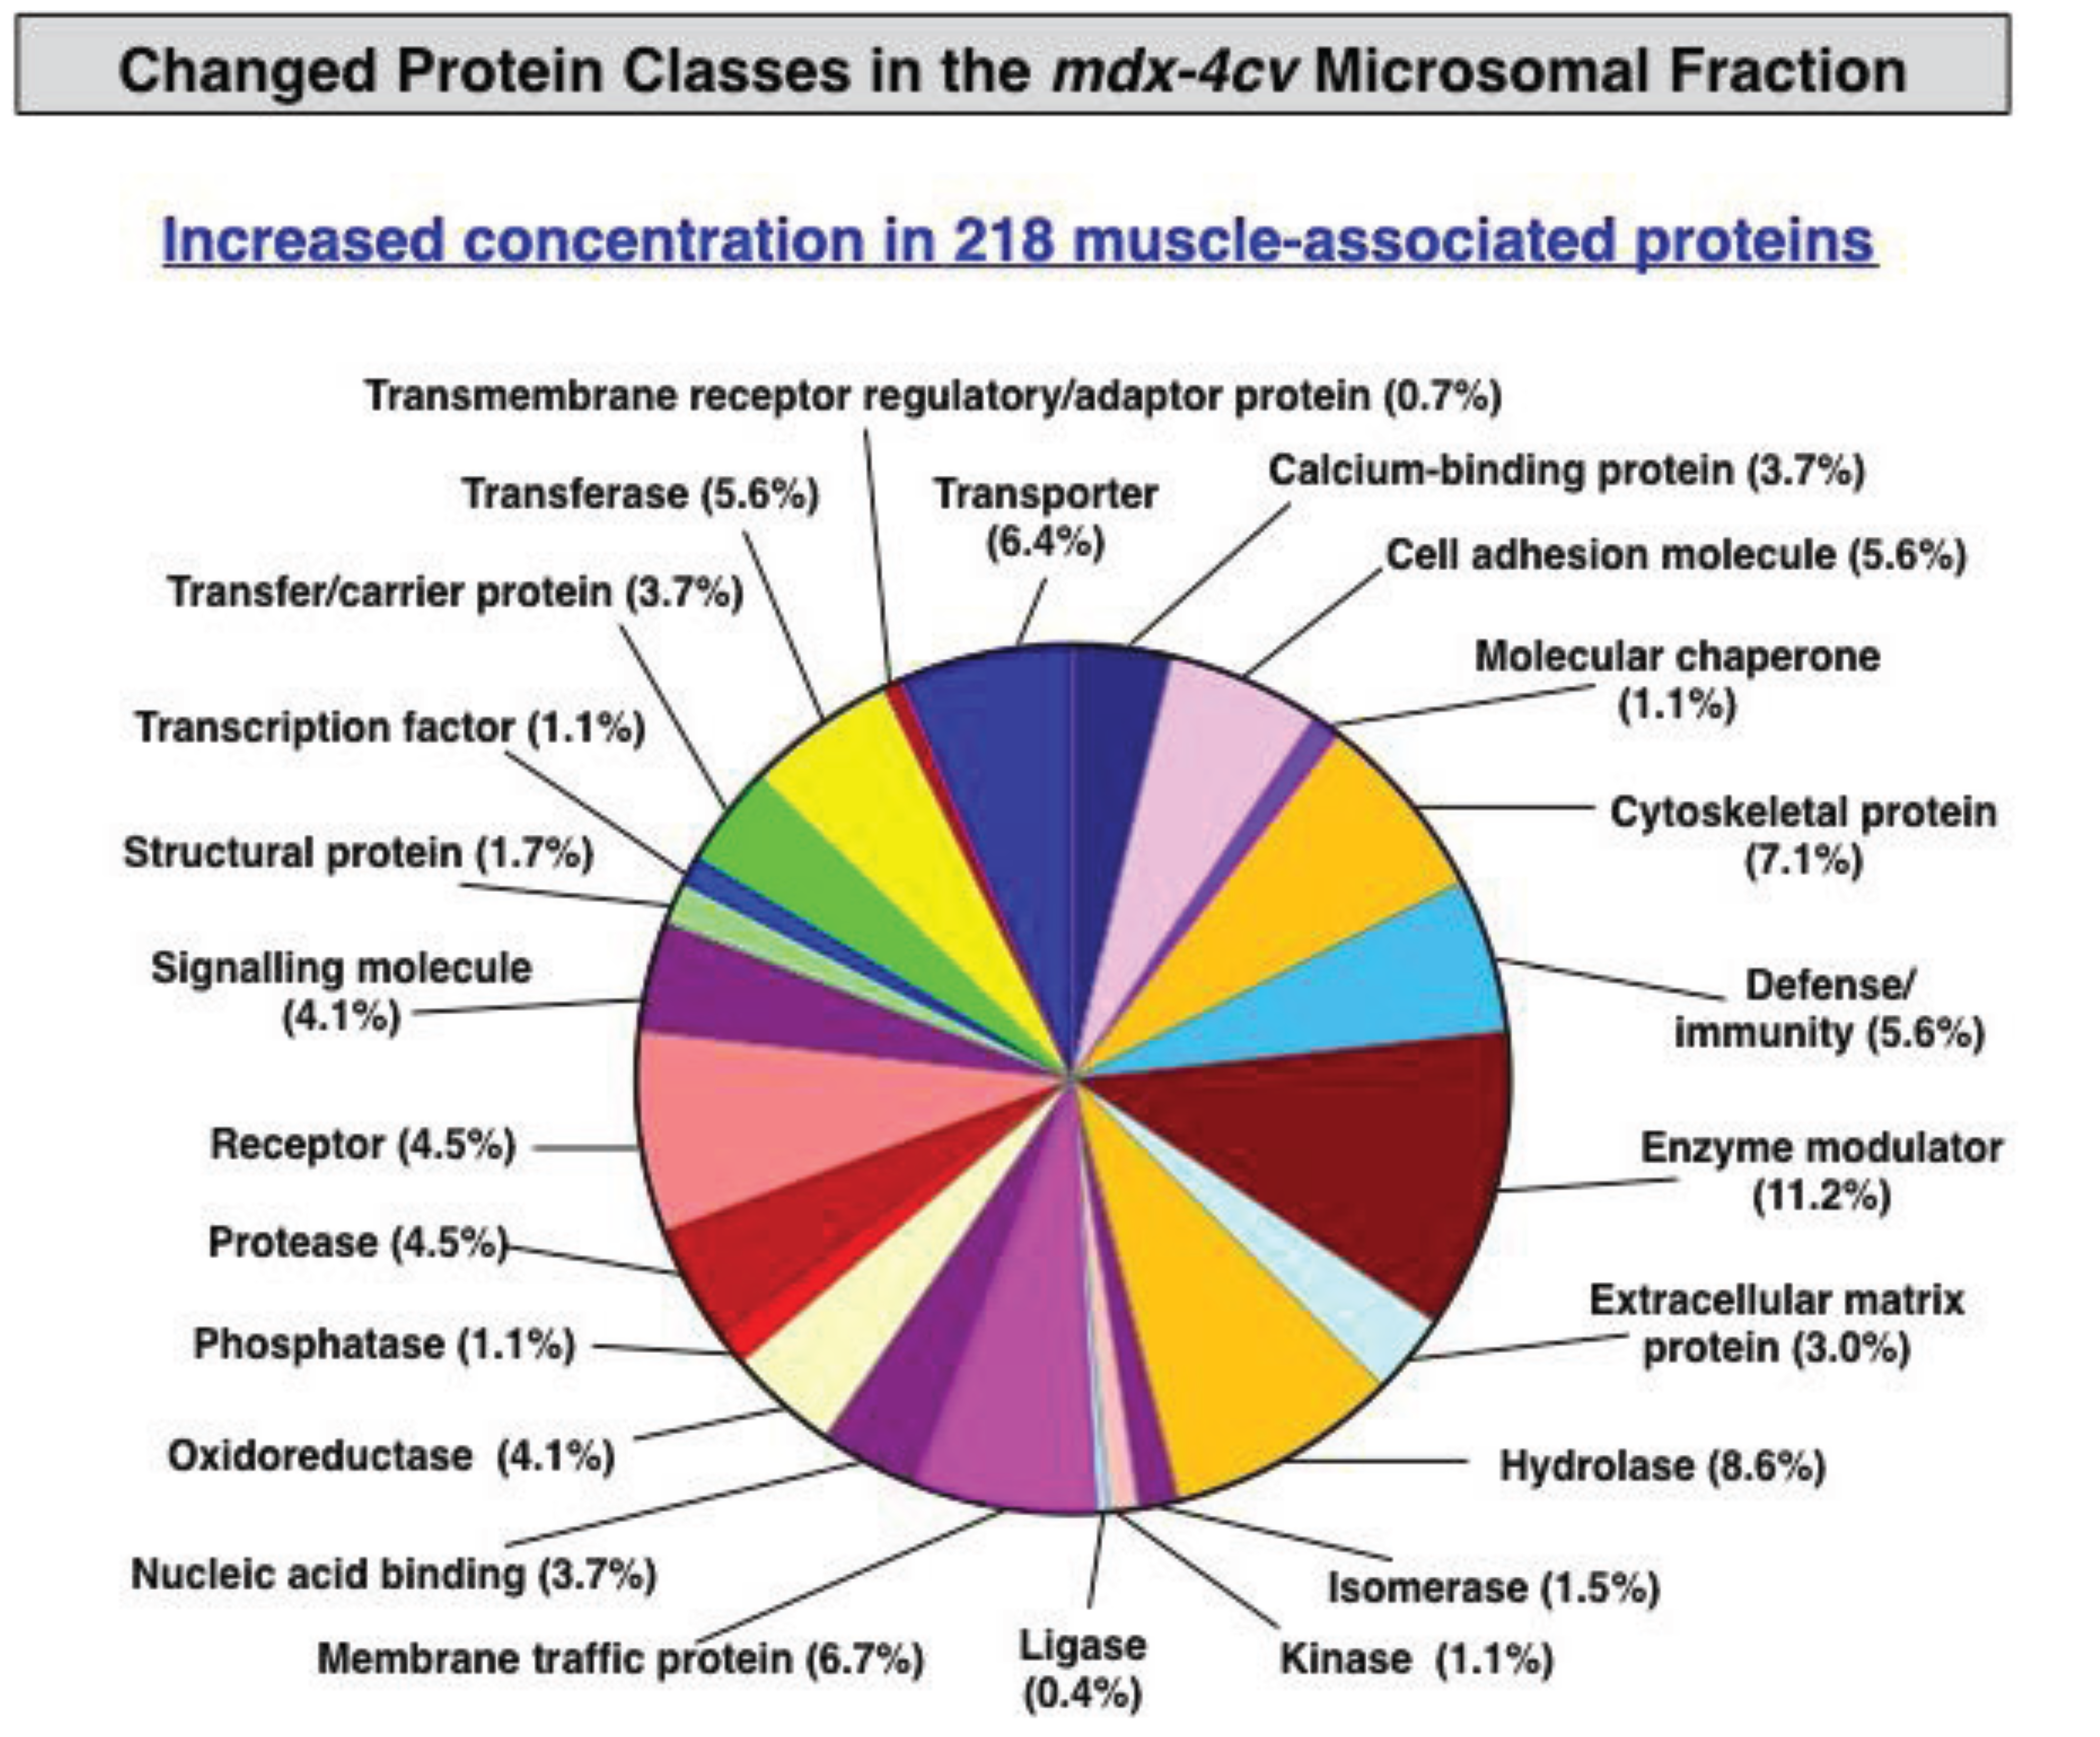
3.3. Bioinformatics Evaluation of the Label-Free LC-MS/MS Analysis of mdx-4cv Muscle Microsomes

The bioinformatics PANTHER database of protein families [58] was used to identify the molecular functions of the newly identified mdx-4cv muscle proteins with an altered abundance in the microsomal fraction. For the microsomal subproteome, the proposed molecular functions were established as follows: Antioxidant activity (0.7%), binding activity (23.2%), catalytic activity (37.2%), enzyme regulator activity (7.8%), nucleic acid binding transcription factor activity (1.4%), protein binding transcription factor activity (0.3%), receptor activity (6.5%), structural molecule activity (15.4%), and transporter activity (7.5%).
Changes in protein classes are presented in Figure 4 and Figure 5, illustrating the large diversity of altered types of protein in muscular dystrophy. Figure 4 displays the distribution of decreased protein classes and Figure 5 shows the increased muscle protein families. The class of cytoskeletal proteins was estimated to cover approximately 11% of the total cohort of changed proteins. Remarkably, a quarter of decreased components were shown to be cytoskeletal proteins (Figure 4), agreeing with the fact that dystrophinopathies are primary diseases of the membrane cytoskeleton. Thus, the deficiency in the full-length dystrophin isoform Dp427 has a significant effect on the entire cytoskeletal network of dystrophic muscle fibres.
The bioinformatics database STRING for determining potential protein-protein interaction networks [59,60] was used to evaluate the patterns of change in direct physical and indirect functional protein interactions. The analysis of mass spectrometrically identified proteins with a changed abundance in mdx-4cv muscle was based on the proteomic data presented in Table 1, Table 2, Table S1 and Table S2. The analysis clearly illustrated the central position of the altered dystrophin-dystroglycan axis and its involvement in muscular dystrophy, as well as the changed interaction patterns between other elements of the cytoskeletal network and the contractile apparatus (Figure S1; supplementary materials).

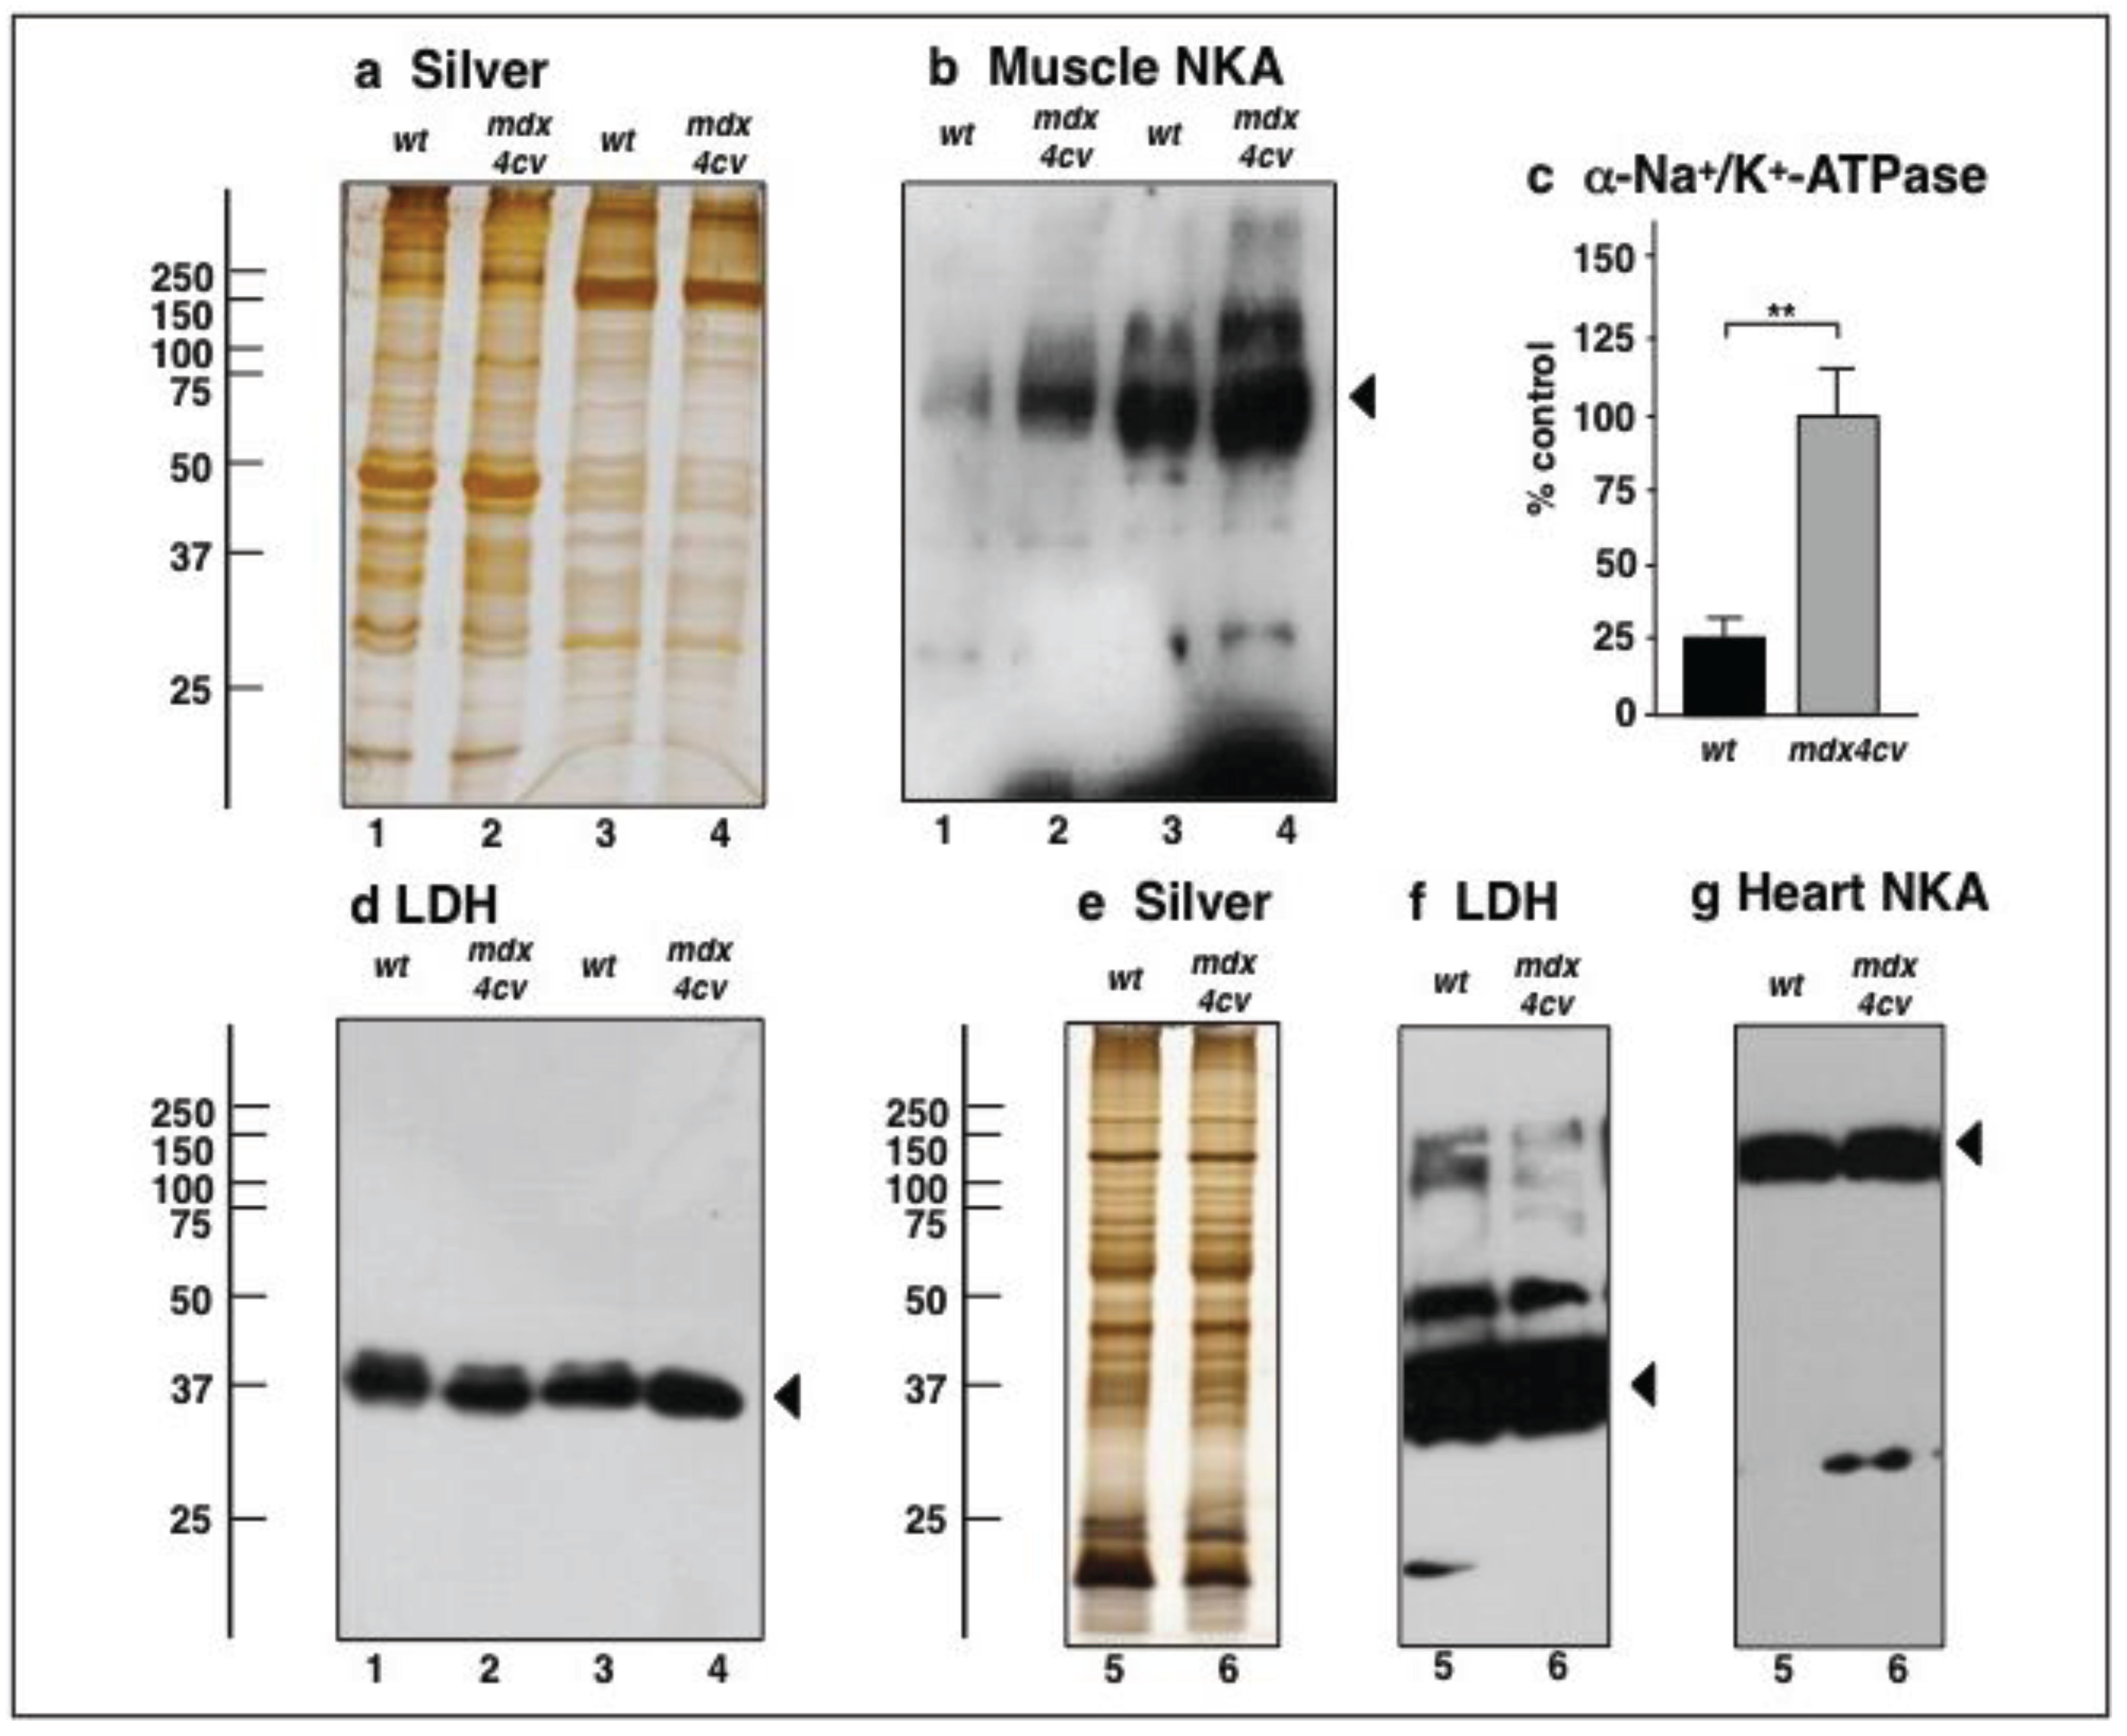
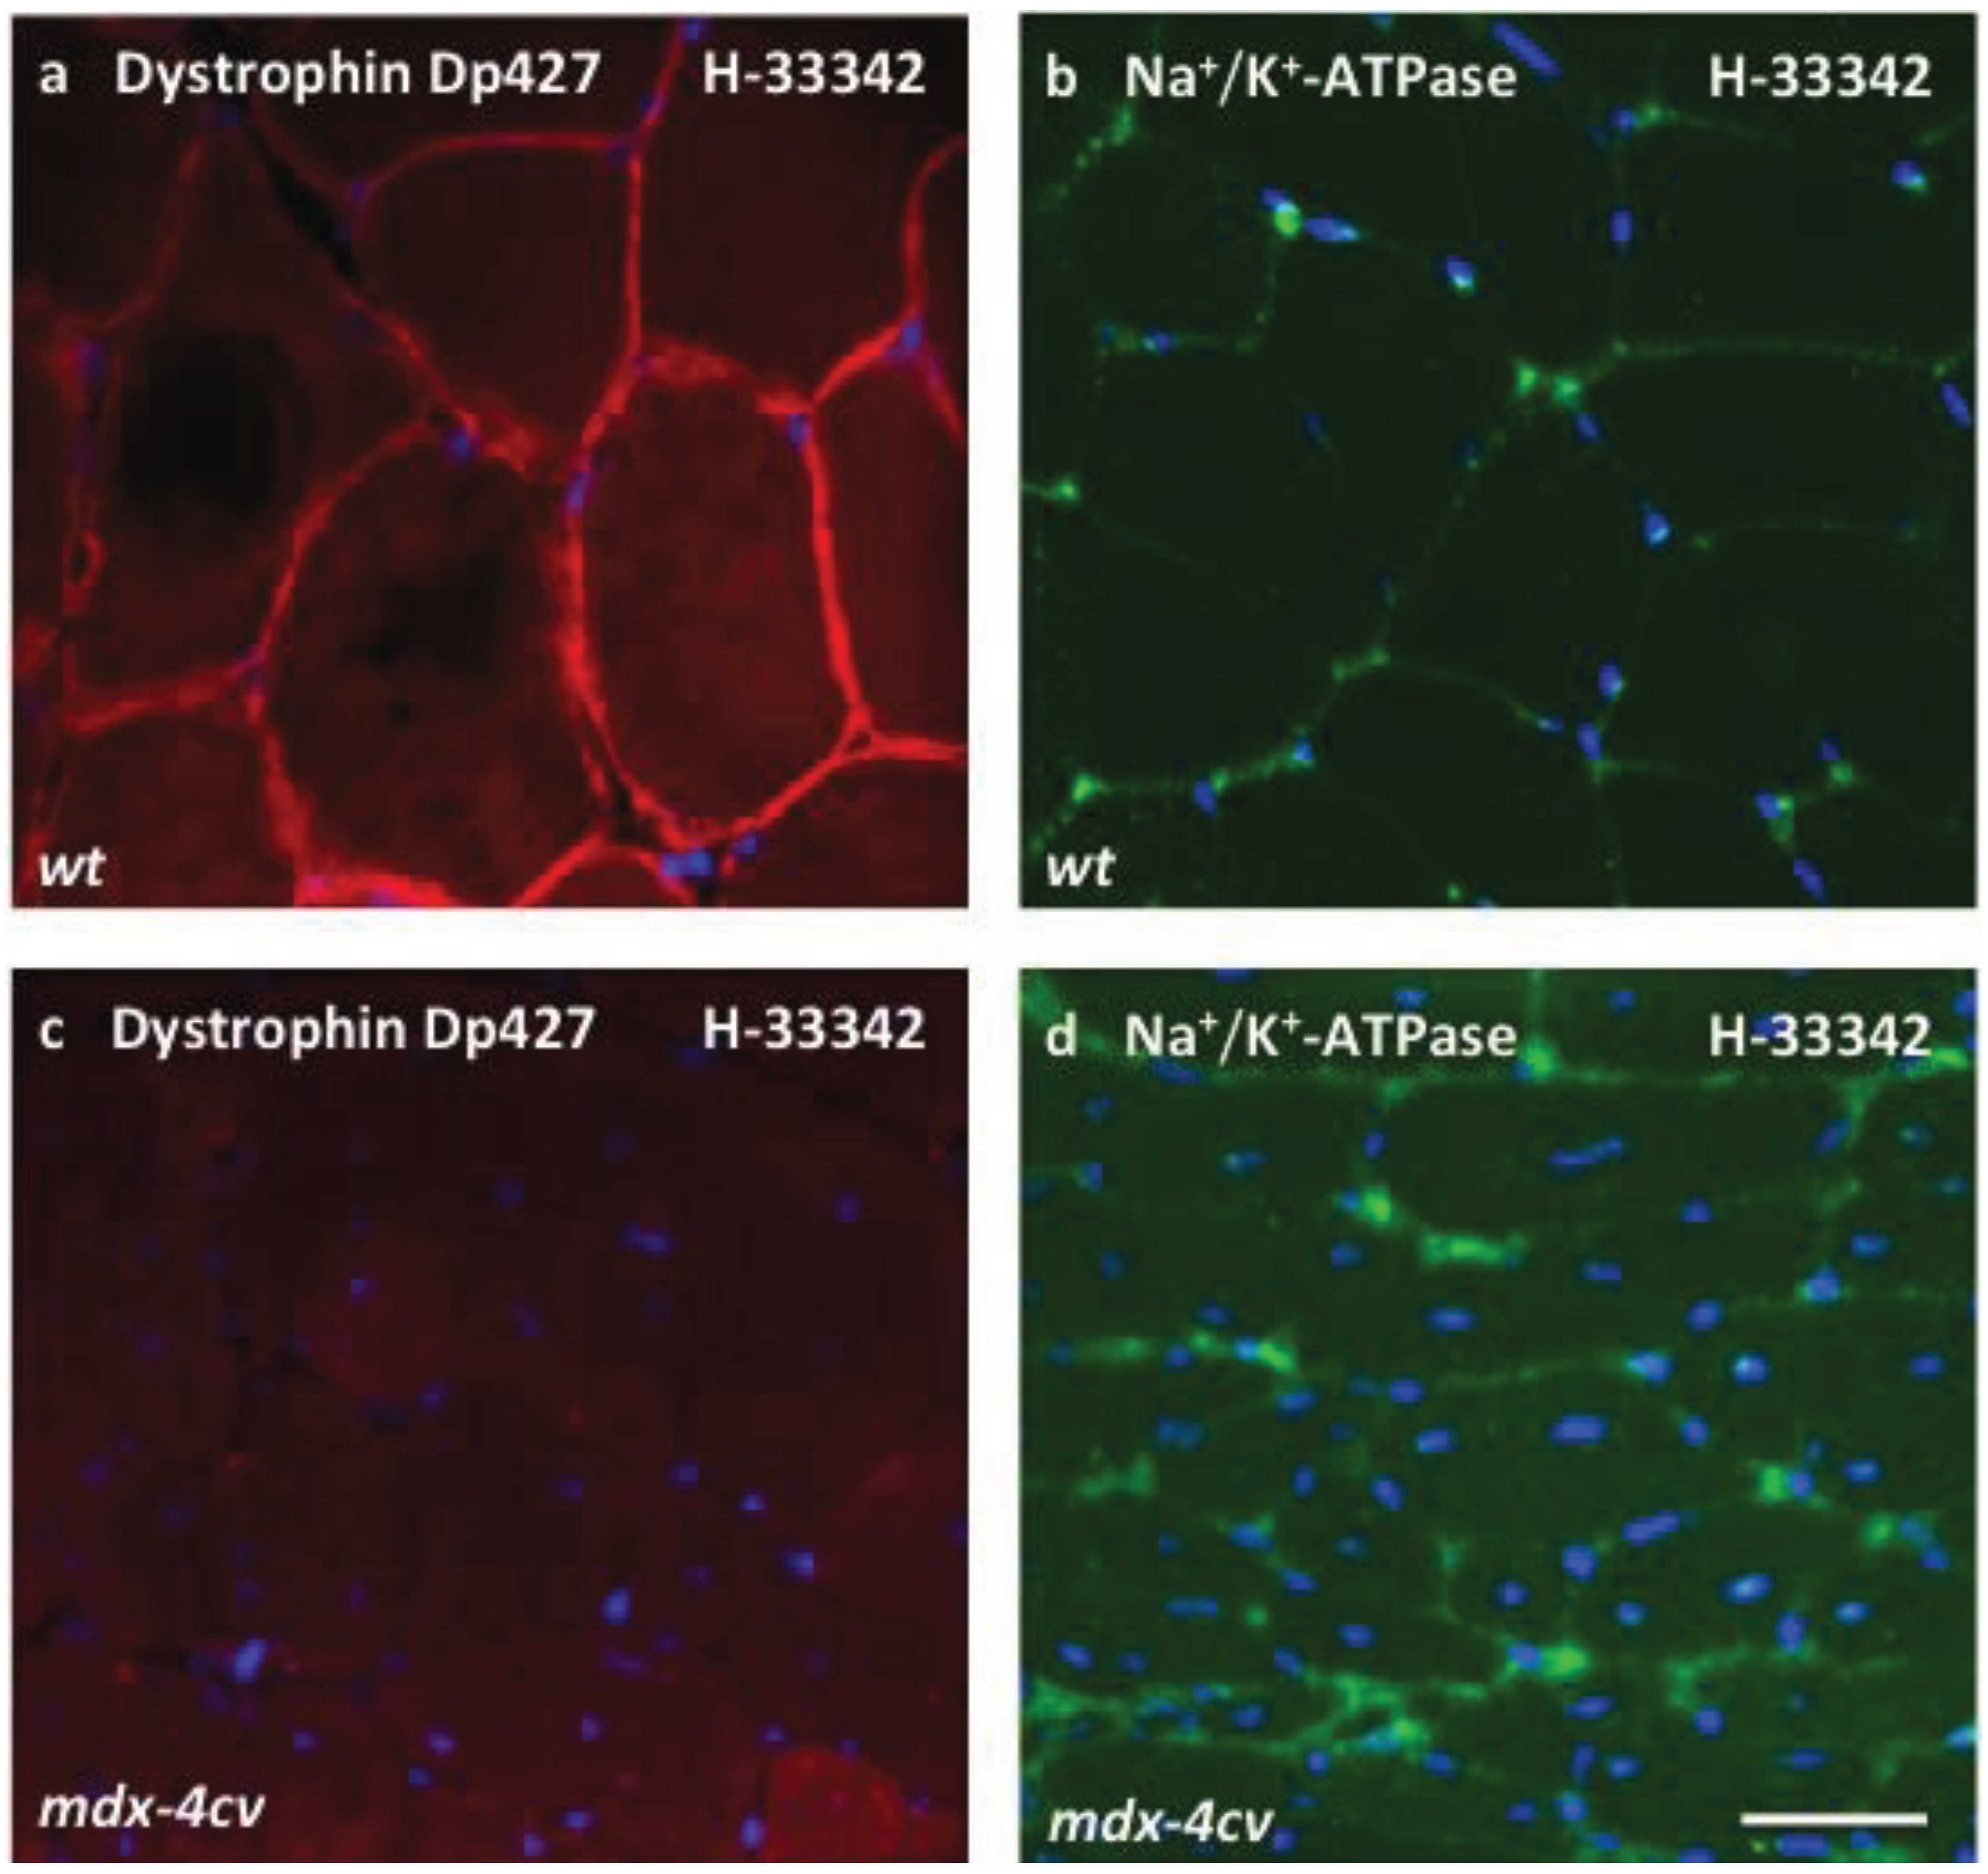
3.4. Verification Analysis of Increased Levels of the Na+/K+-ATPase in mdx-4cv Skeletal Muscle

To demonstrate that the results from organelle proteomics reflect changes in the entire skeletal muscle proteome, immunoblotting was carried out with both total extracts and the microsomal fraction for the evaluation of a major integral membrane protein, the α-subunit of the Na+/K+-ATPase. In agreement with previous biochemical and physiological studies [81], this sarcolemmal protein was shown to be significantly increased in both total tissue extracts and the microsomal fraction from dystrophic skeletal muscle (Figure 6b,c). Immuno-labelling of lactate dehydrogenase was employed as a loading control (Figure 6d). This metabolic enzyme is relatively abundant in muscle tissues and was not identified as being changed in the microsomal fraction from mdx-4cv muscles. It was therefore employed as a convenient loading control in our immunoblotting survey of changed proteins. Importantly, the comparative immunoblot analysis of the Na+/K+-ATPase in normal versus dystrophic cardiac muscle showed no major differences in the density of this ion-pumping protein in the mdx-4cv heart (Figure 6g; supplementary Figure S2). Hence, the apparent up-regulation of the Na+/K+-ATPase appears to be restricted to dystrophic skeletal muscles of the investigated age group of mdx-4cv mice. Findings form immunofluorescence microscopy agreed with both the proteomic survey and the immunoblot analysis presented in this report. As shown in Figure 7, dystrophin-deficient muscle fibres exhibited an increased abundance of the Na+/K+-ATPase in the sarcolemma membrane and also a higher degree of central nucleation. Thus, the increased levels of the Na+/K+-ATPase in the mdx-4cv preparations verify the proteomic findings listed in Table S2 (supplementary materials) and also confirm that label-free mass spectrometry is highly suitable for the comparative analysis of integral membrane proteins from skeletal muscles.
Figure 4. Summary of changed protein classes with a reduced abundance in mdx-4cv hind limb muscle. The bioinformatics software programme PANTHER [57,58] was applied to identify the clustering of protein classes based on the mass spectrometric analysis of the microsomal fraction from dystrophic versus control specimens (Table 1 and Table S1).
Biology 04 00397 g004
Figure 5. Summary of changed protein classes with an increased abundance in mdx-4cv hind limb muscle. The bioinformatics software programme PANTHER [57,58] was applied to identify the clustering of protein classes based on the mass spectrometric analysis of the microsomal fraction from dystrophic versus control specimens (Table 2 and Table S2).
Biology 04 00397 g005

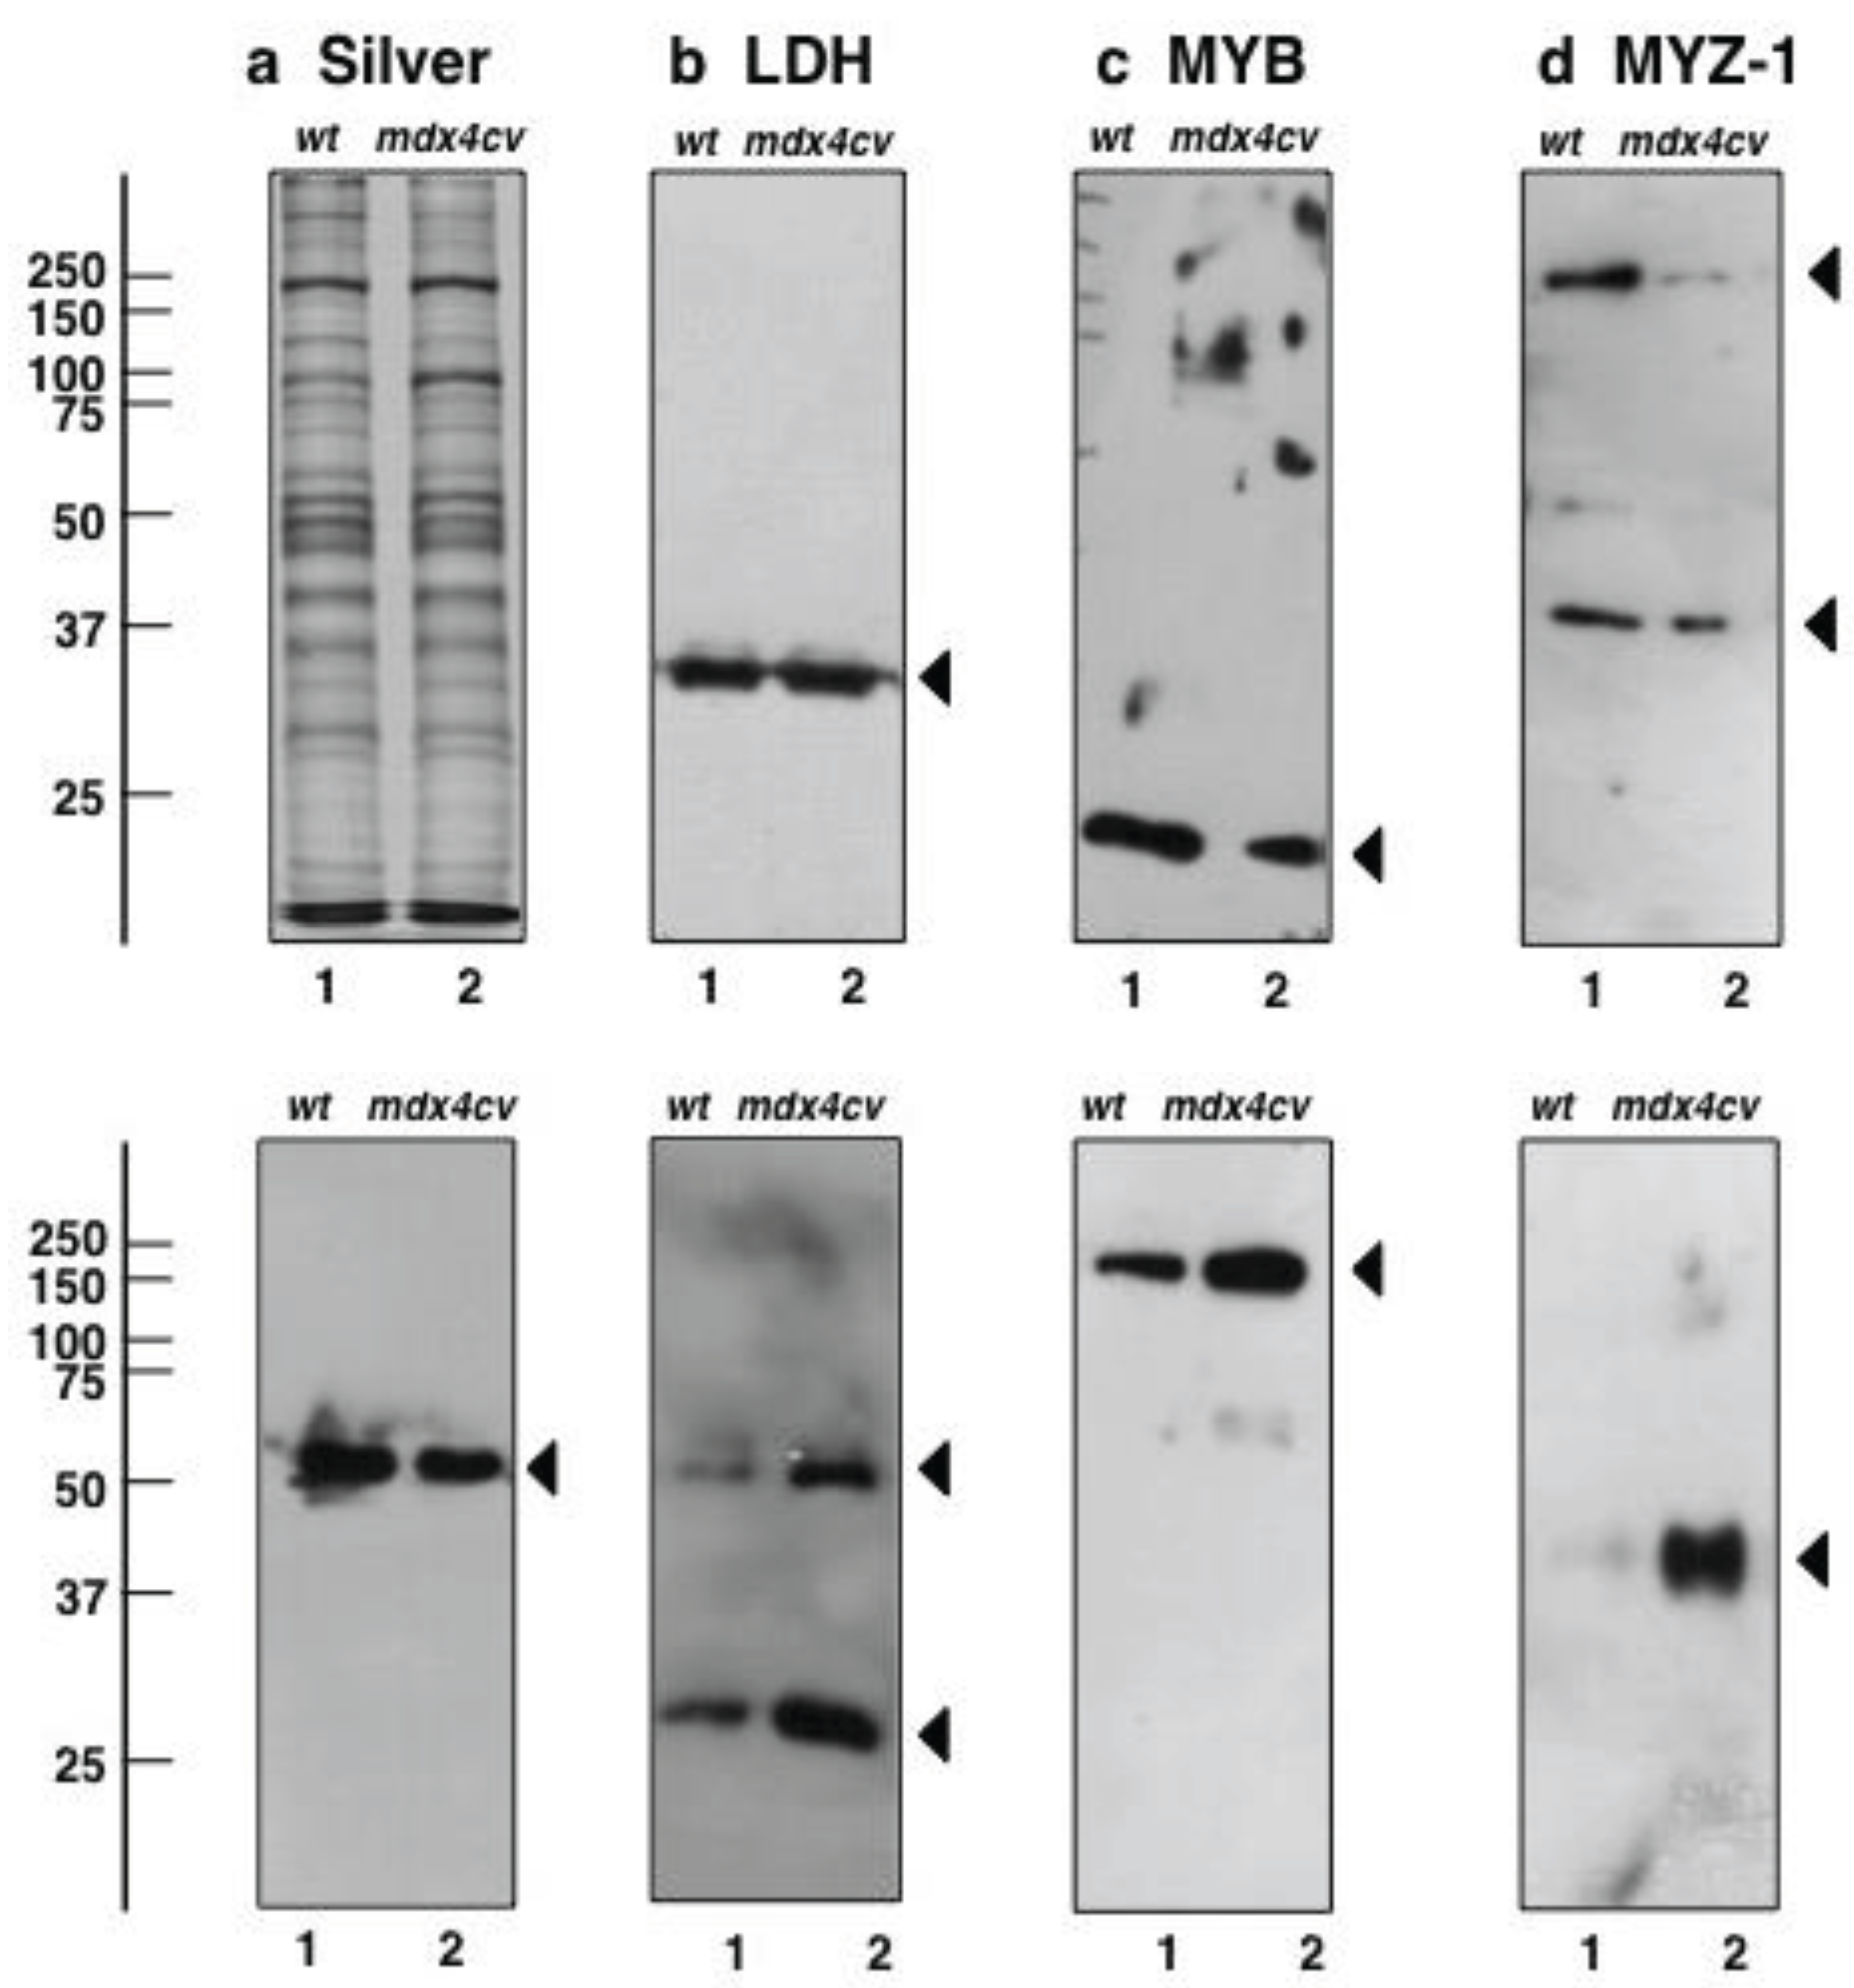
3.5. Immunoblotting Survey of mdx-4cv versus Wild Type Skeletal Muscle

Select findings from the proteomic survey of the microsomal fraction from mdx-4cv hind limb muscle were verified by comparative immunoblot analysis, so this new proteomic survey could be related to previous large-scale analyses of muscles from dystrophic mice. This included established marker proteins of decreased and increased abundance in muscular dystrophy. Silver-stained gels showed no major changes in the overall protein band pattern in wild type versus dystrophic muscle microsomes following gel electrophoretic separation (Figure 8a). Antibody labelling of lactate dehydrogenase was used as a loading control (Figure 8b). The immunoblotting of myoglobin, a major muscle-associated oxygen carrier, myozenin isoform 1, an intracellular binding protein that provides a linkage of the Z-line proteins α-actinin and γ-filamin to the sarcomere structure, and pyruvate dehydrogenase, a major mitochondrial protein involved in the conversion of pyruvate into acetyl-CoA, indicated a reduction in mdx-4cv skeletal muscle (Figure 8c–e). This agrees with previous proteomic studies, as reviewed by Holland et al. [46] and Dowling et al. [69]. In contrast, the microtubular element β-tubulin, the matricellular protein periostin and the intermediate filament component vimentin were found to be significantly increased in dystrophic muscles (Figure 8f–h; supplementary Figure S3), which is also in agreement with a previous study [77].
Figure 6. Immunoblot analysis of the Na+/K+-ATPase from mdx-4cv skeletal and cardiac muscles. Shown are representative silver-stained gels (a,e) and immunoblots (b,d,f,g). Lanes 1 to 6 represent total extracts from non-dystrophic wild type (wt) skeletal muscle, total extracts from dystrophic mdx-4cv skeletal muscle, crude microsomes from wt skeletal muscle, crude microsomes form mdx-4cv skeletal muscle, total extracts from wt heart, and total extracts from mdx-4cv heart, respectively. Blots were labelled with antibodies to the Na+/K+-ATPase (b,g), and lactate dehydrogenase (LDH; as a loading control) (d,f). Arrowheads indicate immuno-labelled bands. Graphical representations of the immuno-decoration levels for the Na+/K+-ATPase in normal versus mdx-4cv microsomes are shown in panel (c): Student’s t-test, unpaired; n = 4; ** p < 0.01. See supplementary Figure S2 for the graphical presentation of LDH and the cardiac Na+/K+-ATPase.
Biology 04 00397 g006
Figure 7. Immunofluorescence microscopical analysis of dystrophin and the Na+/K+-ATPase in mdx-4cv gastrocnemius muscle. Shown is the labelling of nuclei with the DNA binding dye bis-benzimide Hoechst 33342 (H-33342) (ad), as well as antibody labelling of the full-length dystrophin isoform Dp427 (a,c) and the Na+/K+-ATPase (b,d) in wild type (wt) (a,b) versus dystrophic mdx-4cv (c,d) gastrocnemius muscle. The immunofluorescence microscopical analysis of dystrophin-deficient muscle fibres indicates a higher degree of central nucleation and increased levels of the sarcolemmal Na+/K+-ATPase. The bar equals 20 μm.
Biology 04 00397 g007
Figure 8. Immunoblot analysis of proteins with a considerable change in concentration levels in mdx-4cv skeletal muscle tissue. Shown is a silver-stained gel (a) and representative immunoblots (bh). Lanes 1 and 2 represent crude microsomes from wild type muscle and dystrophic mdx-4cv muscle, respectively. Blots were labeled with antibodies to lactate dehydrogenase (LDH) (b), myoglobin (MYB) (c), myozenin (MYZ-1) (d), pyruvate dehydrogenase (PDH) (e), β-tubulin (β-TUB) (f), periostin (POSTN) (g) and vimentin (VIM) (h). The graphical representations of immuno-decoration levels are shown in supplementary Figure S3. Arrowheads indicate immuno-labelled bands. In the case of myozenin and tubulin, high-molecular-mass bands were detected besides the main isoforms, possibly representing larger protein aggregates.
Biology 04 00397 g008

4. Conclusions

In order to establish a large number of predictive, diagnostic, prognostic and/or therapy monitoring biomarkers in relation to dystrophinopathy-associated changes, international research initiatives have focused on the large-scale and high-throughput screening of dystrophic muscle specimens. In analogy to these systematic efforts, we present here the first proteomic documentation of the actual loss of dystrophin and the significant decrease of dystrophin-associated proteins in skeletal muscle preparations. Previous proteomic analyses of total muscle tissue extracts employing a single analytical run have failed to detect these changes that present the primary defect in X-linked muscular dystrophy. In this new analytical approach, the comprehensive analysis of the crude microsomal fraction allowed the simultaneous proteomic evaluation of both the primary abnormality of dystrophinopathy plus downstream alterations within the same muscle sample. Secondary alterations included a large number of proteins involved in cell signalling, energy metabolism, the excitation-contraction-relaxation cycle, ion homeostasis, the cellular stress response, the extracellular matrix and the cytoskeletal network. It is important to emphasise that the interpretation of comparative findings from proteomic studies of crude extracts or distinct subcellular fractions from diseased tissues is complicated and potentially adversely affected by the dissimilar cellular composition of analysed specimens. The dystrophy-related substitution of degenerating contractile fibres by fatty and connective tissue therefore presents an issue when one tries to interpret proteomic changes in wild type versus dystrophic phenotypes. However, in the case of the dystrophic hind leg muscle investigated in this study, relatively low levels of fibrosis have been observed, as compared to the mdx diaphragm or the aging dystrophic heart muscle. Therefore, the findings from our organelle proteomic survey of a moderately affected group of skeletal muscles should be relatively representative of actual changes within the muscle proteome. Importantly, the usefulness of the label-free LC-MS/MS technology for the improved proteomic coverage of certain classes of proteins, which are usually under-represented in gel-based studies, was exemplified by the identification of hydrophobic protein species such as the sarcolemmal Na+/K+-ATPase. Thus, ideally both gel-free and gel-based methods should be combined to identify the maximum number of diverse biomarker candidates with greatly differing physicochemical properties.

Supplementary Files

Supplementary File 1

Acknowledgments

Research was supported by a Hume scholarship from Maynooth University and project grants from the Deutsche Duchenne Stiftung aktion benni & co e.V. and Muscular Dystrophy Ireland. The authors thank Caroline Batchelor for help with LC-MS/MS analysis. The Q-Exactive quantitative mass spectrometer was funded under the SFI Research Infrastructure Call 2012 (SFI-12/RI/2346/3) to Sean Doyle and James Carolan (Maynooth University).

Author Contributions

Sandra Murphy designed and performed the main analytical experiments and the mass spectrometric analysis. Dieter Swandulla and Kay Ohlendieck conceived this collaborative study and provided scientific oversight. Michael Henry and Paula Meleady provided the detailed analysis of mass spectrometric data. Margit Zweyer and Rustam Mundegar were involved in the maintenance of the mouse colonies and performed the preparation of tissue samples and immunofluorescence microscopy. All authors were involved in interpreting of data, as well as the writing and correcting of the manuscript.

Conflicts of Interest

The authors declare no conflict of interest.

References

  1. Geiger, T.; Velic, A.; Macek, B.; Lundberg, E.; Kampf, C.; Nagaraj, N.; Uhlen, M.; Cox, J.; Mann, M. Initial quantitative proteomic map of 28 mouse tissues using the SILAC mouse. Mol. Cell. Proteomics 2013, 12, 1709–1722. [Google Scholar] [CrossRef] [PubMed]
  2. Højlund, K.; Yi, Z.; Hwang, H.; Bowen, B.; Lefort, N.; Flynn, C.R.; Langlais, P.; Weintraub, S.T.; Mandarino, L.J. Characterization of the human skeletal muscle proteome by one-dimensional gel electrophoresis and HPLC-ESI-MS/MS. Mol. Cell. Proteomics 2008, 7, 257–267. [Google Scholar] [CrossRef] [PubMed]
  3. Raddatz, K.; Albrecht, D.; Hochgräfe, F.; Hecker, M.; Gotthardt, M. A proteome map of murine heart and skeletal muscle. Proteomics 2008, 8, 1885–1897. [Google Scholar] [CrossRef] [PubMed]
  4. Parker, K.C.; Walsh, R.J.; Salajegheh, M.; Amato, A.A.; Krastins, B.; Sarracino, D.A.; Greenberg, S.A. Characterization of human skeletal muscle biopsy samples using shotgun proteomics. J. Proteome Res. 2009, 8, 3265–3277. [Google Scholar] [CrossRef] [PubMed]
  5. Burniston, J.G.; Connolly, J.; Kainulainen, H.; Britton, S.L.; Koch, L.G. Label-free profiling of skeletal muscle using high-definition mass spectrometry. Proteomics 2014, 14, 2339–2344. [Google Scholar] [CrossRef] [PubMed]
  6. Deshmukh, A.S.; Murgia, M.; Nagaraja, N.; Treebak, J.T.; Cox, J.; Mann, M. Deep proteomics of mouse skeletal muscle enables quantitation of protein isoforms, metabolic pathways and transcription factors. Mol. Cell. Proteomics 2015, 14, 841–853. [Google Scholar] [CrossRef] [PubMed]
  7. Schiaffino, S.; Reggiani, C. Fiber types in mammalian skeletal muscles. Physiol. Rev. 2011, 91, 1447–1531. [Google Scholar] [CrossRef] [PubMed]
  8. Pette, D.; Staron, R.S. Myosin isoforms, muscle fiber types, and transitions. Microsc. Res. Tech. 2000, 50, 500–509. [Google Scholar] [CrossRef]
  9. Froemming, G.R.; Murray, B.E.; Harmon, S.; Pette, D.; Ohlendieck, K. Comparative analysis of the isoform expression pattern of Ca2+-regulatory membrane proteins in fast-twitch, slow-twitch, cardiac, neonatal and chronic low-frequency stimulated muscle fibers. Biochim. Biophys. Acta 2000, 1466, 151–168. [Google Scholar] [CrossRef]
  10. Quiroz-Rothe, E.; Rivero, J.L. Coordinated expression of myosin heavy chains, metabolic enzymes, and morphological features of porcine skeletal muscle fiber types. Microsc. Res. Tech. 2004, 65, 43–61. [Google Scholar] [CrossRef] [PubMed]
  11. Blaauw, B.; Schiaffino, S.; Reggiani, C. Mechanisms modulating skeletal muscle phenotype. Compr. Physiol. 2013, 3, 1645–1687. [Google Scholar] [PubMed]
  12. Okumura, N.; Hashida-Okumura, A.; Kita, K.; Matsubae, M.; Matsubara, T.; Takao, T.; Nagai, K. Proteomic analysis of slow- and fast-twitch skeletal muscles. Proteomics 2005, 5, 2896–2906. [Google Scholar] [CrossRef] [PubMed]
  13. Gelfi, C.; Viganò, A.; de Palma, S.; Ripamonti, M.; Begum, S.; Cerretelli, P.; Wait, R. 2-D protein maps of rat gastrocnemius and soleus muscles: A tool for muscle plasticity assessment. Proteomics 2006, 6, 321–340. [Google Scholar] [CrossRef] [PubMed]
  14. Drexler, H.C.; Ruhs, A.; Konzer, A.; Mendler, L.; Bruckskotten, M.; Looso, M.; Günther, S.; Boettger, T.; Krüger, M.; Braun, T. On marathons and Sprints: An integrated quantitative proteomics and transcriptomics analysis of differences between slow and fast muscle fibers. Mol. Cell. Proteomics 2012. [Google Scholar] [CrossRef] [PubMed]
  15. Murgia, M.; Nagaraj, N.; Deshmukh, A.S.; Zeiler, M.; Cancellara, P.; Moretti, I.; Reggiani, C.; Schiaffino, S.; Mann, M. Single muscle fiber proteomics reveals unexpected mitochondrial specialization. EMBO Rep. 2015, 16, 387–395. [Google Scholar] [CrossRef] [PubMed]
  16. Ohlendieck, K. Proteomics of skeletal muscle differentiation, neuromuscular disorders and fiber aging. Expert Rev. Proteomics 2010, 7, 283–296. [Google Scholar] [CrossRef] [PubMed]
  17. Gelfi, C.; Vasso, M.; Cerretelli, P. Diversity of human skeletal muscle in health and disease: Contribution of proteomics. J. Proteomics 2011, 74, 774–795. [Google Scholar] [CrossRef] [PubMed]
  18. Holland, A.; Ohlendieck, K. Proteomic profiling of the contractile apparatus from skeletal muscle. Expert Rev. Proteomics 2013, 10, 239–257. [Google Scholar] [CrossRef] [PubMed]
  19. Holland, A.; Ohlendieck, K. Comparative proteomics for studying muscular dystrophy: Intrinsic biological and analytical issues associated with the systematic utilization of tissue specimens. J. Proteomics Bioinform. 2014. [Google Scholar] [CrossRef]
  20. Gauthier, D.J.; Lazure, C. Complementary methods to assist subcellular fractionation in organellar proteomics. Expert Rev. Proteomics 2008, 5, 603–617. [Google Scholar] [CrossRef] [PubMed]
  21. Altelaar, A.F.; Heck, A.J. Trends in ultrasensitive proteomics. Curr. Opin. Chem. Biol. 2012, 16, 206–213. [Google Scholar] [CrossRef] [PubMed]
  22. Drissi, R.; Dubois, M.L.; Boisvert, F.M. Proteomics methods for subcellular proteome analysis. FEBS J. 2013, 280, 5626–5634. [Google Scholar] [CrossRef] [PubMed]
  23. Ohlendieck, K. Organelle proteomics in skeletal muscle biology. J. Integr. Omics 2012, 2, 27–38. [Google Scholar] [CrossRef]
  24. Vitorino, R.; Ferreira, R.; Neuparth, M.; Guedes, S.; Williams, J.; Tomer, K.B.; Domingues, P.M.; Appell, H.J.; Duarte, J.A.; Amado, F.M. Subcellular proteomics of mice gastrocnemius and soleus muscles. Anal. Biochem. 2007, 366, 156–169. [Google Scholar] [CrossRef] [PubMed]
  25. Maughan, D.W.; Henkin, J.A.; Vigoreaux, J.O. Concentrations of glycolytic enzymes and other cytosolic proteins in the diffusible fraction of a vertebrate muscle proteome. Mol. Cell. Proteomics 2005, 4, 1541–1549. [Google Scholar] [CrossRef] [PubMed]
  26. Toigo, M.; Donohoe, S.; Sperrazzo, G.; Jarrold, B.; Wang, F.; Hinkle, R.; Dolan, E.; Isfort, R.J.; Aebersold, R. ICAT-MS-MS time course analysis of atrophying mouse skeletal muscle cytosolic subproteome. Mol. Biosyst. 2005, 1, 229–241. [Google Scholar] [CrossRef] [PubMed]
  27. Lewis, C.; Ohlendieck, K. Mass spectrometric identification of dystrophin isoform Dp427 by on-membrane digestion of sarcolemma from skeletal muscle. Anal. Biochem. 2010, 404, 197–203. [Google Scholar] [CrossRef] [PubMed]
  28. Staunton, L.; Ohlendieck, K. Mass spectrometric characterization of the sarcoplasmic reticulum from rabbit skeletal muscle by on-membrane digestion. Protein Pept. Lett. 2012, 19, 252–263. [Google Scholar] [CrossRef] [PubMed]
  29. Liu, Z.; Du, X.; Yin, C.; Chang, Z. Shotgun proteomic analysis of sarcoplasmic reticulum preparations from rabbit skeletal muscle. Proteomics 2013, 13, 2335–2338. [Google Scholar] [CrossRef] [PubMed]
  30. Lefort, N.; Yi, Z.; Bowen, B.; Glancy, B.; de Filippis, E.A.; Mapes, R.; Hwang, H.; Flynn, C.R.; Willis, W.T.; Civitarese, A.; et al. Proteome profile of functional mitochondria from human skeletal muscle using one-dimensional gel electrophoresis and HPLC-ESI-MS/MS. J. Proteomics 2009, 72, 1046–1060. [Google Scholar] [CrossRef] [PubMed]
  31. O’Connell, K.; Ohlendieck, K. Proteomic DIGE analysis of the mitochondria-enriched fraction from aged rat skeletal muscle. Proteomics 2009, 9, 5509–5524. [Google Scholar] [CrossRef] [PubMed]
  32. Ferreira, R.; Vitorino, R.; Alves, R.M.; Appell, H.J.; Powers, S.K.; Duarte, J.A.; Amado, F. Subsarcolemmal and intermyofibrillar mitochondria proteome differences disclose functional specializations in skeletal muscle. Proteomics 2010, 10, 3142–3154. [Google Scholar] [CrossRef] [PubMed]
  33. Carberry, S.; Zweyer, M.; Swandulla, D.; Ohlendieck, K. Comparative proteomic analysis of the contractile protein-depleted fraction from normal versus dystrophic skeletal muscle. Anal. Biochem. 2014, 446, 108–115. [Google Scholar] [CrossRef] [PubMed]
  34. Muntoni, F.; Torelli, S.; Ferlini, A. Dystrophin and mutations: One gene, several proteins, multiple phenotypes. Lancet Neurol. 2003, 2, 731–740. [Google Scholar] [CrossRef]
  35. Nakamura, A.; Takeda, S. Mammalian models of duchenne muscular dystrophy: Pathological characteristics and therapeutic applications. J. Biomed. Biotechnol. 2011. [Google Scholar] [CrossRef] [PubMed]
  36. Ng, R.; Banks, G.B.; Hall, J.K.; Muir, L.A.; Ramos, J.N.; Wicki, J.; Odom, G.L.; Konieczny, P.; Seto, J.; Chamberlain, J.R. Animal models of muscular dystrophy. Prog. Mol. Biol. Transl. Sci. 2012, 105, 83–111. [Google Scholar] [PubMed]
  37. Partridge, T.A. The mdx mouse model as a surrogate for Duchenne muscular dystrophy. FEBS J. 2013, 280, 4177–4186. [Google Scholar] [CrossRef] [PubMed]
  38. Doran, P.; Wilton, S.D.; Fletcher, S.; Ohlendieck, K. Proteomic profiling of antisense-induced exon skipping reveals reversal of pathobiochemical abnormalities in dystrophic mdx diaphragm. Proteomics 2009, 9, 671–685. [Google Scholar] [CrossRef] [PubMed]
  39. Danko, I.; Chapman, V.; Wolff, J.A. The frequency of revertants in mdx mouse genetic models for Duchenne muscular dystrophy. Pediatr. Res. 1992, 32, 128–131. [Google Scholar] [CrossRef] [PubMed]
  40. Shin, J.H.; Hakim, C.H.; Zhang, K.; Duan, D. Genotyping mdx, mdx3cv, and mdx4cv mice by primer competition polymerase chain reaction. Muscle Nerve 2011, 43, 283–286. [Google Scholar] [CrossRef] [PubMed]
  41. Doran, P.; Martin, G.; Dowling, P.; Jockusch, H.; Ohlendieck, K. Proteome analysis of the dystrophin-deficient MDX diaphragm reveals a drastic increase in the heat shock protein cvHSP. Proteomics 2006, 6, 4610–4621. [Google Scholar] [CrossRef] [PubMed]
  42. Guevel, L.; Lavoie, J.R.; Perez-Iratxeta, C.; Rouger, K.; Dubreil, L.; Feron, M.; Talon, S.; Brand, M.; Megeney, L.A. Quantitative proteomic analysis of dystrophic dog muscle. J. Proteome Res. 2011, 10, 2465–2478. [Google Scholar] [CrossRef] [PubMed]
  43. Carberry, S.; Zweyer, M.; Swandulla, D.; Ohlendieck, K. Proteomics reveals drastic increase of extracellular matrix proteins collagen and dermatopontin in aged mdx diaphragm muscle. Int. J. Mol. Med. 2012, 30, 229–234. [Google Scholar] [PubMed]
  44. Rayavarapu, S.; Coley, W.; Cakir, E.; Jahnke, V.; Takeda, S.; Aoki, Y.; Grodish-Dressman, H.; Jaiswal, J.K.; Hoffman, E.P.; Brown, K.J.; et al. Identification of disease specific pathways using in vivo SILAC proteomics in dystrophin deficient mdx mouse. Mol. Cell. Proteomics 2013, 12, 1061–1073. [Google Scholar] [CrossRef] [PubMed]
  45. Duguez, S.; Duddy, W.; Johnston, H.; Lainé, J.; le Bihan, M.C.; Brown, K.J.; Bigot, A.; Hathout, Y.; Butler-Browne, G.; Partridge, T. Dystrophin deficiency leads to disturbance of LAMP1-vesicle-associated protein secretion. Cell. Mol. Life Sci. 2013, 70, 2159–2174. [Google Scholar] [CrossRef] [PubMed]
  46. Holland, A.; Carberry, S.; Ohlendieck, K. Proteomics of the dystrophin-glycoprotein complex and dystrophinopathy. Curr. Protein Pept. Sci. 2013, 14, 680–697. [Google Scholar] [CrossRef] [PubMed]
  47. Chapman, V.M.; Miller, D.R.; Armstrong, D.; Caskey, C.T. Recovery of induced mutations for X chromosome-linked muscular dystrophy in mice. Proc. Natl. Acad. Sci. USA 1989, 86, 1292–1296. [Google Scholar] [CrossRef] [PubMed]
  48. Im, W.B.; Phelps, S.F.; Copen, E.H.; Adams, E.G.; Slightom, J.L.; Chamberlain, J.S. Differential expression of dystrophin isoforms in strains of mdx mice with different mutations. Hum. Mol. Genet. 1996, 5, 1149–1153. [Google Scholar] [CrossRef] [PubMed]
  49. Judge, L.M.; Haraguchiln, M.; Chamberlain, J.S. Dissecting the signaling and mechanical functions of the dystrophin-glycoprotein complex. J. Cell Sci. 2006, 119, 1537–1546. [Google Scholar] [CrossRef] [PubMed]
  50. Mitrpant, C.; Fletcher, S.; Iversen, P.L.; Wilton, S.D. By-passing the nonsense mutation in the 4 CV mouse model of muscular dystrophy by induced exon skipping. J. Gene Med. 2009, 11, 46–56. [Google Scholar] [CrossRef] [PubMed]
  51. Kimura, E.; Li, S.; Gregorevic, P.; Fall, B.M.; Chamberlain, J.S. Dystrophin delivery to muscles of mdx mice using lentiviral vectors leads to myogenic progenitor targeting and stable gene expression. Mol. Ther. 2010, 18, 206–213. [Google Scholar] [CrossRef] [PubMed]
  52. Holland, A.; Dowling, P.; Zweyer, M.; Swandulla, D.; Henry, M.; Clynes, M.; Ohlendieck, K. Proteomic profiling of cardiomyopathic tissue from the aged mdx model of Duchenne muscular dystrophy reveals a drastic decrease in laminin, nidogen and annexin. Proteomics 2013, 13, 2312–2323. [Google Scholar] [CrossRef] [PubMed]
  53. Bradford, M.M. A rapid and sensitive method for the quantitation of microgram quantities of protein utilizing the principle of protein-dye binding. Anal. Biochem. 1976, 72, 248–254. [Google Scholar] [CrossRef]
  54. Meleady, P.; Gallagher, M.; Clarke, C.; Henry, M.; Sanchez, N.; Barron, N.; Clynes, M. Impact of miR-7 over-expression on the proteome of Chinese hamster ovary cells. J. Biotechnol. 2012, 160, 251–262. [Google Scholar] [CrossRef] [PubMed]
  55. Meleady, P.; Hoffrogge, R.; Henry, M.; Rupp, O.; Bort, J.H.; Clarke, C.; Brinkrolf, K.; Kelly, S.; Müller, B.; Doolan, P.; et al. Utilization and evaluation of CHO-specific sequence databases for mass spectrometry based proteomics. Biotechnol. Bioeng. 2012, 109, 1386–1394. [Google Scholar] [CrossRef] [PubMed]
  56. Holland, A.; Schmitt-John, T.; Dowling, P.; Meleady, P.; Henry, M.; Clynes, M.; Ohlendieck, K. Intricate effects of primary motor neuronopathy on contractile proteins and metabolic muscle enzymes as revealed by label-free mass spectrometry. Biosci. Rep. 2014, 34, e00119. [Google Scholar] [CrossRef] [PubMed]
  57. PANTHER Gene List Analysis. Available online: http://pantherdb.org/ (accessed on 4 May 2015).
  58. Mi, H.; Muruganujan, A.; Thomas, P.D. PANTHER in 2013: Modeling the evolution of gene function, and other gene attributes, in the context of phylogenetic trees. Nucleic Acids Res. 2013, 41, D377–D386. [Google Scholar] [CrossRef] [PubMed]
  59. STRING Functional Protein Association Network. Available online: http://string-db.org/ (accessed on 3 February 2015).
  60. Franceschini, A.; Szklarczyk, D.; Frankild, S.; Kuhn, M.; Simonovic, M.; Roth, A.; Lin, J.; Minguez, P.; Bork, P.; von Mering, C.; et al. STRING v9.1: Protein-protein interaction networks, with increased coverage and integration. Nucleic Acids Res. 2013, 41, D808–D815. [Google Scholar] [CrossRef] [PubMed]
  61. Mundegar, R.R.; Franke, E.; Schäfer, R.; Zweyer, M.; Wernig, A. Reduction of high background staining by heating unfixed mouse skeletal muscle tissue sections allows for detection of thermostable antigens with murine monoclonal antibodies. J. Histochem. Cytochem. 2008, 56, 969–975. [Google Scholar] [CrossRef] [PubMed]
  62. Gardan-Salmon, D.; Dixon, J.M.; Lonergan, S.M.; Selsby, J.T. Proteomic assessment of the acute phase of dystrophin deficiency in mdx mice. Eur. J. Appl. Physiol. 2011, 111, 2763–2773. [Google Scholar] [CrossRef] [PubMed]
  63. Carberry, S.; Brinkmeier, H.; Zhang, Y.; Winkler, C.K.; Ohlendieck, K. Comparative proteomic profiling of soleus, extensor digitorum longus, flexor digitorum brevis and interosseus muscle from the mdx mouse model of Duchenne muscular dystrophy. Int. J. Mol. Med. 2013, 32, 544–556. [Google Scholar] [PubMed]
  64. Yoon, J.H.; Johnson, E.; Xu, R.; Martin, L.T.; Martin, P.T.; Montanaro, F. Comparative proteomic profiling of dystroglycan-associated proteins in wild type, mdx, and Galgt2 transgenic mouse skeletal muscle. J. Proteome Res. 2012, 11, 4413–4424. [Google Scholar] [CrossRef] [PubMed]
  65. Johnson, E.K.; Zhang, L.; Adams, M.E.; Phillips, A.; Freitas, M.A.; Froehner, S.C.; Green-Church, K.B.; Montanaro, F. Proteomic analysis reveals new cardiac-specific dystrophin-associated proteins. PLoS ONE 2012, 7, e43515. [Google Scholar] [CrossRef] [PubMed]
  66. Swiderski, K.; Shaffer, S.A.; Gallis, B.; Odom, G.L.; Arnett, A.L.; Edgar, S.J.; Baum, D.M.; Chee, A.; Naim, T.; Gregorevic, P.; et al. Phosphorylation within the cysteine-rich region of dystrophin enhances its association with β-dystroglycan and identifies a potential novel therapeutic target for skeletal muscle wasting. Hum. Mol. Genet. 2014, 23, 6697–6711. [Google Scholar] [CrossRef] [PubMed]
  67. Brown, K.J.; Marathi, R.; Fiorillo, A.A.; Ciccimaro, E.F.; Sharma, S.; Rowlands, D.S.; Rayavarapu, S.; Nagaraju, K.; Hoffman, E.P.; Hathout, Y. Accurate quantitation of dystrophin protein in human skeletal muscle using mass spectrometry. J. Bioanal. Biomed. 2012. [Google Scholar] [CrossRef] [PubMed]
  68. Ohlendieck, K. Proteomic identification of biomarkers of skeletal muscle disorders. Biomark. Med. 2013, 7, 169–186. [Google Scholar] [CrossRef] [PubMed]
  69. Dowling, P.; Holland, A.; Ohlendieck, K. Mass spectrometry-based identification of muscle-associated and muscle-derived proteomic biomarkers of dystrophinopathies. J. Neuromusc. Dis. 2014, 1, 15–40. [Google Scholar]
  70. Gannon, J.; Doran, P.; Kirwan, A.; Ohlendieck, K. Drastic increase of myosin light chain MLC-2 in senescent skeletal muscle indicates fast-to-slow fibre transition in sarcopenia of old age. Eur. J. Cell Biol. 2009, 88, 685–700. [Google Scholar] [CrossRef] [PubMed]
  71. Schreiber, D.; Ohlendieck, K. Oligomerisation of sarcoplasmic reticulum Ca2+-ATPase monomers from skeletal muscle. Protein Pept. Lett. 2007, 14, 219–226. [Google Scholar] [CrossRef] [PubMed]
  72. Ohlendieck, K.; Campbell, K.P. Dystrophin-associated proteins are greatly reduced in skeletal muscle from mdx mice. J. Cell Biol. 1991, 115, 1685–1694. [Google Scholar] [CrossRef] [PubMed]
  73. Ohlendieck, K.; Matsumura, K.; Ionasescu, V.V.; Towbin, J.A.; Bosch, E.P.; Weinstein, S.L.; Sernett, S.W.; Campbell, K.P. Duchenne muscular dystrophy: Deficiency of dystrophin-associated proteins in the sarcolemma. Neurology 1993, 43, 795–800. [Google Scholar] [CrossRef] [PubMed]
  74. Fumagalli, L.; Businaro, R.; Nori, S.L.; Toesca, A.; Pompili, E.; Evangelisti, E.; Giannetti, S.; Ippoliti, F.; de Renzis, G. Protease inhibitors in mouse skeletal muscle: Tissue-associated components of serum inhibitors and calpastatin. Cell. Mol. Biol. 1996, 42, 535–546. [Google Scholar] [PubMed]
  75. Miravitlles, M. Alpha-1-antitrypsin and other proteinase inhibitors. Curr. Opin. Pharmacol. 2012, 12, 309–314. [Google Scholar] [CrossRef] [PubMed]
  76. Jonigk, D.; Al-Omari, M.; Maegel, L.; Müller, M.; Izykowski, N.; Hong, J.; Hong, K.; Kim, S.H.; Dorsch, M.; Mahadeva, R.; et al. Anti-inflammatory and immunomodulatory properties of α1-antitrypsin without inhibition of elastase. Proc. Natl. Acad. Sci. USA 2013, 110, 15007–15012. [Google Scholar] [CrossRef] [PubMed]
  77. Holland, A.; Dowling, P.; Meleady, P.; Henry, M.; Zweyer, M.; Mundegar, R.R.; Swandulla, D.; Ohlendieck, K. Label-free mass spectrometric analysis of the mdx-4cv diaphragm identifies the matricellular protein periostin as a potential factor involved in dystrophinopathy-related fibrosis. Proteomics 2015. [Google Scholar] [CrossRef]
  78. Vidal, B.; Serrano, A.L.; Tjwa, M.; Suelves, M.; Ardite, E.; de Mori, R.; Baeza-Raja, B.; de Lagrán, M.M.; Lafuste, P.; Ruiz-Bonilla, V.; et al. Fibrinogen drives dystrophic muscle fibrosis via a TGFbeta/alternative macrophage activation pathway. Genes Dev. 2008, 22, 1747–1752. [Google Scholar] [CrossRef] [PubMed]
  79. Selbert, S.; Fischer, P.; Menke, A.; Jockusch, H.; Pongratz, D.; Noegel, A.A. Annexin VII relocalization as a result of dystrophin deficiency. Exp. Cell Res. 1996, 222, 199–208. [Google Scholar] [CrossRef] [PubMed]
  80. Bizzarro, V.; Petrella, A.; Parente, L. Annexin A1: Novel roles in skeletal muscle biology. J. Cell. Physiol. 2012, 227, 3007–3015. [Google Scholar] [CrossRef] [PubMed]
  81. Dunn, J.F.; Burton, K.A.; Dauncey, M.J. Ouabain sensitive Na+/K+-ATPase content is elevated in mdx mice: Implications for the regulation of ions in dystrophic muscle. J. Neurol. Sci. 1995, 133, 11–15. [Google Scholar] [CrossRef]

