Article

The Role of the Insulin/Glucose Ratio in the Regulation of Pathogen Biofilm Formation

1
Department of Microbiology and Immunology, Midwestern University, Downers Grove, IL 60515, USA
2
Department of Chemistry, American University, Washington, DC 20016, USA
*
Author to whom correspondence should be addressed.
Biology 2023, 12(11), 1432; https://doi.org/10.3390/biology12111432
Submission received: 20 September 2023 / Revised: 7 November 2023 / Accepted: 9 November 2023 / Published: 15 November 2023
(This article belongs to the Section Medical Biology)

Abstract

:

Simple Summary

Insulin and glucose affect the biofilm formation of both Gram-positive and Gram-negative bacteria over the physiologic range in a manner that is dependent on the ratio of insulin to glucose. These findings provide insight into the mechanism underpinning empirical sepsis management in trauma care.

Abstract

During the management of patients in acute trauma the resulting transient hyperglycemia is treated by administration of insulin. Since the effect of insulin, a quorum sensing compound, together with glucose affects biofilm formation in a concentration-specific manner, we hypothesize that the insulin/glucose ratio over the physiologic range modulates biofilm formation potentially influencing the establishment of infection through biofilm formation. Methods: A variety of Gram-positive and Gram-negative bacteria were grown in peptone (1%) yeast nitrogen base broth overnight in 96-well plates with various concentrations of glucose and insulin. Biofilm formation was determined by the crystal violet staining procedure. Expression of insulin binding was determined by fluorescent microscopy (FITC-insulin). Controls were buffer alone, insulin alone, and glucose alone. Results: Overall, maximal biofilm levels were measured at 220 mg/dL of glucose, regardless of insulin concentration (10, 100, 200 µU/mL) of the organism tested. In general, insulin with glucose over the range of 160–180 mg/dL exhibited a pattern of biofilm suppression. However, either above or below this range, the presence of insulin in combination with glucose significantly modulated (increase or decrease) biofilm formation in a microbe-specific pattern. This modulation appears for some organisms to be reflective of the glucose-regulated intrinsic expression of bacterial insulin receptor expression. Conclusion: Insulin at physiologic levels (normal and hyperinsulinemic) in combination with glucose can affect biofilm formation in a concentration-specific and microbe-specific manner. These findings may provide insight into the importance of co-regulation of the insulin/glucose ratio in patient management.

1. Introduction

Hyperglycemia is a common clinical presentation that occurs in a significant number of critically ill individuals. For critically ill inpatients, hyperglycemia requires treatment when the blood glucose level is persistently >180 mg/dL. In trauma, transient hyperglycemia is a common physiologic response [1,2,3,4]. Standard ICU and surgical protocol are empirical administration of insulin to modulate the glucose levels, decreasing them to levels associated with reduced morbidity and mortality, i.e., below 220 mg/dL [5,6]. Other studies suggest tight glycemic endpoint control (via infusion) with the resultant blood glucose endpoint of between 150 mg/dL and 180 mg/dL [7]. This glycemic level appears to further improve patient outcomes in both pre- and post-operative settings [8]. Although this empirical treatment application has been shown to be effective, the underlying mechanism(s) associated with microbial sepsis under various glycemic conditions vis-à-vis insulin levels has not been determined. The state of sepsis, i.e., bacteremia, provides an opportunity for bacteria to colonize host surfaces and form biofilms. This formation of biofilms is an important characteristic of bacteria in sepsis since it acts as a protective mechanism against the hostile host environment, i.e., immune defense, as well as provides protection against any antimicrobial therapy that may be used in patient management [9]. Furthermore, these biofilms can play a key role as a locus for secondary spread with potentiation of systemic infection. Biofilm formation by microbes is highly adaptable to the environment and in general regulated through an organism’s response to quorum chemical signaling compounds, which include mammalian hormones, e.g., insulin.
Insulin is an interkingdom quorum chemical signaling molecule that modulates Escherichia coli (E. coli) adherence and biofilm formation [10,11,12]. Taxonomically production of insulin spans the Eubacteria (E. coli), Fungi (Neurospora crassa), Protist (Tetrahymena), Animalia (mammals), and, more controversially, Plantae (Momordica charantia) [13,14,15]. With respect to procaryotes, LeRoith, et al. [16] demonstrated that wild-type E. coli elaborates a native insulin with properties similar to mammalian insulin with respect to structure and function in a mammalian liver cell assay system. One function that insulin exhibits in E. coli is that of a rheostat, with respect to the expression of microbial phenotype regarding biofilm-forming behavior, i.e., adherence and chemotaxis, both of which appear to be dependent on the presence of carbohydrates, particularly glucose [10,17,18]. Although the administration of insulin is a mainstay in the management of the glycemic state in trauma and hospitalized patients, to date, the effect of insulin/glucose ratio over the general physiologic range on biofilm formation has not been determined. The focus of this study was to screen various Gram-positive and Gram-negative clinical isolates for biofilm formation in response to insulin/glucose levels over a physiological range to determine if there is a relationship between the clinically reported hyperglycemic–sepsis association and the resultant microbial response of biofilm formation.

2. Materials and Methods

Both standard ATCC highly stable quality control isolates and clinical isolates obtained from blood cultures were used for the study. All isolates were able to form biofilm under permissible environmental conditions. The bacterial isolates used were E. coli extended-spectrum beta-lactamase (ESBL) L108; E. coli ESBL L109; Acinetobacter baumannii L185; A. baumannii L186; A. baumannii L187; Klebsiella pneumoniae ATCC 27736; K. pneumoniae carbapenemase (KPC)-producing bacteria L133; K. pneumoniae ESBL L174; multi-drug-resistant (MDR) K. pneumoniae B249 (KLE B249); vancomycin-resistant Enterococcus faecalis (E.faecalis) 9 (VRE); methicillin-resistant Staphylococcus aureus (MRSA) isolates (X52960, M23110, M23304, W52559, T51995); and methicillin-sensitive S. aureus (MSSA) isolates (ATCC 25923, T55358, M24839). All non-ATCC isolates were reported as blood culture isolates from patients admitted to the hospital with various presenting acute ailments, e.g., trauma and acute infectious presentation, which necessitated a blood draw for bacterial culture and were a generous gift from the late Paul Schreckenberger.
Biofilm assay: Biofilm formation was measured using the standard quantitative crystal violet bacterial pellicle absorbance assay [19]. Organisms were maintained at −80 °C until use. After overnight growth on LB agar, organisms were inoculated to the same density (103 CFU/mL) in LB broth with and without various concentrations of insulin (10, 100, 200 µU/mL) and/or glucose, and placed in flat bottom untreated tissue culture plates (150 µL/well) [10,13]. After overnight growth (18 h, 37 °C), the wells were carefully washed (4X: PBS; pH 7.0), air dried, and then stained with crystal violet (Troy Biologics, Troy, MI, USA). After extensive washing, the plates were dried, and then the stain was solubilized with absolute ethanol (300 µL/well). The dissolved stain was transferred to another 96-well flat bottom plate (200 µL/well) and the level of biofilm present was quantified by immediately measuring the optical density in an (EIA reader (Dynatech Laboratories, Inc., Chantilly, VA, USA); 590 nm). Positive controls for biofilm formation consisted of organisms grown in LB alone, organisms grown in insulin in LB alone, and organisms grown in glucose in LB alone. Experiments were conducted in octuplicate and repeated thrice (n = 24). Data were evaluated by analysis of variance (ANOVA; GraphPad InStat 3.06 for Windows, GraphPad Software Inc., Version 8.0.0, San Diego, CA, USA).
For K. pneumoniae ATCC 27736, a stable highly characterized encapsulated isolate used for antibiotic testing, capsule levels were also determined in duplicate plates stained with Alcian blue, a stain specific for acidic polysaccharides, (1% w/v PBS, 30 min, room temperature) [17,20,21]. The stain was dissolved in 300 µL/well pyridine (Sigma-Aldrich, St. Louis, MO, USA). The dissolved stain was transferred to another 96-well flat bottom plate (200 µL/well) and the level of the capsule was quantified by immediately measuring the optical density in an EIA reader at 450 nm.
Insulin binding: To determine if insulin intrinsically bound to each of the species screened for biofilm formation, a randomly chosen isolate was grown overnight (18 h, 37 °C) in LB alone and 10–15 μL of cell suspension were then removed, dried onto a glass slide, methanol fixed, and stained (30 min; 37 °C; moisture chamber) with fluorescein isothiocyanate (FITC)-labeled insulin (25 µg/mL PBS; Sigma-Aldrich). Slides were coded and examined by epifluorescence microscopy (Nikon E600 microscope). Cell fluorescence was determined from photomicrographs of representative fields (n = 3). FITC-insulin control consisted of cells pre-treated with insulin (Humulin R®; 1 U/mL) prior to staining with FITC-insulin (no insulin fluorescence observed for any of the isolates).
Statistical analysis: All assays were carried out in triplicate and repeated at least twice unless otherwise indicated. Whenever possible, experiments were coded and performed in a blind fashion. Analysis of variance was used to determine differences between experimental conditions with p < 0.05 considered significant. If statistical significance was found, a Tukey–Kramer post hoc analysis was applied (InStat3, GraphPad Software, San Diego, CA, USA).

3. Results

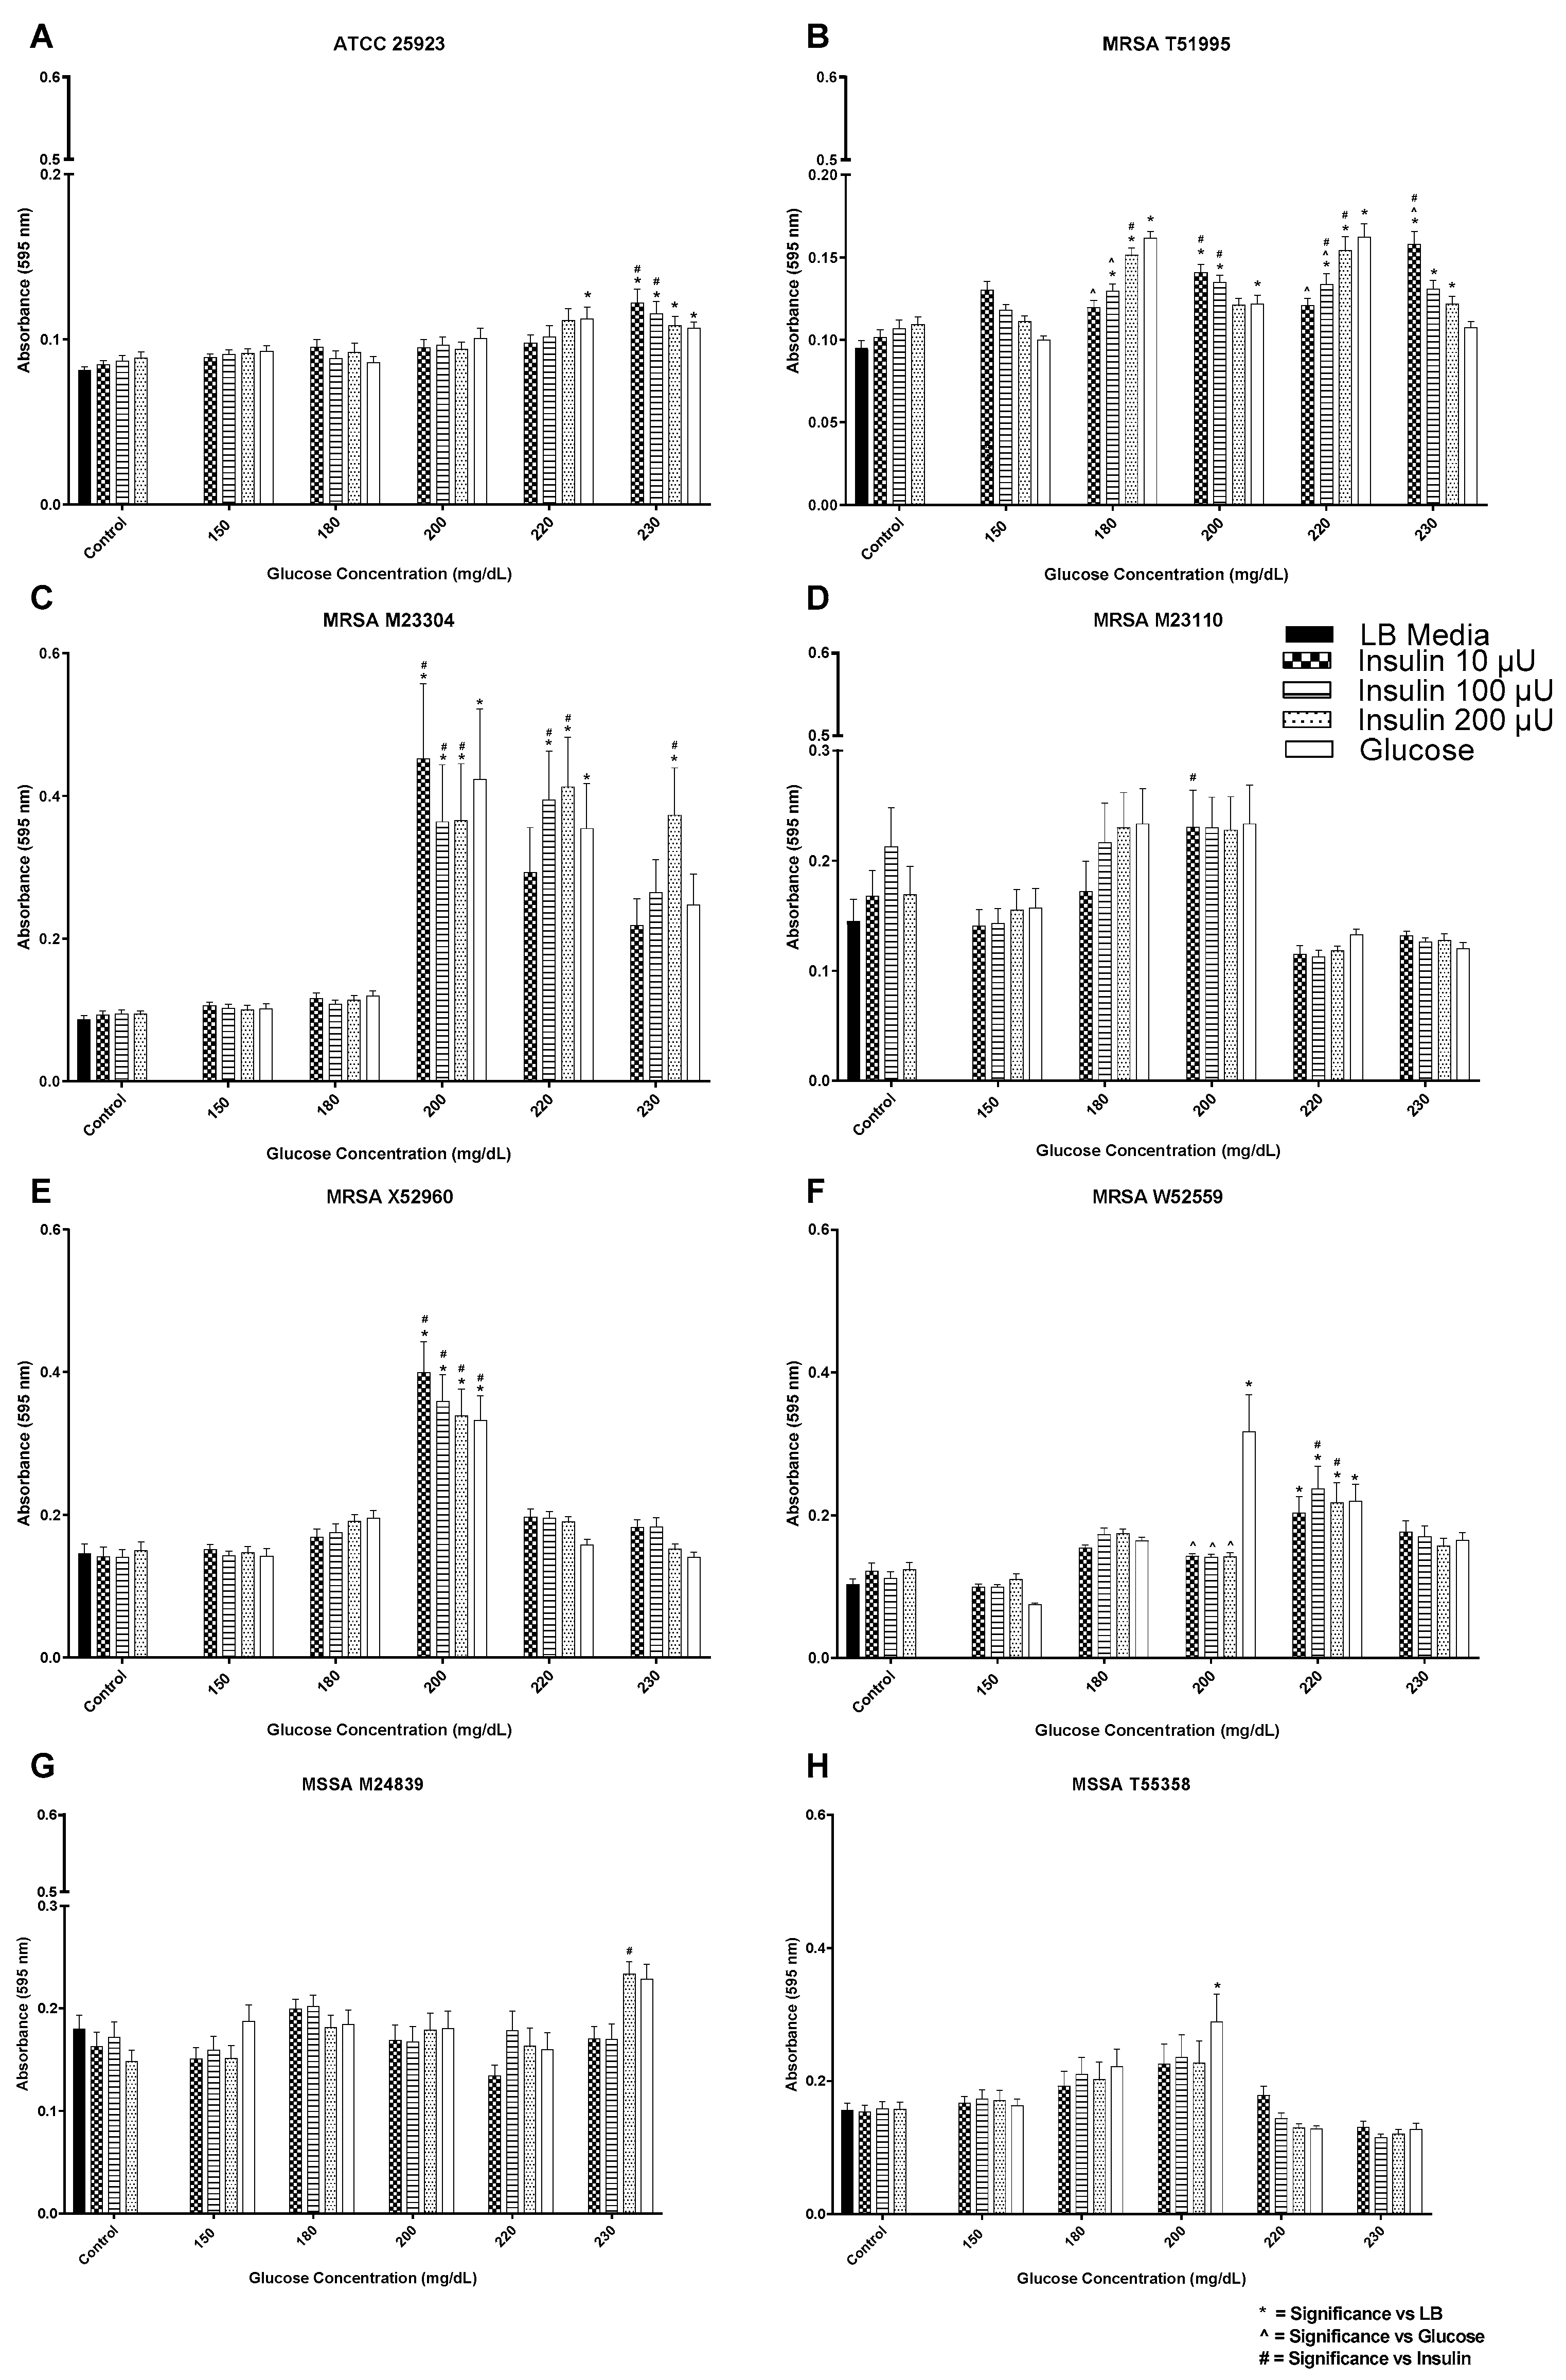
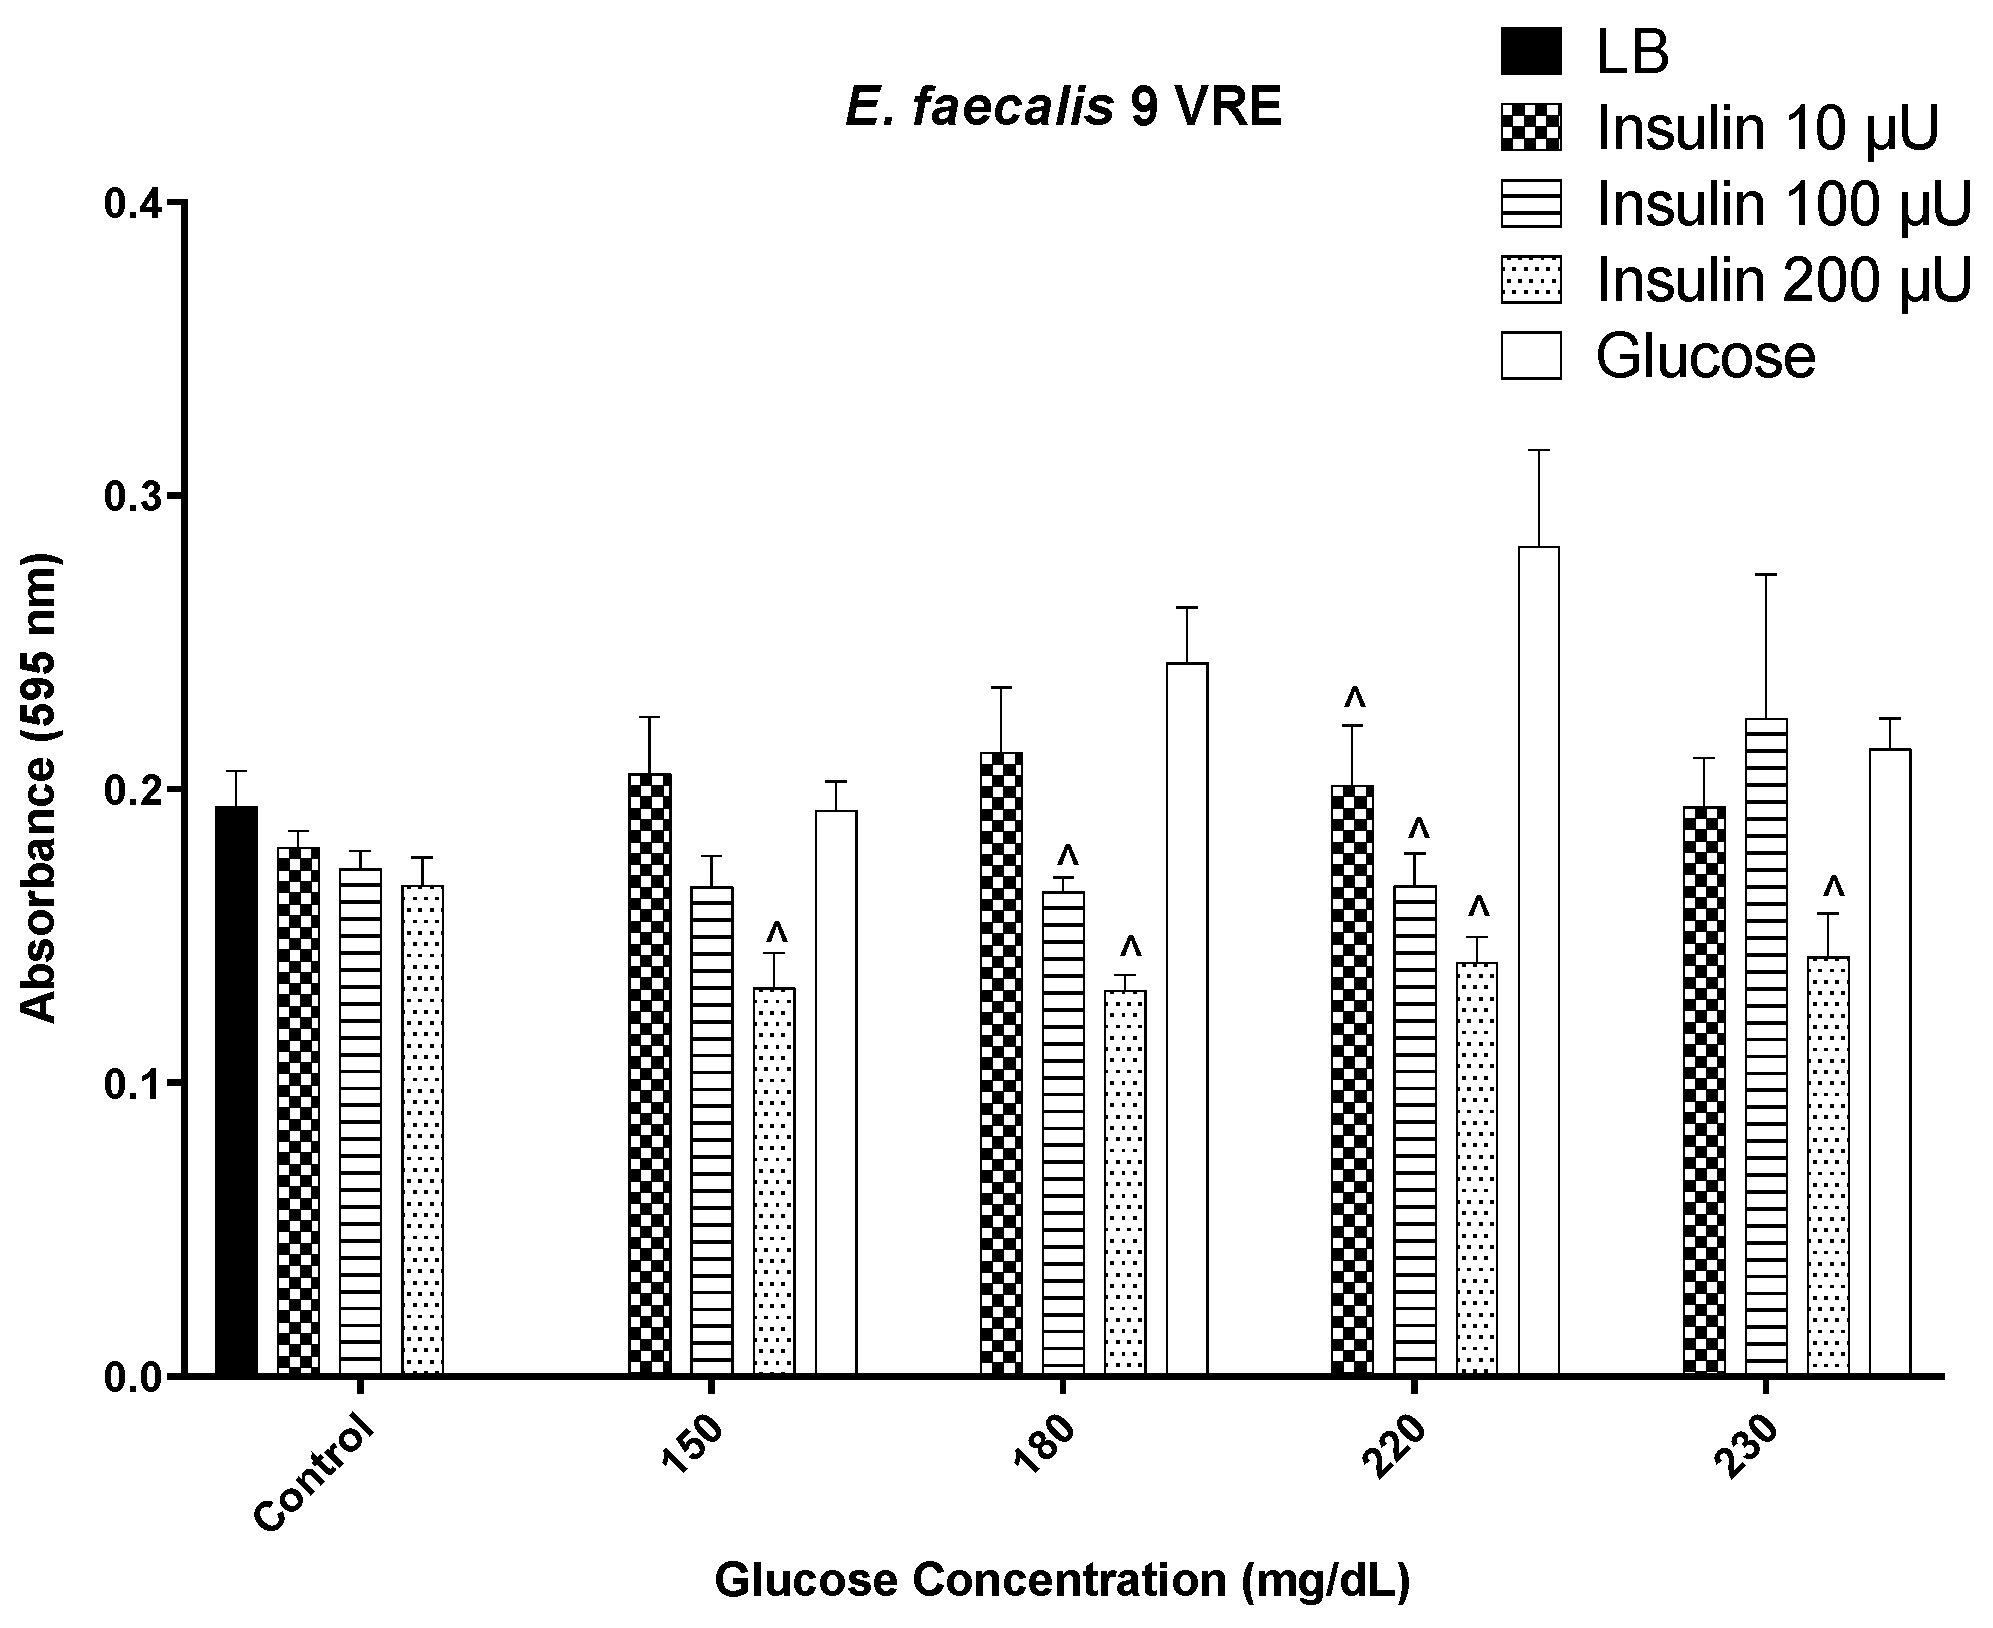
3.1. Insulin/Glucose Concentration Effect on Biofilm Formation by MSSA, MRSA, and VRE

Seven clinical isolates (5 MRSA and 2 MSSA) and one standard control MSSA strain were screened for biofilm formation in response to insulin and glucose (Figure 1A–H). Regardless of the isolation source, i.e., blood, the level of biofilm expressed by the various isolates was heterologous. For the stable MSSA isolate ATCC 25923 (Figure 1A), biofilm levels maximized at or above the insulin/glucose ratio of 200 µU/mL insulin and 220 mg/dL glucose. MSSA clinical isolates T55358 and M24839 (Figure 1B,C) biofilm levels were not significantly affected by the presence of insulin, regardless of concentration tested with biofilm level being a general reflection of glucose level. The exception to this trend was that of insulin/glucose ratio of 200 µU/mL insulin for T55358, where biofilm formation was enhanced, and 230 mg/dL glucose for M24839, where its biofilm level was suppressed when either 10 or 100 µU/mL insulin was present, as compared to 230 mg/dL glucose alone. For isolates X52960, M23110, and M23304, insulin had no significant effect on biofilm formation as compared to that of glucose, although maximal biofilm levels were measured at or around 200 mg/dL glucose (Figure 1D–F). Of interest is the glucose concentration specificity for MRSA X52960, which exhibited its maximal peak biofilm level at 200 before decreasing (at 230 mg/dL) to levels similar to those measured for 150 and 180 mg/dL glucose. In contrast, insulin at all concentrations suppressed MRSA W52559 maximal glucose biofilm levels (200 mg/dL glucose) while conversely enhancing biofilm production as compared to glucose alone (150 mg/dL) (Figure 1G). The greatest insulin concentration effect per glucose concentration was measured for MRSA T51995. These findings indicate that biofilm formation in response to insulin/glucose ratios was isolate, insulin, and glucose concentration dependent, although overall, the maximal biofilm level was measured at or around 200 mg/dL, regardless of insulin level at that glucose concentration. In addition to the ability to respond to insulin, randomly chosen isolates (Figure 2) also exhibited the ability to intrinsically bind FITC-insulin. Interestingly, the overall pattern of binding for the laboratory strain MSSA ATCC 25923 displayed cocci in clusters with variable levels of fluorescent intensity. In contrast, MRSA T51995 fluorescence was localized to the coccal margins for a majority of the cells.
Vancomycin-resistant E. faecalis exhibited a pattern of biofilm formation that was insulin concentration sensitive, with the greater the insulin level, the more controlled the level of biofilm. Although biofilm levels increased with increasing glucose alone, the presence of insulin maintained biofilm levels at a constant level through 220 mg/dL glucose (Figure 3). However, at 230 mg/dL glucose, insulin’s ability to suppress biofilm formation was similar to glucose at 100 µU/mL insulin. This isolate exhibits intrinsic ability to bind FITC-insulin in a varied pattern (Figure 4).

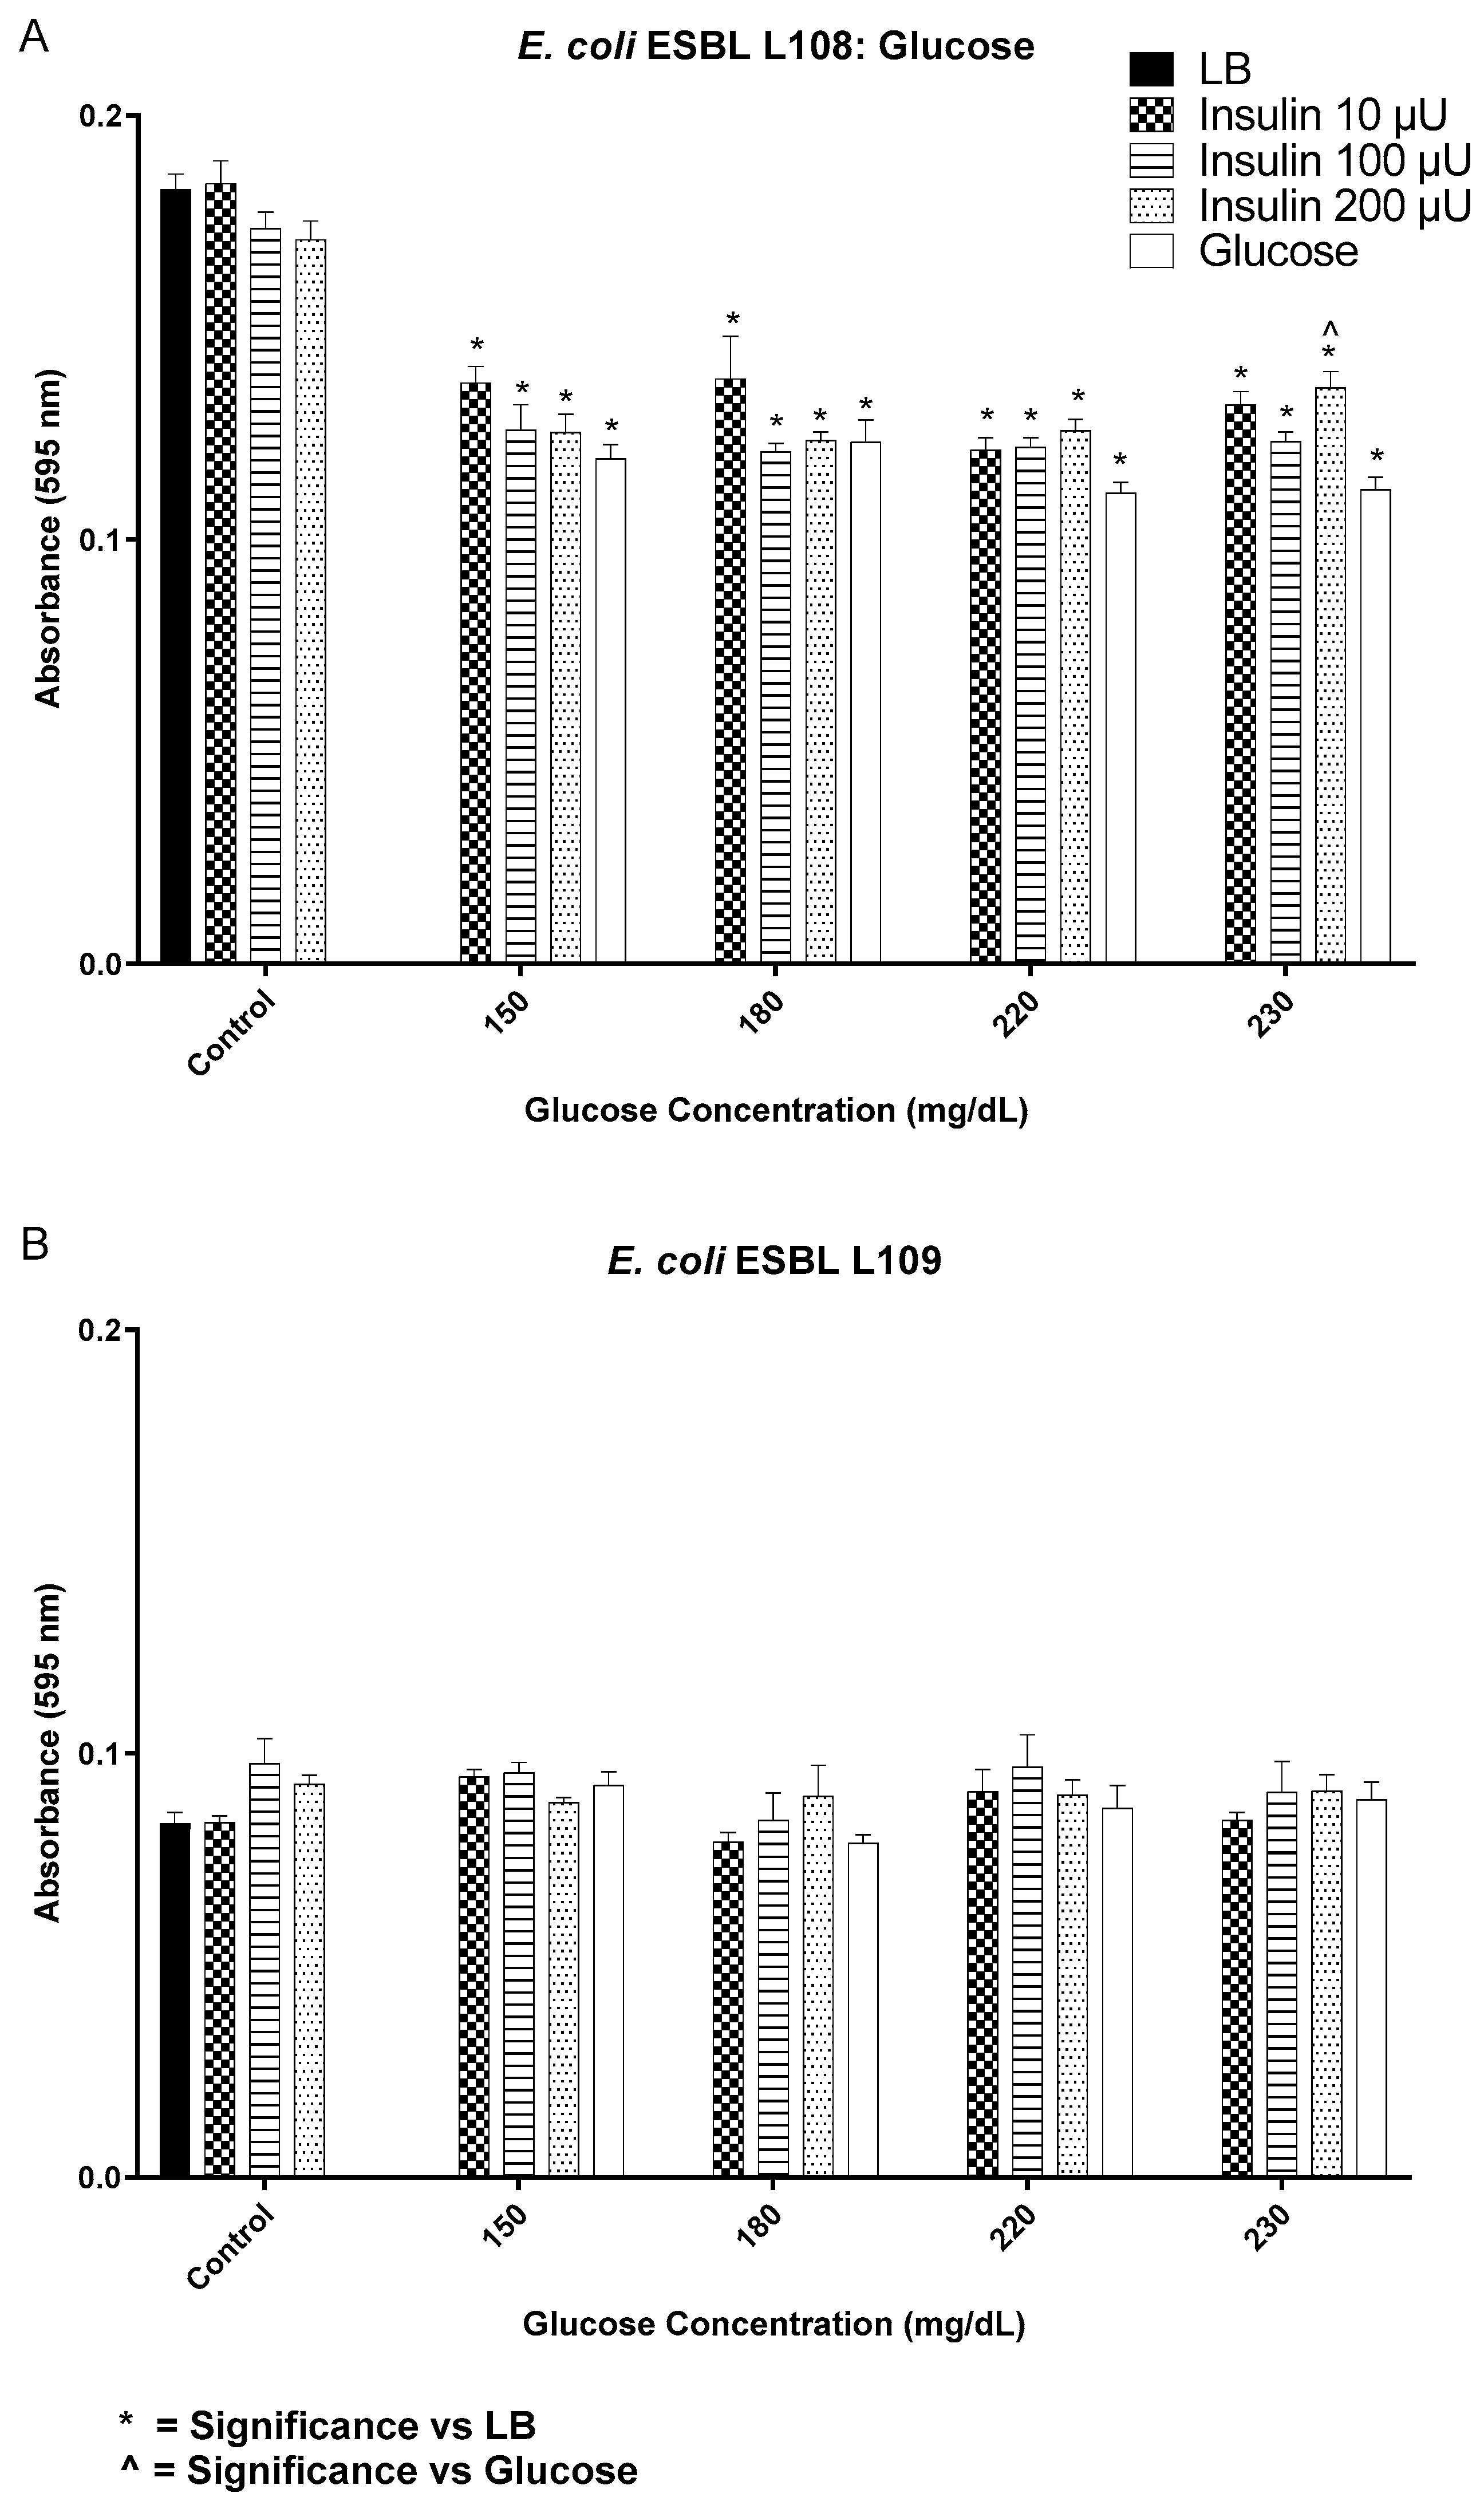
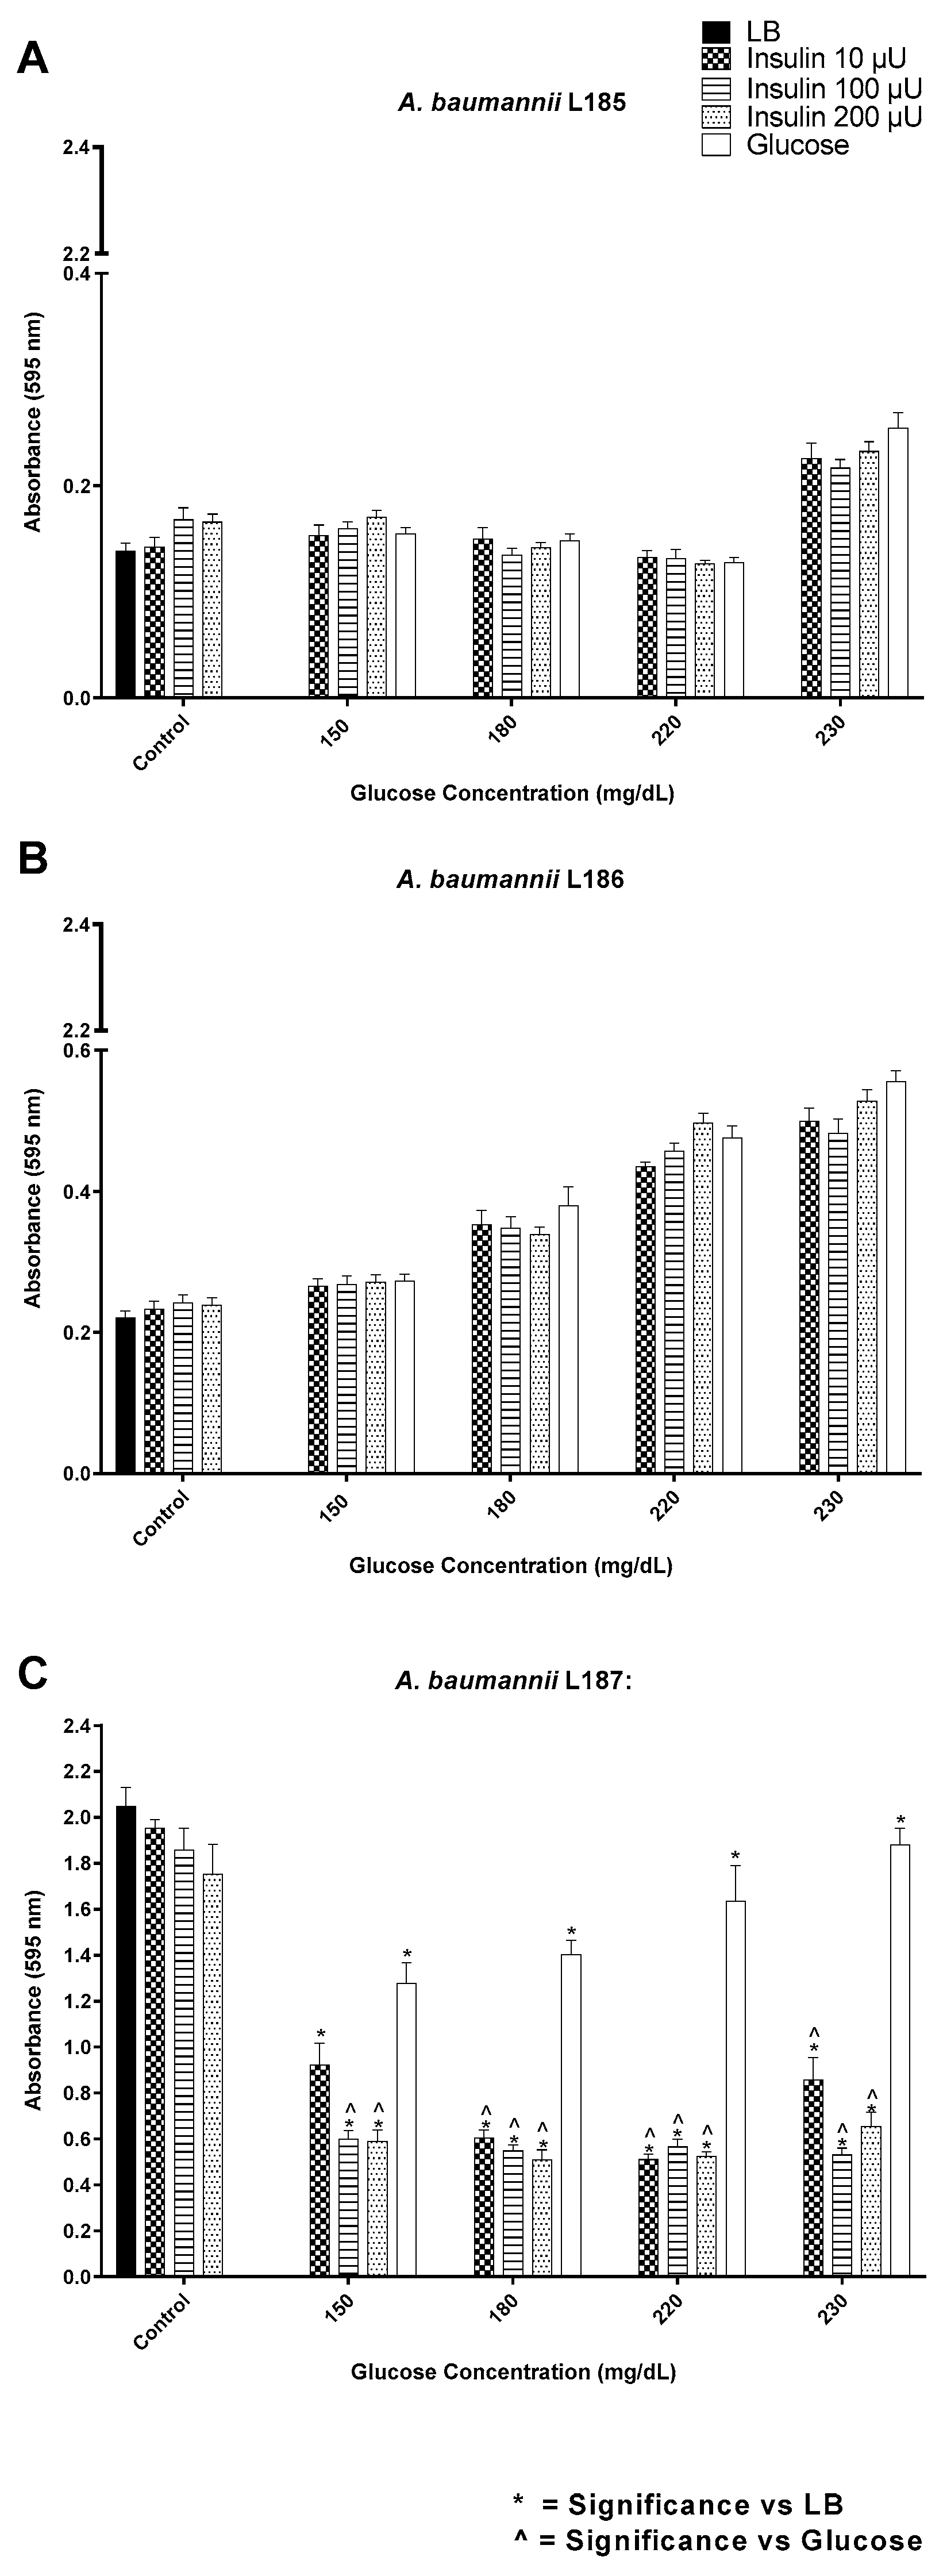
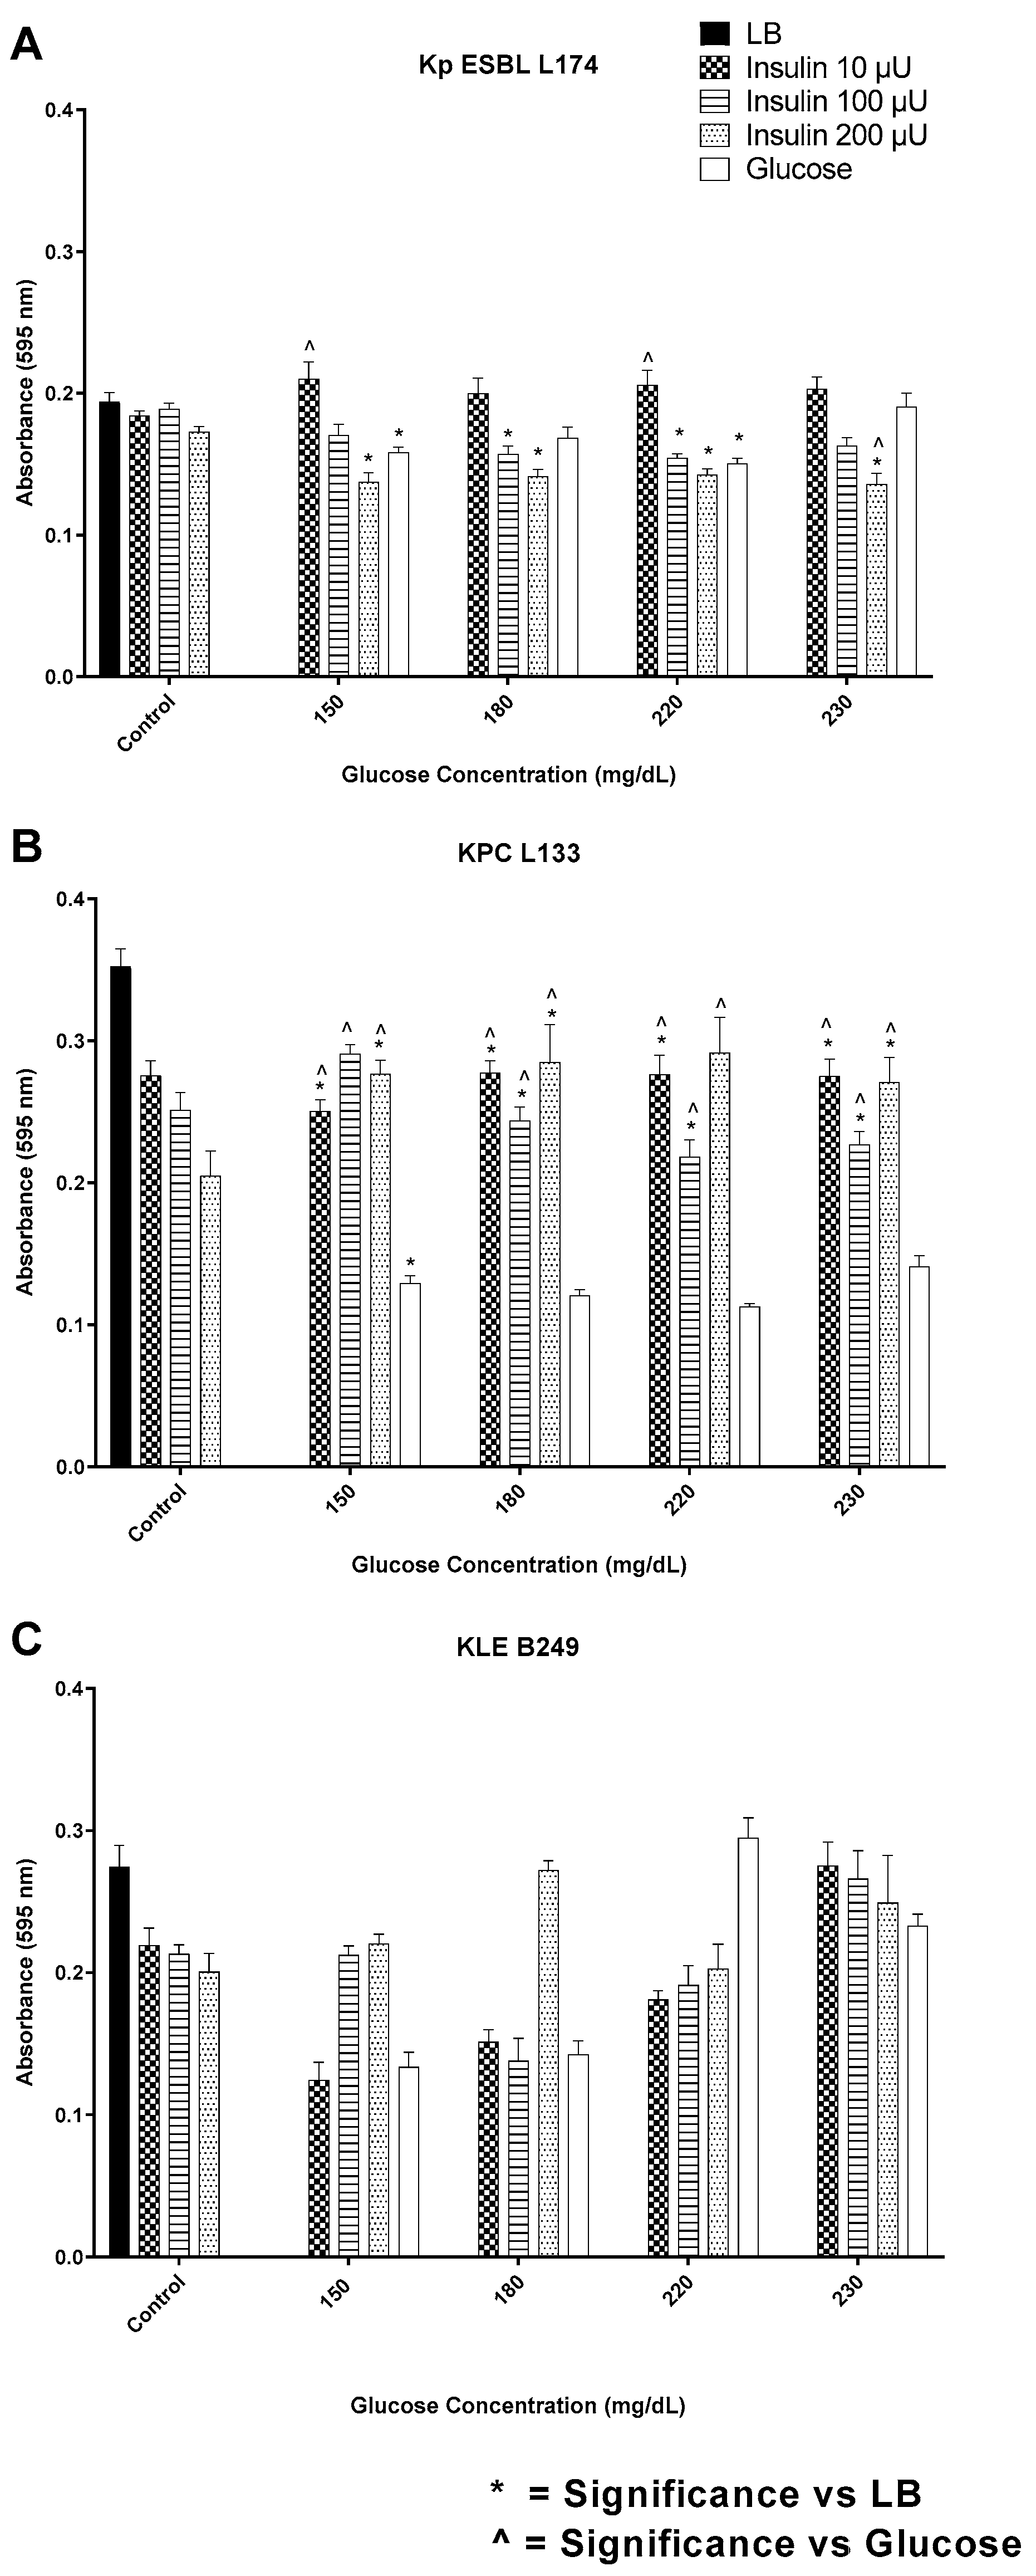
3.2. Insulin/Glucose Concentration Effect on Biofilm Formation by Gram-Negative Pathogens

Intrinsic binding of FITC-insulin to E. coli L108 resulted in a varied pattern of fluorescence (Figure 5). Cells exhibited mono- and bi-polar capping, while others showed an even or punctate pattern of fluorescence. For E. coli ESBL 108 at 220 and 230 mg/dL glucose, all concentrations of insulin induced significantly more biofilm as compared to glucose alone, while at the lowest insulin concentration tested (10 µU/mL), there was enhanced biofilm production for 150 and 180 mg/dL glucose concentrations (Figure 6A). In contrast, for E. coli ESBL L109 insulin/glucose effect on biofilm expression, there was no significant difference in biofilm level for 10, 100, and 200 µU/mL insulin regardless of glucose concentration (Figure 6B).
Similar to what was observed for E. coli, A. baumannii L187 exhibits intrinsic binding of insulin in various patterns, e.g., polar, punctate, and even (Figure 7). Insulin had no significant effect on biofilm formation for isolates L185 and L186 (Figure 8A,B). In contrast, for isolate L187, insulin at all concentrations tested significantly suppressed biofilm formation as compared to glucose alone control for all glucose concentrations (Figure 8C).
The response of the three multidrug-resistant clinical isolates of K. pneumoniae screened for their biofilm production response to insulin/glucose or glucose alone is shown in Figure 9A–C.
For all three isolates, insulin affected biofilm expression in an insulin/glucose-specific ratio. For K. pneumoniae ESBL L174, regardless of glucose concentration below 230 mg/dL, insulin at 10 µU/mL enhanced biofilm to a similar extent, while 200 µU/mL insulin at 230 mg/dL glucose suppressed biofilm expression (Figure 9A). In contrast, for isolate KPC L133, the insulin/glucose ratio over the range of insulin concentrations enhanced biofilm production as compared to glucose alone control (Figure 9B). This concentration-specific insulin regulation of biofilm level was most prominent with isolate K. pneumoniae B249 (Figure 9C). At 180 mg/dL glucose, the presence of 200 µU/mL insulin induced a biofilm level similar to that of the maximal levels measured for this isolate. However, the insulin-induced variability was absent at 230 mg/dL glucose, where the biofilm levels measured for three insulin concentrations were similar to that of glucose alone. Like the other Gram-negative and Gram-positive bacteria tested, K. pneumoniae L133 was able to intrinsically bind FITC-insulin in a heterogenous pattern (Figure 10).
Since sepsis is associated with capsule formation, whether there is a correlation between biofilm formation and capsule production with respect to response to the insulin/glucose ratio for K. pneumoniae was examined using a highly stable encapsulated strain of K. pneumoniae ATCC 27736 (Figure 11A–F) [9,22]. As with the clinical isolates, biofilm formation by this isolate was affected by the presence of insulin at all concentrations tested (Figure 11A,C,E). In contrast, the production of the acidic polysaccharide capsule was unaffected by either insulin or glucose concentrations (Figure 11B,D,F).

4. Discussion

The hypermetabolic stress response of hyperglycemia has been shown to be closely associated with injury, trauma events, and/or acute hospital presentation [23,24,25,26]. Hyperglycemia during these hypermetabolic stress states not only poses a danger for individuals diagnosed with diabetes but represents a high critical risk for those with no known previous risk for diabetes which can account for 12% of adult patients admitted [23,24,25,26]. Beyond the known and undiagnosed diabetic individuals are the remaining trauma patients who respond to the traumatic assault with intrinsic transient hyperglycemia.
The mechanism underlying hyperglycemia is complex and includes metabolic and hormonal changes associated with increased circulating counterregulatory hormones and proinflammatory cytokines along with exogenous interventions, including the use of vasopressors, corticosteroids, and non-oral (enteral and parenteral) administration of nourishment [26]. Regardless of the underlying cause, the occurrence of hyperglycemia in acute hospitalized patients has with it increased morbidity and mortality, including that of sepsis [27]. This risk of complications and mortality is correlated with the extent of hyperglycemia. Interestingly, the level of trauma-associated hyperglycemia is typically higher in patients without known diabetes [23,28]. The increased risk from hyperglycemia including that of sepsis and multiorgan failure is empirically controlled with intensive insulin therapy [7,29,30,31]. This is the first study to systematically examine how the interaction of insulin with glucose over the physiologic range affects the expression of a virulence factor known to play a role in sepsis [32,33].
Insulin is a phylogenetically ancient protein not only synthesized across the taxonomic kingdoms but regardless of which source, exhibits cross-kingdom activity [13,14,15,16,34,35,36,37,38,39]. Although E. coli has been demonstrated to synthesize its own insulin, as well as respond to human insulin, it has only been recently that its role as a behavioral modifier in E. coli phenotypic expression regulation has been described [10,17]. Insulin can function as an interkingdom quorum signaling compound that affects the expression of biofilm formation in E. coli in a manner that is nutrient and environmentally sensitive [17,40,41,42,43]. Furthermore, in E. coli, human recombinant insulin (rh-insulin), like other quorum chemical signaling compounds, has been shown to play an important role in the regulation of E. coli chemotactic responses and growth rates, in addition to biofilm formation [10,12,41,42,43]. Of interest is that the ability of rh-insulin to function as an interkingdom quorum signal compound is not limited to E. coli but has also been demonstrated in S. aureus [11,44]. However, the response of pathogens associated with sepsis, particularly multidrug-resistant organisms wherein the presence of biofilm would decrease clinical treatment success in trauma, has not been examined.
This is the first report of the widespread ability of representative strains of blood-borne pathogens associated with sepsis to intrinsically bind insulin, regardless of cell wall architecture, i.e., Gram-positive or Gram-negative. In addition, with respect to the Gram-negative bacteria, there were cells that exhibited distinct patterns of binding: polar, punctate, and even. Of note is the preliminary finding that significant effects of insulin/glucose on biofilm formation do not appear to be a requirement for the binding of FITC-insulin to cells as shown by the photomicrograph of A. baumannii 185. Although we have not observed a lack of insulin binding regardless of species or cell wall architecture (Gram-positive or Gram-negative), this apparent receptor binding by insulin requires further study with the putative receptor characterized. A consideration pertinent to the insulin receptor is that the distribution of receptors could be linked to specific types of actions, e.g., motility–chemotaxis representing a more planktonic behavior, vis-à-vis sessile, or biofilm-associated behaviors. Especially notable are the reports of polar clustering of chemotactic receptors [45,46,47,48]. Interestingly, insulin receptors can exhibit a similar polar pattern of clustered receptors as reported for E. coli chemotactic receptors. This observation is intriguing since insulin has not been reported as a chemotactic agent for Gram-negative bacteria. It also indicates that exploitation of this receptor-signaling expression may provide an avenue for prevention of biofilm formation, or the potential conversion of biofilm sessile populations to planktonic populations that would be conceivably easier to eliminate from the host.
With regards to biofilm formation, the response of the organisms to insulin/glucose across physiologic insulin/glucose relevant concentrations was highly variable, dependent on the isolate, insulin level, and glucose concentration. Overall, the general pattern for all microbes was that glucose at 200 mg/dL, regardless of insulin level, induced the highest amount of biofilm. This correlates with the empirical findings that treatment of trauma patients to maintain glucose levels below 200 mg/dL decreases the risk for sepsis. The biofilm formation ranged from insulin (10 µU/mL) suppression of biofilm as compared to glucose alone at 180 mg/dL (MRSA T51995) to enhanced biofilm production at the same insulin concentration at 230 mg/dL glucose. In contrast, for VRE, insulin inhibited biofilm formation in a concentration-specific manner, maintaining constant biofilm levels regardless of the glucose concentration present. Suppression of biofilm was also notable for A. baumannii L187 at all insulin concentrations compared to glucose alone. However, of greatest concern were the effects of insulin on Klebsiella isolates with insulin causing enhanced production of biofilm as compared to glucose alone. The potential use of trauma protocol treatment enhances the presence of biofilm formation in a bacteremic individual could have an adverse outcome on antibiotic treatment due to the protective effects of biofilms [49].
The mechanism by which insulin/glucose modulates biofilm formation is not known. It is interesting that the differential staining of an encapsulated organism, K. pneumoniae provides some indication that the biofilm components modulated by insulin/glucose are not likely the acidic polysaccharide (Alcian blue stainable) component, but may be more related to the crystal violet (gentian violet) stainable biofilm components, e.g., protein, lipids and nucleic acids [20,50]. Taken together, these findings lay a foundation that indicates that although empirical administration of insulin in hyperglycemic acute trauma patients can be somewhat effective, there is also the potential that without knowledge of how the insulin/glucose can affect patients who may transition into sepsis, adequate antibiotic treatment could be hampered, particularly if the isolate was both multidrug-resistant as well as phenotypically induced to express higher levels of biofilm. This scenario could unfortunately also function to synergistically select for increased drug resistance [51]. Our initial study points out the need for the development of hormone biofilmgrams analogous to the antibiograms currently in clinical usage for predictive use in a septic event. In addition, it points out the need to develop real-time insulin measurement for use with constant glucose monitoring since together with the institution of clinical microbial biofilm screening, there is the potential to decrease patient morbidity and mortality, as well as overall hospital costs in trauma patients.

5. Conclusions

In both critically ill and noncritically ill patients, extremes in blood glucose levels tend to lead to poor outcomes. However, glycemic targets obtained through the administration of insulin can be difficult to maintain since critically ill individuals exhibit metabolic instability with an inclination to shift insulin requirements. A risk in this patient population is the development of bacteremia with subsequent initiation of infection site colonization with biofilm formation. Although previous studies have shown that for a select few of the bacteria examined, their response to insulin and or glucose with respect to biofilm formation was insulin and/or glucose-concentration specific, we have demonstrated in this foundational study that not only do organisms representing both Gram-positive and Gram-negative cell wall architectures exhibit an intrinsic ability to bind insulin, but that their response to insulin/glucose ratios is also species and strain specific. Hyperglycemia is associated with infectious morbidity in hospitalized and trauma patients. Since this metabolic stress response is an independent predictor of patient outcome, as is sepsis with both associated with increased mortality in the trauma population, there is the potential that modulation of the insulin/glucose ratio, while it may contribute to poorer patient outcome, could also be modified in a real-time clinical setting to suppress the formation of biofilms with the potential of affecting a positive patient outcome. Further studies expanding these findings as well as the development of real-time in situ insulin measurement probes are in progress.

Author Contributions

Conceptualization: B.J.P. methodology and investigation, B.J.P. and S.H.; formal analysis, B.J.P., I.M.S., M.I.K., E.S., A.M. and S.H.; resources, B.J.P.; data curation, A.K. and S.H.; writing—original draft preparation, B.J.P., A.K., I.M.S. and M.I.K.; writing—review and editing, A.M., E.S., M.I.K., A.K. and I.M.S.; project administration, B.J.P., funding acquisition, B.J.P. All authors have read and agreed to the published version of the manuscript.

Funding

This research was funded by the Midwestern University Office of Research and Sponsored Programs, the Chicago College of Osteopathic Medicine, and the MWU College of Graduate Studies.

Institutional Review Board Statement

Not applicable.

Informed Consent Statement

Not applicable.

Data Availability Statement

Data are contained within the article.

Conflicts of Interest

The authors declare no conflict of interest.

References

  1. Qaseem, A.; Humphrey, L.L.; Chou, R.; Snow, V.; Shekelle, P. Use of Intensive Insulin Therapy for the Management of Glycemic Control in Hospitalized Patients: A Clinical Practice Guideline from the American College of Physicians. Ann. Intern. Med. 2011, 154, 260–267. [Google Scholar] [CrossRef]
  2. Van den Berghe, G. What’s New in Glucose Control in the ICU? Intensive Care Med. 2013, 39, 823–825. [Google Scholar] [CrossRef]
  3. Ellahham, S. Insulin Therapy in Critically Ill Patients. Vasc. Health Risk Manag. 2010, 1089–1101. [Google Scholar] [CrossRef]
  4. Ellahham, S. Molecular Mechanisms of Hyperglycemia and Cardiovascular-Related Events in Critically Ill Patients: Rationale For The Clinical Benefits of Insulin Therapy. Clin. Epidemiol. 2010, 2, 281–288. [Google Scholar] [CrossRef]
  5. Barsoumian, A.E.; Mende, K.; Sanchez, C.J.; Beckius, M.L.; Wenke, J.C.; Murray, C.K.; Akers, K.S. Clinical Infectious Outcomes Associated with Biofilm-Related Bacterial Infections: A Retrospective Chart Review. BMC Infect. Dis. 2015, 15, 223. [Google Scholar] [CrossRef]
  6. Waldrop, R.; McLaren, A.; Calara, F.; McLemore, R. Biofilm Growth Has a Threshold Response to Glucose In Vitro. Clin. Orthop. Relat. Res. 2014, 472, 3305–3310. [Google Scholar] [CrossRef]
  7. Jacobi, J.; Bircher, N.; Krinsley, J.; Agus, M.; Braithwaite, S.S.; Deutschman, C.; Freire, A.X.; Geehan, D.; Kohl, B.; Nasraway, S.A.; et al. Guidelines for the Use of An Insulin Infusion for The Management of Hyperglycemia in Critically Ill Patients. Crit. Care Med. 2012, 40, 3251–3276. [Google Scholar] [CrossRef]
  8. Du, M.; Zhang, Q.-H.; Tang, R.; Liu, H.-Y.; Ji, Z.-S.; Gao, Z.; Wang, Y.; You, H.-Y.; Hao, J.-W.; Zhou, M. Prognostic Significance of Plasma Insulin Level for Deep Venous Thrombosis in Patients with Severe Traumatic Brain Injury in Critical Care. Neurocrit. Care 2023, 38, 263–278. [Google Scholar] [CrossRef]
  9. Minasyan, H. Sepsis: Mechanisms of Bacterial Injury to the Patient. Scand. J. Trauma Resusc. Emerg. Med. 2019, 27, 19. [Google Scholar] [CrossRef]
  10. Klosowska, K.; Plotkin, B. Human Insulin Modulation of Escherichia coli Adherence and Chemotaxis. Am. J. Infect. Dis. 2006, 2, 197–200. [Google Scholar] [CrossRef]
  11. Plotkin, B.; Wu, Z.; Ward, K.; Nadella, S.; Green, J. Effect of Human Insulin on the Formation of Catheter-Associated E. coli Biofilms. Open J. Urol. 2014, 4, 49–56. [Google Scholar] [CrossRef]
  12. Plotkin, B.J.; Viselli, S.M. Effect of Insulin on Microbial Growth. Curr. Microbiol. 2000, 41, 60–64. [Google Scholar] [CrossRef] [PubMed]
  13. Xavier-Filho, J.; Oliveira, A.E.A.; Silva, L.B.D.; Rocha, A.; Venancio, T.; Machado, O.; Oliva, M.L.; Fernandes, K.; Xavier-Neto, J. Plant Insulin or Glucokinin: A Conflicting Issue. Braz. J. Plant Physiol. 2003, 15, 67–78. [Google Scholar] [CrossRef]
  14. Fawell, S.E.; Lenard, J. A Specific Insulin Receptor and Tyrosine Kinase Activity in the Membranes of Neurospora crassa. Biochem. Biophys. Res. Commun. 1988, 155, 59–65. [Google Scholar] [CrossRef] [PubMed]
  15. Christensen, S. Insulin Rescues the Unicellular Eucaryote Tetrahymena from Dying in A Complete, Synthetic Nutrient Medium. Cell Biol. Intern. 1993, 17, 833–837. [Google Scholar] [CrossRef]
  16. LeRoith, D.; Shiloach, J.; Roth, J.; Lesniak, M.A. Insulin or a Closely Related Molecule Is Native to Escherichia coli. J. Biol. Chem. 1981, 256, 6533–6536. [Google Scholar] [CrossRef]
  17. Patel, N.; Curtis, J.C.; Plotkin, B.J. Insulin Regulation of Escherichia coli Abiotic Biofilm Formation: Effect of Nutrients and Growth Conditions. Antibiotics 2021, 10, 1349. [Google Scholar] [CrossRef]
  18. Konaklieva, M.; Plotkin, B. Chemical Communication—Do We Have a Quorum? Mini-Rev. Med. Chem. 2006, 6, 817–825. [Google Scholar] [CrossRef]
  19. Christensen, G.D.; Simpson, W.A.; Younger, J.J.; Baddour, L.M.; Barrett, F.F.; Melton, D.M.; Beachey, E.H. Adherence of Coagulase-Negative Staphylococci To Plastic Tissue Culture Plates: A Quantitative Model for the Adherence of Staphylococci to Medical Devices. J. Clin. Microbiol. 1985, 22, 996–1006. [Google Scholar] [CrossRef]
  20. Hronowski, L.; Anastassiades, T.P. Quantitation and Interaction of Glycosaminoglycans with Alcian Blue in Dimethyl Sulfoxide Solutions. Anal. Biochem. 1979, 93, 60–72. [Google Scholar] [CrossRef]
  21. Farzam, F.; Plotkin, B.J. Effect of Sub-Mics of Antibiotics on The Hydrophobicity and Production of Acidic Polysaccharide by Vibrio vulnificus. Chemotherapy 2001, 47, 184–193. [Google Scholar] [CrossRef] [PubMed]
  22. Mann-Salinas, E.A.; Baun, M.M.; Meininger, J.C.; Murray, C.K.; Aden, J.K.; Wolf, S.E.; Wade, C.E. Novel Predictors of Sepsis Outperform the American Burn Association Sepsis Criteria in the Burn Intensive Care Unit Patient. J. Burn. Care Res. 2013, 34, 31–43. [Google Scholar] [CrossRef] [PubMed]
  23. Laird, A.M.; Miller, P.R.; Kilgo, P.D.; Meredith, J.W.; Chang, M.C. Relationship of Early Hyperglycemia to Mortality in Trauma Patients. J. Trauma-Inj. Infect. Crit. Care 2004, 56, 1058–1062. [Google Scholar] [CrossRef] [PubMed]
  24. Mayberry, J.C. The Importance of Hyperglycemia Control in Orthopedic Trauma Patients. J. Orthop. Trauma 2013, 27, 21. [Google Scholar] [CrossRef]
  25. Sung, J.; Bochicchio, G.V.; Joshi, M.; Bochicchio, K.; Tracy, K.; Scalea, T.M. Admission Hyperglycemia Is Predictive of Outcome in Critically III Trauma Patients. J. Trauma-Inj. Infect. Crit. Care 2005, 59, 80–83. [Google Scholar] [CrossRef]
  26. Turina, M.; Fry, D.E.; Polk, H.C. Acute Hyperglycemia and the Innate Immune System: Clinical, Cellular, and Molecular Aspects. Crit. Care Med. 2005, 33, 1624–1633. [Google Scholar] [CrossRef]
  27. Karunakar, M.A.; Staples, K.S. Does Stress-Induced Hyperglycemia Increase the Risk of Perioperative Infectious Complications in Orthopaedic Trauma Patients? J. Orthop. Trauma 2010, 24, 752–756. [Google Scholar] [CrossRef]
  28. Richards, J.E.; Kauffmann, R.M.; Obremskey, W.T.; May, A.K. Stress-Induced Hyperglycemia as a Risk Factor for Surgical-Site Infection in Nondiabetic Orthopedic Trauma Patients Admitted to the Intensive Care Unit. J. Orthop. Trauma 2013, 27, 16–21. [Google Scholar] [CrossRef]
  29. Jeschke, M.G.; Klein, D.; Herndon, D.N. Insulin Treatment Improves the Systemic Inflammatory Reaction to Severe Trauma. Ann. Surg. 2004, 239, 553–560. [Google Scholar] [CrossRef]
  30. Klein, D.; Schubert, T.; Horch, R.E.; Jauch, K.W.; Jeschke, M.G. Insulin Treatment Improves Hepatic Morphology and Function through Modulation of Hepatic Signals after Severe Trauma. Ann. Surg. 2004, 240, 340–349. [Google Scholar] [CrossRef]
  31. Tannuri, U.; Coelho, M.C.M.; Maksoud, J.G. Serum-Insulin Glucose Ratio and Urinary Loss of Insulin After Trauma in Young Animals—Effect of Adrenergic Blockage. Pediatr. Surg. Int. 1993, 8, 210–214. [Google Scholar] [CrossRef]
  32. Hospenthal, D.R.; Green, A.D.; Crouch, H.K.; English, J.F.; Pool, J.; Yun, H.C.; Murray, C.K.; Prevention Combat-Related, I. Infection Prevention and Control in Deployed Military Medical Treatment Facilities. J. Trauma-Inj. Infect. Crit. Care 2011, 71, S290–S298. [Google Scholar] [CrossRef] [PubMed]
  33. Yano, H.; Kinoshita, M.; Fujino, K.; Nakashima, M.; Yamamoto, Y.; Miyazaki, H.; Hamada, K.; Ono, S.; Iwaya, K.; Saitoh, D.; et al. Insulin Treatment Directly Restores Neutrophil Phagocytosis and Bactericidal Activity in Diabetic Mice and Thereby Improves Surgical Site Staphylococcus aureus Infection. Infect. Immun. 2012, 80, 4409–4416. [Google Scholar] [CrossRef] [PubMed]
  34. LeRoith, D.; Lesniak, M.; Roth, J. Insulin in Insects and Annelids. Diabetes 1981, 30, 70–76. [Google Scholar] [CrossRef] [PubMed]
  35. LeRoith, D.; Shiloach, J.; Heffron, R.; Rubinovitz, C.; Tanenbaum, R.; Roth, J. Insulin-Related Material in Microbes: Similarities and Differences from Mammalian Insulins. Can. J. Biochem. Cell Biol. 1985, 63, 839–849. [Google Scholar] [CrossRef] [PubMed]
  36. LeRoith, D.; Shiloach, J.; Roth, J.; Lesniak, M. Evolutionary Origins of Vertebrate Hormones: Substances Similar to Mammalian Insulins are Native to Unicellular Eukaryotes. Proc. Natl. Acad. Sci. USA 1980, 77, 6184–6188. [Google Scholar] [CrossRef]
  37. Roth, J.; Leroith, D.; Collier, E.; Watkinson, A.; Lesniak, M. The Evolutionary Origins of Intercellular Communication and the Maginot Lines of the Mind. Ann. N. Y. Acad. Sci. 1986, 463, 1–11. [Google Scholar] [CrossRef]
  38. Dietz, E.; Uhlenbruck, G. An Insulin Receptor in Microorganisms: Fact or Fiction? Naturwissensenschaften 1989, 76, 269–270. [Google Scholar] [CrossRef]
  39. Feraco, D.; Blaha, M.; Khan, S.; Green, J.M.; Plotkin, B.J. Host Environmental Signals and Effects on Biofilm Formation. Microb. Pathog. 2016, 99, 253–263. [Google Scholar] [CrossRef]
  40. Miller, M.; Bassler, B. Quorum Sensing in Bacteria. Annu. Rev. Microbiol. 2001, 55, 165–199. [Google Scholar] [CrossRef]
  41. Taga, M.E.; Bassler, B.L. Chemical Communication Among Bacteria. Proc. Natl. Acad. Sci. USA 2003, 100, 14549–14554. [Google Scholar] [CrossRef] [PubMed]
  42. Waters, C.M.; Bassler, B.L. Quorum Sensing: Cell-To-Cell Communication in Bacteria. Annu. Rev. Cell Dev. Biol. 2005, 21, 319–346. [Google Scholar] [CrossRef] [PubMed]
  43. Jayaraman, A.; Wood, T.K. Bacterial Quorum Sensing: Signals, Circuits, and Implications for Biofilms and Disease. Annu. Rev. Biomed. Eng. 2008, 10, 145–167. [Google Scholar] [CrossRef]
  44. Kirby, D.; Raino, C.; Rabor, S.F., Jr.; Wasson, C.; Plotkin, B. Semi-Automated Method for Multi-Tasking Measurement of Microbial Growth, Capsule, and Biofilm Formation. Adv. Microbiol. 2012, 2, 623–628. [Google Scholar] [CrossRef]
  45. Shiomi, D.; Banno, S.; Homma, M.; Kawagishi, I. Stabilization of Polar Localization of a Chemoreceptor Via Its Covalent Modifications and Its Communication with a Different Chemoreceptor. J. Bacteriol. 2005, 187, 7647–7654. [Google Scholar] [CrossRef] [PubMed]
  46. Sourjik, V. Receptor Clustering and Signal Processing in E. coli Chemotaxis. Trends Microbiol. 2004, 12, 569–576. [Google Scholar] [CrossRef]
  47. Tatsuno, I.; Homma, M.; Oosawa, K.; Kawagishi, I. Signaling by the Escherichia coli Aspartate Chemoreceptor Tar with a Single Cytoplasmic Domain Per Dimer. Science 1996, 274, 423. [Google Scholar] [CrossRef]
  48. Zhang, P.; Khursigara, C.M.; Hartnell, L.M.; Subramaniam, S. Direct Visualization of Escherichia coli Chemotaxis Receptor Arrays Using Cryo-Electron Microscopy. Proc. Natl. Acad. Sci. USA 2007, 104, 3777–3781. [Google Scholar] [CrossRef]
  49. Lahiri, D.; Nag, M.; Ghosh, A.; Das, D.; Dey, A.; Mukherjee, D.; Garai, S.; Ray, R.R. Biofilm and Antimicrobial Resistance. Biofilm-Mediat. Dis. Causes Control. 2021, 437, 183–208. [Google Scholar]
  50. Clark, J.; Webb, R. The Site of Action of the Crystal Violet Nuclear Stain. Stain. Technol. 1955, 30, 89–92. [Google Scholar] [CrossRef]
  51. Mirghani, R.; Saba, T.; Khaliq, H.; Mitchell, J.; Do, L.; Chambi, L.; Diaz, K.; Kennedy, T.; Alkassab, K.; Huynh, T. Biofilms: Formation, Drug Resistance and Alternatives to Conventional Approaches. AIMS Microbiol. 2022, 8, 239–277. [Google Scholar] [CrossRef] [PubMed]
Figure 1. Biofilm formation by methicillin-sensitive (AC) S. aureus (MSSA) isolates and various clinical MRSA isolates (DH) in response to a range of insulin/glucose concentrations. * Significantly different (p ≤ 0.05) as compared to LB. ˄ Significantly different (p ≤ 0.05) as compared to glucose. # Significantly different (p ≤ 0.05) as compared to insulin at homologous concentration. Positive controls for biofilm formation were growth in LB alone, each insulin concentration in LB alone, and glucose in LB alone.
Biology 12 01432 g001
Figure 2. Binding of FITC-insulin to S. aureus ATCC 25923 MSSA (A) and S. aureus T51995 MRSA (B) cells after 18 h of aerobic growth.
Biology 12 01432 g002
Figure 3. Biofilm formation by a vancomycin-resistant E. faecalis 9(VRE) isolate in response to a range of insulin/glucose concentrations. ˄ Significantly different (p ≤ 0.05) as compared to glucose. Positive controls for biofilm formation were growth in LB alone, each insulin concentration in LB alone, and glucose in LB alone.
Biology 12 01432 g003
Figure 4. Binding of FITC-insulin to E. faecalis 9 VRE cells after 18 h of aerobic growth.
Biology 12 01432 g004
Figure 5. Binding of FITC-insulin to E. coli ESBL L108 cells after 18 h of aerobic growth in LB broth.
Biology 12 01432 g005
Figure 6. Biofilm formation by E. coli isolates in response to a range of insulin/glucose concentrations for two clinical multi-drug resistant isolates (A,B). * Significantly different (p ≤ 0.05) as compared to LB. ˄ Significantly different (p ≤ 0.05) as compared to glucose. Positive controls for biofilm formation were growth in LB alone, each insulin concentration in LB alone, and glucose in LB alone.
Biology 12 01432 g006
Figure 7. Binding of FITC-insulin to aerobically grown A. baumannii L187 cells after 18 h of aerobic growth.
Biology 12 01432 g007
Figure 8. Biofilm formation by A. baumannii multi-drug resistant clinical isolates (AC) in response to a range of insulin/glucose concentrations. * Significantly different (p ≤ 0.05) as compared to LB. ˄ Significantly different (p ≤ 0.05) as compared to glucose. Positive controls for biofilm formation were growth in LB alone, each insulin concentration in LB alone, and glucose in LB alone.
Biology 12 01432 g008
Figure 9. Biofilm formation by K. pneumoniae clinical isolates (AC) in response to a range of insulin/glucose concentrations. * Significantly different (p ≤ 0.05) as compared to LB. ˄ Significantly different (p ≤ 0.05) as compared to glucose. Positive controls for biofilm formation were growth in LB alone, each insulin concentration in LB alone, and glucose in LB alone.
Biology 12 01432 g009
Figure 10. Binding of FITC-insulin to aerobically grown K. pneumoniae carbapenemase-producing (KPC) L133 cells after 18 h of aerobic growth.
Biology 12 01432 g010
Figure 11. Biofilm (crystal violet staining; (A,C,E)) and capsule (Alcian blue staining; (B,D,F)) formation by K. pneumoniae ATCC 27736 in response to a range of insulin/glucose concentrations. ˄ Significantly different (p ≤ 0.05) as compared to glucose. Positive controls for biofilm formation were growth in LB alone, each insulin concentration in LB alone, and glucose in LB alone.
Biology 12 01432 g011
Disclaimer/Publisher’s Note: The statements, opinions and data contained in all publications are solely those of the individual author(s) and contributor(s) and not of MDPI and/or the editor(s). MDPI and/or the editor(s) disclaim responsibility for any injury to people or property resulting from any ideas, methods, instructions or products referred to in the content.

