
Evaluation of Epigenetic Age Acceleration Scores and Their Associations with CVD-Related Phenotypes in a Population Cohort
 , , , , , ,
  , , , , , , and
Abstract
:Simple Summary
Abstract
1. Introduction
2. Methods
2.1. Data Collection
2.2. Variables Description
- Anthropometric: BMI and WHR;
- Lifestyle: smoking status and annual alcohol consumption (intake and number of occasions);
- Metabolic: GGT, T2DM, and plasma glucose;
- Lipids: TC, HDL, LDL, and TG;
- Cardiovascular: SBP, DBP, HT, CHD, CP, and MCP.
2.3. DNAm Data Quality Control (QC) and Preprocessing
2.4. Epigenetic Age Acceleration
2.5. Grouping
2.6. Statistical Analysis
3. Results
3.1. Associations between Sex and Phenotypes
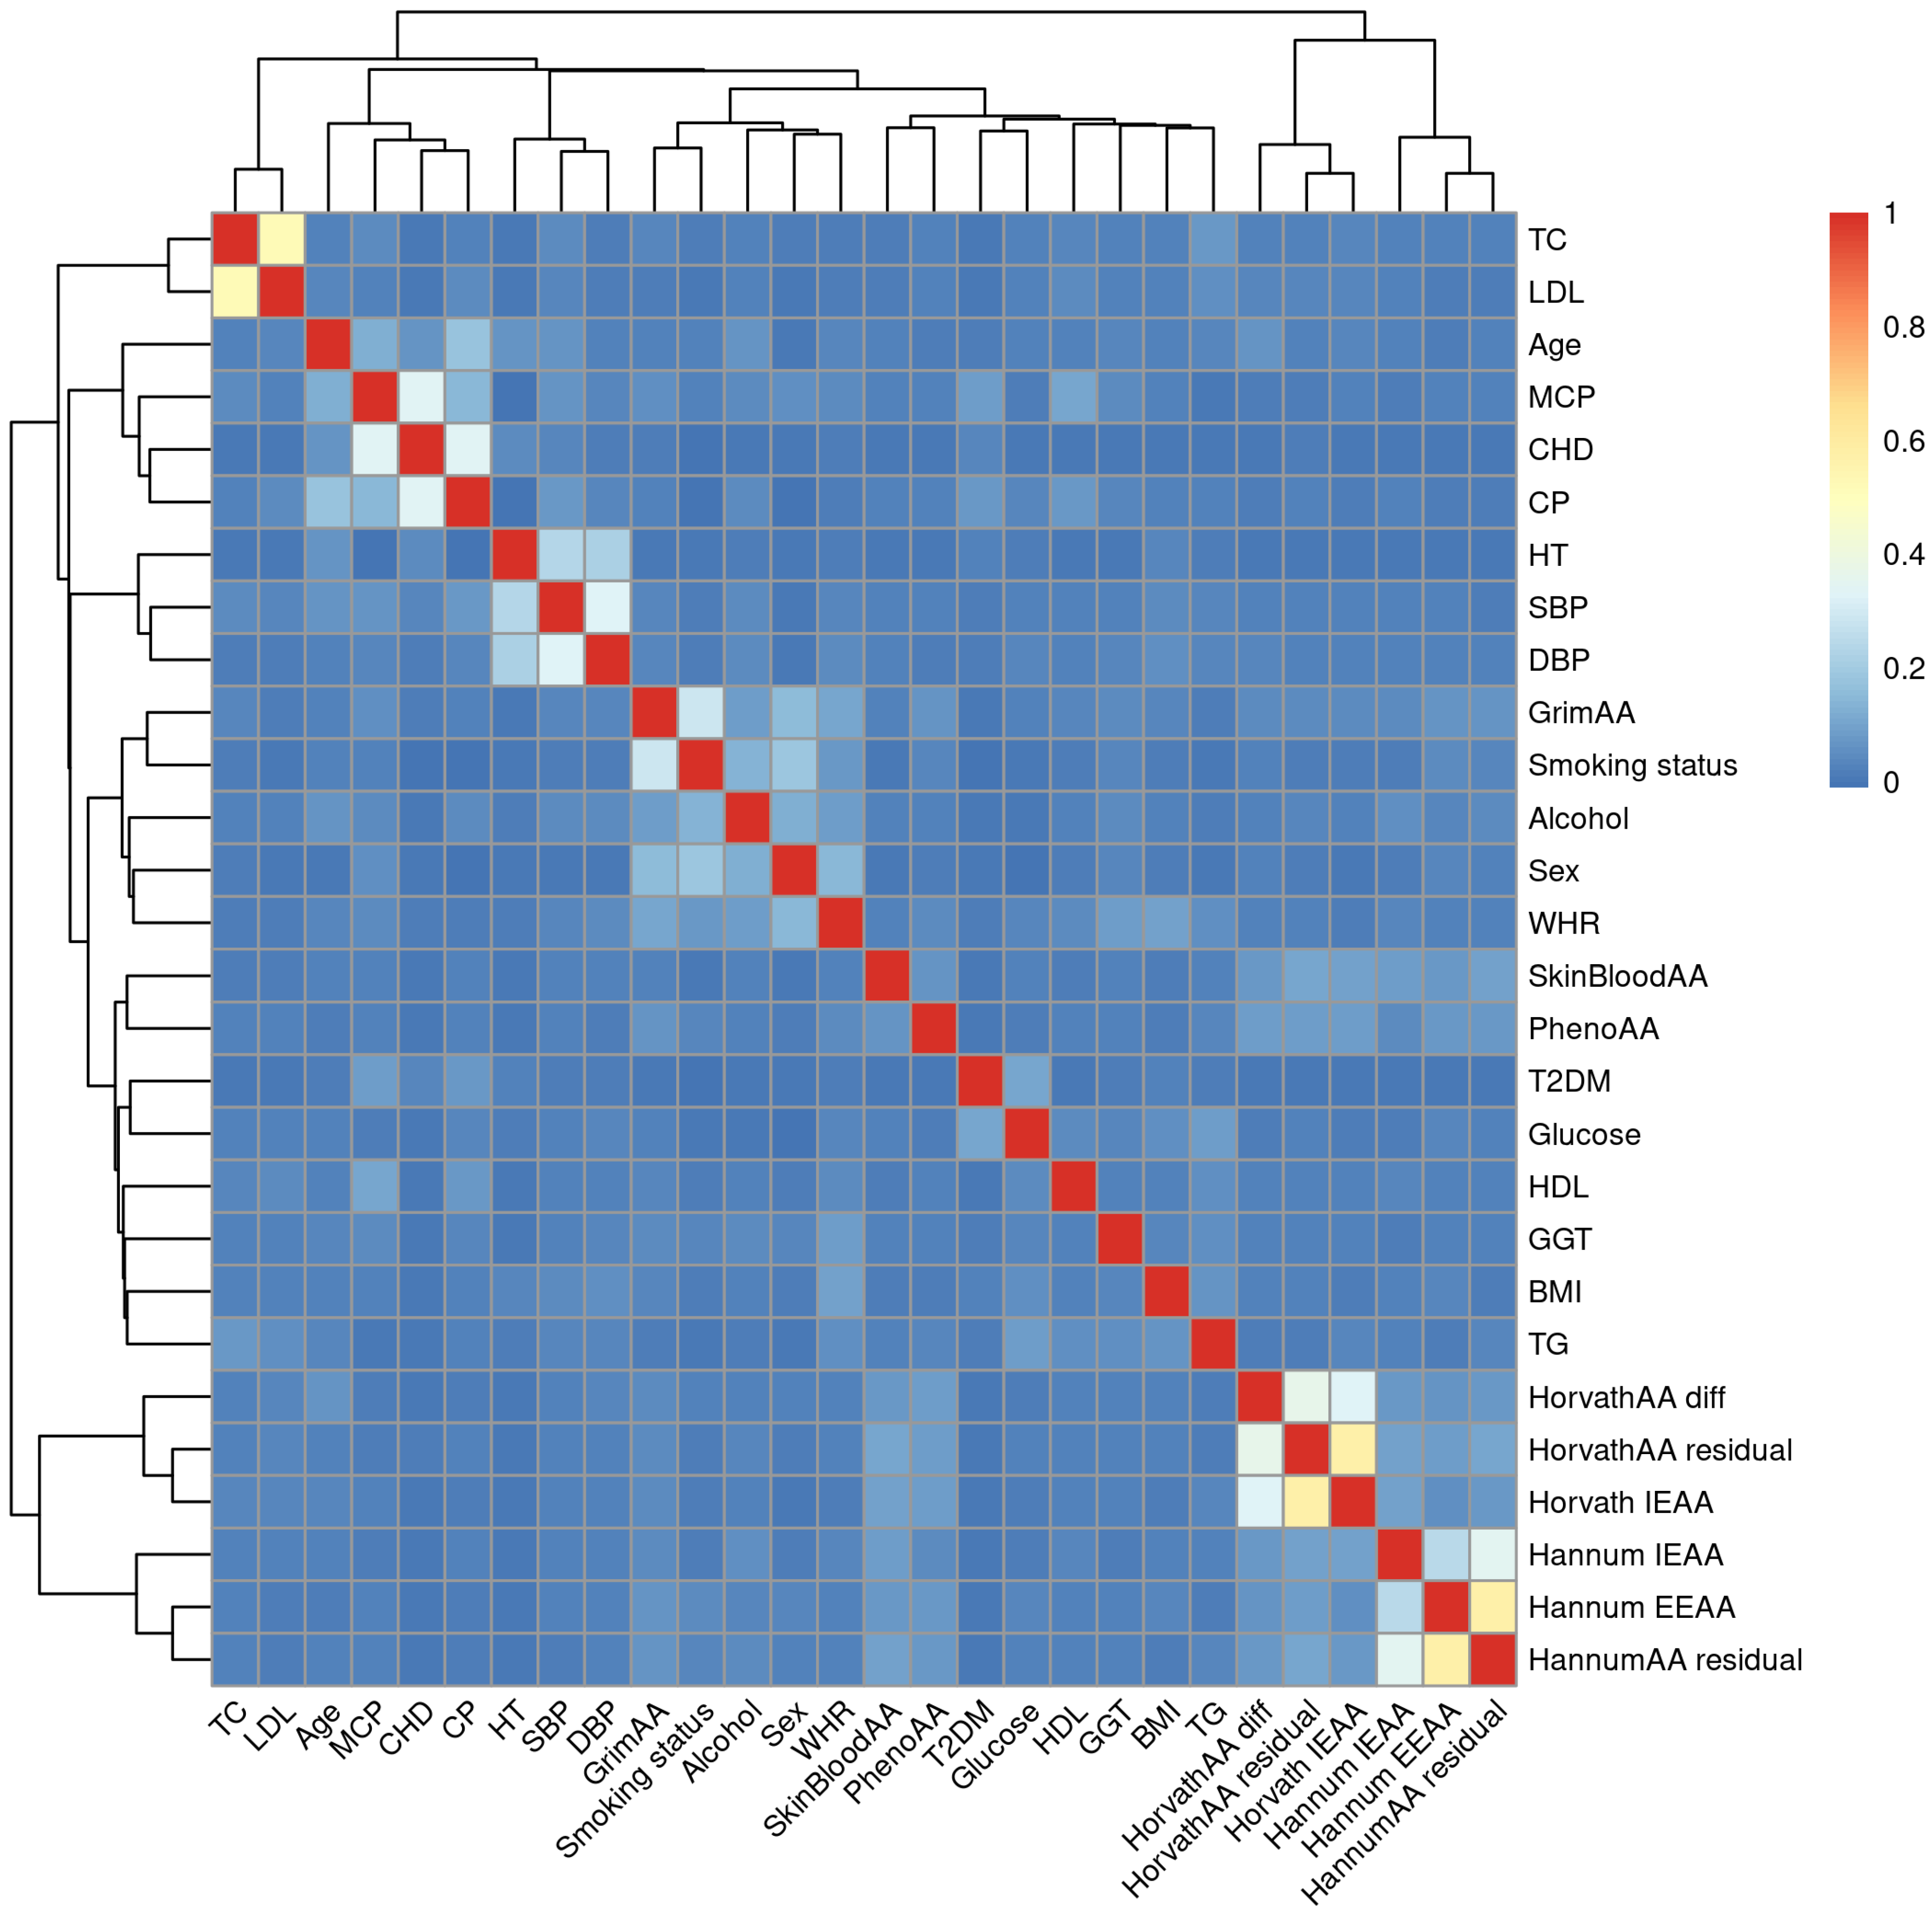
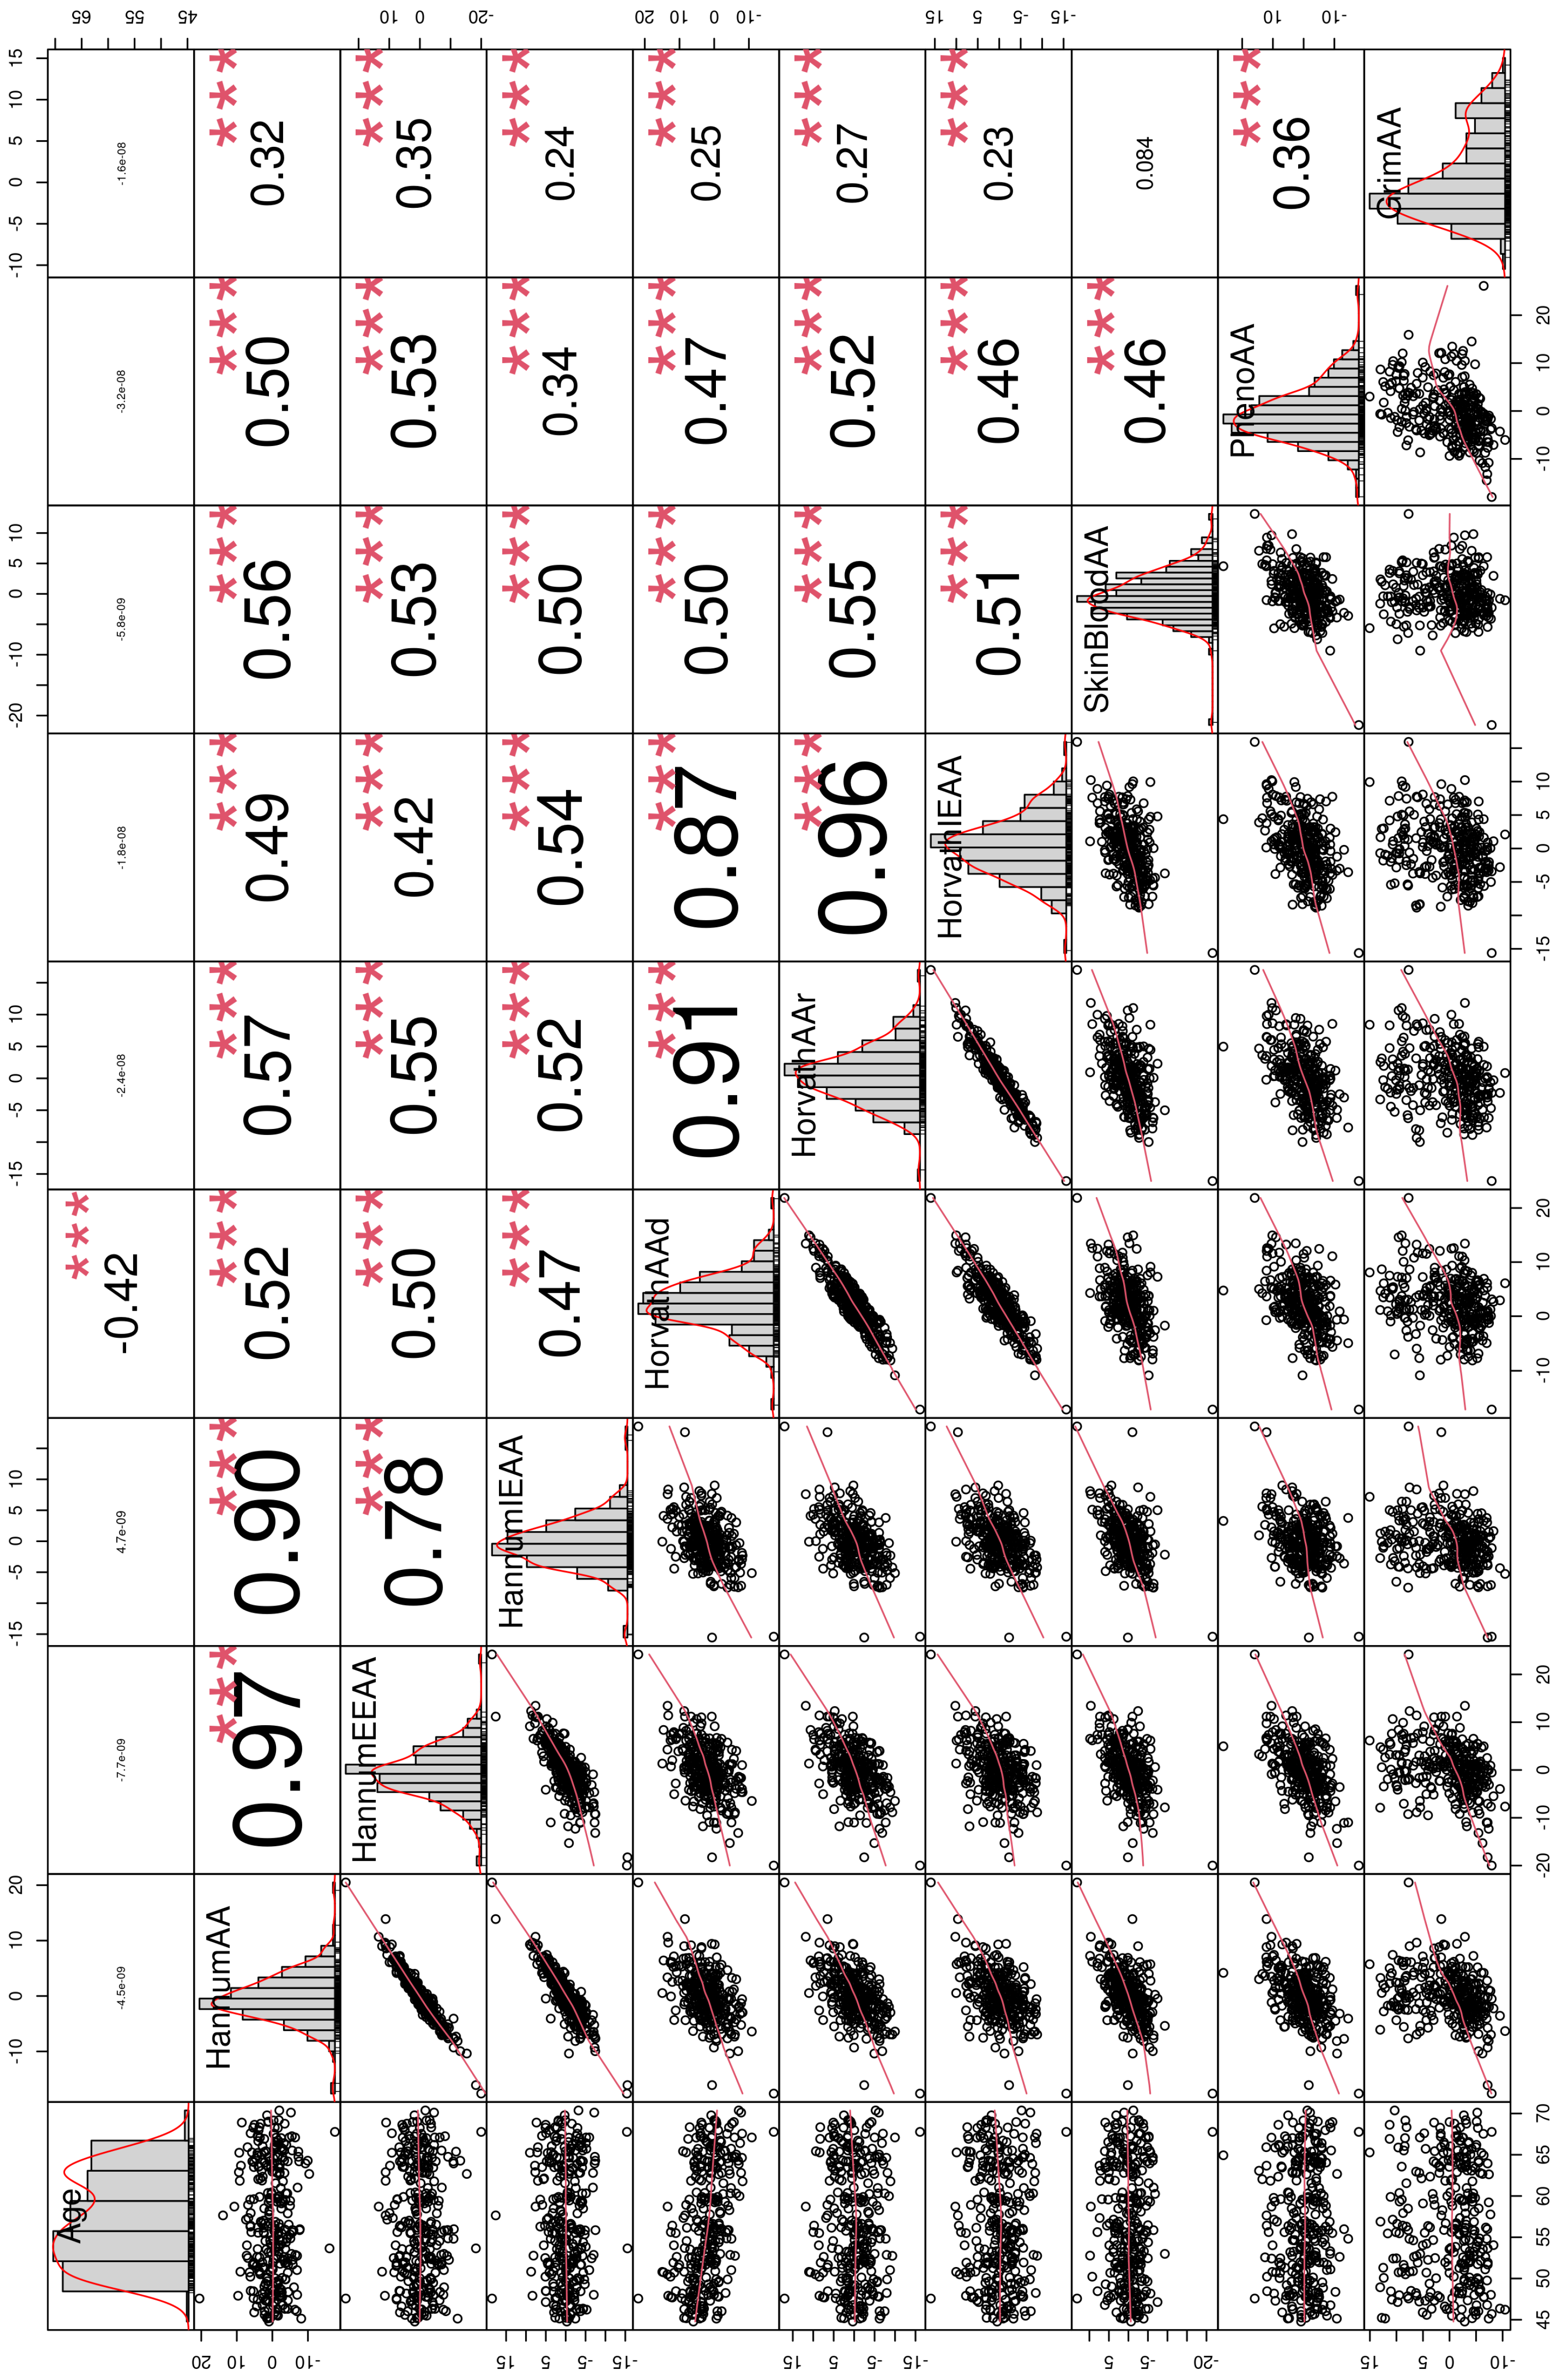
3.2. EAAs Are Associated with Some Phenotypes and Have Strong Sex Bias
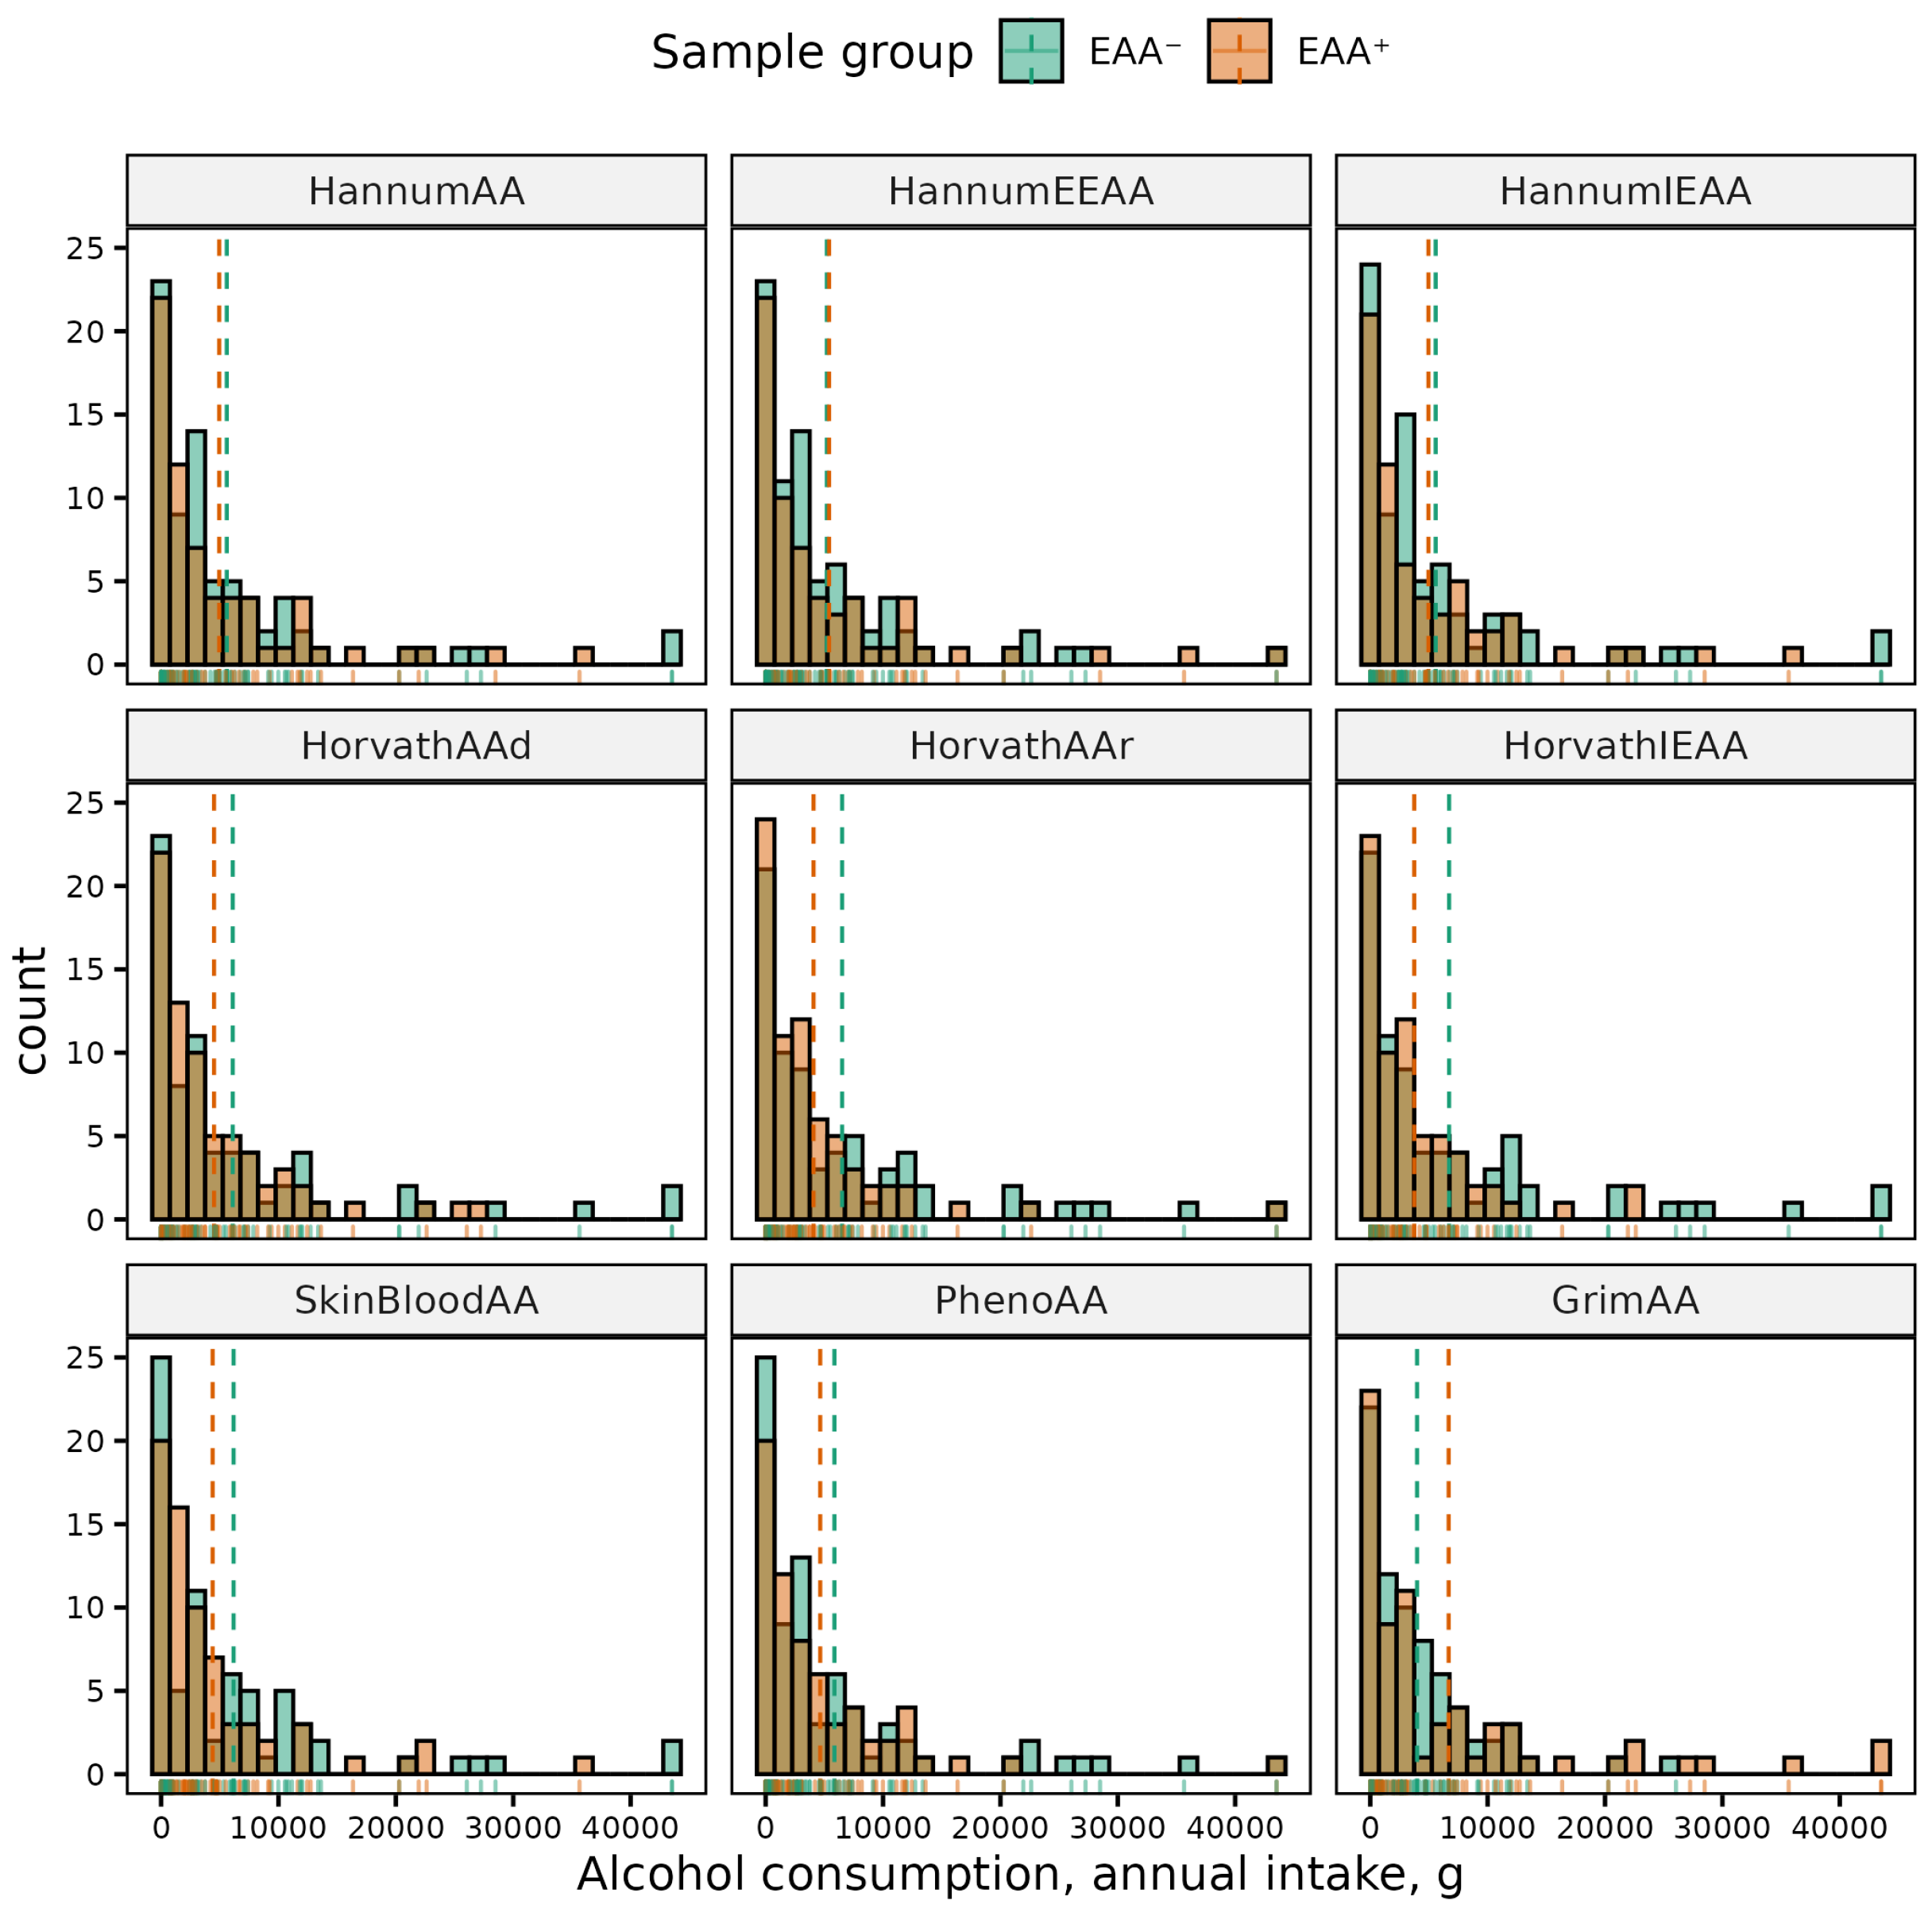
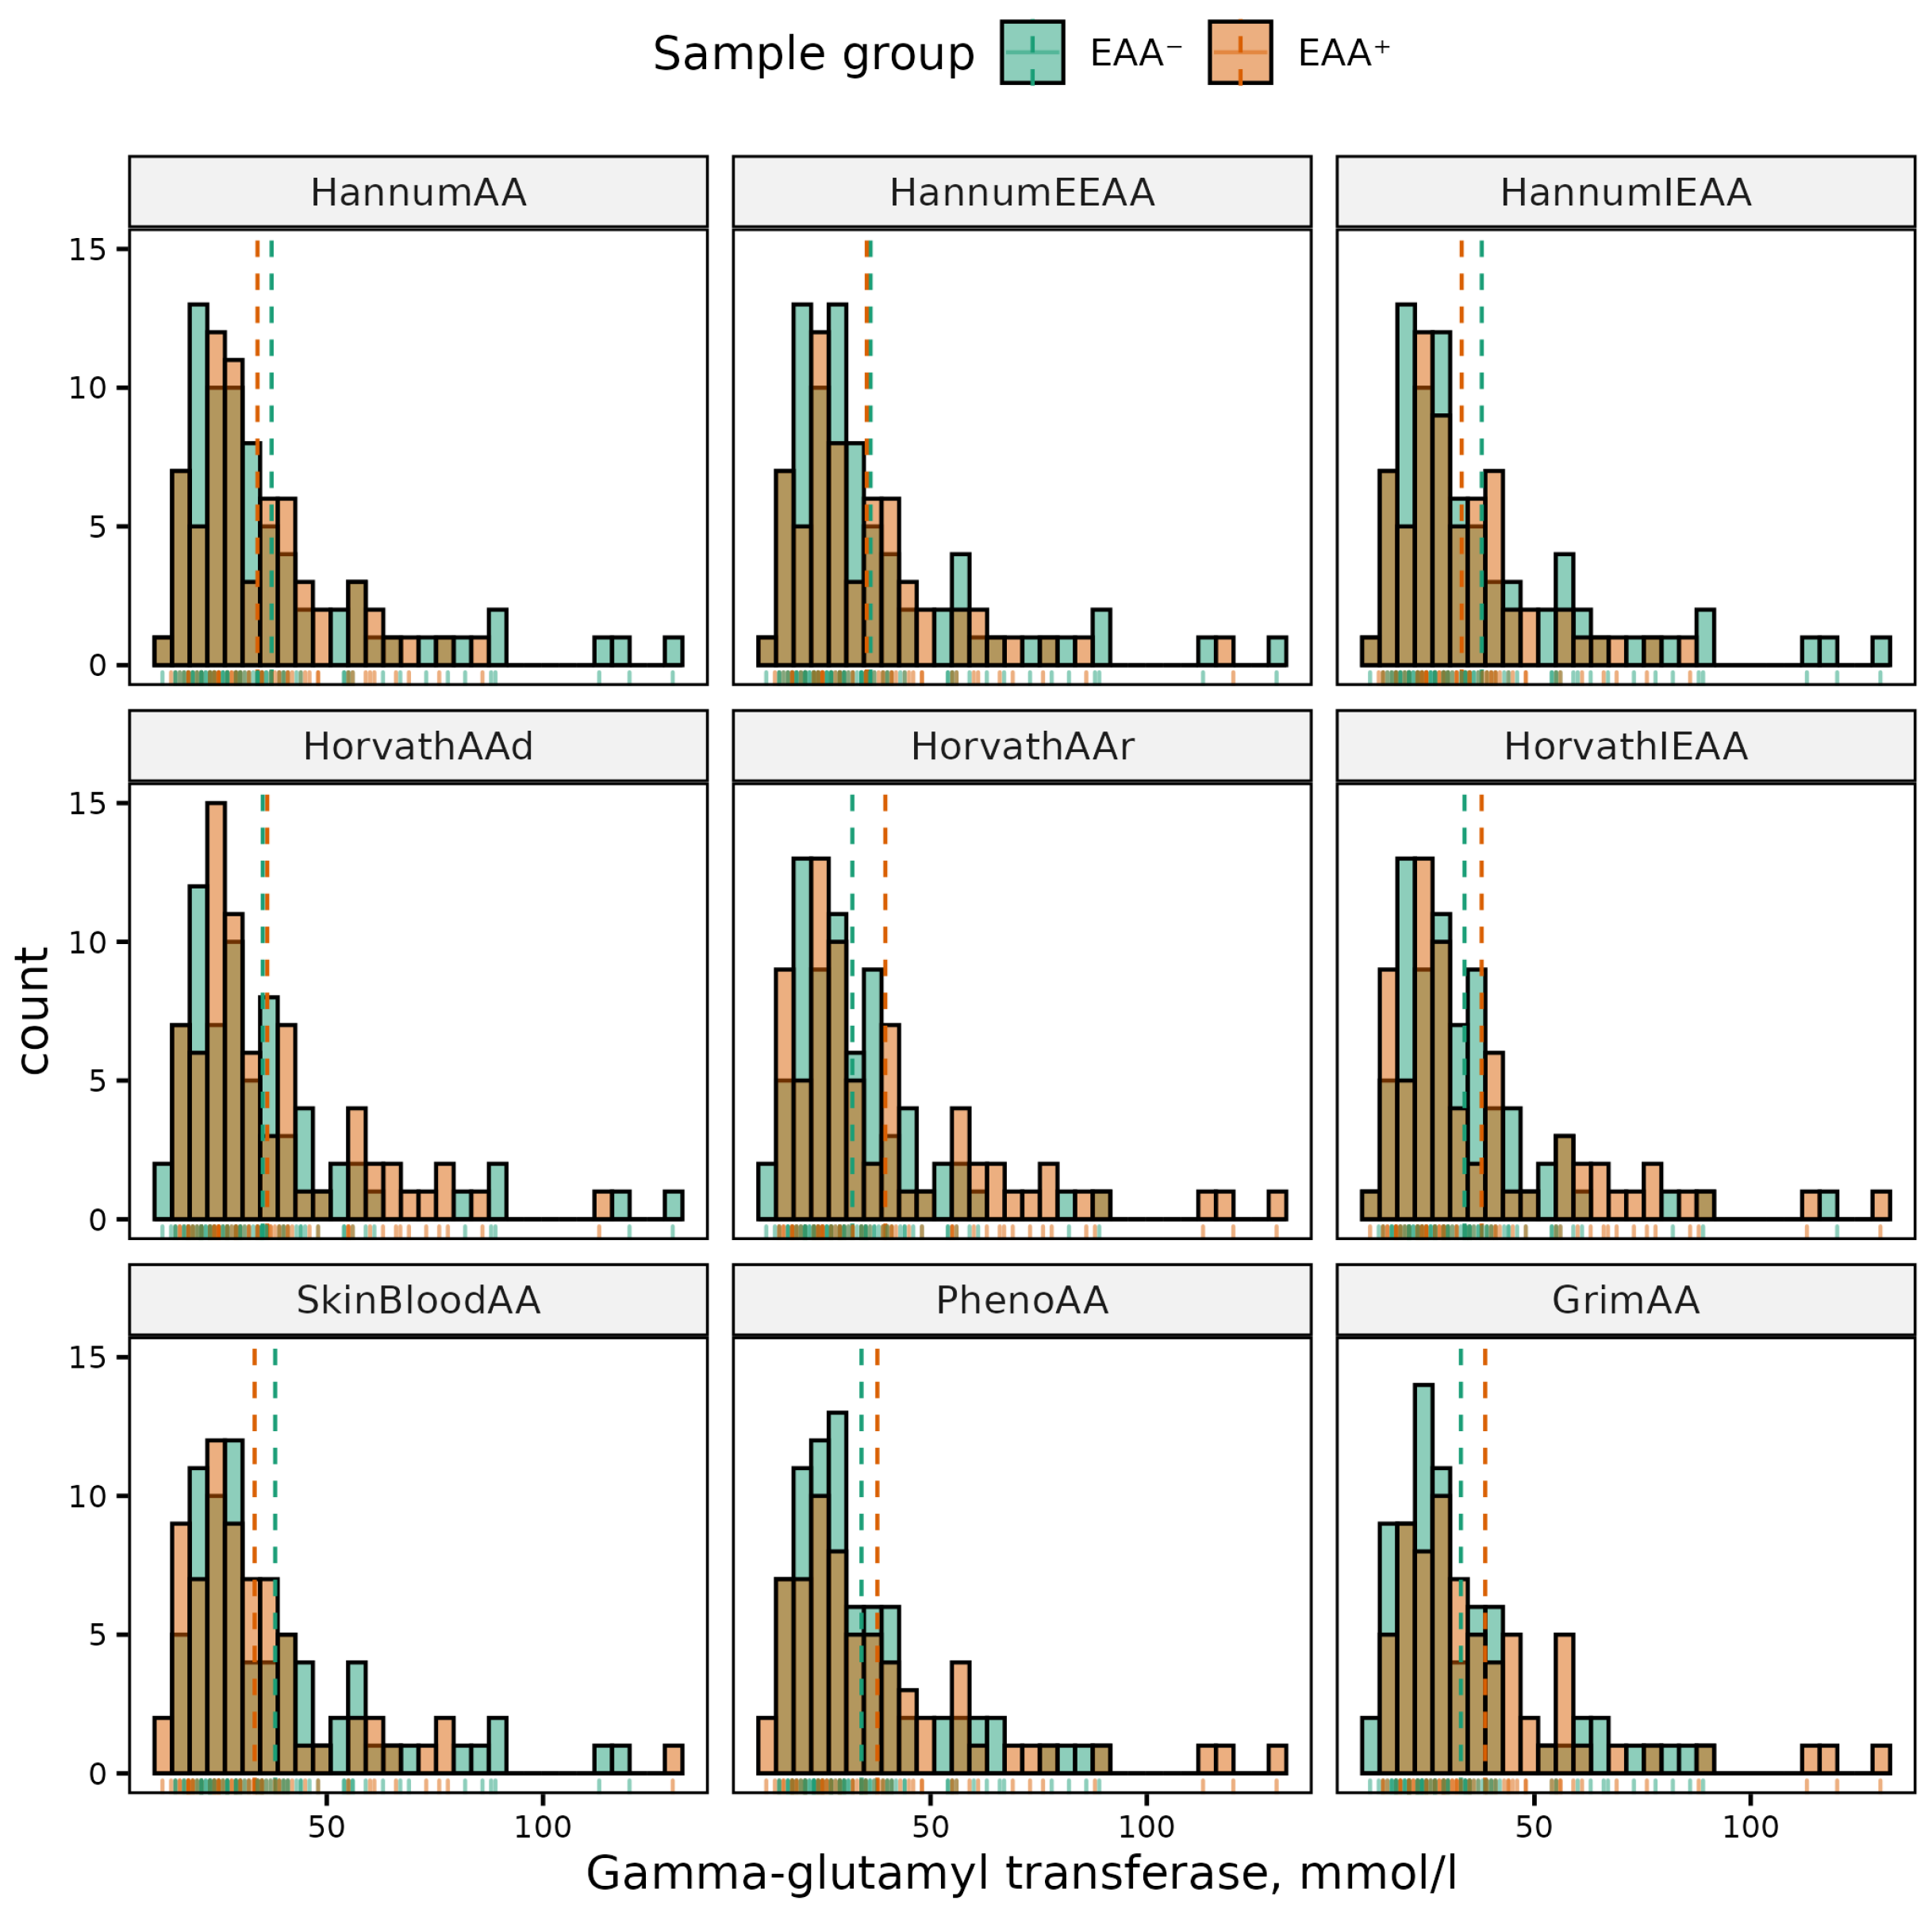
3.3. Sex-Adjusted EAAs Are Associated with Various Phenotypes
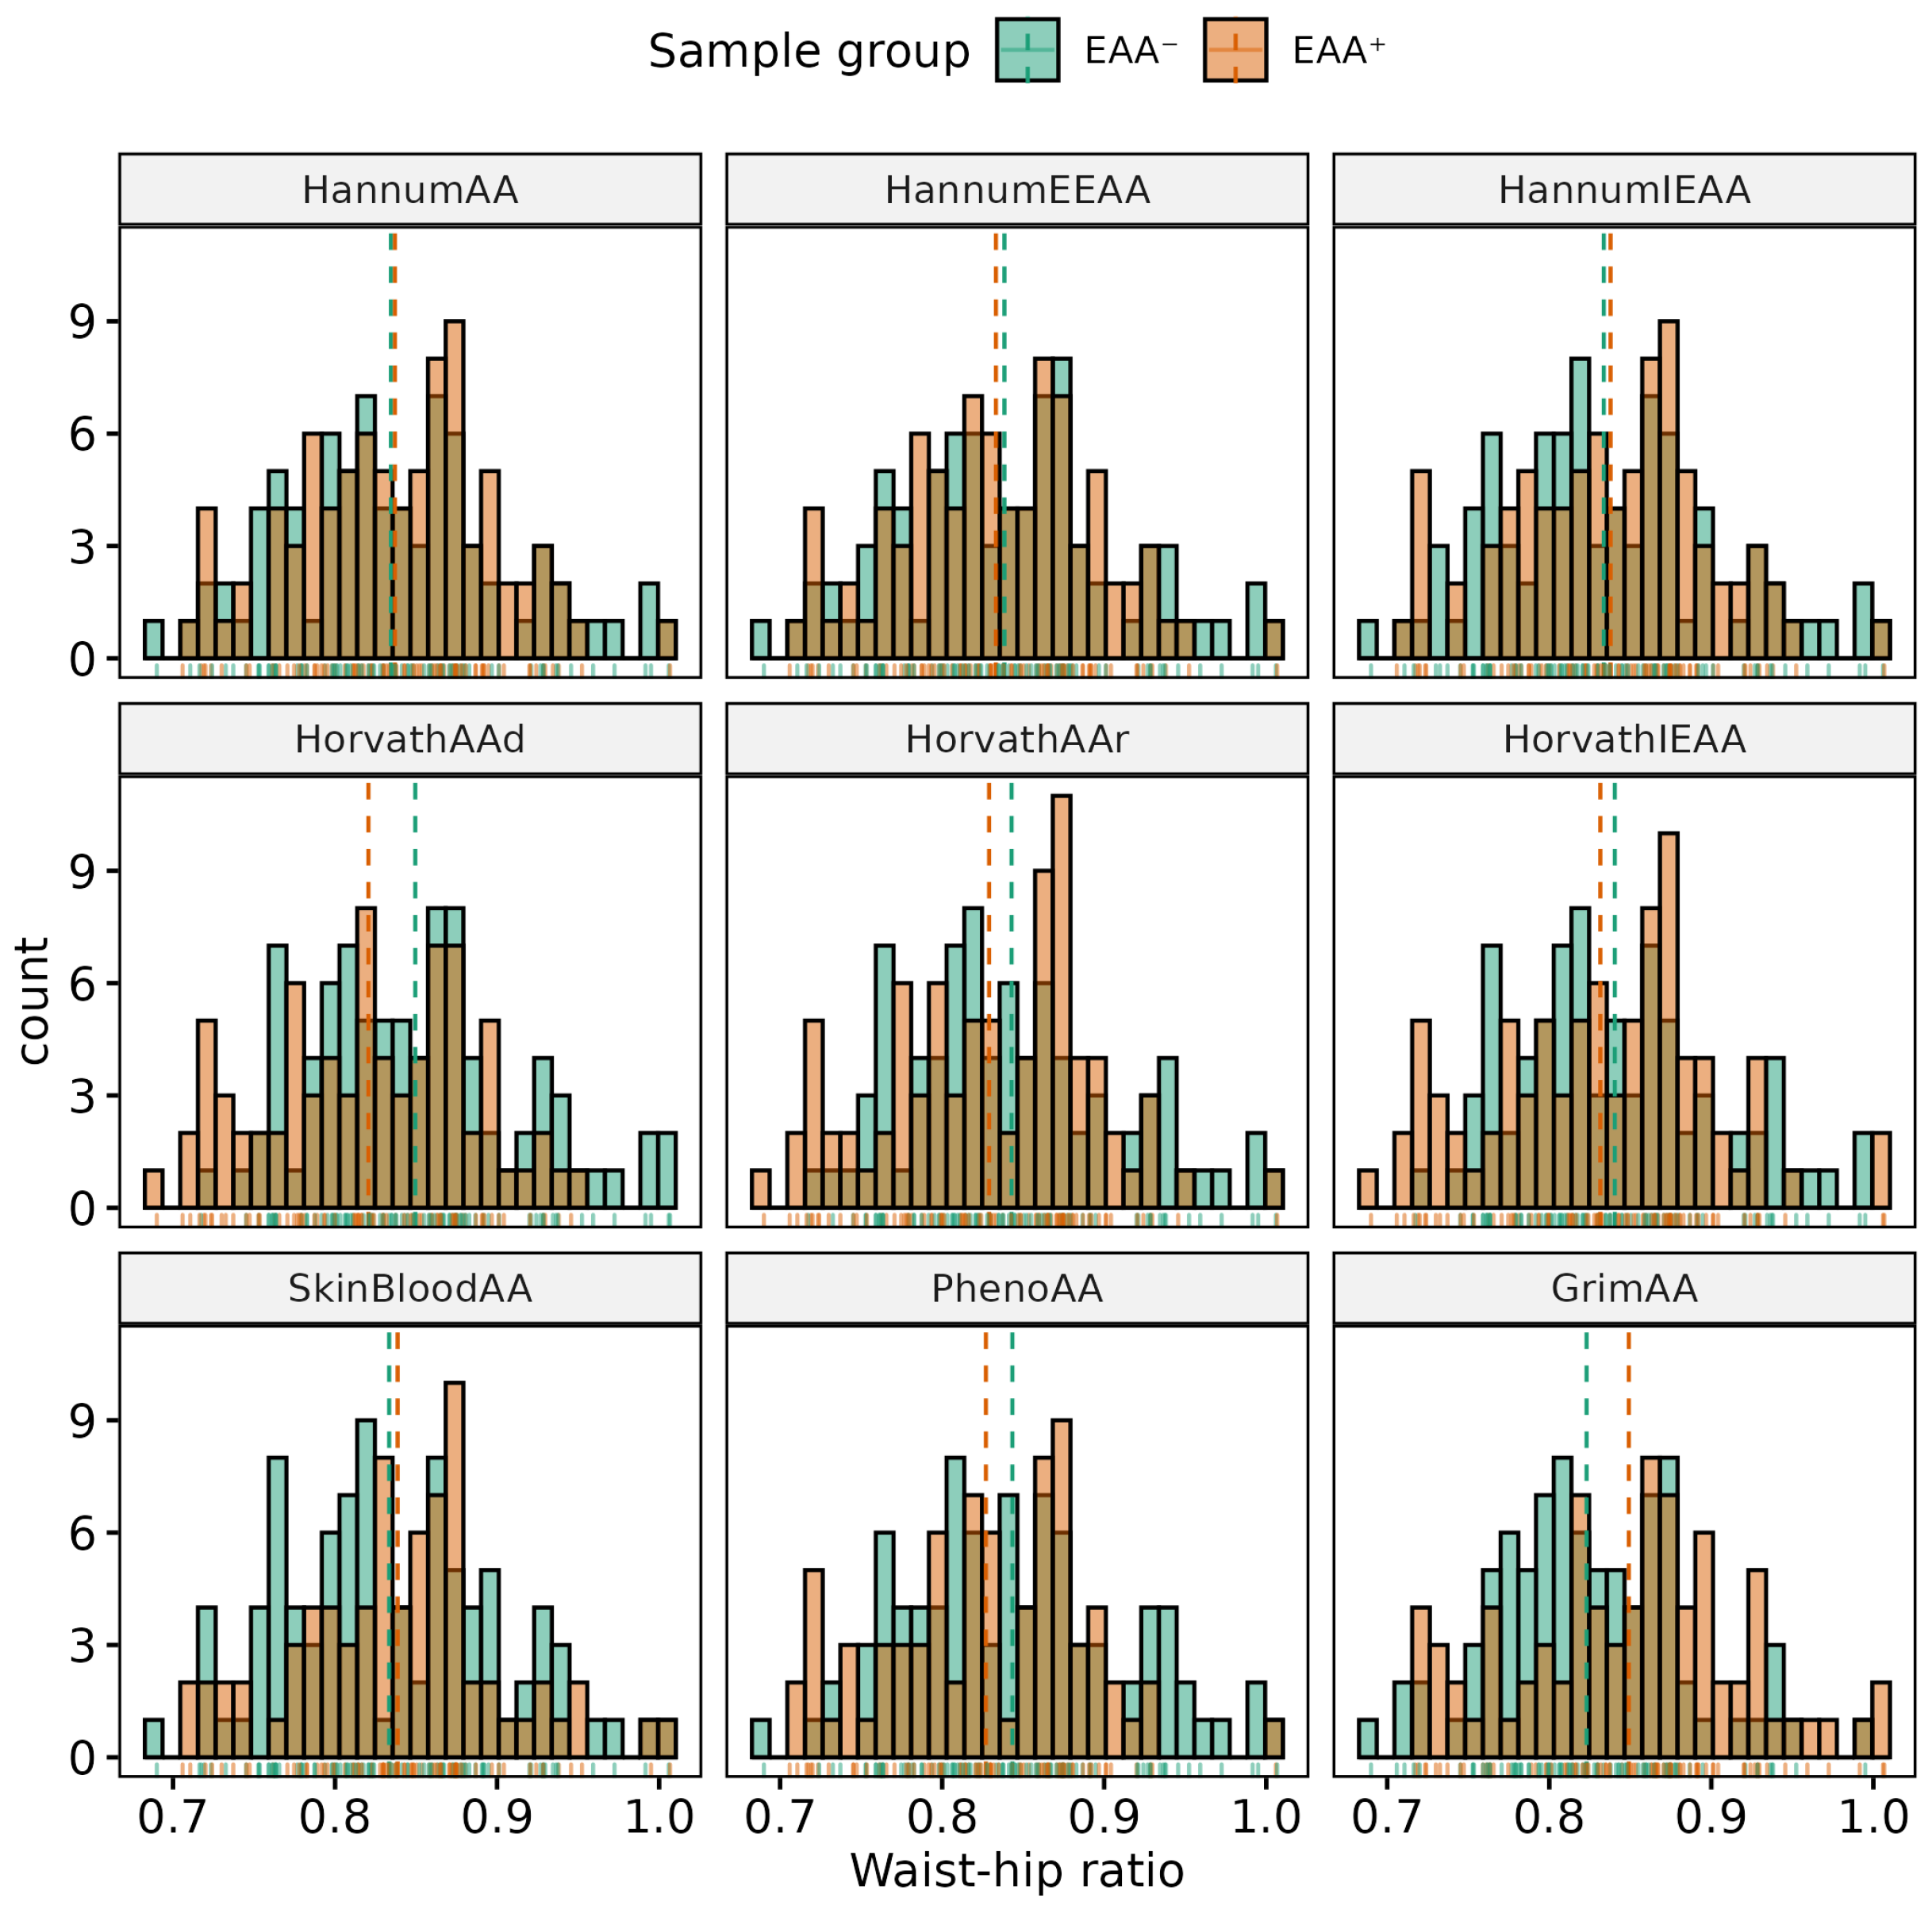
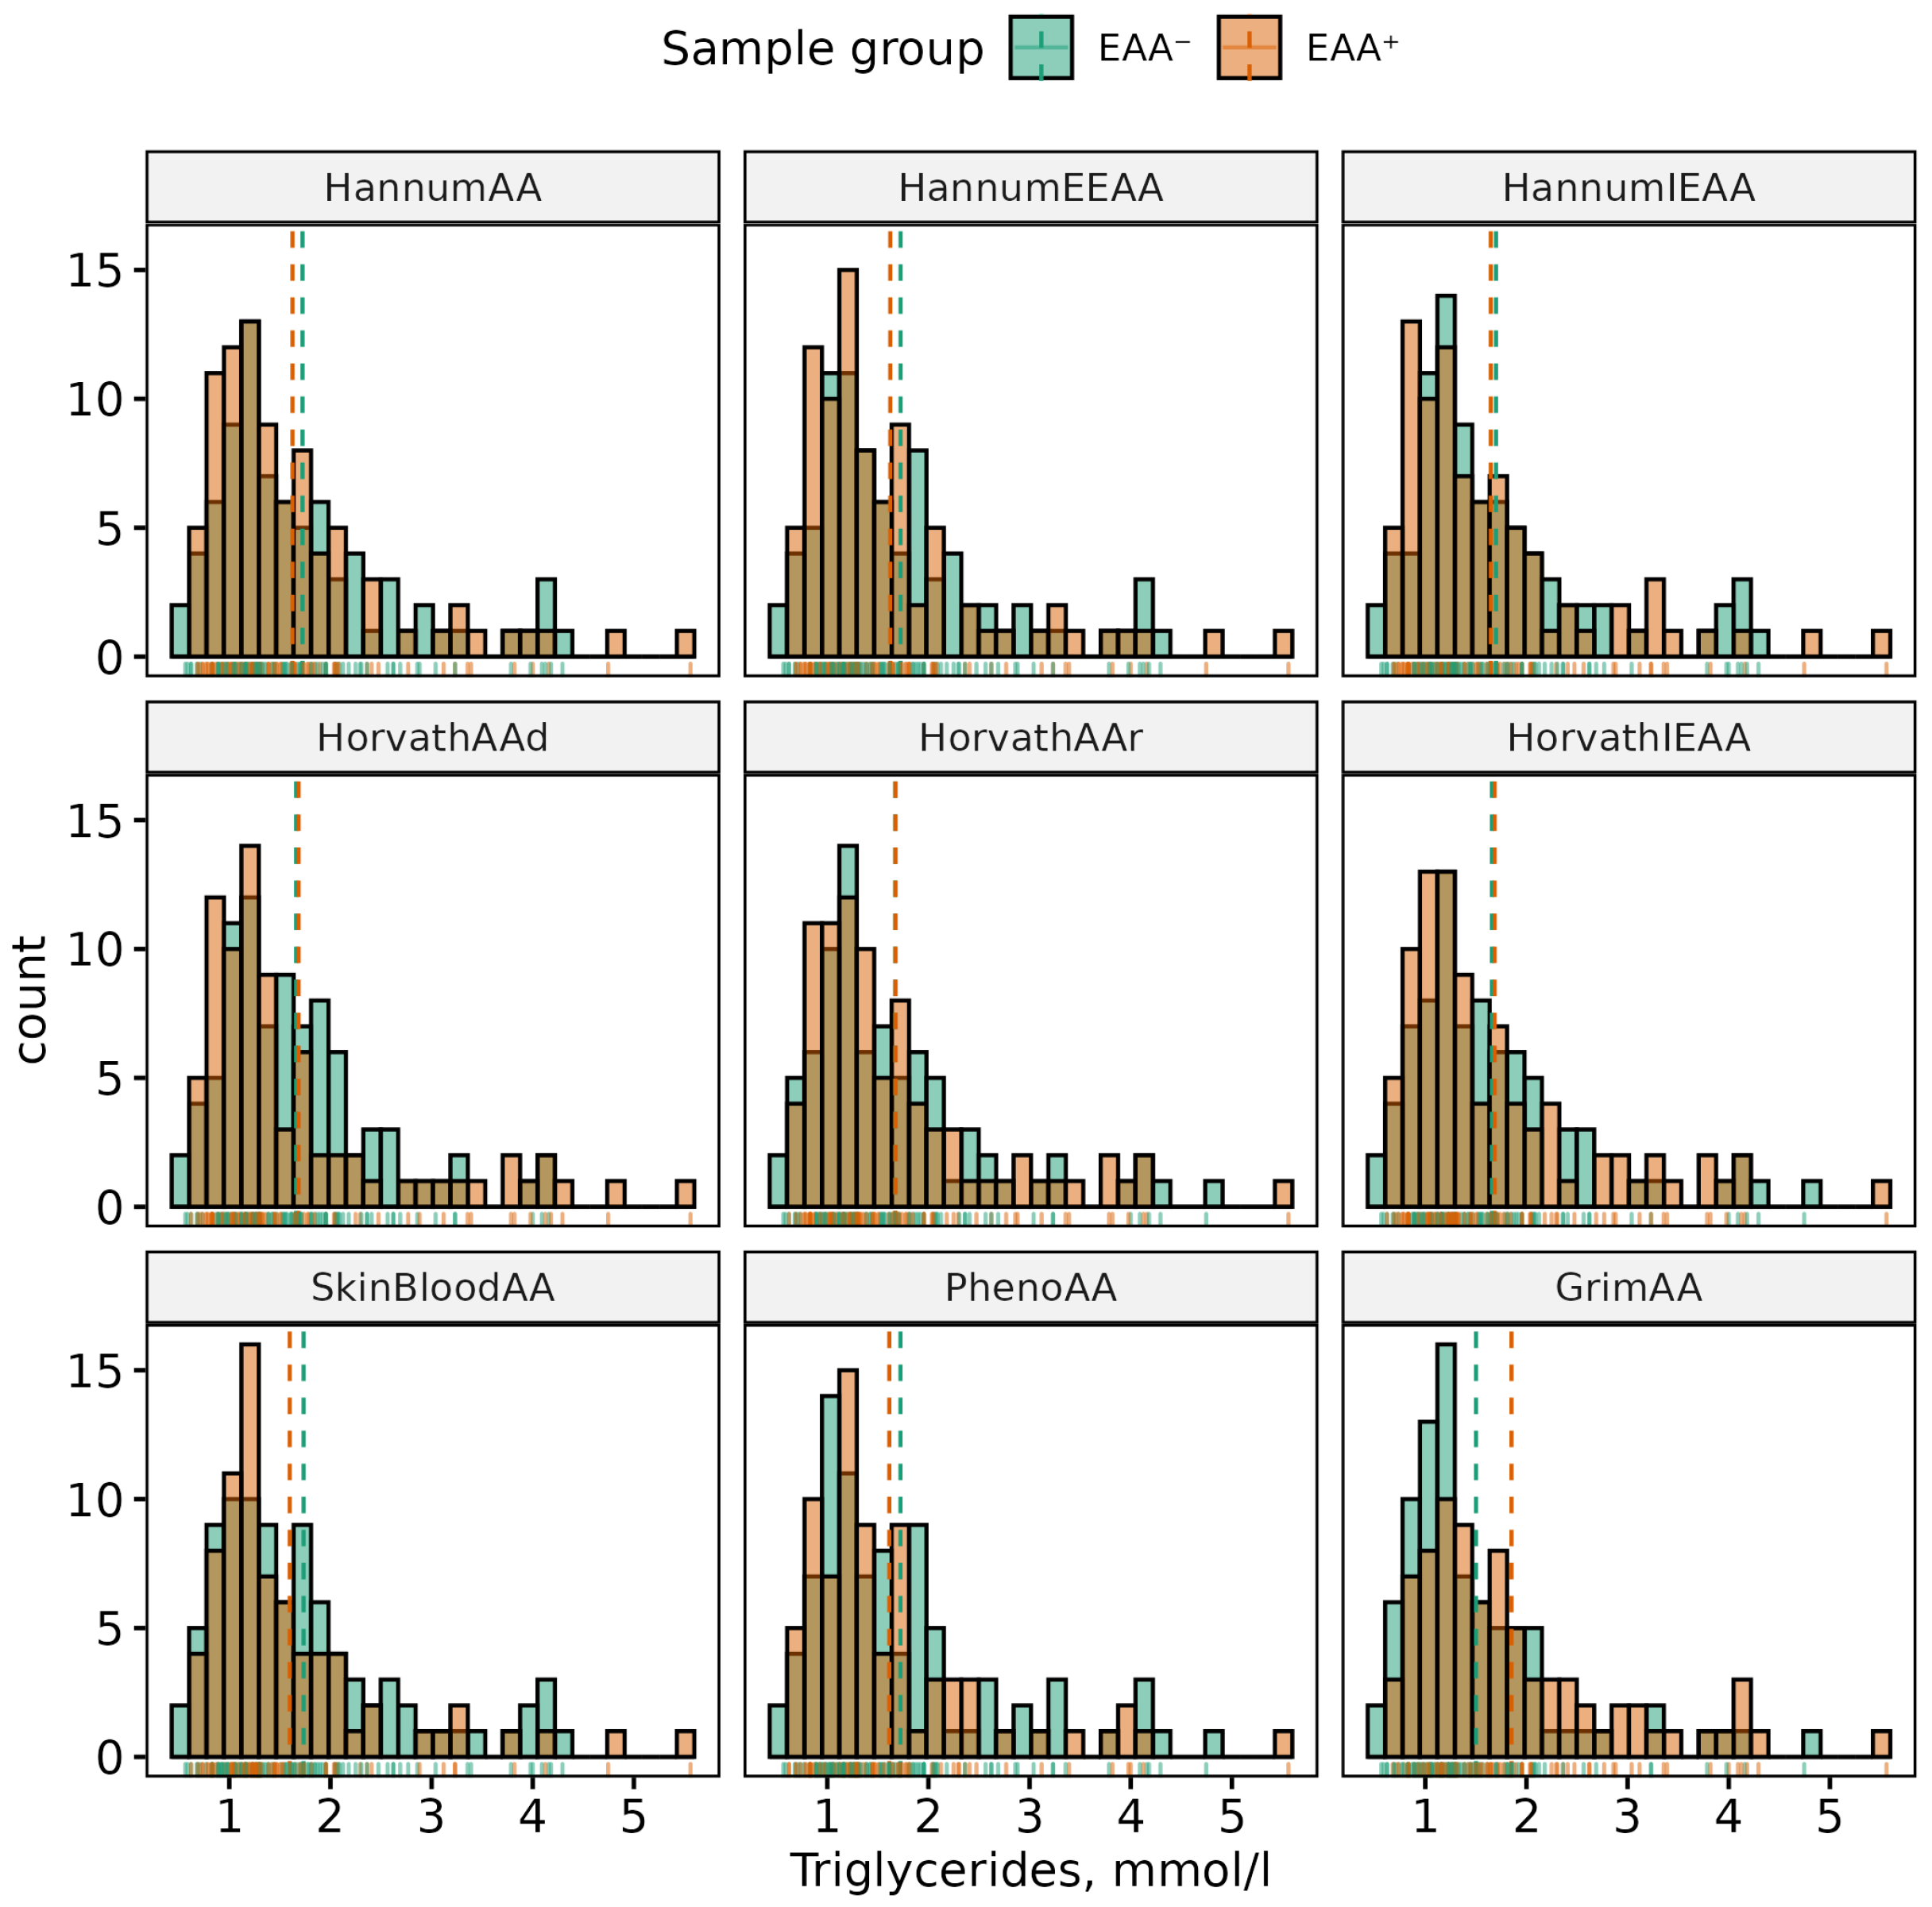
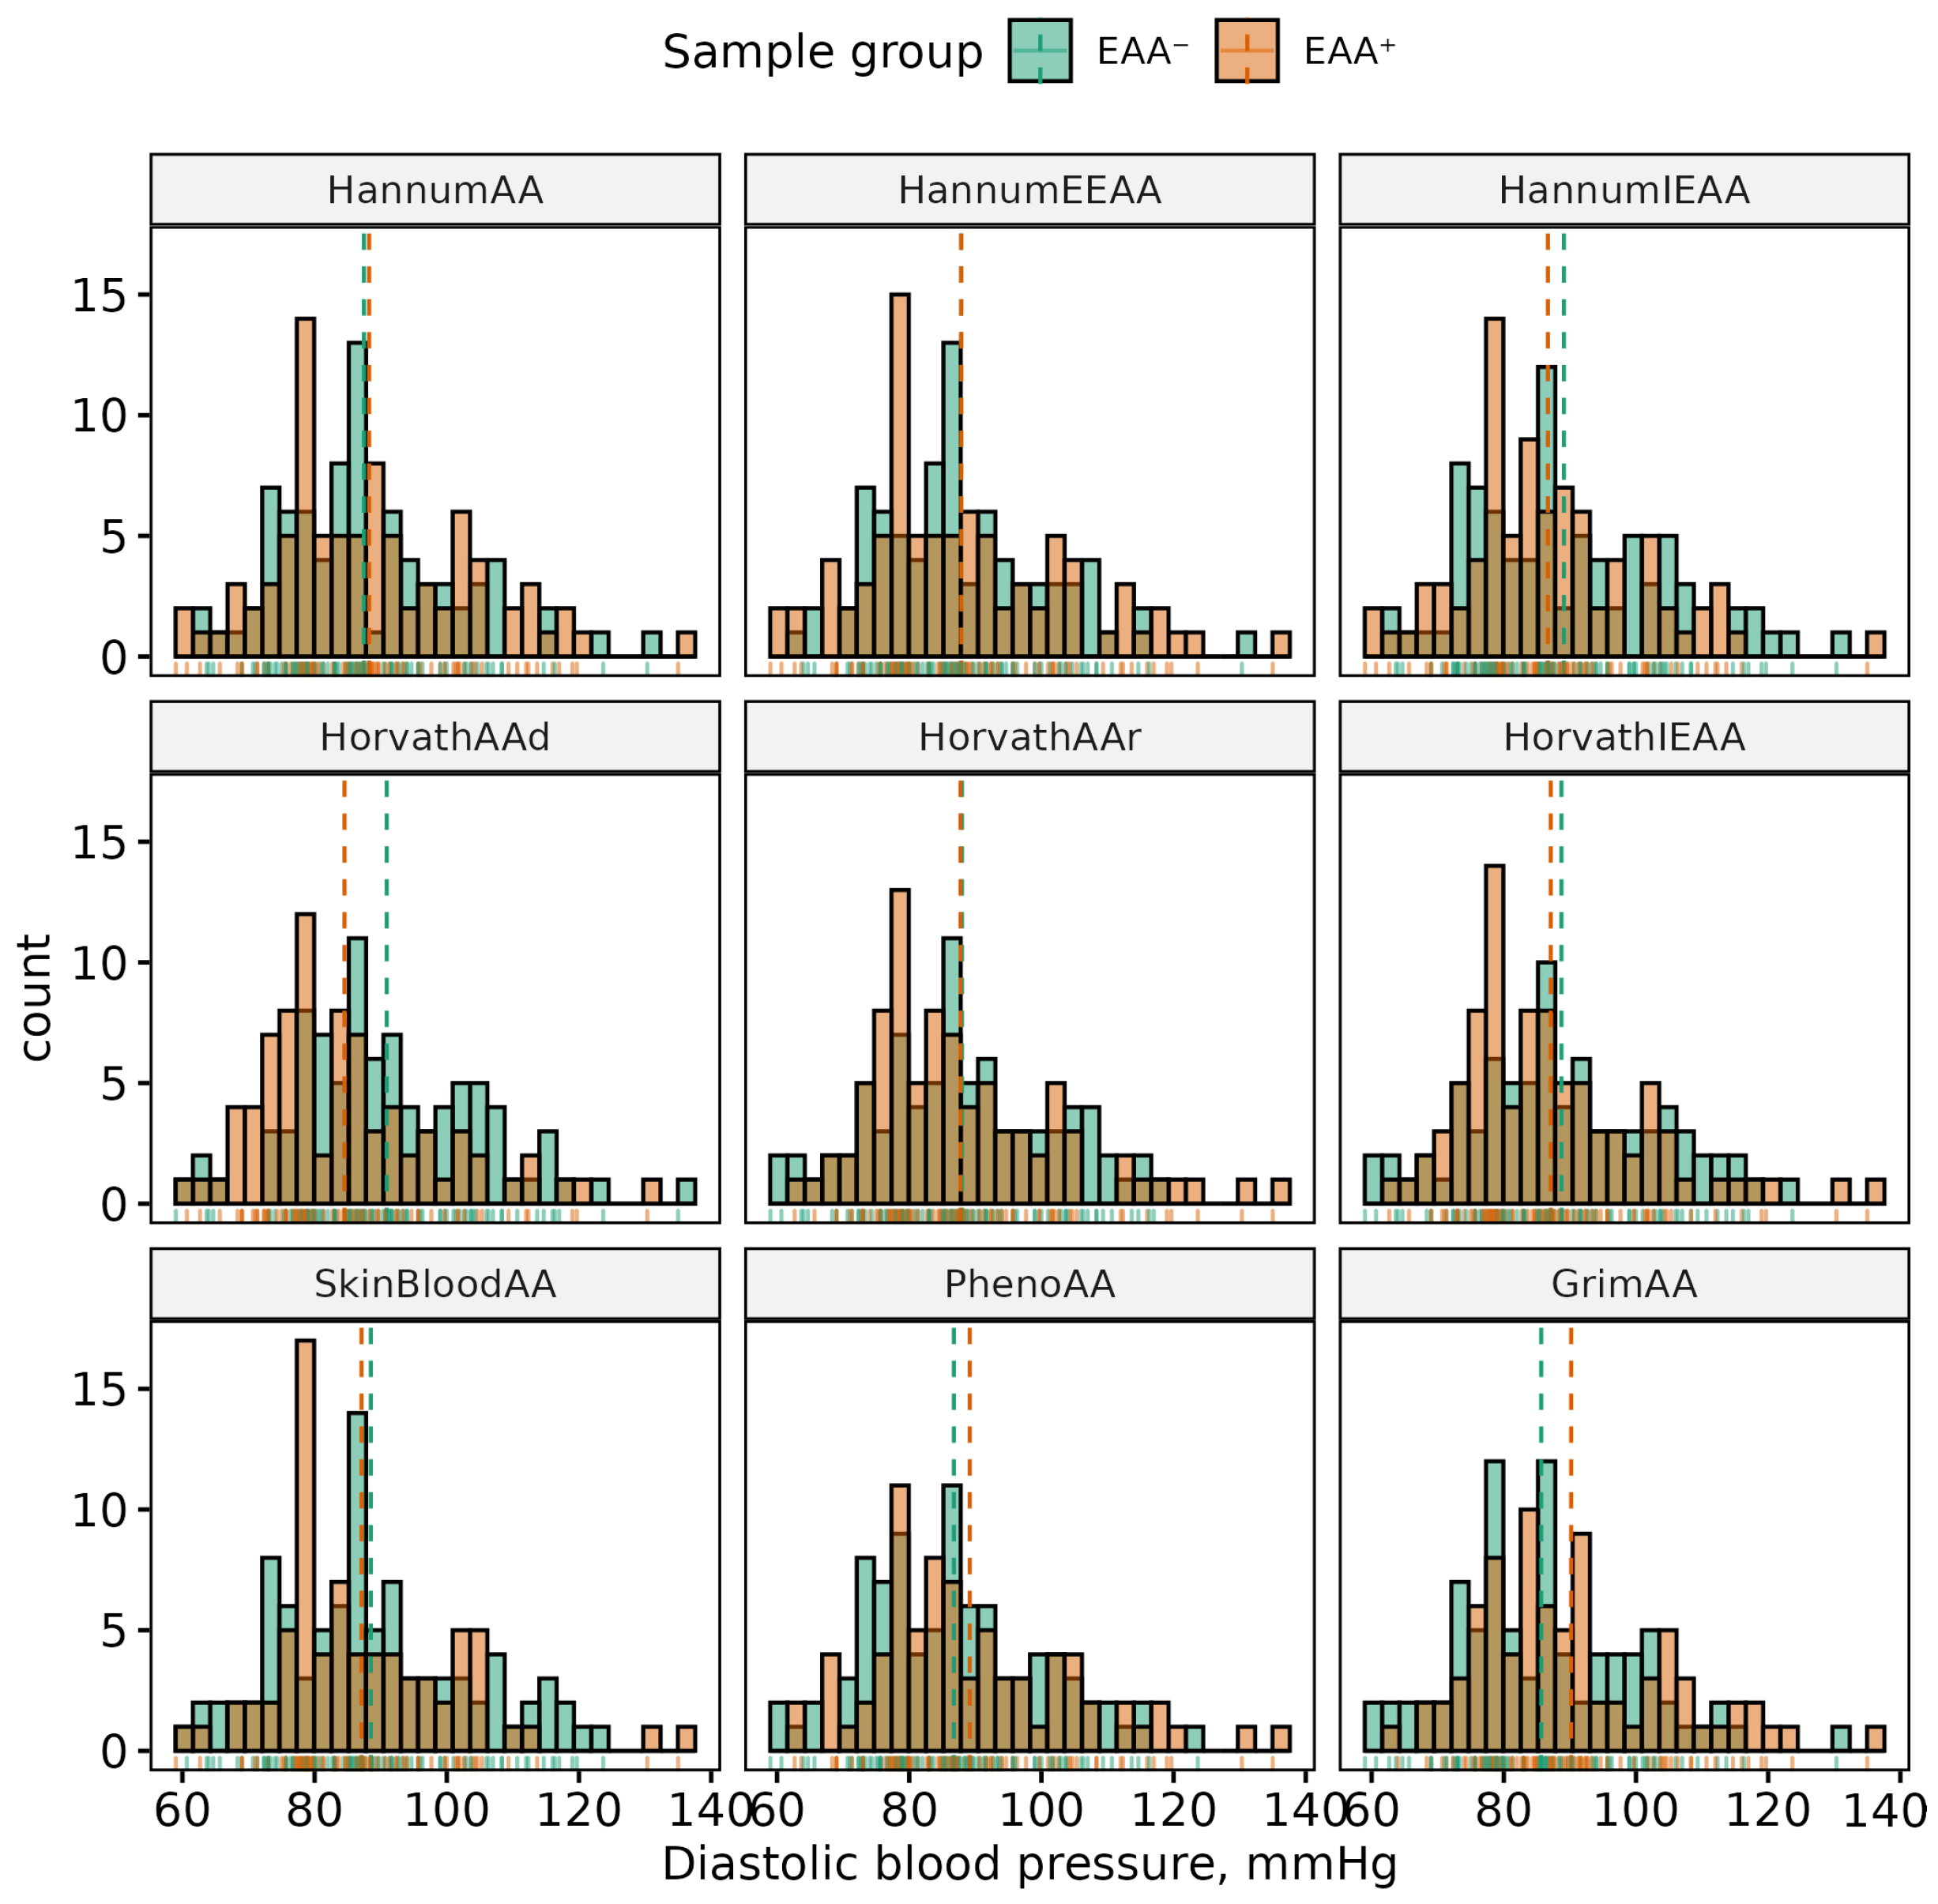
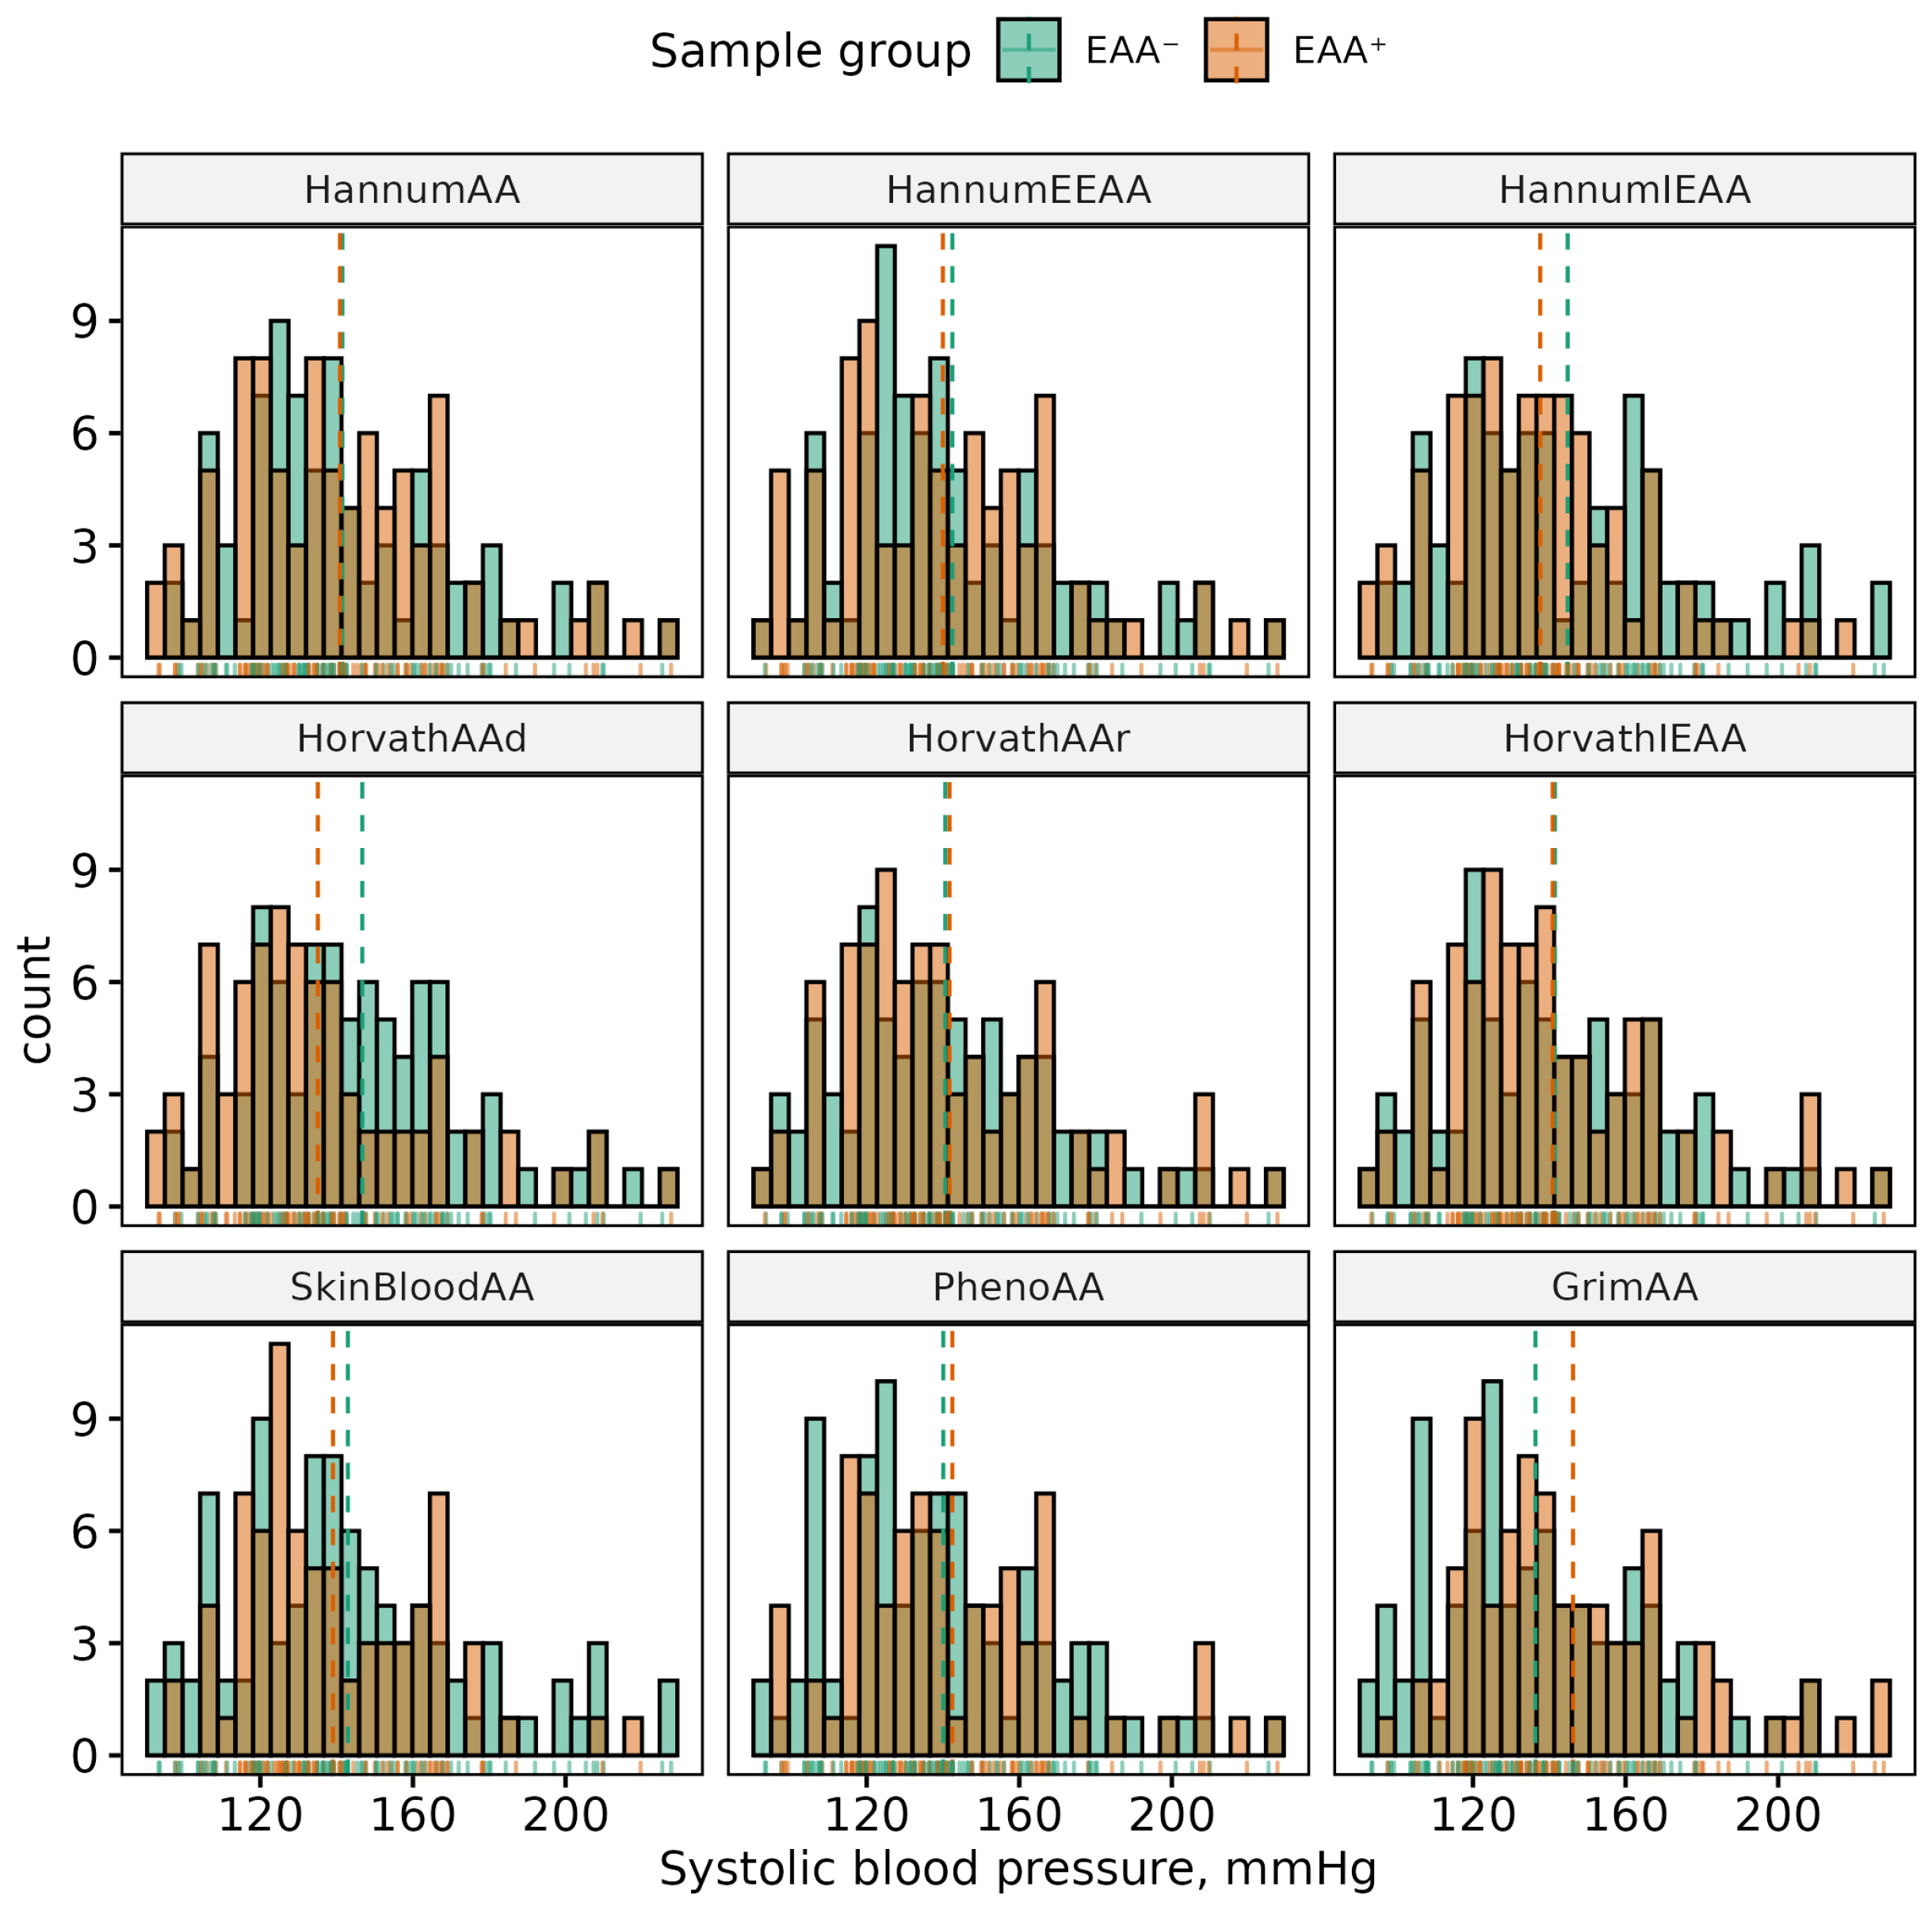
3.4. Directions of Some EAA–Phenotype Associations in Sex-Specific Subsets Are Different
4. Discussion
5. Conclusions
Author Contributions
Funding
Institutional Review Board Statement
Informed Consent Statement
Data Availability Statement
Acknowledgments
Conflicts of Interest
Abbreviations
| ACS | Acute coronary syndrome |
| adjEAA | Adjusted epigenetic age acceleration |
| ASE | American Society of Echocardiography |
| BMI | Body mass index |
| BP | Blood pressure |
| CA | Chronological age |
| CARDIA | Coronary Artery Risk Development in Young Adults |
| CHD | Coronary heart disease |
| CP | Carotid plaque |
| CpG | Cytosine–phospate–guanine |
| CVD | Cardiovascular disease |
| DBP | Diastolic blood pressure |
| DNAm | DNA methylation |
| EA | Epigenetic age |
| EAA | Epigenetic age acceleration |
| EASD | European Association for the Study of Diabetes |
| EEAA | Extrinsic epigenetic age acceleration |
| EGA | European Genome-phenome Archive |
| ESC | European Society of Cardiology |
| ESH | European Society of Hypertension |
| FPG | Fasting plasma glucose |
| GENOA | Genetic Epidemiology Network of Arteriopathy |
| GGT | Gamma-glutamyl transferase |
| HAPIEE | Health, Alcohol, and Psychosocial Factors in Eastern Europe |
| HDL | High-density lipoprotein |
| HT | Hypertension |
| IEAA | Intrinsic epigenetic age acceleration |
| IIPM | Institute of Internal and Preventive Medicine |
| LDL | Low-density lipoprotein |
| MCP | Multiple carotid plaques |
| MI | Myocardial infarction |
| QC | Quality control |
| SBP | Systolic blood pressure |
| T2DM | Type 2 diabetes mellitus |
| TC | Total cholesterol |
| TG | Triglycerides |
| WHR | Waist–hip ratio |
Appendix A


| Phenotype | Sex | (Min, Max) | Mean (SD) | p-Value | 95% CI |
|---|---|---|---|---|---|
| Age, years | All | (44.78, 70.37) | 56.78 (7.13) | 0.16 | (−0.46, 2.75) |
| F | (44.78, 70.11) | 57.3 (7.28) | |||
| M | (45.15, 70.37) | 56.15 (6.92) | |||
| BMI, kg/m | All | (16.76, 53.62) | 28.06 (5.3) | <0.001 | (1.18, 3.48) |
| F | (16.76, 53.62) | 29.12 (5.66) | |||
| M | (18.37, 43.27) | 26.8 (4.54) | |||
| WHR, units | All | (0.69, 1.13) | 0.88 (0.08) | <0.001 | (−0.12, −0.09) |
| F | (0.69, 1.01) | 0.84 (0.06) | |||
| M | (0.79, 1.13) | 0.94 (0.07) | |||
| Alcohol (annual intake), g | All | (0, 43,530) | 2696.73 (5936.95) | <0.001 | (−6129.87, −3453.23) |
| F | (0, 14,850) | 504.52 (1323.39) | |||
| M | (0, 43,530) | 5296.07 (7919.46) | |||
| Alcohol (annual occasions), n | All | (0, 365) | 47 (75.56) | <0.001 | (−77.54, −44) |
| F | (0, 198) | 19.19 (34.44) | |||
| M | (0, 365) | 79.96 (95.4) | |||
| GGT, mmol/L | All | (10, 140) | 31.26 (19.92) | <0.001 | (−12.69, −3.77) |
| F | (10, 140) | 27.5 (18.34) | |||
| M | (12, 130) | 35.73 (20.85) | |||
| Glucose, mmol/L | All | (4.11, 17.11) | 6.04 (1.65) | 0.766 | (−0.44, 0.32) |
| F | (4.11, 16) | 6.02 (1.6) | |||
| M | (4.56, 17.11) | 6.07 (1.72) | |||
| TC, mmol/L | All | (4.04, 11.06) | 6.5 (1.28) | 0.001 | (0.19, 0.75) |
| F | (4.14, 11.06) | 6.72 (1.33) | |||
| M | (4.14, 11.06) | 6.25 (1.17) | |||
| TG, mmol/L | All | (0.56, 5.56) | 1.62 (0.84) | 0.189 | (−0.06, 0.31) |
| F | (0.56, 5.56) | 1.67 (0.92) | |||
| M | (0.63, 4.59) | 1.55 (0.71) | |||
| HDL, mmol/L | All | (0.7, 3.29) | 1.54 (0.33) | 0.015 | (0.02, 0.17) |
| F | (0.93, 2.46) | 1.59 (0.32) | |||
| M | (0.7, 3.29) | 1.49 (0.35) | |||
| LDL, mmol/L | All | (1.46, 8.3) | 4.22 (1.14) | 0.013 | (0.07, 0.58) |
| F | (1.94, 8.09) | 4.37 (1.15) | |||
| M | (1.46, 8.3) | 4.05 (1.1) | |||
| SBP, mmHg | All | (93.33, 247) | 140.95 (25.75) | 0.861 | (−5.21, 6.23) |
| F | (93.33, 227.67) | 141.18 (28.19) | |||
| M | (99.67, 247) | 140.67 (22.62) | |||
| DBP, mmHg | All | (54.33, 135.33) | 88.65 (13.76) | 0.275 | (−4.8, 1.37) |
| F | (59, 135) | 87.87 (14.15) | |||
| M | (54.33, 135.33) | 89.59 (13.26) |
| EAA | Sex | (Min, Max) | Mean (SD) | Median (IQR) | p-Value | 95% CI |
|---|---|---|---|---|---|---|
| HannumAA | All | (−17.6, 20.49) | 0 (4.35) | −0.33 (5.2) | <0.001 | (−3.46, −1.56) |
| F | (−17.6, 10.69) | −1.15 (4.06) | −1.06 (4.77) | |||
| M | (−7.65, 20.49) | 1.36 (4.32) | 0.7 (5.85) | |||
| HannumEEAA | All | (−20, 24.18) | 0 (5.42) | 0.04 (6.73) | <0.001 | (−4.59, −2.27) |
| F | (−20, 13.44) | −1.57 (5.15) | −1.55 (5.8) | |||
| M | (−9.24, 24.18) | 1.86 (5.16) | 1.29 (7.2) | |||
| HannumIEAA | All | (−15.55, 18.54) | 0 (3.91) | −0.19 (4.98) | 0.001 | (−2.44, −0.69) |
| F | (−15.55, 8.11) | −0.72 (3.57) | −0.67 (4.43) | |||
| M | (−7.49, 18.54) | 0.85 (4.13) | 0.55 (5.19) | |||
| HorvathAAd | All | (−17.16, 21.87) | 2.16 (4.95) | 2 (6.02) | <0.001 | (−3.51, −1.31) |
| F | (−17.16, 13.42) | 1.06 (4.58) | 0.82 (5.55) | |||
| M | (−10.84, 21.87) | 3.47 (5.07) | 3.49 (6.15) | |||
| HorvathAAr | All | (−16.11, 17.01) | 0 (4.49) | −0.07 (5.55) | <0.001 | (−3.07, −1.08) |
| F | (−16.11, 11.83) | −0.95 (4.13) | −0.9 (5.43) | |||
| M | (−9.98, 17.01) | 1.13 (4.65) | 1.08 (5.79) | |||
| HorvathIEAA | All | (−15.62, 15.93) | 0 (4.32) | 0.07 (5.57) | 0.002 | (−2.51, −0.56) |
| F | (−15.62, 10.23) | −0.7 (4.07) | −0.48 (5.26) | |||
| M | (−8.84, 15.93) | 0.83 (4.48) | 0.58 (5.56) | |||
| SkinBloodAA | All | (−21.55, 13.15) | 0 (3.68) | −0.39 (4.82) | 0.048 | (−1.66, −0.01) |
| F | (−21.55, 9.82) | −0.38 (3.73) | −0.58 (4.85) | |||
| M | (−9.33, 13.15) | 0.45 (3.58) | 0.18 (4.48) | |||
| PhenoAA | All | (−17.95, 26.12) | 0 (5.74) | −0.53 (7.4) | <0.001 | (−3.62, −1.08) |
| F | (−17.95, 26.12) | −1.08 (5.68) | −1.62 (5.78) | |||
| M | (−10.35, 15.91) | 1.27 (5.56) | 0.71 (7.88) | |||
| GrimAA | All | (−10.46, 15.05) | 0 (5.44) | −1.47 (7.73) | <0.001 | (−8.19, −6.26) |
| F | (−10.46, 8.45) | −3.31 (2.94) | −3.44 (3.16) | |||
| M | (−7.71, 15.05) | 3.92 (5.12) | 3.66 (8.39) |
| Phenotype | Sex | Samples, n | Cases, n (%) | OR (95% CI) | p-Value |
|---|---|---|---|---|---|
| Smoking status | All | 306 | 126 (41.18%) | <0.001 | |
| F | 166 | 24 (14.46%) | 0.06 (0.03, 0.12) | ||
| M | 140 | 102 (72.86%) | 15.69 (8.67, 29.34) | ||
| T2DM | All | 306 | 34 (11.11%) | 0.466 | |
| F | 166 | 16 (9.64%) | 0.72 (0.33, 1.57) | ||
| M | 140 | 18 (12.86%) | 1.38 (0.64, 3.03) | ||
| CHD | All | 306 | 130 (42.48%) | 0.083 | |
| F | 166 | 63 (37.95%) | 0.67 (0.41, 1.08) | ||
| M | 140 | 67 (47.86%) | 1.5 (0.93, 2.43) | ||
| CP | All | 105 | 46 (43.81%) | 0.698 | |
| F | 55 | 23 (41.82%) | 0.85 (0.36, 1.96) | ||
| M | 50 | 23 (46%) | 1.18 (0.51, 2.75) | ||
| MCP | All | 105 | 16 (15.24%) | 0.001 | |
| F | 55 | 2 (3.64%) | 0.1 (0.01, 0.47) | ||
| M | 50 | 14 (28%) | 10.1 (2.12, 96.93) | ||
| HT | All | 306 | 176 (57.52%) | 0.643 | |
| F | 166 | 93 (56.02%) | 0.88 (0.54, 1.41) | ||
| M | 140 | 83 (59.29%) | 1.14 (0.71, 1.85) |
| EAA | Sex | EAA Group Size, n (%) | adjEAA Group Size, n (%) | ||
|---|---|---|---|---|---|
| EAA | EAA | adjEAA | adjEAA | ||
| HannumAA | All | 162 (53%) | 144 (47%) | 155 (51%) | 151 (49%) |
| F | 104 (63%) | 62 (37%) | 80 (48%) | 86 (52%) | |
| M | 58 (41%) | 82 (59%) | 75 (54%) | 65 (46%) | |
| HannumEEAA | All | 150 (49%) | 156 (51%) | 159 (52%) | 147 (48%) |
| F | 100 (60%) | 66 (40%) | 81 (49%) | 85 (51%) | |
| M | 50 (36%) | 90 (64%) | 78 (56%) | 62 (44%) | |
| HannumIEAA | All | 160 (52%) | 146 (48%) | 159 (52%) | 147 (48%) |
| F | 95 (57%) | 71 (43%) | 82 (49%) | 84 (51%) | |
| M | 65 (46%) | 75 (54%) | 77 (55%) | 63 (45%) | |
| HorvathAAd | All | 98 (32%) | 208 (68%) | 156 (51%) | 150 (49%) |
| F | 68 (41%) | 98 (59%) | 87 (52%) | 79 (48%) | |
| M | 30 (21%) | 110 (79%) | 69 (49%) | 71 (51%) | |
| HorvathAAr | All | 155 (51%) | 151 (49%) | 151 (49%) | 155 (51%) |
| F | 98 (59%) | 68 (41%) | 81 (49%) | 85 (51%) | |
| M | 57 (41%) | 83 (59%) | 70 (50%) | 70 (50%) | |
| HorvathIEAA | All | 150 (49%) | 156 (51%) | 152 (50%) | 154 (50%) |
| F | 89 (54%) | 77 (46%) | 79 (48%) | 87 (52%) | |
| M | 61 (44%) | 79 (56%) | 73 (52%) | 67 (48%) | |
| SkinBloodAA | All | 163 (53%) | 143 (47%) | 162 (53%) | 144 (47%) |
| F | 96 (58%) | 70 (42%) | 91 (55%) | 75 (45%) | |
| M | 67 (48%) | 73 (52%) | 71 (51%) | 69 (49%) | |
| PhenoAA | All | 168 (55%) | 138 (45%) | 164 (54%) | 142 (46%) |
| F | 105 (63%) | 61 (37%) | 89 (54%) | 77 (46%) | |
| M | 63 (45%) | 77 (55%) | 75 (54%) | 65 (46%) | |
| GrimAA | All | 186 (61%) | 120 (39%) | 157 (51%) | 149 (49%) |
| F | 151 (91%) | 15 (9%) | 85 (51%) | 81 (49%) | |
| M | 35 (25%) | 105 (75%) | 72 (51%) | 68 (49%) | |
| Phenotype | EAA | Unadjusted | Adjusted for sex | ||||||||||
|---|---|---|---|---|---|---|---|---|---|---|---|---|---|
| All | Female | Male | All | Female | Male | ||||||||
| p | 95% CI | p | 95% CI | p | 95% CI | p | 95% CI | p | 95% CI | p | 95% CI | ||
| Anthropometric | |||||||||||||
| BMI | GrimAA | 0.011 | (−2.767, −0.364) | 0.039 | (−3.079, −0.079) | ||||||||
| HorvathAAd | 0.019 | (−2.950, −0.267) | 0.031 | (−3.751, −0.188) | |||||||||
| WHR | HorvathAAd | 0.007 | (−0.048, −0.008) | 0.004 | (−0.048, −0.009) | ||||||||
| GrimAA | <0.001 | (0.069, 0.103) | 0.046 | (−0.0004, 0.042) | 0.010 | (0.006, 0.046) | |||||||
| SkinBloodAA | 0.041 | (−0.001,0.038) | |||||||||||
| HannumEEAA | 0.016 | (−0.004, 0.042) | |||||||||||
| Lifestyle | |||||||||||||
| Smoking status | GrimAA | <0.001 | (15.646, 61.134) | <0.001 | (3.642, 52.054) | <0.001 | (5.237, 39.030) | <0.001 | (1.799, 4.895) | 0.026 | (1.077, 8.931) | <0.001 | (4.515, 58.734) |
| HorvathAAd | 0.003 | (1.294, 3.884) | 0.016 | (1.140, 9.454) | |||||||||
| PhenoAA | 0.002 | (1.262, 3.359) | 0.013 | (1.201, 6.494) | 0.004 | (1.360, 8.319) | |||||||
| HannumAAr | <0.001 | (1.447, 3.873) | |||||||||||
| HannumIEAA | 0.015 | (1.112, 2.940) | |||||||||||
| HannumEEAA | <0.001 | (1.717, 4.677) | |||||||||||
| Alcohol (annual intake) | HorvathIEAA | 0.009 | (−6721.199, −1005.072) | 0.028 | (−2832.461, −163.529) | 0.023 | (−5521.650, −422.226) | ||||||
| HorvathAAr | 0.033 | (−5976.624, −264.277) | |||||||||||
| GrimAA | <0.001 | (2477.312, 5546.062) | 0.049 | (16.036, 5369.626) | |||||||||
| HannumAAr | 0.028 | (165.525, 2866.550) | |||||||||||
| HannumEEAA | 0.009 | (432.292, 3063.949) | |||||||||||
| Alcohol (annual occasions) | HorvathIEAA | 0.020 | (−73.632, −6.503) | ||||||||||
| HorvathAAr | 0.027 | (4.412, 72.233) | |||||||||||
| HannumEEAA | 0.015 | (4.092, 37.637) | |||||||||||
| GrimAA | <0.001 | (28.848, 66.692) | |||||||||||
| HannumAAr | 0.016 | (3.953,38.375 ) | |||||||||||
| Metabolic | |||||||||||||
| GGT | HannumIEAA | 0.029 | (0.817, 15.130) | ||||||||||
| GrimAA | 0.003 | (2.518, 11.746) | 0.023 | (0.728, 9.699) | |||||||||
| HorvathAAr | 0.030 | (0.738, 14.519) | |||||||||||
| Lipids | |||||||||||||
| TC | HannumAAr | 0.011 | (−0.652, −0.085) | 0.014 | (−0.904, −0.103) | 0.009 | (−0.947, −0.141) | ||||||
| GrimAA | 0.025 | (−0.630, −0.042) | 0.046 | (0.008, 0.818) | |||||||||
| PhenoAA | 0.010 | (−0.653, −0.088) | 0.004 | (−0.993, −0.198) | 0.010 | (−0.919, −0.127) | |||||||
| HannumEEAA | 0.012 | (−0.653, −0.082 ) | 0.012 | (−0.904, −0.113) | 0.003 | (−1.004, −0.203) | |||||||
| TG | GrimAA | 0.015 | (0.070, 0.632) | ||||||||||
| HannumIEAA | 0.043 | (−0.378, −0.006) | 0.028 | (−0.510, −0.030) | |||||||||
| HannumAAr | 0.023 | (−0.403, −0.031) | 0.034 | (−0.522, −0.021) | |||||||||
| HDL | HorvathAAr | 0.004 | (0.046, 0.236) | 0.013 | (0.026, 0.219) | ||||||||
| SkinBloodAA | 0.027 | (0.012, 0.205) | |||||||||||
| HorvathIEAA | 0.002 | (0.053, 0.241) | |||||||||||
| HannumIEAA | 0.033 | (0.010, 0.236) | |||||||||||
| HannumAAr | 0.036 | (0.008, 0.233) | |||||||||||
| GrimAA | 0.004 | (−0.192, −0.036 ) | |||||||||||
| LDL | PhenoAA | 0.012 | (−0.575, −0.070) | 0.002 | (−0.891, −0.208) | 0.037 | (−0.523, −0.016) | 0.004 | (−0.840, −0.157) | ||||
| HannumAAr | 0.013 | (−0.575, −0.068) | 0.007 | (−0.822, −0.129) | 0.010 | (−0.811, −0.112) | |||||||
| HannumEEAA | 0.008 | (−0.601, −0.093) | 0.004 | (−0.848, −0.165) | 0.002 | (−0.904, −0.215) | |||||||
| Cardiovascular | |||||||||||||
| CHD | GrimAA | 0.003 | (1.267, 3.408) | 0.011 | (1.220, 7.596) | <0.001 | (1.518, 4.060) | 0.001 | (1.458, 5.955) | 0.042 | (1.020, 4.389) | ||
| HorvathAAr | 0.015 | (1.106, 2.913) | 0.006 | (1.187, 3.139) | 0.018 | (1.150, 4.995) | |||||||
| CP | GrimAA | 0.009 | (1.367, 22.723) | ||||||||||
| MCP | GrimAA | 0.001 | (1.979, 46.687) | 0.004 | (1.584, 26.779) | 0.009 | (1.401, 33.864) | ||||||
| HT | HorvathAAd | 0.009 | (0.296, 0.867) | 0.007 | (0.195, 0.793) | 0.005 | (0.202, 0.781) | ||||||
| GrimAA | 0.043 | (0.987, 3.764) | |||||||||||
| SBP | HorvathAAd | 0.024 | (−13.311, −0.964) | 0.028 | (−18.191, −1.045) | 0.008 | (−20.142, −3.153) | ||||||
| GrimAA | 0.024 | (1.294, 18.398) | |||||||||||
| DBP | HorvathAAd | 0.048 | (−8.648, −0.031) | 0.003 | (−10.626, −2.144) | ||||||||
| GrimAA | 0.039 | (0.228, 8.832) | |||||||||||
| Phenotype | EAA | p, All | Mean/OR (95% CI, All) | p, Female | Mean/OR (95% CI, Female) | p, Male | Mean/OR (95% CI, Male) |
|---|---|---|---|---|---|---|---|
| Anthropometric | |||||||
| BMI | HorvathAAd | 0.118 | 0.946 (−0.242, 2.133) | 0.051 | 1.712 (−0.005, 3.428) | 0.880 | −0.117 (−1.641, 1.408) |
| BMI | HorvathAAr | 0.955 | 0.034 (−1.159, 1.227) | 0.665 | −0.381 (−2.116, 1.353) | 0.446 | 0.588 (−0.933, 2.108) |
| BMI | SkinBloodAA | 0.768 | −0.179 (−1.373, 1.014) | 0.873 | 0.141 (−1.593, 1.875) | 0.323 | −0.764 (−2.285, 0.758) |
| BMI | HorvathIEAA | 0.409 | 0.501 (−0.692, 1.694) | 0.742 | 0.291 (−1.452, 2.034) | 0.199 | 0.983 (−0.522, 2.488) |
| BMI | HannumEEAA | 0.691 | 0.242 (−0.958, 1.442) | 0.970 | −0.033 (−1.768, 1.702) | 0.228 | 0.929 (−0.589, 2.447) |
| BMI | HannumIEAA | 0.465 | 0.442 (−0.746, 1.631) | 0.656 | 0.394 (−1.348, 2.135) | 0.296 | 0.789 (−0.698, 2.277) |
| BMI | HannumAA | 0.982 | 0.014 (−1.181, 1.208) | 0.830 | 0.190 (−1.556, 1.935) | 0.921 | 0.078 (−1.460, 1.615) |
| BMI | GrimAA | 0.844 | −0.120 (−1.322, 1.082) | 0.081 | −1.543 (−3.281, 0.195) | 0.039 | 1.579 (0.079, 3.079) |
| BMI | PhenoAA | 0.841 | −0.123 (−1.329, 1.084) | 0.787 | 0.239 (−1.510, 1.989) | 0.483 | −0.554 (−2.113, 1.005) |
| WHR | HorvathAAd | 0.178 | 0.013 (−0.006, 0.032) | 0.004 | 0.029 (0.009, 0.048) | 0.909 | 0.001 (−0.021, 0.023) |
| WHR | HorvathAAr | 0.482 | 0.007 (−0.012, 0.026) | 0.170 | 0.014 (−0.006, 0.034) | 0.686 | −0.004 (−0.026, 0.017) |
| WHR | SkinBloodAA | 0.184 | −0.013 (−0.032, 0.006) | 0.604 | −0.005 (−0.025, 0.015) | 0.269 | −0.012 (−0.034, 0.010) |
| WHR | HorvathIEAA | 0.317 | 0.010 (−0.009, 0.028) | 0.376 | 0.009 (−0.011, 0.029) | 0.996 | 0.000 (−0.022, 0.022) |
| WHR | HannumEEAA | 0.152 | 0.014 (−0.005, 0.033) | 0.605 | 0.005 (−0.015, 0.025) | 0.477 | 0.008 (−0.014, 0.030) |
| WHR | HannumIEAA | 0.506 | 0.006 (−0.012, 0.025) | 0.678 | −0.004 (−0.024, 0.016) | 0.583 | 0.006 (−0.016, 0.028) |
| WHR | HannumAA | 0.609 | 0.005 (−0.014, 0.024) | 0.810 | −0.002 (−0.023, 0.018) | 0.911 | 0.001 (−0.021, 0.023) |
| WHR | GrimAA | 0.162 | −0.013 (−0.032, 0.005) | 0.010 | −0.026 (−0.046, −0.006) | 0.920 | 0.001 (−0.021, 0.023) |
| WHR | PhenoAA | 0.475 | 0.007 (−0.012, 0.026) | 0.104 | 0.016 (−0.003, 0.036) | 0.714 | −0.004 (−0.026, 0.018) |
| Lifestyle | |||||||
| Alcohol (annual intake) | HorvathAAd | 0.496 | 459.390 (−868.299, 1787.078) | 0.292 | −225.055 (−645.973, 195.864) | 0.238 | 1595.070 (−1070.824, 4260.965) |
| Alcohol (annual intake) | HorvathAAr | 0.107 | 1101.018 (−238.071, 2440.106) | 0.522 | −130.099 (−531.505, 271.307) | 0.069 | 2435.000 (−192.278, 5062.278) |
| Alcohol (annual intake) | SkinBloodAA | 0.438 | 519.830 (−797.085, 1836.746) | 0.388 | −190.837 (−627.538, 245.865) | 0.182 | 1783.619 (−845.651, 4412.889) |
| Alcohol (annual intake) | HorvathIEAA | 0.028 | 1497.995 (163.529, 2832.461) | 0.485 | −140.131 (−535.868, 255.606) | 0.023 | 2971.938 (422.226, 5521.650) |
| Alcohol (annual intake) | HannumEEAA | 0.833 | 144.007 (−1197.565, 1485.579) | 0.373 | −180.731 (−581.352, 219.891) | 0.888 | −193.486 (−2906.095, 2519.122) |
| Alcohol (annual intake) | HannumIEAA | 0.506 | 448.790 (−878.267, 1775.846) | 0.379 | −180.038 (−583.961, 223.885) | 0.642 | 616.522 (−2000.890, 3233.935) |
| Alcohol (annual intake) | HannumAA | 0.529 | 426.629 (−906.939, 1760.197) | 0.257 | −228.406 (−625.223, 168.412) | 0.627 | 646.862 (−1977.101, 3270.824) |
| Alcohol (annual intake) | GrimAA | 0.105 | −1119.352 (−2474.041, 235.337) | 0.355 | 187.723 (−212.549, 587.995) | 0.049 | −2692.831 (−5369.626, −16.036) |
| Alcohol (annual intake) | PhenoAA | 0.446 | 510.560 (−806.875, 1827.995) | 0.727 | −76.111 (−506.575, 354.353) | 0.360 | 1210.595 (−1395.209, 3816.398) |
| Alcohol (annual occasions) | HorvathAAd | 0.886 | −1.236 (−18.230, 15.759) | 0.316 | −5.429 (−16.092, 5.234) | 0.629 | 7.843 (−24.213, 39.900) |
| Alcohol (annual occasions) | HorvathAAr | 0.213 | 10.806 (−6.247, 27.859) | 0.441 | −4.114 (−14.640, 6.412) | 0.096 | 26.900 (−4.801, 58.601) |
| Alcohol (annual occasions) | SkinBloodAA | 0.884 | 1.253 (−15.668, 18.175) | 0.375 | −4.829 (−15.541, 5.883) | 0.392 | 13.818 (−18.028, 45.664) |
| Alcohol (annual occasions) | HorvathIEAA | 0.134 | 13.001 (−4.012, 30.013) | 0.419 | −4.305 (−14.803, 6.194) | 0.083 | 27.554 (−3.661, 58.768) |
| Alcohol (annual occasions) | HannumEEAA | 0.967 | −0.360 (−17.423, 16.703) | 0.515 | −3.487 (−14.028, 7.054) | 0.722 | −5.854 (−38.391, 26.683) |
| Alcohol (annual occasions) | HannumIEAA | 0.907 | −1.014 (−18.093, 16.065) | 0.587 | −2.911 (−13.470, 7.647) | 0.706 | −6.212 (−38.690, 26.266) |
| Alcohol (annual occasions) | HannumAA | 0.942 | 0.634 (−16.385, 17.654) | 0.255 | −6.066 (−16.547, 4.414) | 0.927 | 1.484 (−30.599, 33.568) |
| Alcohol (annual occasions) | GrimAA | 0.737 | −2.923 (−20.017, 14.170) | 0.529 | 3.366 (−7.167, 13.900) | 0.512 | −10.678 (−42.810, 21.453) |
| Alcohol (annual occasions) | PhenoAA | 0.412 | 7.037 (−9.830, 23.903) | 0.576 | 3.000 (−7.580, 13.580) | 0.459 | 11.880 (−19.746, 43.506) |
| Smoking status | HorvathAAd | 0.164 | 1.400 (0.865, 2.271) | 0.016 | 3.112 (1.140, 9.454) | 0.850 | 0.901 (0.398, 2.028) |
| Smoking status | HorvathAAr | 0.908 | 0.957 (0.591, 1.547) | 0.661 | 0.779 (0.294, 2.027) | 0.849 | 1.154 (0.513, 2.613) |
| Smoking status | SkinBloodAA | 0.908 | 1.039 (0.642, 1.682) | 0.826 | 0.847 (0.314, 2.209) | 1.000 | 0.962 (0.426, 2.169) |
| Smoking status | HorvathIEAA | 1.000 | 0.978 (0.605, 1.582) | 1.000 | 1.085 (0.417, 2.874) | 0.706 | 1.186 (0.527, 2.700) |
| Smoking status | HannumEEAA | 0.642 | 1.142 (0.706, 1.849) | 0.512 | 1.397 (0.536, 3.769) | 0.181 | 1.771 (0.771, 4.217) |
| Smoking status | HannumIEAA | 0.642 | 1.142 (0.706, 1.849) | 0.271 | 1.757 (0.669, 4.873) | 0.451 | 1.360 (0.600, 3.150) |
| Smoking status | HannumAA | 0.296 | 1.297 (0.802, 2.102) | 0.128 | 2.048 (0.769, 5.900) | 0.186 | 1.708 (0.750, 4.004) |
| Smoking status | GrimAA | 0.000 | 2.954 (1.799, 4.895) | 0.026 | 2.941 (1.077, 8.931) | 0.000 | 14.047 (4.515, 58.734) |
| Smoking status | PhenoAA | 0.132 | 1.424 (0.879, 2.311) | 0.663 | 0.801 (0.297, 2.087) | 0.004 | 3.249 (1.360, 8.319) |
| Metabolic | |||||||
| T2DM | HorvathAAd | 0.717 | 1.192 (0.548, 2.614) | 0.441 | 0.635 (0.180, 2.043) | 0.207 | 2.124 (0.685, 7.363) |
| T2DM | HorvathAAr | 0.102 | 1.912 (0.866, 4.419) | 0.794 | 1.250 (0.391, 4.172) | 0.075 | 2.943 (0.914, 11.207) |
| T2DM | SkinBloodAA | 0.720 | 1.141 (0.523, 2.489) | 0.188 | 2.169 (0.673, 7.658) | 0.451 | 0.618 (0.190, 1.882) |
| T2DM | HorvathIEAA | 0.364 | 1.469 (0.674, 3.284) | 0.798 | 1.186 (0.371, 3.956) | 0.313 | 1.844 (0.605, 6.012) |
| T2DM | HannumEEAA | 0.468 | 0.732 (0.328, 1.596) | 0.794 | 1.250 (0.391, 4.172) | 0.203 | 0.441 (0.116, 1.420) |
| T2DM | HannumIEAA | 1.000 | 0.957 (0.436, 2.081) | 0.432 | 1.706 (0.530, 6.018) | 0.321 | 0.572 (0.165, 1.777) |
| T2DM | HannumAA | 1.000 | 1.030 (0.472, 2.245) | 0.436 | 1.618 (0.503, 5.706) | 0.615 | 0.704 (0.216, 2.144) |
| T2DM | GrimAA | 0.858 | 0.929 (0.424, 2.021) | 1.000 | 1.054 (0.326, 3.410) | 0.803 | 0.828 (0.264, 2.510) |
| T2DM | PhenoAA | 0.586 | 0.788 (0.353, 1.718) | 0.112 | 0.354 (0.079, 1.235) | 0.455 | 1.518 (0.501, 4.757) |
| GGT | HorvathAAd | 0.664 | 0.990 (−3.484, 5.464) | 0.260 | 3.176 (−2.373, 8.725) | 0.770 | −1.037 (−8.046, 5.973) |
| GGT | HorvathAAr | 0.614 | −1.150 (−5.630, 3.330) | 0.151 | 4.135 (−1.521, 9.791) | 0.030 | −7.629 (−14.519, −0.738) |
| GGT | SkinBloodAA | 0.531 | 1.431 (−3.061, 5.924) | 0.794 | −0.766 (−6.551, 5.019) | 0.178 | 4.752 (−2.182, 11.685) |
| GGT | HorvathIEAA | 0.937 | 0.180 (−4.309, 4.669) | 0.305 | 2.983 (−2.749, 8.715) | 0.270 | −3.955 (−11.026, 3.115) |
| GGT | HannumEEAA | 0.186 | 2.997 (−1.449, 7.443) | 0.192 | 3.749 (−1.902, 9.400) | 0.803 | 0.873 (−6.041, 7.788) |
| GGT | HannumIEAA | 0.218 | 2.774 (−1.652, 7.201) | 0.893 | 0.386 (−5.266, 6.037) | 0.172 | 4.644 (−2.039, 11.326) |
| GGT | HannumAA | 0.120 | 3.530 (−0.925, 7.984) | 0.304 | 2.968 (−2.716, 8.651) | 0.344 | 3.255 (−3.530, 10.041) |
| GGT | GrimAA | 0.023 | −5.213 (−9.699, −0.728) | 0.087 | −4.906 (−10.542, 0.729) | 0.114 | −5.618 (−12.606, 1.370) |
| GGT | PhenoAA | 0.916 | 0.244 (−4.285, 4.773) | 0.205 | 3.549 (−1.960, 9.057) | 0.314 | −3.666 (−10.841, 3.510) |
| Glucose | HorvathAAd | 0.500 | 0.130 (−0.248, 0.508) | 0.197 | 0.325 (−0.170, 0.820) | 0.761 | −0.089 (−0.664, 0.487) |
| Glucose | HorvathAAr | 0.706 | −0.072 (−0.447, 0.303) | 0.907 | −0.029 (−0.527, 0.468) | 0.675 | −0.123 (−0.701, 0.455) |
| Glucose | SkinBloodAA | 0.686 | 0.077 (−0.297, 0.452) | 0.778 | −0.072 (−0.572, 0.428) | 0.392 | 0.249 (−0.325, 0.824) |
| Glucose | HorvathIEAA | 0.873 | −0.031 (−0.407, 0.346) | 0.981 | −0.006 (−0.503, 0.491) | 0.828 | −0.065 (−0.653, 0.524) |
| Glucose | HannumEEAA | 0.455 | 0.143 (−0.234, 0.521) | 0.910 | −0.029 (−0.533, 0.476) | 0.260 | 0.335 (−0.251, 0.921) |
| Glucose | HannumIEAA | 0.360 | −0.182 (−0.574, 0.209) | 0.088 | −0.439 (−0.944, 0.067) | 0.730 | 0.108 (−0.509, 0.725) |
| Glucose | HannumAA | 0.488 | −0.133 (−0.512, 0.245) | 0.564 | −0.147 (−0.647, 0.354) | 0.680 | −0.128 (−0.742, 0.486) |
| Glucose | GrimAA | 0.792 | 0.051 (−0.328, 0.430) | 0.359 | −0.234 (−0.736, 0.268) | 0.200 | 0.376 (−0.201, 0.952) |
| Glucose | PhenoAA | 0.517 | 0.124 (−0.253, 0.501) | 0.421 | 0.203 (−0.294, 0.700) | 0.909 | 0.034 (−0.550, 0.618) |
| Lipids | |||||||
| HDL | HorvathAAd | 0.948 | 0.002 (−0.073, 0.077) | 0.712 | −0.018 (−0.117, 0.080) | 0.725 | 0.021 (−0.096, 0.137) |
| HDL | HorvathAAr | 0.281 | −0.041 (−0.116, 0.034) | 0.013 | −0.122 (−0.219, −0.026) | 0.328 | 0.057 (−0.058, 0.173) |
| HDL | SkinBloodAA | 0.104 | −0.062 (−0.136, 0.013) | 0.027 | −0.108 (−0.205, −0.012) | 0.790 | −0.016 (−0.131, 0.100) |
| HDL | HorvathIEAA | 0.328 | −0.037 (−0.113, 0.038) | 0.065 | −0.091 (−0.188, 0.006) | 0.541 | 0.035 (−0.079, 0.150) |
| HDL | HannumEEAA | 0.158 | −0.054 (−0.129, 0.021) | 0.959 | −0.003 (−0.101, 0.095) | 0.092 | −0.102 (−0.221, 0.017) |
| HDL | HannumIEAA | 0.195 | −0.050 (−0.125, 0.026) | 0.765 | 0.015 (−0.083, 0.113) | 0.056 | −0.116 (−0.234, 0.003) |
| HDL | HannumAA | 0.529 | −0.024 (−0.099, 0.051) | 0.450 | 0.038 (−0.060, 0.135) | 0.148 | −0.087 (−0.204, 0.031) |
| HDL | GrimAA | 0.935 | −0.003 (−0.078, 0.072) | 0.306 | 0.051 (−0.047, 0.148) | 0.260 | −0.066 (−0.183, 0.050) |
| HDL | PhenoAA | 0.604 | −0.020 (−0.095, 0.055) | 0.602 | −0.026 (−0.122, 0.071) | 0.825 | −0.013 (−0.129, 0.103) |
| LDL | HorvathAAd | 0.458 | 0.097 (−0.160, 0.353) | 0.324 | 0.177 (−0.176, 0.531) | 0.916 | −0.020 (−0.388, 0.349) |
| LDL | HorvathAAr | 0.643 | −0.060 (−0.316, 0.195) | 0.916 | 0.019 (−0.334, 0.372) | 0.435 | −0.146 (−0.515, 0.223) |
| LDL | SkinBloodAA | 0.138 | 0.193 (−0.063, 0.449) | 0.055 | 0.343 (−0.007, 0.693) | 0.954 | −0.011 (−0.381, 0.359) |
| LDL | HorvathIEAA | 0.627 | −0.063 (−0.319, 0.193) | 0.779 | 0.050 (−0.302, 0.402) | 0.379 | −0.166 (−0.539, 0.207) |
| LDL | HannumEEAA | 0.096 | 0.216 (−0.039, 0.470) | 0.002 | 0.560 (0.215, 0.904) | 0.441 | −0.146 (−0.520, 0.228) |
| LDL | HannumIEAA | 0.427 | 0.104 (−0.153, 0.360) | 0.090 | 0.303 (−0.048, 0.654) | 0.617 | −0.095 (−0.468, 0.279) |
| LDL | HannumAA | 0.211 | 0.163 (−0.093, 0.418) | 0.010 | 0.461 (0.112, 0.811) | 0.413 | −0.154 (−0.525, 0.217) |
| LDL | GrimAA | 0.446 | −0.099 (−0.356, 0.157) | 0.089 | −0.304 (−0.655, 0.047) | 0.439 | 0.145 (−0.224, 0.513) |
| LDL | PhenoAA | 0.037 | 0.270 (0.016, 0.523) | 0.004 | 0.498 (0.157, 0.840) | 0.994 | −0.001 (−0.373, 0.371) |
| TC | HorvathAAd | 0.560 | 0.085 (−0.203, 0.374) | 0.479 | 0.148 (−0.263, 0.558) | 0.920 | −0.020 (−0.411, 0.371) |
| TC | HorvathAAr | 0.410 | −0.120 (−0.407, 0.167) | 0.610 | −0.105 (−0.513, 0.302) | 0.525 | −0.126 (−0.517, 0.265) |
| TC | SkinBloodAA | 0.203 | 0.186 (−0.101, 0.472) | 0.149 | 0.297 (−0.108, 0.702) | 0.947 | 0.013 (−0.378, 0.404) |
| TC | HorvathIEAA | 0.404 | −0.122 (−0.409, 0.165) | 0.797 | −0.053 (−0.460, 0.353) | 0.431 | −0.157 (−0.552, 0.237) |
| TC | HannumEEAA | 0.140 | 0.215 (−0.071, 0.500) | 0.003 | 0.603 (0.203, 1.004) | 0.378 | −0.178 (−0.575, 0.220) |
| TC | HannumIEAA | 0.473 | 0.105 (−0.182, 0.392) | 0.099 | 0.341 (−0.064, 0.747) | 0.552 | −0.120 (−0.516, 0.277) |
| TC | HannumAA | 0.192 | 0.190 (−0.096, 0.477) | 0.009 | 0.544 (0.141, 0.947) | 0.385 | −0.174 (−0.568, 0.220) |
| TC | GrimAA | 0.215 | −0.182 (−0.470, 0.106) | 0.046 | −0.413 (−0.818, −0.008) | 0.633 | 0.095 (−0.296, 0.485) |
| TC | PhenoAA | 0.081 | 0.253 (−0.031, 0.538) | 0.010 | 0.523 (0.127, 0.919) | 0.738 | −0.067 (−0.460, 0.326) |
| TG | HorvathAAd | 0.751 | −0.031 (−0.220, 0.159) | 0.867 | −0.025 (−0.314, 0.265) | 0.702 | −0.046 (−0.285, 0.192) |
| TG | HorvathAAr | 0.667 | −0.041 (−0.229, 0.147) | 0.979 | −0.004 (−0.288, 0.280) | 0.498 | −0.082 (−0.322, 0.157) |
| TG | SkinBloodAA | 0.215 | 0.119 (−0.069, 0.308) | 0.342 | 0.137 (−0.148, 0.422) | 0.474 | 0.087 (−0.153, 0.327) |
| TG | HorvathIEAA | 0.623 | −0.047 (−0.235, 0.141) | 0.851 | −0.027 (−0.310, 0.256) | 0.633 | −0.059 (−0.302, 0.184) |
| TG | HannumEEAA | 0.222 | 0.117 (−0.071, 0.305) | 0.479 | 0.102 (−0.182, 0.386) | 0.198 | 0.155 (−0.082, 0.393) |
| TG | HannumIEAA | 0.243 | 0.112 (−0.076, 0.300) | 0.718 | 0.052 (−0.232, 0.336) | 0.097 | 0.200 (−0.036, 0.435) |
| TG | HannumAA | 0.233 | 0.114 (−0.074, 0.302) | 0.491 | 0.099 (−0.185, 0.383) | 0.222 | 0.147 (−0.090, 0.385) |
| TG | GrimAA | 0.070 | −0.174 (−0.363, 0.014) | 0.015 | −0.351 (−0.632, −0.070) | 0.767 | 0.036 (−0.204, 0.276) |
| TG | PhenoAA | 0.940 | 0.007 (−0.183, 0.198) | 0.445 | 0.110 (−0.174, 0.395) | 0.357 | −0.115 (−0.361, 0.131) |
| Cardiovascular | |||||||
| CHD | HorvathAAd | 0.419 | 0.820 (0.507, 1.323) | 0.423 | 0.737 (0.372, 1.448) | 0.866 | 0.895 (0.437, 1.830) |
| CHD | HorvathAAr | 0.006 | 1.924 (1.187, 3.139) | 0.151 | 1.626 (0.826, 3.234) | 0.018 | 2.377 (1.150, 4.995) |
| CHD | SkinBloodAA | 1.000 | 0.991 (0.613, 1.600) | 0.521 | 0.776 (0.390, 1.528) | 0.612 | 1.253 (0.613, 2.572) |
| CHD | HorvathIEAA | 0.134 | 1.421 (0.880, 2.303) | 0.423 | 1.357 (0.690, 2.687) | 0.236 | 1.568 (0.765, 3.239) |
| CHD | HannumEEAA | 0.420 | 1.209 (0.749, 1.954) | 0.264 | 1.466 (0.746, 2.905) | 1.000 | 1.039 (0.505, 2.136) |
| CHD | HannumIEAA | 0.730 | 1.086 (0.673, 1.754) | 1.000 | 1.012 (0.516, 1.989) | 0.611 | 1.237 (0.603, 2.547) |
| CHD | HannumAA | 0.298 | 1.296 (0.803, 2.095) | 0.201 | 1.564 (0.795, 3.109) | 0.865 | 1.107 (0.540, 2.273) |
| CHD | GrimAA | 0.000 | 2.474 (1.518, 4.060) | 0.001 | 2.915 (1.458, 5.955) | 0.042 | 2.102 (1.020, 4.389) |
| CHD | PhenoAA | 0.418 | 1.218 (0.754, 1.969) | 0.873 | 1.083 (0.550, 2.128) | 0.397 | 1.393 (0.680, 2.870) |
| MCP | HorvathAAd | 0.429 | 0.638 (0.184, 2.119) | 1.000 | 0.964 (0.012, 78.414) | 0.343 | 0.485 (0.112, 1.986) |
| MCP | HorvathAAr | 0.290 | 1.797 (0.540, 6.237) | 0.170 | Inf (0.265, Inf) | 0.761 | 1.244 (0.302, 5.156) |
| MCP | SkinBloodAA | 0.426 | 0.616 (0.169, 2.062) | 1.000 | 1.298 (0.016, 105.663) | 0.211 | 0.404 (0.087, 1.672) |
| MCP | HorvathIEAA | 1.000 | 1.118 (0.333, 3.755) | 0.236 | Inf (0.196, Inf) | 1.000 | 0.841 (0.197, 3.436) |
| MCP | HannumEEAA | 1.000 | 1.092 (0.315, 3.640) | 1.000 | 1.400 (0.017, 114.021) | 1.000 | 1.049 (0.244, 4.318) |
| MCP | HannumIEAA | 0.412 | 0.535 (0.134, 1.842) | 1.000 | 1.118 (0.014, 90.951) | 0.353 | 0.507 (0.097, 2.191) |
| MCP | HannumAA | 1.000 | 1.043 (0.301, 3.475) | 1.000 | 1.298 (0.016, 105.663) | 1.000 | 1.049 (0.244, 4.318) |
| MCP | GrimAA | 0.004 | 5.795 (1.584, 26.779) | 0.156 | Inf (0.286, Inf) | 0.009 | 6.225 (1.401, 33.864) |
| MCP | PhenoAA | 0.791 | 1.144 (0.330, 3.815) | 1.000 | 1.400 (0.017, 114.021) | 1.000 | 1.175 (0.273, 4.866) |
| CP | HorvathAAd | 0.332 | 0.677 (0.289, 1.571) | 1.000 | 1.089 (0.328, 3.644) | 0.153 | 0.392 (0.104, 1.397) |
| CP | HorvathAAr | 0.843 | 1.141 (0.488, 2.666) | 1.000 | 1.122 (0.330, 3.793) | 1.000 | 1.143 (0.326, 4.030) |
| CP | SkinBloodAA | 0.555 | 0.746 (0.318, 1.730) | 1.000 | 0.989 (0.292, 3.317) | 0.395 | 0.536 (0.148, 1.873) |
| CP | HorvathIEAA | 0.437 | 1.380 (0.595, 3.225) | 0.176 | 2.239 (0.669, 7.862) | 0.782 | 0.832 (0.234, 2.910) |
| CP | HannumEEAA | 1.000 | 0.957 (0.406, 2.244) | 0.417 | 0.610 (0.171, 2.069) | 0.567 | 1.544 (0.435, 5.598) |
| CP | HannumIEAA | 1.000 | 0.977 (0.417, 2.278) | 1.000 | 1.038 (0.311, 3.462) | 1.000 | 0.936 (0.257, 3.359) |
| CP | HannumAA | 0.844 | 0.894 (0.380, 2.090) | 0.286 | 0.540 (0.151, 1.823) | 0.567 | 1.544 (0.435, 5.598) |
| CP | GrimAA | 0.074 | 2.090 (0.883, 5.032) | 1.000 | 0.941 (0.271, 3.199) | 0.009 | 5.241 (1.367, 22.723) |
| CP | PhenoAA | 1.000 | 1.026 (0.435, 2.412) | 0.787 | 0.829 (0.240, 2.796) | 0.774 | 1.301 (0.362, 4.717) |
| HT | HorvathAAd | 0.064 | 0.642 (0.396, 1.038) | 0.005 | 0.400 (0.202, 0.781) | 0.864 | 1.113 (0.537, 2.309) |
| HT | HorvathAAr | 0.908 | 1.046 (0.648, 1.689) | 0.877 | 0.941 (0.487, 1.818) | 0.731 | 1.193 (0.576, 2.480) |
| HT | SkinBloodAA | 0.563 | 0.860 (0.532, 1.389) | 0.351 | 0.744 (0.383, 1.440) | 1.000 | 1.011 (0.488, 2.097) |
| HT | HorvathIEAA | 0.908 | 0.970 (0.601, 1.565) | 0.876 | 0.930 (0.481, 1.797) | 1.000 | 1.033 (0.498, 2.146) |
| HT | HannumEEAA | 0.644 | 1.140 (0.706, 1.843) | 0.755 | 1.144 (0.592, 2.212) | 0.730 | 1.160 (0.557, 2.430) |
| HT | HannumIEAA | 0.817 | 1.081 (0.669, 1.746) | 0.876 | 1.096 (0.567, 2.118) | 0.864 | 1.080 (0.520, 2.256) |
| HT | HannumAA | 0.356 | 1.248 (0.773, 2.018) | 0.435 | 1.316 (0.681, 2.552) | 0.730 | 1.189 (0.573, 2.482) |
| HT | GrimAA | 0.488 | 1.193 (0.739, 1.929) | 0.043 | 1.917 (0.987, 3.764) | 0.303 | 0.677 (0.324, 1.403) |
| HT | PhenoAA | 0.908 | 0.965 (0.597, 1.559) | 0.876 | 1.088 (0.563, 2.109) | 0.610 | 0.834 (0.401, 1.731) |
| SBP | HorvathAAd | 0.069 | 5.357 (−0.419, 11.133) | 0.008 | 11.648 (3.153, 20.142) | 0.582 | −2.110 (−9.680, 5.461) |
| SBP | HorvathAAr | 0.606 | −1.520 (−7.316, 4.276) | 0.802 | −1.100 (−9.759, 7.559) | 0.602 | −2.005 (−9.585, 5.576) |
| SBP | SkinBloodAA | 0.506 | 1.949 (−3.810, 7.708) | 0.366 | 3.904 (−4.595, 12.403) | 0.920 | −0.386 (−7.976, 7.204) |
| SBP | HorvathIEAA | 0.931 | −0.256 (−6.057, 5.546) | 0.895 | 0.581 (−8.097, 9.260) | 0.756 | −1.198 (−8.816, 6.419) |
| SBP | HannumEEAA | 0.986 | −0.051 (−5.865, 5.763) | 0.570 | 2.492 (−6.159, 11.144) | 0.432 | −3.027 (−10.622, 4.569) |
| SBP | HannumIEAA | 0.356 | 2.712 (−3.058, 8.481) | 0.102 | 7.186 (−1.433, 15.805) | 0.505 | −2.565 (−10.151, 5.021) |
| SBP | HannumAA | 0.710 | −1.099 (−6.902, 4.704) | 0.884 | 0.641 (−8.019, 9.300) | 0.416 | −3.117 (−10.675, 4.441) |
| SBP | GrimAA | 0.293 | −3.104 (−8.899, 2.691) | 0.024 | −9.846 (−18.398, −1.294) | 0.200 | 4.894 (−2.621, 12.409) |
| SBP | PhenoAA | 0.793 | −0.779 (−6.619, 5.061) | 0.590 | −2.376 (−11.075, 6.322) | 0.774 | 1.114 (−6.549, 8.778) |
| DBP | HorvathAAd | 0.135 | 2.356 (−0.735, 5.448) | 0.003 | 6.385 (2.144, 10.626) | 0.309 | −2.288 (−6.718, 2.141) |
| DBP | HorvathAAr | 0.994 | −0.011 (−3.106, 3.084) | 0.922 | 0.215 (−4.131, 4.560) | 0.886 | −0.324 (−4.774, 4.127) |
| DBP | SkinBloodAA | 0.523 | 1.009 (−2.094, 4.113) | 0.520 | 1.416 (−2.924, 5.756) | 0.760 | 0.688 (−3.766, 5.142) |
| DBP | HorvathIEAA | 0.443 | 1.209 (−1.887, 4.305) | 0.462 | 1.626 (−2.730, 5.981) | 0.809 | 0.551 (−3.945, 5.047) |
| DBP | HannumEEAA | 0.870 | −0.259 (−3.374, 2.857) | 0.989 | 0.030 (−4.303, 4.363) | 0.701 | −0.869 (−5.333, 3.595) |
| DBP | HannumIEAA | 0.383 | 1.373 (−1.719, 4.466) | 0.273 | 2.419 (−1.921, 6.759) | 0.972 | −0.080 (−4.541, 4.381) |
| DBP | HannumAA | 0.614 | −0.795 (−3.896, 2.306) | 0.721 | −0.786 (−5.121, 3.550) | 0.653 | −1.013 (−5.453, 3.427) |
| DBP | GrimAA | 0.505 | −1.052 (−4.152, 2.047) | 0.039 | −4.530 (−8.832, −0.228) | 0.172 | 3.064 (−1.353, 7.481) |
| DBP | PhenoAA | 0.678 | −0.666 (−3.820, 2.487) | 0.282 | −2.399 (−6.790, 1.992) | 0.547 | 1.390 (−3.173, 5.953) |
Appendix B. Epigenetic Clocks Information
Appendix B.1. First-Generation Clocks
Appendix B.1.1. Horvath’s Clock
Appendix B.1.2. Hannum’s Clock
Appendix B.2. Second-Generation Clocks
Appendix B.2.1. Intrinsic and Extrinsic EAAs
Appendix B.2.2. Skin and Blood Clock
Appendix B.2.3. DNAm PhenoAge
Appendix B.2.4. Grimage
Appendix B.3. Summary of the Epigenetic Clocks
References
- Bocklandt, S.; Lin, W.; Sehl, M.E.; Sánchez, F.J.; Sinsheimer, J.S.; Horvath, S.; Vilain, E. Epigenetic predictor of age. PloS ONE 2011, 6, e14821. [Google Scholar] [CrossRef] [PubMed] [Green Version]
- Hannum, G.; Guinney, J.; Zhao, L.; Zhang, L.; Hughes, G.; Sadda, S.; Klotzle, B.; Bibikova, M.; Fan, J.B.; Gao, Y.; et al. Genome-wide methylation profiles reveal quantitative views of human aging rates. Mol. Cell 2013, 49, 359–367. [Google Scholar] [CrossRef] [PubMed] [Green Version]
- Horvath, S. DNA methylation age of human tissues and cell types. Genome Biol. 2013, 14, 1–20. [Google Scholar] [CrossRef] [PubMed] [Green Version]
- Levine, M.E.; Lu, A.T.; Quach, A.; Chen, B.H.; Assimes, T.L.; Bandinelli, S.; Hou, L.; Baccarelli, A.A.; Stewart, J.D.; Li, Y.; et al. An epigenetic biomarker of aging for lifespan and healthspan. Aging 2018, 10, 573. [Google Scholar] [CrossRef] [Green Version]
- Lu, A.T.; Quach, A.; Wilson, J.G.; Reiner, A.P.; Aviv, A.; Raj, K.; Hou, L.; Baccarelli, A.A.; Li, Y.; Stewart, J.D.; et al. DNA methylation GrimAge strongly predicts lifespan and healthspan. Aging 2019, 11, 303. [Google Scholar] [CrossRef]
- Ecker, S.; Beck, S. The epigenetic clock: A molecular crystal ball for human aging? Aging 2019, 11, 833. [Google Scholar] [CrossRef]
- Jylhävä, J.; Pedersen, N.L.; Hägg, S. Biological age predictors. EBioMedicine 2017, 21, 29–36. [Google Scholar] [CrossRef] [Green Version]
- Horvath, S.; Raj, K. DNAmethylation-based biomarkers and the epigenetic clock theory of ageing. Nat. Rev. Genet. 2018, 19, 371–384. [Google Scholar] [CrossRef]
- Oblak, L.; van der Zaag, J.; Higgins-Chen, A.T.; Levine, M.E.; Boks, M.P. A systematic review of biological, social and environmental factors associated with epigenetic clock acceleration. Ageing Res. Rev. 2021, 69, 101348. [Google Scholar] [CrossRef]
- Perna, L.; Zhang, Y.; Mons, U.; Holleczek, B.; Saum, K.U.; Brenner, H. Epigenetic age acceleration predicts cancer, cardiovascular, and all-cause mortality in a German case cohort. Clin. Epigenetics 2016, 8, 64. [Google Scholar] [CrossRef]
- Qin, N.; Li, Z.; Song, N.; Wilson, C.L.; Easton, J.; Mulder, H.; Plyler, E.; Neale, G.; Walker, E.; Zhou, X.; et al. Epigenetic age acceleration and chronic health conditions among adult survivors of childhood cancer. JNCI J. Natl. Cancer Inst. 2021, 113, 597–605. [Google Scholar] [CrossRef] [PubMed]
- Nannini, D.R.; Joyce, B.T.; Zheng, Y.; Gao, T.; Liu, L.; Yoon, G.; Huan, T.; Ma, J.; Jacobs, D.R.; Wilkins, J.T.; et al. Epigenetic age acceleration and metabolic syndrome in the coronary artery risk development in young adults study. Clin. Epigenetics 2019, 11, 160. [Google Scholar] [CrossRef] [PubMed]
- Beydoun, M.A.; Shaked, D.; Tajuddin, S.M.; Weiss, J.; Evans, M.K.; Zonderman, A.B. Accelerated epigenetic age and cognitive decline among urban-dwelling adults. Neurology 2020, 94, e613–e625. [Google Scholar] [CrossRef]
- Peasey, A.; Bobak, M.; Kubinova, R.; Malyutina, S.; Pajak, A.; Tamosiunas, A.; Pikhart, H.; Nicholson, A.; Marmot, M. Determinants of cardiovascular disease and other non-communicable diseases in Central and Eastern Europe: Rationale and design of the HAPIEE study. BMC Public Health 2006, 6, 255. [Google Scholar] [CrossRef] [PubMed] [Green Version]
- Malyutina, S.; Chervova, O.; Tillmann, T.; Maximov, V.; Ryabikov, A.; Gafarov, V.; Hubacek, J.A.; Pikhart, H.; Beck, S.; Bobak, M. The Relationship between Epigenetic Age and Myocardial Infarction/Acute Coronary Syndrome in a Population-Based Nested Case-Control Study. J. Pers. Med. 2022, 12, 110. [Google Scholar] [CrossRef] [PubMed]
- Hilton, M.E. A comparison of a prospective diary and two summary recall techniques for recording alcohol consumption. Br. J. Addict. 1989, 84, 1085–1092. [Google Scholar] [CrossRef] [PubMed]
- Friedewald, W.T.; Levy, R.I.; Fredrickson, D.S. Estimation of the concentration of low-density lipoprotein cholesterol in plasma, without use of the preparative ultracentrifuge. Clin. Chem. 1972, 18, 499–502. [Google Scholar] [CrossRef]
- Ryden, L.; Standl, E.; Bartnik, M.; Van den Berghe, G.; Betteridge, J.; De Boer, M.J.; Cosentino, F.; Jönsson, B.; Laakso, M.; Malmberg, K.; et al. Guidelines on diabetes, pre-diabetes, and cardiovascular diseases: Executive summary: The Task Force on Diabetes and Cardiovascular Diseases of the European Society of Cardiology (ESC) and of the European Association for the Study of Diabetes (EASD). Eur. Heart J. 2007, 28, 88–136. [Google Scholar]
- Williams, B.; Mancia, G.; Spiering, W.; Agabiti Rosei, E.; Azizi, M.; Burnier, M.; Clement, D.L.; Coca, A.; De Simone, G.; Dominiczak, A.; et al. 2018 ESC/ESH Guidelines for the management of arterial hypertension: The Task Force for the management of arterial hypertension of the European Society of Cardiology (ESC) and the European Society of Hypertension (ESH). Eur. Heart J. 2018, 39, 3021–3104. [Google Scholar] [CrossRef] [Green Version]
- Rydén, L.; Grant, P.; Anker, S.; Berne, C.; Cosentino, F.; Danchin, N.; Deaton, C.; Escaned, J.; Hammes, H.; Huikuri, H.; et al. Authors/Task Force Members; ESC Committee for Practice Guidelines (CPG); Document Reviewers. ESC Guidelines on diabetes, pre-diabetes, and cardiovascular diseases developed in collaboration with the EASD: The Task Force on diabetes, pre-diabetes, and cardiovascular diseases of the European Society of Cardiology (ESC) and developed in collaboration with the European Association for the Study of Diabetes (EASD). Eur. Heart J. 2013, 34, 3035–3087. [Google Scholar]
- Stein, J.H.; Korcarz, C.E.; Hurst, R.T.; Lonn, E.; Kendall, C.B.; Mohler, E.R.; Najjar, S.S.; Rembold, C.M.; Post, W.S. Use of carotid ultrasound to identify subclinical vascular disease and evaluate cardiovascular disease risk: A consensus statement from the American Society of Echocardiography Carotid Intima-Media Thickness Task Force endorsed by the Society for Vascular Medicine. J. Am. Soc. Echocardiogr. 2008, 21, 93–111. [Google Scholar] [PubMed]
- Ryabikov, A.; Malyutina, S.; Halcox, J.; Nikitin, Y.; Marmot, M.; Bobak, M. Prevalence and predictors of carotid wall triple line pattern in a general population sample. Arterioscler. Thromb. Vasc. Biol. 2011, 31, 1682–1688. [Google Scholar] [CrossRef] [PubMed]
- Touboul, P.J.; Hennerici, M.; Meairs, S.; Adams, H.; Amarenco, P.; Bornstein, N.; Csiba, L.; Desvarieux, M.; Ebrahim, S.; Hernandez, R.H.; et al. Mannheim carotid intima-media thickness and plaque consensus (2004–2006–2011). Cerebrovasc. Dis. 2012, 34, 290–296. [Google Scholar] [CrossRef] [PubMed] [Green Version]
- Chervova, O.; Conde, L.; Guerra-Assunção, J.A.; Moghul, I.; Webster, A.P.; Berner, A.; Cadieux, E.L.; Tian, Y.; Voloshin, V.; Jesus, T.F.; et al. The Personal Genome Project-UK, an open access resource of human multi-omics data. Sci. Data 2019, 6, 257. [Google Scholar] [CrossRef] [Green Version]
- R Core Team. R: A Language and Environment for Statistical Computing; R Foundation for Statistical Computing: Vienna, Austria, 2021. [Google Scholar]
- Aryee, M.J.; Jaffe, A.E.; Corrada-Bravo, H.; Ladd-Acosta, C.; Feinberg, A.P.; Hansen, K.D.; Irizarry, R.A. Minfi: A flexible and comprehensive Bioconductor package for the analysis of Infinium DNA methylation microarrays. Bioinformatics 2014, 30, 1363–1369. [Google Scholar] [CrossRef] [Green Version]
- Tian, Y.; Morris, T.J.; Webster, A.P.; Yang, Z.; Beck, S.; Feber, A.; Teschendorff, A.E. ChAMP: Updated methylation analysis pipeline for Illumina BeadChips. Bioinformatics 2017, 33, 3982–3984. [Google Scholar] [CrossRef] [Green Version]
- Xu, Z.; Niu, L.; Li, L.; Taylor, J.A. ENmix: A novel background correction method for Illumina HumanMethylation450 BeadChip. Nucleic Acids Res. 2016, 44, e20. [Google Scholar] [CrossRef]
- Horvath, S.; Oshima, J.; Martin, G.M.; Lu, A.T.; Quach, A.; Cohen, H.; Felton, S.; Matsuyama, M.; Lowe, D.; Kabacik, S.; et al. Epigenetic clock for skin and blood cells applied to Hutchinson Gilford Progeria Syndrome and ex vivo studies. Aging 2018, 10, 1758. [Google Scholar] [CrossRef]
- Horvath, S.; Gurven, M.; Levine, M.E.; Trumble, B.C.; Kaplan, H.; Allayee, H.; Ritz, B.R.; Chen, B.; Lu, A.T.; Rickabaugh, T.M.; et al. An epigenetic clock analysis of race/ethnicity, sex, and coronary heart disease. Genome Biol. 2016, 17, 171. [Google Scholar] [CrossRef] [Green Version]
- Lind, L.; Ingelsson, E.; Sundström, J.; Siegbahn, A.; Lampa, E. Methylation-based estimated biological age and cardiovascular disease. Eur. J. Clin. Investig. 2018, 48, e12872. [Google Scholar] [CrossRef]
- Kim, K.; Joyce, B.T.; Zheng, Y.; Schreiner, P.J.; Jacobs Jr, D.R.; Catov, J.M.; Shikany, J.M.; Carnethon, M.R.; Greenland, P.; Van Horn, L.V.; et al. DNA Methylation GrimAge and Incident Diabetes: The Coronary Artery Risk Development in Young Adults (CARDIA) Study. Diabetes 2021, 70, 1404–1413. [Google Scholar] [CrossRef] [PubMed]
- Welch, B.L. The generalization of ‘STUDENT’S’problem when several different population varlances are involved. Biometrika 1947, 34, 28–35. [Google Scholar]
- Fisher, R.A. On the interpretation of χ2 from contingency tables, and the calculation of P. J. R. Stat. Soc. 1922, 85, 87–94. [Google Scholar] [CrossRef]
- Dunn, O.J. Multiple comparisons among means. J. Am. Stat. Assoc. 1961, 56, 52–64. [Google Scholar] [CrossRef]
- Bonferroni, C. Teoria statistica delle classi e calcolo delle probabilita. Pubbl. Del Ist. Super. Sci. Econ. Commericiali Firenze 1936, 8, 3–62. [Google Scholar]
- Hadley, W. Ggplot2: Elegrant Graphics for Data Analysis; Springer: Berlin/Heidelberg, Germany, 2016. [Google Scholar]
- Kolde, R. Package ‘pheatmap’. R Package 2015, 1, 790. [Google Scholar]
- Peterson, B.G.; Carl, P.; Boudt, K.; Bennett, R.; Ulrich, J.; Zivot, E.; Cornilly, D.; Hung, E.; Lestel, M.; Balkissoon, K.; et al. Package ‘performanceanalytics’. R Team Coop. 2018, 3, 13–14. [Google Scholar]
- Roshandel, D.; Chen, Z.; Canty, A.J.; Bull, S.B.; Natarajan, R.; Paterson, A.D. DNA methylation age calculators reveal association with diabetic neuropathy in type 1 diabetes. Clin. Epigenetics 2020, 12, 52. [Google Scholar] [CrossRef] [Green Version]
- Wang, C.; Ni, W.; Yao, Y.; Just, A.; Heiss, J.; Wei, Y.; Gao, X.; Coull, B.A.; Kosheleva, A.; Baccarelli, A.A.; et al. DNA methylation-based biomarkers of age acceleration and all-cause death, myocardial infarction, stroke, and cancer in two cohorts: The NAS, and KORA F4. EBioMedicine 2021, 63, 103151. [Google Scholar] [CrossRef]
- Roetker, N.S.; Pankow, J.S.; Bressler, J.; Morrison, A.C.; Boerwinkle, E. Prospective study of epigenetic age acceleration and incidence of cardiovascular disease outcomes in the ARIC study (Atherosclerosis Risk in Communities). Circ. Genom. Precis. Med. 2018, 11, e001937. [Google Scholar] [CrossRef] [Green Version]
- Snir, S.; Farrell, C.; Pellegrini, M. Human epigenetic ageing is logarithmic with time across the entire lifespan. Epigenetics 2019, 14, 912–926. [Google Scholar] [CrossRef] [PubMed]
- Li, C.; Engström, G.; Hedblad, B.; Calling, S.; Berglund, G.; Janzon, L. Sex differences in the relationships between BMI, WHR and incidence of cardiovascular disease: A population-based cohort study. Int. J. Obes. 2006, 30, 1775–1781. [Google Scholar] [CrossRef] [PubMed] [Green Version]
- Ha, K.H.; Kim, H.C.; Park, S.; Ihm, S.H.; Lee, H.Y. Gender differences in the association between serum γ-Glutamyltransferase and blood pressure change: A prospective community-based cohort study. J. Korean Med. Sci. 2014, 29, 1379–1384. [Google Scholar] [CrossRef] [PubMed] [Green Version]
- Ramirez, L.A.; Sullivan, J.C. Sex differences in hypertension: Where we have been and where we are going. Am. J. Hypertens. 2018, 31, 1247–1254. [Google Scholar] [CrossRef] [Green Version]
- Fransquet, P.D.; Wrigglesworth, J.; Woods, R.L.; Ernst, M.E.; Ryan, J. The epigenetic clock as a predictor of disease and mortality risk: A systematic review and meta-analysis. Clin. Epigenetics 2019, 11, 62. [Google Scholar] [CrossRef] [Green Version]
- Kresovich, J.K.; Garval, E.L.; Martinez Lopez, A.M.; Xu, Z.; Niehoff, N.M.; White, A.J.; Sandler, D.P.; Taylor, J.A. Associations of body composition and physical activity level with multiple measures of epigenetic age acceleration. Am. J. Epidemiol. 2021, 190, 984–993. [Google Scholar] [CrossRef]
- Lin, W.Y.; Wang, Y.C.; Teng, I.H.; Liu, C.; Lou, X.Y. Associations of five obesity metrics with epigenetic age acceleration: Evidence from 2,474 Taiwan Biobank participants. Obesity 2021, 29, 1731–1738. [Google Scholar] [CrossRef]
- Liu, C.; Marioni, R.E.; Hedman, Å.K.; Pfeiffer, L.; Tsai, P.C.; Reynolds, L.M.; Just, A.C.; Duan, Q.; Boer, C.G.; Tanaka, T.; et al. A DNA methylation biomarker of alcohol consumption. Mol. Psychiatry 2018, 23, 422–433. [Google Scholar] [CrossRef]
- Ryan, J.; Wrigglesworth, J.; Loong, J.; Fransquet, P.D.; Woods, R.L. A systematic review and meta-analysis of environmental, lifestyle, and health factors associated with DNA methylation age. J. Gerontol. Ser. A 2020, 75, 481–494. [Google Scholar] [CrossRef]
- Quach, A.; Levine, M.E.; Tanaka, T.; Lu, A.T.; Chen, B.H.; Ferrucci, L.; Ritz, B.; Bandinelli, S.; Neuhouser, M.L.; Beasley, J.M.; et al. Epigenetic clock analysis of diet, exercise, education, and lifestyle factors. Aging 2017, 9, 419. [Google Scholar] [CrossRef] [Green Version]
- McKee, M.; Bobak, M.; Rose, R.; Shkolnikov, V.; Chenet, L.; Leon, D. Patterns of smoking in Russia. Tob. Control. 1998, 7, 22–26. [Google Scholar] [CrossRef] [PubMed]
- Adamson, S.S.; Brace, L.E.; Kennedy, B.K. Alcohol and aging: From epidemiology to mechanism. Transl. Med. Aging 2017, 1, 18–23. [Google Scholar] [CrossRef]
- Shiau, S.; Wang, L.; Liu, H.; Zheng, Y.; Drong, A.; Joyce, B.T.; Wang, J.; Li, W.; Leng, J.; Shen, Y.; et al. Prenatal gestational diabetes mellitus exposure and accelerated offspring DNA methylation age in early childhood. Epigenetics 2021, 16, 186–195. [Google Scholar] [CrossRef]
- Ammous, F.; Zhao, W.; Ratliff, S.M.; Mosley, T.H.; Bielak, L.F.; Zhou, X.; Peyser, P.A.; Kardia, S.L.; Smith, J.A. Epigenetic age acceleration is associated with cardiometabolic risk factors and clinical cardiovascular disease risk scores in African Americans. Clin. Epigenetics 2021, 13, 55. [Google Scholar] [CrossRef] [PubMed]
- Emdin, M.; Passino, C.; Pompella, A.; Paolicchi, A. Gamma-glutamyltransferase as a cardiovascular risk factor. Eur. Heart J. 2006, 27, 2145–2146. [Google Scholar] [CrossRef] [PubMed] [Green Version]
- Whitfield, J. Gamma glutamyl transferase. Crit. Rev. Clin. Lab. Sci. 2001, 38, 263–355. [Google Scholar] [CrossRef]
- Bartlett, J.; Predazzi, I.M.; Williams, S.M.; Bush, W.S.; Kim, Y.; Havas, S.; Toth, P.P.; Fazio, S.; Miller, M. Is isolated low high-density lipoprotein cholesterol a cardiovascular disease risk factor? New insights from the Framingham offspring study. Circ. Cardiovasc. Qual. Outcomes 2016, 9, 206–212. [Google Scholar] [CrossRef] [Green Version]
- Hahn, O.; Grönke, S.; Stubbs, T.M.; Ficz, G.; Hendrich, O.; Krueger, F.; Andrews, S.; Zhang, Q.; Wakelam, M.J.; Beyer, A.; et al. Dietary restriction protects from age-associated DNA methylation and induces epigenetic reprogramming of lipid metabolism. Genome Biol. 2017, 18, 56. [Google Scholar] [CrossRef] [Green Version]
- Irvin, M.R.; Aslibekyan, S.; Do, A.; Zhi, D.; Hidalgo, B.; Claas, S.A.; Srinivasasainagendra, V.; Horvath, S.; Tiwari, H.K.; Absher, D.M.; et al. Metabolic and inflammatory biomarkers are associated with epigenetic aging acceleration estimates in the GOLDN study. Clin. Epigenetics 2018, 10, 56. [Google Scholar] [CrossRef] [Green Version]
- Gao, T.; Wilkins, J.T.; Zheng, Y.; Joyce, B.T.; Jacobs, D.R.; Schreiner, P.J.; Horvath, S.; Greenland, P.; Lloyd-Jones, D.; Hou, L. Plasma lipid profiles in early adulthood are associated with epigenetic aging in the Coronary Artery Risk Development in Young Adults (CARDIA) Study. Clin. Epigenetics 2022, 14, 16. [Google Scholar] [CrossRef]
- Feng, L.; Nian, S.; Tong, Z.; Zhu, Y.; Li, Y.; Zhang, C.; Bai, X.; Luo, X.; Wu, M.; Yan, Z. Age-related trends in lipid levels: A large-scale cross-sectional study of the general Chinese population. BMJ Open 2020, 10, e034226. [Google Scholar] [CrossRef] [PubMed]
- Stevens, S.L.; Wood, S.; Koshiaris, C.; Law, K.; Glasziou, P.; Stevens, R.J.; McManus, R.J. Blood pressure variability and cardiovascular disease: Systematic review and meta-analysis. BMJ 2016, 354, 4098. [Google Scholar] [CrossRef] [PubMed] [Green Version]
- Lappalainen, I.; Almeida-King, J.; Kumanduri, V.; Senf, A.; Spalding, J.D.; Saunders, G.; Kandasamy, J.; Caccamo, M.; Leinonen, R.; Vaughan, B.; et al. The European Genome-phenome Archive of human data consented for biomedical research. Nat. Genet. 2015, 47, 692–695. [Google Scholar] [CrossRef] [PubMed] [Green Version]
- Chen, B.H.; Marioni, R.E.; Colicino, E.; Peters, M.J.; Ward-Caviness, C.K.; Tsai, P.C.; Roetker, N.S.; Just, A.C.; Demerath, E.W.; Guan, W.; et al. DNA methylation-based measures of biological age: Meta-analysis predicting time to death. Aging 2016, 8, 1844. [Google Scholar] [CrossRef] [PubMed] [Green Version]
- Balestrino, M. Role of creatine in the heart: Health and disease. Nutrients 2021, 13, 1215. [Google Scholar] [CrossRef]
- Nagaya, N.; Satoh, T.; Nishikimi, T.; Uematsu, M.; Furuichi, S.; Sakamaki, F.; Oya, H.; Kyotani, S.; Nakanishi, N.; Goto, Y.; et al. Hemodynamic, renal, and hormonal effects of adrenomedullin infusion in patients with congestive heart failure. Circulation 2000, 101, 498–503. [Google Scholar] [CrossRef]
- Ishimitsu, T.; Kojima, M.; Kangawa, K.; Hino, J.; Matsuoka, H.; Kitamura, K.; Eto, T.; Matsuo, H. Genomic structure of human adrenomedullin gene. Biochem. Biophys. Res. Commun. 1994, 203, 631–639. [Google Scholar] [CrossRef]
- Shi, F.; Sun, L.; Kaptoge, S. Association of beta-2-microglobulin and cardiovascular events and mortality: A systematic review and meta-analysis. Atherosclerosis 2021, 320, 70–78. [Google Scholar] [CrossRef]
- Heymans, S.; Schroen, B.; Vermeersch, P.; Milting, H.; Gao, F.; Kassner, A.; Gillijns, H.; Herijgers, P.; Flameng, W.; Carmeliet, P.; et al. Increased cardiac expression of tissue inhibitor of metalloproteinase-1 and tissue inhibitor of metalloproteinase-2 is related to cardiac fibrosis and dysfunction in the chronic pressure-overloaded human heart. Circulation 2005, 112, 1136–1144. [Google Scholar] [CrossRef] [Green Version]
- Zhang, Y.; Wilson, R.; Heiss, J.; Breitling, L.P.; Saum, K.U.; Schöttker, B.; Holleczek, B.; Waldenberger, M.; Peters, A.; Brenner, H. DNA methylation signatures in peripheral blood strongly predict all-cause mortality. Nat. Commun. 2017, 8, 14617. [Google Scholar] [CrossRef] [Green Version]
- Bell, C.G.; Lowe, R.; Adams, P.D.; Baccarelli, A.A.; Beck, S.; Bell, J.T.; Christensen, B.C.; Gladyshev, V.N.; Heijmans, B.T.; Horvath, S.; et al. DNA methylation aging clocks: Challenges and recommendations. Genome Biol. 2019, 20, 249. [Google Scholar] [CrossRef] [PubMed]


| EAA | Clock | Info |
|---|---|---|
| HannumAA | Hannum [2] | Residuals from regressing EA on CA |
| HannumEEAA | Hannum [30] | Residuals from regressing the weighted average of Hannum’s EA and estimated measures of blood cells counts on CA |
| HannumIEAA | Hannum [30] | Residuals from regressing Hannum’s EA on CA and various blood immune cell counts |
| HorvathAAd | Horvath [3] | Difference between EA and CA |
| HorvathAAr | Horvath [3] | Residuals from regressing EA on CA |
| HorvathIEAA | Horvath [30] | Residuals from regressing Horvath’s EA on CA and various blood immune cell counts |
| SkinBloodAA | Skin and Blood [29] | Residuals from regressing EA on CA |
| PhenoAA | PhenoAge [4] | Residuals from regressing EA on CA |
| GrimAA | GrimAge [5] | Residuals from regressing EA on CA |
| Phenotype | EAA | p, All | 95% CI, All | p, F | 95% CI, F | p, M | 95% CI, M |
|---|---|---|---|---|---|---|---|
| Anthropometric | |||||||
| BMI | GrimAA | 0.039 | (−3.079, −0.079) | ||||
| WHR | HorvathAAd | 0.004 | (−0.048, −0.009) | ||||
| GrimAA | 0.010 | (0.006, 0.046) | |||||
| Lifestyle | |||||||
| Smoking status | GrimAA | <0.001 | (1.799, 4.895) | 0.026 | (1.077, 8.931) | <0.001 | (4.5, 58.7) |
| HorvathAAd | 0.016 | (1.140, 9.454) | |||||
| PhenoAA | 0.004 | (1.360, 8.319) | |||||
| Alcohol, annual intake | HorvathIEAA | 0.028 | (−2832, −163 ) | 0.023 | (−5522, −422) | ||
| GrimAA | 0.049 | (16, 5370) | |||||
| Metabolic | |||||||
| GGT | GrimAA | 0.023 | (0.728, 9.699) | ||||
| HorvathAAr | 0.030 | (0.738, 14.5) | |||||
| Lipids | |||||||
| TC | HannumAA | 0.009 | (−0.947, −0.141) | ||||
| GrimAA | 0.046 | (0.008, 0.818) | |||||
| PhenoAA | 0.010 | (−0.919, −0.127) | |||||
| HannumEEAA | 0.003 | (−1.004, −0.203) | |||||
| TG | GrimAA | 0.015 | (0.070, 0.632) | ||||
| HDL | HorvathAAr | 0.013 | (0.026, 0.219) | ||||
| SkinBloodAA | 0.027 | (0.012, 0.205) | |||||
| LDL | PhenoAA | 0.037 | (−0.523, −0.016) | 0.004 | (−0.840, −0.157) | ||
| HannumAA | 0.010 | (−0.811, −0.112) | |||||
| HannumEEAA | 0.002 | (−0.904, −0.215) | |||||
| Cardiovascular | |||||||
| CHD | GrimAA | <0.001 | (1.518, 4.060) | 0.001 | (1.458, 5.955) | 0.042 | (1.020, 4.389) |
| HorvathAAr | 0.006 | (1.187, 3.139) | 0.018 | (1.150, 4.995) | |||
| CP | GrimAA | 0.009 | (1.367, 22.723) | ||||
| MCP | GrimAA | 0.004 | (1.584, 26.779) | 0.009 | (1.401, 33.864) | ||
| HT | HorvathAAd | 0.005 | (0.202, 0.781) | ||||
| GrimAA | 0.043 | (0.987, 3.764) | |||||
| SBP | HorvathAAd | 0.008 | (−20.1, −3.2) | ||||
| GrimAA | 0.024 | (1.3, 18.4) | |||||
| DBP | HorvathAAd | 0.003 | (−10.626, −2.144) | ||||
| GrimAA | 0.039 | (0.228, 8.832) | |||||
| HannumIEAA | HannumEEAA | HannumAA | HorvathAAd | HorvathAAr | HorvathIEAA | SkinBloodAA | PhenoAA | GrimAA | |
|---|---|---|---|---|---|---|---|---|---|
| BMI | m | ||||||||
| WHR | F | F | |||||||
| Smoking Status | F | M | AFM | ||||||
| Alcohol (annual intake) | a M | m | |||||||
| Alcohol (annual occasions) | |||||||||
| GGT | m | a | |||||||
| TC | F | F | F | f | |||||
| TG | f | ||||||||
| HDL | f | f | |||||||
| LDL | F | F | aF | ||||||
| CHD | A m | AFm | |||||||
| CP | m | ||||||||
| MCP | A m | ||||||||
| HT | F | f | |||||||
| SBP | F | f | |||||||
| DBP | F | f |
Disclaimer/Publisher’s Note: The statements, opinions and data contained in all publications are solely those of the individual author(s) and contributor(s) and not of MDPI and/or the editor(s). MDPI and/or the editor(s) disclaim responsibility for any injury to people or property resulting from any ideas, methods, instructions or products referred to in the content. |
© 2022 by the authors. Licensee MDPI, Basel, Switzerland. This article is an open access article distributed under the terms and conditions of the Creative Commons Attribution (CC BY) license (https://creativecommons.org/licenses/by/4.0/).
Share and Cite
Chervova, O.; Chernysheva , E.; Panteleeva , K.; Widayati , T.A.; Hrbkova, N.; Schneider , J.; Maximov , V.; Ryabikov , A.; Tillmann , T.; Pikhart, H.; et al. Evaluation of Epigenetic Age Acceleration Scores and Their Associations with CVD-Related Phenotypes in a Population Cohort. Biology 2023, 12, 68. https://doi.org/10.3390/biology12010068
Chervova O, Chernysheva E, Panteleeva K, Widayati TA, Hrbkova N, Schneider J, Maximov V, Ryabikov A, Tillmann T, Pikhart H, et al. Evaluation of Epigenetic Age Acceleration Scores and Their Associations with CVD-Related Phenotypes in a Population Cohort. Biology. 2023; 12(1):68. https://doi.org/10.3390/biology12010068
Chicago/Turabian StyleChervova, Olga, Elizabeth Chernysheva , Kseniia Panteleeva , Tyas Arum Widayati , Natalie Hrbkova, Jadesada Schneider , Vladimir Maximov , Andrew Ryabikov , Taavi Tillmann , Hynek Pikhart, and et al. 2023. "Evaluation of Epigenetic Age Acceleration Scores and Their Associations with CVD-Related Phenotypes in a Population Cohort" Biology 12, no. 1: 68. https://doi.org/10.3390/biology12010068