
Functional Connectivity Alterations Based on Hypometabolic Region May Predict Clinical Prognosis of Temporal Lobe Epilepsy: A Simultaneous 18F-FDG PET/fMRI Study

 , ,
, ,
Abstract
:Simple Summary
Abstract
1. Introduction
2. Materials and Methods
2.1. Subjects
2.2. PET/MR Acquisition and Preprocessing
2.3. Obtaining Hypometabolic Regions on 18F-FDG PET
2.4. Construction of ROI-Based FC Alteration Patterns
2.5. Statistical Analysis
3. Results
3.1. Demographic and Clinical Characteristics of Subjects
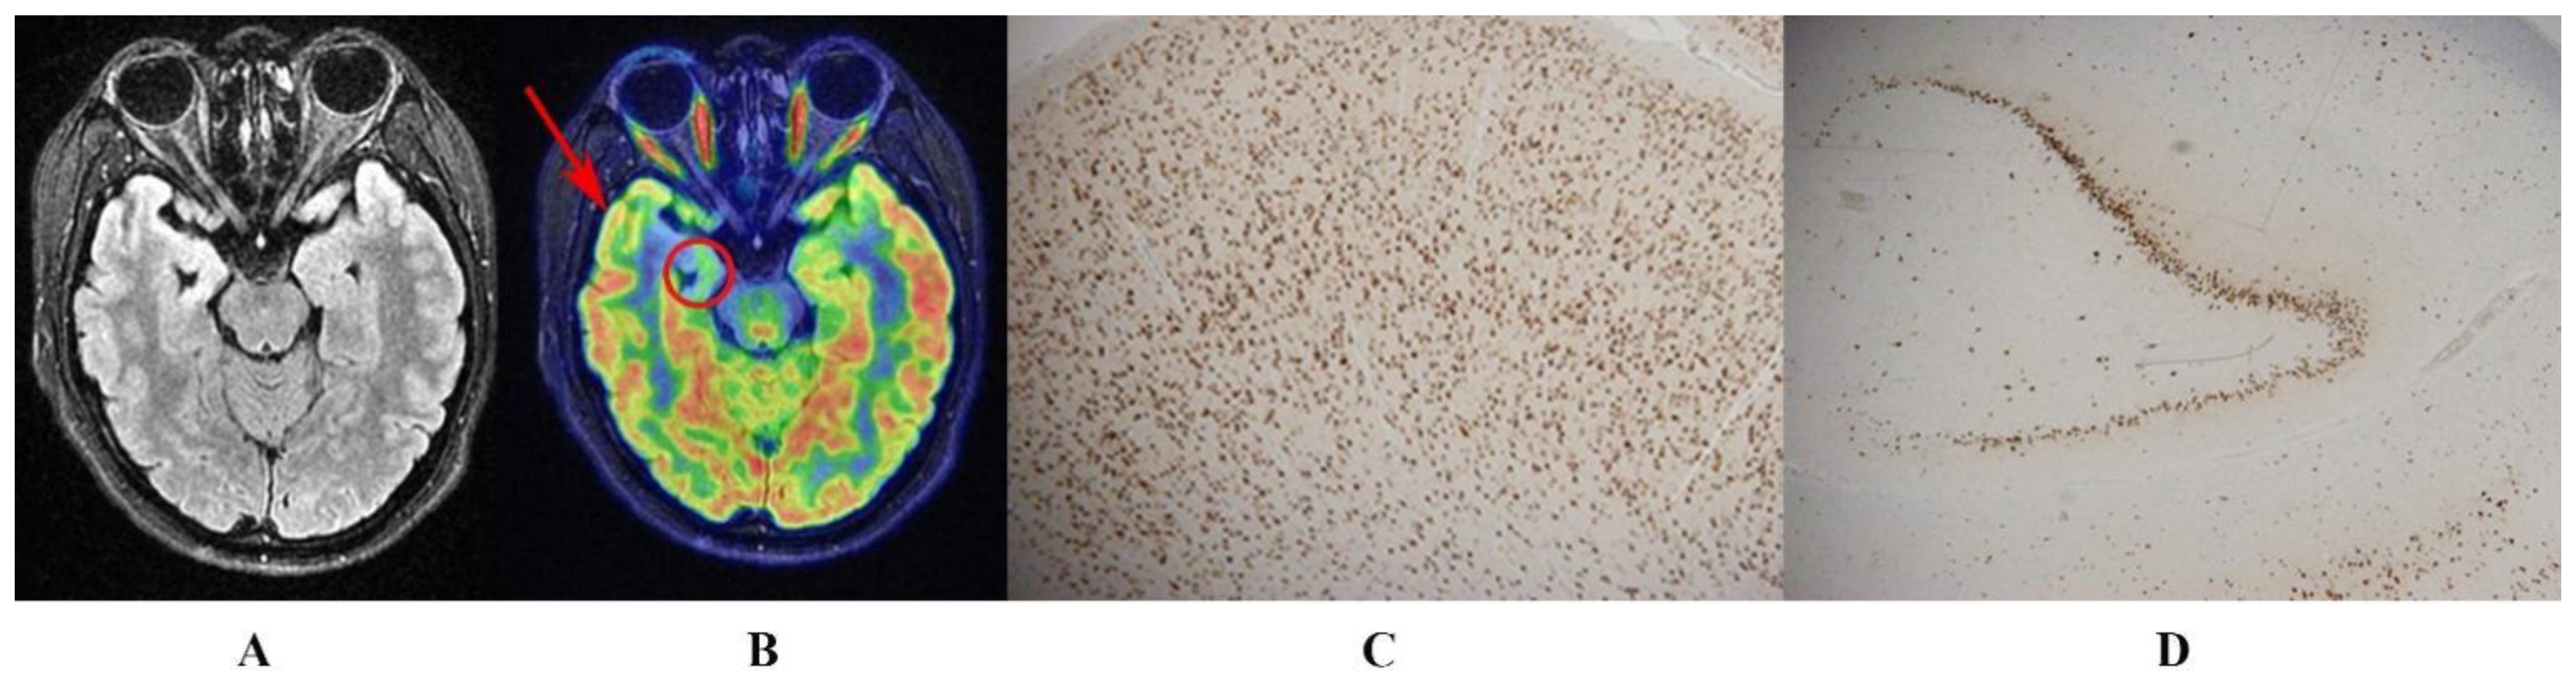
3.2. Hypometabolic Region Localized on 18F-FDG PET
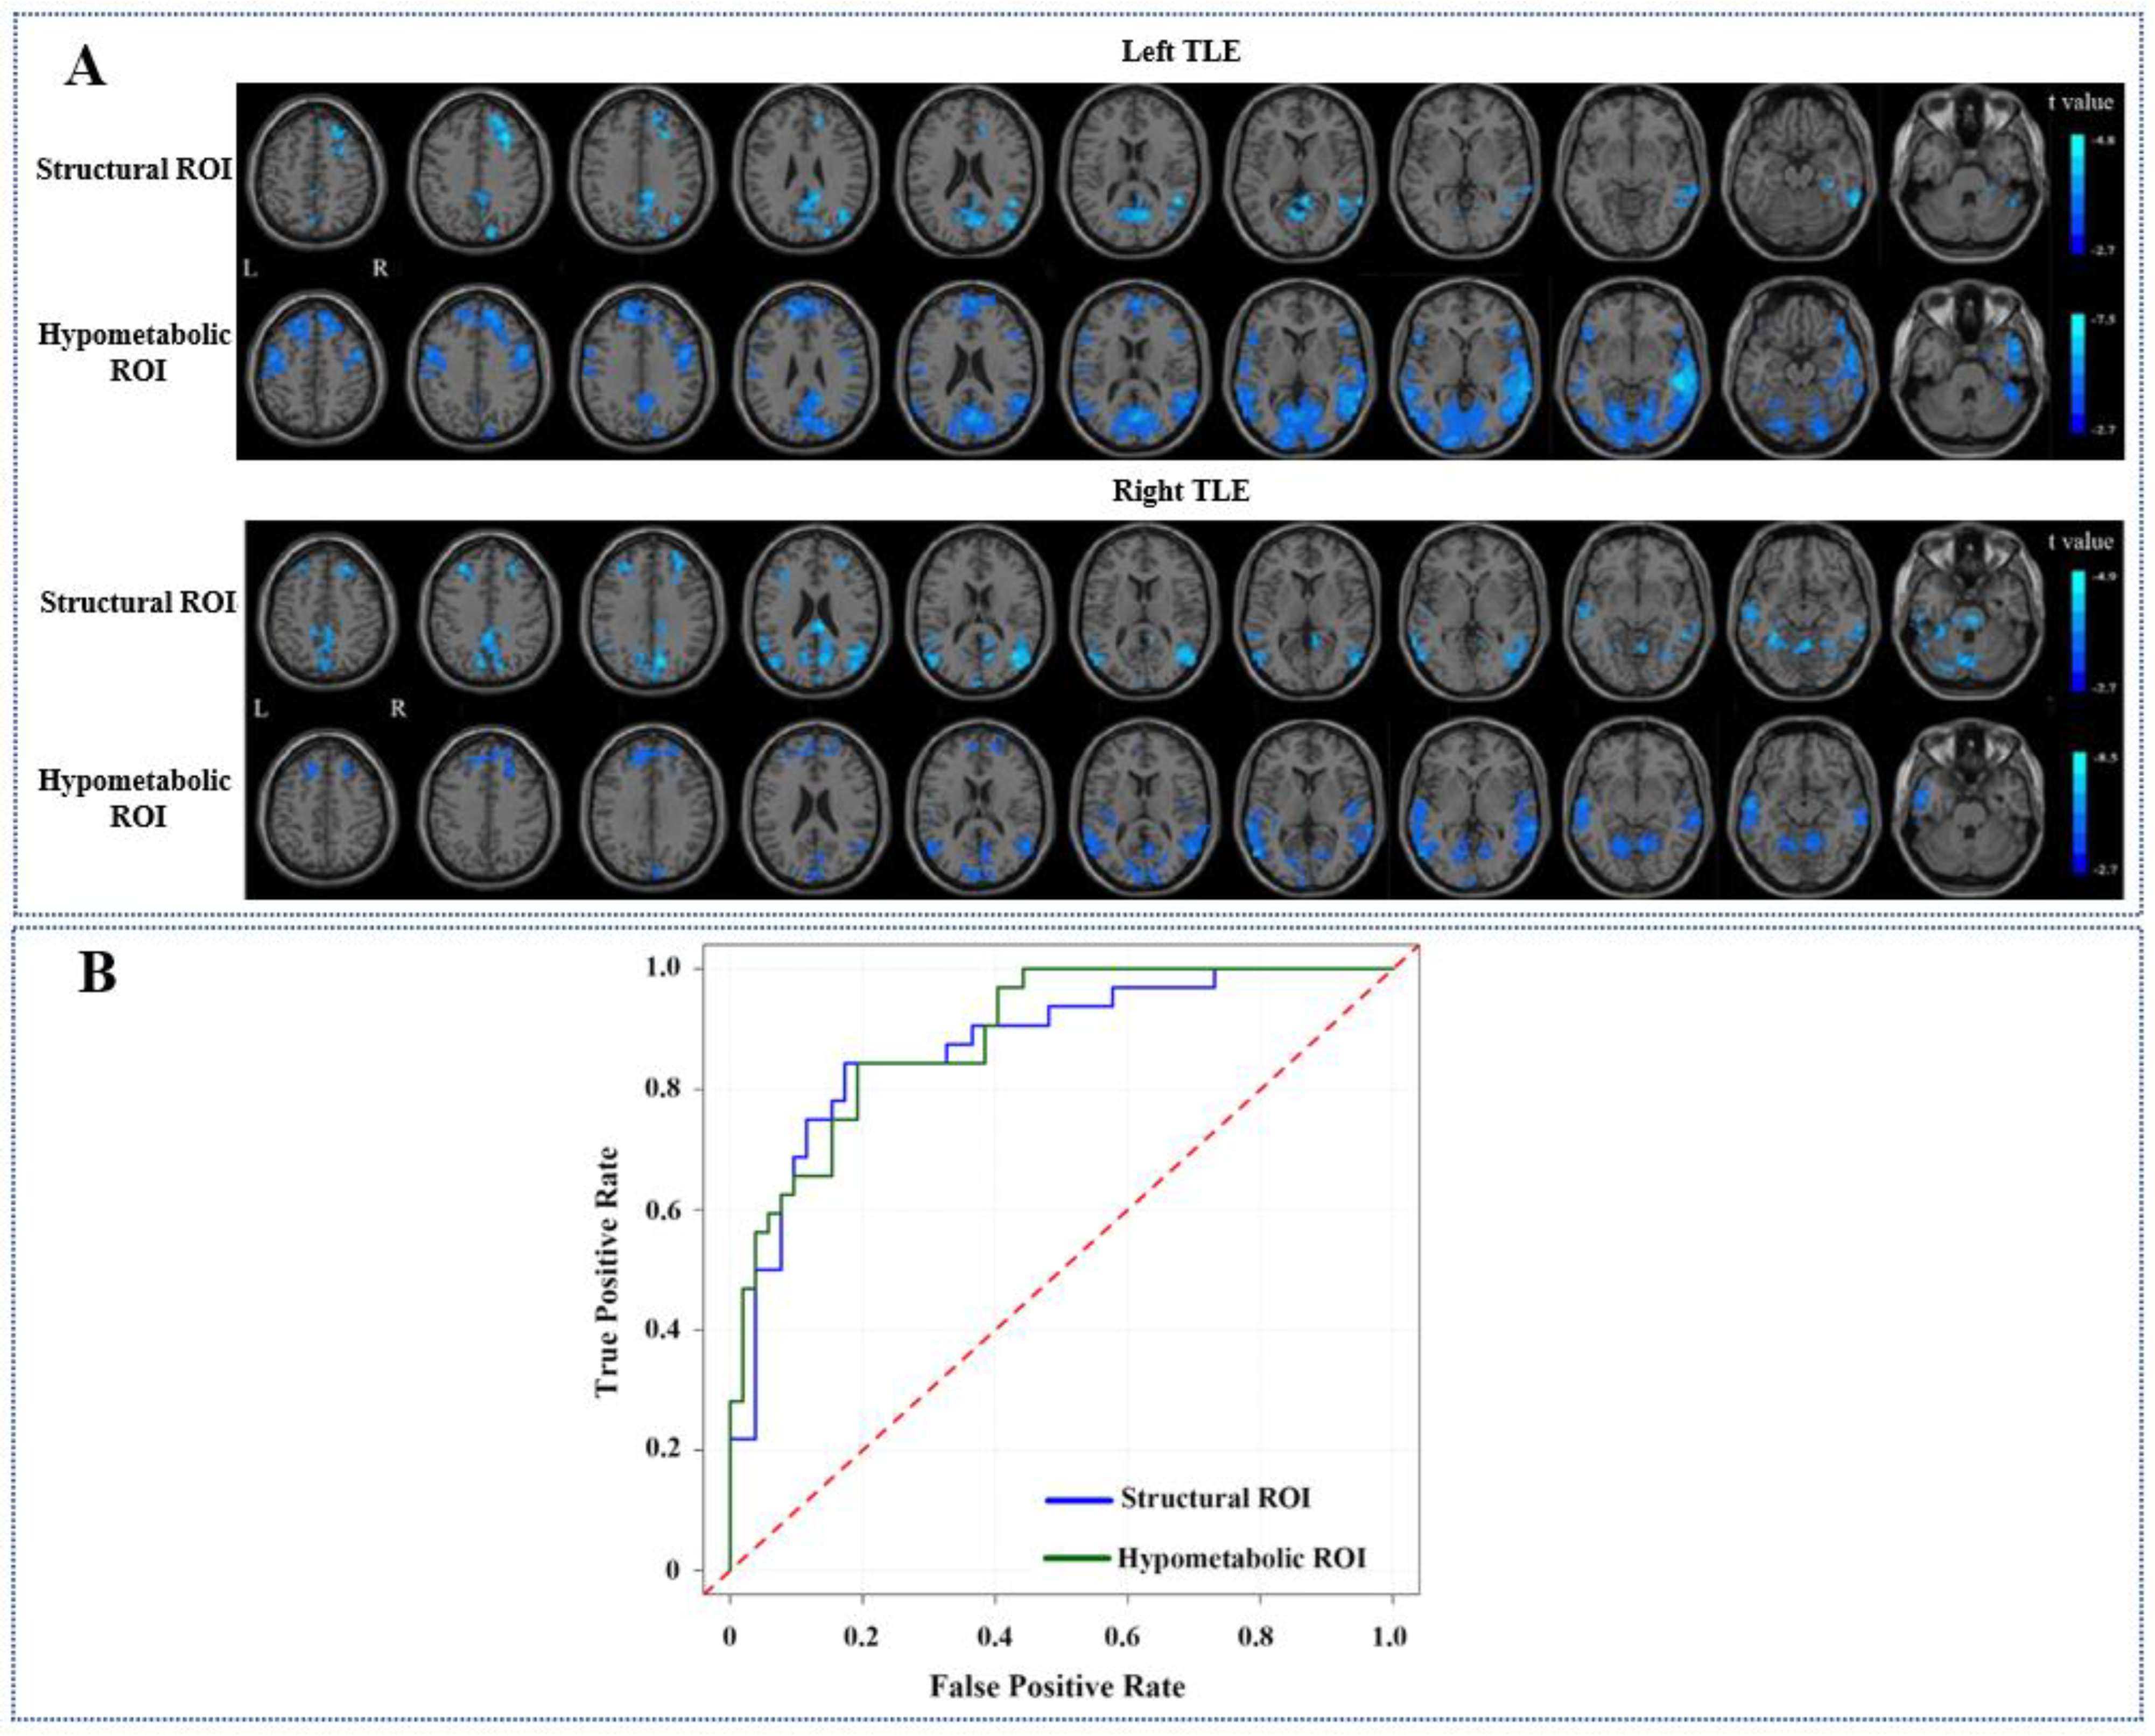
3.3. Comparisons of FC Alteration Patterns Based on Hypometabolic and Structural Lesion
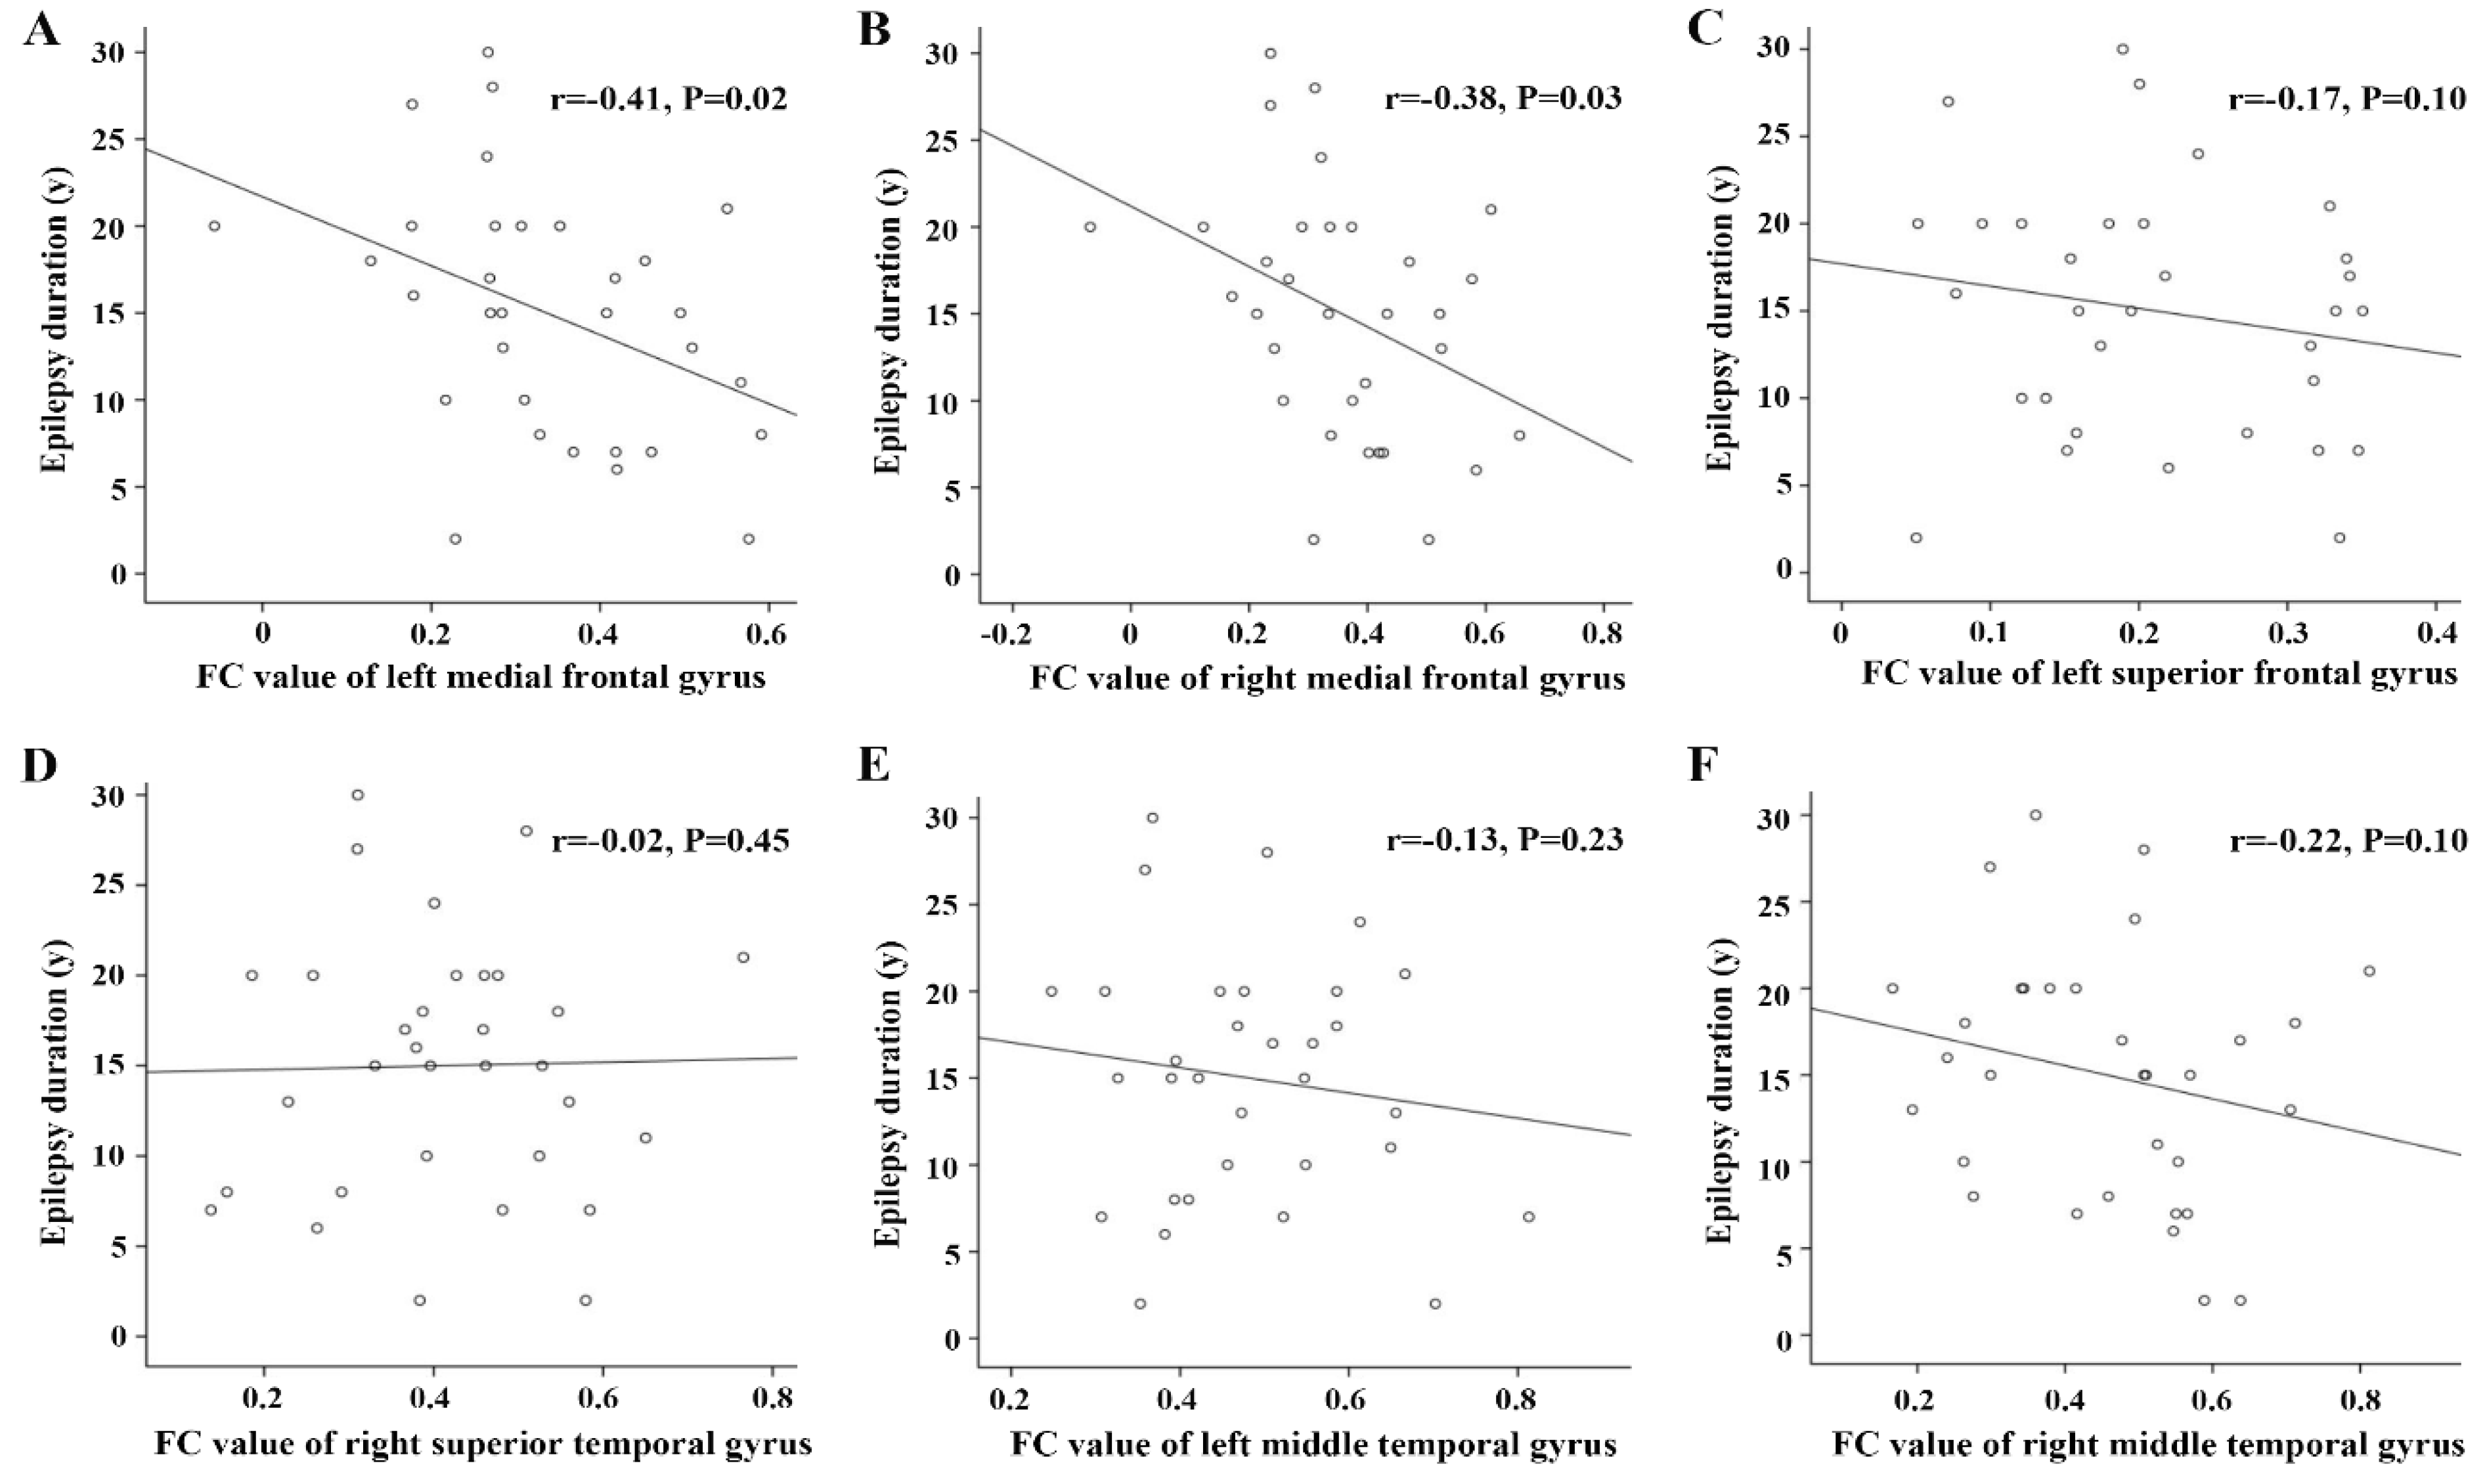
3.4. Correlations between FC Alterations Based on Hypometabolic Region and Clinical Prognosis
4. Discussion
5. Conclusions
Supplementary Materials
Author Contributions
Funding
Institutional Review Board Statement
Informed Consent Statement
Data Availability Statement
Conflicts of Interest
References
- Engel, J., Jr.; McDermott, M.P.; Wiebe, S.; Langfitt, J.T.; Stern, J.M.; Dewar, S.; Sperling, M.R.; Gardiner, I.; Erba, G.; Fried, I.; et al. Early Randomized Surgical Epilepsy Trial (ERSET) Study Group. Early surgical therapy for drug-resistant temporal lobe epilepsy: A randomized trial. JAMA 2012, 307, 922–930. [Google Scholar] [CrossRef] [PubMed]
- Englot, D.J.; Konrad, P.E.; Morgan, V.L. Regional and global connectivity disturbances in focal epilepsy, related neurocognitive sequelae, and potential mechanistic underpinnings. Epilepsia 2016, 57, 1546–1557. [Google Scholar] [CrossRef] [PubMed] [Green Version]
- Lee, H.W.; Arora, J.; Papademetris, X.; Tokoglu, F.; Negishi, M.; Scheinost, D.; Farooque, P.; Blumenfeld, H.; Spencer, D.D.; Constable, R.T. Altered functional connectivity in seizure onset zones revealed by fMRI intrinsic connectivity. Neurology 2014, 83, 2269–2277. [Google Scholar] [CrossRef] [PubMed] [Green Version]
- Negishi, M.; Martuzzi, R.; Novotny, E.J.; Spencer, D.D.; Constable, R.T. Functional MRI connectivity as a predictor of the surgical outcome of epilepsy. Epilepsia 2011, 52, 1733–1740. [Google Scholar] [CrossRef] [Green Version]
- Kumar, A.; Chugani, H.T. The role of radionuclide imaging in epilepsy, Part 1: Sporadic temporal and extratemporal lobe epilepsy. J. Nucl. Med. 2013, 54, 1775–1781. [Google Scholar] [CrossRef]
- Muhlhofer, W.; Tan, Y.L.; Mueller, S.G.; Knowlton, R. MRI-negative temporal lobe epilepsy-What do we know? Epilepsia 2017, 58, 727–742. [Google Scholar] [CrossRef] [Green Version]
- Liu, F.; Ruan, W.; Deng, X.; Song, Y.; Song, W.; Hu, F.; Guo, J.; Lan, X. Efficacy of delayed (18)F-FDG hybrid PET/MRI for epileptic focus identification: A prospective cohort study. Eur. J. Nucl. Med. Mol. Imaging 2021, 48, 293–301. [Google Scholar] [CrossRef]
- von Oertzen, T.J. PET and ictal SPECT can be helpful for localizing epileptic foci. Curr. Opin. Neurol. 2018, 31, 184–191. [Google Scholar] [CrossRef] [Green Version]
- Berger, J.; Plotkin, M.; Demin, K.; Holtkamp, M.; Bengner, T. The relationship between structural MRI, FDG-PET, and memory in temporal lobe epilepsy: Preliminary results. Epilepsy Behav. 2018, 80, 61–67. [Google Scholar] [CrossRef]
- Lamusuo, S.; Jutila, L.; Ylinen, A.; Kälviäinen, R.; Mervaala, E.; Haaparanta, M.; Jääskeläinen, S.; Partanen, K.; Vapalahti, M.; Rinne, J. [18F]FDG-PET reveals temporal hypometabolism in patients with temporal lobe epilepsy even when quantitative MRI and histopathological analysis show only mild hippocampal damage. Arch. Neurol. 2001, 58, 933–939. [Google Scholar] [CrossRef] [Green Version]
- Kuba, R.; Tyrlíková, I.; Chrastina, J.; Slaná, B.; Pažourková, M.; Hemza, J.; Brázdil, M.; Novák, Z.; Hermanová, M.; Rektor, I. “MRI-negative PET-positive” temporal lobe epilepsy: Invasive EEG findings, histopathology, and postoperative outcomes. Epilepsy Behav. 2011, 22, 537–541. [Google Scholar] [CrossRef]
- Shang, K.; Wang, J.; Fan, X.; Cui, B.; Ma, J.; Yang, H.; Zhou, Y.; Zhao, G.; Lu, J. Clinical Value of Hybrid TOF-PET/MR Imaging-Based Multiparametric Imaging in Localizing Seizure Focus in Patients with MRI-Negative Temporal Lobe Epilepsy. AJNR Am. J. Neuroradiol. 2018, 39, 1791–1798. [Google Scholar] [CrossRef] [PubMed]
- Uijl, S.G.; Leijten, F.S.; Arends, J.B.; Parra, J.; van Huffelen, A.C.; Moons, K.G. The added value of [18F]-fluoro-D-deoxyglucose positron emission tomography in screening for temporal lobe epilepsy surgery. Epilepsia 2007, 48, 2121–2129. [Google Scholar] [CrossRef] [PubMed]
- DeSalvo, M.N.; Tanaka, N.; Douw, L.; Cole, A.J.; Stufflebeam, S.M. Contralateral Preoperative Resting-State Functional MRI Network Integration Is Associated with Surgical Outcome in Temporal Lobe Epilepsy. Radiology 2020, 294, 622–627. [Google Scholar] [CrossRef]
- Haneef, Z.; Lenartowicz, A.; Yeh, H.J.; Levin, H.S.; Engel, J., Jr.; Stern, J.M. Functional connectivity of hippocampal networks in temporal lobe epilepsy. Epilepsia 2014, 55, 137–145. [Google Scholar] [CrossRef]
- Morgan, V.L.; Conrad, B.N.; Abou-Khalil, B.; Rogers, B.P.; Kang, H. Increasing structural atrophy and functional isolation of the temporal lobe with duration of disease in temporal lobe epilepsy. Epilepsy Res. 2015, 110, 171–178. [Google Scholar] [CrossRef] [Green Version]
- Pereira, F.R.; Alessio, A.; Sercheli, M.S.; Pedro, T.; Bilevicius, E.; Rondina, J.M.; Ozelo, H.F.; Castellano, G.; Covolan, R.J.; Damasceno, B.P.; et al. Asymmetrical hippocampal connectivity in mesial temporal lobe epilepsy: Evidence from resting state fMRI. BMC Neurosci. 2010, 11, 66. [Google Scholar] [CrossRef] [Green Version]
- Pittau, F.; Grova, C.; Moeller, F.; Dubeau, F.; Gotman, J. Patterns of altered functional connectivity in mesial temporal lobe epilepsy. Epilepsia 2012, 53, 1013–1023. [Google Scholar] [CrossRef] [Green Version]
- Cecchin, D.; Palombit, A.; Castellaro, M.; Silvestri, E.; Bui, F.; Barthel, H.; Sabri, O.; Corbetta, M.; Bertoldo, A. Brain PET and functional MRI: Why simultaneously using hybrid PET/MR systems? Q. J. Nucl. Med. Mol. Imaging 2017, 61, 345–359. [Google Scholar] [CrossRef]
- Noe, K.; Sulc, V.; Wong-Kisiel, L.; Wirrell, E.; Van Gompel, J.J.; Wetjen, N.; Britton, J.; So, E.; Cascino, G.D.; Marsh, W.R.; et al. Long-term outcomes after nonlesional extratemporal lobe epilepsy surgery. JAMA Neurol. 2013, 70, 1003–1008. [Google Scholar] [CrossRef]
- Yan, S.; Zheng, C.; Cui, B.; Qi, Z.; Zhao, Z.; An, Y.; Qiao, L.; Han, Y.; Zhou, Y.; Lu, J. Multiparametric imaging hippocampal neurodegeneration and functional connectivity with simultaneous PET/MRI in Alzheimer’s disease. Eur. J. Nucl. Med. Mol. Imaging 2020, 47, 2440–2452. [Google Scholar] [CrossRef] [PubMed] [Green Version]
- Desarnaud, S.; Mellerio, C.; Semah, F.; Laurent, A.; Landre, E.; Devaux, B.; Chiron, C.; Lebon, V.; Chassoux, F. (18)F-FDG PET in drug-resistant epilepsy due to focal cortical dysplasia type 2: Additional value of electroclinical data and coregistration with MRI. Eur. J. Nucl. Med. Mol. Imaging 2018, 45, 1449–1460. [Google Scholar] [CrossRef] [PubMed]
- Jayalakshmi, S.; Nanda, S.K.; Vooturi, S.; Vadapalli, R.; Sudhakar, P.; Madigubba, S.; Panigrahi, M. Focal Cortical Dysplasia and Refractory Epilepsy: Role of Multimodality Imaging and Outcome of Surgery. AJNR Am. J. Neuroradiol. 2019, 40, 892–898. [Google Scholar] [CrossRef]
- Aparicio, J.; Carreño, M.; Bargalló, N.; Setoain, X.; Rubí, S.; Rumià, J.; Falcón, C.; Calvo, A.; Martí-Fuster, B.; Padilla, N.; et al. Combined (18)F-FDG-PET and diffusion tensor imaging in mesial temporal lobe epilepsy with hippocampal sclerosis. Neuroimage Clin. 2016, 12, 976–989. [Google Scholar] [CrossRef] [PubMed] [Green Version]
- Chassoux, F.; Semah, F.; Bouilleret, V.; Landre, E.; Devaux, B.; Turak, B.; Nataf, F.; Roux, F.X. Metabolic changes and electro-clinical patterns in mesio-temporal lobe epilepsy: A correlative study. Brain 2004, 127, 164–174. [Google Scholar] [CrossRef] [PubMed] [Green Version]
- Chassoux, F.; Artiges, E.; Semah, F.; Desarnaud, S.; Laurent, A.; Landre, E.; Gervais, P.; Devaux, B.; Helal, O.B. Determinants of brain metabolism changes in mesial temporal lobe epilepsy. Epilepsia 2016, 57, 907–919. [Google Scholar] [CrossRef]
- Chassoux, F.; Artiges, E.; Semah, F.; Laurent, A.; Landré, E.; Turak, B.; Gervais, P.; Helal, B.O.; Devaux, B. (18)F-FDG-PET patterns of surgical success and failure in mesial temporal lobe epilepsy. Neurology 2017, 88, 1045–1053. [Google Scholar] [CrossRef]
- Cahill, V.; Sinclair, B.; Malpas, C.B.; McIntosh, A.M.; Chen, Z.; Vivash, L.E.; O’Shea, M.F.; Wilson, S.J.; Desmond, P.M.; Berlangieri, S.U.; et al. Metabolic patterns and seizure outcomes following anterior temporal lobectomy. Ann. Neurol. 2019, 85, 241–250. [Google Scholar] [CrossRef]
- Coito, A.; Plomp, G.; Genetti, M.; Abela, E.; Wiest, R.; Seeck, M.; Michel, C.M.; Vulliemoz, S. Dynamic directed interictal connectivity in left and right temporal lobe epilepsy. Epilepsia 2015, 56, 207–217. [Google Scholar] [CrossRef]
- Vanicek, T.; Hahn, A.; Traub-Weidinger, T.; Hilger, E.; Spies, M.; Wadsak, W.; Lanzenberger, R.; Pataraia, E.; Asenbaum-Nan, S. Insights into Intrinsic Brain Networks based on Graph Theory and PET in right- compared to left-sided Temporal Lobe Epilepsy. Sci. Rep. 2016, 6, 28513. [Google Scholar] [CrossRef] [Green Version]
- Pail, M.; Brázdil, M.; Marecek, R.; Mikl, M. An optimized voxel-based morphometric study of gray matter changes in patients with left-sided and right-sided mesial temporal lobe epilepsy and hippocampal sclerosis (MTLE/HS). Epilepsia 2016, 51, 511–518. [Google Scholar] [CrossRef] [PubMed]
- Zheng, L.; Bin, G.; Zeng, H.; Zou, D.; Gao, J.; Zhang, J.; Huang, B. Meta-analysis of voxel-based morphometry studies of gray matter abnormalities in patients with mesial temporal lobe epilepsy and unilateral hippocampal sclerosis. Brain Imaging Behav. 2018, 12, 1497–1503. [Google Scholar] [CrossRef] [PubMed]
- Doucet, G.; Osipowicz, K.; Sharan, A.; Sperling, M.R.; Tracy, J.I. Extratemporal functional connectivity impairments at rest are related to memory performance in mesial temporal epilepsy. Hum. Brain Mapp. 2013, 34, 2202–2216. [Google Scholar] [CrossRef] [Green Version]
- Doucet, G.E.; Rider, R.; Taylor, N.; Skidmore, C.; Sharan, A.; Sperling, M.; Tracy, J.I. Presurgery resting-state local graph-theory measures predict neurocognitive outcomes after brain surgery in temporal lobe epilepsy. Epilepsia 2015, 56, 517–526. [Google Scholar] [CrossRef] [PubMed]
- Liu, J.T.; Liu, B.; Zhang, H. Surgical versus medical treatment of drug-resistant epilepsy: A systematic review and meta-analysis. Epilepsy Behav. 2018, 82, 179–188. [Google Scholar] [CrossRef] [PubMed]
- Morgan, V.L.; Englot, D.J.; Rogers, B.P.; Landman, B.A.; Cakir, A.; Abou-Khalil, B.W.; Anderson, A.W. Magnetic resonance imaging connectivity for the prediction of seizure outcome in temporal lobe epilepsy. Epilepsia 2017, 58, 1251–1260. [Google Scholar] [CrossRef]

| Left TLE | Right TLE | Controls | |
|---|---|---|---|
| Number | 14 | 18 | 26 |
| Gender (male: female) | 8:6 | 9:9 | 12:14 |
| Age (y, mean ± SD) | 25.1 ± 5.3 1 | 28.1 ± 6.4 | 31.7 ± 6.8 |
| Age of onset (y, mean ± SD) | 11.6 ± 7.0 | 14.4 ± 9.7 | —— |
| Epilepsy duration (y, mean ± SD) | 15.5 ± 7.8 | 14.6 ± 7.0 | —— |
| Seizures per month (mean ± SD) | 4.6 ± 7.7 | 5.8 ± 6.7 | —— |
| Type of surgery (ATL/RFTC) | 10/4 | 14/4 | —— |
| Engel class (IA/non-IA) | |||
| ATL | 18/6 | —— | |
| RFTC | 2/4 | —— | |
| Patients | Metabolic Changes | Brain Areas | Cluster Extend | Peak Voxel | |||
|---|---|---|---|---|---|---|---|
| t | x | y | z | ||||
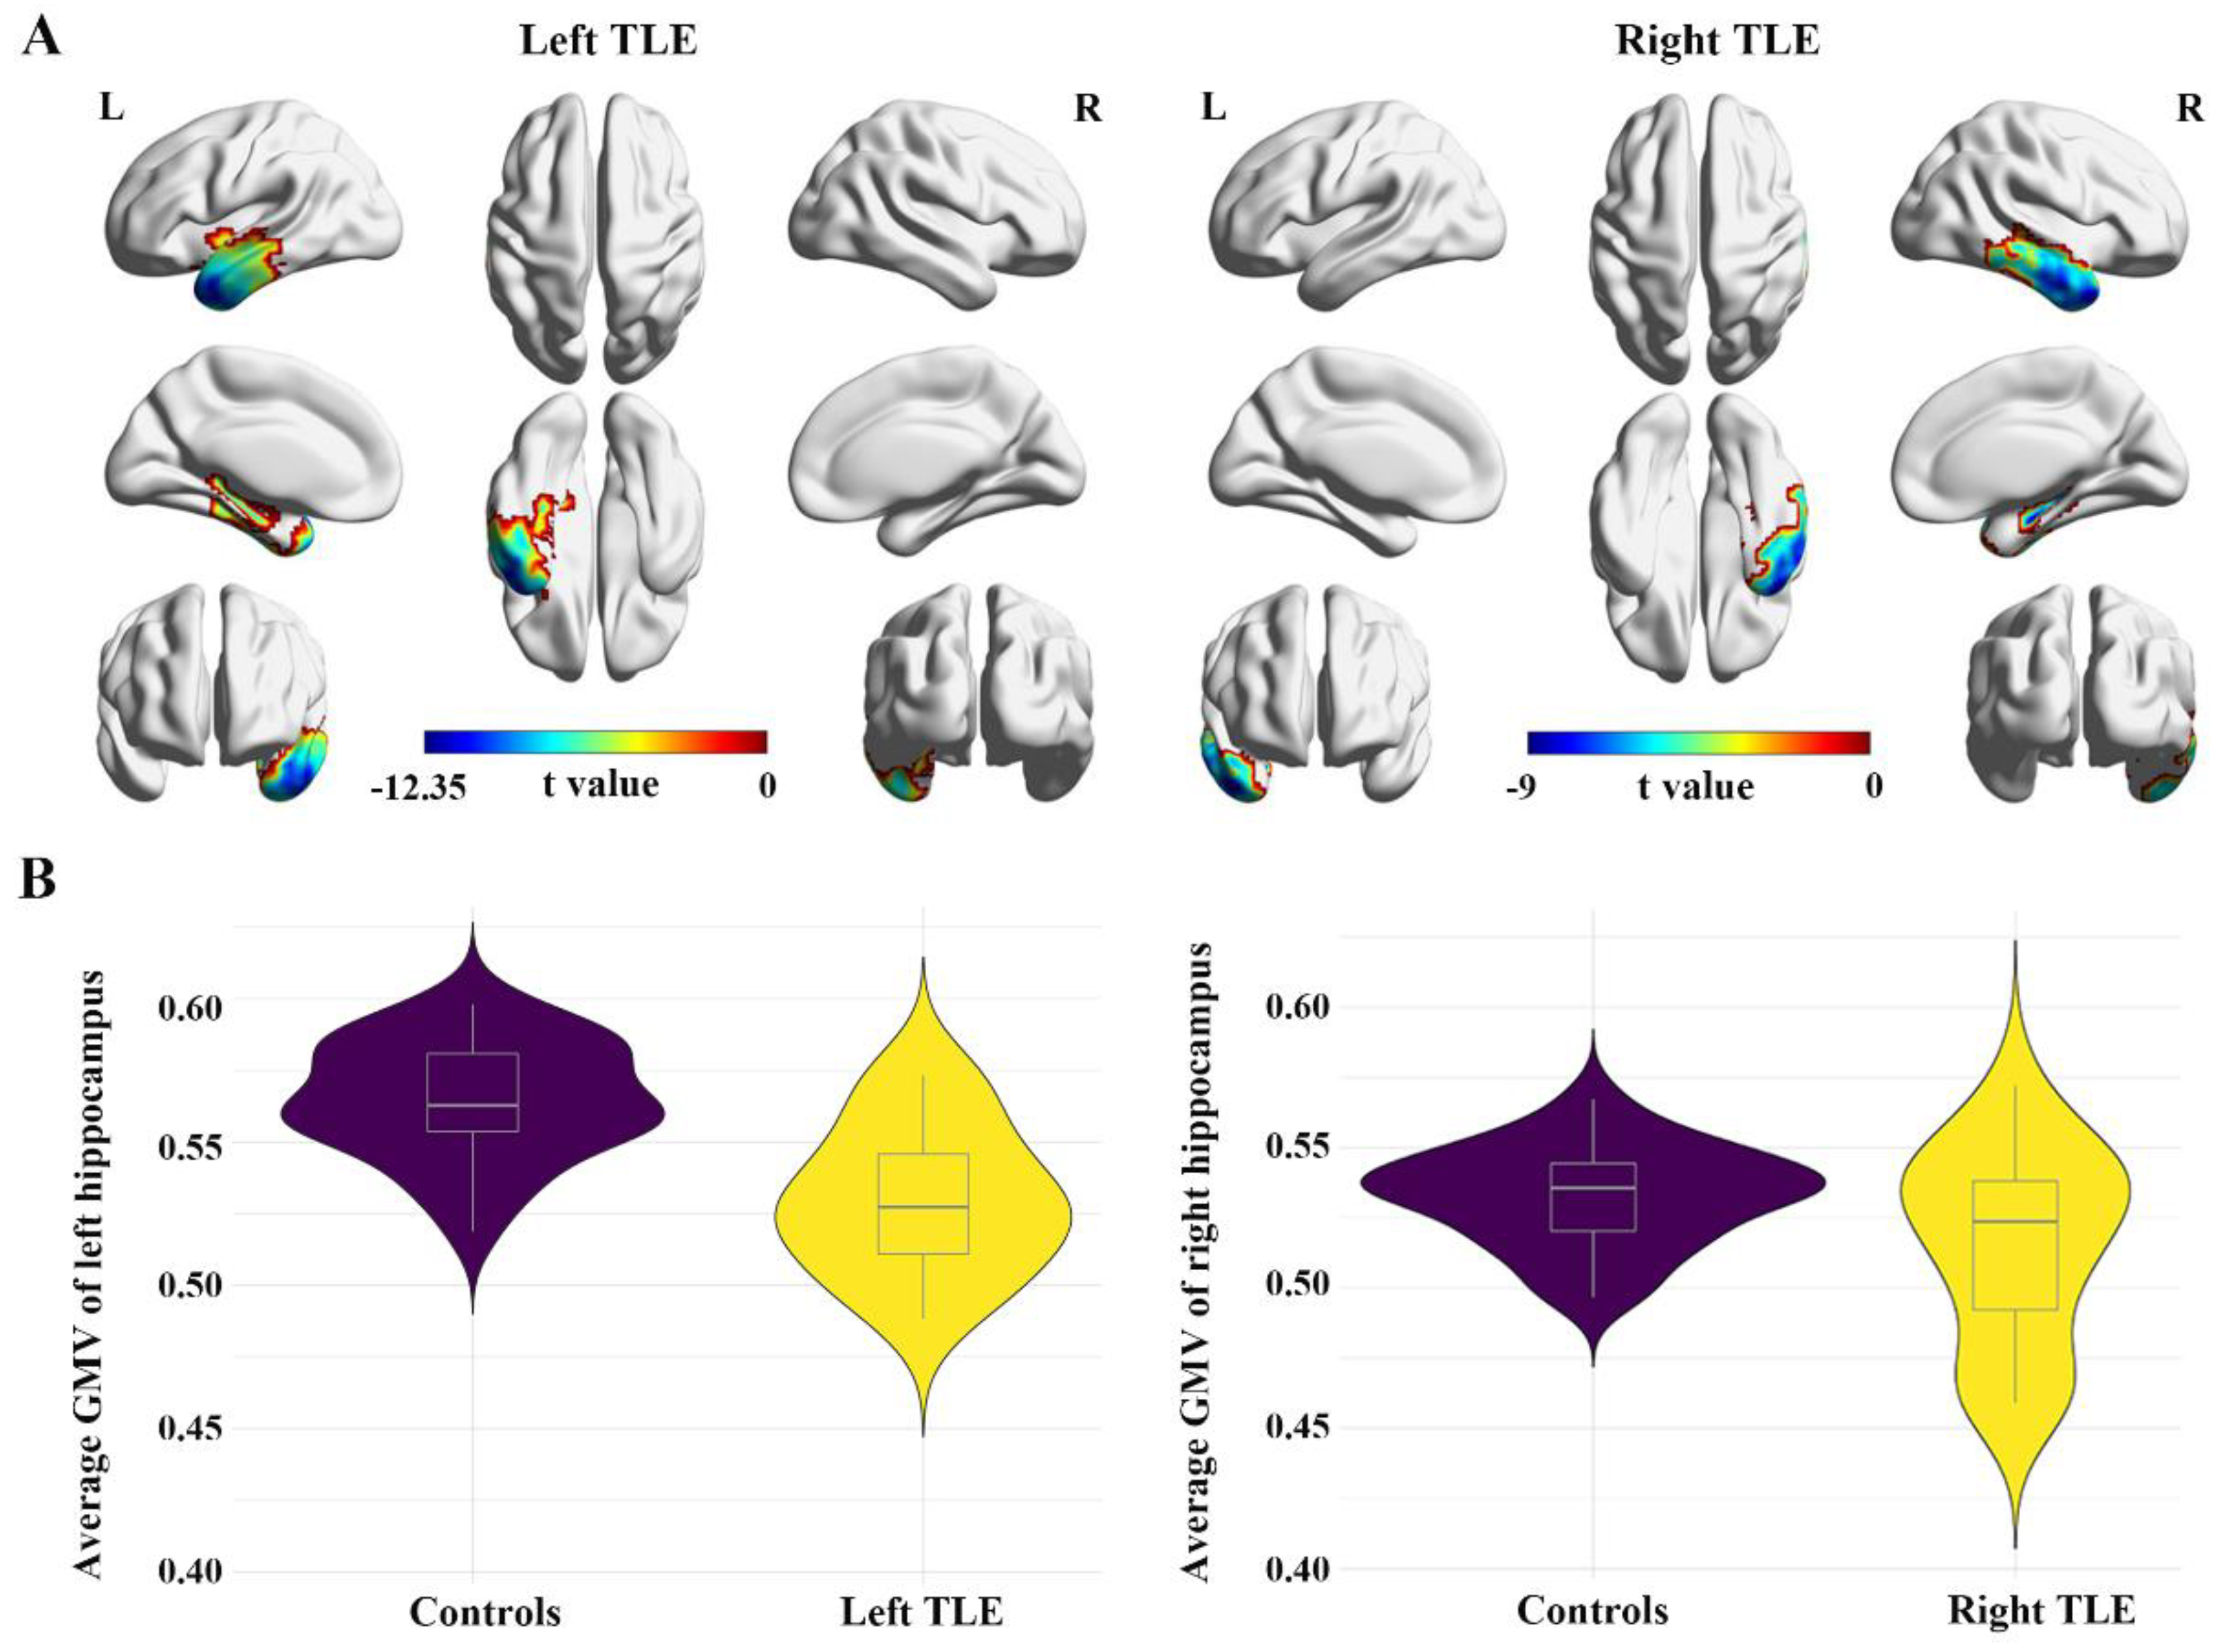
| Left TLE | Hypometabolism | L STG L MTG L ITG L PHG L HG | 1629 | −12.35 | −48 | 0 | −33 |
| Right TLE | Hypometabolism | R STG R MTG R ITG R PHG R HG | 1002 | −9.00 | 30 | −15 | −21 |
| TLE | ROI | FC Values | Brain Areas | Cluster Extend | Peak Voxel | |||
|---|---|---|---|---|---|---|---|---|
| t | x | y | z | |||||
| Left TLE | L-hippocampus | Decreased | PCG/PreCu | 808 | −4.53 | 6 | −48 | 9 |
| Decreased | R MEG/R ITG | 603 | −4.73 | 48 | −48 | 15 | ||
| Decreased | R SFG/R MiFG | 491 | −4.83 | 30 | 24 | 42 | ||
| Hypometabolic regions | Decreased | B STG/B MTG/B ITG/ B MOG/B IOG/PCG/ PreCu/Cereb | 7792 | −7.53 | 54 | −36 | −6 | |
| Decreased | B SFG/B MiFG/B MeFG/ B OFG/B PoCG/B PrCG | 1752 | −5.03 | −18 | 54 | 30 | ||
| Right TLE | R-hippocampus | Decreased | PCG/PreCu | 2111 | −4.89 | 6 | −30 | 24 |
| Decreased | R MTG | 661 | −4.45 | 45 | −75 | 21 | ||
| Decreased | L MTG/L ITG | 271 | −3.89 | −45 | −21 | −33 | ||
| Decreased | R SFG/R MiFG | 264 | −3.68 | 27 | 51 | 33 | ||
| Decreased | L SFG/L MiFG | 200 | −4.10 | −30 | 36 | 39 | ||
| Hypometabolic regions | Decreased | L STG/L MTG/L ITG | 1246 | −8.54 | −54 | −12 | −21 | |
| Decreased | PCG/PreCu | 956 | −4.8 | 6 | −57 | −9 | ||
| Decreased | R STG/R MTG | 801 | −6.02 | 66 | −39 | 3 | ||
| Decreased | B SFG/B MeFG/B MiFG | 563 | −4.58 | −9 | 45 | 30 | ||
Publisher’s Note: MDPI stays neutral with regard to jurisdictional claims in published maps and institutional affiliations. |
© 2022 by the authors. Licensee MDPI, Basel, Switzerland. This article is an open access article distributed under the terms and conditions of the Creative Commons Attribution (CC BY) license (https://creativecommons.org/licenses/by/4.0/).
Share and Cite
Shan, Y.; Zhou, H.-C.; Shang, K.; Cui, B.-X.; Fan, X.-T.; Zhang, Q.; Shan, Y.-Z.; Jiang, J.-H.; Zhao, G.-G.; Lu, J. Functional Connectivity Alterations Based on Hypometabolic Region May Predict Clinical Prognosis of Temporal Lobe Epilepsy: A Simultaneous 18F-FDG PET/fMRI Study. Biology 2022, 11, 1178. https://doi.org/10.3390/biology11081178
Shan Y, Zhou H-C, Shang K, Cui B-X, Fan X-T, Zhang Q, Shan Y-Z, Jiang J-H, Zhao G-G, Lu J. Functional Connectivity Alterations Based on Hypometabolic Region May Predict Clinical Prognosis of Temporal Lobe Epilepsy: A Simultaneous 18F-FDG PET/fMRI Study. Biology. 2022; 11(8):1178. https://doi.org/10.3390/biology11081178
Chicago/Turabian StyleShan, Yi, Hu-Cheng Zhou, Kun Shang, Bi-Xiao Cui, Xiao-Tong Fan, Qi Zhang, Yong-Zhi Shan, Jie-Hui Jiang, Guo-Guang Zhao, and Jie Lu. 2022. "Functional Connectivity Alterations Based on Hypometabolic Region May Predict Clinical Prognosis of Temporal Lobe Epilepsy: A Simultaneous 18F-FDG PET/fMRI Study" Biology 11, no. 8: 1178. https://doi.org/10.3390/biology11081178