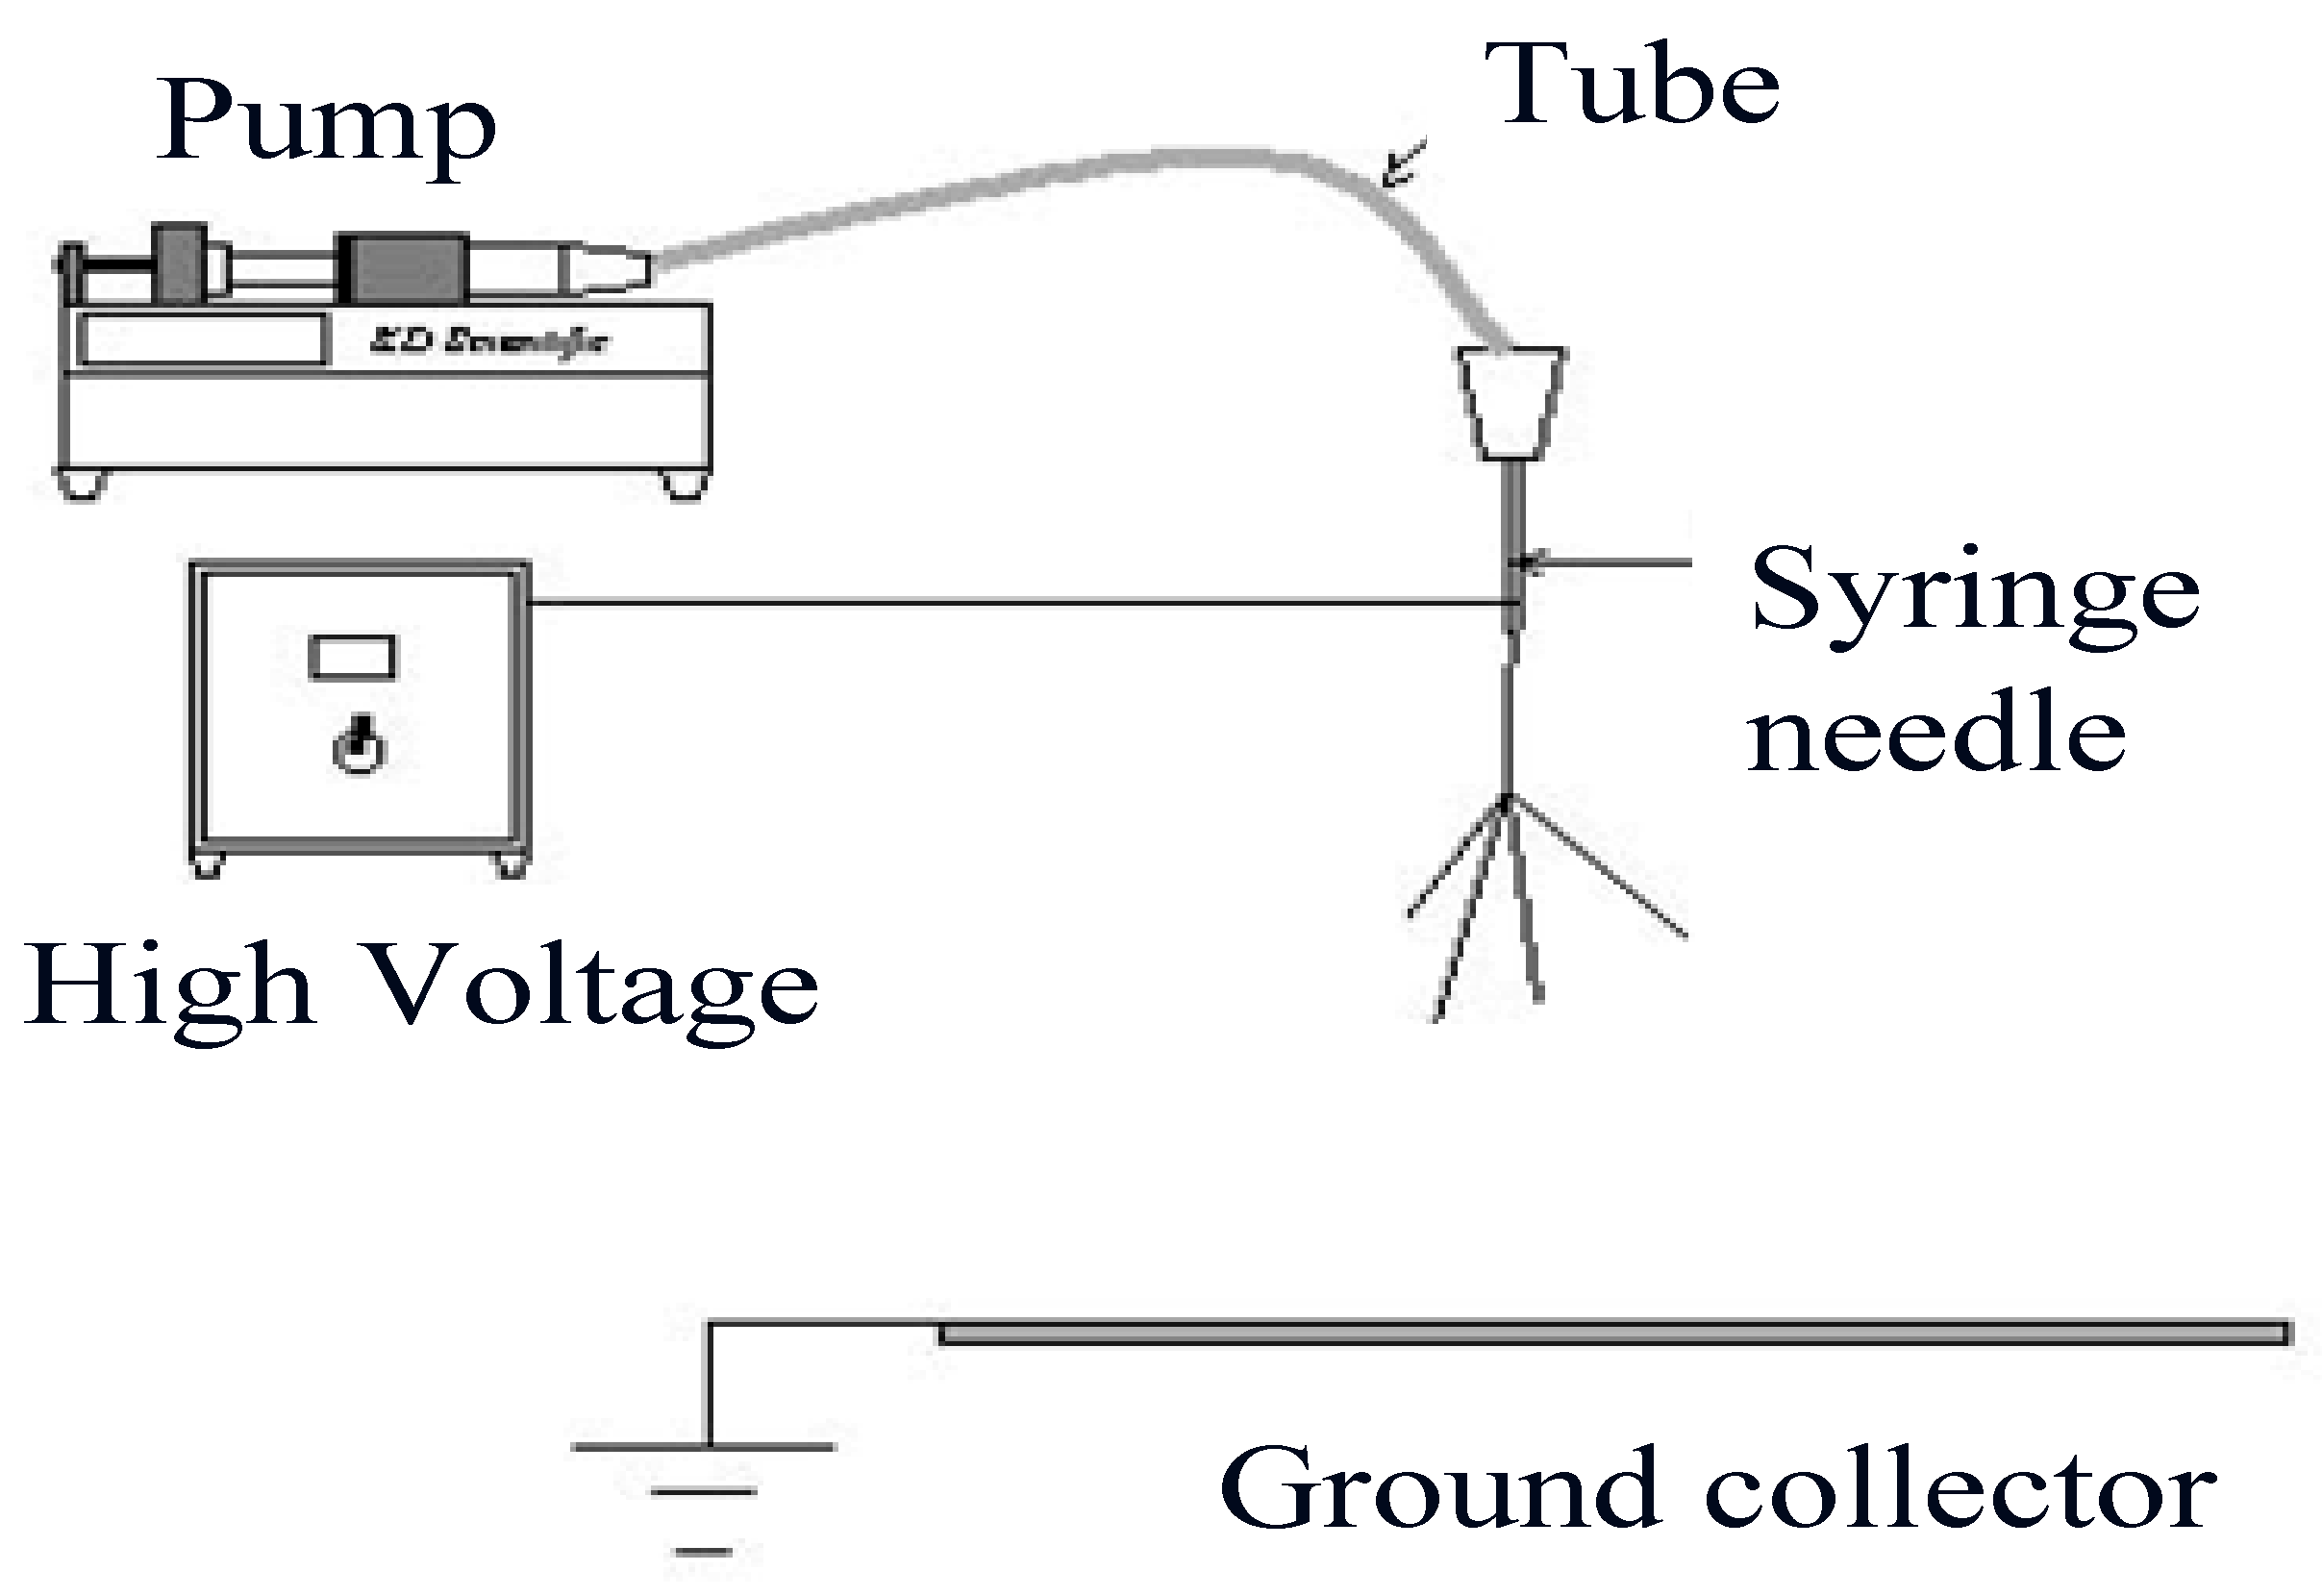
2.1. Production of Defect Free Cellulose Acetate Nanofibres
In order to produce defect free fibres, acetone and DMAc were used as polymer solutions, initially at a ratio of 2:1. The polymer concentration and spinning conditions were then altered to optimise the fibre morphology. At cellulose acetate concentrations of 14.5% and 17% and using a range of spinning parameters (
Table 1), light microscopy revealed extensive beading of the fibres.
Table 1.
Solutions and spinning parameters tested to investigate the production of defect free fibres.
Table 1.
Solutions and spinning parameters tested to investigate the production of defect free fibres.
| Solution Number | Solution | Voltage (kV) | Distance of the needle tip to collecting plate (cm) | Flow rate (µL/min) |
|---|
| 1 | 14.5% Cellulose acetate 2:1 Acetone: DMAc | 12, 15, 17, 20 | 10, 15, 20 | 5, 10, 16 |
| 2 | 17% cellulose acetate 2:1 Acetone: DMAc | 10, 15, 17 | 15, 30 | 16 |
| 3 | 20% cellulose acetate 2:1 acetone: DMAc | 15 | 17.5, 30 | 10, 15, 25 |
| 4 | 21.5% cellulose acetate 2:1 acetone: DMAc | 10, 15, 20 | 30 | 0.2, 0.5, 1, 5, 10 |
| 5 | 20% cellulose acetate 3:1 acetone: DMAc | 15 | 30 | 5, 10 |
| 6 | 17% cellulose acetate 3:1 acetone: DMAc | 15 | 30 | 5, 10 |
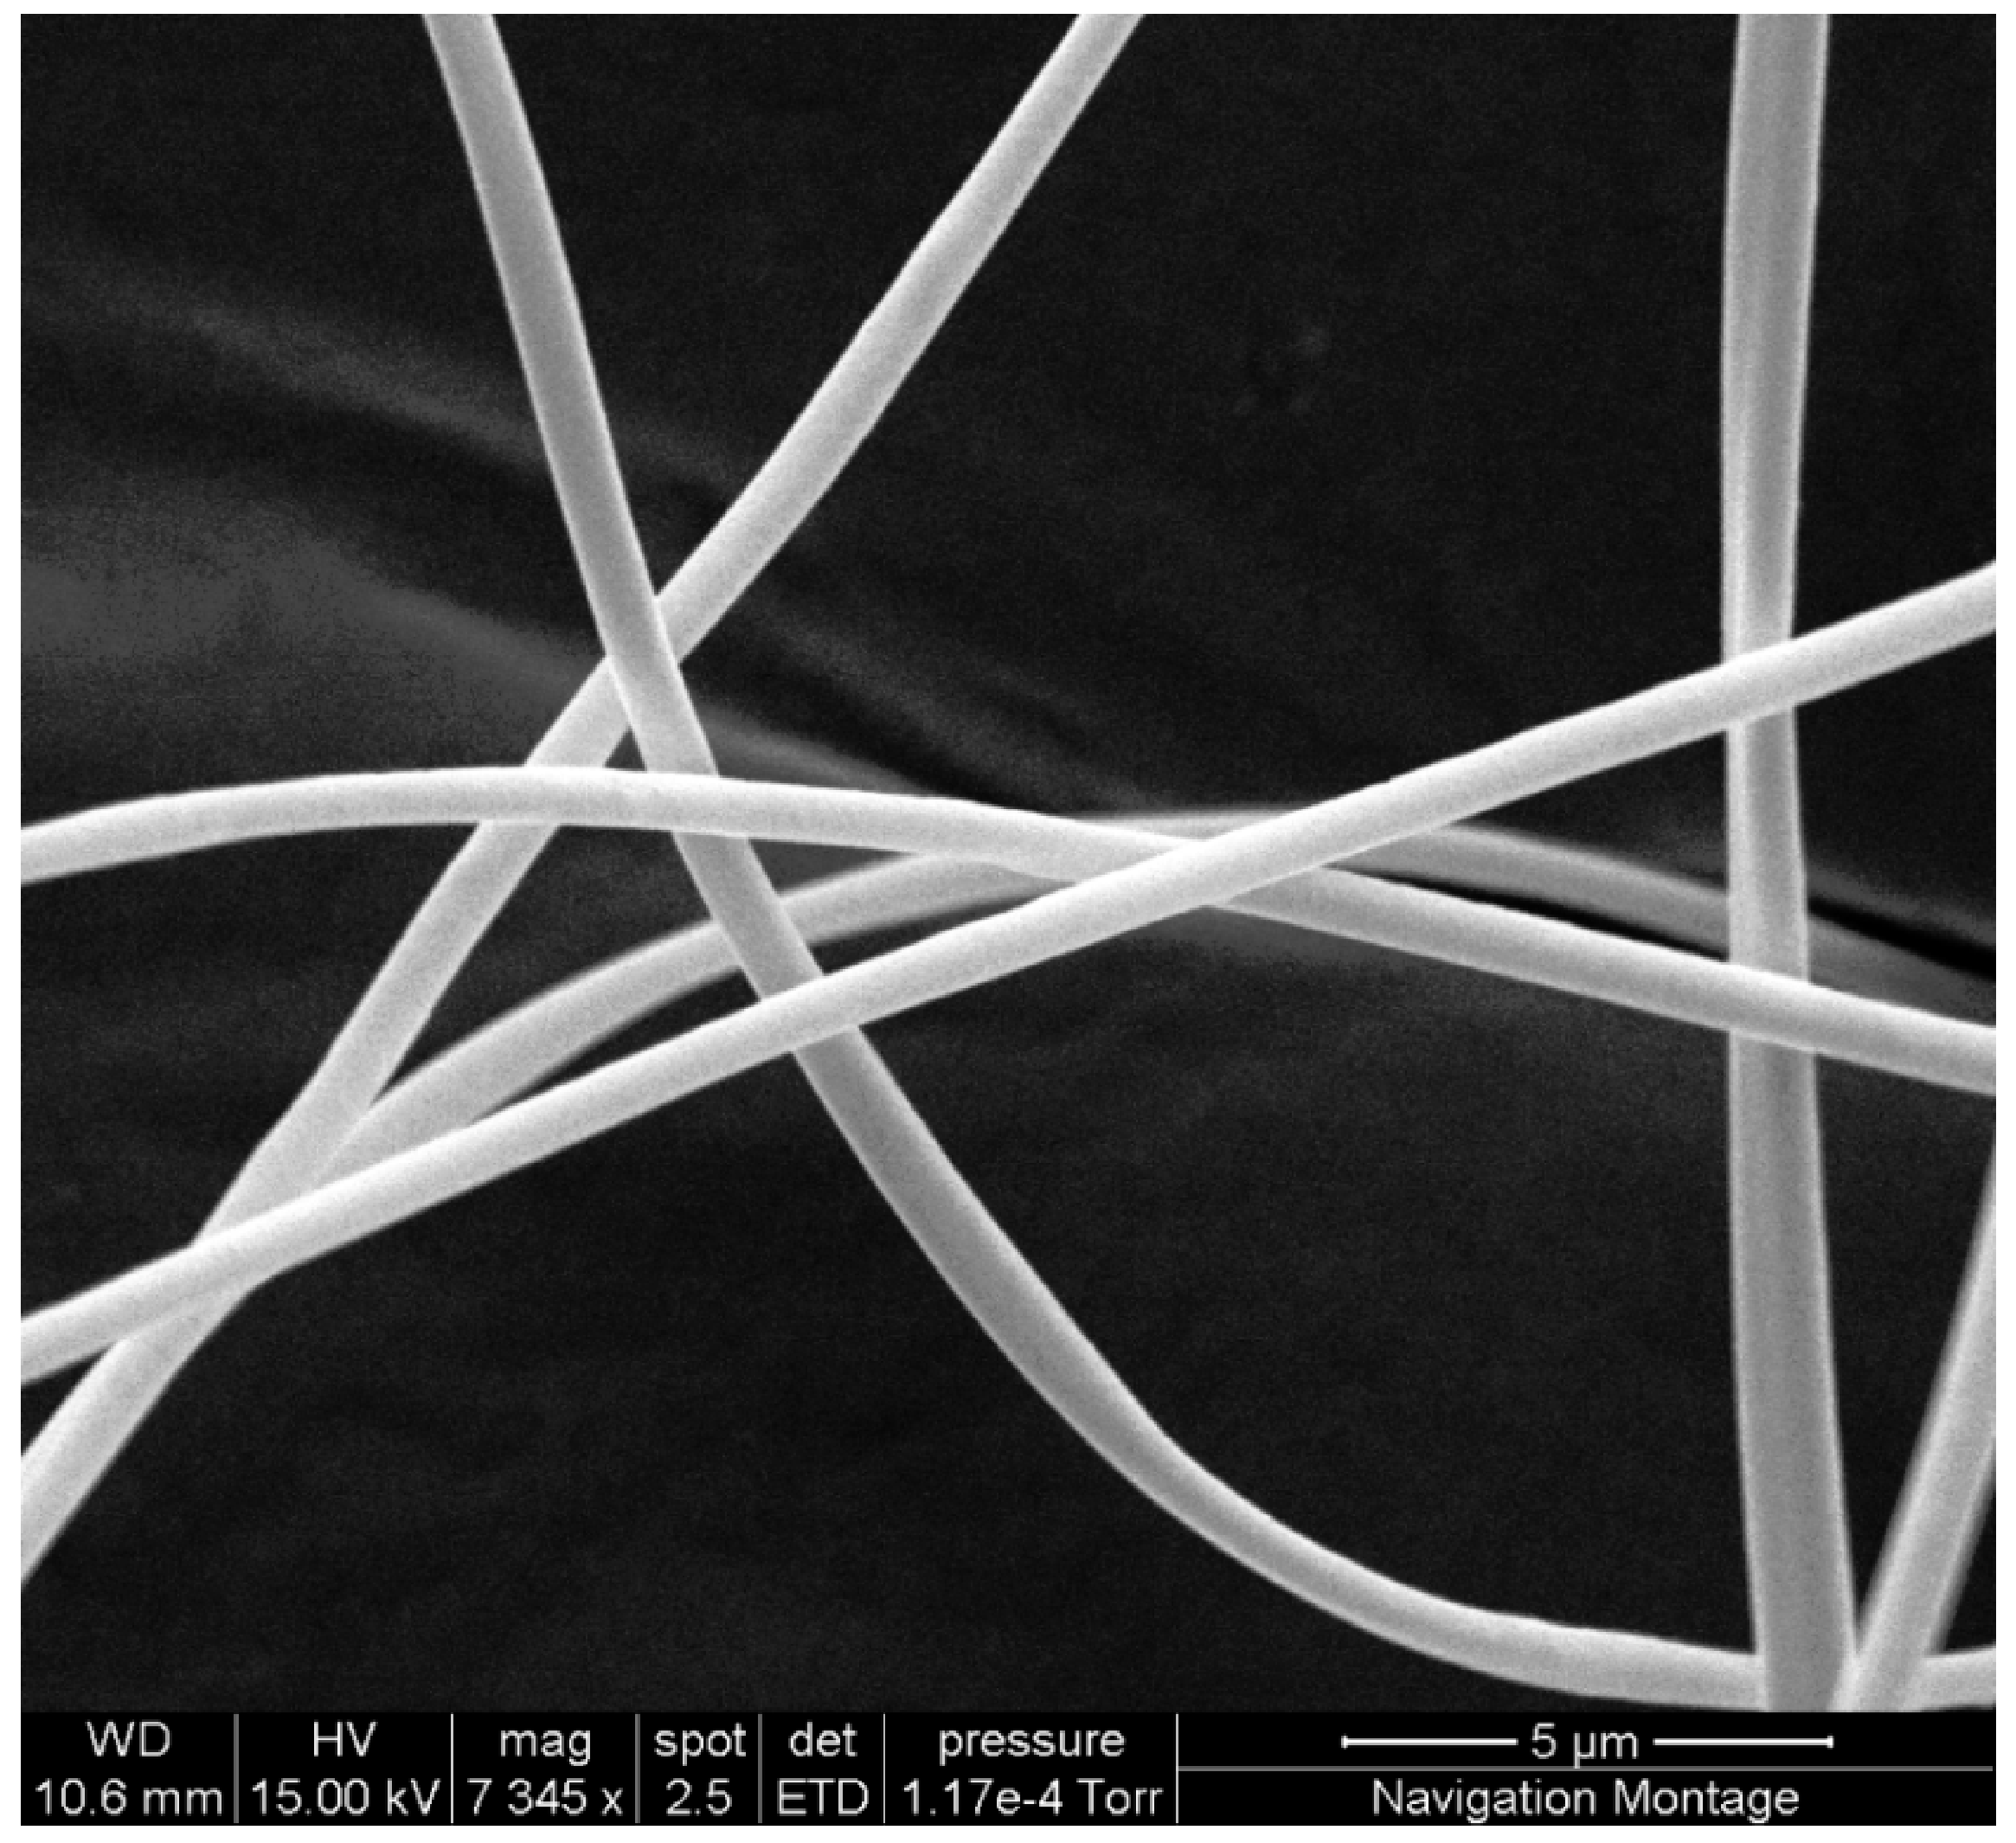
The presence of excess solvent on the microscope slide following electrospinning suggested that a further increase in polymer concentration might not only reduce the presence of beading, but also aid complete evaporation of the solvent. At a cellulose acetate concentration of 20% and with the spinning parameters of 15 kV at a distance of 17.5 cm and a flow rate of 15 µL/min, continuous defect free fibres were produced (
Figure 1). Splashes of solvent were still visible on the collecting plate, therefore both the operating voltage and collecting distance were increased to encourage increased whipping of the fibres in order to drive off the excess solvent.
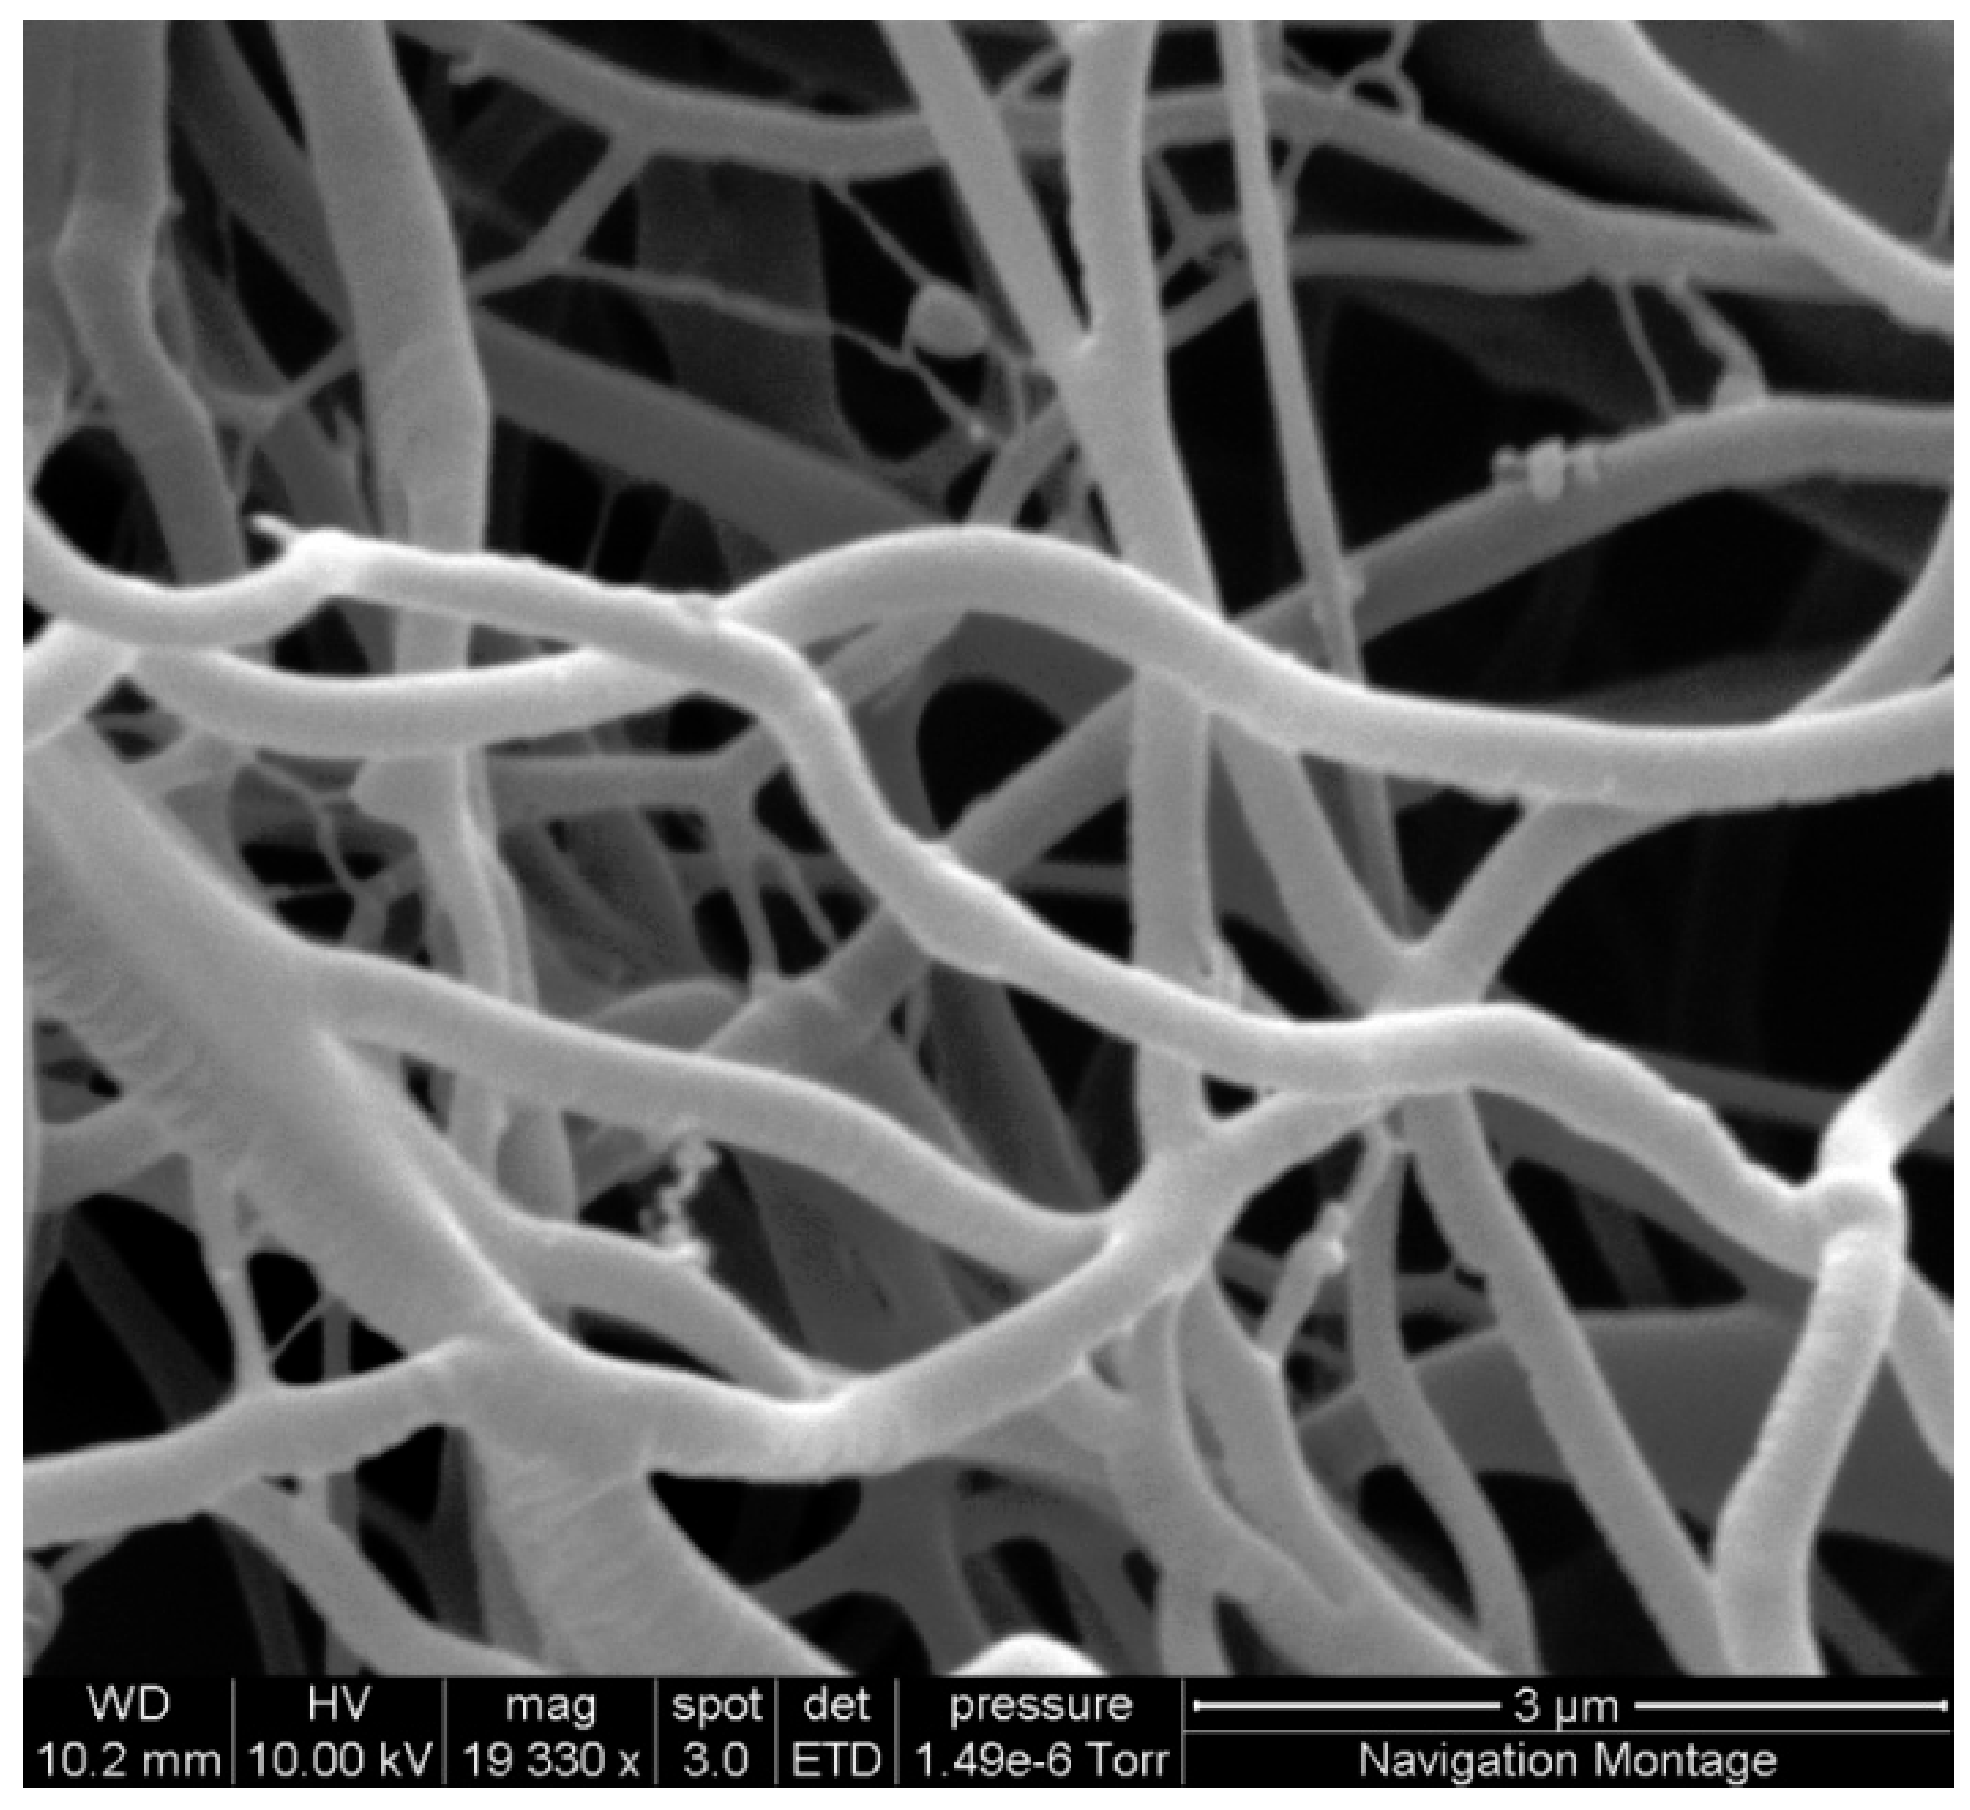
The flow rate was also adjusted in order to determine the minimum flow rate that could be used. The optimum conditions were determined to be 15 kV at a spinning distance of 30 cm with a flow rate of 10 µL/min. This produced regular, defect free fibres in the 400 to 700 nm range (
Figure 2) as determined by measuring 20 fibre diameters under SEM.
Figure 1.
SEM image showing regular defect free fibres produced using 20% cellulose acetate solution with spinning parameters of 15 kV at a distance of 17.5 cm and a flow rate of 15 µL/min.
Figure 1.
SEM image showing regular defect free fibres produced using 20% cellulose acetate solution with spinning parameters of 15 kV at a distance of 17.5 cm and a flow rate of 15 µL/min.
Figure 2.
SEM image of regular defect free cellulose acetate nanofibres in the 480 nm range produced using 21.5% cellulose acetate solution, with the spinning parameters of 10 kV, 30 cm needle tip to collecting plate distance and a 5 µL/min flow rate.
Figure 2.
SEM image of regular defect free cellulose acetate nanofibres in the 480 nm range produced using 21.5% cellulose acetate solution, with the spinning parameters of 10 kV, 30 cm needle tip to collecting plate distance and a 5 µL/min flow rate.
However, a further increase in polymer concentration to 21.5% again produced defect free fibres. In this case not only were defect free fibres produced, but it showed a trend towards a small reduction in fibre size with reduced operating voltage and flow rates (
Table 2).
Table 2.
The effect of manipulation of spinning parameters on fibre diameter using Solution 4 (21.5% cellulose acetate, 2:1 acetone: DMAc).
Table 2.
The effect of manipulation of spinning parameters on fibre diameter using Solution 4 (21.5% cellulose acetate, 2:1 acetone: DMAc).
| Operating Voltage (kV) | Distance (cm) | Flow Rate (µL/min) | Mean Fibre Diameter (nm) | Minimum Fibre Diameter (nm) | Maximum Fibre Diameter (nm) |
|---|
| 20 | 30 | 10 | 895 | 485 | 2077 |
| 20 | 30 | 5 | 1000 | 465 | 2239 |
| 10 | 30 | 10 | 537 | 228 | 884 |
| 10 | 30 | 5 | 483 | 205 | 746 |
Although the viscosity of the electrospinning solution was not measured in this study, it has been previously shown that increasing the polymer concentration results in an increase in the viscosity [
8]. Viscosity is a significant factor affecting the ability to produce electrospun fibres and is specific to different polymers, is affected by temperature [
6] and is directly related to electrospun fibre diameter. In general as the viscosity increases so does fibre diameter [
9] and therefore in order to produce defect free fibres of small diameter, a balance has to be struck between polymer concentration and viscosity.
It has also previously been shown that cellulose acetate fibre size distributions are strongly related to the molecular weight of the cellulose acetate. The lower the molecular weight the larger the fibre size distribution and the greater the number of bead defects [
10]. Conversely, increasing the molecular weight leads to the production of fibres of a more consistent diameter and with fewer defects such as beading. Compared to previous studies the cellulose acetate used in this investigation had a relatively low molecular weight. This may explain why increasing the optimal polymer concentration to 21.5% in order to eliminate beading was higher than the 14.5% polymer concentration previously suggested by Liu and Hseih (2002) [
6]. Using a similar molecular weight cellulose acetate polymer and with the same solvent solution, Liu and Tang (2007) [
8] produced defect free electrospun nanofibres of a similar fibre diameter. They also described the presence of significant beading of the fibres at polymer concentrations below 20%.
The optimum flow rate in this experiment varied according to the solution parameters, but the optimum flow rate for the production of a flat membrane of fibres was determined to be 5 µL/min. In general the diameter of the spun fibres was noted to reduce with decreasing flow rates.
2.2. The Effect of Spinning Parameters
As with the flow rate a small reduction in fibre diameter was noted with reduced operating voltage. A minimum operating voltage is required to overcome the surface tension of the polymer solution and to permit the formation of a Taylor cone. Increasing the operating voltage beyond this point has the effect of accelerating the passage of the electrospun fibres towards the collecting plate and reducing the whipping of the fibres. The whipping phase, once the fibre has been ejected from the Taylor cone, is an important step in the reduction of the fibre diameter as the jet is stretched to many times its original length due to bending instability caused by the electrical charge carried in the fibres. A reduction in the whipping process will therefore cause an increase in the produced fibre diameter [
11]. The optimum operating voltage for production of a flat nanofibre membrane was determined to be 10 kV.
Increasing the distance between the needle tip and the collecting plate from 17.5 cm to 30 cm appeared to aid evaporation of the solvent from the fibres. However this increase in distance appeared to have little effect on the diameter of the produced fibres This finding is in agreement with previous work carried out on silk nanofibres, which also found that increasing the spinning distance had no effect on the diameter of the fibres produced [
12].
In this present experiment the smallest diameter defect free fibres that were produced had a mean diameter of 483 nm, which is similar to that reported by a previous study [
8] and which will still be visible to the naked eye. Smaller 90 nm diameter, invisible fibres have been produced, but these were beaded and not defect free [
13]. There have been no reports of the production of small diameter invisible defect free fibres of cellulose acetate nanofibres in the 100 nm range.
2.3. Production of 3D Nanofibres.
Although nanofibres were produced in this experiment, initially they had only been in the form of a flat membrane and yet the aim of this study was to produce a 3D fibre mesh for resin reinforcement. Previous work on the production of nanofibre reinforced composites has involved resin infiltration of flat non woven mats of nanofibres, resulting in the production of laminate composites. However, three common causes of failure of laminate composites have been identified, namely micro-cracking, fibre breakage and delamination [
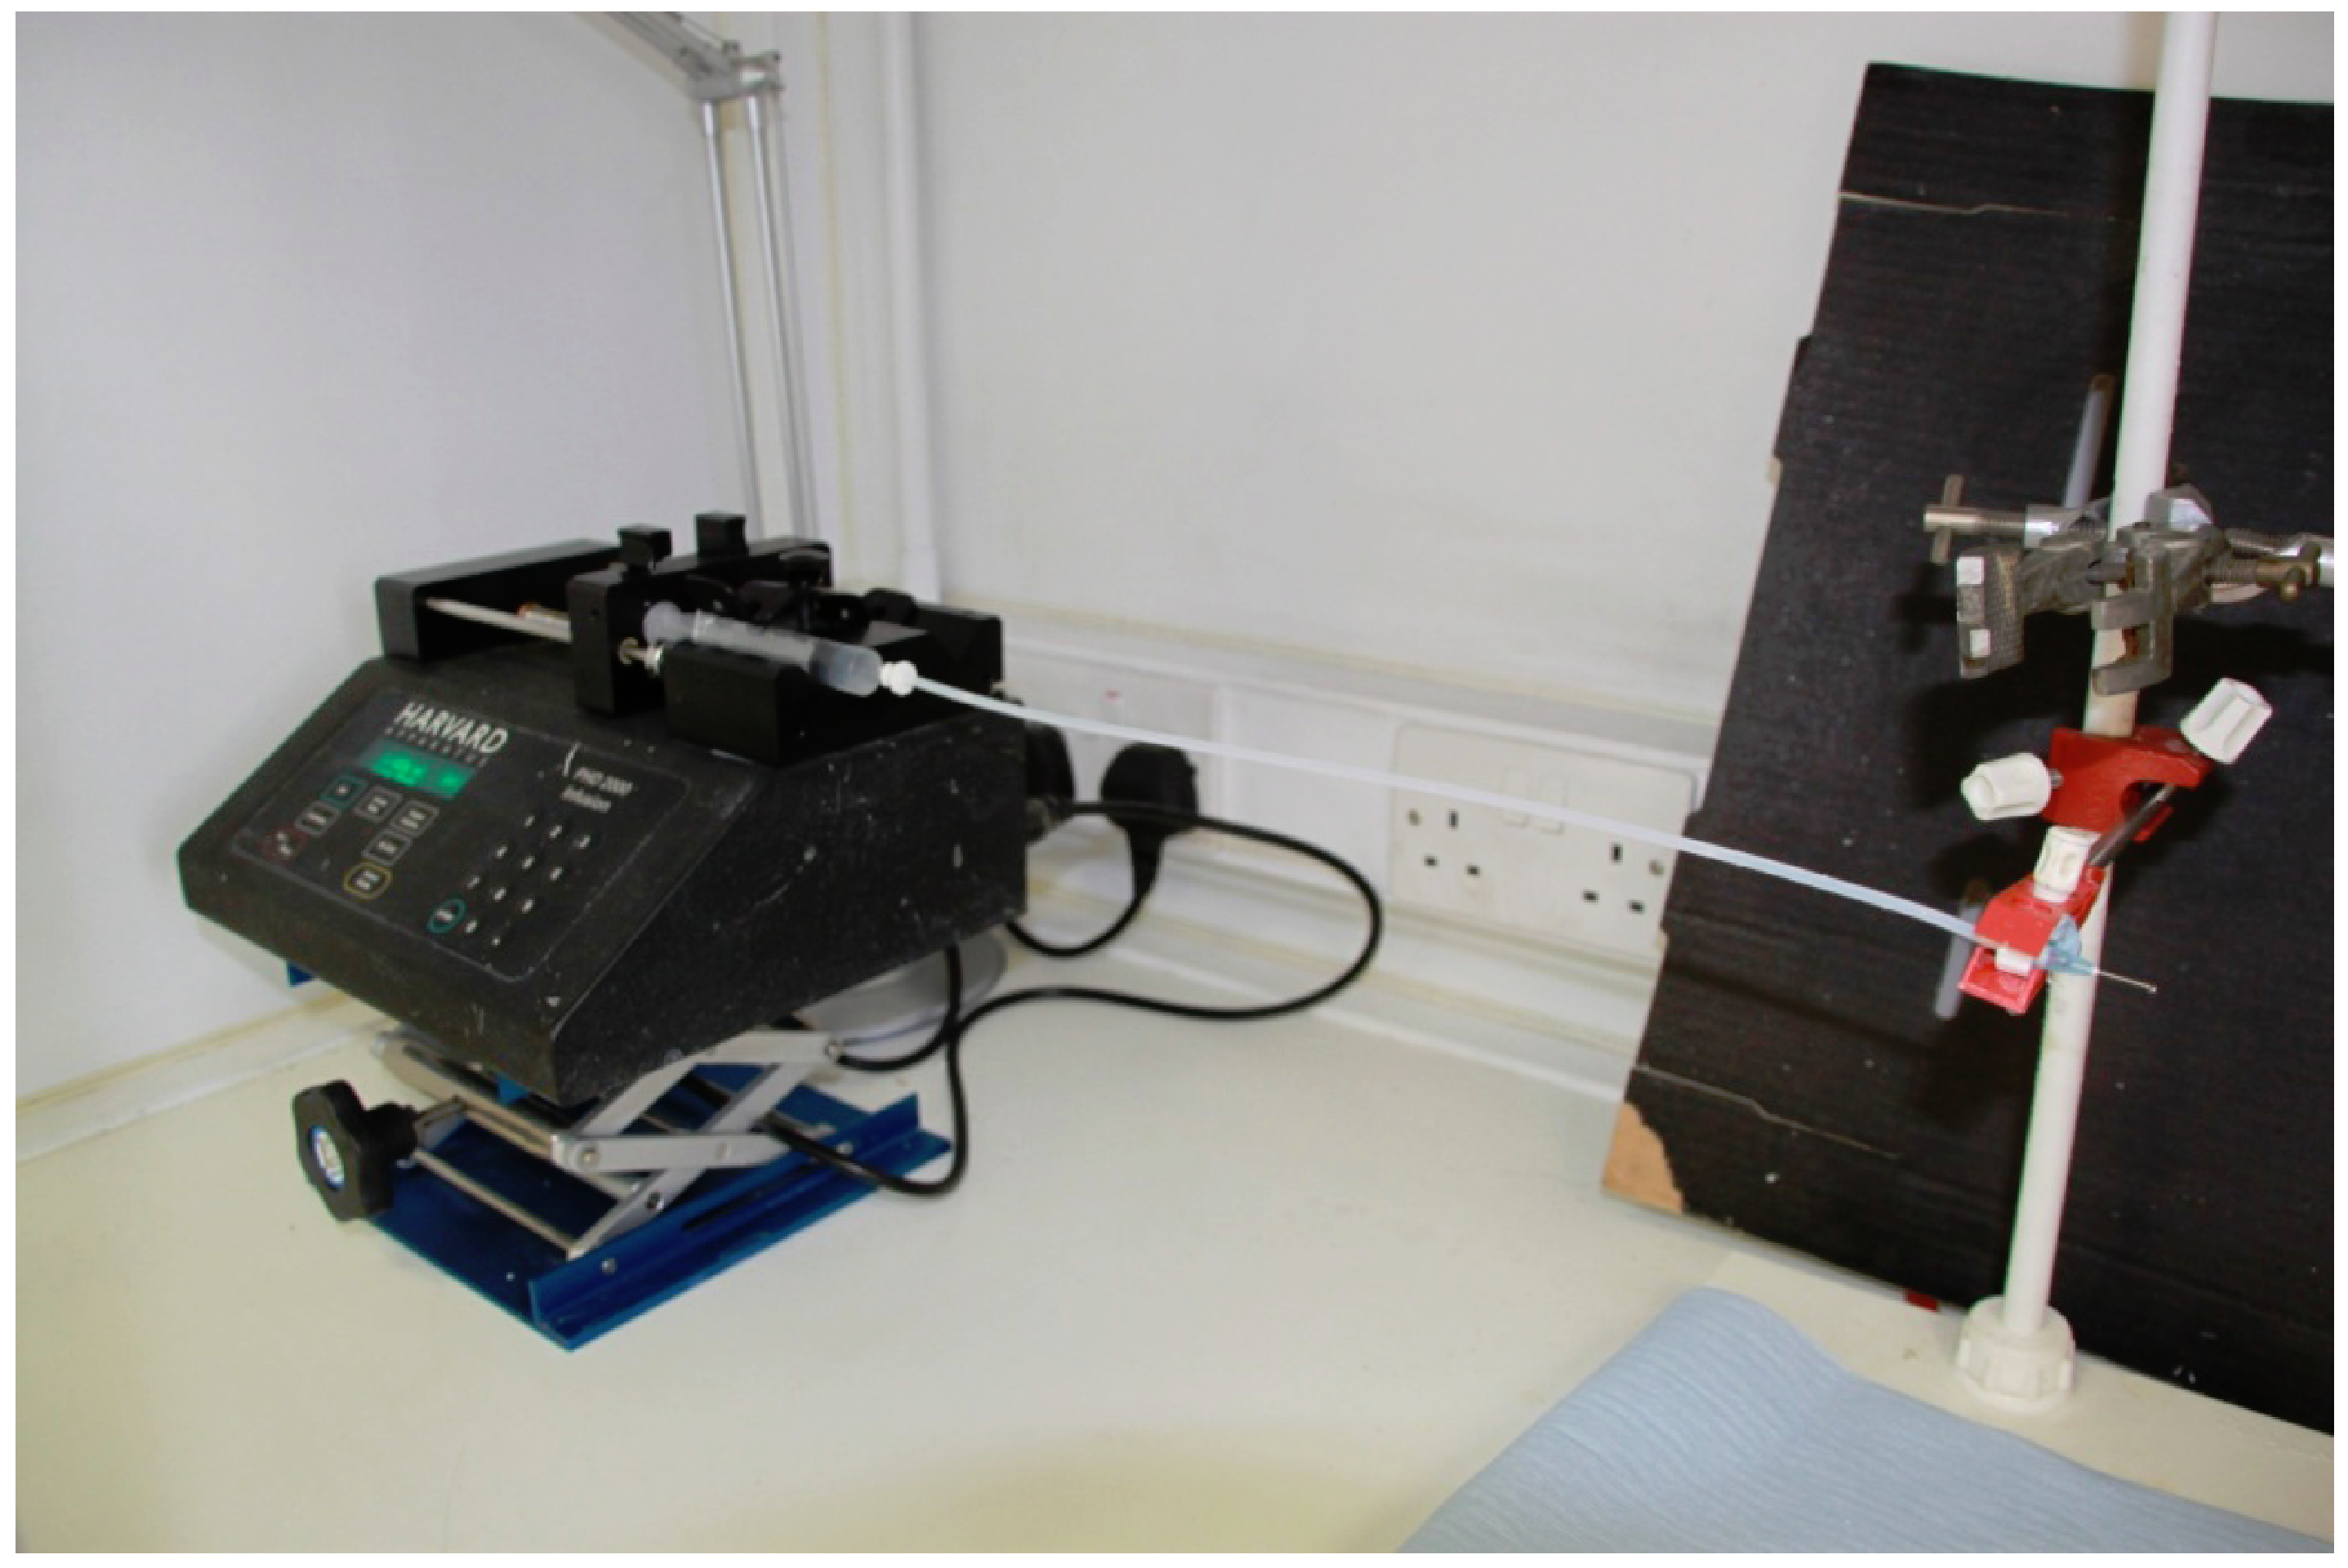
14]. If a 3D nanofibre reinforcement were instead used it might at least eliminate the most common of these causes of failure, delamination. Once again a number of different methods may be used to produce a 3D mesh of fibres, including substitution of the metal grounded collection plate with liquid nitrogen, or a non-conducting surface, as well as the use of a heated collection plate. All three techniques have limitations. Spinning onto the surface of liquid nitrogen results in freezing of the fibres along with any remaining solvent, which is then difficult to eliminate. Collection onto a non conducting plate means that the electrostatic charge generated during the spinning process remains within the fibres, leading to fibre repulsion and the generation of the 3D mesh. However, grounding of the fibres in order to manipulate them prior to resin infiltration may then result in collapse of the 3D structure. The use of a heated collection plate can lead to an increase in the ambient temperature in the electrospinning chamber, which in turn will have an adverse effect on the spinning process as excessive solvent evaporation at the needle tip can result in solidification of the Taylor cone. This would then require compensatory cooling of the needle tip and syringe using a water jacket.
A simpler solution is to ensure complete evaporation of the solvent solution before the fibres reach the collection plate, by the use of an ionic salt. The addition of an ionic salt to the polymer solution results in a higher charge density on the surface of the jet during spinning, resulting in a greater electric charge being carried by the electrospinning jet. This results in a greater elongation force, caused by increased whipping and electrostatic repulsion as the fibres pass from the needle tip to the collecting plate. This whipping in turn leads to an increase in the evaporation of solvent. Another benefit of the increased whipping is the production of smaller diameter fibres [
15]. However, using 0.5% lithium chloride in a 21.5% cellulose acetate solution, a 2:1 solvent solution of acetone: DMAc, along with the optimum conditions previously determined (namely 10 kV at a distance of 30 cm and flow rate of 5 µL/min), no fibres were produced. A lower 1 µL/min flow rate was insufficient to support any spinning while 2 µL/min and 3 µL/min flow rates produced fibres which appeared to interfere with the spinning process, leading to solidification at the Taylor cone. To counteract this, the polymer concentration was first reduced to 20% and then subsequently to 17.5%. Initially the 17.5% cellulose acetate solution appeared to produce 3D fibres, but closer inspection revealed that the solution was solidifying at the needle tip and then being drawn to the collecting plate, creating droplets on long fibres. This was due to excessive solvent evaporation and therefore the solvent ratio was altered to increase the proportion of DMAc, reducing the overall volatility of the polymer solution. A change in the solvent solution ratio to 3:2 acetone: DMAc also failed to prevent excessive solvent evaporation with both 20% and 17.5% cellulose acetate solutions. A solution containing 17.5% cellulose acetate, 1% lithium chloride, and acetone: DMAc in a 1:1 ratio produced 3D fibres following further manipulation of the spinning parameters. 3D fibres were produced using the following parameters of operating voltage, needle tip to collecting plate distance, and flow rate:
30 kV, 15 cm and 10 µL/min
25 kV, 15 cm and 10 µL/min
25 kV, 15 cm and 5 µL/min
30 kV, 15 cm and 1 µL/min
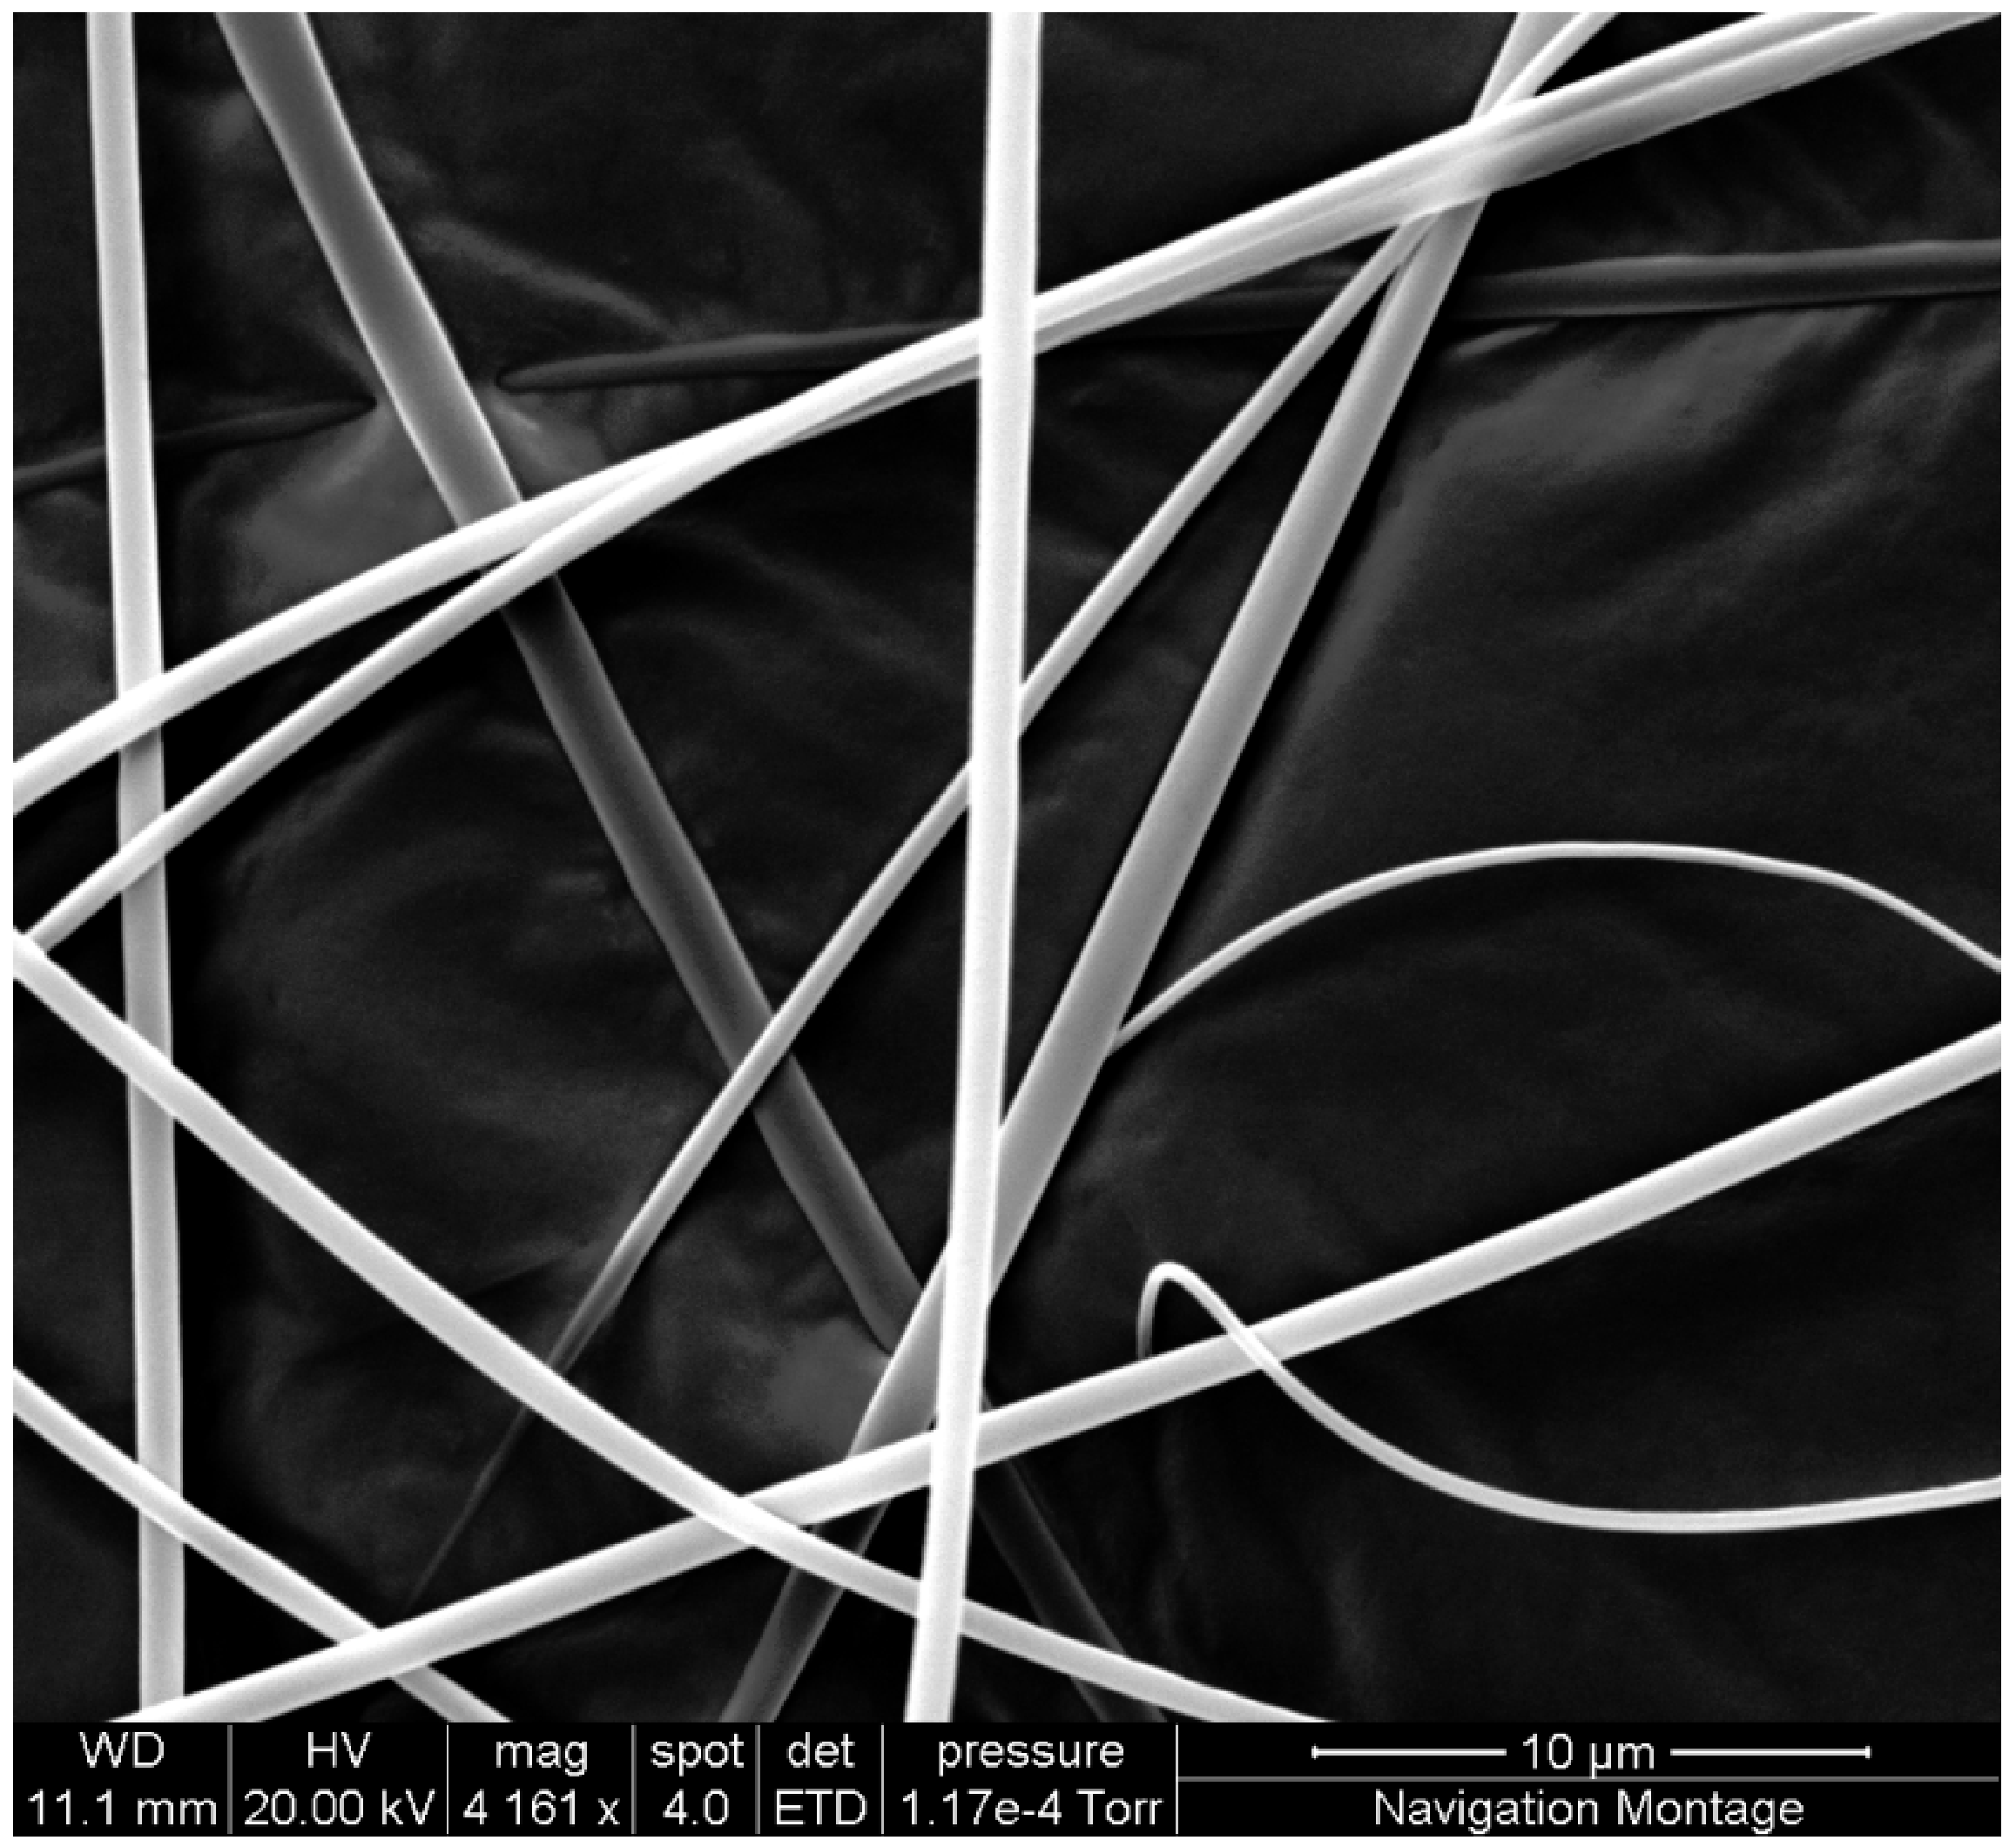
The final set of parameters permitted the smoothest spinning at the needle tip and an immediate build up of 3D fibres, suggesting that complete evaporation of the solvent solution had occurred as the jet passed from the needle tip to the collecting plate. An image of the collected fibres under the SEM may be seen in
Figure 3. The increased charge density of the solution caused a reduction of the mean fibre diameter of the nanofibres from 483 nm to 286 nm, based on the measurement of 20 fibres.
Figure 3.
SEM image of 3D fibre network produced with a solution of 17.5% cellulose acetate, 1% lithium chloride and 1:1 DMAc: acetone solvent solution. The spinning parameters were 30 kV, 15 cm and 1 µL/min. Notice how the fibres are branched. Areas of precipitation of lithium chloride may be seen on some of the fibres.
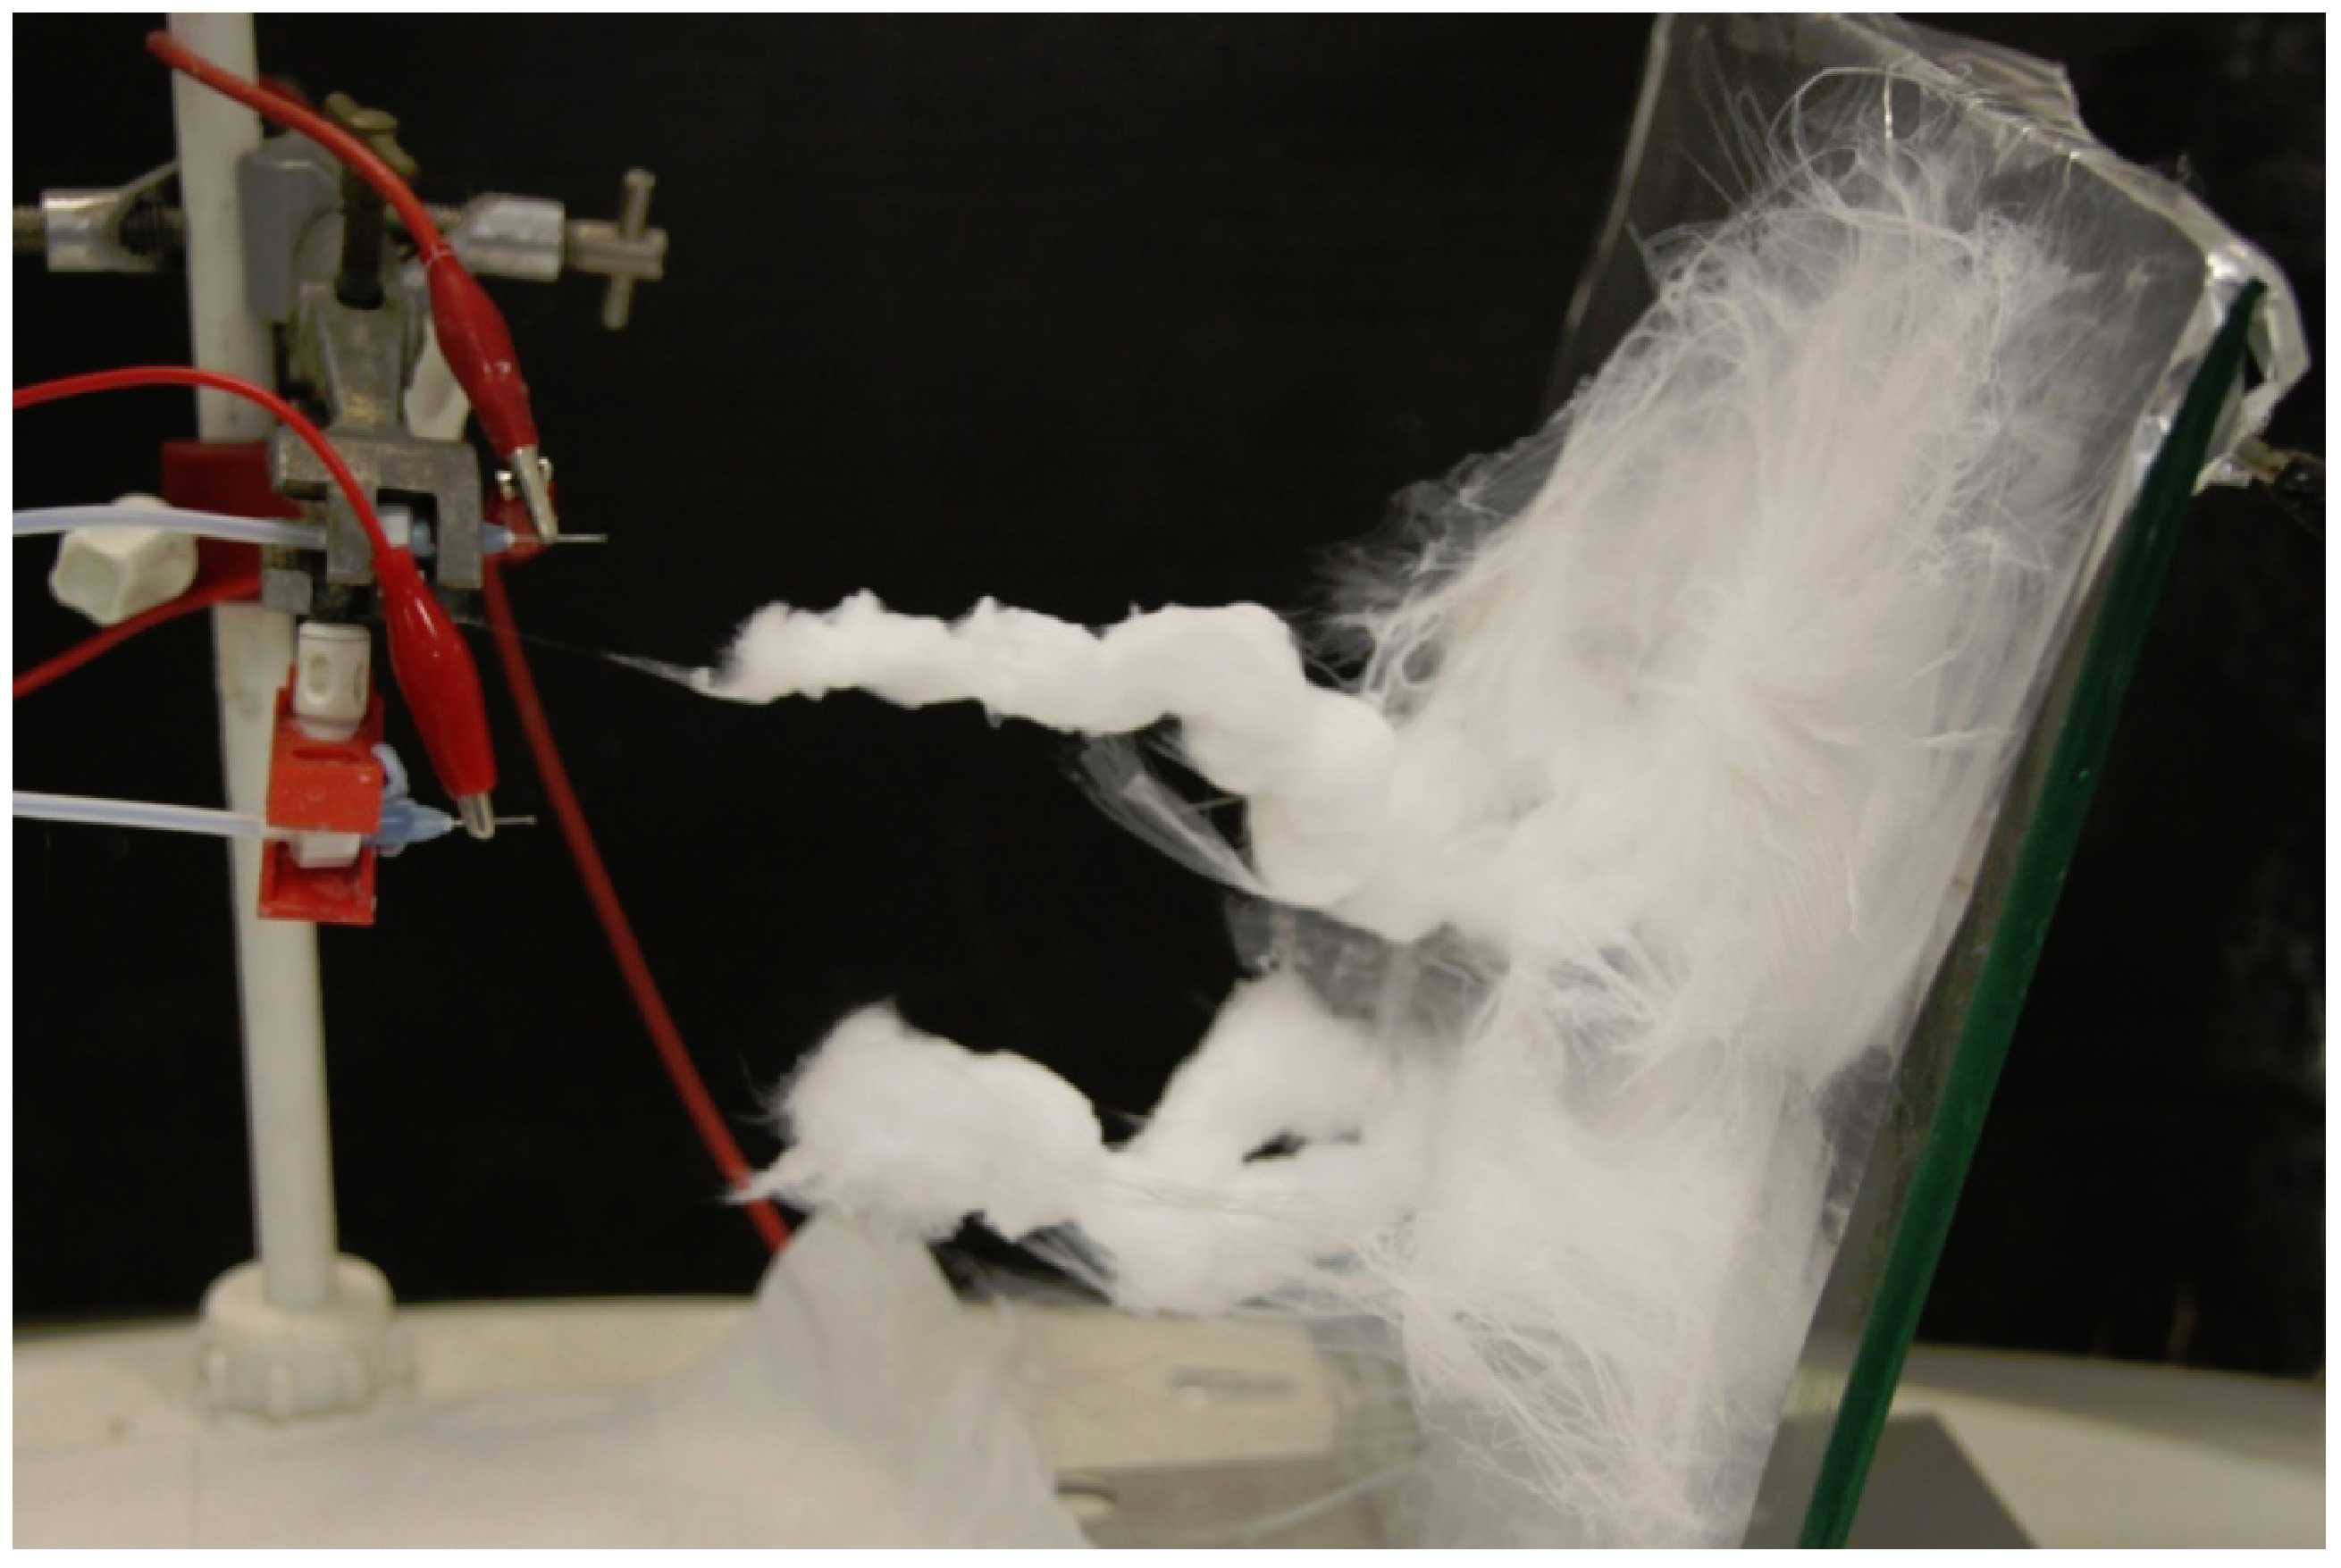
Even with the optimal concentrations, kV and flow rates, after a period of 30 min the collected fibres started to back up towards the needle tip (
Figure 4), which eventually prevented complete evaporation of the solvent due to a decrease in the potential space for whipping of the fibres. To counteract this and to maximise the rate of fibre collection, the distance to the collection plate was increased to 30 cm and a second syringe and needle was connected in a tandem circuit. The flow rate was also increased to 2 µL/min in order to maintain the spinning process over time.
Figure 4.
Image of the collection of 3D fibres using solution 13 and a double needle setup. Notice how the 3D fibres are backing up towards the needle tip.
Figure 4.
Image of the collection of 3D fibres using solution 13 and a double needle setup. Notice how the 3D fibres are backing up towards the needle tip.
When observed under SEM a precipitation of salt was observed on a number of the nanofibres. Therefore the concentration of lithium chloride was reduced from 1% to 0.5%. This appeared to reduce the precipitation without having any discernable effect on fibre diameter or morphology.
Of note was the fact that the spinning process appeared to be sensitive to the ambient temperature and humidity. On a number of occasions, using the previously described optimum conditions, electrospinning failed to produce a 3D membrane if the ambient temperature dropped below 20 °C. This produced significant problems in consistent fibre production as the temperature could not be easily controlled.
2.4. Filler Loading
The percent filler content by weight of the epoxy and the Bis-GMA samples are illustrated in
Table 3. It can be seen that the filler loadings of both the epoxy and Concise samples produced in this experiment were far below typical values for dental composites.
The loadings ranged from 1.35% to 8.3% by weight, a typical dental composite may comprise up to 75% filler loading by weight. Nanometre sized fillers are widely believed to have the potential to substantially improve the mechanical properties of composites at very low filler loadings. This is because their large interfacial area enables the applied load to be transferred to the resin filler interface [
16]. Typical filler loading values for nanofibre reinforced composites range from 3 to 15% [
17]. A Bis-GMA resin reinforced with 5% by weight nylon nanofibres has been shown to improve flexural strength by 36% [
9], therefore the filler loadings used in this investigation were well within the range expected to improve the physical properties. However, incomplete wetting and air inclusion resulted in a reduction in the flexural strength. Strong interfacial bonding of the nanofibre fillers to the resin phase of the matrix has been shown to be important in the reinforcement of composites [
18].
Table 3.
Filler loading by weight for the filled specimens.
Table 3.
Filler loading by weight for the filled specimens.
| Polymer | Filler Loading (%) by weight |
|---|
| Obs | Mean | SD | Min | Max |
|---|
| Filled epoxy | 5 | 4.08 | 2.56 | 1.51 | 8.30 |
| Filled epoxy and silane | 5 | 2.66 | 1.83 | 1.35 | 5.33 |
| Filled Bis-GMA and silane | 5 | 3.23 | 1.78 | 1.39 | 6.15 |
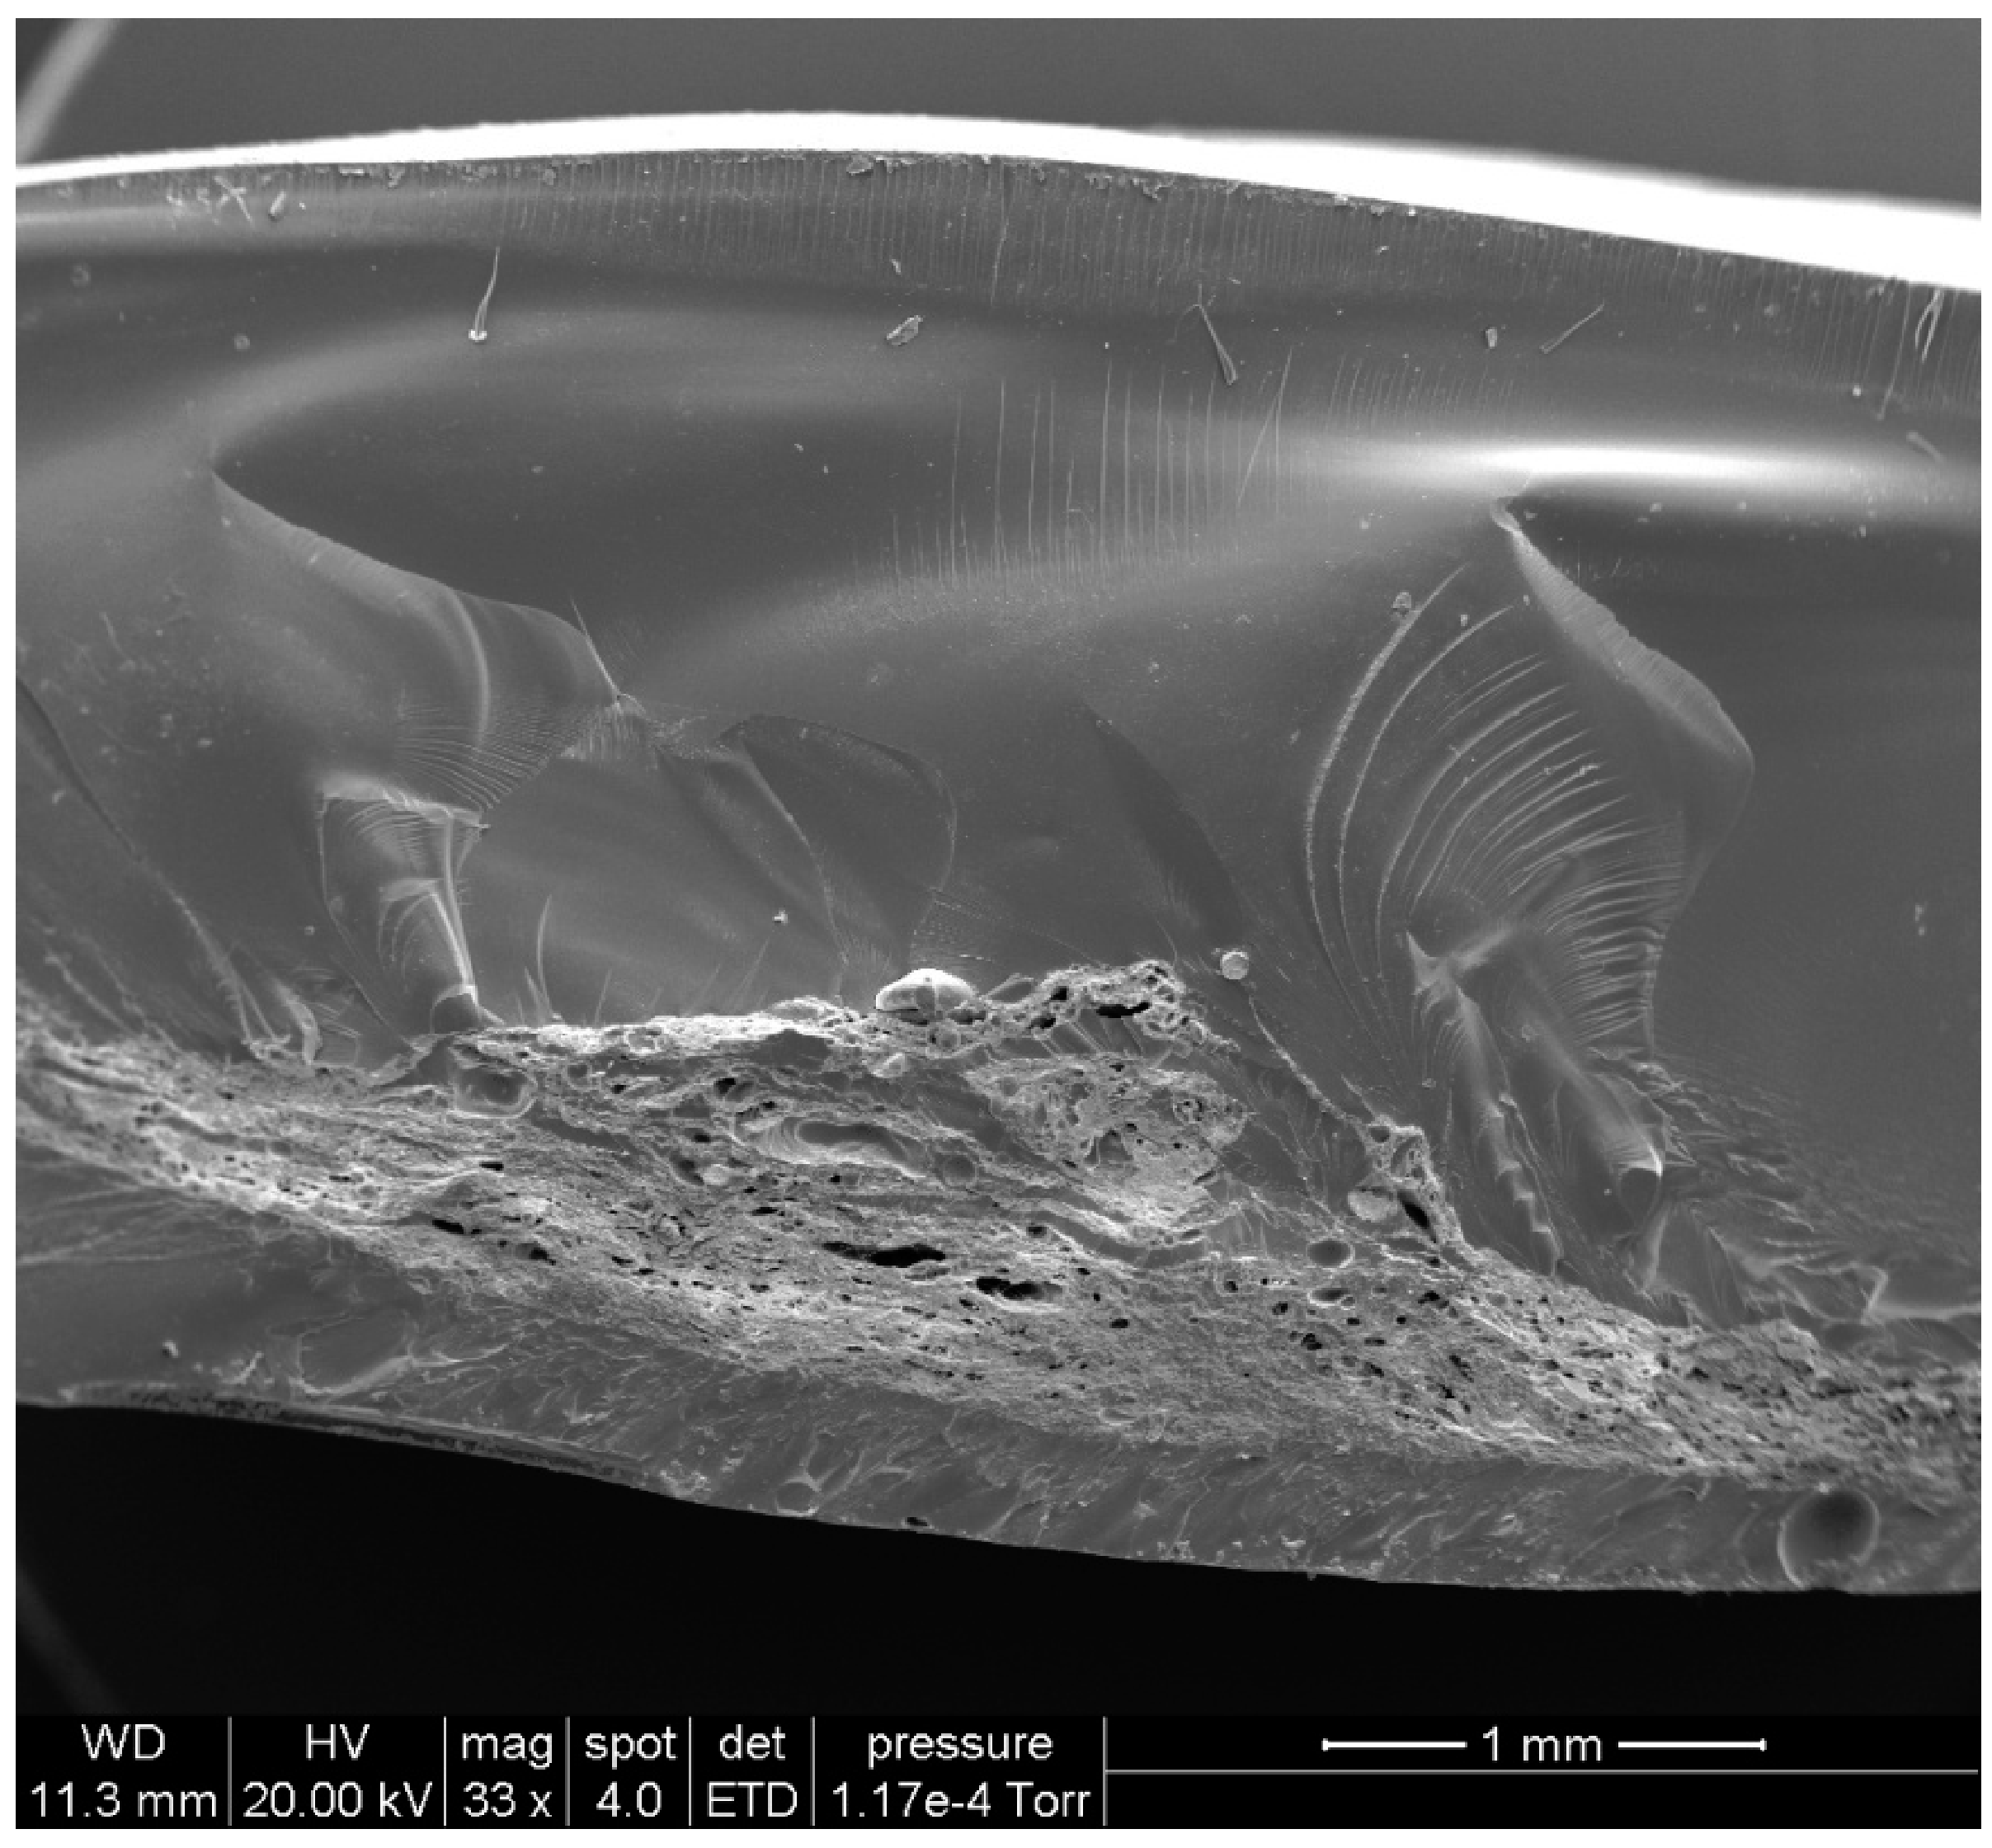
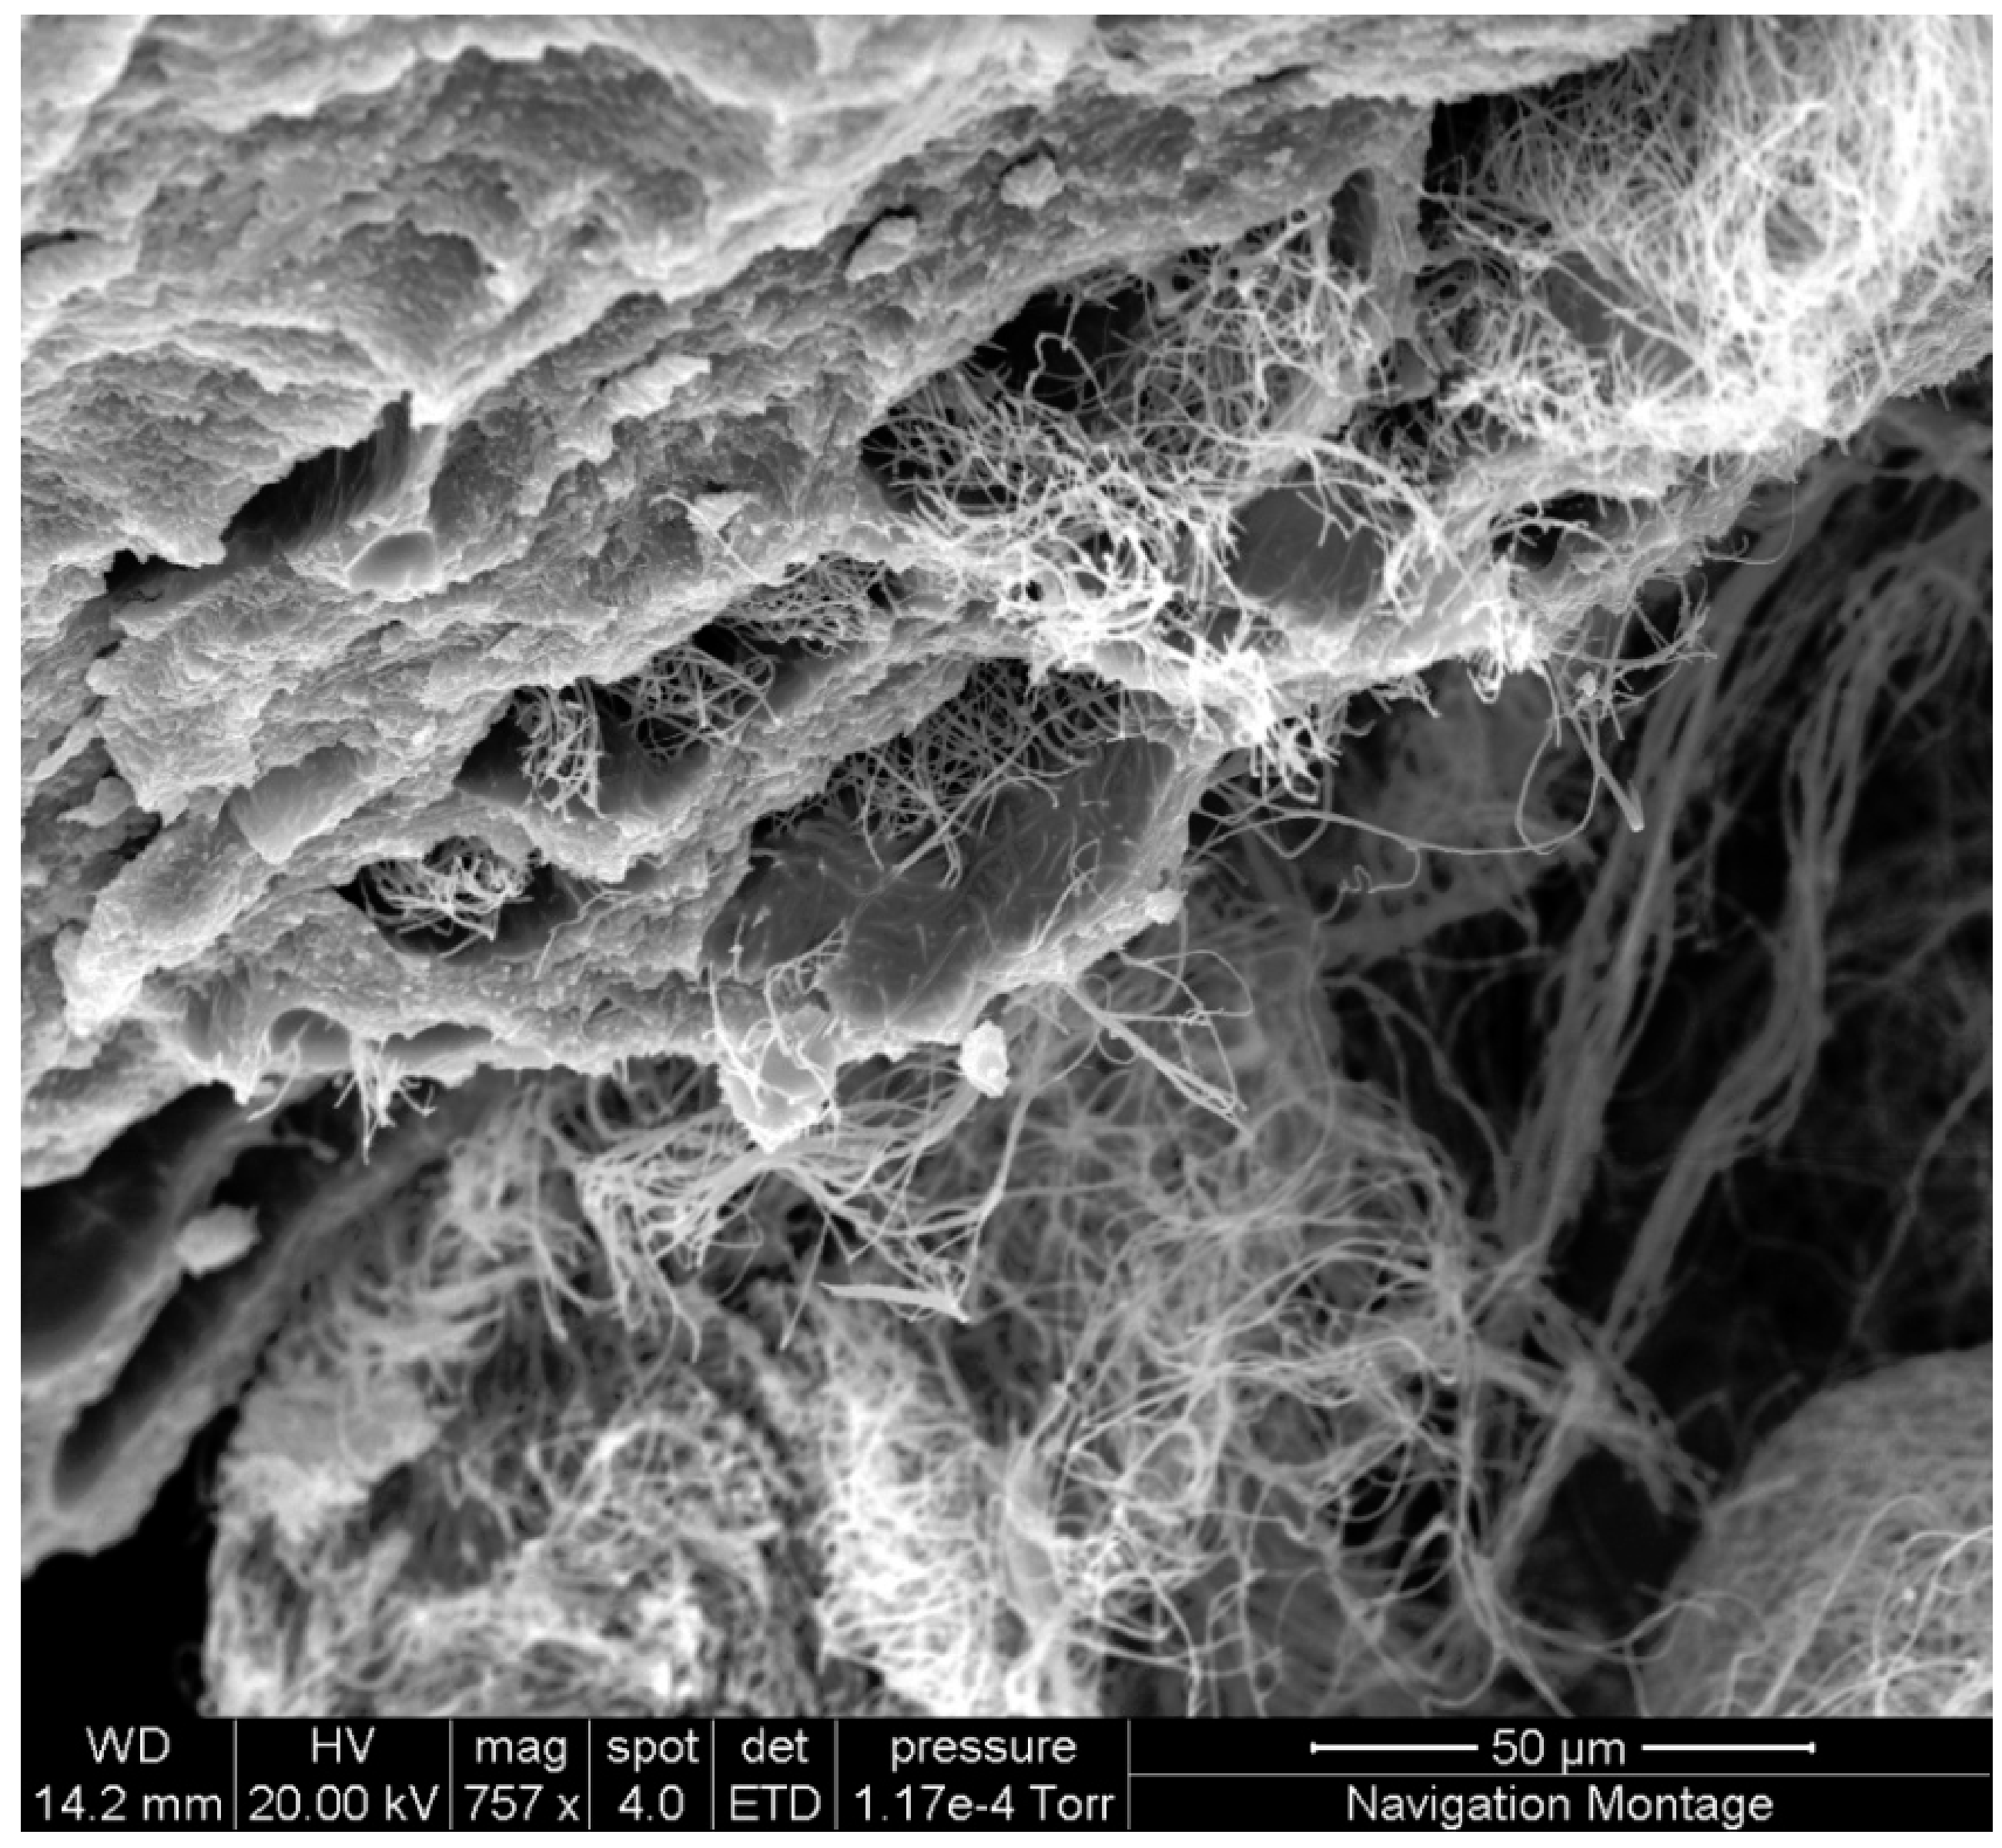
Examination of the fractured surfaces of both the epoxy and Concise filled samples (
Figure 5) showed limited resin filler interaction, therefore there was little potential for load transfer from the nanofibres to the resin matrix. Infiltration of the epoxy resin was carried out under vacuum in an attempt to reduce the inclusion of air in the final samples. Nevertheless, macroscopically the samples exhibited opaque areas where it was initially unclear whether it was due to air inclusion, or clumping of the nanofibres. The Concise samples could not be prepared under vacuum due to the rapid polymerisation and although less viscous than the epoxy resin, complete filling of the mould and fibre wetting was again not possible. The use of a low viscosity, light cured resin cured in a vacuum oven might produce significantly fewer air inclusions within the final composite, an approach which has been shown to be effective in the production of laminate nanofibre reinforced composites [
19].
Figure 5.
SEM image of the fractured surface of 3D nanofibres filled epoxy resin clearly showing how some fibres have not been infiltrated by the resin.
Figure 5.
SEM image of the fractured surface of 3D nanofibres filled epoxy resin clearly showing how some fibres have not been infiltrated by the resin.
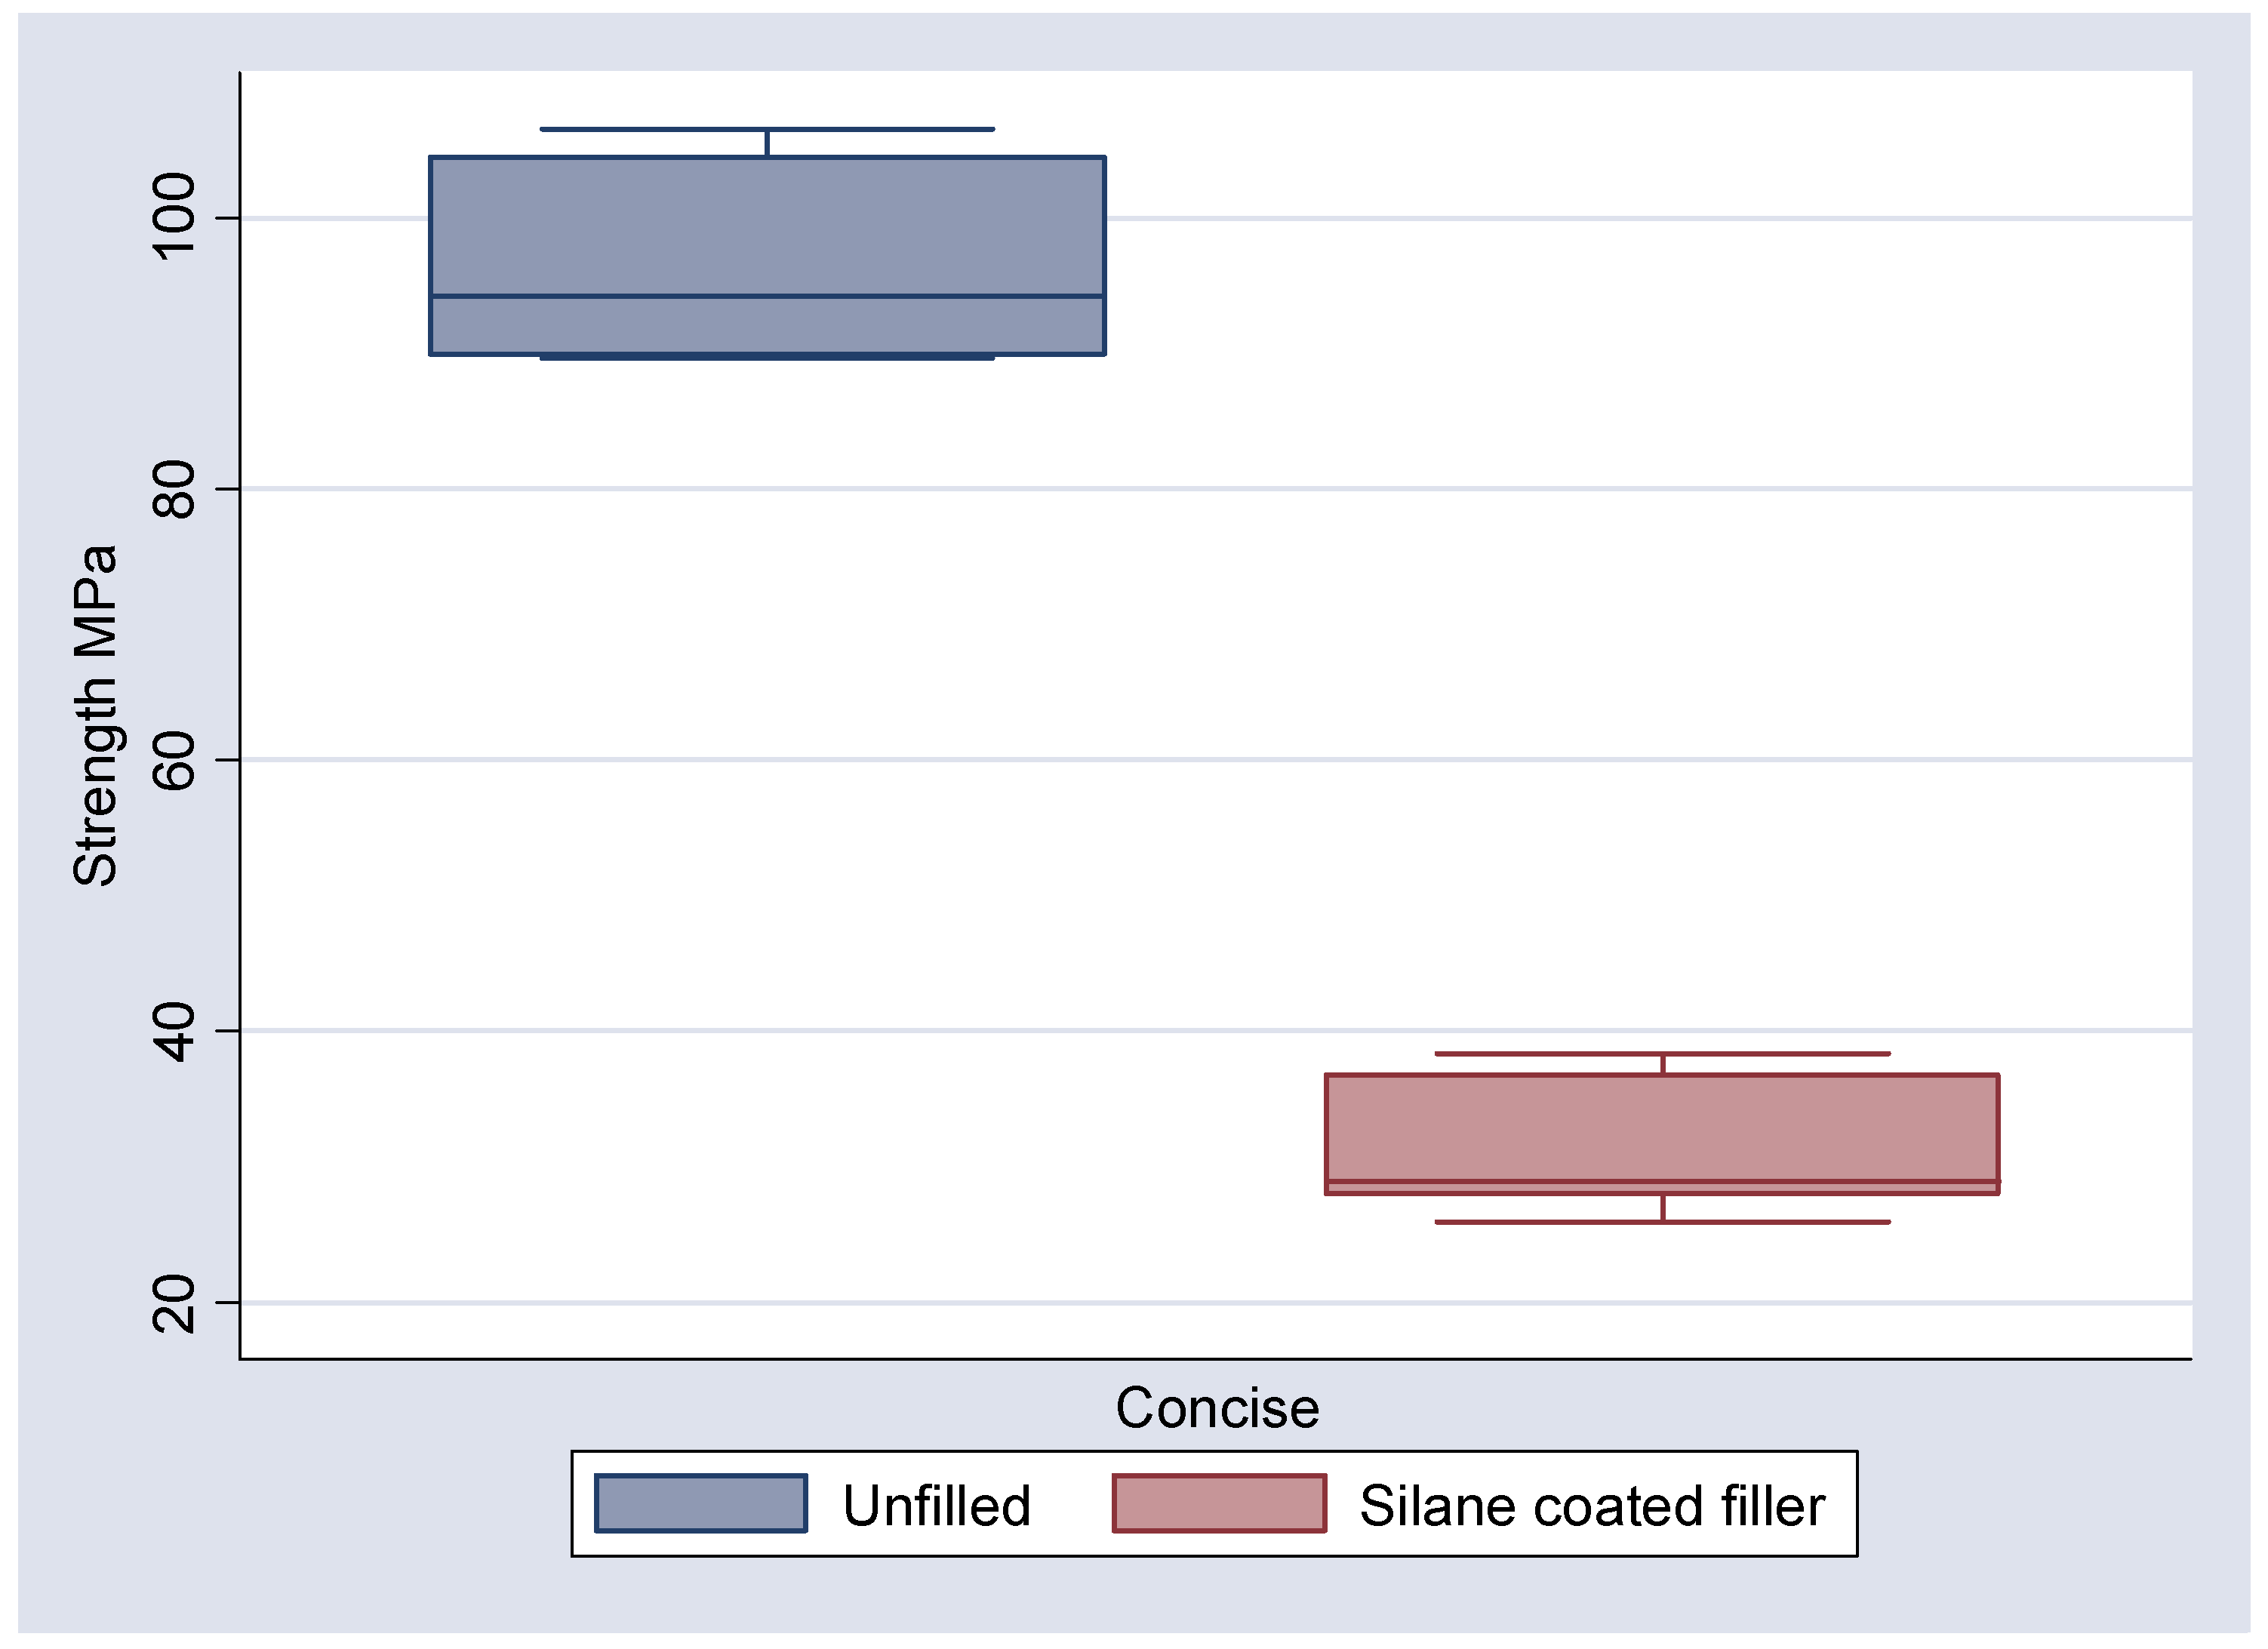
2.5. Three Point Bend Test
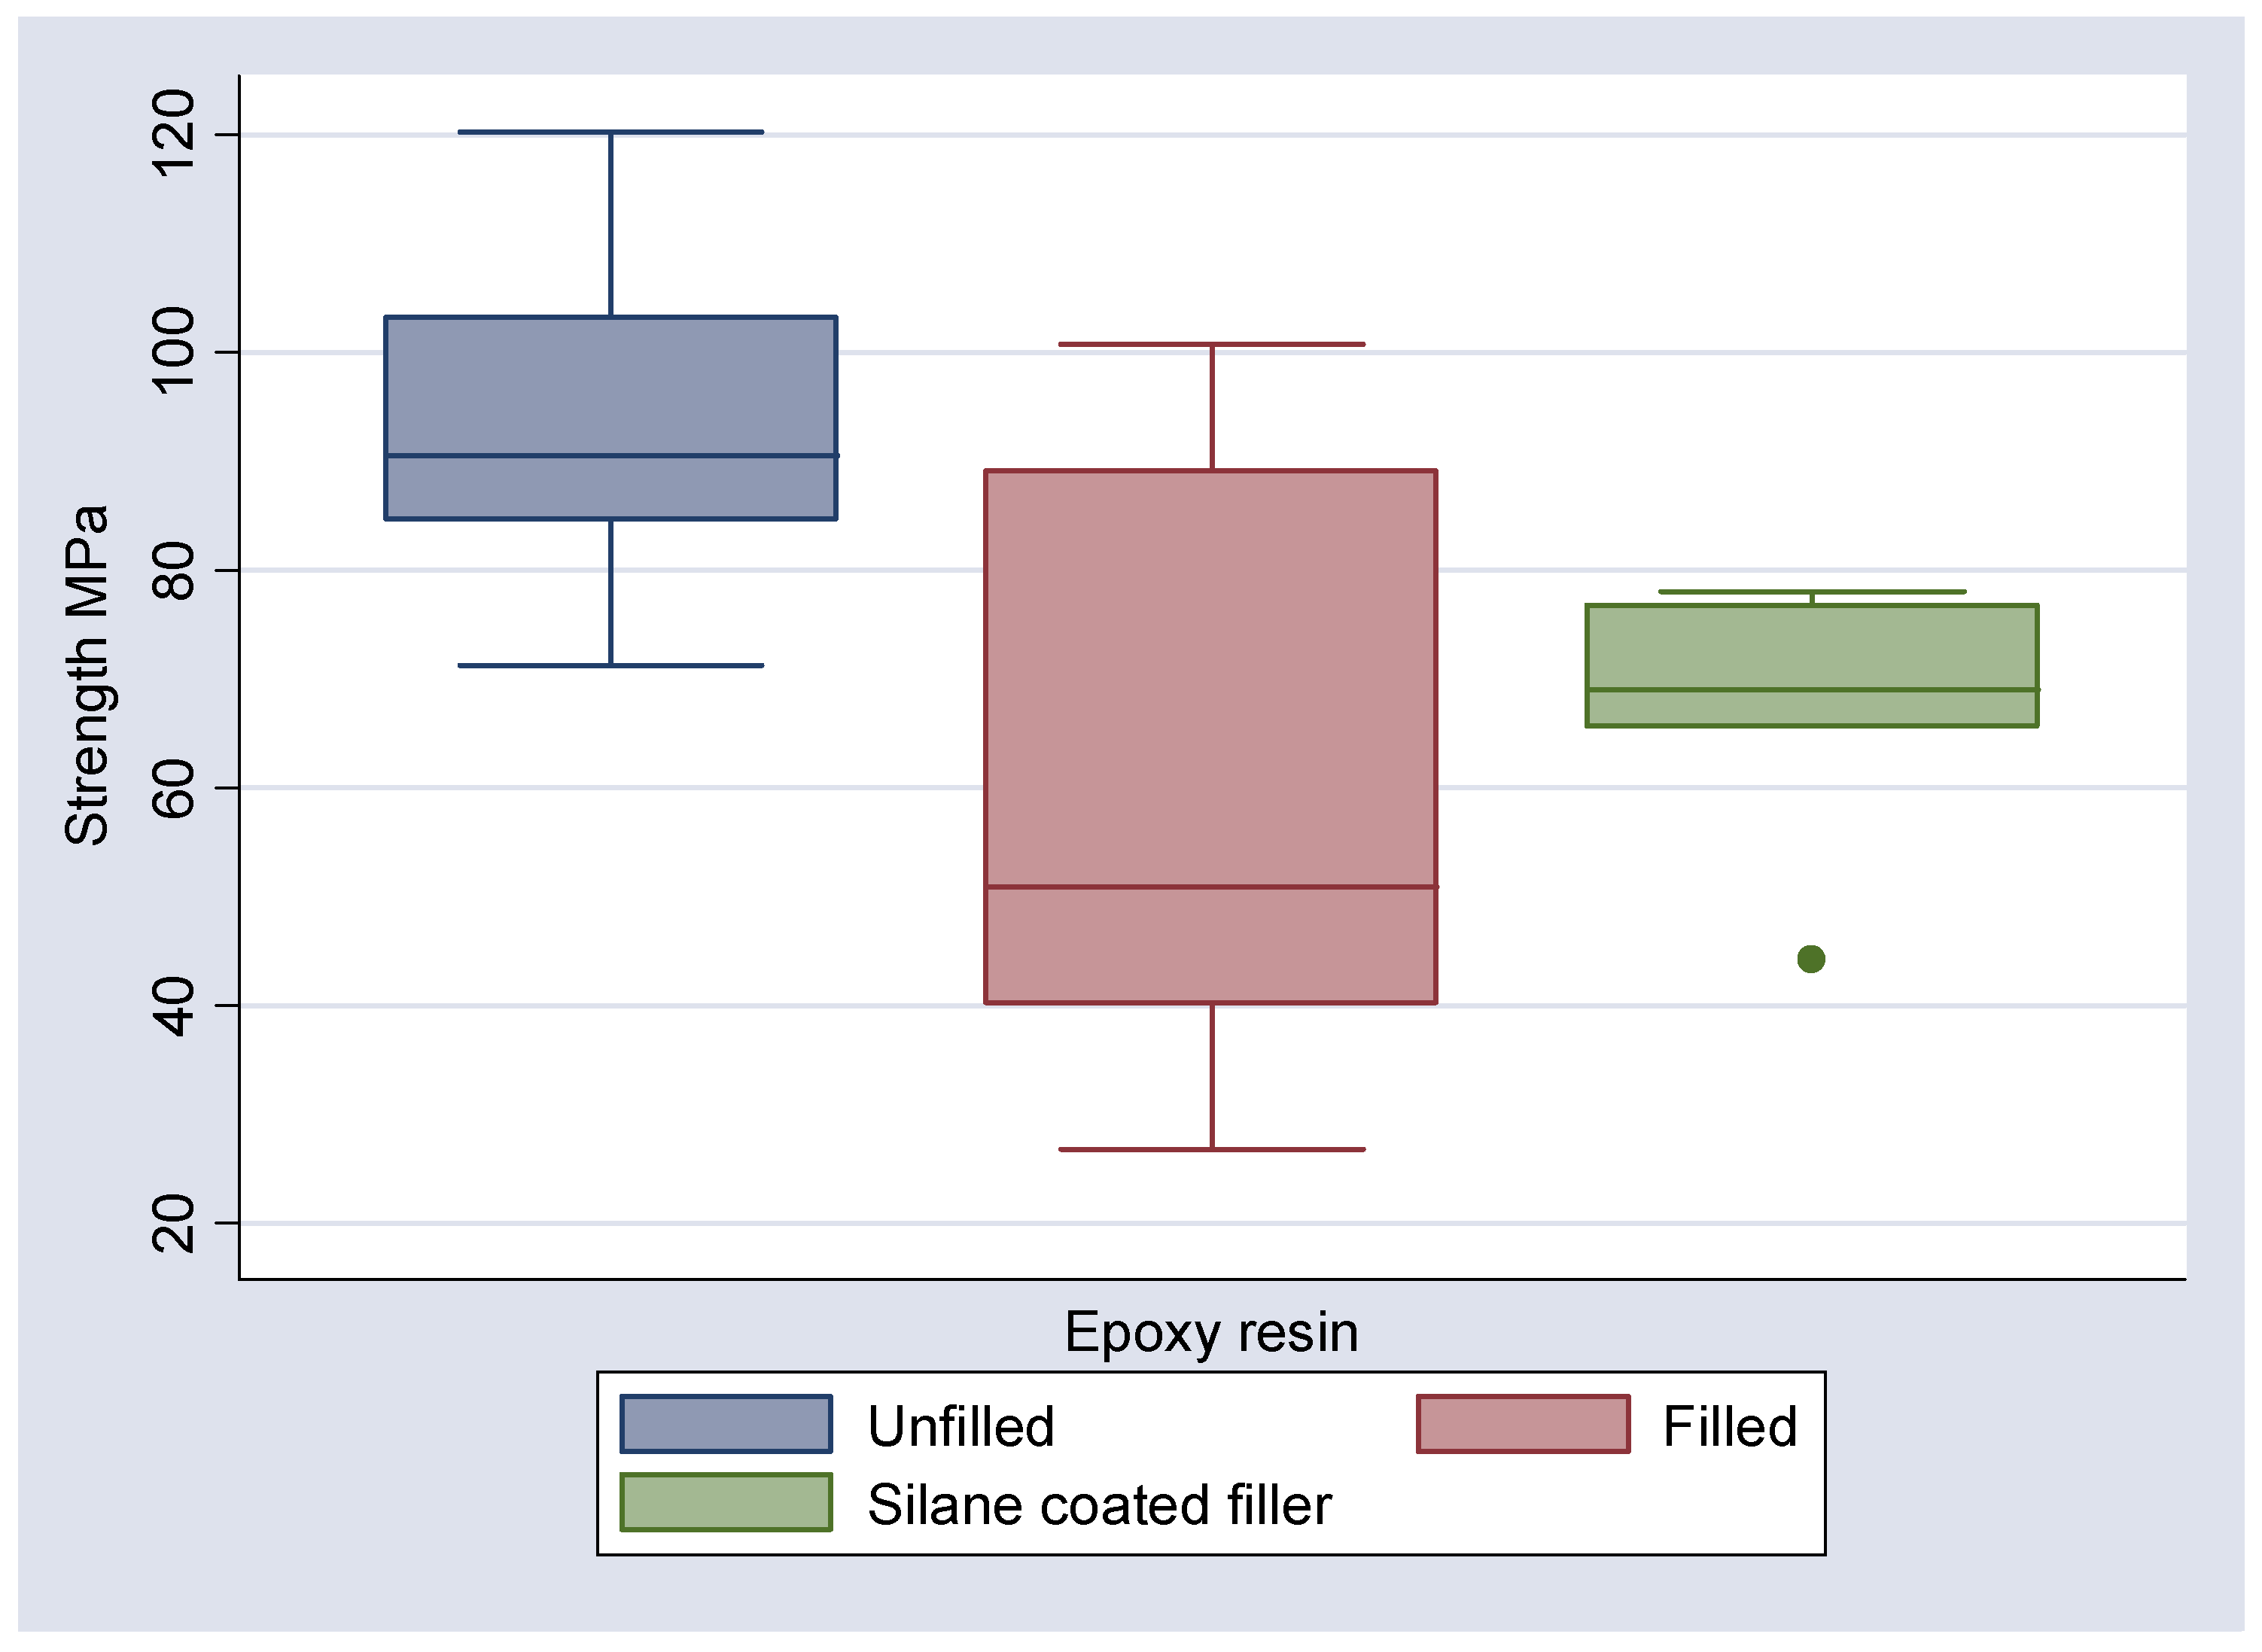
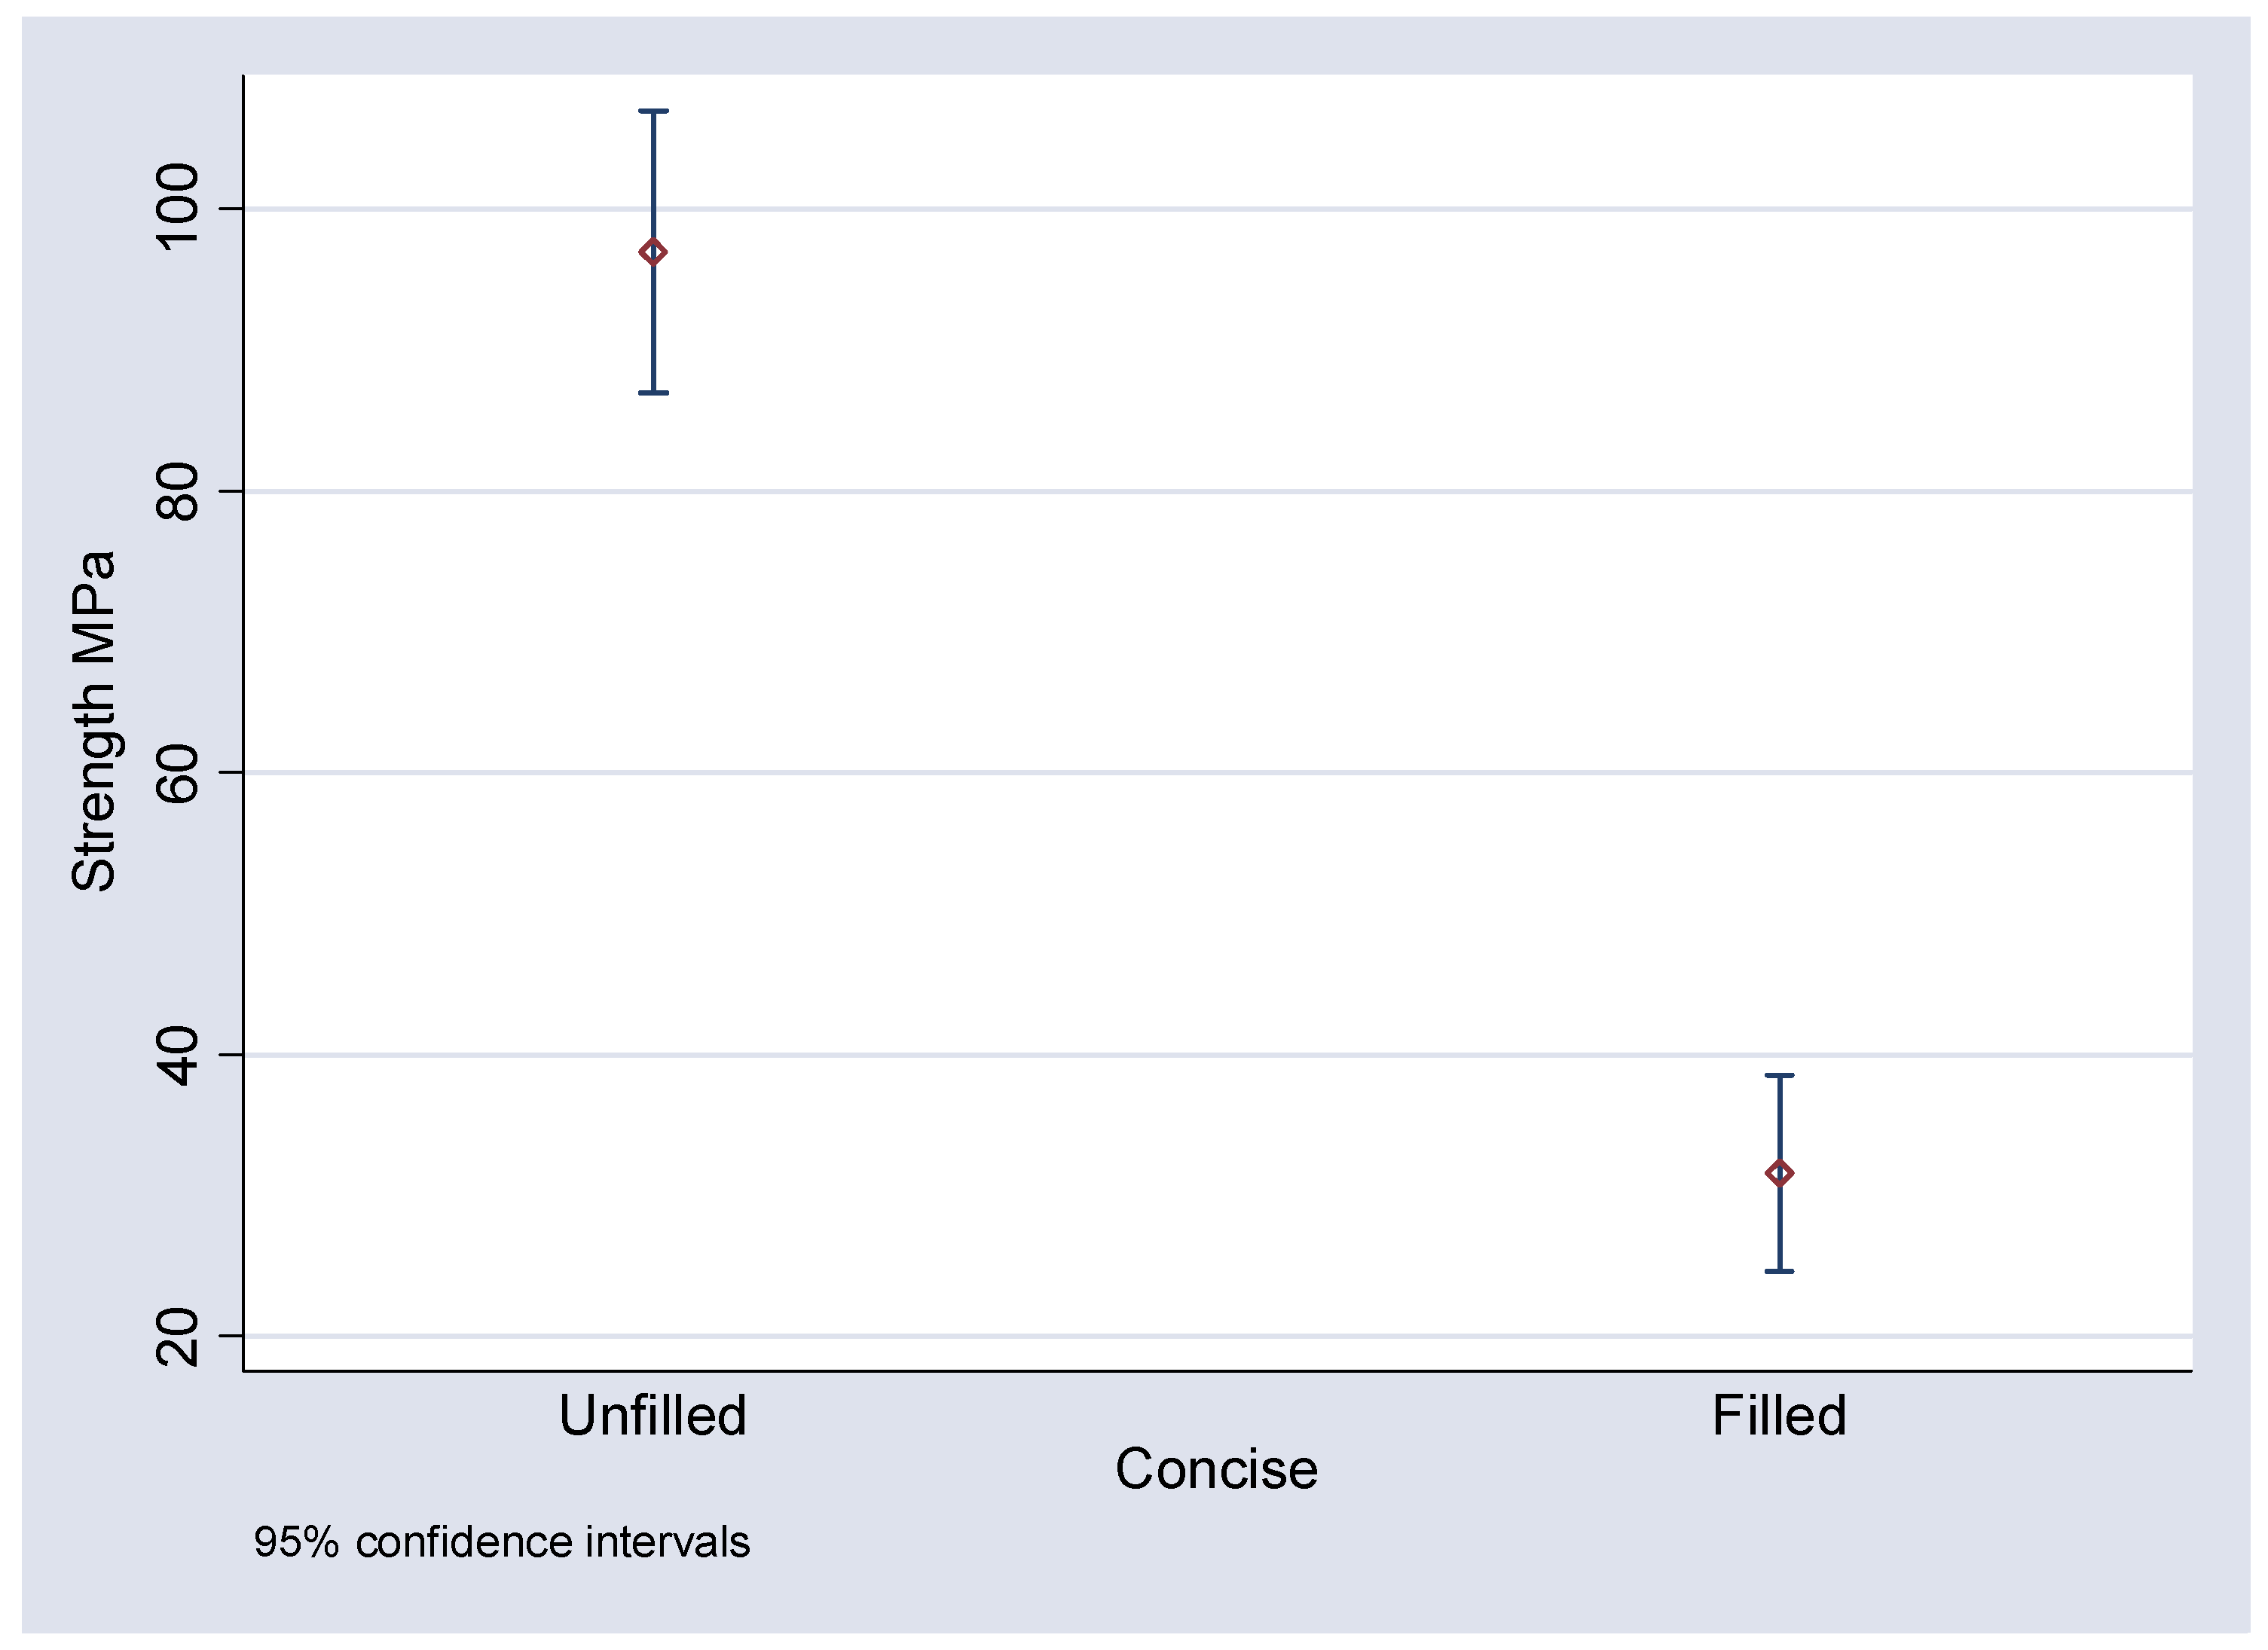
The results of the 3 point bend testing are illustrated in
Table 4 along with the boxplots and means and 95% confidence interval plots (
Figure 6,
Figure 7,
Figure 8,
Figure 9). It can be seen that the mean flexural strengths for the unfilled epoxy and unfilled Bis-GMA are 94.40 and 96.95 MPa respectively. The inclusion of the 3D fibre mesh reduced the mean flexural strength to 66.75 MPa for the silane coated fibres in epoxy and 31.54 MPa for Bis-GMA. For the non-silanated fibres in epoxy the mean flexural strength was reduced to 61.53 MPa.
Table 4.
Data summary of flexural strength (MPa) for the epoxy resin and Bis-GMA unfilled and filled samples.
Table 4.
Data summary of flexural strength (MPa) for the epoxy resin and Bis-GMA unfilled and filled samples.
| | Flexural Strength (MPa) |
|---|
| Obs | Mean | SD | Min | Max | 95% Confidence Intervals of Mean |
|---|
| Unfilled epoxy | 10 | 94.40 | 14.91 | 71.21 | 120.26 | 83.73 to 105.06 |
| Filled epoxy | 5 | 61.53 | 31.91 | 26.86 | 100.71 | 21.91 to 101.14 |
| Filled epoxy and silane | 5 | 66.75 | 13.65 | 44.21 | 78.09 | 49.81 to 83.70 |
| Unfilled Bis-GMA | 5 | 96.95 | 8.07 | 89.60 | 106.55 | 86.93 to 106.97 |
| Filled Bis-GMA and silane | 5 | 31.54 | 5.60 | 25.89 | 38.33 | 25.59 to 38.50 |
Figure 6.
Boxplot of observed strengths (MPa) of epoxy resin in each of three states, unfilled, filled and with silane coated filler.
Figure 6.
Boxplot of observed strengths (MPa) of epoxy resin in each of three states, unfilled, filled and with silane coated filler.
Figure 7.
Means and 95% confidence intervals of the mean for epoxy resin in each of three states, unfilled, filled and with silane coated filler.
Figure 7.
Means and 95% confidence intervals of the mean for epoxy resin in each of three states, unfilled, filled and with silane coated filler.
Figure 8.
Boxplot of observed strengths (MPa) for Concise, unfilled and with silane coated filler.
Figure 8.
Boxplot of observed strengths (MPa) for Concise, unfilled and with silane coated filler.
Figure 9.
Means and 95% confidence intervals of the mean for Concise, unfilled and with silane coated filler.
Figure 9.
Means and 95% confidence intervals of the mean for Concise, unfilled and with silane coated filler.
The aim using a silane was to see if it would improve any potential bond between the 3D nanofibres and the resin. A recent investigation in which co-axial polymethyl methacrylate/polyacrylonitrile core nanofibres were infiltrated with Bis-GMA resin prior to being embedded in bulk Bis-GMA, demonstrated a significant increase in flexural strength as a result of the infiltration [
20]. Unfortunately the same effect was not observed in our experiment where the flexural strength of the unfilled epoxy control samples was higher than the flexural strength of both silane coated and uncoated nanofibre reinforced epoxy samples.
Although the addition of silane coupling agent to the fibres appeared to reduce the range of observed flexural strengths, it did not significantly improve the mechanical properties of the composite. The reason for this may have been due to improved wetting of the fibres, or direct chemical bonding of the nanofibres to the resin component, or a combination of these two factors. However, the process of silane coating itself may have caused some slumping of the fibres and loss of the 3D structure. In addition the silane coupling agent used in this experiment contained a small amount of acetone as a solvent, which may potentially affect 3D nanofibres.
Similarly with the Concise samples flexural strength was also significantly reduced when compared to the unfilled controls. Indeed the effect was much more pronounced than the differences observed between the filled and unfilled epoxy resin. This suggests that the difficulties in preparation of samples due to the setting characteristics of the Concise compromised the strength to a greater degree than the epoxy resin. The common use of vacuum ovens and light cured Bis-GMA resins in other studies [
19,
20] appears to minimise the problems associated with incorporation of air into the samples during preparation. This approach would be recommended for any further investigation of this type.
The fracture surfaces of both the epoxy and Concise samples revealed aggregations of nanofibre fillers that were not in contact with the resin phase of the composite. This, combined with the previously described inclusion of air within the samples, undoubtedly contributed to the reduced flexural strengths observed. Evidence of slumping of the nanofibres towards the bottom of the samples suggested that during resin infiltration the 3D structure had been compromised, either as a result of the manipulation of the nanofibres during placement into the mould, during silane coating, or at the resin infiltration phase (
Figure 10).
Figure 10.
SEM image of sample 3D nanofibres filled Concise showing clear aggregation of the nanofibre filler at the base of the sample. This suggested that the 3D integrity of the nanofibre mesh had not been preserved in the process of resin infiltration.
Figure 10.
SEM image of sample 3D nanofibres filled Concise showing clear aggregation of the nanofibre filler at the base of the sample. This suggested that the 3D integrity of the nanofibre mesh had not been preserved in the process of resin infiltration.


