Highly Sensitive Fluorescence Detection of Three Organophosphorus Pesticides Based on Highly Bright DNA-Templated Silver Nanoclusters


1
State Key Laboratory of Food Science and Technology, Jiangnan University, Lihu Road 1800, Wuxi 214122, China
2
School of Food Science and Technology, Jiangnan University, Lihu Road 1800, Wuxi 214122, China
3
International Joint Laboratory on Food Safety, Jiangnan University, Lihu Road 1800, Wuxi 214122, China
4
School of Food Science and Technology, Shihezi University, Shihezi 832000, China
*
Authors to whom correspondence should be addressed.
Biosensors 2023, 13(5), 520; https://doi.org/10.3390/bios13050520
Submission received: 27 March 2023
/
Revised: 29 April 2023
/
Accepted: 4 May 2023
/
Published: 5 May 2023
(This article belongs to the Special Issue DNA Biosensors for Highly Sensitive Detection)
Abstract
:It is still challenging to achieve simultaneous and sensitive detection of multiple organophosphorus pesticides (OPs). Herein, we optimized the ssDNA templates for the synthesis of silver nanoclusters (Ag NCs). For the first time, we found that the fluorescence intensity of T base-extended DNA-templated Ag NCs was over three times higher than the original C-riched DNA-templated Ag NCs. Moreover, a “turn-off” fluorescence sensor based on the brightest DNA-Ag NCs was constructed for the sensitive detection of dimethoate, ethion and phorate. Under strong alkaline conditions, the P-S bonds in three pesticides were broken, and the corresponding hydrolysates were obtained. The sulfhydryl groups in the hydrolyzed products formed Ag-S bonds with the silver atoms on the surface of Ag NCs, which resulted in the aggregation of Ag NCs, following the fluorescence quenching. The fluorescence sensor showed that the linear ranges were 0.1–4 ng/mL for dimethoate with a limit of detection (LOD) of 0.05 ng/mL, 0.3–2 µg/mL for ethion with a LOD of 30 ng/mL, and 0.03–0.25 µg/mL for phorate with a LOD of 3 ng/mL. Moreover, the developed method was successfully applied to the detection of dimethoate, ethion and phorate in lake water samples, indicating a potential application in OP detection.
1. Introduction
Organophosphorus pesticides (OPs) have been used for agricultural pest control worldwide for over half a century, and they contribute 38% of the total global pesticide use [1]. However, OP residues cause serious contamination of agricultural products and environmental pollution due to improper use, and also bring about harm to human health through food intake [2]. Organophosphorus compounds are characterized by the presence of the thiophosphoryl functional groups (P=S). Excessive use of OPs causes long-term accumulation in the ecosystem, which is harmful to the environment and human beings, because it can inhibit the activity of acetylcholinesterase (AChE), which is a kind of acetylcholinesterase hydrolase (ATCh). If the activity of AChE is inhibited, organisms become overexcited, eventually leading to death [3,4].
It is of great significance to develop a rapid detection method for OP pesticides in environmental and food contamination. So far, the most common strategy of developing detection of OP has been mainly based on its inhibition of natural enzyme (AChE) activity [5,6]. However, AChE methods are generally used for OPs and carbamate pesticides [7]. Furthermore, Yan et al. utilized paraoxon as a representative of OPs to inhibit the activity of tyrosinase, resulting in the fluorescence recovery of egg-white-wrapped gold nanoclusters (Au NCs) and the detection of paraoxon [8]. Wu et al. used paraoxon to inhibit the activity of butyrylcholinesterase, recovering the fluorescence of carbon quantum dots (CQDs) which were quenched by gold nanoparticles (Au NPs) [9].
In addition, several works have employed hydrolytic enzymes to hydrolyze OPs, and have achieved the indirect detection of OPs through the detection of OP hydrolysates. For example, Su’s group employed OP hydrolase to hydrolyze parathion-methyl and produced p-nitrophenol [10]. This resulted in electron transfer (ET) from CdTe QDs to p-nitrophenol, thus quenching the CdTe QDs’ fluorescence and achieving the detection of parathion-methyl. However, it should be noted that environmental factors could greatly affect the activity of natural enzymes [11,12]. Limited works were also developed based on the chemical hydrolysis of OPs. Yi et al. hydrolyzed parathion-methyl to p-nitrophenol under alkaline conditions [13]. The hydrolysates entered the β-cyclodextrin (β-CD) cavity through host-guest recognition and quenched the fluorescence of β-CD-modified MoS2 QDs, thereby achieving the indirect detection of parathion-methyl. Liu et al. developed a highly sensitive fluorescence sensing system based on nitrogen and sulphur co-doped carbon dots for the indirect detection of methyl parathion with the aid of alkaline-induced hydrolysis [14]. Zhang et al. applied chemiluminescence induced by replacing methionine on the surface of Au-Fe3O4 dumbbell-like nanoparticles with parathion-methyl hydrolysates to detect parathion-methyl. The anti-interference effect in complex sample detection could be achieved by magnetic bead separation [15]. Compared with these methods, the fluorescence sensing method has the advantages of high sensitivity and simple operation.
Today, fluorescence quenching sensing based on the interaction between sulfhydryl groups and fluorescent nanoclusters is quite common. Most of these methods achieved detection based on intrinsic sulfhydryl groups [16]. Meanwhile, hydrolysis of OPs can also produce sulfhydryl groups [17]. However, there are few reports of sulfhydryl groups hydrolyzed from OPs applied in fluorescence sensing. Therefore, inspired by the quenching effect of sulfhydryl groups on fluorescent nanoclusters, we achieved fluorescence sensing of three OPs based on quenching fluorescence of DNA-templated silver nanoclusters (DNA-Ag NCs) using a pesticide hydrolysate. Herein, we developed highly sensitive fluorescence detection methods for the three OPs (dimethoate, ethion and phorate) based on the quenching of fluorescence of DNA-templated silver nanoclusters (DNA-Ag NCs) by the pesticide hydrolysate under alkaline conditions for the detection of three OPs. It was found that the rapid hydrolysis of dimethoate, ethion and phorate under strong alkaline conditions could be utilized to split the P-S bonds of three OPs and produce the sulfhydryl group. Then, an indirect sensitive response of the DNA-Ag NCs to the OPs was achieved through the sulfhydryl group bonding with Ag NCs and the formation of Ag-S bond. Additionally, the other common OPs could not interfere with the detection. The above method has the advantages of enzyme-free, simple operation, high sensitivity and good selectivity, thus, showing high application potential in OP detection.
2. Materials and Methods
2.1. Reagents and Instruments
The single-stranded DNA (ssDNA) shown in Table 1 was used in this study, and the oligonucleotide was synthesized by Shanghai Sangon Biotechnology Co. Ltd. (Shanghai, China). Silver nitrate (AgNO3) and sodium borohydride (NaBH4) were purchased from Shanghai Aladdin Biochemical Technology Co. Ltd. (Shanghai, China). Sodium hydroxide (NaOH) was provided by Sinopharm Chemical Reagent Co. Ltd. (Shanghai, China). The chemicals and reagents used were of analytical grade, and all pesticides were supplied by Shanghai Pesticide Research Institute. Ultrapure water used in this study was produced by Milli-Q Academic system (Millipore, Burlington, MA, USA; Resistivity: 18.2 MΩ·cm).
A JEOL JEM-2100 transmission electron microscope (Tokyo, Japan) was used for the transmission electron microscopy (TEM) measurement. The hydrodynamic size distribution was conducted on a dynamic light scattering (DLS) analyzer (Malvern Zetasizer Nano ZSE, London, UK). Fluorescence spectra were performed on a F97Pro spectrophotometer (Shanghai, China). The UV-Vis absorption spectrum was characterized on a UV-2802PCS UV–visible spectrophotometer (UNICO, Franksville, WI, USA).
2.2. Synthesis of DNA-Ag NCs
DNA-Ag NCs were synthesized by a one-step method according to previous reported methods with a slight modification [18,19], and the following provides the specific steps. Firstly, 16 µL of DNA solution (250 µM) was mixed with 166 µL of phosphate-buffered saline (PBS) (20 mM, pH 7.0). A volume of 6 µL of AgNO3 solution (4 mM) was then added to the mixture and incubated at 4 °C for 20 min. Subsequently, 12 µL of NaBH4 (2 mM) prepared with iced water was added. After being mixed with violent shaking, the mixture was then incubated in darkness at room temperature for 3 h. Finally, the prepared DNA-Ag NCs solution was stored at 4 °C until use.
2.3. Optimization of the Assay Conditions
To develop a highly sensitive and reproducible detection method for the detection of dimethoate, ethion and phorate, parameters such as NaOH concentration, hydrolysis temperature, hydrolysis time and the reaction time between DNA-Ag NCs and each pesticide were investigated. The NaOH solution was diluted to the concentrations of 1, 2, 3, 4 and 5 mM. The hydrolysis temperature of pesticides was examined at 20, 30, 50, 70 and 90 °C. The hydrolysis was performed at 0, 5, 10, 15 and 20 min for dimethoate, 0, 1, 3, 5, 10 and 15 min for ethion, and 0, 1, 3, 5 and 10 min for phorate, respectively. In addition, the reaction time between DNA-Ag NCs and each pesticide was also performed at 1, 5, 10, 15 and 20 min. The results of each assay are presented in terms of the fluorescence intensity of DNA-Ag NCs in the absence of pesticides (F0), the fluorescence intensity of DNA-Ag NCs in the presence of pesticides (F) and the ratio of the two (F/F0).
2.4. Pesticide Detection Procedure
The whole reaction process was divided into two steps: one was the hydrolysis of pesticides under alkaline conditions and the other was the reaction between hydrolysates and DNA-Ag NCs. In brief, 10 µL of pesticides (dimethoate, ethion and phorate) with different concentrations were mixed with 10 µL of sodium hydroxide solution (3 mM) and incubated for a certain time, respectively. Then, 60 µL of PBS (10 mM, pH 7.5) and 20 µL of DNA-Ag NCs solution (0.01×) were added and the reaction was carried out at room temperature. A volume of 95 µL of mixture was used to record the fluorescence intensity at 620 nm (excitation wavelength was 530 nm) by fluorescence spectrophotometry.
2.5. Detection of Dimethoate, Ethion and Phorate in Lake Water Samples
Lake water was collected from the local lake. After being filtered twice with a 0.22 μm microporous membrane, dimethoate (0.5, 2 and 4 ng/mL), ethion (0.5, 1 and 1.5 μg/mL), and phorate (0.05, 0.2 and 0.4 μg/mL) were added to lake water samples, respectively. The fluorescence analysis was followed by the above detection procedure, and the concentrations of pesticide residues in water samples were calculated using the standard curves. After the actual sample was prepared, the three pesticides with different concentrations were added to it, respectively, and the actual concentrations were detected by the standard curve. The recovery was calculated by the equation:
3. Results and Discussion
3.1. Sensing Strategy for the Detection of Three OPs
DNA can bind with silver ions through the N7 position of purine bases and the N3 position of pyrimidine bases with high affinity [20]. Therefore, the reduced silver atoms tend to aggregate inside the encapsulated spaces of nucleobases [21]. The luminescent properties of silver nanoclusters (Ag NCs) are closely related to their size [22]; when the size of Ag NCs approaches the Fermi wavelength of electrons, their energy structure breaks down into discrete levels which is similar to the molecule, rendering the Ag NCs with a good fluorescence quantum yield and resulting in a strong fluorescence intensity [23]. Based on this, the luminescent properties of silver nanoclusters can be adjusted by changing the DNA template sequence and structure.
In terms of the molecular structure, OPs can be divided into three categories: phosphate ester pesticides [(RO)3P=O], thiophosphate ester pesticides [(RO)3P=S] and thioester phosphate pesticides [(RO)3S-P=O(S)] [4]. According to previous reports, some OPs are easily hydrolyzed under alkaline conditions. Specifically, P-O or P-S bonds are broken to generate hydroxyl or sulfhydryl groups. For example, Lan et al. utilized the P-O bond fracture of parathion-methyl under alkaline conditions to produce p-nitrophenol, thus resulting in the inner-filter effect with N-doped carbon dots [24]. Under neutral conditions, P=S bonds coordinated with silver atoms on the surface of Ag NCs [25], which led to the weak fluorescence quenching of Ag NCs. However, in the strongly alkaline environment, P-S bonds were broken by pesticide hydrolysis and sulfhydryl groups were generated. Then, the sulfhydryl groups and the silver atoms on the surface of Ag NCs underwent a metal-sulfur coordination interaction, which greatly quenched the fluorescence of Ag NCs. As shown in Figure 1, the structures of dimethoate, ethion and phorate contain P-S bonds, which could hydrolyze under alkaline conditions and produce the sulfhydryl groups. Meanwhile, the highly bright DNA-Ag NCs were synthesized by sequestering AgNO3 with DNA and then reducing Ag+ to Ag0 clusters in the presence of NaBH4. Based on this, detection of the three OPs was achieved through the fluorescence quenching effect of the produced sulfhydryl groups on the DNA-Ag NCs which could be quantified by F/F0 (F and F0 represent fluorescence intensity in the presence and absence of Ops, respectively).
3.2. Characterization of DNA-Ag NCs
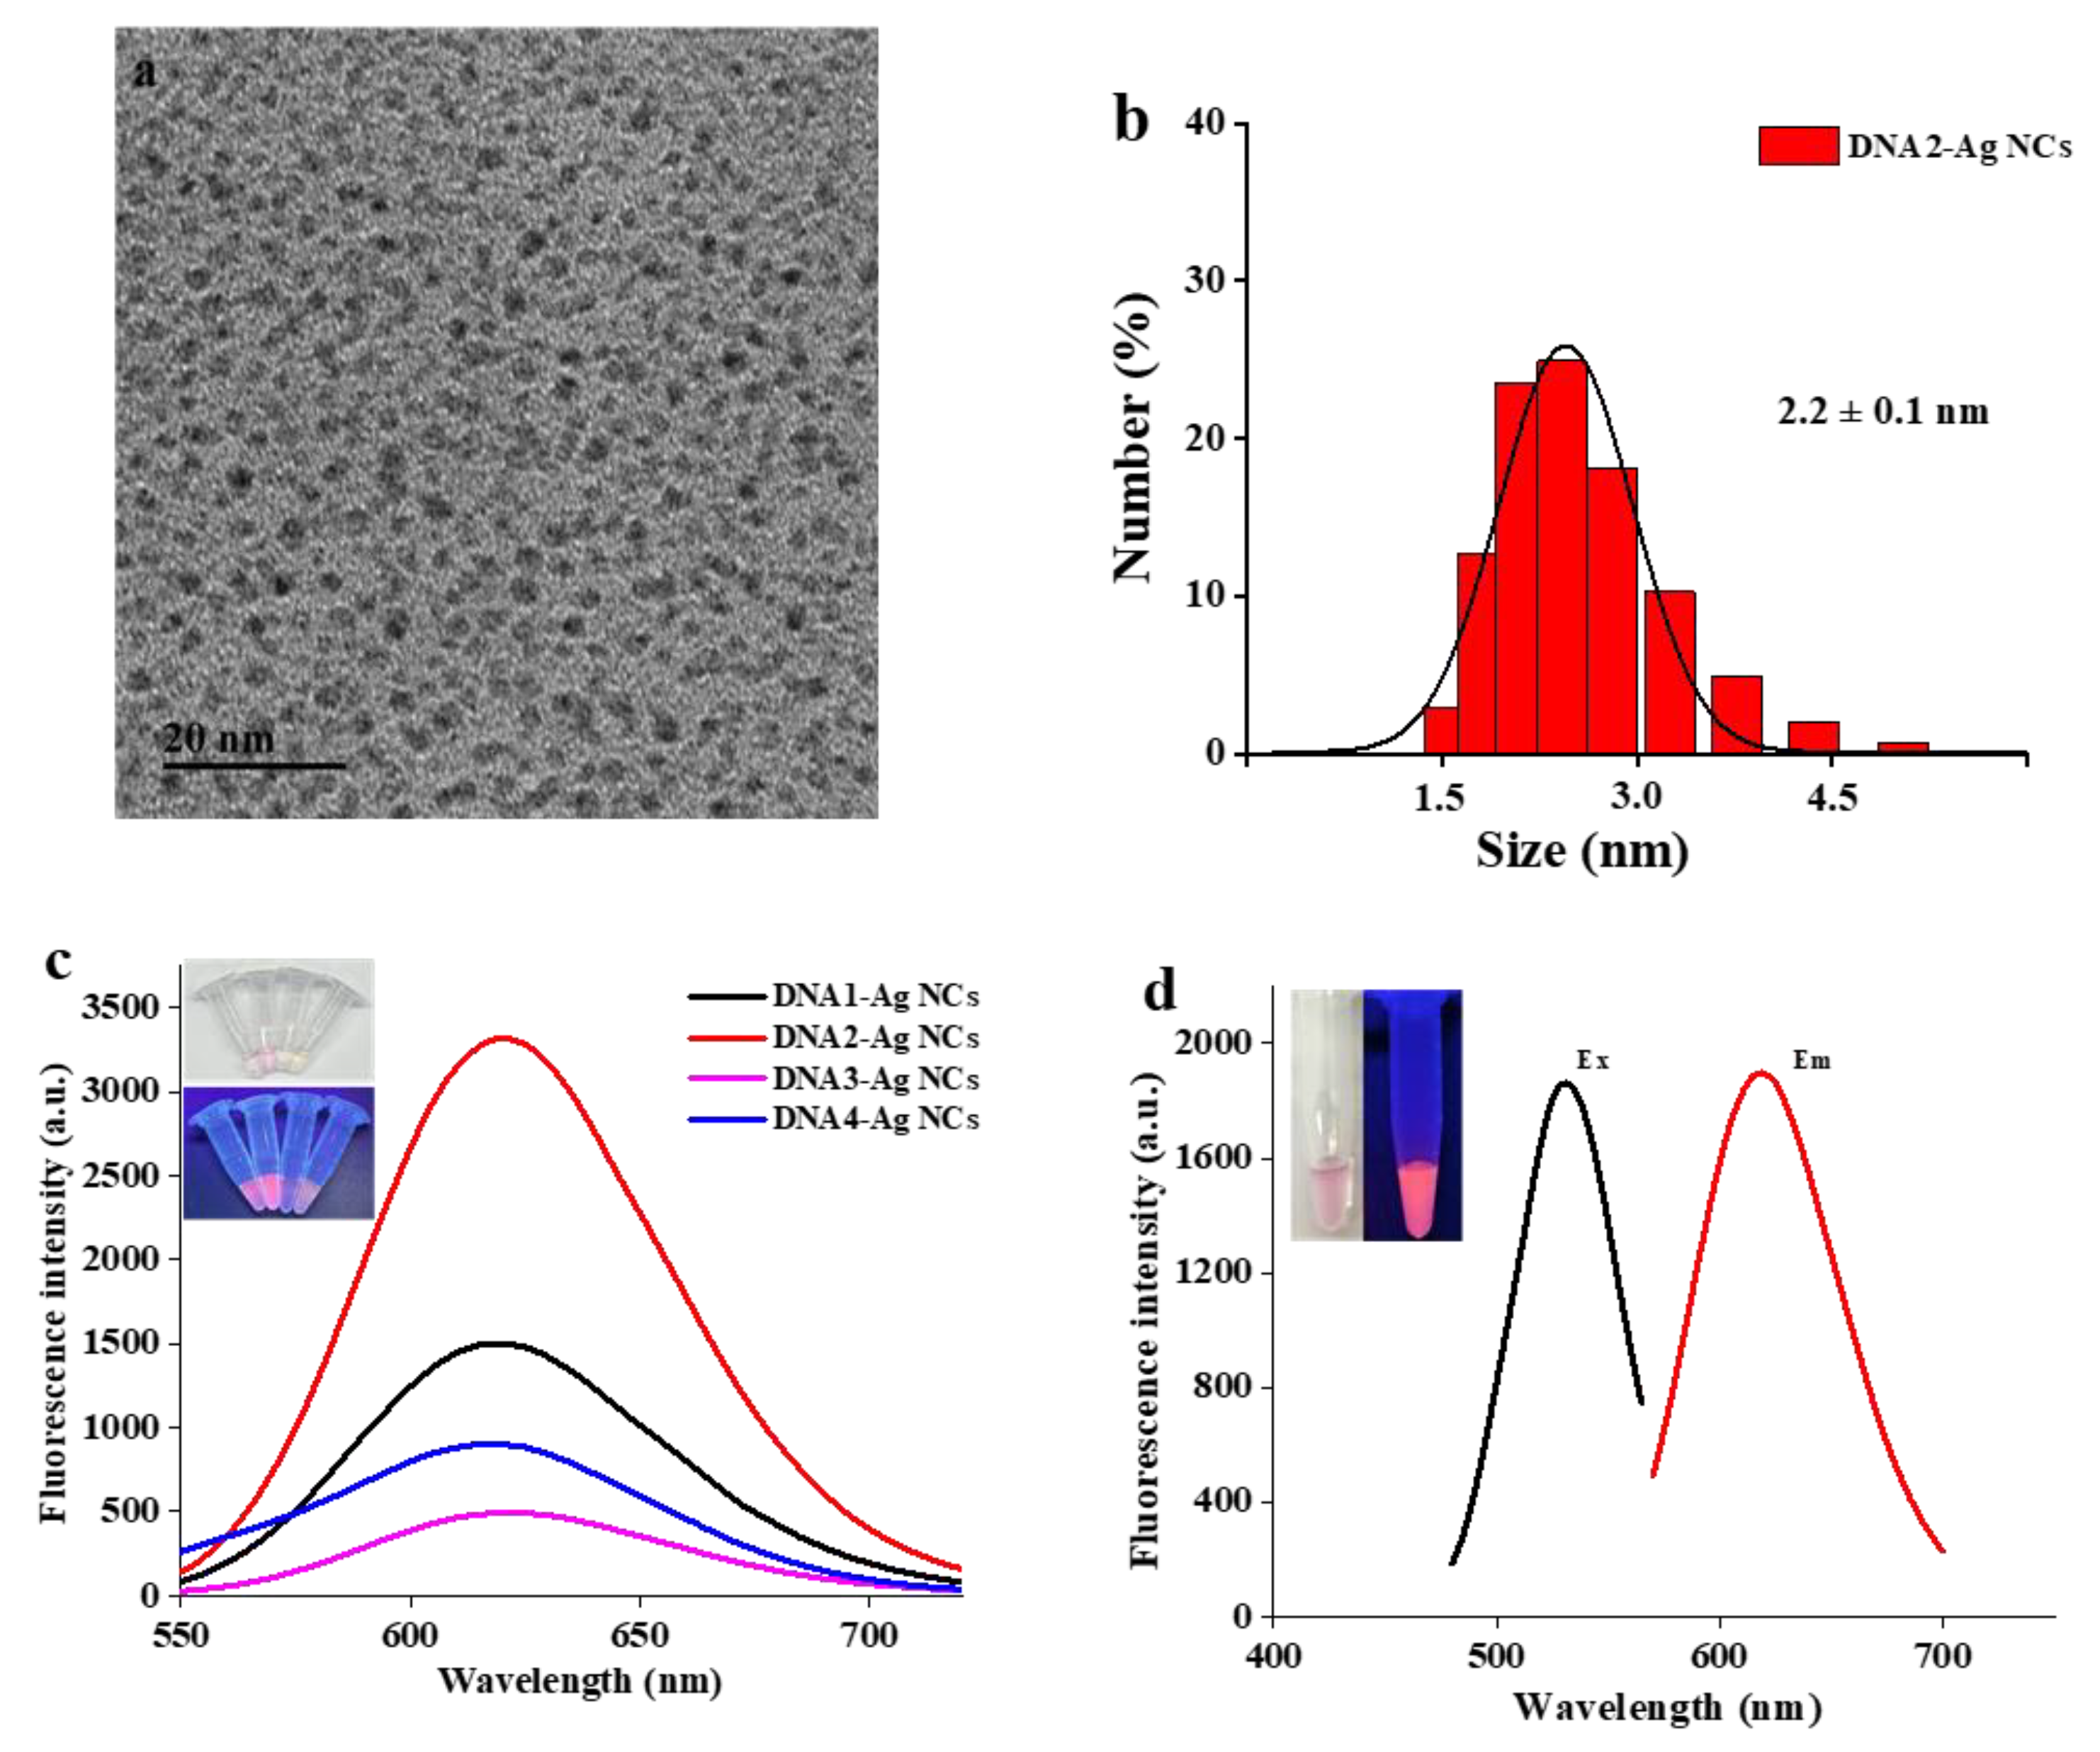
In the presence of ssDNA, DNA-Ag NCs were obtained by reducing AgNO3 with NaBH4. With the C-riched DNA1 template, we obtained Ag NCs with strong and stable fluorescence [26]. In order to obtain brighter Ag NCs, we designed another three ssDNA templates, which were obtained through extending several bases at two ends of the DNA1, and investigated their fluorescence characteristics. As shown in Figure 2b, we found that the fluorescence intensity of T-extended DNA-templated Ag NCs (DNA2-Ag NCs) was enhanced by more than double compared with DNA1-Ag NCs. However, the fluorescence intensities of A-extended (DNA3 Ag-NCs) and G-extended DNA-templated Ag NCs (DNA4-Ag NCs) were much lower than DNA1-Ag NCs. Werner et al. found that the red fluorescence of DNA-Ag NCs could be enhanced 500-fold when placed in proximity to guanine-rich DNA sequences [27]. Zhou et al. found that mixing ssDNA (T20)-templated Ag NCs and assistant DNA-Ag NCs (A20-C55-NC) could generate a new Ag NC luminescence center and promote fluorescence emission through the formation of paratactic parallel double strands after hybridization [28]. However, the fluorescence enhancement of DNA-Ag NCs in our work was obviously different from the above two typical phenomena of DNA-Ag NC enhancement. Considering that the change in the construction and microenvironment of the DNA template would alter the fluorescent characters of DNA-Ag NCs [28], we speculated that the enhanced fluorescence intensity of T-extended Ag NCs (DNA2-Ag NCs) was due to the fact that extended short T-bases could bind with the A-base existing in the C-riched DNA template, which slightly changed the microenvironment of the DNA template. To the best of our knowledgeable, this was the first obvious example of T-extended bases realizing the fluorescence enhancement of DNA-Ag NCs. Therefore, we selected the brightest DNA2-Ag NCs for further experiments.
In order to confirm the formation of DNA2-Ag NCs, the particle size of the synthesized nanoclusters was characterized. As shown in Figure 2a, TEM was employed to characterize the size and morphology of DNA-Ag NCs. The synthesized DNA2-Ag NCs displayed no aggregation and the average particle size was about 1.76 nm. As Figure 2b presents, the average particle size was about 2.2 nm. Compared with the TEM image, the particle size obtained by DLS is slightly larger, because DLS measures the hydrated particle size. It can be seen that the as-prepared DNA2-Ag NCs had uniform particle size distribution and no large aggregate particles were created. For fluorescence performance, the fluorescence spectra showed that the maximum emission wavelength of the DNA2-Ag NCs was 620 nm with an excitation wavelength of 530 nm (Figure 2d). Meanwhile, as shown in Figure S3 (Supplementary Materials), the fluorescence intensity of DNA2-Ag NCs decreased by about 10% in 6 months, indicating that the fluorescence intensity of the DNA2-Ag NCs was stable. Figure S1 presents X-ray photoelectron spectroscopy (XPS) data for the synthesized DNA-Ag NCs. As shown in Figure 1b, binding energy peaks at 368.1 eV and 374.1 eV ascribed to Ag 3d5/2 and Ag 3d3/2 were consistent with the standard reference XPS spectrum of Ag [29,30]. Meanwhile, the binding energy peaks at 402.8 eV in the XPS spectrum of N 1s also indicated binding of Ag and N [31].
3.3. Optimization of the Experimental Conditions
To achieve better sensing results of OPs, different concentration ratios of DNA, NaBH4 and silver ions were investigated for the synthesis of DNA-Ag NCs.
As shown in Figure S2, the fluorescence intensity of DNA-Ag NCs was gradually increased with the increase in silver ion concentration. The highest fluorescence intensity of DNA-Ag NCs was achieved at CDNA:CAg+ = 1:6. Compared with the influence of DNA concentration, the influence of NaBH4 concentration was relatively small. The highest fluorescence intensity of DNA-Ag NCs was obtained at CNaBH4:CAg+ = 1:6. Meanwhile, a higher concentration of NaBH4 caused a decrease in the fluorescence intensity of DNA-Ag NCs.
For the optimal fluorescence detection conditions, the experimental parameters including the concentration of NaOH, hydrolysis temperature, hydrolysis time, and the reaction time between targets and DNA2-Ag NCs were optimized.
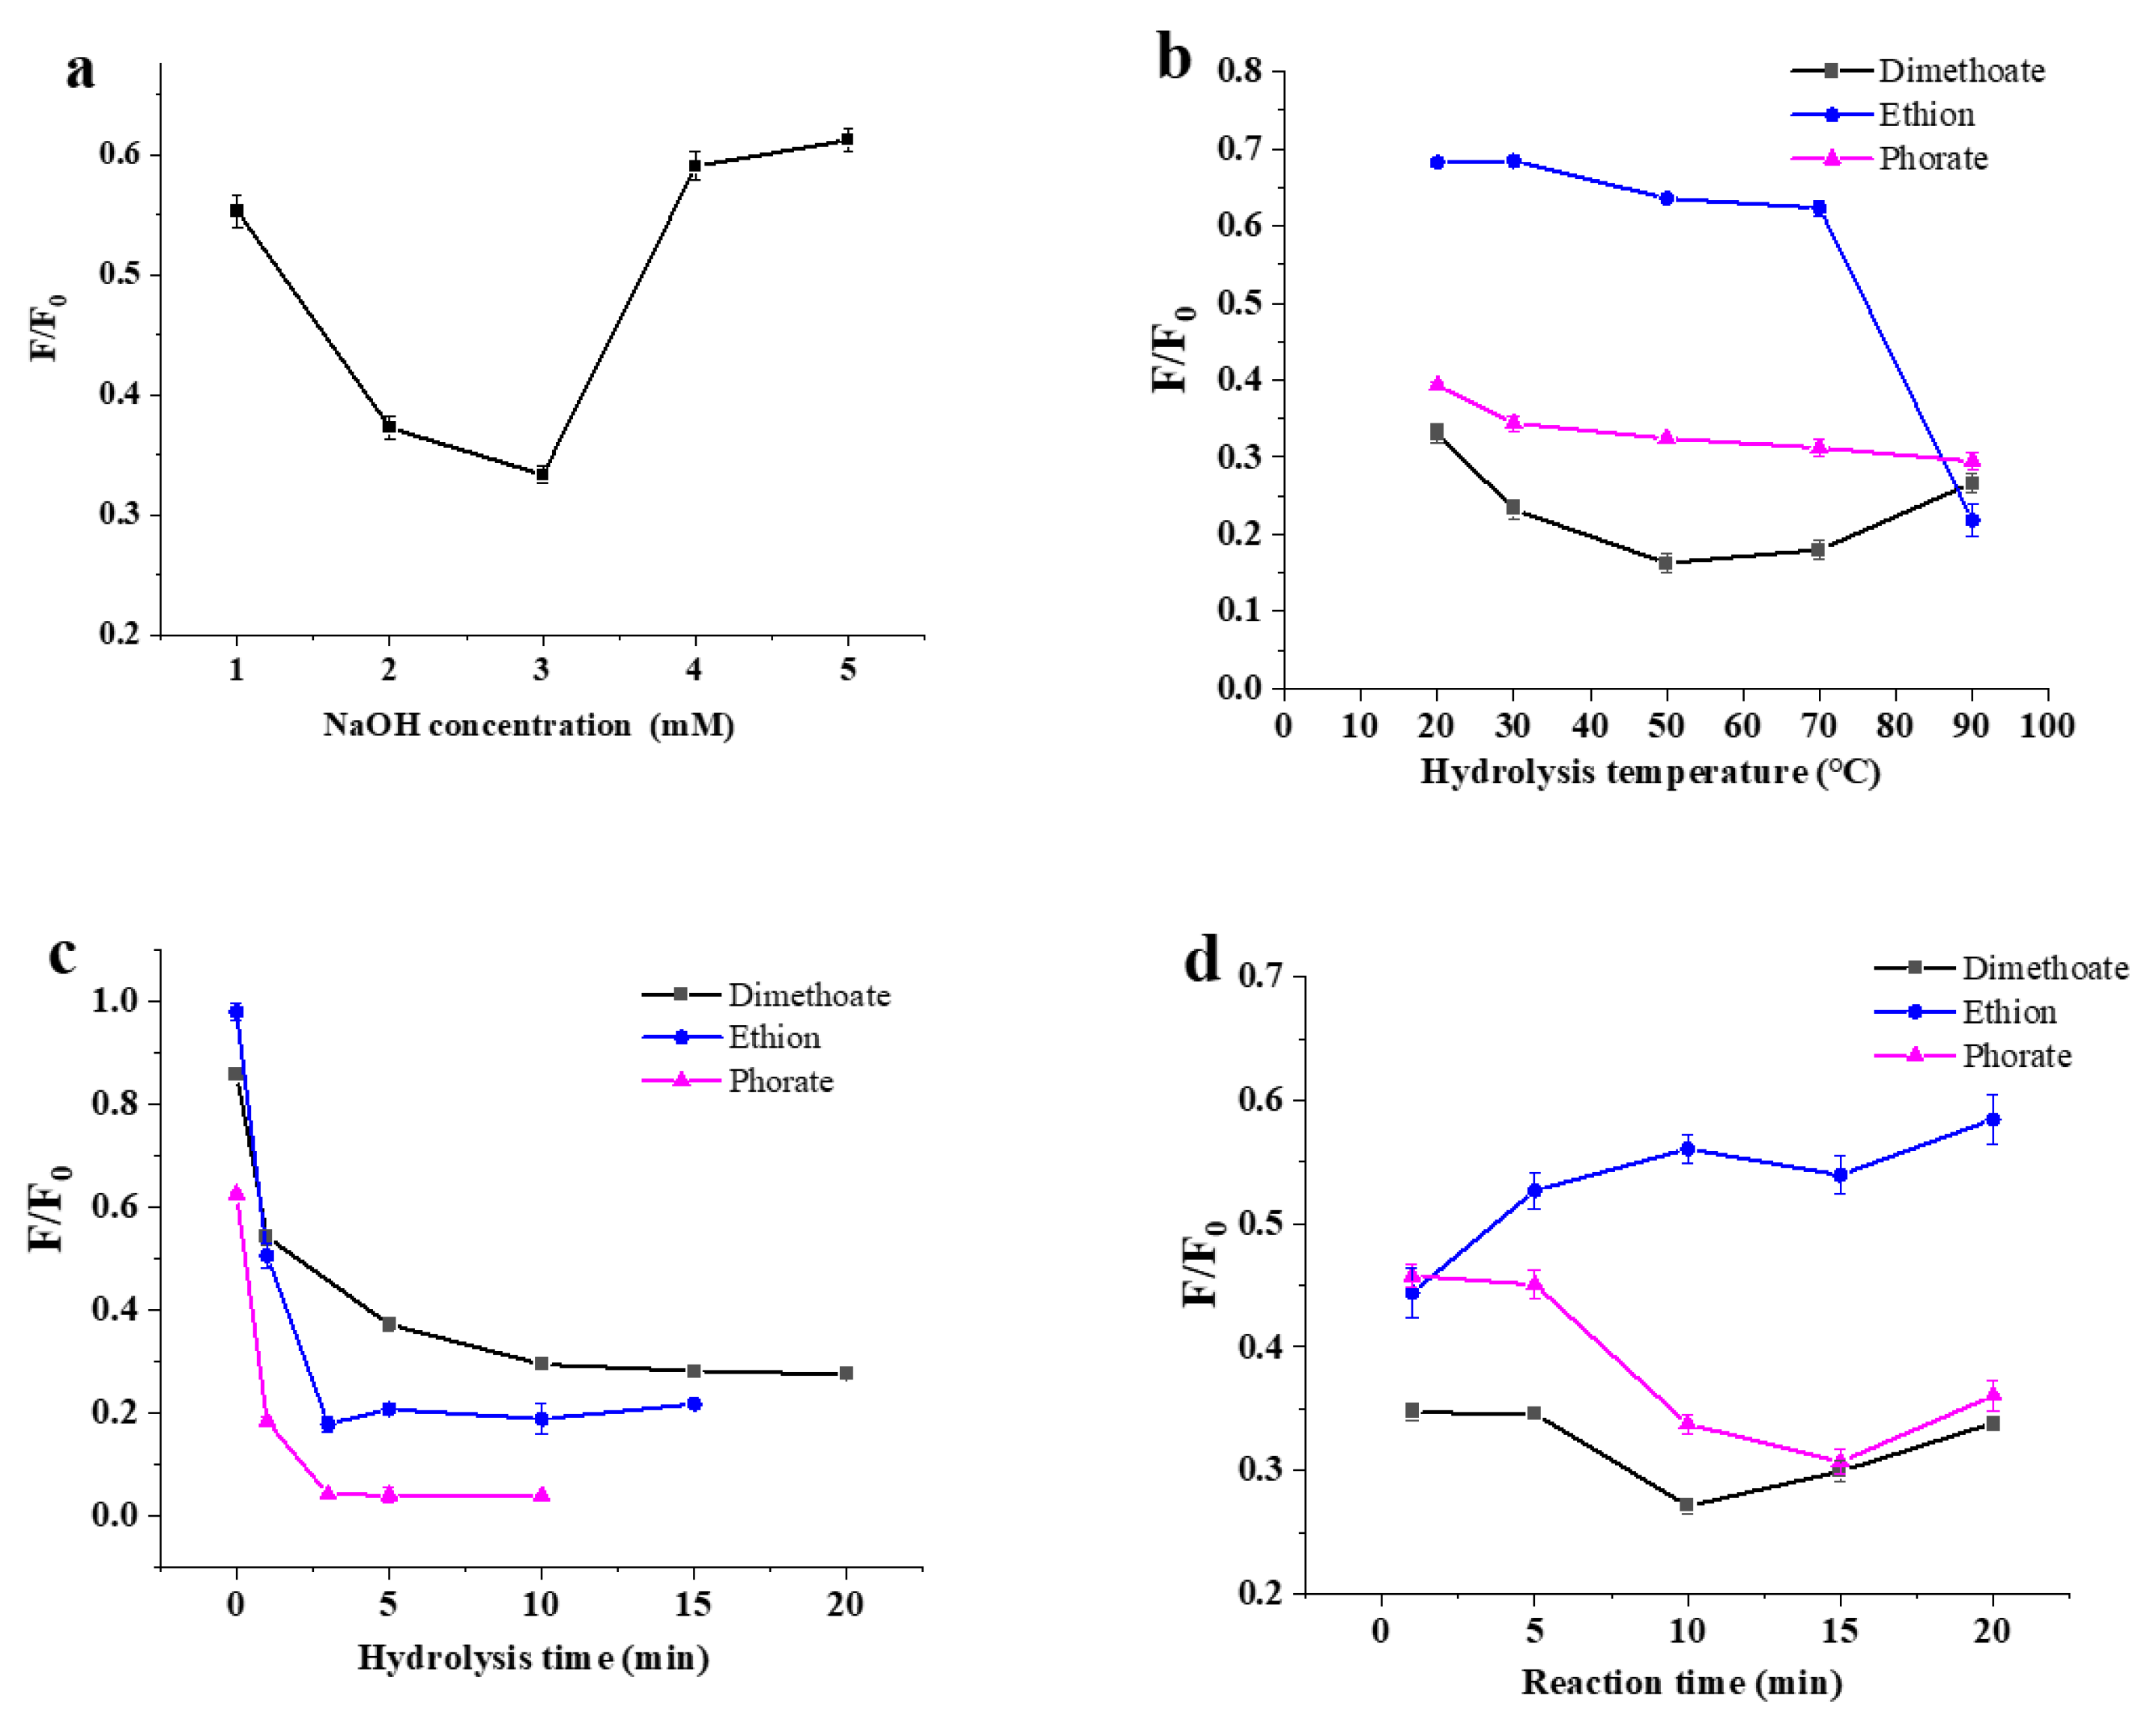
The alkaline environment was provided by an NaOH solution for the hydrolysis of OPs. Pesticides were mixed with the NaOH solution at different concentrations (1, 2, 3, 4 and 5 mM) and hydrolyzed. As displayed in Figure 3a, 3 mM was the optimal NaOH concentration in the hydrolysis of dimethoate, ethion and phorate for the next fluorescent determination. The result was due to the fact that that the low concentration of NaOH could not cause sufficient hydrolysis, while too much NaOH affected the fluorescence stability of the DNA2-Ag NCs. The temperature was an important factor affecting the hydrolysis rate in the alkaline hydrolysis of OPs. As shown in Figure 3b, the F/F0 response to the hydrolysis of phorate was demonstrated by a slow decrease in the temperature fluctuation of 20–90 °C. As for dimethoate, an optimal temperature of 50 °C could be found, although only small F/F0 variations could be observed. Additionally, the F/F0 response to ethion hydrolysate was demonstrated by a sharp decrease in the heating curve from 70 to 90 °C. When the temperature was set at 90 °C, the hydrolysis of the three pesticides was adequate or nearly adequate. Thus, this temperature was selected for the next experiments.
From Figure 3c, it can be found that all the F/F0 values responding to the hydrolysis of the three pesticides sharply decreased within the initial 1–2 min, and were nearly stable after hydrolysis at 3 min. Thus, 3 min could be selected as the appropriate hydrolysis time. The reaction time of the pesticide hydrolysate with the Ag NCs was also investigated. As shown in Figure 3d, the F/F0 values decreased as the reaction progressed, indicating that the fluorescence of DNA-Ag NCs was quenched by three OPs. After a 5 min reaction time, the reaction was relatively stable. Thus, 5 min can be selected as the appropriate condition to conveniently facilitate the detection of the three OPs.
We must consider that although these three pesticides all contain P-S bonds in their structures, there are structural differences between them, which makes hydrolysis difficult and the optimal hydrolysis conditions different.
3.4. Fluorescence Assay of Dimethoate, Ethion and Phorate
Different concentrations were added to study the sensitivity of the fluorescence sensor for the quantitative detection of the three pesticides under optimal conditions. The results are shown in Figure 4. The fluorescence intensity of DNA2-Ag NCs decreased accordingly with the increasing concentration of the three pesticides (Figure 4a,c,e). As shown in Figure 4b, the linear detection of F/F0 versus the dimethoate concentration was obtained in the range of 0.1–4 ng/mL. The linear regression equation for dimethoate was y = 0.9735 − 0.085x, and the correlation coefficient of R2 = 0.992. The LOD was calculated to be 0.05 ng/mL on the basis of 3σ/s (σ refers to the standard deviation of ten blank experiment values and s refers to the slope of the equation). When the ethion concentration was in the range of 0.3–2 µg/mL, the linear regression equation for ethion was y = 0.993 − 0.45x (R2 = 0.991) and the LOD was 0.03 µg/mL (Figure 4d). Figure 4f exhibits the plot of the F/F0 as a function of phorate concentration, and the regression curve was deduced to be y = 0.943 − 3.319x (R2 = 0.998). The linear range for phorate was 0.03–0.25 µg/mL and the LOD was 0.003 µg/mL.
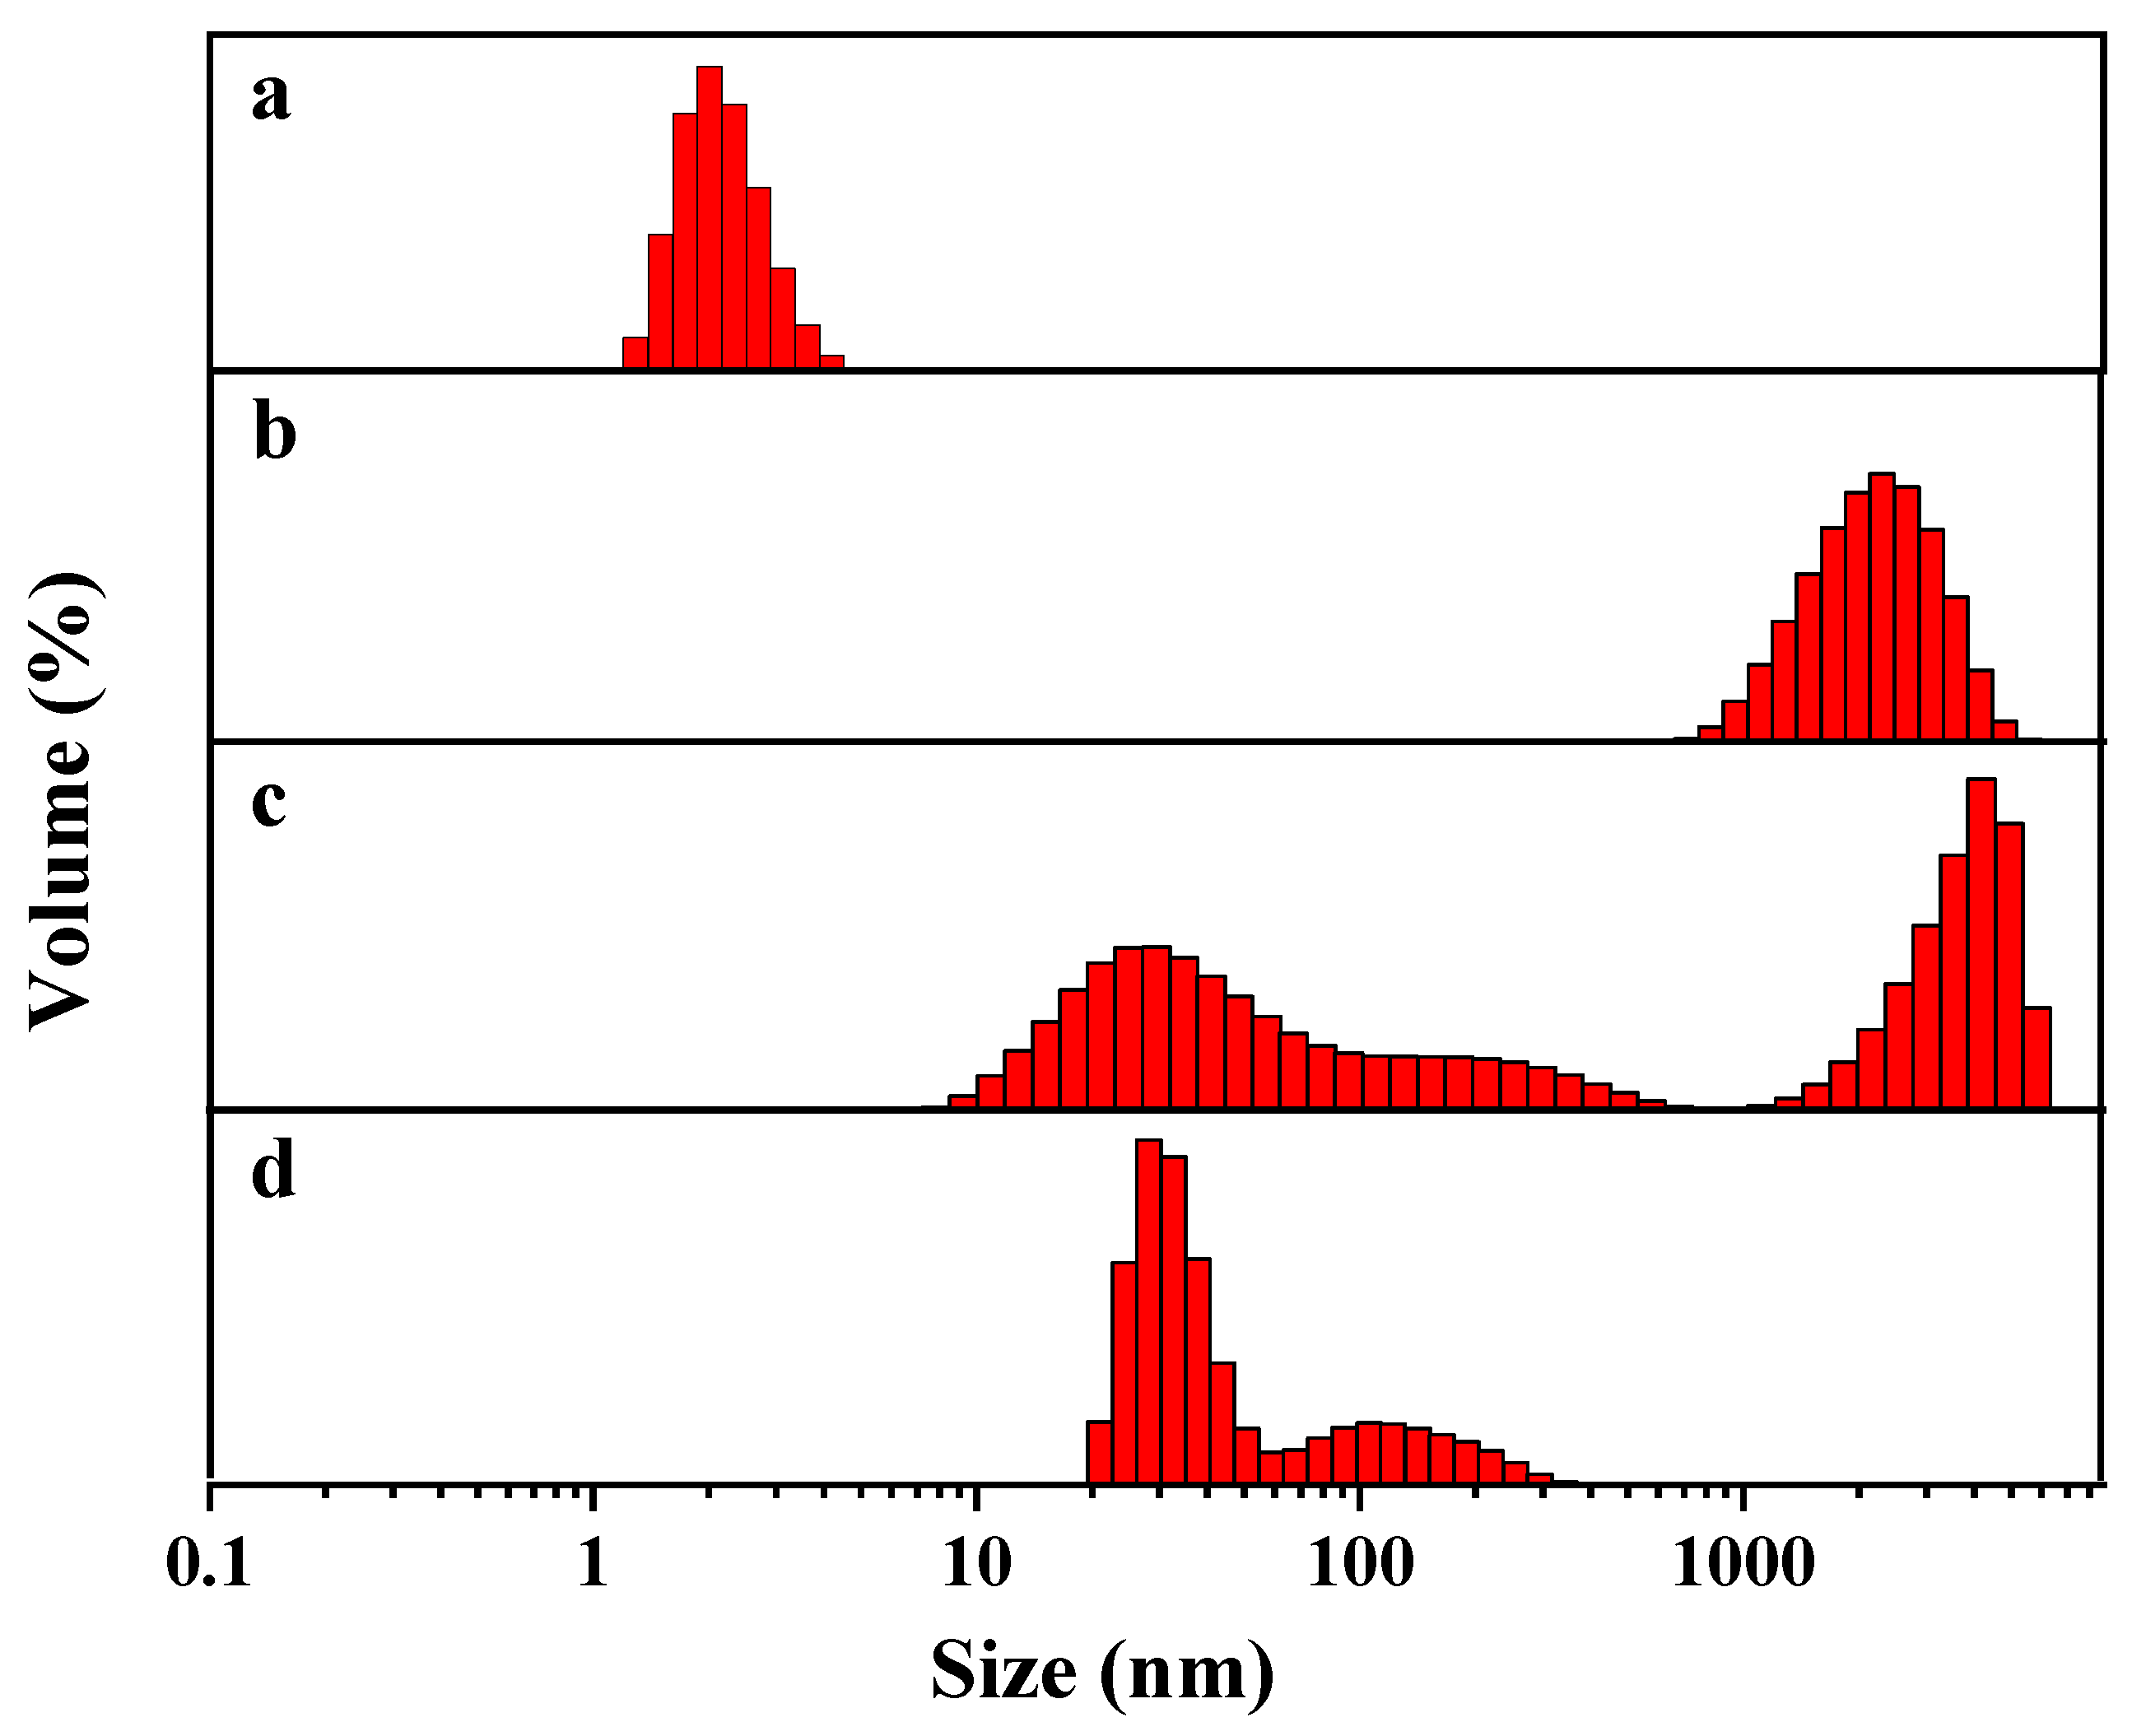
As mentioned above, the hydrolysis of dimethoate, ethion and phorate under alkaline conditions broke the P-S bonds and generated sulfhydryl groups. According to previous reports, the binding of sulfhydryl compounds to silver atoms on the surface of DNA-Ag NCs via Ag-S bonds resulted in the fluorescence quenching of nanoclusters [32]. We speculate that this was due to the aggregation of nanoclusters caused by the hydrolysates, which greatly quenched the fluorescence. The DLS images (Figure 5) indicate that the particle size of DNA2-Ag NCs was about 2 nm. When the hydrolysates of three pesticides were added, the particle size of the nanoclusters became larger and different degrees of aggregation appeared, which was consistent with our speculation.
In addition, this method does not require complex preparation and detection means and is simple to operate, showing more application prospects. There is an overview of its comparison with other previous reported sensors in Table 2, which indicates that the present method possesses remarkable advantages in terms of detection limit and multi-target detection versus reported publications. This sensor could be used for the sensitive analysis of dimethoate, ethion and phorate.
3.5. Selectivity Analysis
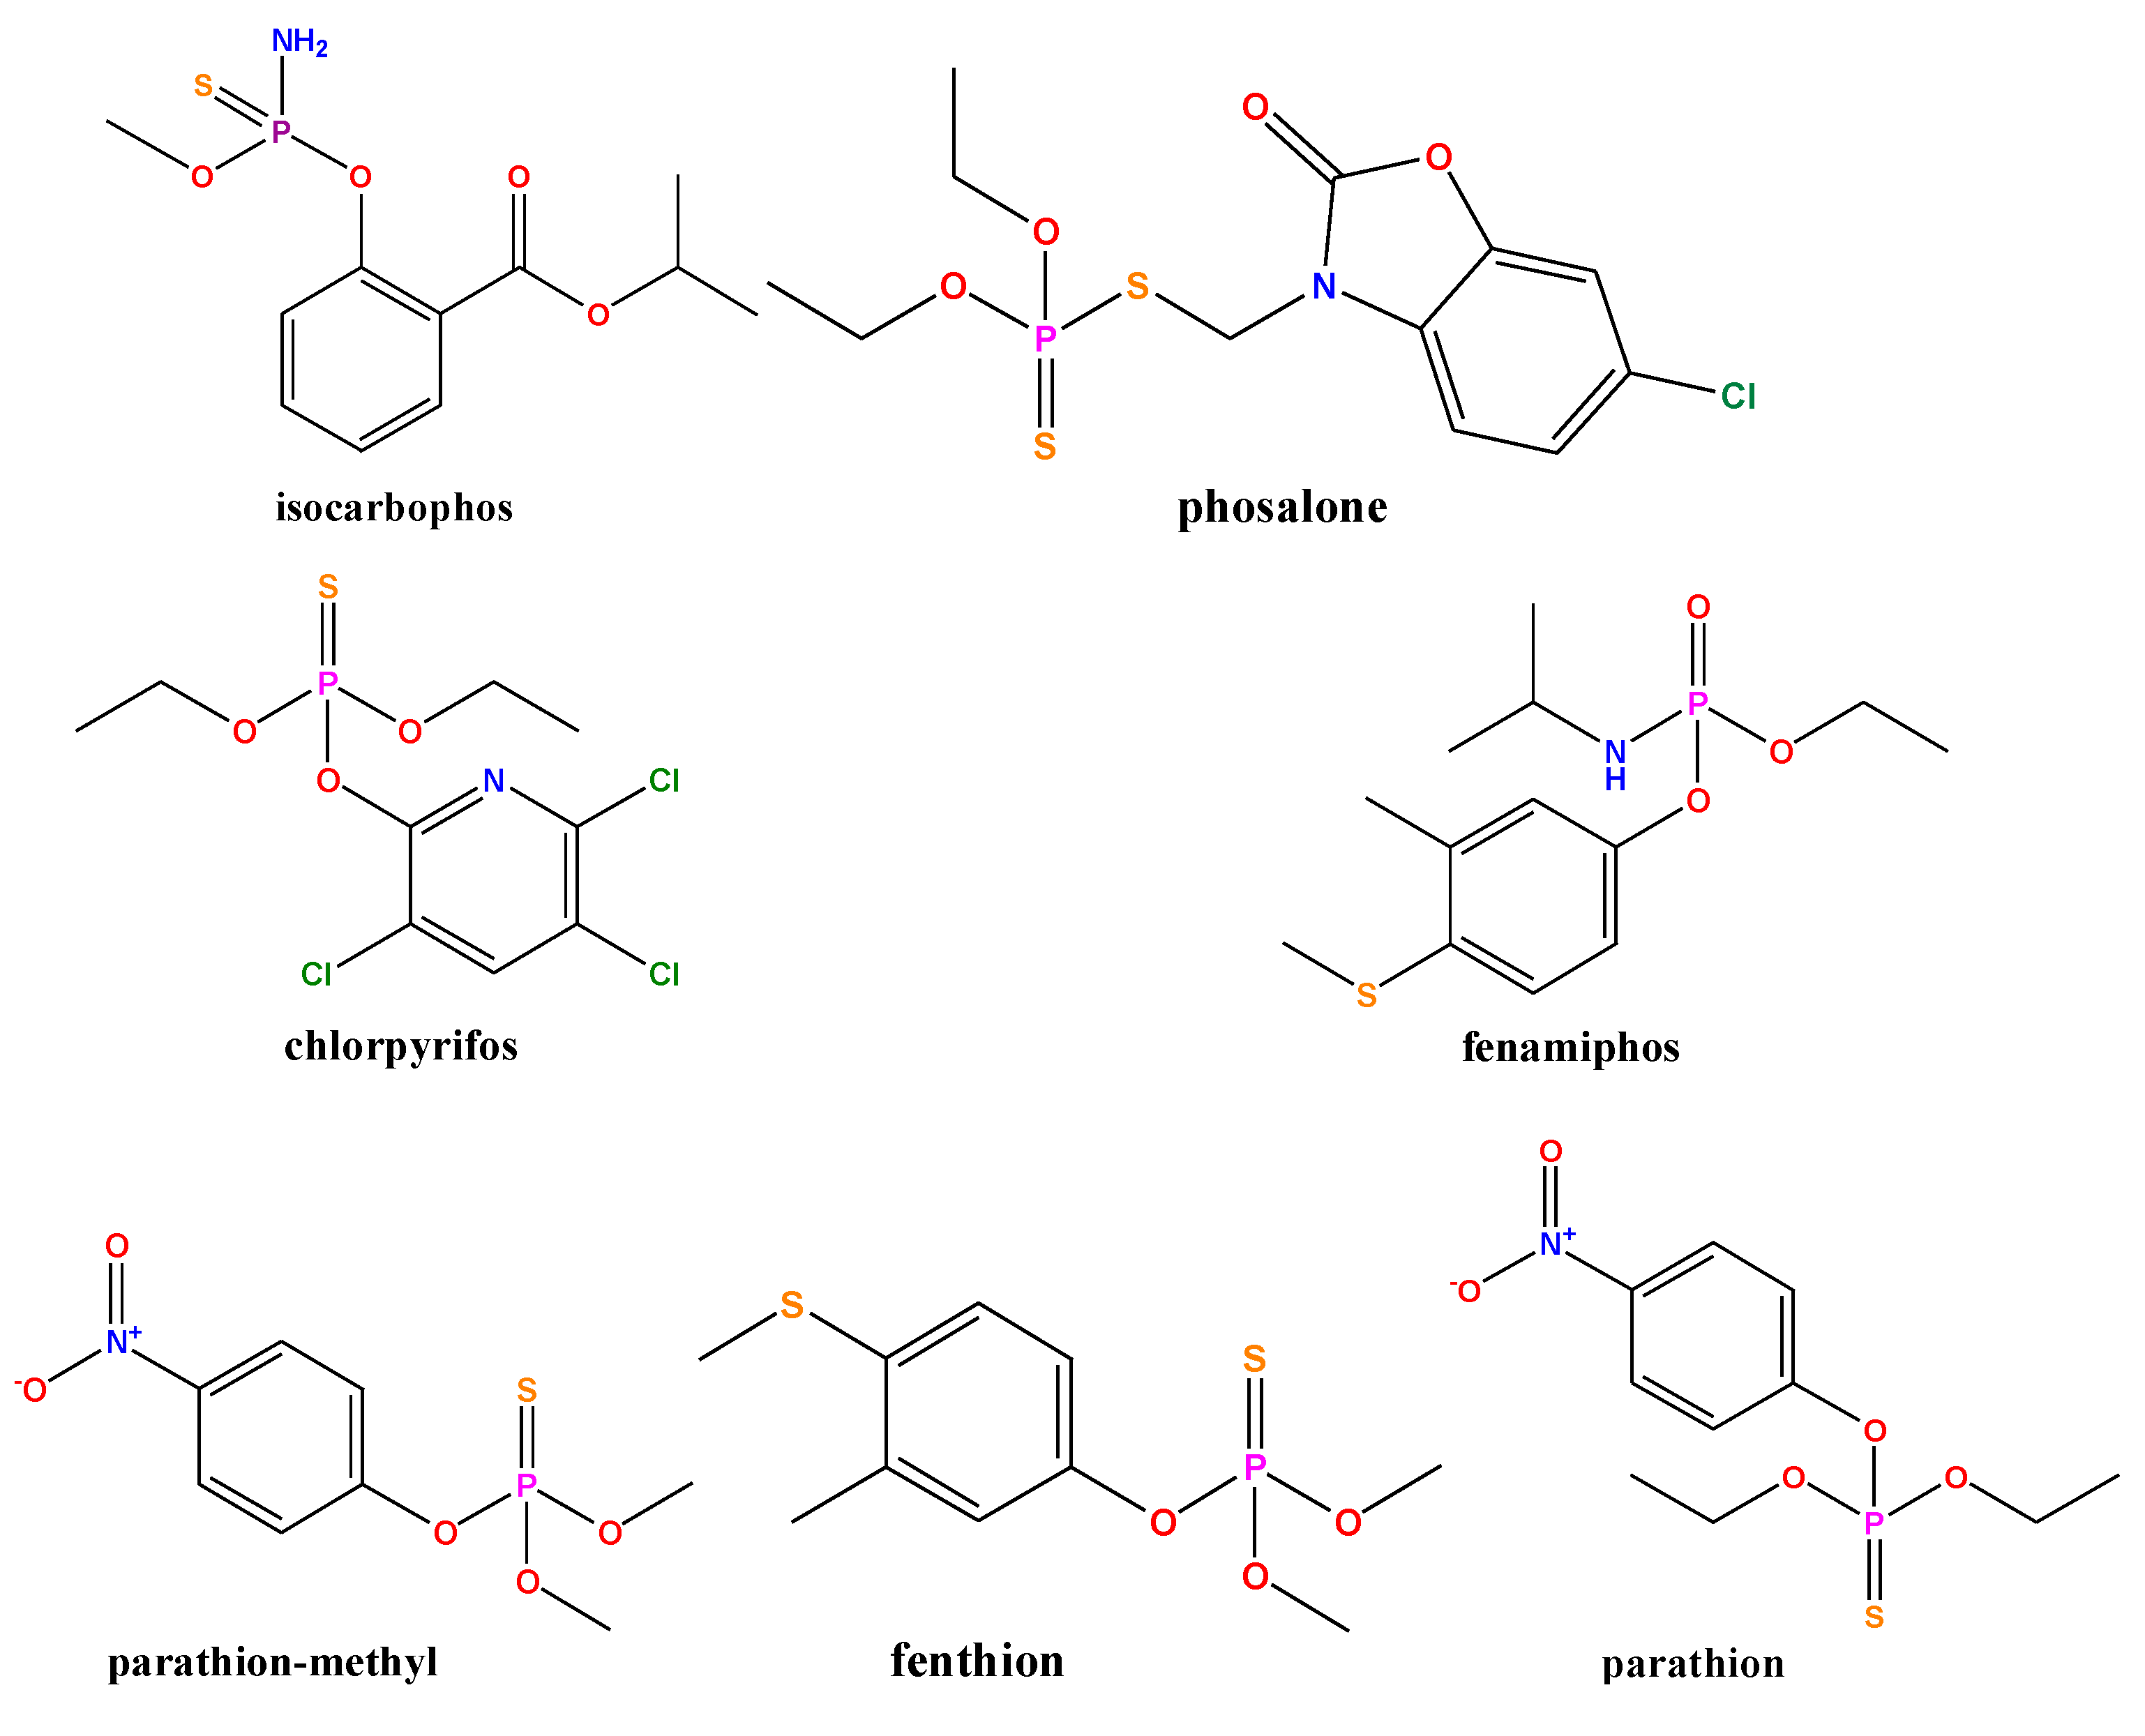
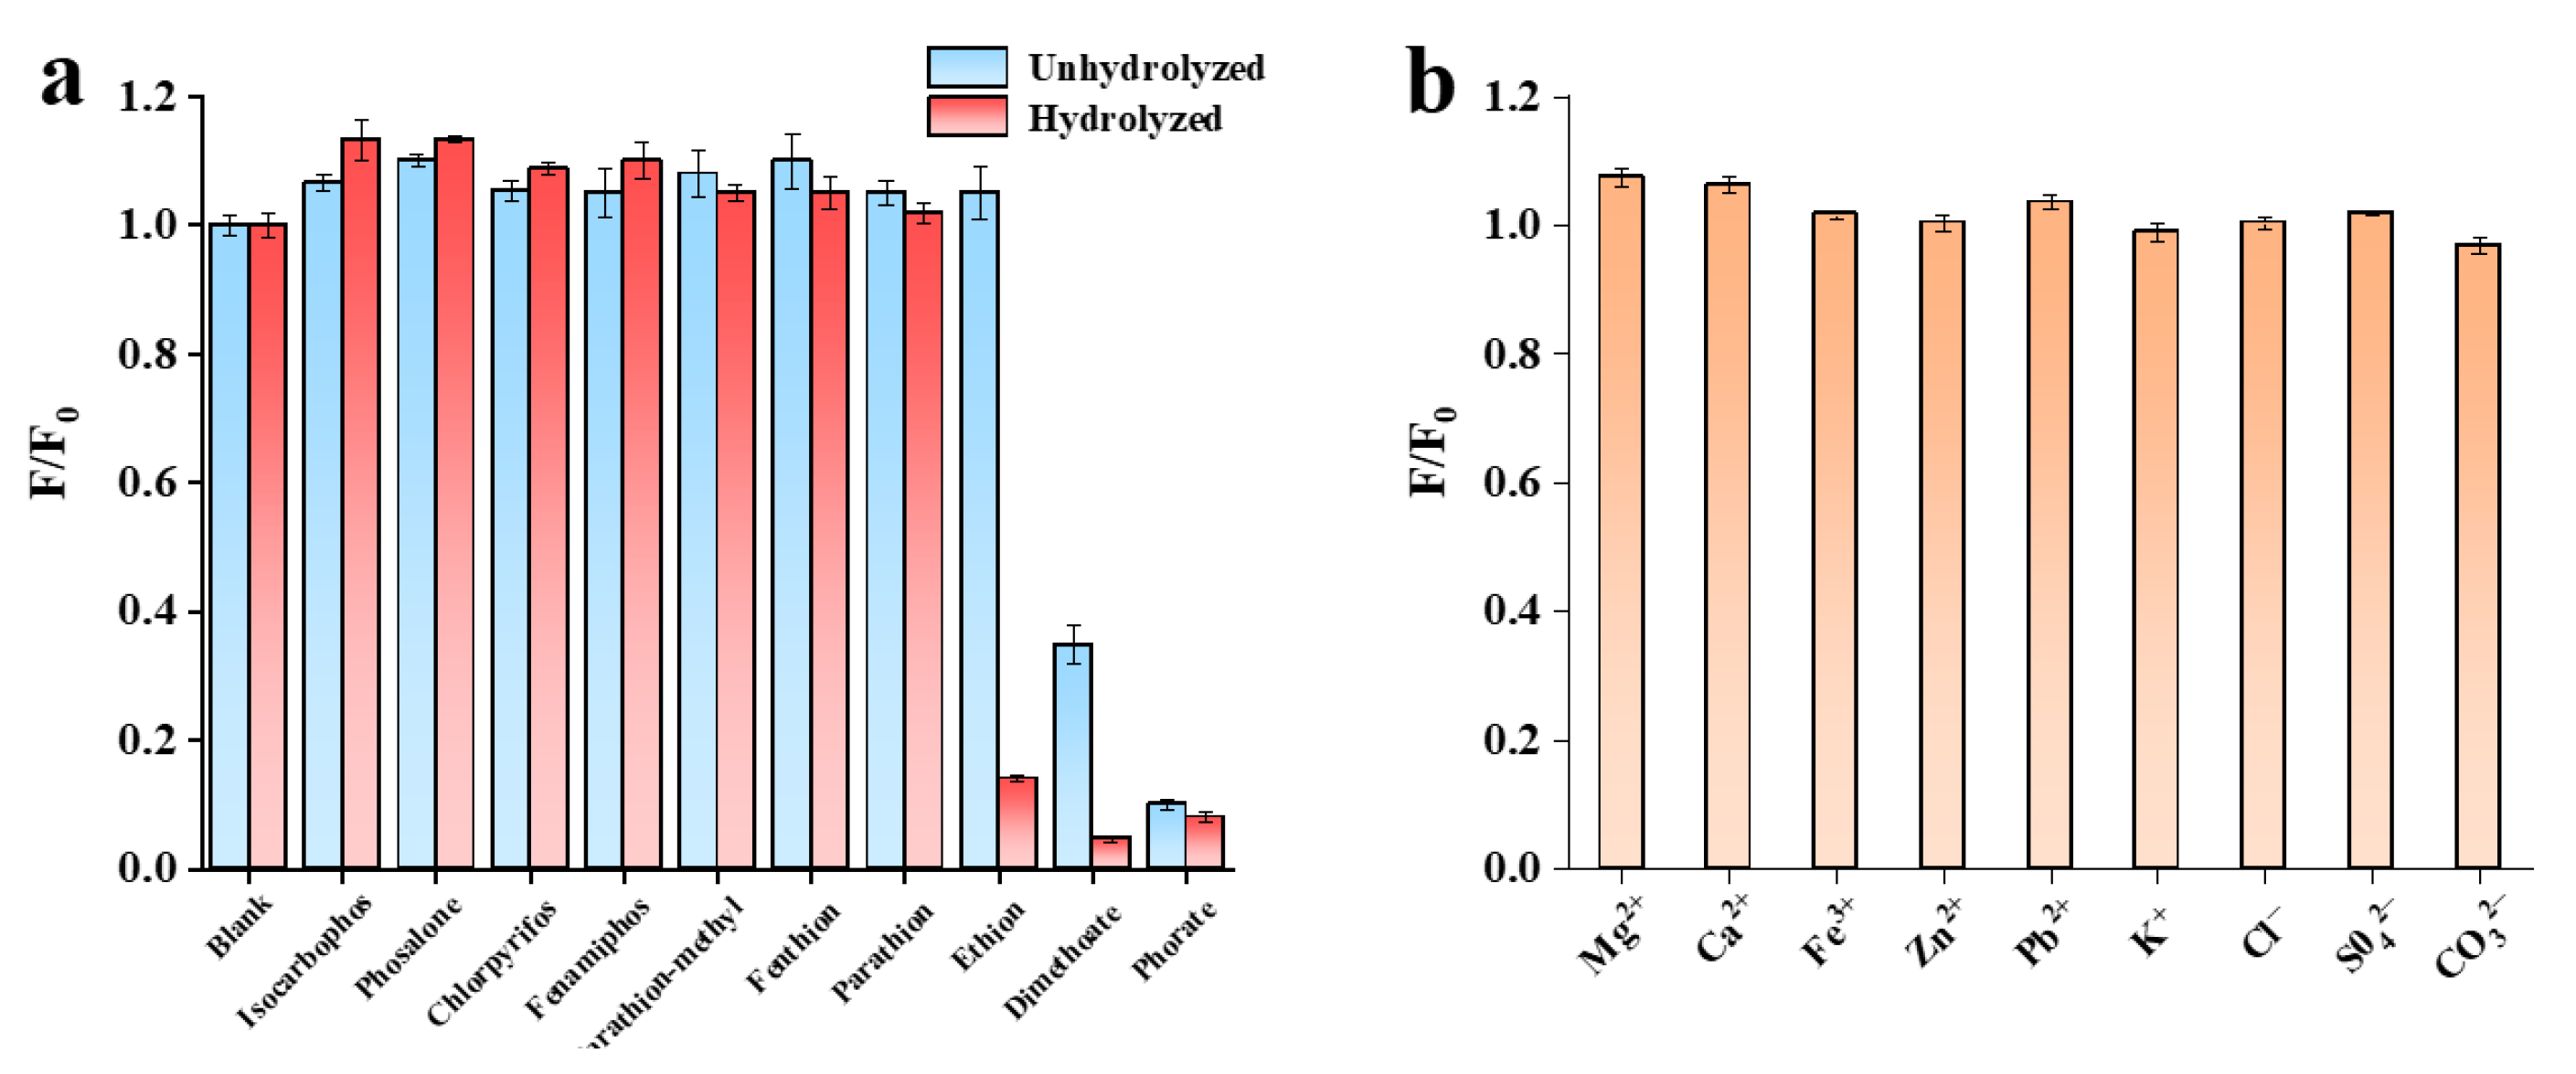
In order to evaluate the selectivity of the developed fluorescence sensor for target detection, another seven pesticides (isocarbophos, phosalone, chlorpyrifos, fenamiphos, parathion-methyl, fenthion, and parathion) were selected (Figure 6). Their structural formulae are shown in Figure 7a. Selectivity experiments were carried out under optimum conditions. The final concentrations of dimethoate, ethion and phorate were 2 µg/mL, five times lower than those of other interfering pesticides. As shown in Figure 7, these high concentrations of phosphate ester pesticides (fenamiphos), thiophosphate ester pesticides (isocarbophos, chlorpyrifos, parathion-methyl, fenthion, and parathion), and thioester phosphate pesticides (phosalone) did not respond to the DNA2-Ag NCs fluorescence system. Only three pesticide targets (dimethoate, ethion, and phorate) could cause fluorescence quenching. The response of DNA2-Ag NCs to dimethoate and ethion were greatly improved by hydrolysis under alkaline conditions. However, the hydrolysis of phorate only slightly enhanced its response. The reason could be due to the interaction between silver and sulfur also resulting in the breakage of the thioether bond in the phorate molecule, and the production of thiol [41]. Thus, the hydrolysis-based fluorescent detection had good selectivity for OPs containing P-bonds. We added some common anions and cations (100 μM) in the selective analysis experiment. As shown in Figure 7b, compared with the three OPs (2 µg/mL), a much higher concentration of interfering ions did not cause fluorescence quenching, indicating that the proposed method has good ion anti-interference ability.
3.6. Detection of Dimethoate, Ethion and Phorate in Real Samples
To verify the practical application of the DNA2-Ag NC fluorescence sensor for the lake water samples spiked with different concentrations of dimethoate, ethion and phorate were tested with the above fluorescent method. The results in Table 3 showed that the average recovery ranges for dimethoate, ethion, and phorate detection were 89–105%, 97–110% and 90–110%, and the relative standard deviations were 2.1–8%, 3.5–7.2% and 4.0–9.5%, respectively. These results indicate that the proposed fluorescence sensor is a promising application prospect for dimethoate, ethion and phorate detection in real water samples with high accuracy and reliability.
4. Conclusions
In this work, we obtained the Ag NCs with a stronger fluorescence intensity by extending T bases at two ends of an original C-riched DNA template. Based on this, a fluorescence sensor was successfully designed for dimethoate, ethion and phorate detection. In this sensor, DNA-Ag NCs combined with the hydrolysates of these pesticides under alkaline conditions and formed non-fluorescent polymers by Ag-S bonds, which could effectively quench the fluorescence emission of DNA-Ag NCs. Under optimum conditions, the LODs of dimethoate, ethion and phorate reached 0.05 ng/mL, 30 ng/mL and 3 ng/mL, respectively. The developed fluorescence sensor showed good sensitivity and selectivity of OPs containing P-S bonds, and had satisfactory recovery levels in lake water samples. Hence, our proposed sensor is a potential tool that can achieve the sensitive detection of residues of three OPs in real samples with a low cost and simple operation.
Supplementary Materials
The following supporting information can be downloaded at: https://www.mdpi.com/article/10.3390/bios13050520/s1, Figure S1: (a) The whole XPS spectrum (b) Ag 3d (c) N1s XPS spectrum of DNA2-Ag NCs; Figure S2: Optimization of synthesis conditions of DNA2-Ag NCs; Figure S3: The stability of DNA2-Ag NCs.
Author Contributions
G.L.: Methodology, formal analysis, investigation, and writing—original draft; X.H.: Formal analysis, investigation, and validation; C.P.: Conceptualization, writing—review and editing, supervision, and funding acquisition. F.S.: Supervision, writing, and funding acquisition. All authors have read and agreed to the published version of the manuscript.
Funding
This work was supported by the National Key Research and Development Program (2022YFD2101105) and the National Natural Science Foundation of China (31871879).
Institutional Review Board Statement
Not applicable.
Informed Consent Statement
Not applicable.
Data Availability Statement
All data generated or analyzed during this study are included in the published article.
Acknowledgments
The work was supported by the National Key Research and Development Program (2022YFD2101105) and the National Natural Science Foundation of China (31871879).
Conflicts of Interest
The authors declare no conflict of interest.
References
- Pundir, C.S.; Malik, A.; Preety. Bio-sensing of organophosphorus pesticides: A review. Biosens. Bioelectron. 2019, 140, 111348. [Google Scholar] [CrossRef]
- Wang, J.; Zhang, J.; Wang, J.; Fang, G.; Liu, J.; Wang, S. Fluorescent peptide probes for organophosphorus pesticides detection. J. Hazard. Mater. 2020, 389, 122074. [Google Scholar] [CrossRef]
- Nemati, F.; Hosseini, M.; Zare-Dorabei, R.; Ganjali, M.R. Sensitive recognition of ethion in food samples using turn-on fluorescence N and S co-doped graphene quantum dots. Anal. Methods 2018, 10, 1760–1766. [Google Scholar] [CrossRef]
- Yang, L.; Zhang, X.; Jiang, L. Determination of Organophosphorus Pesticides in Fortified Tomatoes by Fluorescence Quenching of Cadmium Selenium–Zinc Sulfide Quantum Dots. Anal. Lett. 2018, 52, 729–744. [Google Scholar] [CrossRef]
- Cao, J.; Wang, M.; Yu, H.; She, Y.; Cao, Z.; Ye, J.; Abd El-Aty, A.M.; Hacımüftüoğlu, A.; Wang, J.; Lao, S. An Overview on the Mechanisms and Applications of Enzyme Inhibition-Based Methods for Determination of Organophosphate and Carbamate Pesticides. J. Agric. Food Chem. 2020, 68, 7298–7315. [Google Scholar] [CrossRef]
- Ma, L.; He, Y.; Wang, Y.; Wang, Y.; Li, R.; Huang, Z.; Jiang, Y.; Gao, J. Nanocomposites of Pt nanoparticles anchored on UiO66-NH2 as carriers to construct acetylcholinesterase biosensors for organophosphorus pesticide detection. Electrochim. Acta 2019, 318, 525–533. [Google Scholar] [CrossRef]
- Yan, X.; Kong, D.; Jin, R.; Zhao, X.; Li, H.; Liu, F.; Lin, Y.; Lu, G. Fluorometric and colorimetric analysis of carbamate pesticide via enzyme-triggered decomposition of Gold nanoclusters-anchored MnO2 nanocomposite. Sens. Actuators B Chem. 2019, 290, 640–647. [Google Scholar] [CrossRef]
- Yan, X.; Li, H.; Hu, T.; Su, X. A novel fluorimetric sensing platform for highly sensitive detection of organophosphorus pesticides by using egg white-encapsulated gold nanoclusters. Biosens. Bioelectron. 2017, 91, 232–237. [Google Scholar] [CrossRef] [PubMed]
- Wu, X.; Song, Y.; Yan, X.; Zhu, C.; Ma, Y.; Du, D.; Lin, Y. Carbon quantum dots as fluorescence resonance energy transfer sensors for organophosphate pesticides determination. Biosens. Bioelectron. 2017, 94, 292–297. [Google Scholar] [CrossRef] [PubMed]
- Yan, X.; Li, H.; Wang, X.; Su, X. A novel fluorescence probing strategy for the determination of parathion-methyl. Talanta 2015, 131, 88–94. [Google Scholar] [CrossRef] [PubMed]
- Bao, J.; Hou, C.; Zhang, Y.; Li, Q.; Huo, D.; Yang, M.; Luo, X. A Non-Enzymatic Glucose Sensor based on Copper Oxide Nanowires-Single Wall Carbon Nanotubes. J. Electrochem. Soc. 2014, 162, B47–B51. [Google Scholar] [CrossRef]
- Yan, X.; Li, H.; Yan, Y.; Su, X. Selective detection of parathion-methyl based on near-infrared CuInS2 quantum dots. Food Chem. 2015, 173, 179–184. [Google Scholar] [CrossRef]
- Yi, Y.; Zeng, W.; Zhu, G. β-Cyclodextrin functionalized molybdenum disulfide quantum dots as nanoprobe for sensitive fluorescent detection of parathion-methyl. Talanta 2021, 222, 121703. [Google Scholar] [CrossRef]
- Liu, L.; Qian, M.; Sun, H.; Yang, Z.-Q.; Xiao, L.; Gong, X.; Hu, Q. A highly sensitive fluorescence probe for methyl parathion detection in vegetable and fruit samples based on N and S co-doped carbon dots. J. Food Compos. Anal. 2022, 107, 104374. [Google Scholar] [CrossRef]
- Zhang, J.; Wang, J.; Yang, L.; Liu, B.; Guan, G.; Jiang, C.; Zhang, Z. Ligand replacement induced chemiluminescence for selective detection of an organophosphorus pesticide using bifunctional Au-Fe3O4 dumbbell-like nanoparticles. Chem. Commun. 2014, 50, 15870–15873. [Google Scholar] [CrossRef]
- Pan, J.; Zheng, Z.; Yang, J.; Wu, Y.; Lu, F.; Chen, Y.; Gao, W. A novel and sensitive fluorescence sensor for glutathione detection by controlling the surface passivation degree of carbon quantum dots. Talanta 2017, 166, 1–7. [Google Scholar] [CrossRef]
- Lai, K.; Stolowich, N.J.; Wild, J.R. Characterization of P-S Bond Hydrolysis in Organophosphorothioate Pesticides by Organophosphorus Hydrolase. Arch. Biochem. Biophys. 1995, 318, 59–64. [Google Scholar] [CrossRef]
- Wang, R.; Yan, X.; Sun, J.; Wang, X.; Zhao, X.-E.; Liu, W.; Zhu, S. Cu2+ modulated DNA-templated silver nanoclusters as a turn-on fluorescence probe for the detection of quinolones. Anal. Methods 2018, 10, 4183–4188. [Google Scholar] [CrossRef]
- Yang, Y.; Ghalandari, B.; Lin, L.; Sang, X.; Su, W.; Divsalar, A.; Ding, X. A turn-on fluorescence sensor based on Cu(2+) modulated DNA-templated silver nanoclusters for glyphosate detection and mechanism investigation. Food Chem. 2022, 367, 130617. [Google Scholar] [CrossRef]
- Liu, J. DNA-stabilized, fluorescent, metal nanoclusters for biosensor development. TrAC Trends Anal. Chem. 2014, 58, 99–111. [Google Scholar] [CrossRef]
- Wu, J.; Fu, Y.; He, Z.; Han, Y.; Zheng, L.; Zhang, J.; Li, W. Growth mechanisms of fluorescent silver clusters regulated by polymorphic DNA templates: A DFT study. J. Phys. Chem. B 2012, 116, 1655–1665. [Google Scholar] [CrossRef] [PubMed]
- Petty, J.T.; Zheng, J.; Hud, N.V.; Dickson, R.M. DNA-Templated Ag Nanocluster Formation. JACS 2004, 126, 5207–5212. [Google Scholar] [CrossRef] [PubMed]
- New, S.Y.; Lee, S.T.; Su, X.D. DNA-templated silver nanoclusters: Structural correlation and fluorescence modulation. Nanoscale 2016, 8, 17729–17746. [Google Scholar] [CrossRef] [PubMed]
- Lan, S.; Wang, X.; Liu, Q.; Bao, J.; Yang, M.; Fa, H.; Hou, C.; Huo, D. Fluorescent sensor for indirect measurement of methyl parathion based on alkaline-induced hydrolysis using N-doped carbon dots. Talanta 2019, 192, 368–373. [Google Scholar] [CrossRef]
- Koo, I.S.; Ali, D.; Yang, K.; Vanloon, G.W.; Buncel, E. Theoretical and Experimental P-31 NMR and ESI-MS Study of Hg2+ Binding to Fenitrothion. Bull. Korean Chem. Soc. 2009, 30, 1257–1261. [Google Scholar] [CrossRef]
- Cheng, Y.; Li, G.; Huang, X.; Qian, Z.; Peng, C. Label-Free Fluorescent Turn-On Glyphosate Sensing Based on DNA-Templated Silver Nanoclusters. Biosensors 2022, 12, 832. [Google Scholar] [CrossRef]
- Yeh, H.C.; Sharma, J.; Han, J.J.; Martinez, J.S.; Werner, J.H. A DNA--silver nanocluster probe that fluoresces upon hybridization. Nano Lett. 2010, 10, 3106–3110. [Google Scholar] [CrossRef]
- Zhou, W.; Zhu, J.; Fan, D.; Teng, Y.; Zhu, X.; Dong, S. A Multicolor Chameleon DNA-templated Silver Nanocluster and Its Application for Ratiometric Fluorescence Target Detection with Exponential Signal Response. Adv. Funct. Mater. 2017, 27, 1704092. [Google Scholar] [CrossRef]
- Kumar, M.; Deka, S. Multiply twinned AgNi alloy nanoparticles as highly active catalyst for multiple reduction and degradation reactions. ACS Appl. Mater. Interfaces 2014, 6, 16071–16081. [Google Scholar] [CrossRef]
- Yao, J.; Quan, Y.; Gao, M.; Gao, R.; Chen, L.; Liu, Y.; Lang, J.; Shen, H.; Zhang, Y.; Yang, L.; et al. AgNPs decorated Mg-doped ZnO heterostructure with dramatic SERS activity for trace detection of food contaminants. J. Mater. Chem. C 2019, 7, 8199–8208. [Google Scholar] [CrossRef]
- Zhou, Y.; Zheng, Y.; Zhu, X.; Chai, Y.; Yuan, R. Modular engineering of gold-silver nanocluster supermolecular structure endow strong electrochemiluminescence for ultrasensitive bioanalysis. Biosens. Bioelectron. 2021, 190, 113449. [Google Scholar] [CrossRef]
- Li, C.; Wei, C. DNA-functionlized silver nanoclusters as label-free fluorescent probe for the highly sensitive detection of biothiols and acetylcholinesterase activity. Sens. Actuators B Chem. 2017, 240, 451–458. [Google Scholar] [CrossRef]
- Hu, Y.; Wang, J.; Wu, Y. A simple and rapid chemosensor for colorimetric detection of dimethoate pesticide based on the peroxidase-mimicking catalytic activity of gold nanoparticles. Anal. Methods 2019, 11, 5337–5347. [Google Scholar] [CrossRef]
- Zhan, X.; Tang, Y.; Liu, Y.; Tao, H.; Wu, Y. A novel colorimetric strategy for rapid detection of dimethoate residue in vegetables based on enhancing oxidase-mimicking catalytic activity of cube-shape Ag2O particles. Sens. Actuators B Chem. 2022, 361, 131720. [Google Scholar] [CrossRef]
- Shen, Z.; Xu, D.; Wang, G.; Geng, L.; Xu, R.; Wang, G.; Guo, Y.; Sun, X. Novel colorimetric aptasensor based on MOF-derived materials and its applications for organophosphorus pesticides determination. J. Hazard. Mater. 2022, 440, 129707. [Google Scholar] [CrossRef]
- He, J.; Song, L.; Chen, S.; Li, Y.; Wei, H.; Zhao, D.; Gu, K.; Zhang, S. Novel restricted access materials combined to molecularly imprinted polymers for selective solid-phase extraction of organophosphorus pesticides from honey. Food Chem. 2015, 187, 331–337. [Google Scholar] [CrossRef]
- Hou, L.; Zhang, X.; Huang, Y.; Wang, M.; Chen, X.; Lin, T.; Tan, Y.; Zhao, S. A ratiometric electrochemical biosensor via alkaline phosphatase mediated dissolution of nano-MnO2 and Ru(III) redox recycling for the determination of dimethoate. J. Pharm. Biomed. Anal. 2022, 207, 114400. [Google Scholar] [CrossRef]
- Vahid, B. Specific Fluorescence Probe for Direct Recognition of Dimethoate Using Molecularly Imprinting Polymer on ZnO Quantum Dots. J. Fluoresc. 2017, 27, 1339–1347. [Google Scholar] [CrossRef]
- Yang, Y.; Chang, Y.; Guo, Y.; Yu, L.; Zhang, G.; Zhai, D.; Wang, X.; Sun, X. Fluorometric microplate-based dimethoate assay using CdSe/ZnS quantum dots coated with a molecularly imprinted polymer. Mikrochim. Acta 2019, 186, 589. [Google Scholar] [CrossRef]
- Ting-Ting, L.U.; Wang, J.L.; Zhan, X.Q.; Yuan-Gen, W.U. Carbon Dots-based Fluorescent Aptasensor for Detection of Dimethoate Pesticide. Chin. J. Anal. Chem. 2020, 48, 74–82. [Google Scholar] [CrossRef]
- Shikha, S.; Dureja, S.; Sapra, R.; Babu, J.; Haridas, V.; Pattanayek, S.K. Interaction of borohydride stabilized silver nanoparticles with sulfur-containing organophosphates. RSC Adv. 2021, 11, 32286–32294. [Google Scholar] [CrossRef] [PubMed]
Figure 1.
(a) The schematic illustration for the preparation of OP hydrolysates containing sulfhydryl groups; (b) the sensing principle of indirect detection based on DNA-Ag NCs.
Figure 1.
(a) The schematic illustration for the preparation of OP hydrolysates containing sulfhydryl groups; (b) the sensing principle of indirect detection based on DNA-Ag NCs.

Figure 2.
(a) TEM image of DNA2-Ag NCs. (b) DLS spectrum of DNA2-Ag NCs. (c) Fluorescence spectra of DNA-Ag NCs. The inserted digital images were DNA-Ag NCs illuminated with White (up) and UV (down) light. (d) Excitation and Emission spectra of DNA2-Ag NCs. The inserted digital images were DNA2-Ag NCs illuminated with white light (left) and UV light (right).

Figure 3.
Optimization of the detection for three pesticides. (a) NaOH concentration, (b) pesticide hydrolysis temperature, (c) hydrolysis time, and (d) reaction time between pesticide and DNA2-Ag NCs.
Figure 3.
Optimization of the detection for three pesticides. (a) NaOH concentration, (b) pesticide hydrolysis temperature, (c) hydrolysis time, and (d) reaction time between pesticide and DNA2-Ag NCs.

Figure 4.
Fluorescence emission spectra of DNA2-Ag NCs at different concentrations of dimethoate (a), ethion (c) and phorate (e); the calibration plot of F/F0 versus concentration of dimethoate (b). Inset: corresponding linear ranges; corresponding calibration curves for ethion (d) and phorate (f) detection.
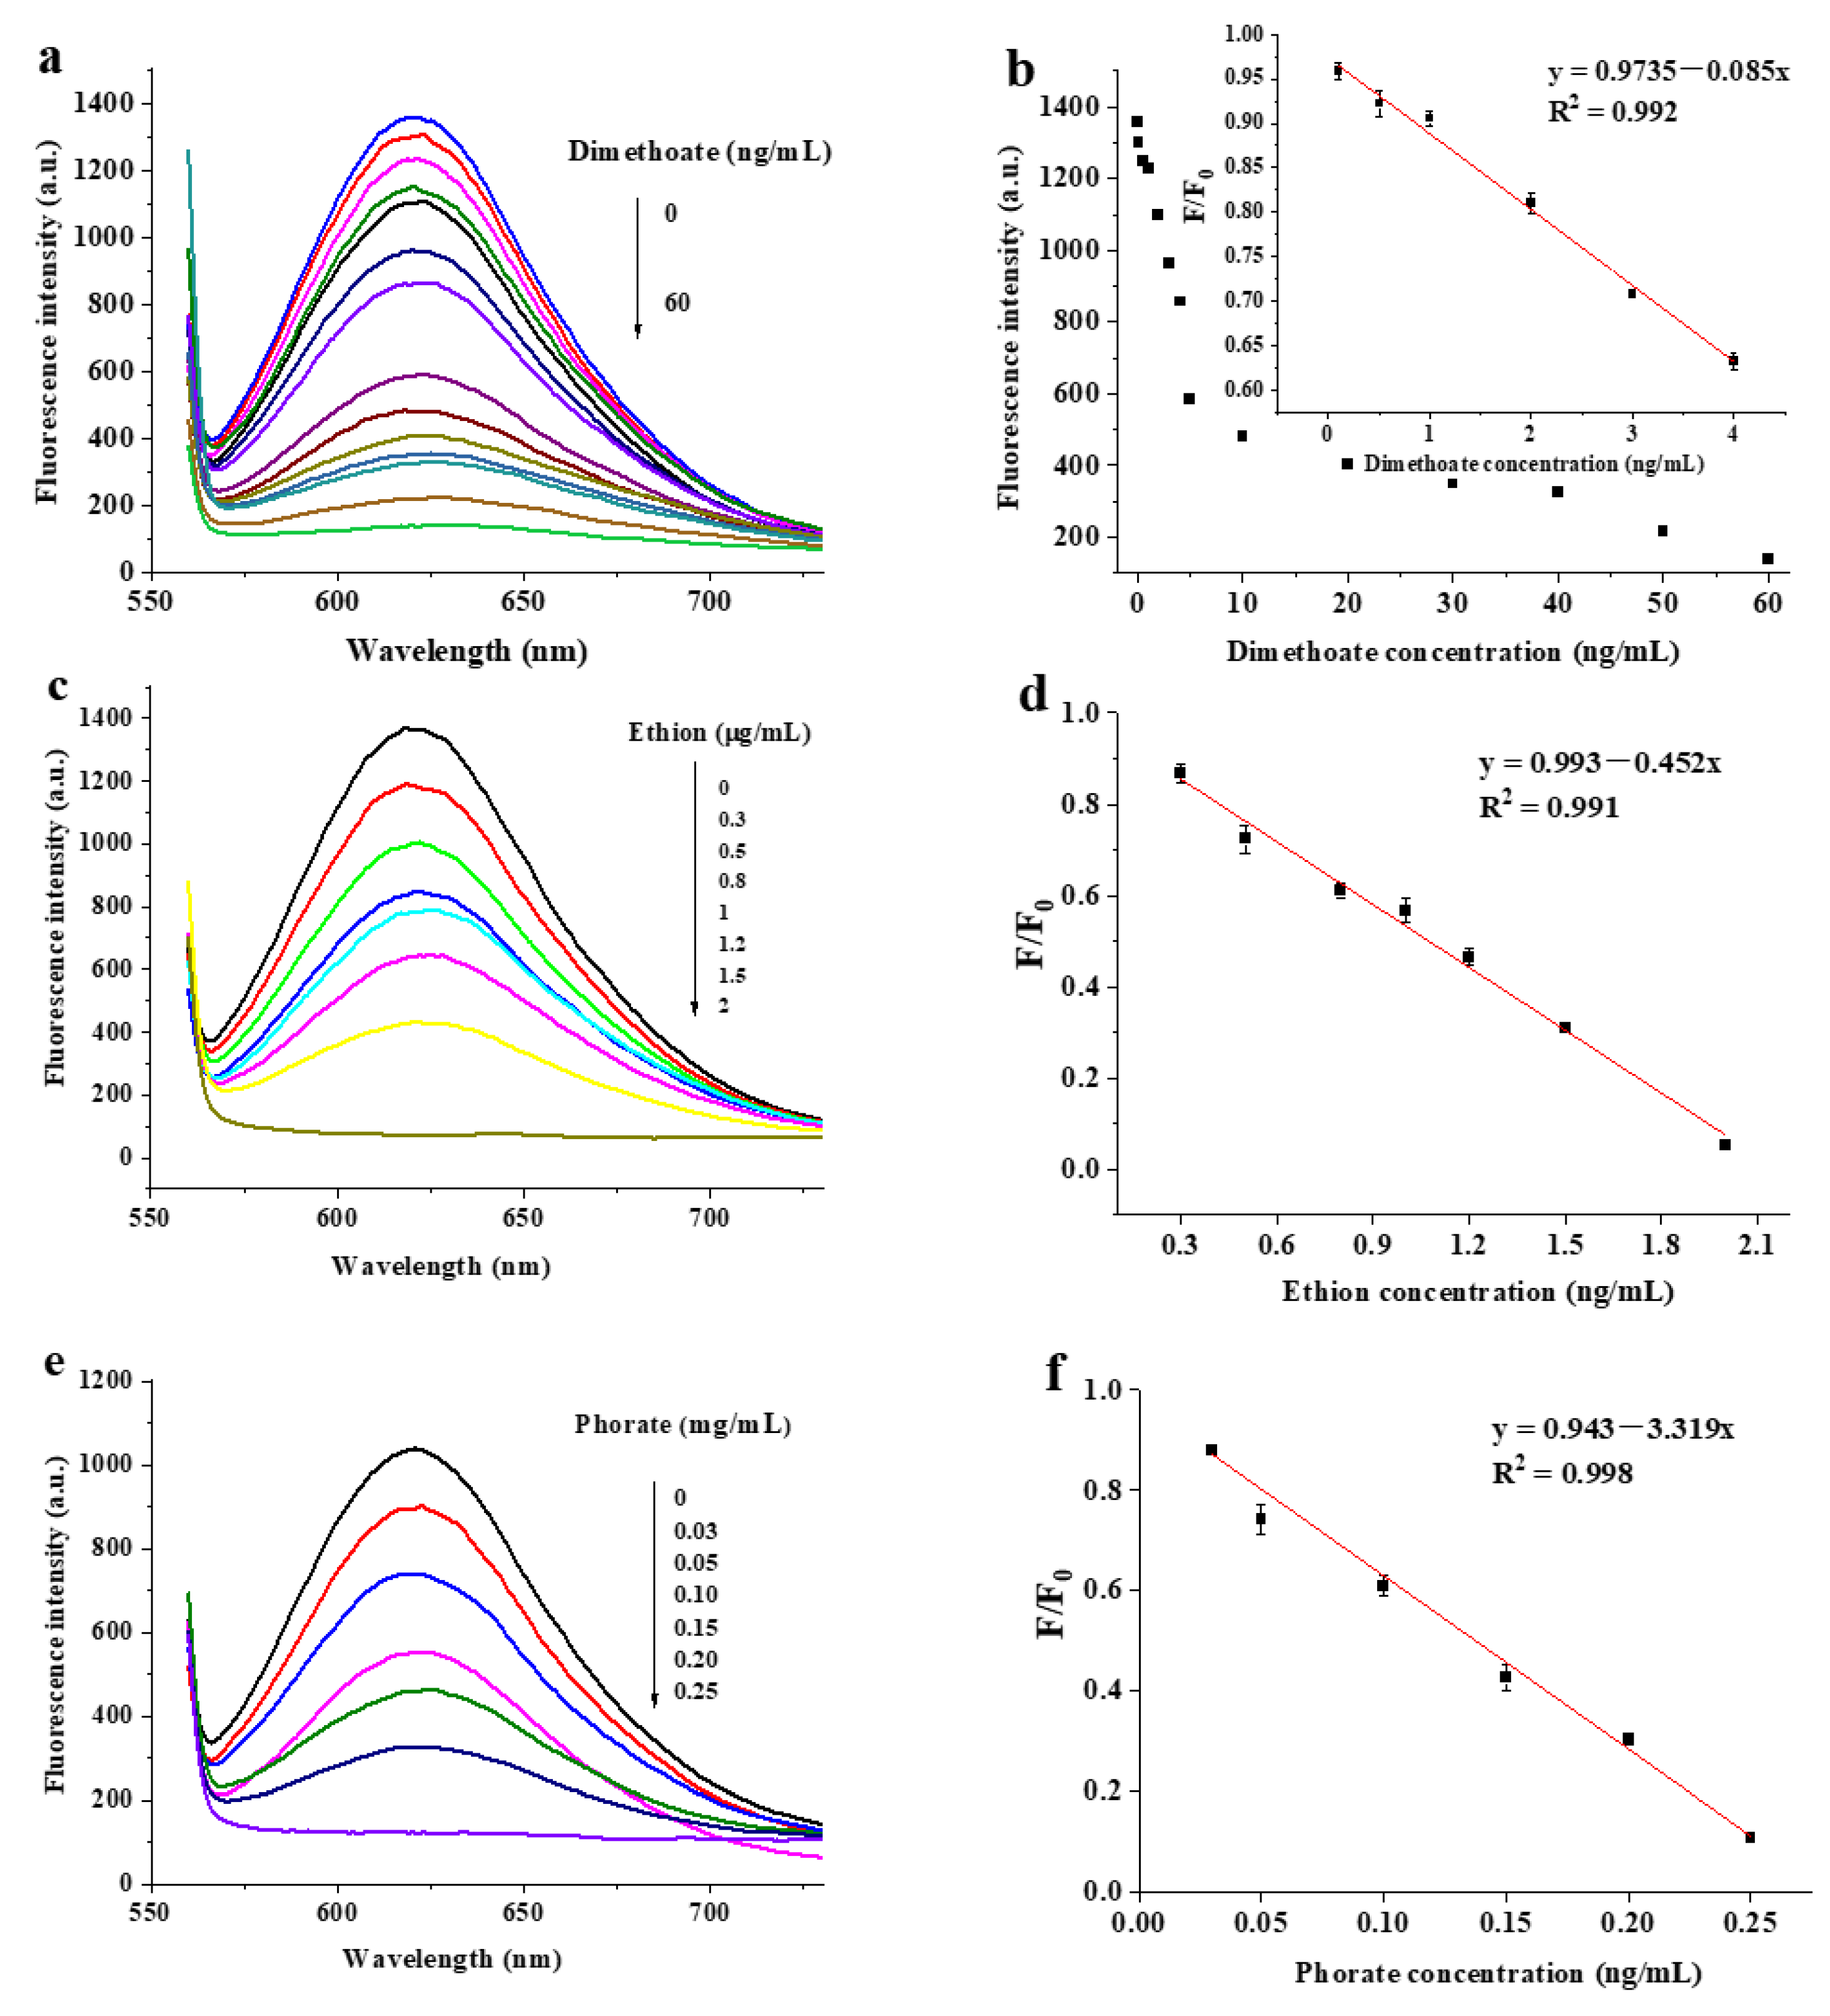
Figure 5.
DLS images of DNA2-Ag NCs (a), DNA2-Ag NCs/Dimethoate (b), DNA2-Ag NCs/Ethion (c), and DNA2-Ag NCs/Phorate (d).
Figure 5.
DLS images of DNA2-Ag NCs (a), DNA2-Ag NCs/Dimethoate (b), DNA2-Ag NCs/Ethion (c), and DNA2-Ag NCs/Phorate (d).

Figure 6.
The chemical structures of seven OPs.

Figure 7.
Selectivity of the fluorescence assay system toward dimethoate, ethion, and phorate at the same concentrations of 2 µg/mL, (a) against other pesticides at the same concentrations of 10 µg/mL, and (b) anion and cation at same concentration of 100 µM.
Figure 7.
Selectivity of the fluorescence assay system toward dimethoate, ethion, and phorate at the same concentrations of 2 µg/mL, (a) against other pesticides at the same concentrations of 10 µg/mL, and (b) anion and cation at same concentration of 100 µM.


Table 1.
Sequence of five single-stranded DNAs.
| DNA | Sequence 5′-3′ |
|---|---|
| DNA 1 | ACCCGAACCTGGGCTACCACCCTTAATCCCC |
| DNA 2 | TTACCCGAACCTGGGCTACCACCCTTAATCCCCTT |
| DNA 3 | AAACCCGAACCTGGGCTACCACCCTTAATCCCCAA |
| DNA 4 | GGACCCGAACCTGGGCTACCACCCTTAATCCCCGG |
Table 2.
Comparison of proposed method and other reported methods for the detection of OPs.
| Method | Target | Linearity (ng/mL) | LOD (ng/mL) | Reference |
|---|---|---|---|---|
| Colorimetry | Dimethoate | 10–400 | 4.7 | [33] |
| Colorimetry | Dimethoate | 20–160 | 14 | [34] |
| Colorimetry | Phorate | 0.5–5000 | 0.1667 | [35] |
| Gas chromatography | Dimethoate Phorate | 10–1000 10–1000 | 1.8 0.8 | [36] |
| Electrochemistry | Dimethoate | 0.01–300 | 0.0063 | [37] |
| Fluorescence | Dimethoate | 20–3200 | 6 | [38] |
| Fluorescence | Dimethoate | 5–150 | 2.1 | [39] |
| Fluorescence | Dimethoate | 6–200 | 2.24 | [40] |
| Fluorescence | Dimethoate Ethion Phorate | 0.1–4 300–2000 30–250 | 0.05 30 3 | This study |
Table 3.
Determination of the three pesticides in lake water samples (n = 3).
| Pesticide | Spiked (ng/mL) | Found (ng/mL) | Recovery (%) | RSD (%) |
|---|---|---|---|---|
| Dimethoate | 0.5 | 0.45 | 89 | 4.0 |
| 2.0 | 1.90 | 95 | 2.1 | |
| 4.0 | 4.20 | 105 | 8.0 | |
| Ethion | 500 | 510 | 102 | 7.2 |
| 1000 | 970 | 97 | 3.5 | |
| 1500 | 1650 | 110 | 4.0 | |
| Phorate | 50 | 48 | 96 | 6.2 |
| 200 | 180 | 90 | 4.0 | |
| 400 | 440 | 110 | 9.0 |
Disclaimer/Publisher’s Note: The statements, opinions and data contained in all publications are solely those of the individual author(s) and contributor(s) and not of MDPI and/or the editor(s). MDPI and/or the editor(s) disclaim responsibility for any injury to people or property resulting from any ideas, methods, instructions or products referred to in the content. |
© 2023 by the authors. Licensee MDPI, Basel, Switzerland. This article is an open access article distributed under the terms and conditions of the Creative Commons Attribution (CC BY) license (https://creativecommons.org/licenses/by/4.0/).
Share and Cite
MDPI and ACS Style
Li, G.; Huang, X.; Peng, C.; Sun, F. Highly Sensitive Fluorescence Detection of Three Organophosphorus Pesticides Based on Highly Bright DNA-Templated Silver Nanoclusters. Biosensors 2023, 13, 520. https://doi.org/10.3390/bios13050520
AMA Style
Li G, Huang X, Peng C, Sun F. Highly Sensitive Fluorescence Detection of Three Organophosphorus Pesticides Based on Highly Bright DNA-Templated Silver Nanoclusters. Biosensors. 2023; 13(5):520. https://doi.org/10.3390/bios13050520
Chicago/Turabian StyleLi, Guowen, Xiufang Huang, Chifang Peng, and Fengxia Sun. 2023. "Highly Sensitive Fluorescence Detection of Three Organophosphorus Pesticides Based on Highly Bright DNA-Templated Silver Nanoclusters" Biosensors 13, no. 5: 520. https://doi.org/10.3390/bios13050520
Note that from the first issue of 2016, this journal uses article numbers instead of page numbers. See further details here.