A Point-of-Care Device for Fully Automated, Fast and Sensitive Protein Quantification via qPCR

 , , and
Abstract
:1. Introduction
2. Background
2.1. Aptamer-Based POC Devices for Protein Quantification
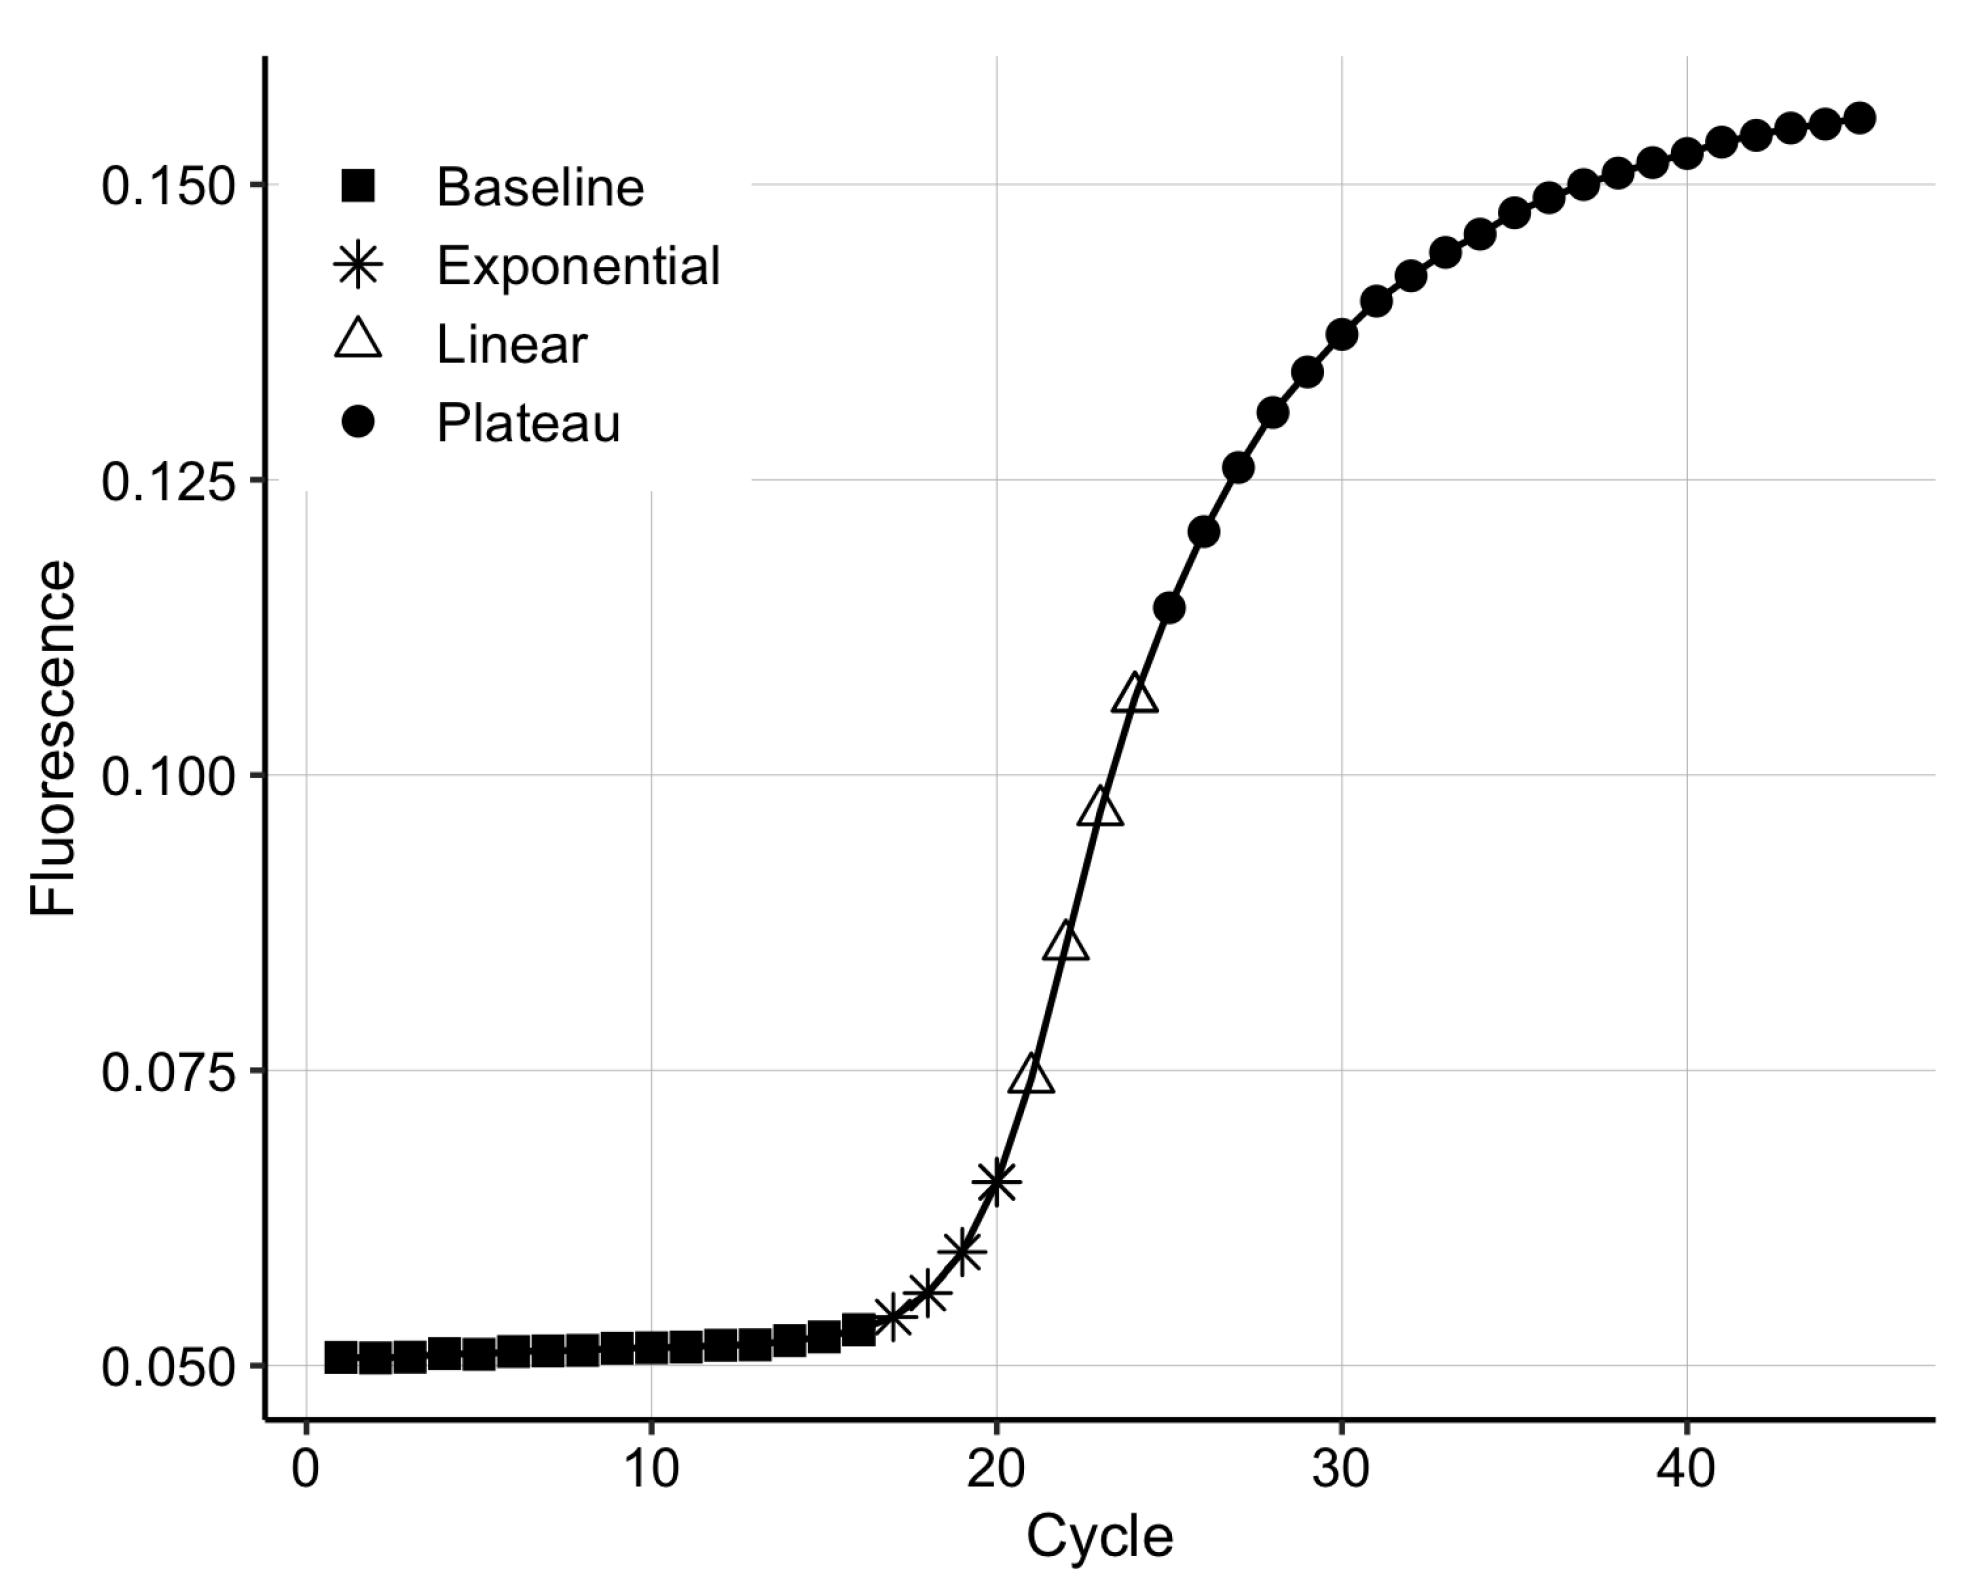
2.2. Techniques for the Analysis of qPCR Data
3. Material and Methods
3.1. Sequences and Primer Design
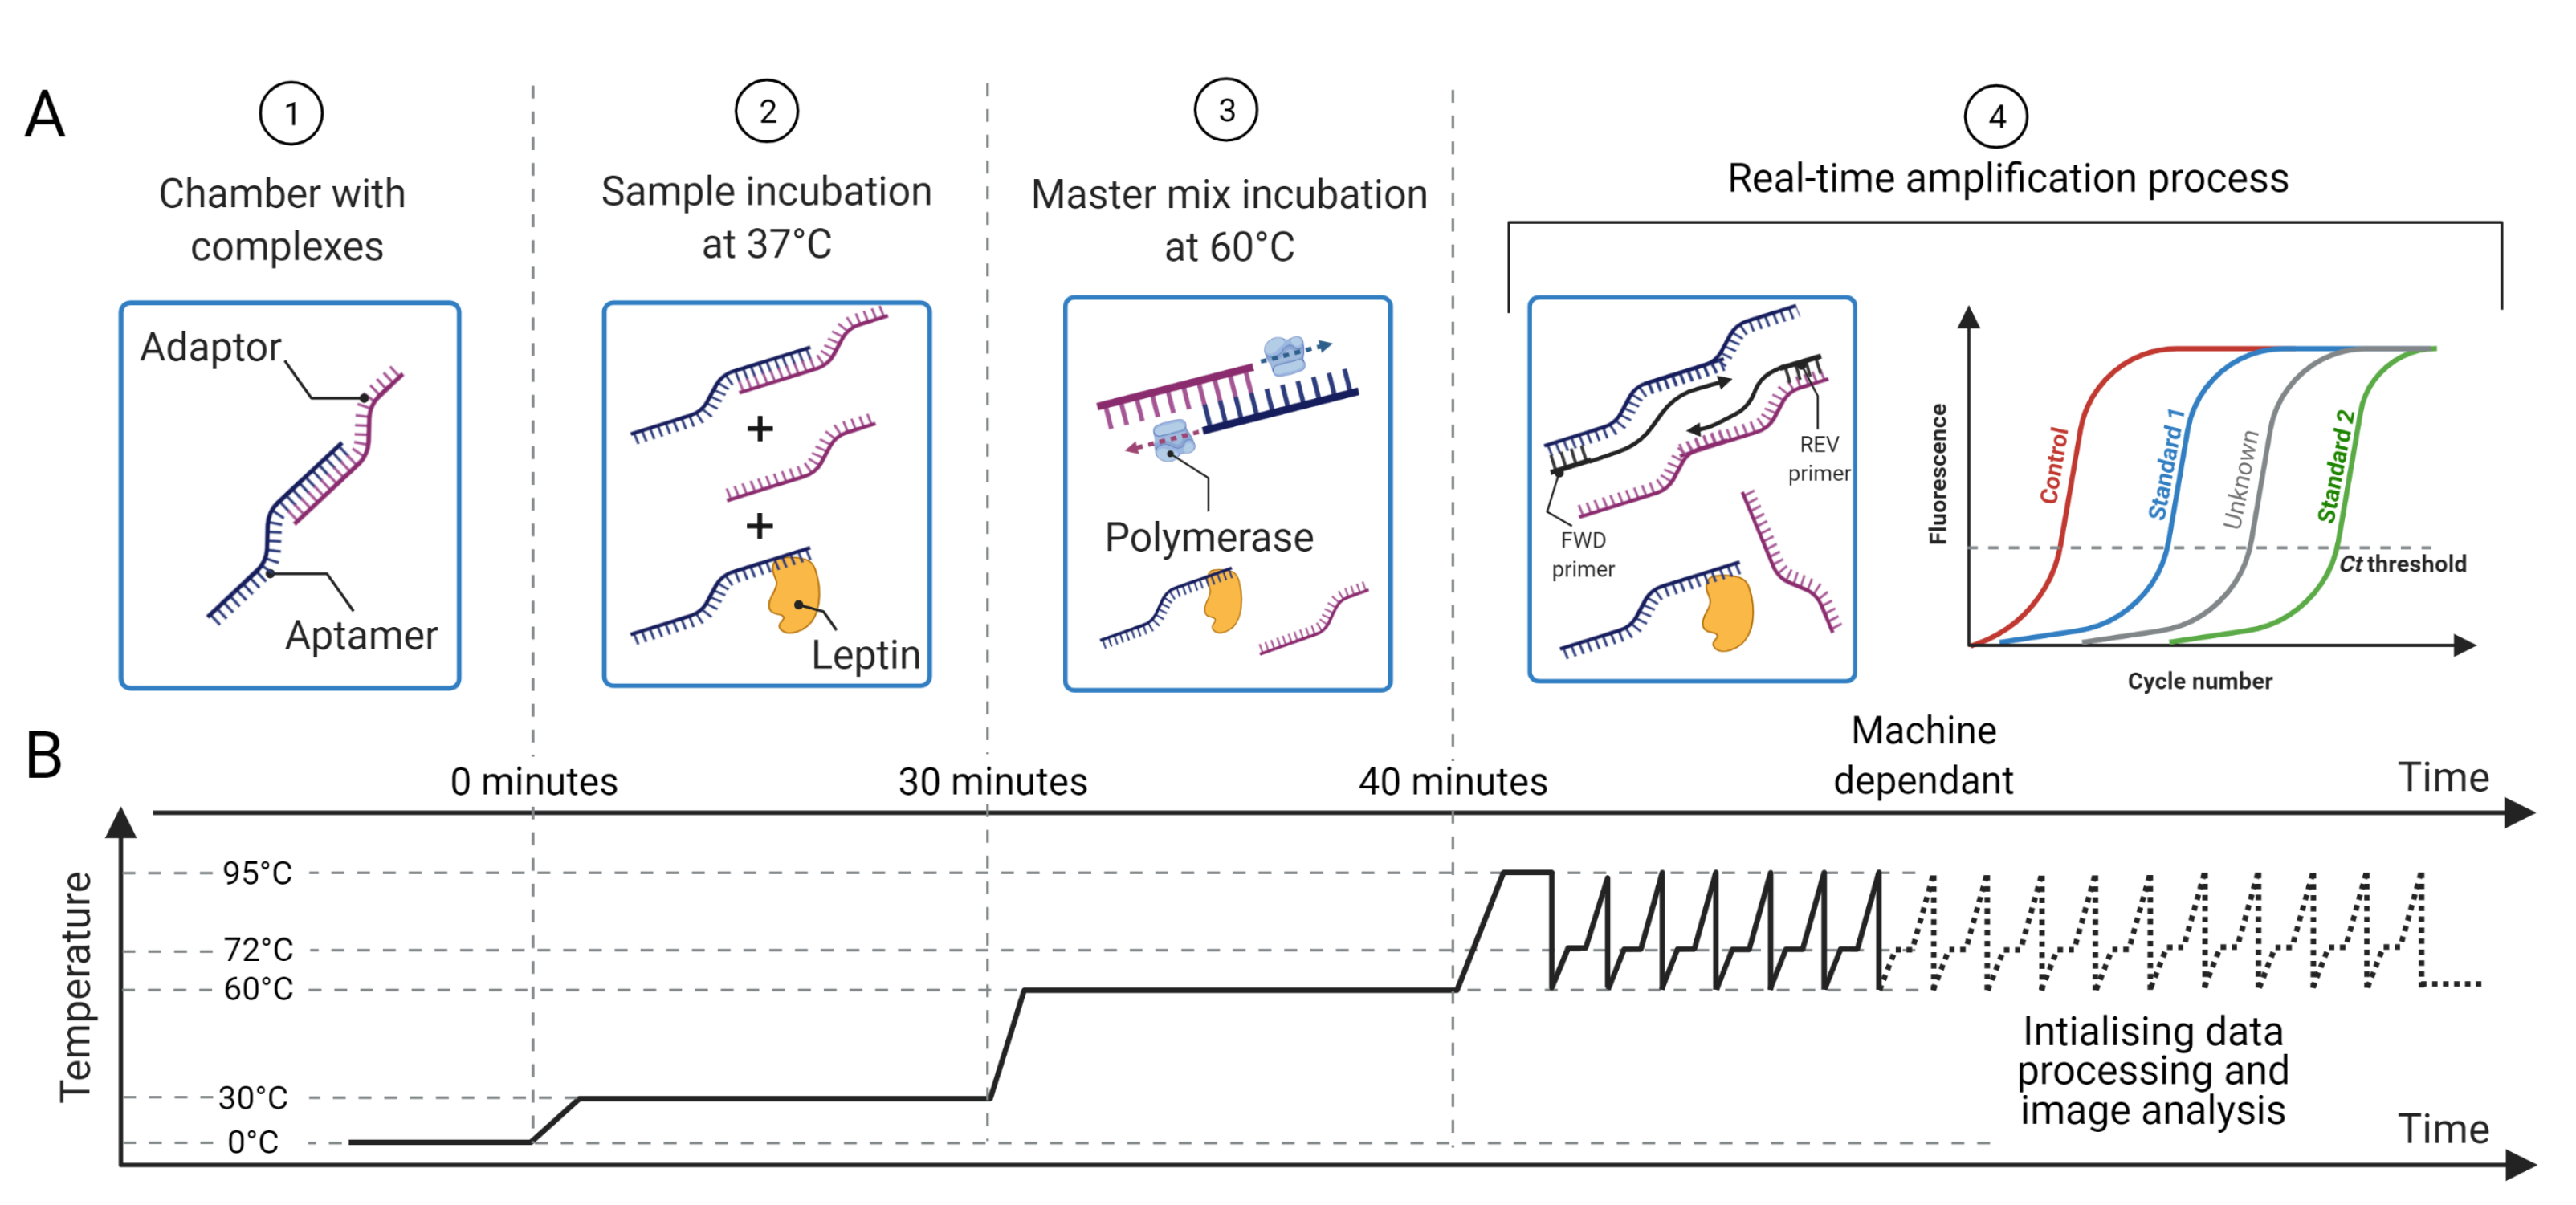
3.2. Aptamer-Adaptor Complex Methodology
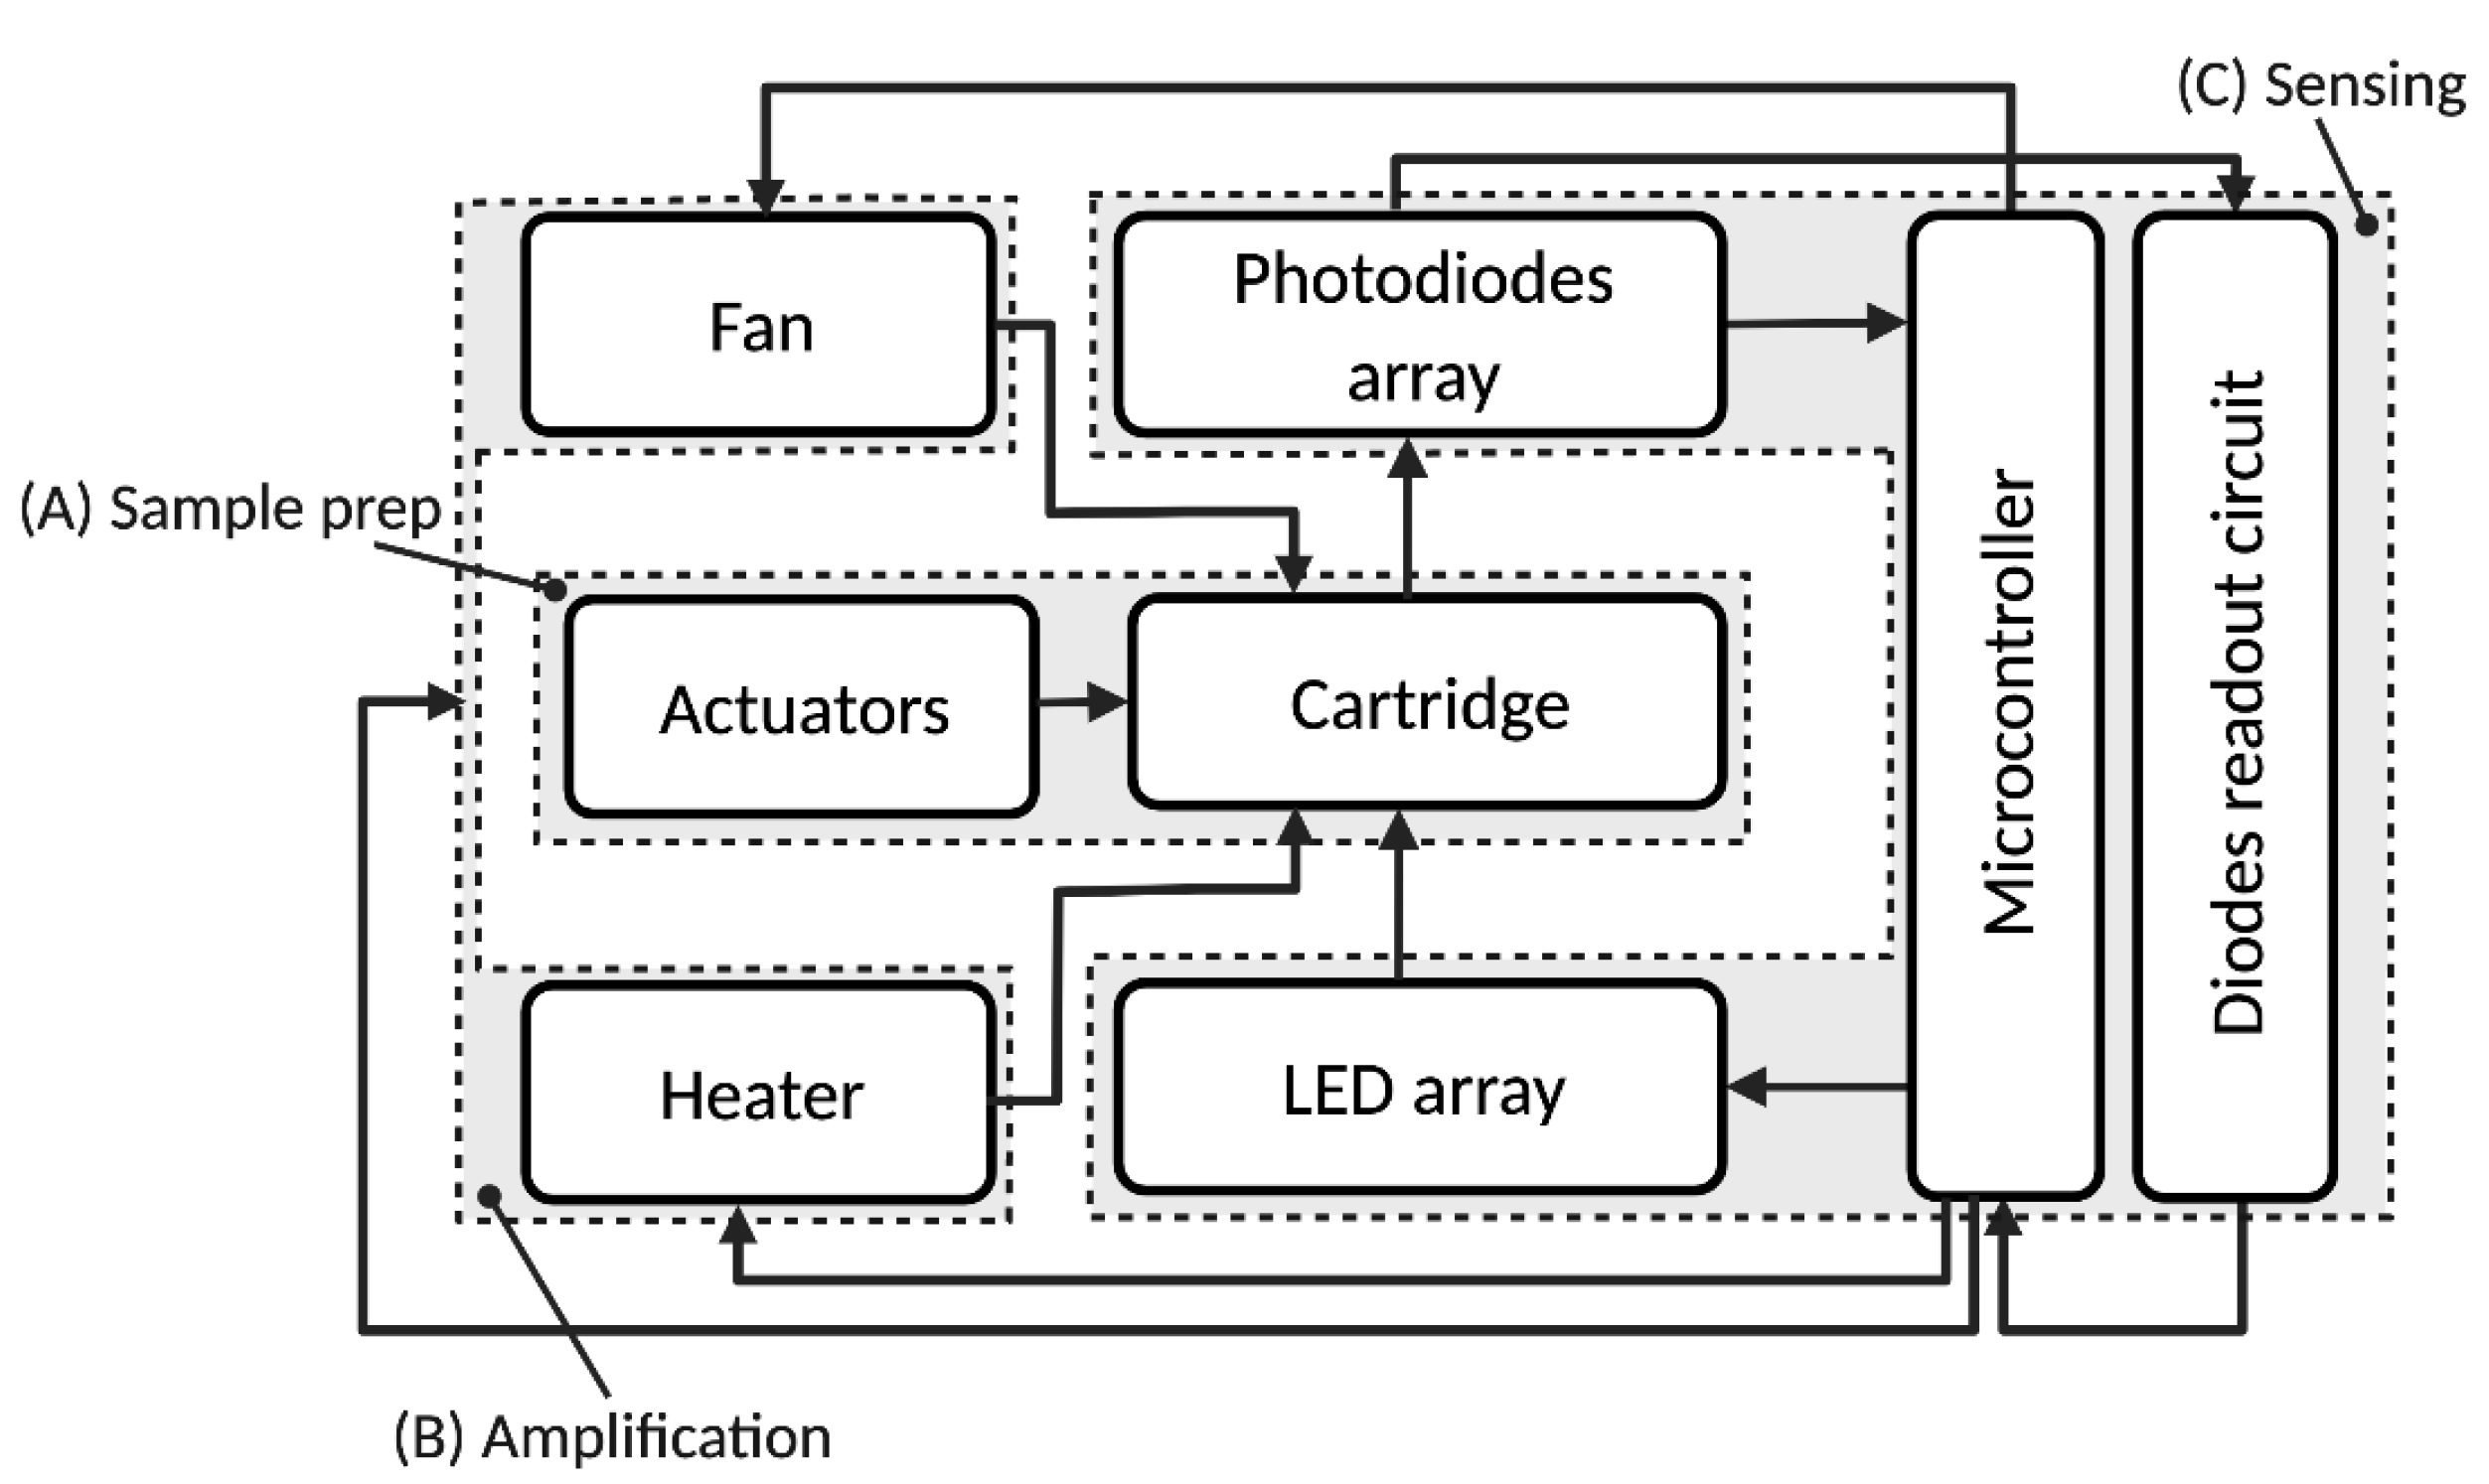
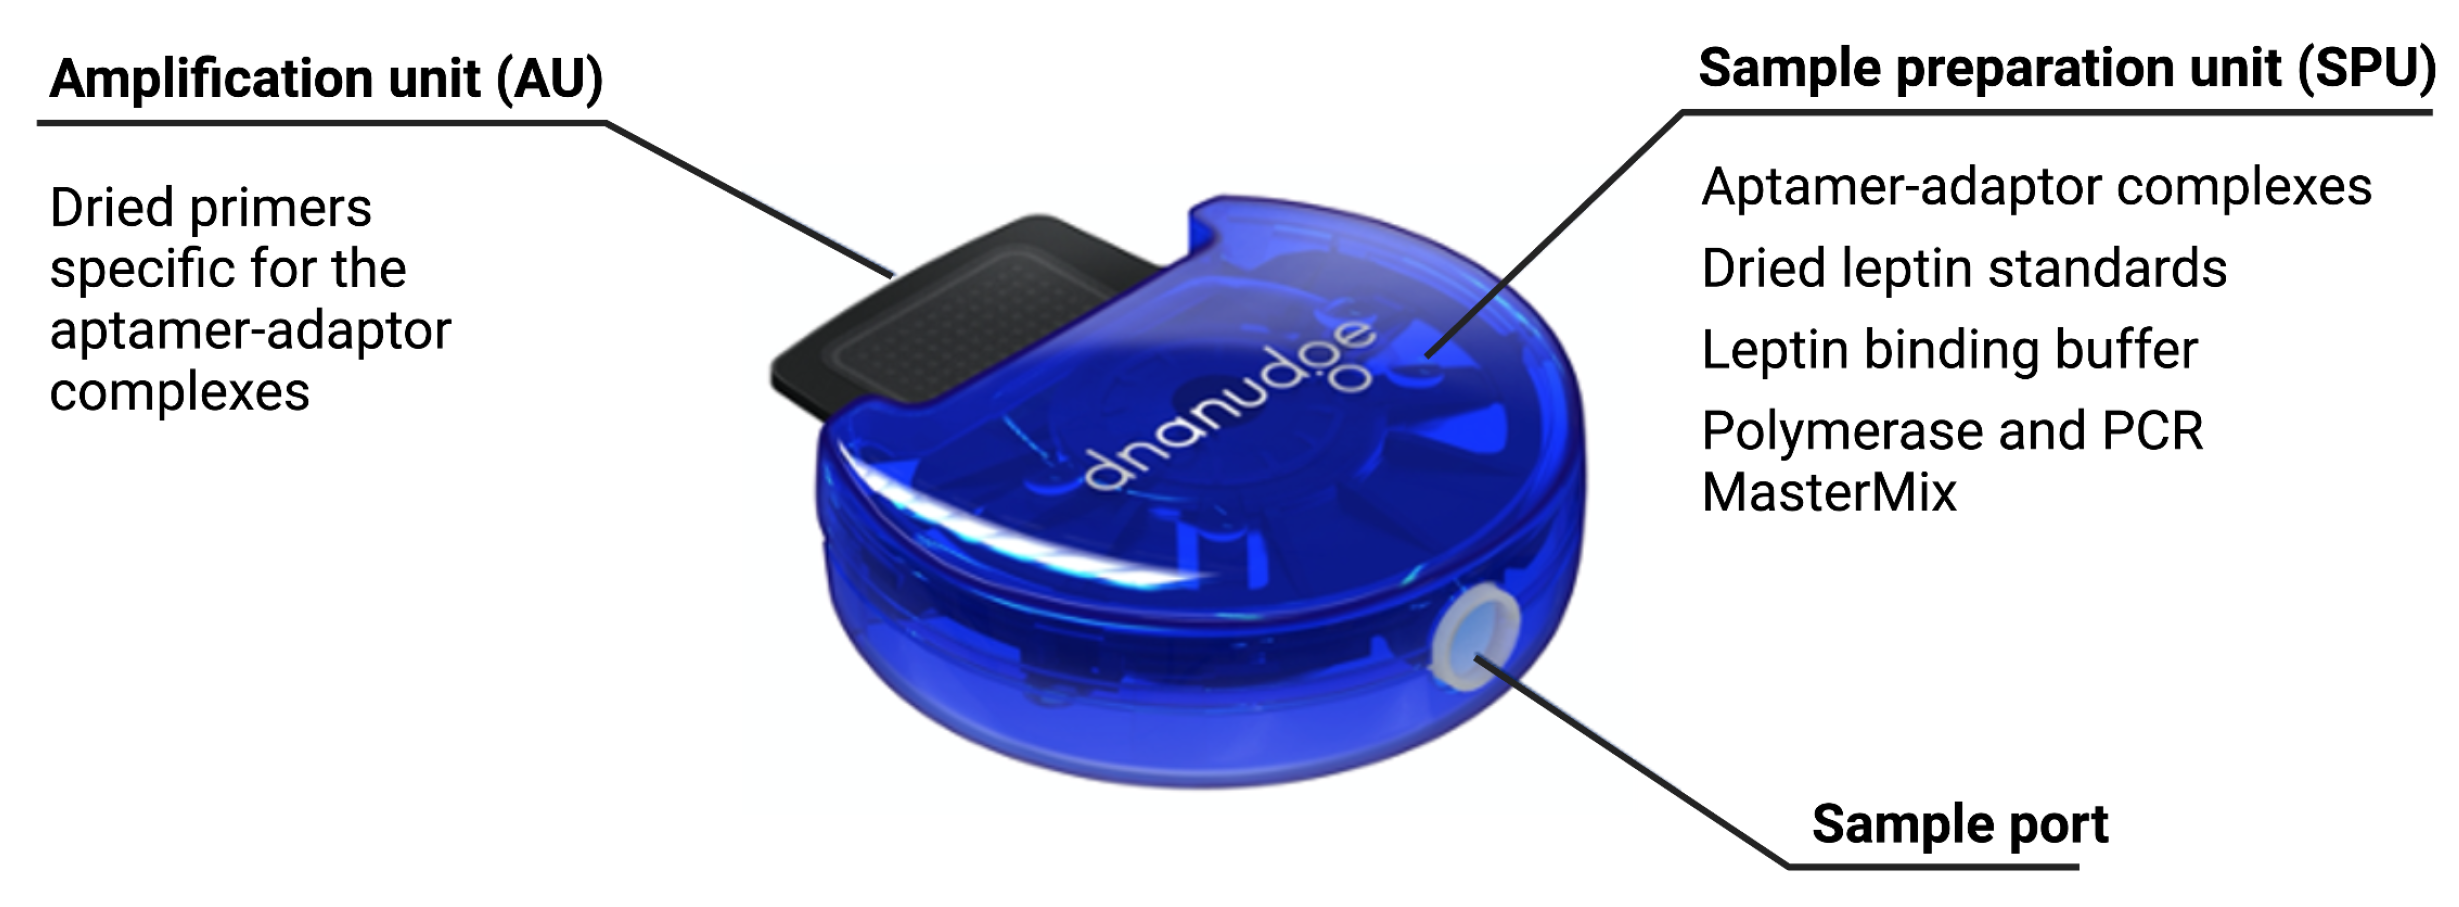
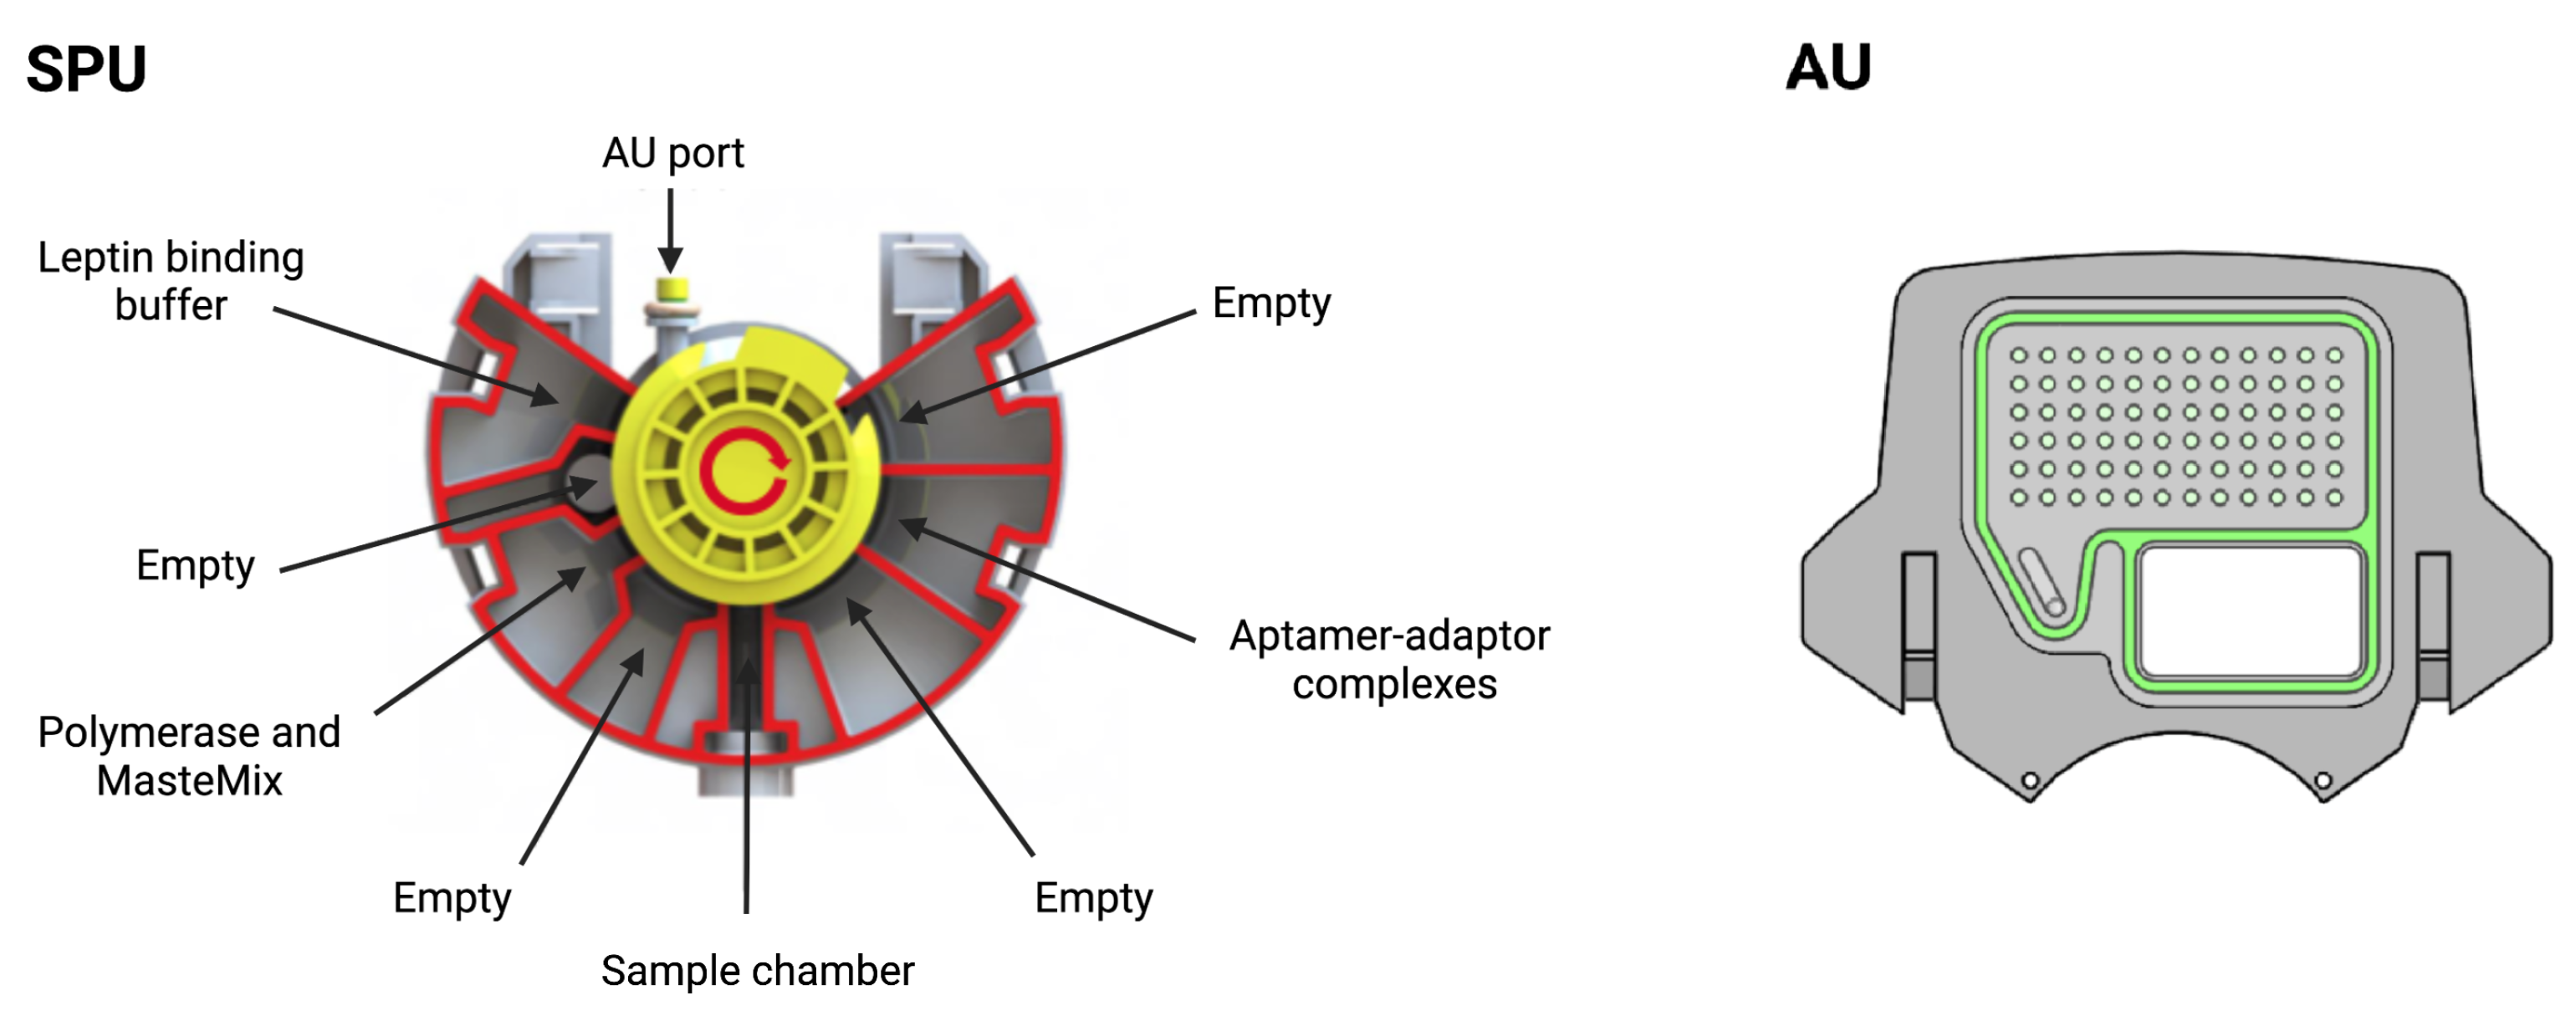
3.3. Cartridge
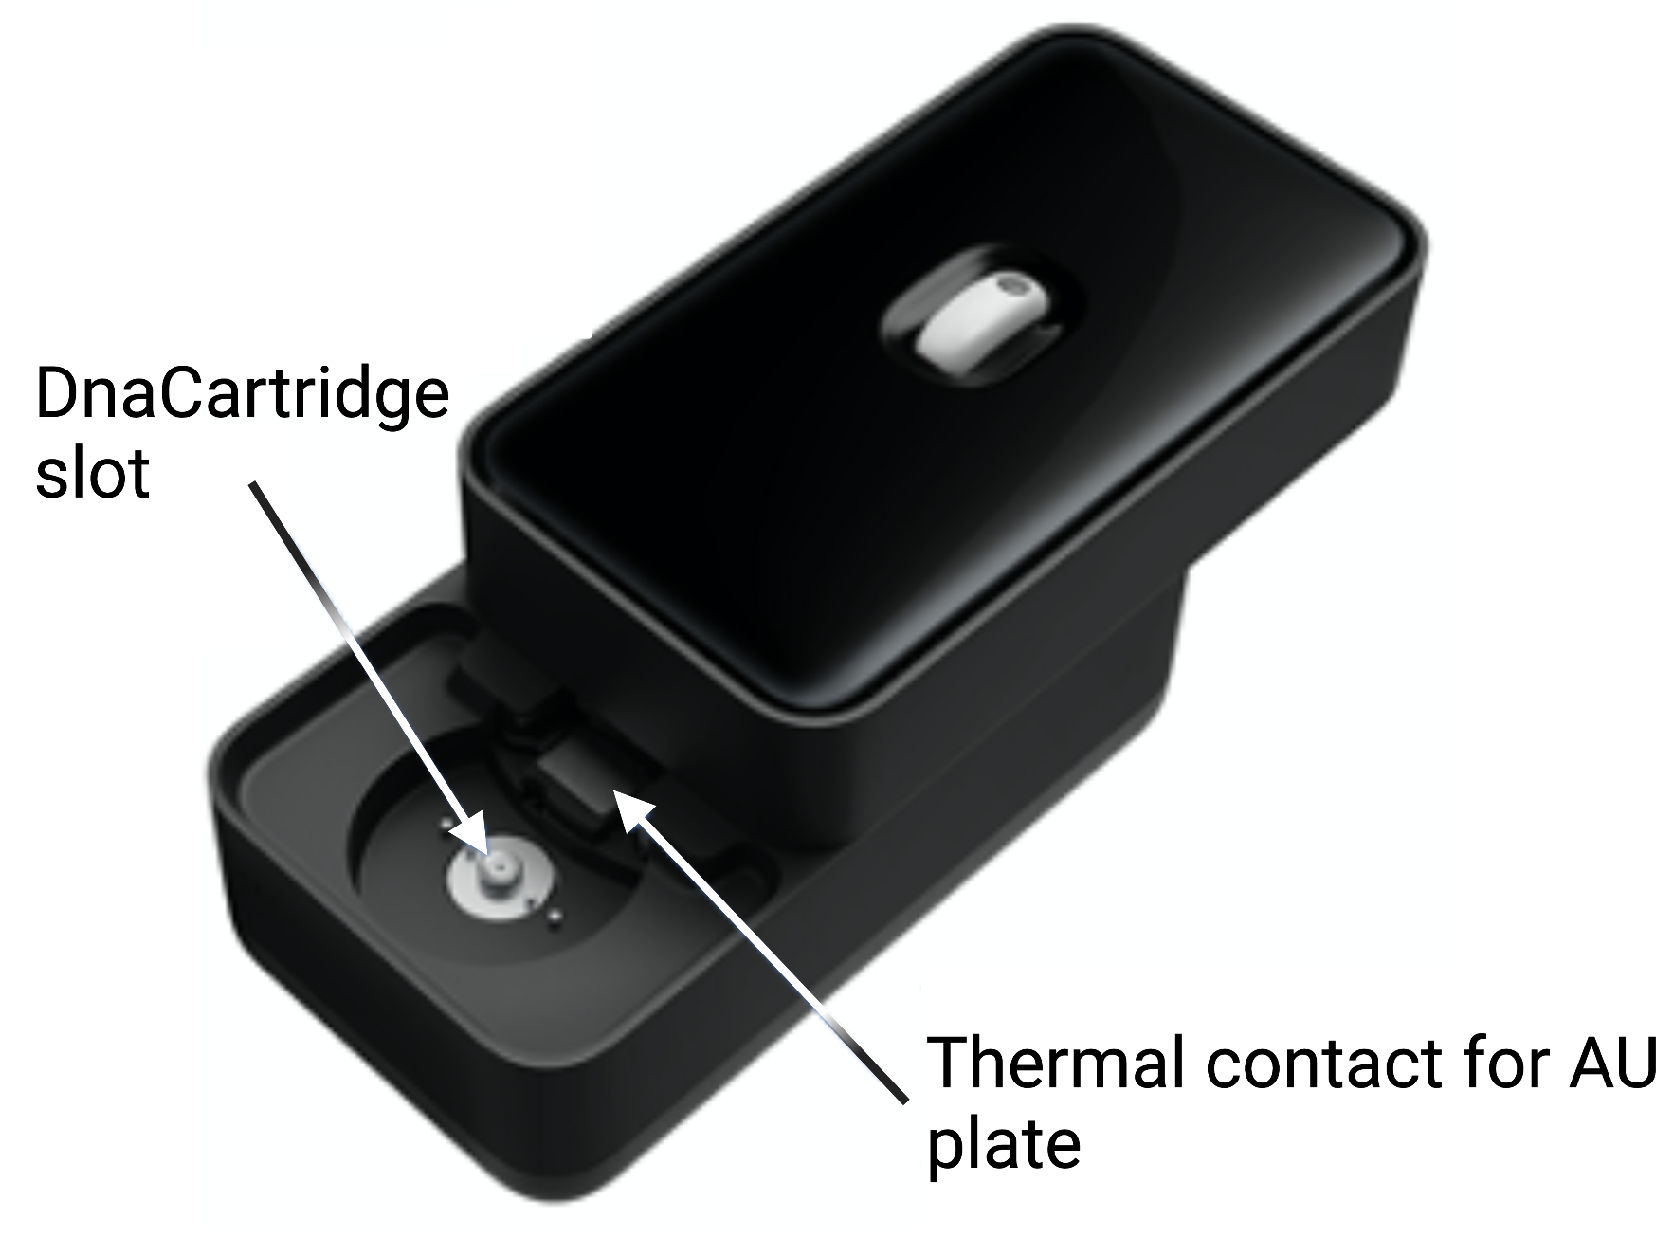
3.4. qPCR Module
3.5. Real-Time qPCR Data Processing
| Algorithm 1 PeakFluo: self-calibrating algorithm for early-cycle protein quantification |
|
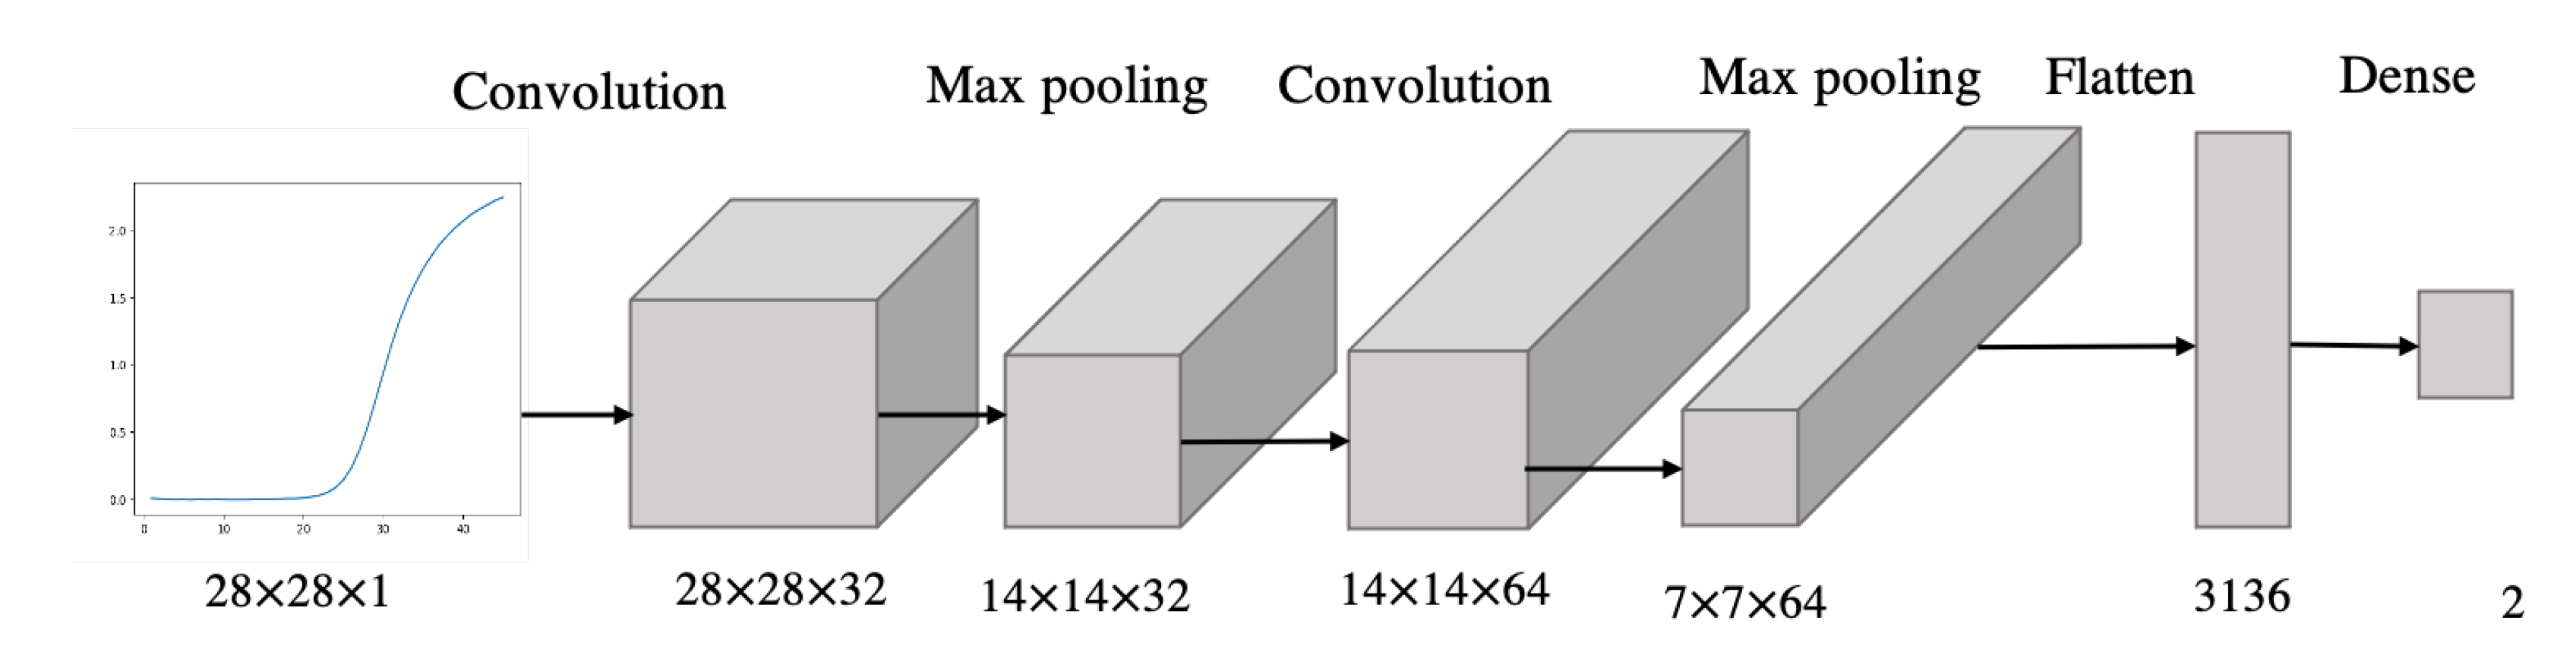
3.6. Convolutional Neural Network for qPCR Data Classification
3.7. Samples for Methods Development and Validation
4. Results
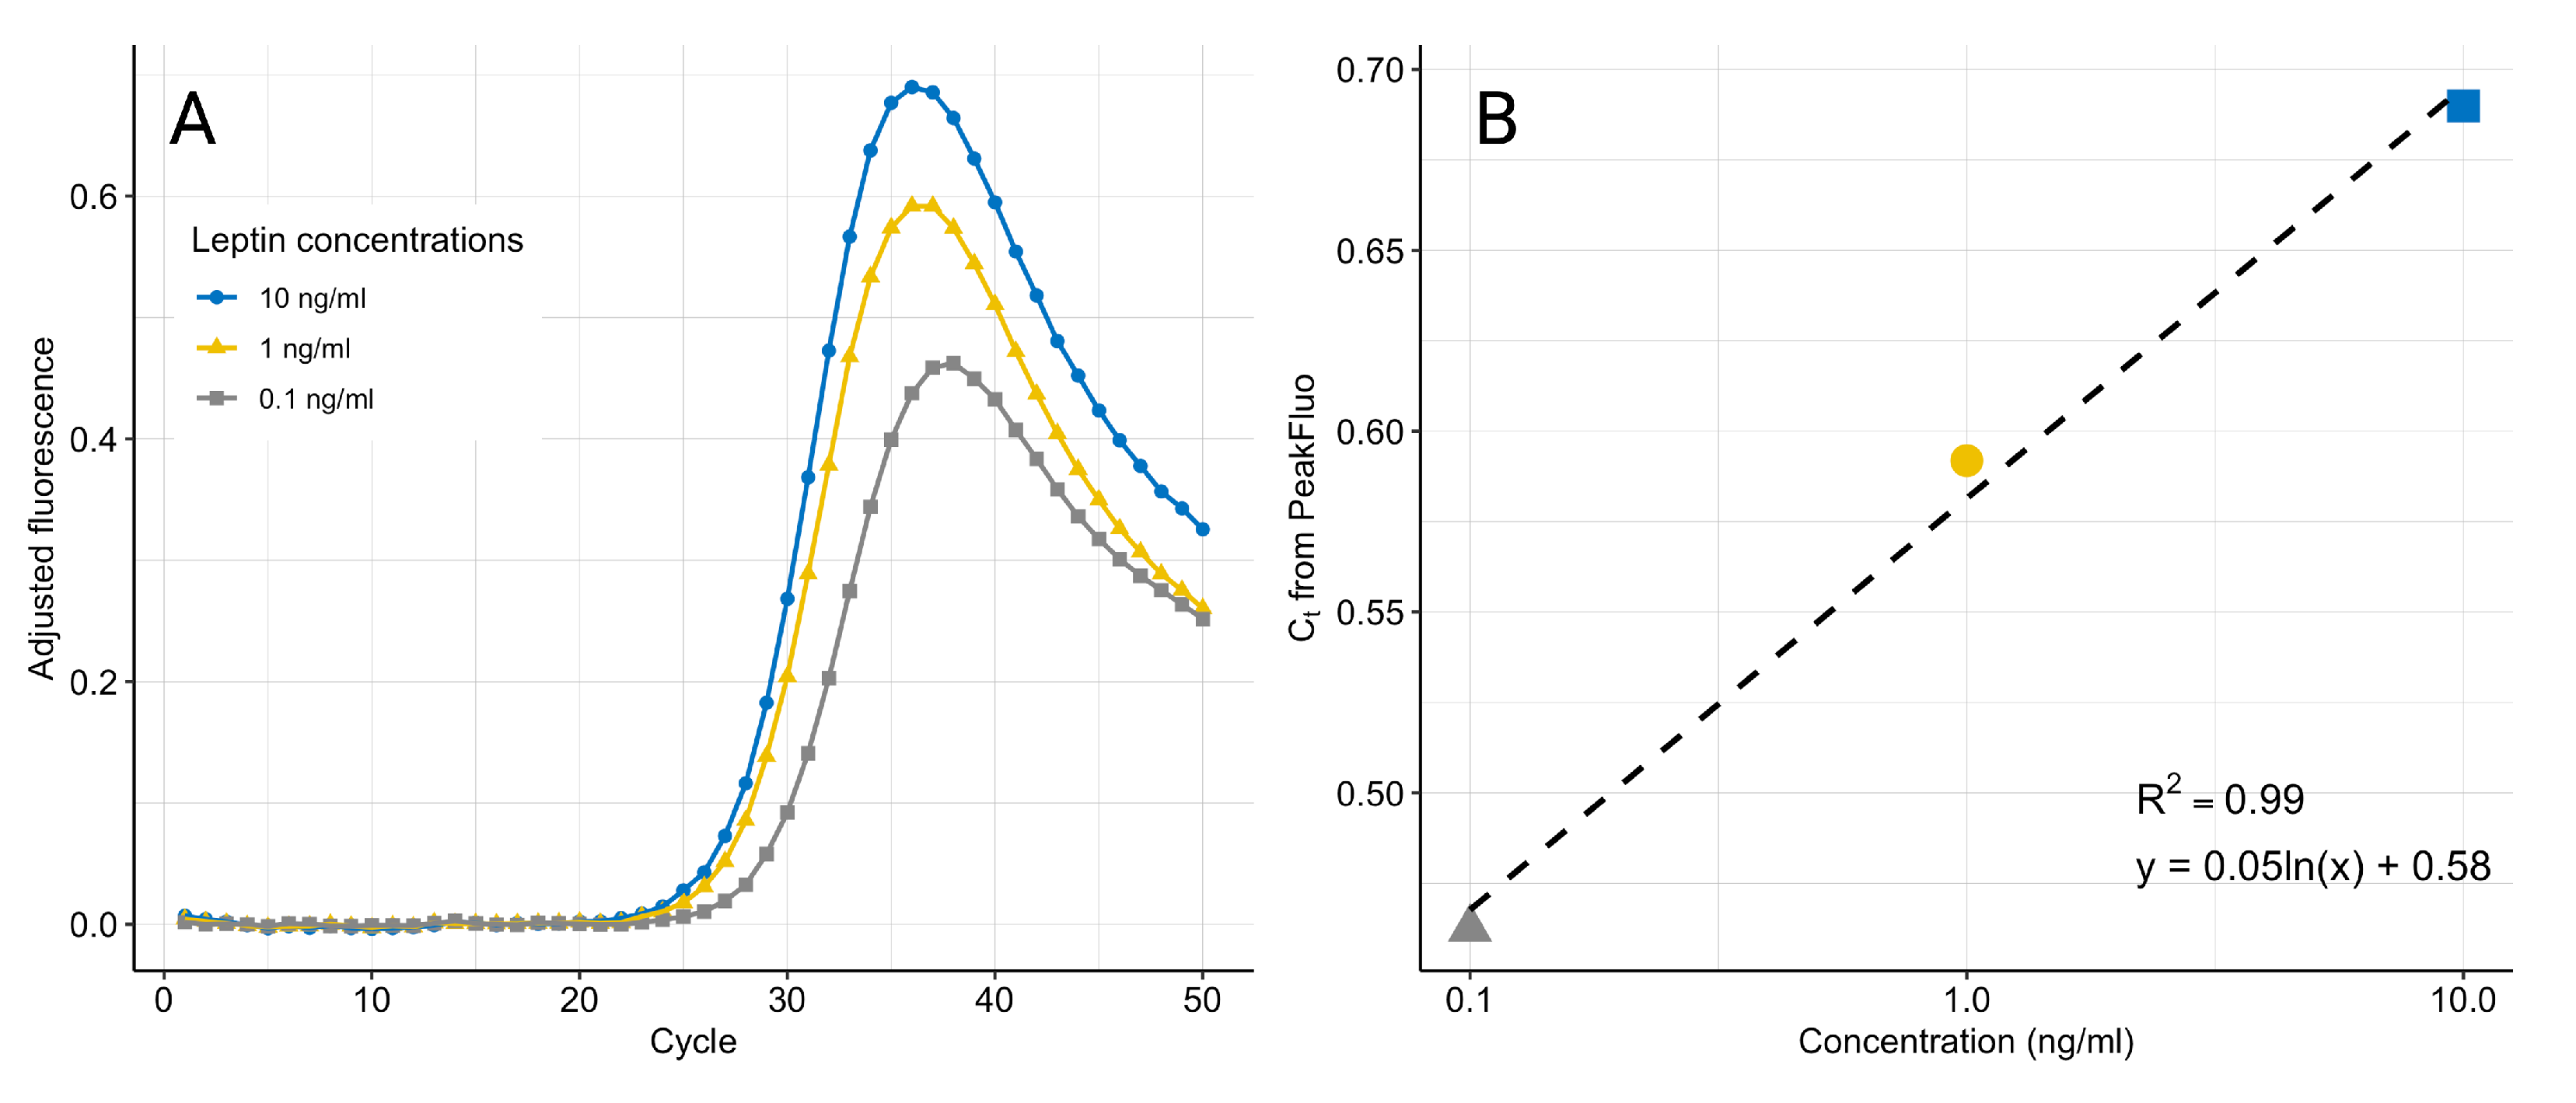
4.1. Biochemical Assay
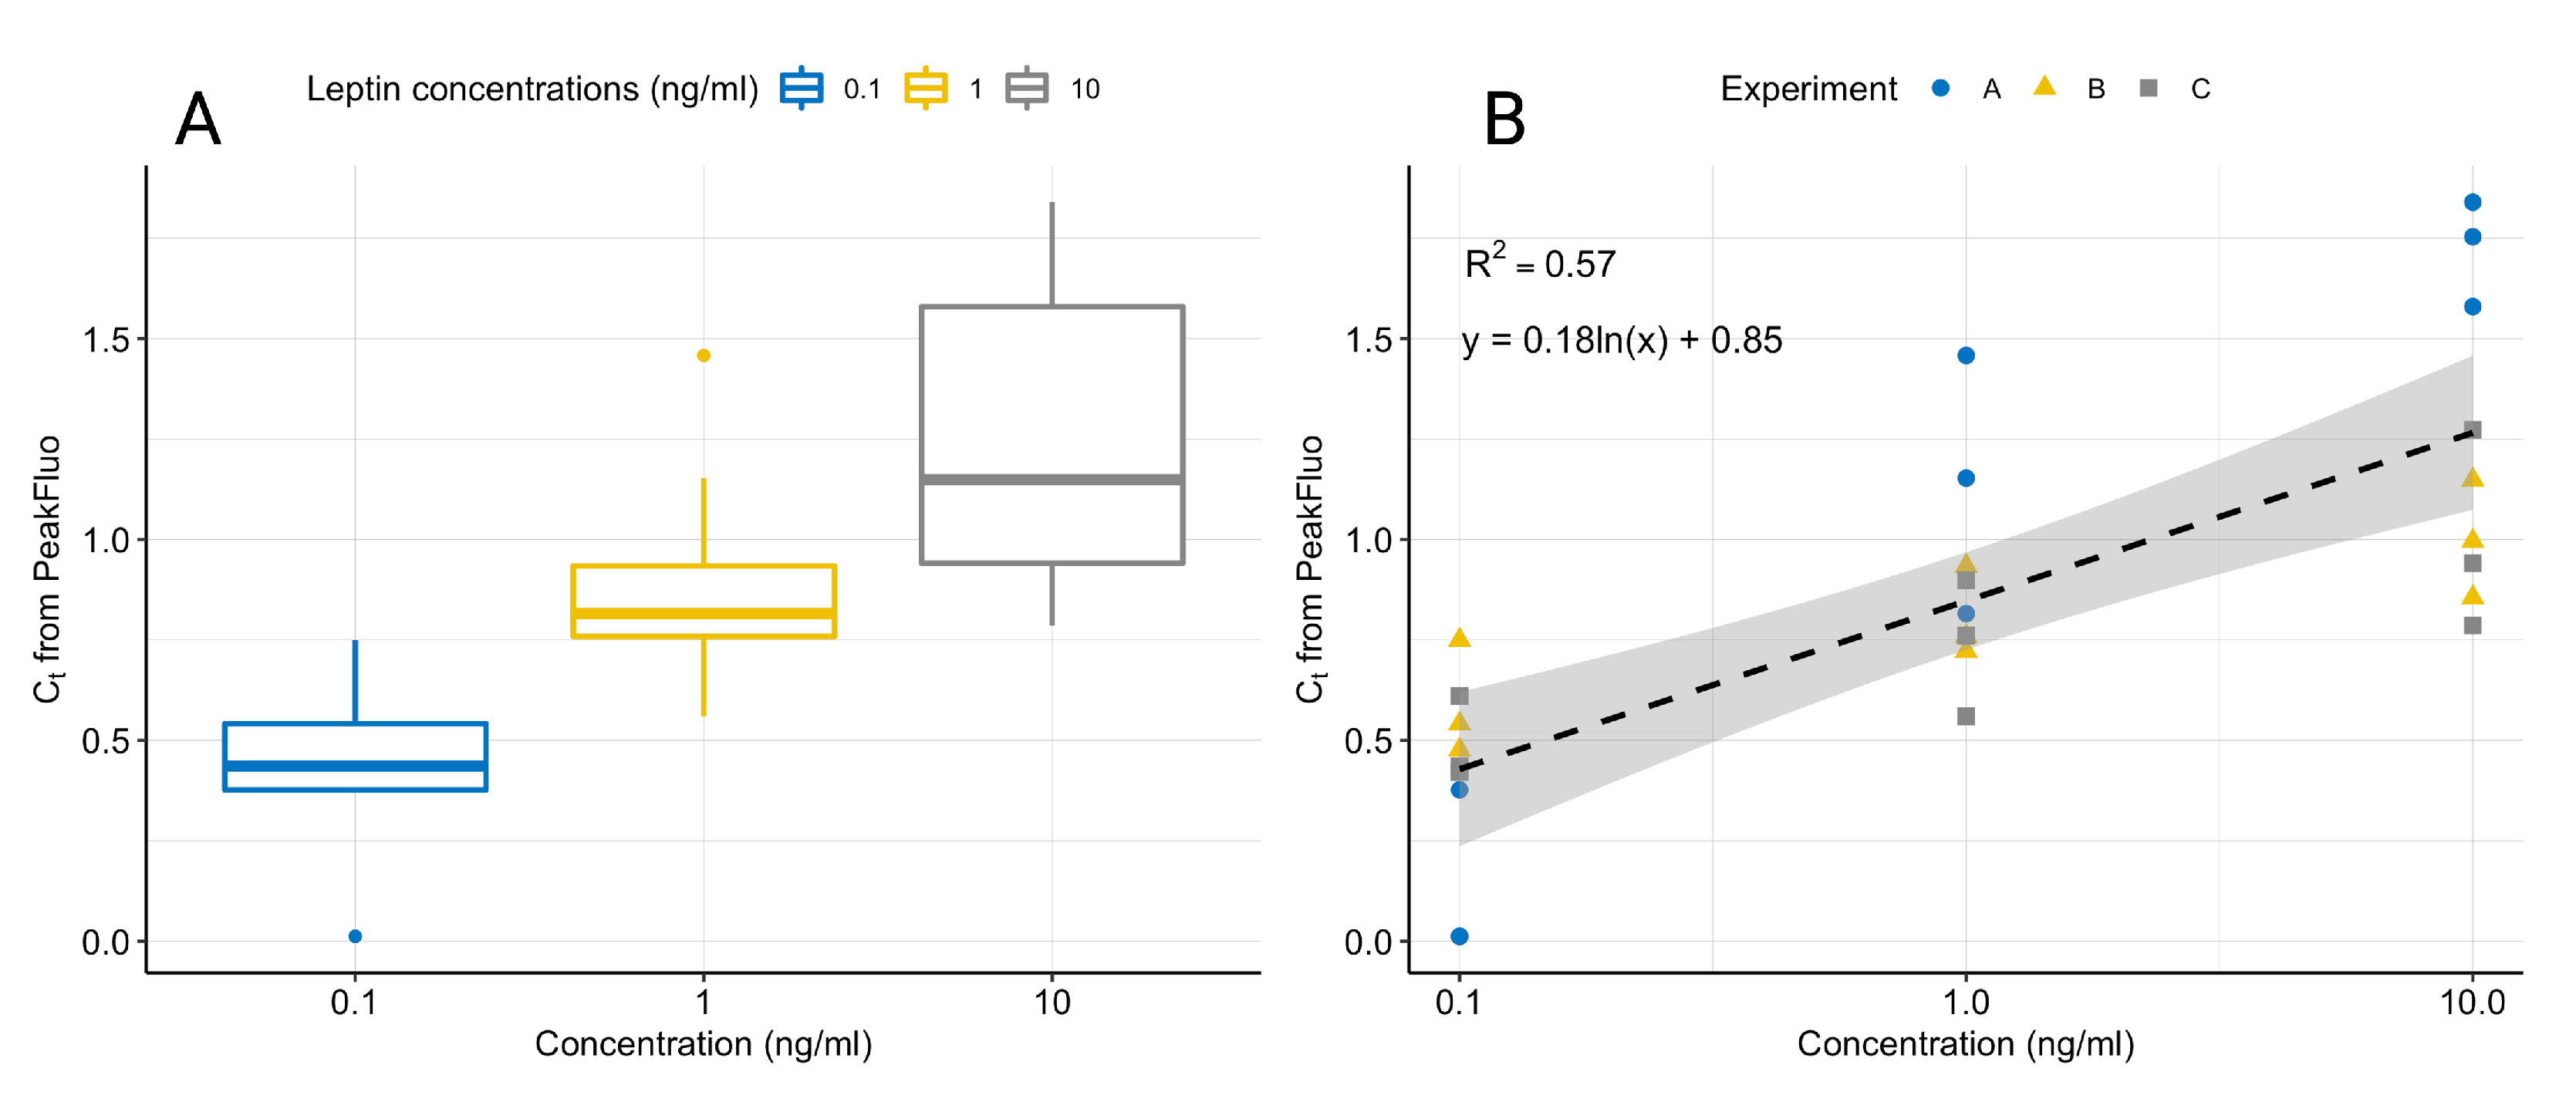
4.2. Real-Time qPCR Data Processing
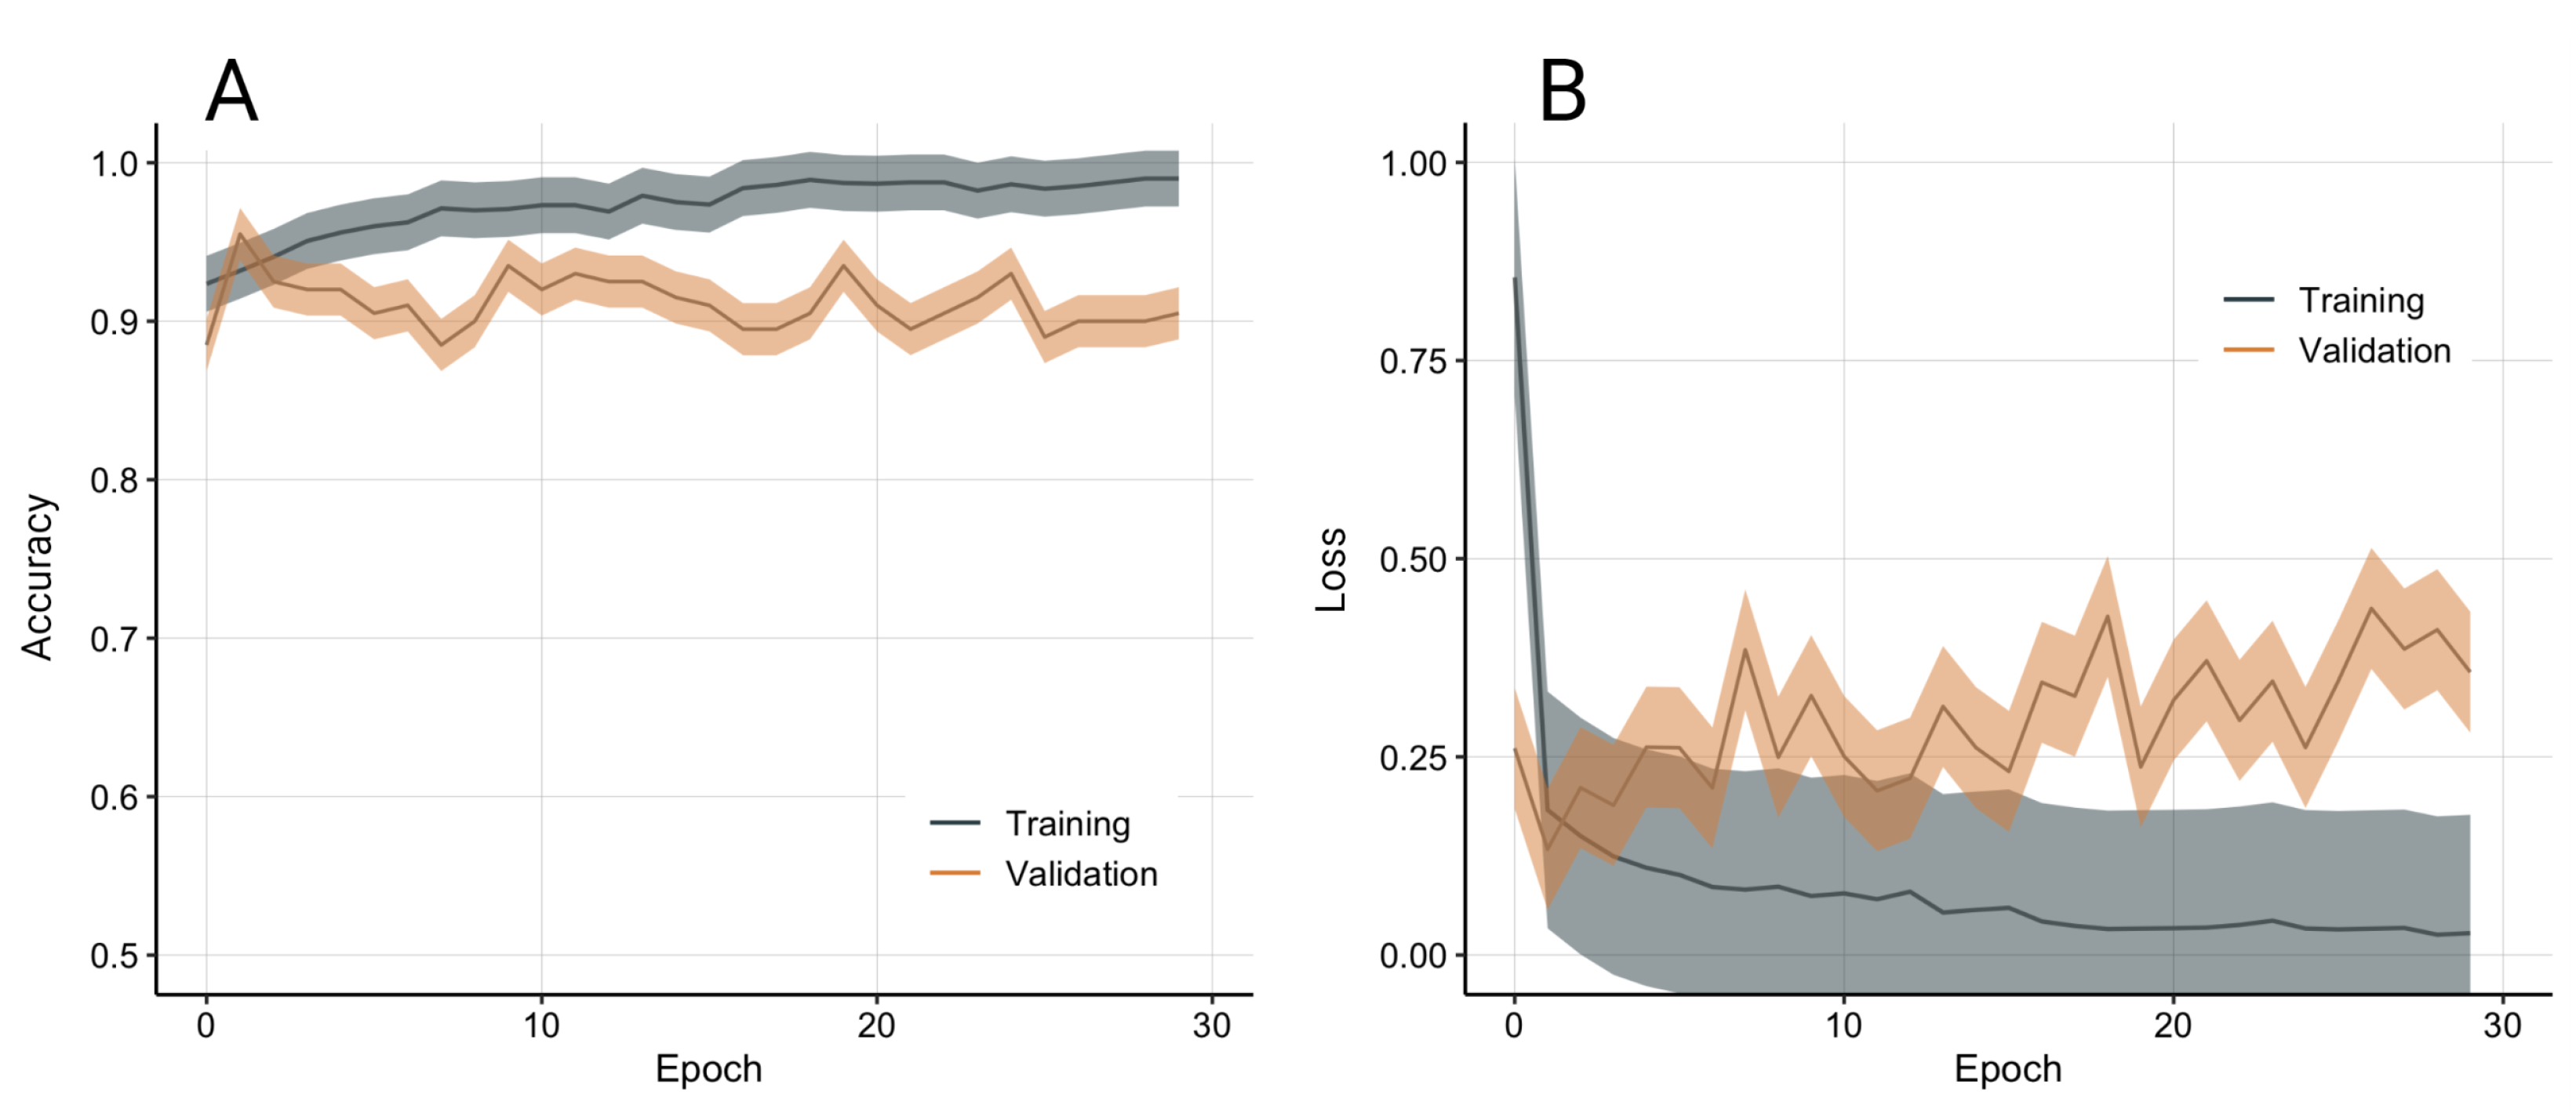
4.3. Convolutional Neural Network for qPCR Data Classification
5. Discussion
6. Conclusions
Author Contributions
Funding
Institutional Review Board Statement
Informed Consent Statement
Data Availability Statement
Conflicts of Interest
References
- Shrivastava, S.; Trung, T.Q.; Lee, N.E. Recent progress, challenges, and prospects of fully integrated mobile and wearable point-of-care testing systems for self-testing. Chem. Soc. Rev. 2020, 49, 1812–1866. [Google Scholar] [CrossRef] [PubMed]
- Llibre, A.; Shimakawa, Y.; Mottez, E.; Ainsworth, S.; Buivan, T.P.; Firth, R.; Harrison, E.; Rosenberg, A.R.; Meritet, J.F.; Fontanet, A.; et al. Development and clinical validation of the Genedrive point-of-care test for qualitative detection of hepatitis C virus. Gut 2018, 67, 2017–2024. [Google Scholar] [CrossRef] [PubMed] [Green Version]
- Fitzgerald, N.; Cross, M.; O’Shea, S.; Fox, J. Diagnosing acute HIV infection at point of care: A retrospective analysis of the sensitivity and specificity of a fourth-generation point-of-care test for detection of HIV core protein p24. Sex. Transm. Infect. 2017, 93, 100–101. [Google Scholar] [CrossRef] [PubMed]
- Thanakun, S.; Watanabe, H.; Thaweboon, S.; Izumi, Y. An effective technique for the processing of saliva for the analysis of leptin and adiponectin. Peptides 2013, 47, 60–65. [Google Scholar] [CrossRef]
- Cass, A.E.; Zhang, Y. Nucleic acid aptamers: Ideal reagents for point-of-care diagnostics? Faraday Discuss. 2011, 149, 49–61. [Google Scholar] [CrossRef]
- Mullis, K.; Faloona, F.; Scharf, S.; Saiki, R.; Horn, G.; Erlich, H. Specific enzymatic amplification of DNA in vitro: The polymerase chain reaction. Cold Spring Harb. Symp. Quant. Biol. 1986, 51, 263–273. [Google Scholar] [CrossRef] [Green Version]
- Ahrberg, C.D.; Ilic, B.R.; Manz, A.; Neuzil, P. Handheld real-time PCR device. Lab Chip 2016, 16, 586–592. [Google Scholar] [CrossRef] [Green Version]
- Koo, C.; Malapi-Wight, M.; Kim, H.S.; Cifci, O.S.; Vaughn-Diaz, V.L.; Ma, B.; Kim, S.; Abdel-Raziq, H.; Ong, K.; Jo, Y.K.; et al. Development of a real-time microchip PCR system for portable plant disease diagnosis. PLoS ONE 2013, 8, e82704. [Google Scholar] [CrossRef]
- Neuzil, P.; Zhang, C.; Pipper, J.; Oh, S.; Zhuo, L. Ultra fast miniaturized real-time PCR: 40 cycles in less than six minutes. Nucleic Acids Res. 2006, 34. [Google Scholar] [CrossRef]
- Mulberry, G.; White, K.A.; Vaidya, M.; Sugaya, K.; Kim, B.N. 3D printing and milling a real-time PCR device for infectious disease diagnostics. PLoS ONE 2017, 12, e179133. [Google Scholar] [CrossRef]
- Toumazou, C.; Lowe, S.B.; Green, S.W.; Harding, P.S.; Sanders, G.H.W.; Wooder, N.J.; Werdich, A.A.; Rene Clemens Twisk, M.; Heinz, R.J.Z.; Casey, J.; et al. Method and Apparatus for Analysing a Biological Sample. U.S. Patent 10,093,965 B2, 2018. [Google Scholar]
- Gibani, M.M.; Toumazou, C.; Sohbati, M.; Sahoo, R.; Karvela, M.; Hon, T.K.; De Mateo, S.; Burdett, A.; Leung, K.Y.F.; Barnett, J.; et al. Assessing a novel, lab-free, point-of-care test for SARS-CoV-2 (CovidNudge): A diagnostic accuracy study. Lancet Microbe 2020, 1, e300–e307. [Google Scholar] [CrossRef]
- Guo, X.; Wen, F.; Zheng, N.; Luo, Q.; Wang, H.; Wang, H.; Li, S.; Wang, J. Development of an ultrasensitive aptasensor for the detection of aflatoxin B1. Biosens. Bioelectron. 2014, 56, 340–344. [Google Scholar] [CrossRef] [PubMed]
- Modh, H.; Scheper, T.; Walter, J.G. Detection of ochratoxin A by aptamer-assisted real-time PCR-based assay (Apta-qPCR). Eng. Life Sci. 2017, 17, 923–930. [Google Scholar] [CrossRef] [PubMed] [Green Version]
- Teng, J.; Ye, Y.; Yao, L.; Yan, C.; Cheng, K.; Xue, F.; Pan, D.; Li, B.; Chen, W. Rolling circle amplification based amperometric aptamer/immuno hybrid biosensor for ultrasensitive detection of Vibrio parahaemolyticus. Microchim. Acta 2017, 184, 3477–3485. [Google Scholar] [CrossRef]
- Wu, F.; Liu, W.; Yang, S.; Yao, Q.; Chen, Y.; Weng, X.; Zhou, X. An aptamer-based ligation-triggered rolling circle amplification strategy for ATP detection and imaging in situ. J. Photochem. Photobiol. A Chem. 2018, 355, 114–119. [Google Scholar] [CrossRef]
- Cavallo, F.R.; Mirza, K.B.; de Mateo, S.; Manzano, J.R.; Nikolic, K.; Toumazou, C. A Point-of-Care Device for Sensitive Protein Quantification. In Proceedings of the 2021 IEEE International Symposium on Circuits and Systems (ISCAS), Daegu, Korea, 22–28 May 2021; pp. 1–5. [Google Scholar] [CrossRef]
- Cavallo, F.R.; Mirza, K.B.; De Mateo, S.; Nikolic, K.; Rodriguez-Manzano, J.; Toumazou, C. Aptasensor for Quantification of Leptin through PCR Amplification of Short DNA-Aptamers. ACS Sens. 2021, 6, 709–715. [Google Scholar] [CrossRef]
- Zhou, Y.; Rui, L. Leptin signaling and leptin resistance. Front. Med. 2013, 7, 207–222. [Google Scholar] [CrossRef]
- Wadden, T.A.; Considine, R.V.; Foster, G.D.; Anderson, D.A.; Sarwer, D.B.; Caro, J.S. Short-and long-term changes in serum leptin in dieting obese women: Effects of caloric restriction and weight loss. J. Clin. Endocrinol. Metab. 1998, 83, 214–218. [Google Scholar] [CrossRef]
- de Carvalho, L.G.F.; Lima, W.G.; Coelho, L.G.V.; Cardoso, V.N.; Fernandes, S.O.A. Circulating Leptin Levels as a Potential Biomarker in Inflammatory Bowel Diseases: A Systematic Review and Meta-Analysis. Inflamm. Bowel Dis. 2020, 27, 169–181. [Google Scholar] [CrossRef]
- Vavruch, C.; Länne, T.; Fredrikson, M.; Lindström, T.; östgren, C.J.; Nystrom, F.H. Serum leptin levels are independently related to the incidence of ischemic heart disease in a prospective study of patients with type 2 diabetes. Cardiovasc. Diabetol. 2015, 14, 62. [Google Scholar] [CrossRef] [Green Version]
- Friedman, J.M. Leptin and the endocrine control of energy balance. Nat. Metab. 2019, 1, 754–764. [Google Scholar] [CrossRef] [PubMed]
- Murtaza, G.; Rizvi, A.S.; Qu, F. Aptamer-Based Point of Care Testing Schemes. In Aptamers for Medical Applications: From Diagnosis to Therapeutics; Springer: Singapore, 2021; pp. 53–76. [Google Scholar] [CrossRef]
- Zhang, G.; Zhu, C.; Huang, Y.; Yan, J.; Chen, A. A Lateral Flow Strip Based Aptasensor for Detection of Ochratoxin A in Corn Samples. Molecules 2018, 23, 291. [Google Scholar] [CrossRef] [Green Version]
- Mukama, O.; Wu, W.; Wu, J.; Lu, X.; Liu, Y.; Liu, Y.; Liu, J.; Zeng, L. A highly sensitive and specific lateral flow aptasensor for the detection of human osteopontin. Talanta 2020, 210, 120624. [Google Scholar] [CrossRef] [PubMed]
- Dhiman, A.; Kalra, P.; Bansal, V.; Bruno, J.G.; Sharma, T.K. Aptamer-based point-of-care diagnostic platforms. Sens. Actuators B Chem. 2017, 246, 535–553. [Google Scholar] [CrossRef]
- Rutledge, R.G.; Coté, C. Mathematics of quantitative kinetic PCR and the application of standard curves. Nucleic Acids Res. 2003, 31, 93e. [Google Scholar] [CrossRef] [PubMed]
- Tellinghuisen, J.; Spiess, A.N. Comparing real-time quantitative polymerase chain reaction analysis methods for precision, linearity, and accuracy of estimating amplification efficiency. Anal. Biochem. 2014, 449, 76–82. [Google Scholar] [CrossRef]
- Zhao, S.; Fernald, R.D. Comprehensive algorithm for quantitative real-time polymerase chain reaction. J. Comput. Biol. 2005, 12, 1047–1064. [Google Scholar] [CrossRef]
- Guescini, M.; Sisti, D.; Rocchi, M.B.; Stocchi, L.; Stocchi, V. A new real-time PCR method to overcome significant quantitative inaccuracy due to slight amplification inhibition. BMC Bioinform. 2008, 9, 1–12. [Google Scholar] [CrossRef] [Green Version]
- Han, Z.; Francesca, C.; Nikolic, K.; Mirza, K.; Toumazou, C. Signal Identification of DNA Amplification Curves in Custom-PCR Platforms. In Proceedings of the 2021 IEEE International Symposium on Circuits and Systems (ISCAS), Daegu, Korea, 22–28 May 2021; pp. 1–5. [Google Scholar] [CrossRef]
- Rutledge, R.G. Sigmoidal curve-fitting redefines quantitative real-time PCR with the prospective of developing automated high-throughput applications. Nucleic Acids Res. 2004, 32, 1–8. [Google Scholar] [CrossRef] [Green Version]
- Moniri, A.; Rodriguez-Manzano, J.; Malpartida-Cardenas, K.; Yu, L.S.; Didelot, X.; Holmes, A.; Georgiou, P. Framework for DNA Quantification and Outlier Detection Using Multidimensional Standard Curves. Anal. Chem. 2019, 91, 7426–7434. [Google Scholar] [CrossRef] [Green Version]
- Ashley, J.; Li, S.F.Y. Three-dimensional selection of leptin aptamers using capillary electrophoresis and implications for clone validation. Anal. Biochem. 2013, 434, 146–152. [Google Scholar] [CrossRef] [PubMed]
- Lee, D.S. Real-time PCR machine system modeling and a systematic approach for the robust design of a real-time PCR-on-a-chip system. Sensors 2010, 10, 697–718. [Google Scholar] [CrossRef] [PubMed]
- Farooqi, I.S.; Keogh, J.M.; Kamath, S.; Jones, S.; Gibson, W.T.; Trussell, R.; Jebb, S.A.; Lip, G.Y.; O’rahilly, S. Metabolism: Partial leptin deficiency and human adiposity. Nature 2001, 414, 34–35. [Google Scholar] [CrossRef] [PubMed]
- Imagawa, K.; Matsumoto, Y.; Numata, Y.; Morita, A.; Kikuoka, S.; Tamaki, M.; Higashikubo, C.; Tsuji, T.; Sasakura, K.; Teraoka, H.; et al. Development of a sensitive ELISA for human leptin, using monoclonal antibodies. Clin. Chem. 1998, 44, 2165–2171. [Google Scholar] [CrossRef] [PubMed]
- He, Y.; Sun, J.; Wang, X.; Wang, L. Detection of human leptin in serum using chemiluminescence immunosensor: Signal amplification by hemin/ G-quadruplex DNAzymes and protein carriers by Fe3O4/ polydopamine/ Au nanocomposites. Sens. Actuators B Chem. 2015, 221, 792–798. [Google Scholar] [CrossRef]
- Tanaka, M.; Yoshioka, K.; Hirata, Y.; Fujimaki, M.; Kuwahara, M.; Niwa, O. Design and fabrication of biosensing interface for waveguide-mode sensor. Langmuir 2013, 29, 13111–13120. [Google Scholar] [CrossRef]
- Dong, F.; Luo, R.; Chen, H.; Zhang, W.; Ding, S. Amperometric immunosensor based on carbon nanotubes/chitosan film modified electrodes for detection of human leptin. Int. J. Electrochem. Sci. 2014, 9, 6924–6935. [Google Scholar]
- Cai, J.; Gou, X.; Sun, B.; Li, W.; Li, D.; Liu, J.; Hu, F.; Li, Y. Porous graphene-black phosphorus nanocomposite modified electrode for detection of leptin. Biosens. Bioelectron. 2019, 137, 88–95. [Google Scholar] [CrossRef]
- Chen, W.; Lei, Y.; Li, C.M. Regenerable leptin immunosensor based on protein G immobilized au-pyrrole propylic acid-polypyrrole nanocomposite. Electroanalysis 2010, 22, 1078–1083. [Google Scholar] [CrossRef]
- Ojeda, I.; Moreno-Guzmán, M.; González-Cortés, A.; Yáñez-Sedeño, P.; Pingarrón, J.M. A disposable electrochemical immunosensor for the determination of leptin in serum and breast milk. Analyst 2013, 138, 4284–4291. [Google Scholar] [CrossRef] [Green Version]


| Name | Sequence (5’ to 3’) |
|---|---|
| Aptamer | GTTAATGGGGGATCTCGCGGCCGTTCTTGTTGCTTATACA |
| Adaptor | GCTACCCCGACCACATGAAGCAGCACGACTTCTTCAAGTCCGCCATGCCCGAAGGCTACGTCCAGGAGCGCACCATCTTCTTCAAGGACGACGGCAACTAAAAAATGTATAAGCAACAAGAACGGC |
| Complex | GCTACCCCGACCACATGAAGCAGCACGACTTCTTCAAGTCCGCCATGCCCGAAGGCTACGTCCAGGAGCGCACCATCTTCTTCAAGGACGACGGCAACTAAAAAATGTATAAGCAACAAGAACGGCCGCGAGATCCCCCATTAAC |
| Forward primer | CACATGAAGCAGCACGACTT |
| Reverse primer | TGGGGGATCTCGTGGC |
| Reference | Assay Type | LoD | K | HoT a | TtR | Sample |
|---|---|---|---|---|---|---|
| Imagawa, 1998 [38] | ELISA | 0.78 pg/mL | 83 pM | N/A | 15 h + | 100 L |
| He, 2015 [39] | Chemiluminescent immunosensor | 0.3 pg/mL | N/A | N/A | 44 h + | 100 L |
| Tanaka, 2013 [40] | Waveguide-mode sensor | 100 ng/mL | N/A | N/A | 24 h + | 400 L |
| Dong, 2014 [41] | Electrochemical immunosensor | 30 pg/mL | N/A | N/A | 8 h + | - |
| Cai, 2019 [42] | Electrochemical immunosensor | 0.036 pg/mL | N/A | N/A | 78 h + | - |
| Chen, 2010 [43] | Electrochemical immunosensor | 10 ng/mL | N/A | N/A | 13 h + | - |
| Ojeda, 2013 [44] | Electrochemical immunosensor | 0.5 pg/mL | N/A | N/A | 95 min + | 50 L |
| Commercial ELISA | ELISA | 15.6 pg/mL | N/A | 1 h 20 min | 3 h | 10, 100 Lb |
| This work | Optical (qPCR) aptasensor | 100 pg/mL | 1.5 M | 0 min | <2 h | 10 L |
| Software | Exp. 1 | Exp. 2 | Exp. 3 |
|---|---|---|---|
| PeakFluo | 0.984 | 0.987 | 0.77 |
| Roche LightCycler® 96 | 0.384 | 0.973 | 0.53 |
Publisher’s Note: MDPI stays neutral with regard to jurisdictional claims in published maps and institutional affiliations. |
© 2022 by the authors. Licensee MDPI, Basel, Switzerland. This article is an open access article distributed under the terms and conditions of the Creative Commons Attribution (CC BY) license (https://creativecommons.org/licenses/by/4.0/).
Share and Cite
Cavallo, F.R.; Mirza, K.B.; de Mateo, S.; Miglietta, L.; Rodriguez-Manzano , J.; Nikolic, K.; Toumazou, C. A Point-of-Care Device for Fully Automated, Fast and Sensitive Protein Quantification via qPCR. Biosensors 2022, 12, 537. https://doi.org/10.3390/bios12070537
Cavallo FR, Mirza KB, de Mateo S, Miglietta L, Rodriguez-Manzano J, Nikolic K, Toumazou C. A Point-of-Care Device for Fully Automated, Fast and Sensitive Protein Quantification via qPCR. Biosensors. 2022; 12(7):537. https://doi.org/10.3390/bios12070537
Chicago/Turabian StyleCavallo, Francesca Romana, Khalid Baig Mirza, Sara de Mateo, Luca Miglietta, Jesus Rodriguez-Manzano , Konstantin Nikolic, and Christofer Toumazou. 2022. "A Point-of-Care Device for Fully Automated, Fast and Sensitive Protein Quantification via qPCR" Biosensors 12, no. 7: 537. https://doi.org/10.3390/bios12070537