Probing Denaturation of Protein A via Surface-Enhanced Infrared Absorption Spectroscopy

 ,
,  , , ,
, , ,  , and
, and 
Abstract
:1. Introduction
2. Materials and Methods
2.1. Modeling and Design
2.2. Fabrication
2.3. Biological Assay Preparation
2.3.1. Bioconjugation of MS Pixels with PA
2.3.2. PA Denaturation Protocol
2.4. IR Characterization
3. Results and Discussion
4. Conclusions
Author Contributions
Funding
Institutional Review Board Statement
Informed Consent Statement
Data Availability Statement
Conflicts of Interest
References
- Chalmers, J.; Griffiths, P.R. Handbook of Vibrational Spectroscopy; John Wiley and Son: Chichester, UK, 2003. [Google Scholar] [CrossRef]
- Stuart, B.H. Spectral Analysis. In Infrared Spectroscopy: Fundamentals and Applications; John Wiley and Son: Chichester, UK, 2004. [Google Scholar] [CrossRef]
- Ghosh, A.; Ostrander, J.S.; Zanni, M.T. Watching Proteins Wiggle: Mapping Structures with Two-Dimensional Infrared Spectroscopy. Chem. Rev. 2017, 117, 10726–10759. [Google Scholar] [CrossRef] [PubMed]
- Kottke, T.; Loŕenz-Fonfrá, V.A.; Heberle, J. The Grateful Infrared: Sequential Protein Structural Changes Resolved by Infrared Difference Spectroscopy. J. Phys. Chem. B 2017, 121, 335–350. [Google Scholar] [CrossRef] [PubMed]
- Arkin, I.T. Isotope-Edited IR Spectroscopy for the Study of Membrane Proteins. Curr. Opin. Chem. Biol. 2006, 10, 394–401. [Google Scholar] [CrossRef] [PubMed]
- Tamm, L.K.; Tatulian, S.A. Infrared Spectroscopy of Proteins and Peptides in Lipid Bilayers. Q. Rev. Biophys. 1997, 30, 365–429. [Google Scholar] [CrossRef] [Green Version]
- Barth, A. Infrared Spectroscopy of Proteins. Biochim. Biophys. Acta-Bioenerg. 2007, 1767, 1073–1101. [Google Scholar] [CrossRef] [Green Version]
- Goormaghtigh, E.; Raussens, V.; Ruysschaert, J.-M. Attenuated Total Reflection Infrared Spectroscopy of Proteins and Lipids in Biological Membranes. Biochim. Biophys. Acta-Rev. Biomembr. 1999, 1422, 105–185. [Google Scholar] [CrossRef]
- Mäntele, W. Reaction-Induced Infrared Difference Spectroscopy for the Study of Protein Function and Reaction Mechanisms. Trends Biochem. Sci. 1993, 18, 197–202. [Google Scholar] [CrossRef]
- Vogel, R.; Siebert, F. Vibrational Spectroscopy as a Tool for Probing Protein Function. Curr. Opin. Chem. Biol. 2000, 4, 518–523. [Google Scholar] [CrossRef]
- Leeson, D.T.; Gai, F.; Rodriguez, H.M.; Gregoret, L.M.; Dyer, R.B. Protein Folding and Unfolding on a Complex Energy Landscape. Proc. Natl. Acad. Sci. USA 2000, 97, 2527–2532. [Google Scholar] [CrossRef] [Green Version]
- Chung, H.S.; Ganim, Z.; Jones, K.C.; Tokmakoff, A. Transient 2D IR Spectroscopy of Ubiquitin Unfolding Dynamics. Proc. Natl. Acad. Sci. USA 2007, 104, 14237–14242. [Google Scholar] [CrossRef] [Green Version]
- Zscherp, C.; Barth, A. Reaction-Induced Infrared Difference Spectroscopy for the Study of Protein Reaction Mechanisms. Biochemistry 2001, 40, 1875–1883. [Google Scholar] [CrossRef] [PubMed]
- Nyquist, R.M.; Ataka, K.; Heberle, J. The Molecular Mechanism of Membrane Proteins Probed by Evanescent Infrared Waves. ChemBioChem 2004, 5, 431–436. [Google Scholar] [CrossRef] [PubMed]
- Griffiths, P.R.; de Haseth, J.A. Fourier Transform Infrared Spectrometry; John Wiley and Son: Chichester, UK, 2007. [Google Scholar] [CrossRef] [Green Version]
- Neubrech, F.; Huck, C.; Weber, K.; Pucci, A.; Giessen, H. Surface-Enhanced Infrared Spectroscopy Using Resonant Nanoantennas. Chem. Rev. 2017, 117, 5110–5145. [Google Scholar] [CrossRef] [PubMed]
- Adato, R.; Aksu, S.; Altug, H. Engineering Mid-Infrared Nanoantennas for Surface Enhanced Infrared Absorption Spectroscopy. Mater. Today 2015, 18, 436–446. [Google Scholar] [CrossRef]
- Zucchiatti, P.; Birarda, G.; Cerea, A.; Semrau, M.S.; Hubarevich, A.; Storici, P.; De Angelis, F.; Toma, A.; Vaccari, L. Binding of tyrosine kinase inhibitor to epidermal growth factor receptor: Surface-enhanced infrared absorption microscopy reveals subtle protein secondary structure variation. Nanoscale 2021, 13, 7667–7677. [Google Scholar] [CrossRef]
- De Tommasi, E.; Esposito, E.; Romano, S.; Crescitelli, A.; Di Meo, V.; Mocella, V.; Zito, G.; Rendina, I. Frontiers of Light Manipulation in Natural, Metallic, and Dielectric Nanostructures. La Rivista del Nuovo Cimento 2021, 44, 1–68. [Google Scholar] [CrossRef]
- Schuller, J.A.; Barnard, E.S.; Cai, W.; Jun, Y.C.; White, J.S.; Brongersma, M.L. Plasmonics for Extreme Light Concentration and Manipulation. Nat. Mater. 2010, 9, 193–204. [Google Scholar] [CrossRef]
- Arbabi, A.; Horie, Y.; Bagheri, M.; Faraon, A. Dielectric Metasurfaces for Complete Control of Phase and Polarization with Subwavelength Spatial Resolution and High Transmission. Nat. Nanotechnol. 2015, 10, 937–943. [Google Scholar] [CrossRef] [Green Version]
- Yu, N.; Capasso, F. Flat optics with designer metasurfaces. Nat. Mater. 2014, 13, 139–150. [Google Scholar] [CrossRef]
- Chen, M.K.; Wu, Y.; Feng, L.; Fan, Q.; Lu, M.; Xu, T.; Tsai, D.P. Principles, Functions, and Applications of Optical Meta-Lens. Adv. Opt. Mater. 2021, 9, 2001414. [Google Scholar] [CrossRef]
- Liu, N.; Mesch, M.; Weiss, T.; Hentschel, M.; Giessen. H. Infrared Perfect Absorber and Its Application As Plasmonic Sensor. Nano Lett. 2010, 10, 2342–2348. [Google Scholar] [CrossRef] [PubMed]
- Yu, N.; Aieta, F.; Genevet, P.; Kats, M.P.; Gaburro, Z.; Capasso, F. A Broadband, Background-Free Quarter-Wave Plate Based on Plasmonic Metasurfaces. Nano Lett. 2012, 12, 6328–6333. [Google Scholar] [CrossRef] [PubMed]
- Khorasaninejad, M.; Chen, W.T.; Devlin, R.C.; Oh, J.; Zhu, A.Y.; Capasso, F. Metalenses at Visible Wavelengths: Diffraction-Limited Focusing and Subwavelength Resolution Imaging. Science 2016, 352, 1190–1194. [Google Scholar] [CrossRef] [PubMed] [Green Version]
- Maier, S.A.; Brongersma, M.L.; Kik, P.G.; Meltzer, S.; Requicha, A.A.G.; Atwater, H.A. Plasmonics—A Route to Nanoscale Optical Devices. Adv. Mater. 2001, 13, 1501–1505. [Google Scholar] [CrossRef]
- Leitis, A.; Tittl, A.; Liu, M.; Lee, B.H.; Gu, M.B.; Kivshar, Y.S.; Altug, H. Angle-Multiplexed All-Dielectric Metasurfaces for Broadband Molecular Fingerprint Retrieval. Sci. Adv. 2019, 5, 1–8. [Google Scholar] [CrossRef] [Green Version]
- Aslan, E.; Kaya, S.; Aslan, E.; Korkmaz, S.; Saracoglu, O.G.; Turkmen, M. Polarization Insensitive Plasmonic Perfect Absorber with Coupled Antisymmetric Nanorod Array. Sens. Actuators B Chem. 2017, 243, 617–625. [Google Scholar] [CrossRef]
- Nie, S.; Emory, S.R. Probing Single Molecules and Single Nanoparticles by Surface-Enhanced Raman Scattering. Science 1997, 275, 1102–1106. [Google Scholar] [CrossRef]
- Kneipp, K.; Wang, Y.; Kneipp, H.; Perelman, L.T.; Itzkan, I.; Dasari, R.R.; Feld, M.S. Single Molecule Detection Using Surface-Enhanced Raman Scattering (SERS). Phys. Rev. Lett. 1997, 78, 1667–1670. [Google Scholar] [CrossRef] [Green Version]
- Jeanmaire, D.L.; Van Duyne, R.P. Surface Raman Spectroelectrochemistry: Part I. Heterocyclic, Aromatic, and Aliphatic Amines Adsorbed on the Anodized Silver Electrode. J. Electroanal. Chem. Interf. Electrochem. 1977, 84, 1–20. [Google Scholar] [CrossRef]
- Albrecht, M.G.; Creighton, J.A. Anomalously Intense Raman Spectra of Pyridine at a Silver Electrode. J. Am. Chem. Soc. 1977, 99, 5215–5217. [Google Scholar] [CrossRef]
- Hartstein, A.; Kirtley, J.R.; Tsang, J.C. Enhancement of the Infrared Absorption from Molecular Monolayers with Thin Metal Overlayers. Phys. Rev. Lett. 1980, 45, 201–204. [Google Scholar] [CrossRef]
- Novotny, L. Effective Wavelength Scaling for Optical Antennas. Phys. Rev. Lett. 2007, 98, 266802. [Google Scholar] [CrossRef] [PubMed] [Green Version]
- John-Herpin, A.; Tittl, A.; Kühner, L.; Richter, F.; Huang, S.H.; Shvets, G.; Oh, S.H.; Altug, H. Metasurface-Enhanced Infrared Spectroscopy: An Abundance of Materials and Functionalities. Adv. Mater. 2022, 2110163. [Google Scholar] [CrossRef]
- Di Meo, V.; Caporale, A.; Crescitelli, A.; Janneh, M.; Palange, E.; De Marcellis, A.; Portaccio, M.; Lepore, M.; Rendina, I.; Ruvo, M.; et al. Metasurface Based on Cross-Shaped Plasmonic Nanoantennas as Chemical Sensor for Surface-Enhanced Infrared Absorption Spectroscopy. Sens. Actuators B Chem. 2019, 286, 600–607. [Google Scholar] [CrossRef]
- Di Meo, V.; Crescitelli, A.; Moccia, M.; Sandomenico, A.; Cusano, A.M.; Portaccio, M.; Lepore, M.; Galdi, V.; Esposito, E. Pixeled Metasurface for Multiwavelength Detection of Vitamin D. Nanophotonics 2020, 9, 3921–3930. [Google Scholar] [CrossRef]
- Di Meo, V.; Moccia, M.; Sanità, G.; Crescitelli, A.; Lamberti, A.; Galdi, V.; Rendina, I.; Esposito, E. Advanced DNA Detection via Multispectral Plasmonic Metasurfaces. Front. Bioeng. Biotechnol. 2021, 9, 666121. [Google Scholar] [CrossRef] [PubMed]
- Akiyama, S.; Takashi, S.; Ishimori, K.; Morishima, I. Stepwise Formation of a-Helices During Cytochrome c Folding. Nat. Struct. Biol. 2020, 6, 514–520. [Google Scholar] [CrossRef] [PubMed]
- Anfinsen, C.B. Principles that Govern the Folding of Protein Chains. Science 1973, 181, 223–230. [Google Scholar] [CrossRef] [Green Version]
- Konermann, L. Protein Unfolding and Denaturants; John Wiley & Sons: Chichester, UK, 2012. [Google Scholar] [CrossRef]
- Fennema Galparsoro, D.; Zhou, X.; Jaaloul, A.; Piccirilli, F.; Vetri, V.; Foderà, V. Conformational Transitions upon Maturation Rule Surface and pH-Responsiveness of α-Lactalbumin Microparticulates. ACS Appl. Bio Mater. 2021, 4, 1876–1887. [Google Scholar] [CrossRef]
- Lorenz-Fonfria, V.A. Infrared Difference Spectroscopy of Proteins: From Bands to Bonds. Chem. Rev. 2020, 120, 3466–3576. [Google Scholar] [CrossRef]
- Dempsey, A.C.; Walsh, M.P.; Shaw, G.S. Unmasking the Annexin I Interaction from the Structure of apo-S100A11. Structure 2003, 11, 887–897. [Google Scholar] [CrossRef] [Green Version]
- Konermann, L.; Pan, J.; Liu, Y. Hydrogen Exchange Mass Spectrometry for Studying Protein Structure and Dynamics. Chem. Soc. Rev. 2011, 40, 1224–1234. [Google Scholar] [CrossRef] [PubMed]
- Bartlett, A.I.; Radford, S.E. An expanding Arsenal of Experimental Methods Yields an Explosion of Insights into Protein Folding Mechanisms. Nat. Struct. Mol. Biol. 2009, 16, 582–588. [Google Scholar] [CrossRef] [PubMed]
- Atkins, K.L.; Burman, J.D.; Chamberlain, E.S.; Cooper, J.E.; Poutrel, B.; Bagby, S.; Jenkins, A.T.A.; Feil, E.J.; van den Elsen, J.M.H. S. aureus IgG-binding proteins SpA and Sbi: Host specificity and mechanisms of immune complex formation. Mol. Immunol. 2008, 45, 1600–1611. [Google Scholar] [CrossRef]
- Graille, M.; Stura, E.A.; Corper, A.L.; Sutton, B.J.; Taussig, M.J.; Charbonnier, J.B.; Silverman, G.J. Crystal structure of a Staphylococcus aureus protein A domain complexed with the Fab fragment of a human IgM antibody: Structural basis for recognition of B-cell receptors and superantigen activity. Proc. Natl. Acad. Sci. USA 2000, 97, 5399–5404. [Google Scholar] [CrossRef] [Green Version]
- COMSOL Multiphysics® v.5.1; COMSOL AB: Stockholm, Sweden, 2015.
- Laman, N.; Grischkowsky, D. Terahertz Conductivity of Thin Metal Films. Appl. Phys. Lett. 2008, 93, 051105. [Google Scholar] [CrossRef] [Green Version]
- Chandler-Horowitz, D.; Amirtharaj, P.M. High-Accuracy, Midinfrared (450 cm−1 ≤ ω ≤ 4000 cm−1) Refractive Index Values of Silicon. J. Appl. Phys. 2005, 97, 123526. [Google Scholar] [CrossRef]
- Maystre, D. Theory of Wood’s Anomalies. In Plasmonics: From Basics to Advanced Topics; Enoch, S., Bonod, N., Eds.; Springer: Berlin/Heidelberg, Germany, 2012; pp. 39–83. [Google Scholar] [CrossRef]
- Adato, R.; Yanik, A.A.; Amsden, J.J.; Kaplan, D.L.; Omenetto, F.G.; Hong, M.K.; Erramilli, S.; Altug, H. Ultra-Sensitive Vibrational Spectroscopy of Protein Monolayers with Plasmonic Nanoantenna Arrays. Proc. Natl. Acad. Sci. USA 2009, 106, 19227–19232. [Google Scholar] [CrossRef] [Green Version]
- Bagheri, S.; Weber, K.; Gissibl, T.; Weiss, T.; Neubrech, F.; Giessen, H. Fabrication of Square-Centimeter Plasmonic Nanoantenna Arrays by Femtosecond Direct Laser Writing Lithography: Effects of Collective Excitations on SEIRA Enhancement. ACS Photonics 2015, 2, 779–786. [Google Scholar] [CrossRef]
- Hwang, I.; Kim, M.; Yu, J.; Lee, J.; Choi, J.H.; Park, S.A.; Chang, W.S.; Lee, J.; Jung, J.Y. Ultrasensitive Molecule Detection Based on Infrared Metamaterial Absorber with Vertical Nanogap. Small Methods 2021, 5, 2100277. [Google Scholar] [CrossRef]
- Bagheri, S.; Giessen, H.; Neubrech, F. Large-Area Antenna-Assisted SEIRA Substrates by Laser Interference Lithography. Adv. Opt. Mater. 2014, 2, 1050–1056. [Google Scholar] [CrossRef]
- Eaton, G.; Symons, M.C.R.; Rastogi, P.P. Spectroscopic Studies of the Solvation of Amides with N-H Groups. Part 1. The Carbonyl Group. J. Chem. Soc. Faraday Trans. 1 1989, 85, 3257. [Google Scholar] [CrossRef]
- Torii, H.; Tatsumi, T.; Tasumi, M. Effects of Hydration on the Structure, Vibrational Wavenumbers, Vibrational Force Field and Resonance Raman Intensities of N-Methylacetamide. J. Raman Spectrosc. 1998, 29, 537–546. [Google Scholar] [CrossRef]
- Kubelka, J.; Keiderling, T.A. Ab Initio Calculation of Amide Carbonyl Stretch Vibrational Frequencies in solution with Modified Basis Sets. 1. N-Methyl Acetamide. J. Phys. Chem. A 2001, 105, 10922–10928. [Google Scholar] [CrossRef]
- Venyaminov, S.Y.; Kalnin, N.N. Quantitative IR Spectrophotometry of Peptide Compounds in Water (H2O) Solutions. II. Amide Absorption Bands of Polypeptides and Fibrous Proteins in α-, β-, and Random Coil Conformations. Biopolymers 1990, 30, 1259–1271. [Google Scholar] [CrossRef]
- Goormaghtigh, E.; Cabiaux, V.; Ruysschaert, J.M. Determination of Soluble and Membrane Protein Structure by Fourier Transform Infrared Spectroscopy. II. Experimental Aspects, Side Chain Structure, and H/D Exchange. Subcell. Biochem. 1994, 23, 363–403. [Google Scholar] [CrossRef]
- Goormaghtigh, E.; Cabiaux, V.; Ruysschaert, J.-M. Determination of Soluble and Membrane Protein Structure by Fourier Transform Infrared Spectroscopy. III. Secondary Structures. Subcell. Biochem. 1994, 23, 405–450. [Google Scholar] [CrossRef]
- Jiang, X.; Zaitseva, E.; Schmidt, M.; Siebert, F.; Engelhard, M.; Schlesinger, R.; Ataka, K.; Vogel, R.; Heberle, J. Resolving Voltage-Dependent Structural Changes of a Membrane Photoreceptor by Surface-Enhanced IR Difference Spectroscopy. Proc. Natl. Acad. Sci. USA 2008, 105, 12113–12117. [Google Scholar] [CrossRef] [Green Version]
- Forbrig, E.; Staffa, J.K.; Salewski, J.; Mroginski, M.A.; Hildebrandt, P.; Kozuch, J. Monitoring the Orientational Changes of Alamethicin during Incorporation into Bilayer Lipid Membranes. Langmuir 2018, 34, 2373–2385. [Google Scholar] [CrossRef]


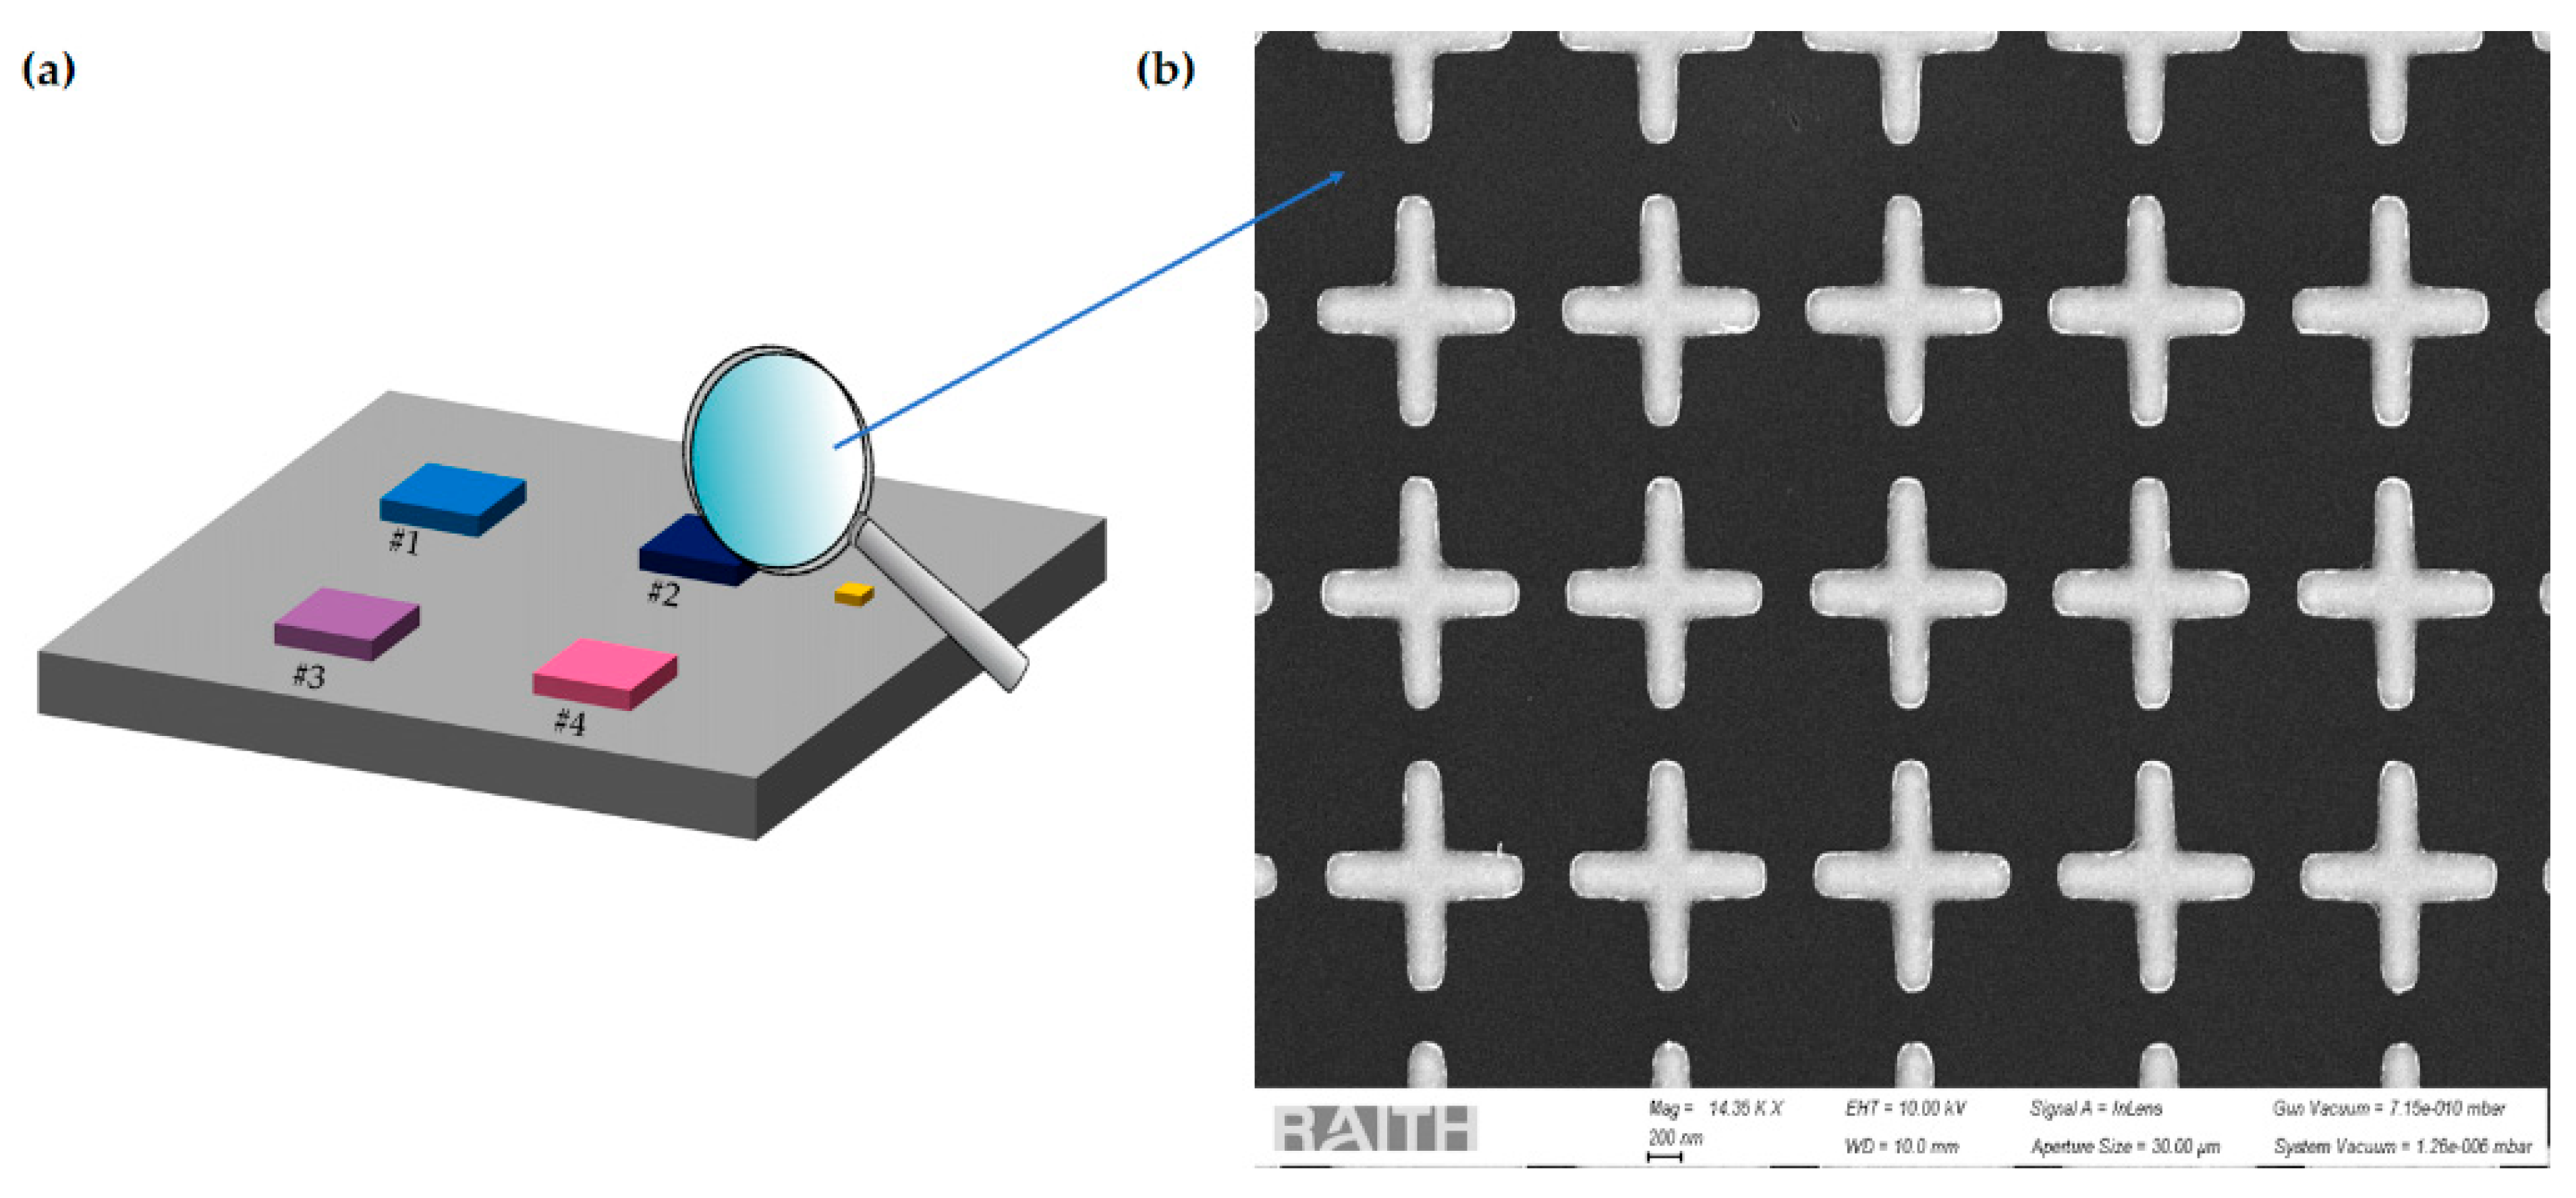
| Geometrical Parameters | νexp (cm−1) | νnum (cm−1) | |||
|---|---|---|---|---|---|
| L (nm) | W (nm) | p (µm) | |||
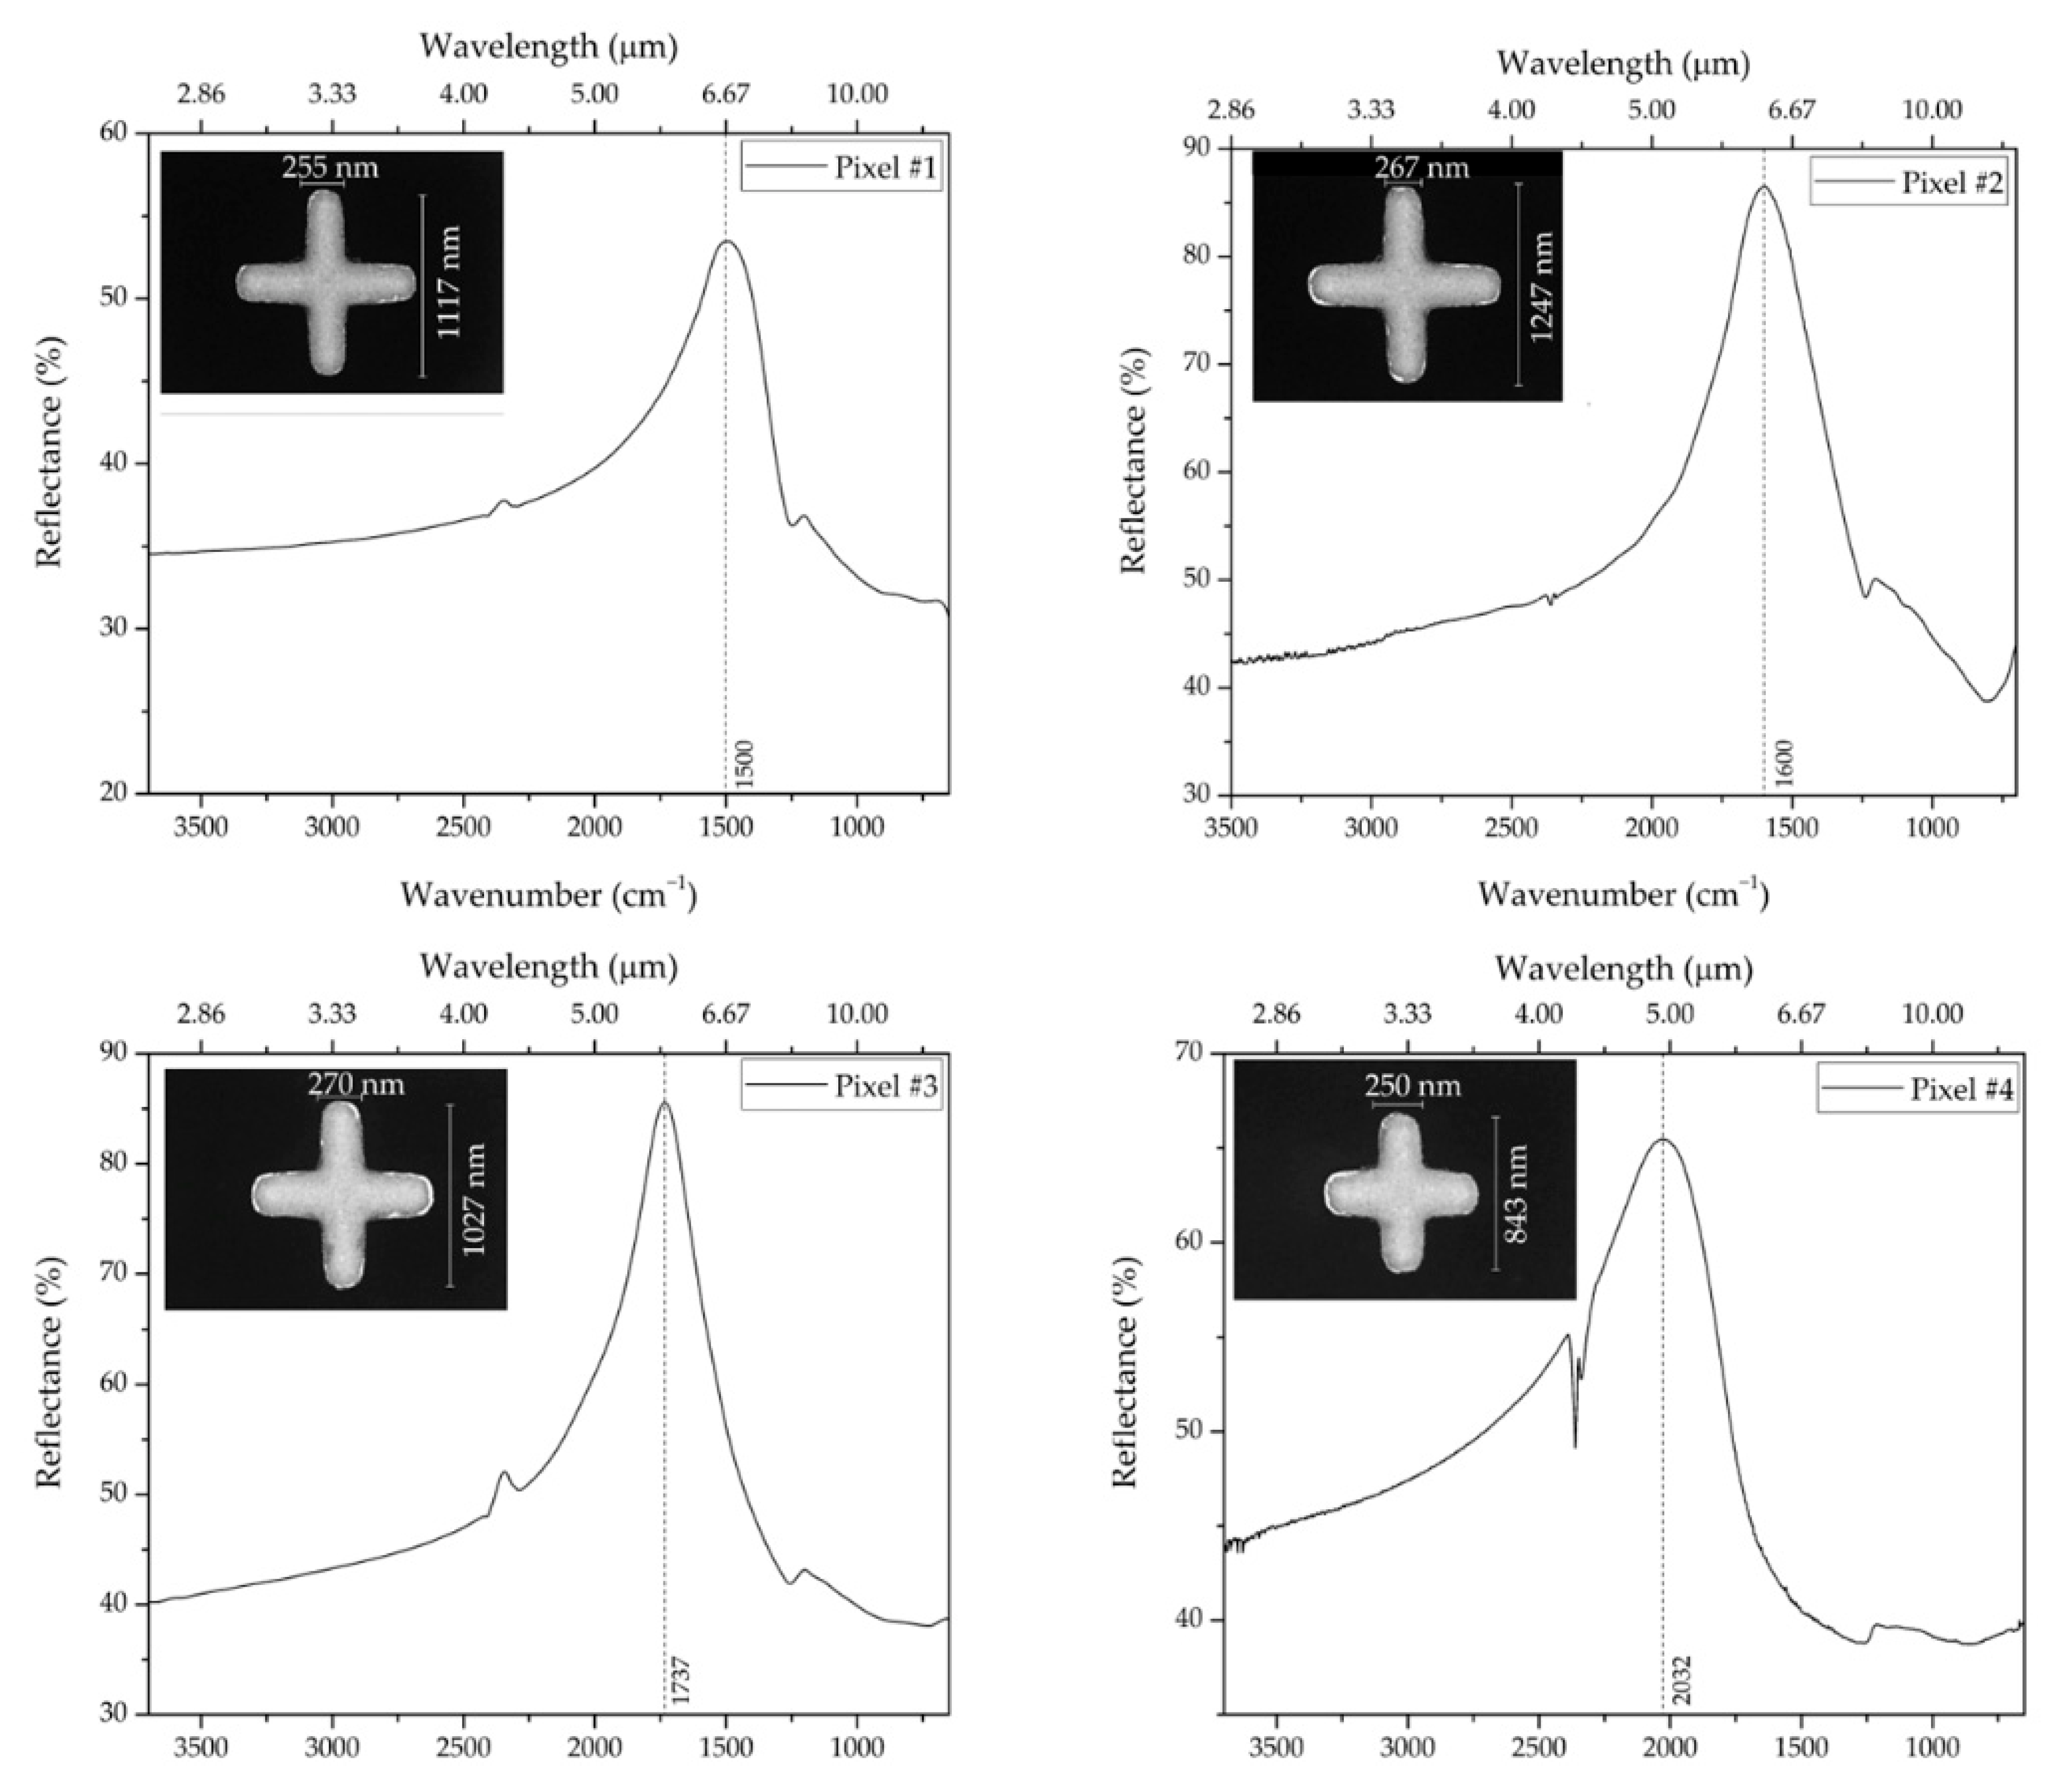
| Pixel #1 | 1117 | 255 | 2.0 | 1500 | 1457.5 |
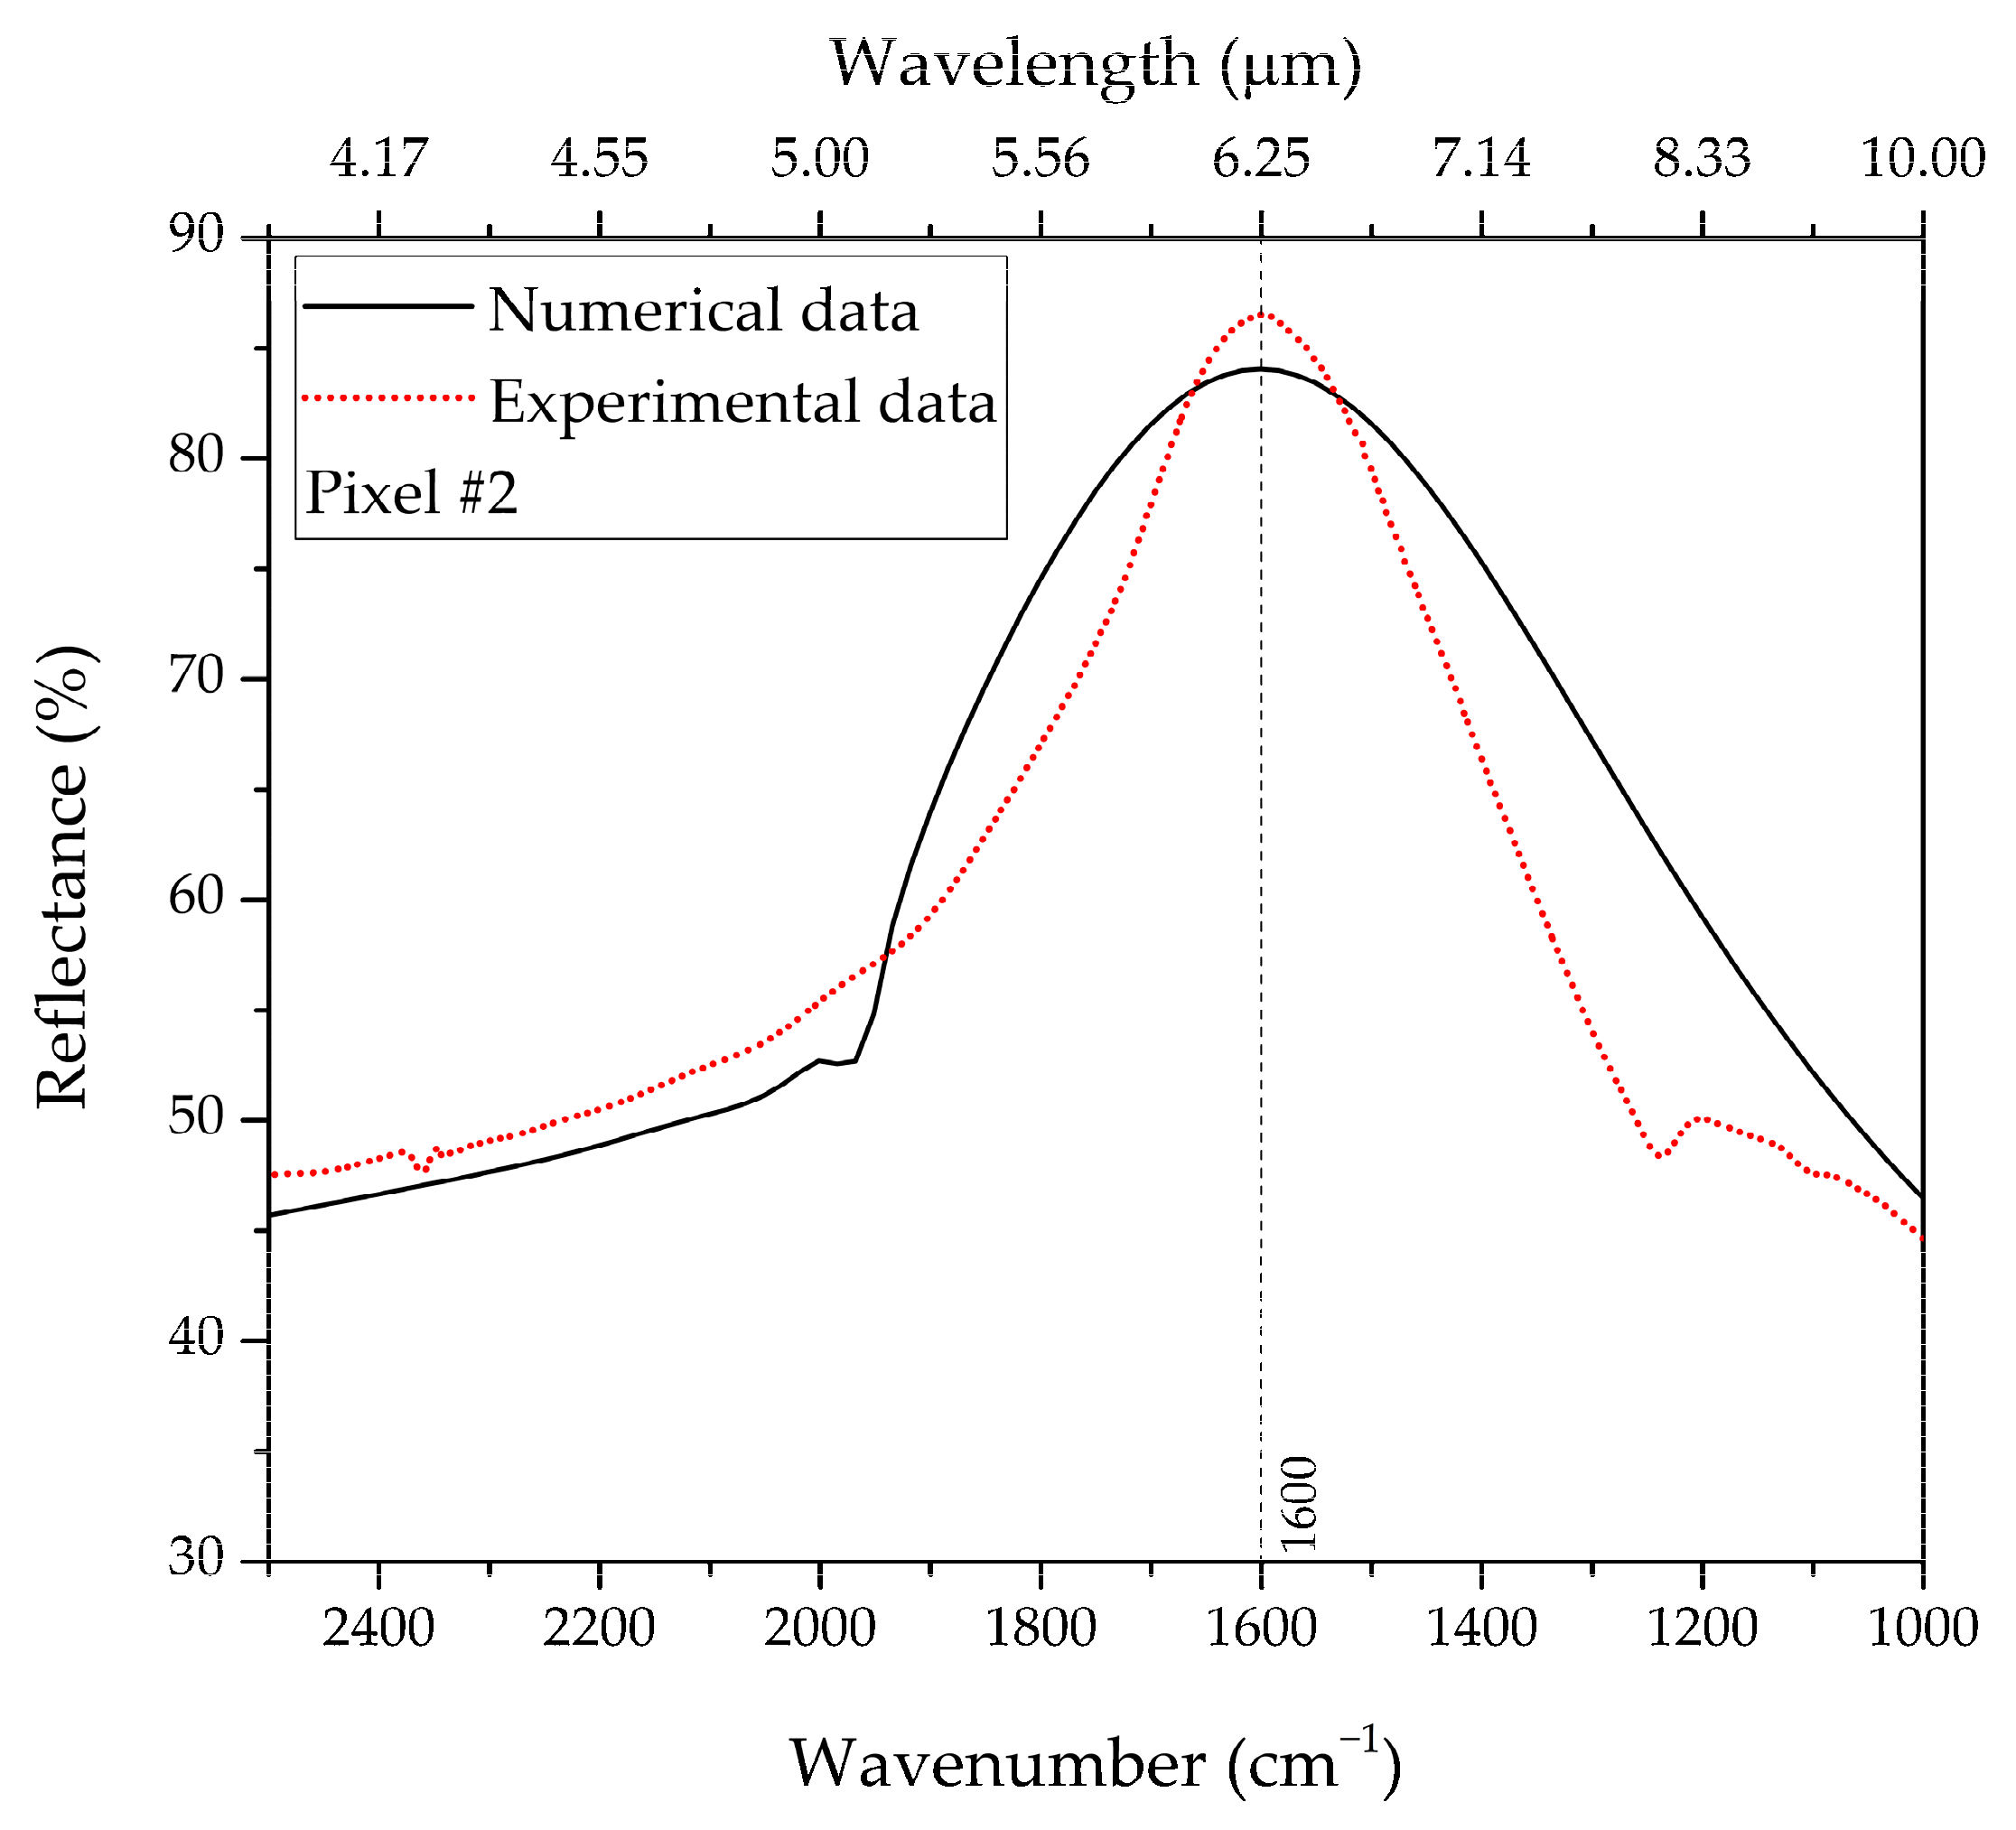
| Pixel #2 | 1247 | 267 | 1.5 | 1600 | 1601.11 |
| Pixel #3 | 1027 | 270 | 1.5 | 1737 | 1834.5 |
| Pixel #4 | 843 | 250 | 1.5 | 2032 | 1945 |
Publisher’s Note: MDPI stays neutral with regard to jurisdictional claims in published maps and institutional affiliations. |
© 2022 by the authors. Licensee MDPI, Basel, Switzerland. This article is an open access article distributed under the terms and conditions of the Creative Commons Attribution (CC BY) license (https://creativecommons.org/licenses/by/4.0/).
Share and Cite
Di Meo, V.; Moccia, M.; Sanità, G.; Crescitelli, A.; Lamberti, A.; Galdi, V.; Rendina, I.; Esposito, E. Probing Denaturation of Protein A via Surface-Enhanced Infrared Absorption Spectroscopy. Biosensors 2022, 12, 530. https://doi.org/10.3390/bios12070530
Di Meo V, Moccia M, Sanità G, Crescitelli A, Lamberti A, Galdi V, Rendina I, Esposito E. Probing Denaturation of Protein A via Surface-Enhanced Infrared Absorption Spectroscopy. Biosensors. 2022; 12(7):530. https://doi.org/10.3390/bios12070530
Chicago/Turabian StyleDi Meo, Valentina, Massimo Moccia, Gennaro Sanità, Alessio Crescitelli, Annalisa Lamberti, Vincenzo Galdi, Ivo Rendina, and Emanuela Esposito. 2022. "Probing Denaturation of Protein A via Surface-Enhanced Infrared Absorption Spectroscopy" Biosensors 12, no. 7: 530. https://doi.org/10.3390/bios12070530