Article

Measuring Bikeshare Access/Egress Transferring Distance and Catchment Area around Metro Stations from Smartcard Data

School of Transportation, Southeast University, Nanjing 211189, China
*
Author to whom correspondence should be addressed.
Information 2018, 9(11), 289; https://doi.org/10.3390/info9110289
Submission received: 13 September 2018 / Revised: 10 November 2018 / Accepted: 14 November 2018 / Published: 19 November 2018

Abstract

:
Metro–bikeshare integration is considered a green and efficient travel model. To better develop such integration, it is necessary to monitor and analyze metro–bikeshare transfer characteristics. This paper measures access and egress transferring distances and catchment areas based on smartcard data. A cubic regression model is conducted for the exploration of the 85th access and egress network-based transferring distance around metro stations. Then, the independent samples t-test and one-way analysis of variance (ANOVA) are used to explore access and egress transfer characteristics in demographic groups and spatial and temporal dimension. Additionally, the catchment area is delineated by applying both the network-based distance method and Euclidean distance method. The result reveals that males outcompete females both in access and egress distances and urban dwellers ride a shorter distance than those in suburban areas. Access and egress distances are both shorter in morning peak hours than those in evening peak hours and access distance on weekdays is longer than that on weekends. In addition, network-based catchment area accounts for over 90% of Euclidean catchment area in urban areas, while most of the ratios are less than 85% in suburban. The paper uses data from Nanjing, China as a case study. This study serves as a scientific basis for policy makers and bikeshare companies to improve metro–bikeshare integration.

1. Introduction

As a result of the suburbanization of cities, a great number of residents have moved to suburban districts [1]. Many of them are willing to commute by metro, as it is a fast, effective, and ecofriendly travel mode. However, in some suburban areas, people often find it inconvenient to access or egress the metro, as taking the bus requires a long waiting time, while walking also takes time for the one-mile trip from home to metro or vice versa. This is known as the “last mile problem”.
Economical, convenient, and sustainable as it is, bikeshare helps not only to mitigate air pollution and traffic congestion [2,3], but also cover short-distance trips in a short time, solving the last mile problem [4]. Over the past few decades, bikeshare has expanded rapidly all over the world. By 19 February 2018, docked bike-sharing systems were running in 1560 cities across the globe; another 402 were under planning or construction [5]. More cities show increasing interest in this travel mode. Due to privacy concerns, dockless bikeshare trip data are kept a secret; this paper, thus, focuses on docked bikeshare (henceforth referred to as bikeshare).
Metro–bikeshare integration, as one of the most promising development trends in the sustainable transportation domain [6], is a good answer to the problems in private bicycle–metro integration. First, it makes cycling more convenient by offering people a “bike-as-needed” mechanism, prompting transit and biking to be better commuting options [7]. Second, for cities with high levels of transit usage and cycling, bikeshare systems at metro stations help to ease the pressure of transit systems relevant to on-board bicycles [8]. Third, private bike usage in egress trips is discouraged because transit vehicles are not allowed to carry bikes during a certain day-period. Bikeshare, however, make it more convenient for commuters to finish their last leg of journeys [9]. Fourth, bikeshare systems address the commuters’ concerns of bicycle vandalism and theft around transit stations [6].
Though many more countries are interested in and have laid out plans to develop metro–bikeshare integration so as to improve the efficiency of public transportation, knowledge on the following topics is scarce:
  • How to measure metro–bikeshare access and egress transferring distance and catchment areas from smartcard data.
  • Do metro–bikeshare transferring distance and catchment area vary much across demographic groups, locations, and time?
This paper will focus on these questions, and the remainder is organized as follows. A literature review of metro–bikeshare usage patterns and metro–bicycle transferring distances and catchment areas is provided in next section. Then, the study area, data source, and the methodology are illustrated. Afterwards, data analysis results and model results are presented. In the final section, the paper concludes the results and offer suggestions for future research.

2. Literature Review

A range of bicycle–metro integration topics have been studied, including the relationship between bikeshare and metro systems, the determinants of metro–bikeshare usage, the impact of bikeshare on metro ridership, parking issues of shared bikes, and methods to boost the integration and accessibility of metro–bikeshare stations [10]. This literature review mainly focuses on metro–bikeshare usage and the measures to calculate metro–bicycle transferring distance and catchment areas.

2.1. Metro–Bikeshare Usage Pattern

Ji et al. [6] and Yang et al. [11] surveyed metro–bikeshare integrators in Nanjing to better analyze metro–bikeshare integration behavior. Ji et al. [6] found that females, elderly, or low-income metro commuters are less prone to taking bikeshare–metro transfer. However, those who once had their bike stolen or who take trips for schooling or working prefer this integration. As for Yang et al. [11], it was found that many suburban commuters thought metro–bikeshare a more comfortable, simple, and efficient commuting mode. This was especially true of those who otherwise had to drive medium-to-long distances for work. Meanwhile, male motorists and commuters having had bad experiences also prefer the metro–bikeshare system. Bachand-Marleau et al. [12] and Chen et al. [13] also carried out related surveys with a respective sampling size of 1432 and 1784, both including private bicycle users. Bachand-Marleau et al. [12] revealed that more than one third of interviewees use bikeshare, among whom, one-year membership owners most prefer bikeshare and metro integration. Chen et al. [13] showed that over half of metro riders prefer bicycle transfer services for time-insensitive issues, such as shopping, visiting friends, and to a lesser extent, working and education. This may be because private bicycle users are included in the sample. Some researchers also made use of historical bikeshare data and built environment data. To be specific, Erdoğan et al. [14] studied bikeshare usage around metro stations and bikeshare–metro interactions; Hong et al. [15] explored public transport accessibility under the context of a bikeshare system; Griffin et al. [16] worked out a framework for the integration of bikeshare and metro planning.

2.2. Metro–Bicycle Transferring Distance and Catchment Area

Transfer distance and catchment area are significant for demand forecasting, interchange planning, and transit integration and realization [17]. The following review focuses on general bicycle usage for metro access and egress.
Reynolds, in 2005, identified three categories of techniques for the calculation of bicycle access distance, namely, the conversion method using bicycle speed, operation system review, and stated preference technique [18]. Taylor et al. [19] concluded through a stated preference survey that bicycle access distance for public transport passengers is 2.4 km, which, he suggested, could be extended up to 4.8 km if a parking lot or bike path was available. Parker [20] applied the speed conversion method and proposed a bicycle access distance of 2.5 km converted from a travel time of 7.6 min. However, it was not clear that 7.6 min was acceptable for the access distance of a potential path. Based on surveys of operation system, Rastogi and Rao [21] found out that bicycle access distance for metro stations acceptably ranged from 1.8 to 4.05 km with its specifics depending on economic, housing, and social factors. Notably, using the regression and cumulative distribution models, Lee [4] found out that the access distance of trips from home to station is estimated to be 1.96 km and that of trips from station to work 2.13 km. Zuo [22] took the 85th percentile value of the cumulative distribution of the access distance as the bicycle access distances, and suggested that the catchment area of bicycle transit is estimated as 1.7 and 2.3 times of the size of that of walking transit at home and activity ends, respectively.
The delineation of the catchment area of a station is possible when access distances are decided [17]. In general, three methods were applied in previous studies: The simple buffer with the Euclidean distance [23], the combination of the Thiessen polygon and buffer [24], and the network-distance-based method [25]. The first two methods always overestimated the catchment area; therefore, in many studies the network-distance-based method was applied and developed on the basis that travelers pick the shortest path from the road network and cycle to metro stations. Wang et al. [17] concluded that metro–bicycle catchment areas could be better delineated if network distance was used for traffic stations. Cheng and Agrawal [26] modified the network-distance-based method to achieve better delineation. Flamm [27] pointed out that transit catchment areas could be much larger for bicycle–metro travelers than for traditional transit travelers who access metro on foot.
To summarize, most of the aforementioned studies used survey data. Though survey-based data directly observe detailed information on travel behavior, it is still difficult to collect sustained long-run periods through behavioral surveys due to concerns of cost, processing load, accuracy, and privacy protection of respondents. Meanwhile, none of these studies has focused on the bikeshare access and egress distance and catchment area around metro stations. To the best of our knowledge, this article is the first effort to use valid metro–bikeshare transfers isolated from smartcard data to measure the transfer distance and catchment area and then reveal their differences across demographic groups and temporal and spatial dimensions.

3. Context and Method

This section introduces the study area and the data source of the historical trip data of bikeshare systems. Then, the methodology of metro–bikeshare transfers identification, access/egress distance calculation, and catchment area delineation are described.

3.1. Study Area

The capital of the Jiangsu Province in China, Nanjing boasts an area of 6587 km2 with a total population of 8.33 million [28]. In the last two decades, it has witnessed a sustained and rapid urbanization, economic growth, and motorization.
Nanjing has a huge and complex urban transportation system, where various modes of transport interact with each other. They mainly include metro, bus, private bike, bikeshare, e-bike, walking, car, and taxi. To this day, the number of urban cars in Nanjing has reached 2.5 million, increasing by 250,000 on annual basis [29]. Consequently, the city is increasingly becoming congestive, with an irreversible trend in sight. To adapt to increasing urban growth and meet travel demand, the Nanjing Metro has opened 10 operating lines as of May 2018, with a total of 174 stations [30]. These lines, coupled with over 700 bus lines, constitute a powerful public traffic network [31]. In addition, the robust use of e-bikes and conventional bikes thanks to the city’s plain topography also helps to meet travel demand to a great extent. Thus, it is not surprising to see multiple feeding modes for metro stations in Nanjing. Figure 1 shows the spatial distribution of metro stations by urban (area within the inner ring road) and suburban area (area outside the inner ring road).

3.2. Data Source

Since the end of December 2015, Nanjing has been issuing smartcards for bikeshare–metro transfer [6]. This enables researchers to explore the travel pattern of bicycle–metro integration using smartcard data. The data of this paper, covering a period from 9 March to 29 March, 2016, were mined from both metro and bikeshare smartcards, provided by Nanjing Metro Company and Nanjing Public Bicycle Company. During this period, transportation services were overall normal, without any disruptive weather events. 23,860,858 smartcard transaction records were collected from the metro database and 1,917,410 records from the bikeshare database. Figure 2 reveals the datasets’ structure.
It is important to mention that transactions recognized as defect or stolen were deleted. Further, metro transactions that begin and stop at the same station within 6 min were excluded, since an actual ride did not take place, given that the lowest time interval between two metro stations of about 3 min. As for the bikeshare transactions, the shortest trips of 1 min and longest trips of 120 min were taken for data screening, as Zhao et al. [32] used. Thus, the valid number of metro datasets declined by 1.92% to 23,375,730, and metro datasets by 4.8% to 1,825,375.

3.3. Identification of Metro–Bikeshare Transfers

A reproducible method was derived from smartcard data for isolation of metro–bikeshare transfer activities from the seamless smartcard transaction samples.
Firstly, querying rules were defined for correct pairing of subsequent metro and bikeshare transactions that had same member ID. Table 1 shows examples of paired smartcard transaction records.
However, not all paired transactions constructed actual transfers. An early morning metro commute and a bikeshare trip in the evening, two irrelevant records, among other possibilities, may seem to be paired. Therefore, this paper brings two recognition rules to erase this concern: Maximum transfer distance and maximum transfer time. Transfer distance is the Euclidean distance of the geographic coordinates of the metro station and the bikeshare station. Transfer time is the time period from exiting the metro ticket gate to leasing a shared bike or from returning a shared bike to consecutively entering the metro ticket gate.
Statistics of cumulative percentages of “Metro→Bikeshare” and “Bikeshare→Metro” transactions are generated with different time and distance thresholds. As illustrated in Table 2, more than 90% of transfer trips from the two transfer modes are completed no more than 10 min and 300 m. Therefore, the maximum transfer distance and time of metro–bikeshare are best set at 300 m and 10 min, respectively. Meanwhile, the walkable distance between a metro station and a bikeshare station was proved by other studies to be 300 m [16], a 5-min walk for average people [33]. Considering the security checks at China’s metro stations, a maximum transfer time of 10 min is quite plausible. More of it may otherwise make the validation more difficult by mixing some unnecessary, uncharacteristic transfer behaviors.
The third standard is grounded on the quantity of transfer trips occurring at each unique transfer pair. Only paired transfer stations that record at least 30 transfer trips during the three weeks were picked, so as to make sure no uncharacteristic transfers would affect the results. In this way, a dataset of 12,331 metro–bikeshare transfer trips made at 39 transfer pairs was produced.

3.4. Access/Egress Distance Calculation

3.4.1. Network-Based Distance Calculation

Both Euclidean distance and network-based distance can be obtained by ArcGIS through geocoded data of origins and destinations, as Romanillos [34] used. As the Euclidean distance does not cover detours in an actual road network, it is shorter than the distance people travel to access/egress the metro stations. As Figure 3 shows, this method, relying deeply on the integrity of the road network, is expected to find a path with the shortest distance between an origin/destination and a metro station. Assuming that travelers tend to take the shortest path on road networks, then this path found by the method is regarded as the actual path the passenger takes.

3.4.2. Threshold of Distance Determination

After the calculation of access and egress distance of every transfer trip, the threshold of access/egress distance can be determined for different categories. Generally, the threshold of access/egress distance which can cover most metro passengers’ trips, is considered as the 85th percentile of the cumulative distribution of access/egress distance [22,35]. In other words, most travelers are willing to access or egress stations within this threshold.
As for the method to estimate the threshold, an arrival cumulative percent graph was originally presented by Hino et al. [36] to estimate the spatial extent that people can reach to accessible adjacent station areas, as Figure 4 shows. On the basis of this approach, Lee et al. [4] revealed a clear correlation between the arrival cumulative distribution of metro passengers and the distance from the station and obtained the 85th percentile value using Quadratic regression and Cubic regression, which are respectively expressed as:
y = α 0 + α 1 x 1 + α 2 x 1 2
y = β 0 + β 1 x 1 + β 2 x 1 2 + β 3 x 1 3
where x1 is access distance and y is cumulative percent (%), while α i ( i = 0 , 1 , 2 ) and β i ( j = 0 , 1 , 2 , 3 ) are regression coefficients for the Quadratic and Cubic model, respectively.
In this paper, we adopted Lee’s method to establish the Quadratic model and Cubic model for different categories of access/egress distance respectively, and then chose the better explanatory model to determine the 85th percentile value of the both distances, meaning that the dependent variable y will be fixed as 85(%).

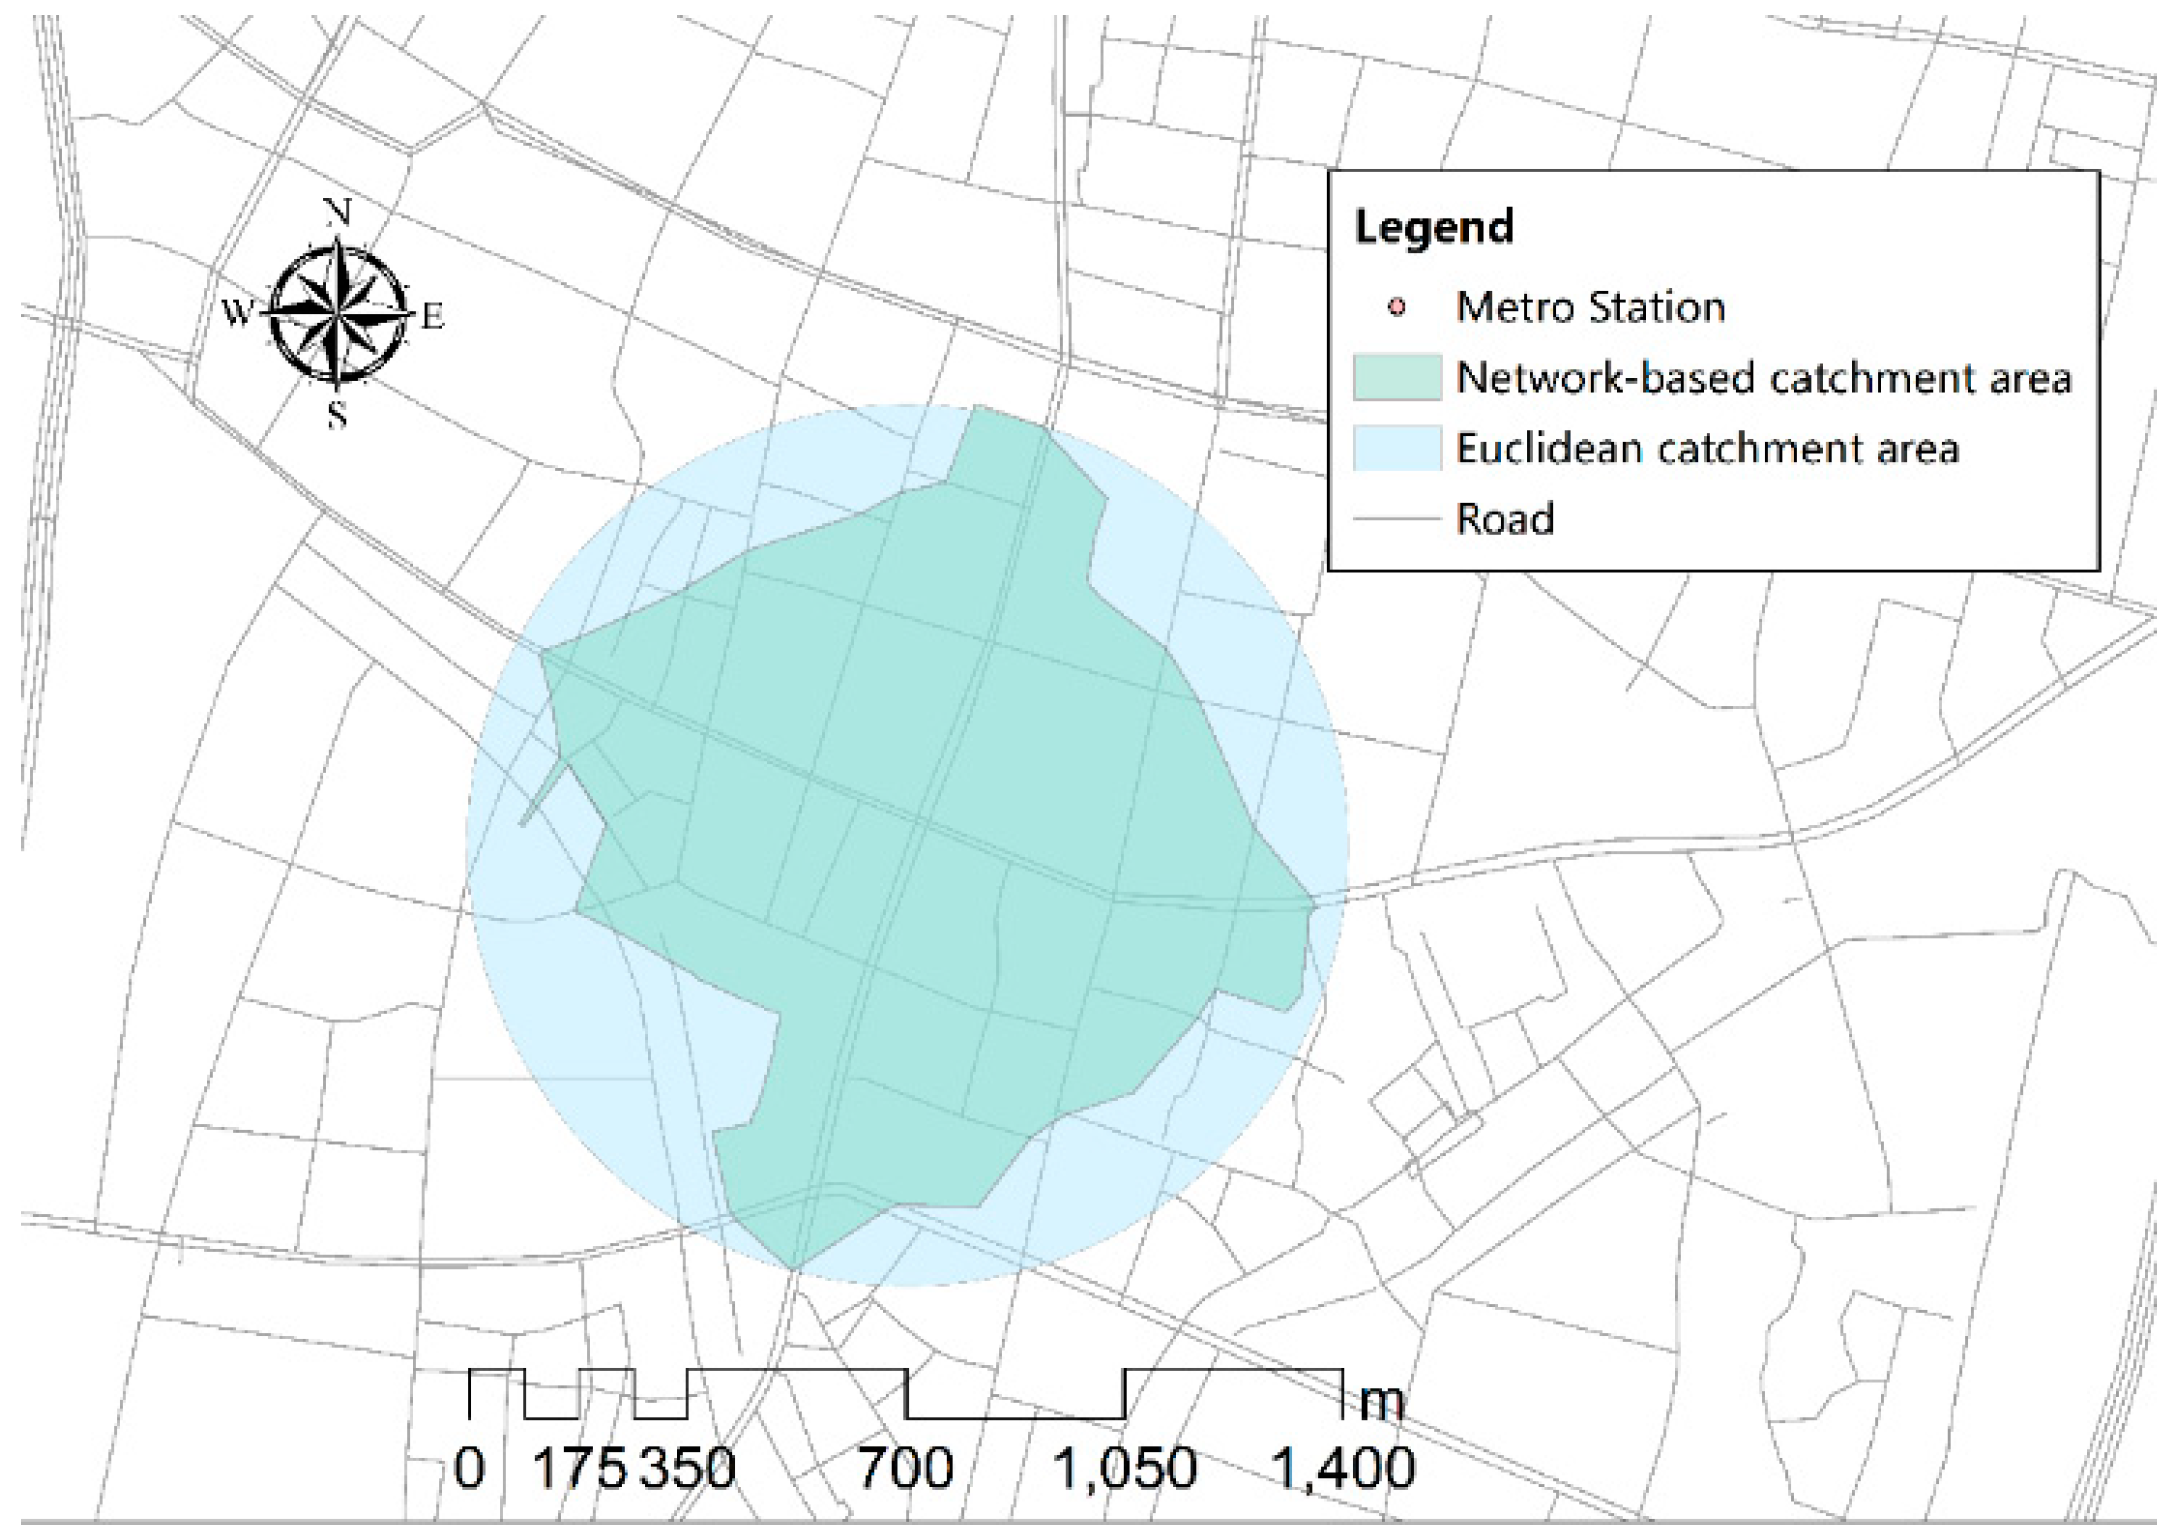
3.5. Catchment Area Delineation

The catchment area of metro–bikeshare transfer trips is identified as the area that can be accessed, whose spatial boundaries are determined by the corresponding distance threshold. In general, the 85th percentile of the access distance is widely employed for catchment area delineation in relevant studies [22,37]; therefore, it is also chosen in this paper. Once the threshold is ascertained, the catchment area based on the road network can also be generated in the ArcGIS platform, as demonstrated in Figure 5. Moreover, the corresponding area of these catchment areas can be calculated. The process of catchment area delineation is like the calculation of access/egress distance on the network: First, the target metro station is added into the network; then, the service area boundary on the network is found along every possible path on the network from a metro station. Additionally, a boundary vertex is tagged on the network, taking the access distance as the cutoff length; when all of the roads starting from the station experience the process like this, an out-of-shape catchment area of the station is finally generated [17].

4. Results

This section focuses on the analysis of transfer characteristics, access and egress distance, and catchment area of metro stations. Notably, in the following part, bikeshare users are categorized into five age groups: Age Group 1 (below 18), Age Group 2 (19–35), Age Group 3 (36–45), Age Group 4 (46–60 for males and 46–55 for females), and Age Group 5 (above 60 for males and above 55 for females). This categorization takes into consideration Chinese citizens’ statutory age of retirement—very often 55 for female and 60 for male.

4.1. Access and Egress Transfer Characteristics

Demonstrated in Figure 6, the analysis for smartcard data reveals several distinctive characteristics of access and egress transfer.
As for demographic groups, the percentage of males taking bikeshare for access and egress metro stations was higher than that of females, which coincides with the results of Romanillos [38]. This is reasonable because males are usually physically stronger than females. Of all bikeshare trips for access and egress metro stations, over half were made by people in the 19–35 age group, 15–20% in both the 36–45 age group and the group before retirement, and less than 10% in both the retiree group and the underage group (below 18). Moreover, excluding the underage group, the older a group was, the smaller the proportion of users who took shared bikes was.
In terms of spatial dimension, nearly 80% of bikeshare trips to access and egress metro stations were made at 25 metro stations in the suburban area compared to around 20% at 14 metro stations in the urban area. In addition, the average transfer volume was 360 at suburban metro stations and 211 at urban metro stations. This difference is because urban areas have a better public transport network and shorter travel distances, making bus transit and walking a better option than bikeshare. On the other hand, suburban dwellers find that walking or bus-taking to access and egress metro stations simply takes too much time. However, bikeshare can conveniently take them to areas even with less frequent metro services and offer them longer access and egress distances to metro.
Finally, as for the temporal dimension, over 50% of bikeshare trips for access and egress metro were made in the morning peak and evening peak hours, indicating that shared bikes are mainly used for commuting. As for the access and egress trips distribution on weekends and weekdays, the percentage on weekdays was much higher that on weekends.

4.2. Access/Egress Distance of Metro Station

The Quadratic regression and Cubic regression for the access distance/egress distance and cumulative percent y (%) are developed in terms of different group ages, gender, locations, and time periods of access and egress metro trips. The y variable means cumulative percent and the x variable is access/egress distance. The purpose of establishing regression models is to find out the 85th percentile value of the cumulative distribution of the access/egress distance. By fixing the dependent variable y as 85 (%), the 85th percentile value for transfer trips are calculated. As presented in Table 3, the bikeshare trip distribution between metro station and bikeshare station can be well explained by the regression model and all the models were statistically significant.
This study explores the nuances of metro–bikeshare access and egress transferring distance existing across demographic groups and spatial dimensions. An independent samples t-test was conducted, as shown in Table 4; the high significance of the test between male and female indicates that both access and egress distances of males are longer than those of females. This is because of varied physical strength. Both access and egress distances in suburban areas are significantly longer than those in urban areas. This may be because bikeshare is more densely distributed in urban areas and people can finish their trips conveniently without going for a relatively far distance.
As for the temporal dimension, access distance on weekdays is much longer than that on weekends. Both access and egress distances in evening peak are longer than those in morning peak. This is because the main metro–bikeshare users during peak hours are commuters. During morning peak, due to tight commuting times, commuters who live near metro stations are more likely to ride shared bikes rather than walk to their workplace, while during evening peak, commuters have enough time and prefer to walk to destinations. When people living around metro stations choose not to ride back home, then the average riding distance becomes longer.
One-way analysis of variance (ANOVA) was used for comparisons of more than two groups. The results of the ANOVA assessing the difference of mean distance across different age groups are presented in Table 5.
The age factor exerts an impact on access and egress distance and for a detailed description of the difference of distances, the least significant difference (LSD) test was applied. Only groups significantly affecting access/egress distance are listed. The distance of different age groups varies much in access and egress phases. Age Group 1 has the shortest mean access and egress distance, significantly differing from Age Groups 3 and 4 in access and the other four groups in egress. For egress trips, as for Age Groups 3 and 5, the reason for the longer travel distance of Age Group 3 in egress trips, in addition to physical strength, also rests on their wider range of activities. Compared to Age Group 5, people of Age Group 3 are more likely to go to somewhere further for entertainment or exercise instead of staying at home.

4.3. Catchment Area of Metro Stations

The network-based approach and Euclidean-based approach are applied respectively to estimate the catchment areas of Sanshanjie station in the urban area and Xinglongdajie Station in the suburban from the aspects of the demographic groups and spatial and temporal characteristics. The determination of boundaries of areas is up to the 85th percentile of access/egress distance. The result is shown in Table 6. The average catchment area of the Euclidean-based and network-based catchments of Sanshanjie Station is 5.52 km2 and 5.17 km2, while in Xinglongdajie Station, the average catchment area is 7.77 km2 and 6.65 km2, respectively. Thus, it can be concluded that the longer the transfer trips are, the larger the catchment area of metro station will be. Obviously, the Euclidean catchment areas in Sanshanjie Station and Xinglongdajie Station are both larger than network-based ones. For example, in Sanshanjie Station, the Euclidean-based and network-based catchment areas are 6.60 km2 and 6.20 km2, respectively, for males and 5.37 km2 and 5.03 km2, respectively, for females. Both groups show a larger Euclidean-based catchment area. Moreover, for both Euclidean-based and network-based catchments of Sanshanjie Station (urban) are less than those of Xinglongdajie Station (suburban), which is consistent with the access/egress distances results. The reasons are not repeated here. The entire network-based area at Sanshanjie Station accounts for over 90% of the Euclidean area, while most of the ratios are less than 85% at Xinglongdajie Station, indicating that the lower density of network leads to narrower areas accessible for travelers.
Figure 7 shows an example of the table above. We delineated the Euclidean-based catchment area and network-based catchment area of Sanshanjie Station (urban) and Xinglongdajie Station (suburban), especially, during morning peak and evening peak. In general, the catchment area of Sanshanjie Station (urban) is smaller than that of Xinglongdajie Station (suburban). And for both Sanshanjie Station (urban) and Xinglongdajie Station (suburban), the catchment area in evening peak is larger than that in morning peak. Moreover, it is obvious that the network-based catchment area is smaller than Euclidean catchment area by comparing Figure 7a,b.

5. Conclusions

A marriage between bikeshare and metro presents new opportunities for sustainable transportation and helps overcome the demerits of metro. This study aimed to reveal the service distance characteristics of gender, age, location, and time of the access/egress metro station. Then, the catchment areas of metro stations for different dimensions were portrayed.
Results showed that, as for personal and travel characteristics, with the exception of the underage group (age below 18), the older people in a group were, the smaller the proportion of users who took shared bikes, and of all bikeshare trips for both access and egress metro, the average transfer volume was 360 at suburban metro stations and 211 at urban metro stations. What is more, over 50% of bikeshare trips for both access and egress metro were made in the morning peak and evening peak and many more such trips were made on weekdays than on weekends. This indicates that shared bikes are mainly used for commuting.
Then, Cubic regression was established for the calculation of the 85th distances of egress and access metro trips. To explore the differences of access or egress distance between males and females, morning peak and evening peak, urban and suburban, weekday and weekend, and different age groups, this paper employed the independent samples t-test and ANOVA. Results revealed that males’ riding distance was longer than females’ riding distance, which was mainly for the physical strength reason. Of all bikeshare trips for access and egress metro stations, people of Age Group 2 (19–35) seized the largest share, as they were at a young age and more likely to use shared bikes. However, when the travel distance turned out to be relatively long, they were unwilling to use bikeshare, compared to Age Group 3 (36–45) and Age Group 4 (46-retirement age), indicating that Age Group 2 preferred short bikeshare trips. Nonetheless, both access and egress distances in the urban area were shorter than those in the suburban area, as the bikeshare system is more densely distributed and thus covers more areas in the urban area, so people do not need to ride for a relatively far distance to find the station of bikeshare. As for the temporal dimensions, the longer access and egress distance in evening peak than in morning peak was probably because the proportion of short trips decreased in evening peak; thus, the mean distance would become longer.
Finally, on the basis of the 85th distances, the catchment areas in urban and suburban areas were obtained. The network-based area in urban accounts for over 90% of the Euclidean area, while the ratio was less than 85% in the suburban area, revealing that the lower density of network leads to narrower areas accessible for travelers.
More smartcard data can be collected from other cities as an extension to this research to see if the access/egress distance and catchment area in other cities are consistent with the findings in Nanjing. Future studies need to consider more comprehensively the factors affecting the access/egress distances in their analyses. Additionally, with the rise of dockless bikeshare, it is necessary to compare dockless bikeshare and docked bikeshare in terms of their access/egress distance and catchment areas.

Author Contributions

Conceptualization, X.M. and Y.J.; Data curation, Y.J. and X.M.; Formal analysis, Y.J. and M.H.; Methodology, X.M.

Funding

This research was funded by the International Cooperation and Exchange of the National Natural Science Foundation of China, grant number 51561135003, the Key Project of National Natural Science Foundation of China, grant number 51338003, and the Scientific Research Foundation of Graduated School of Southeast University, grant number YBPJ1882.

Conflicts of Interest

The authors declare no conflict of interest.

References

  1. Xu, Y.; Chan, E.H.W.; Yung, E.H.K. Analysis of the Mechanisms Contributing to Spatial Mismatch in Transitional Chinese Cities. J. Urban Plan. Dev. 2014, 140, 04013011. [Google Scholar] [CrossRef]
  2. Zhao, P.; Li, S. Bicycle-metro integration in a growing city: The determinants of cycling as a transfer mode in metro station areas in Beijing. Transport. Res. A Pol. 2017, 99, 46–60. [Google Scholar] [CrossRef]
  3. Pucher, J.; Buehler, R. Cycling towards a more sustainable transport future. Transp. Rev. 2017, 37, 689–694. [Google Scholar] [CrossRef] [Green Version]
  4. Lee, J.; Choi, K. Bicycle-based transit-oriented development as an alternative to overcome the criticisms of the conventional transit-oriented development. Int. J. Sustain. Transp. 2016, 10, 975–984. [Google Scholar] [CrossRef]
  5. Meddin, R.; Demaio, P.J. The Bike-Sharing World Map. 2018. Available online: http://www. bikesharingworld.com (accessed on 14 November 2018).
  6. Ji, Y.; Fan, Y.; Ermagun, A.; Cao, X.; Wang, W.; Das, K. Public bicycle as a feeder mode to rail transit in China: The role of gender, age, income, trip purpose, and bicycle theft experience. Int. J. Sustain. Transp. 2017, 11, 308–317. [Google Scholar] [CrossRef]
  7. Shaheen, S.A.; Guzman, S.; Zhang, H. Bikesharing in Europe, the Americas, and Asia: Past, Present, and Future. Transp. Res. Rec. 2010, 2143, 159–167. [Google Scholar] [CrossRef]
  8. Cervero, R.; Gorham, R. Commuting in Transit Versus Automobile Neighborhoods. J. Am. Plan. Assoc. 1995, 61, 210–225. [Google Scholar] [CrossRef]
  9. Demaio, P.; Gifford, J. Will Smart Bikes Succeed as Public Transportation in the United States? J. Public Transp. 2004, 7, 1–15. [Google Scholar] [CrossRef] [Green Version]
  10. Ma, X.; Yang, M.; Ji, Y.; Jin, Y.; Tan, X. Understanding Bikeshare Mode as a Feeder to Metro by Isolating Metro–Bicycle Transfers from Smart Card Data. Transp. Policy 2018, 71, 57–69. [Google Scholar] [CrossRef]
  11. Yang, M.; Liu, X.; Wang, W.; Li, Z.; Zhao, J. Empirical Analysis of a Mode Shift to Using Public Bicycles to Access the Suburban Metro: Survey of Nanjing, China. J. Urban Plan. Dev. 2016, 142, 05015011. [Google Scholar] [CrossRef]
  12. Bachand-Marleau, J.; Larsen, J.; El-Geneidy, A.M. Much-Anticipated Marriage of Cycling and Transit How Will It Work? Transp. Res. Rec. 2011, 2247, 109–117. [Google Scholar] [CrossRef]
  13. Chen, L.; Pel, A.J.; Chen, X.; Sparing, D.; Hansen, I.A. Determinants of Bicycle Transfer Demand at Metro Stations: Analysis of Stations in Nanjing, China. Transp. Res. Rec. 2012, 2276, 131–137. [Google Scholar] [CrossRef]
  14. Erdoğan, S.; Liu, C.; Ma, T. Bicycle Sharing and Transit: Does Capital Bikeshare Affect Metrorail Ridership in Washington, D.C. Transp. Res. Rec. 2015, 2534, 1–9. [Google Scholar]
  15. Hong, Z.; Mittal, A.; Mahmassani, H.S. Effect of Bicycle-Sharing on Public Transport Accessibility: Application to Chicago Divvy Bicycle-sharing System. Transp. Res. Rec. 2016, 16, 6930. [Google Scholar]
  16. Griffin, G.P.; Sener, I.N. Planning for Bike Share Connectivity to Rail Transit. J. Public Transp. 2016, 19, 1–22. [Google Scholar] [CrossRef] [PubMed] [Green Version]
  17. Wang, Z.-J.; Chen, F.; Xu, T.-K. Interchange between Metro and Other Modes: Access Distance and Catchment Area. J. Urban Plan. Dev. 2016, 142, 04016012. [Google Scholar] [CrossRef]
  18. Reynolds, J. Techniques of Research and Investigation Written Report Combining Bicycles and Public Transport; The University of Melbourne: Parkville, Australia, 2005. [Google Scholar]
  19. Taylor, D.B.; Mahmassani, H.S. Analysis of Stated Preferences for Intermodal Bicycle-Transit Interfaces. Transp. Res. Rec. 1996, 1556, 86–95. [Google Scholar] [CrossRef]
  20. Parker, A. Dual mode transportation: Making public transport work. Pedal Power 1985, 3, 28–31. [Google Scholar]
  21. Rastogi, R.; Rao, K.V.K. Travel Characteristics of Commuters Accessing Transit: Case Study. J. Transp. Eng. 2003, 129, 684–694. [Google Scholar] [CrossRef]
  22. Zuo, T.; Wei, H.; Rohne, A. Determining transit service coverage by non-motorized accessibility to transit: Case study of applying GPS data in Cincinnati metropolitan area. J. Transp. Geogr. 2018, 67, 1–11. [Google Scholar] [CrossRef]
  23. Suau-Sanchez, P.; Burghouwt, G.; Pallares-Barbera, M. An appraisal of the CORINE land cover database in airport catchment area analysis using a GIS approach. J. Air Transp. Manag. 2014, 34, 12–16. [Google Scholar] [CrossRef] [Green Version]
  24. Widaningrum, D.L. A GIS–Based Approach for Catchment Area Analysis of Convenience Store. Procedia Comput. Sci. 2015, 72, 511–518. [Google Scholar] [CrossRef]
  25. Gutiérrez, J.; García-Palomares, J.C. Distance-measure impacts on the calculation of transport service areas using GIS. Environ. Plan. B Urban Anal. City Sci. 2008, 35, 480–503. [Google Scholar] [CrossRef]
  26. Cheng, C.L.; Agrawal, A.W. TTSAT: A new approach to mapping transit accessibility. J. Public Transp. 2010, 13, 55–72. [Google Scholar] [CrossRef]
  27. Flamm, B.J.; Rivasplata, C.R. Public Transit Catchment Areas. Transp. Res. Rec. 2018, 2419, 101–108. [Google Scholar] [CrossRef]
  28. The Population of Nanjing. Available online: http://www.chamiji.com/201806046098.html (accessed on 14 November 2018).
  29. Car Ownership in Nanjing. Available online: http://js.xhby.net/system/2018/01/15/030783221.shtml (accessed on 14 November 2018).
  30. Nanjing Metro. Available online: http://www.njmetro.com.cn/service_04_new.aspx (accessed on 14 November 2018).
  31. Sina, J. Efforts of Nanjing Transportation Bureau in the Past Five Years. Available online: http://jiangsu.sina.com.cn/news/2017-07-22/detail-ifyihrit1200076.shtml (accessed on 14 November 2018).
  32. Zhao, J.; Wang, J.; Deng, W. Exploring bikesharing travel time and trip chain by gender and day of the week. Transp. Res. C 2015, 58, 251–264. [Google Scholar] [CrossRef]
  33. Ma, X.; Ji, Y.; Yang, M.; Jin, Y.; Tan, X. Understanding bikeshare mode as a feeder to metro by isolating metro-bikeshare transfers from smart card data. Transp. Polic 2018, 71, 56–69. [Google Scholar] [CrossRef]
  34. Romanillos, G.; Moyagómez, B.; Zaltzaustwick, M.; Lamíquizdaudén, P.J. The pulse of the cycling city: Visualising Madrid bike share system GPS routes and cycling flow. J. Maps 2018, 14, 34–43. [Google Scholar] [CrossRef]
  35. Wang, J.; Cao, X. Exploring built environment correlates of walking distance of transit egress in the Twin Cities. J. Transp. Geogr. 2017, 64, 132–138. [Google Scholar] [CrossRef]
  36. Hino, S.; Kishi, K.; Satoh, K. Development of the Complementary Accessibility Index and Evaluation of Public Transportation System. J. City Plan. Inst. Japan 2000, 35, 475–480. [Google Scholar]
  37. Hochmair, H.H. In Assessment of Service Areas for Bicycle Accessibility to Transit Stations. Int. J. Sustain. Transp. 2015, 9, 15–29. [Google Scholar] [CrossRef]
  38. Romanillos, G.; Austwick, M.Z. Madrid cycle track: Visualizing the cyclable city. J. Maps 2016, 12, 1218–1226. [Google Scholar] [CrossRef]
Figure 1. Illustration of study area.
Information 09 00289 g001
Figure 2. Structure of the datasets of Nanjing Metro and Bikeshare. (Note: Bikeshare exclusive smartcards have the “Member ID” begin with letters “NJ”, while bikeshare seamless smartcards begin with number “9”, the same as metro.).
Information 09 00289 g002
Figure 3. Paths of shared bikes generated on the road network.
Information 09 00289 g003
Figure 4. Cumulative percent curve.
Information 09 00289 g004
Figure 5. Catchment area delineation.
Information 09 00289 g005
Figure 6. Distribution of gender, age, location, and commuting time. (a) Access Transfer; (b) Egress Transfer.
Information 09 00289 g006aInformation 09 00289 g006b
Figure 7. Comparison of catchment Areas by Euclidean Method (a) and network-based method (b) in urban and suburban areas.
Information 09 00289 g007aInformation 09 00289 g007b
Table 1. Example of Nanjing smartcard records for “Metro→Bikeshare” and “Bikeshare→Metro” transactions.
ModeTransaction DateMember IDTrip TypeTransaction TimeMetro Station IDBikeshare
Metro→Bikeshare2016-03-0997007007****Metro08:42:5824-
2016-03-0997007007****Bikeshare08:46:06-11001
Bikeshare→Metro2016-03-0997007007****Bikeshare09:15:55-11001
2016-03-0997007007****Metro09:16:5924-
Table 2. Cumulative percentages of “Metro→Bikeshare” and “Bikeshare→Metro” tranctions by different transfer distances and time.
Transfer Distance (m)Transfer Time (min)
2468101214161820
Metro→Bikeshare
1002%43%49%50%51%52%52%52%52%52%
2002%65%74%78%79%80%80%80%80%80%
3002%70%80%86%91%93%93%93%93%93%
4002%70%81%88%91%94%94%94%94%94%
5002%70%82%90%93%95%95%95%95%95%
6002%70%82%90%94%97%97%98%99%99%
7002%70%82%90%94%97%98%99%99%99%
8002%70%82%91%94%97%98%99%100%100%
9002%70%82%91%94%97%98%99%100%100%
10002%70%82%91%94%97%98%99%100%100%
Bikeshare→Metro
10049%51%52%52%52%53%53%53%53%53%
20074%81%83%83%83%84%84%84%84%84%
30079%83%88%91%91%92%93%93%93%93%
40079%90%95%95%95%96%96%96%97%97%
50079%90%95%95%95%96%96%97%98%98%
60079%91%95%95%96%97%98%98%99%99%
70079%91%95%95%96%97%98%99%99%99%
80079%91%95%96%96%98%98%99%100%100%
90079%91%95%96%96%98%98%99%100%100%
100079%91%95%96%96%98%98%99%100%100%
Table 3. Regression model of both access and egress distance.
VariablesRegression ModelsR2sig85th Distance (m)
Egress
WeekendY = −0.1608 + 0.00090x − 2.12 × 10−7x2 + 1.51 × 10−11x30.9730.0001777.3
WeekdayY = −0.2021 + 0.00093x − 2.15 × 10−7x2 + 1.51 × 10−11x30.9630.0001798.2
Morning peakY = −0.3443 + 0.00105x − 2.50 × 10−7x2 + 1.82 × 10−11x30.9340.0001807.3
Evening peakY = −0.2209 + 0.00091x − 2.06 × 10−7x2 + 1.41 × 10−11x30.9610.0001881.8
UrbanY = −0.2348 + 0.00098x − 2.35 × 10−7x2 + 1.69 × 10−11x30.9570.0001079.6
SuburbanY = −0.0619 + 0.00075x − 1.67 × 10−7x2 + 1.14 × 10−11x30.9600.0001211.6
MaleY = −0.2047 + 0.00090x − 2.03 × 10−7x2 + 1.38 × 10−11x30.9660.0001846.9
FemaleY = −0.2517 + 0.00110x−2.92 × 10−7x2 + 2.47 × 10−11x30.9760.0001689.7
Age Group 1Y = −0.3096 + 0.00143x − 4.92 × 10−7x2 + 5.30 × 10−11x30.9520.0001349.4
Age Group 2Y = −0.2366 + 0.00094x − 2.15 × 10−7x2 + 1.48 × 10−111x30.9590.0001802.8
Age Group 3Y = −0.1688 + 0.00089x − 2.07 × 10−7x2 + 1.45 × 10−11x30.9700.0001823.3
Age Group 4Y = −0.2016 + 0.00010x − 2.59 × 10−7x2 + 2.06 × 10−11x30.9650.0001715.5
Age Group 5Y = −0.2359 + 0.00107x − 3.03 × 10−7x2 + 2.72 × 10−11x30.9770.0001710.0
Access
WeekendY = −0.2240 + 0.00100x − 2.56 × 10−7x2 + 2.00 × 10−11x30.9720.0001727.9
WeekdayY = −0.1856 + 0.00086x − 1.88 × 10−7x2 + 1.24 × 10−11x30.9570.0001882.3
Morning peakY = −0.2510 + 0.00098x − 2.36 × 10−7x2 + 1.72 × 10−11x30.9500.0001799.9
Evening peakY = −0.3679 + 0.00099x − 2.22 × 10−7x2 + 1.53 × 10−11x30.9310.0002003.0
UrbanY = −0.2606 + 0.00101x − 2.45 × 10−7x2 + 1.82 × 10−11x30.9560.0001754.0
SuburbanY = −0.0675 + 0.00068x−1.38 × 10−7x2 + 8.64 × 10−11x30.9680.0002190.3
MaleY = −0.2328 + 0.00093x − 2.15 × 10−7x2 + 1.52 × 10−11x30.9680.0001867.7
FemaleY = −0.1779 + 0.00087x − 1.92 × 10−7x2 + 1.24 × 10−11x30.9550.0001833.4
Age Group 1Y = −0.1257 + 0.00076x + 8.13 × 10−7x2−5.35 × 10−11x30.9670.0001510.9
Age Group 2Y = −0.2847 + 0.00102x − 2.49 × 10−7x2 + 1.85 × 10−11x30.9660.0001782.7
Age Group 3Y = −0.1492 + 0.00081x − 1.70 × 10−7x2 + 1.06 × 10−11x30.9660.0001935.3
Age Group 4Y = −0.2276 + 0.00090x − 2.27 × 10−7x2 + 1.68 × 10−11x30.9640.0001864.8
Age Group 5Y = −0.1153 + 0.00081x − 1.91 × 10−7x2 + 1.31 × 10−11x30.9640.0001802.2
Note: Since the regression results of the Cubic model are always better than those of the Quadratic model, only the regression results of Cubic model are given in Table 3.
Table 4. Independent samples t-test.
Mean Distance (m)Levene’s Test for Equality of Variancest-Test for Equality of Means
Fsigtsig
AccessDemographic groups
Male1183.20.0820.7752.5720.010
Female1142.5
Spatial dimensions
Urban1105.9758.2970.000−13.1040.000
Suburban1346.5
Temporal dimensions
Weekend1106.80.3870.534−2.9650.003
Weekday1173.6
Morning peak1170.656.0920.000−5.3430.000
Evening peak1281.3
EgressDemographic groups
Male1148.618.1700.0006.1560.000
Female1064.1
Spatial dimensions
Urban1079.6575.4170.000−8.0060.000
Suburban1121.6
Temporal dimensions
Weekend1104.326.3280.000−0.3100.742
Weekday1110.2
Morning peak1128.9197.9960.000−4.2630.000
Evening peak1207.0
Table 5. Analysis of variance of access and egress distance for age group.
ANOVALSD Test
Fsig.GroupMean Difference sig.
Access8.9410.000(1)(3)−228.6600.008a
(4)−262.9950.002a
(2)(3)−75.0240.000a
(4)−109.3600.000a
(4)(5)98.2950.004a
Egress4.5570.001(1)(2)−215.7290.000a
(3)−239.4500.000a
(4)−200.2810.001a
(5)−180.1700.005a
(3)(5)59.2800.037a
Note: The significance levels of 0.05.
Table 6. Comparison of Euclidean and network-based catchment areas.
85th Distance (m)Catchment Area
Euclidean (km2)Network-Based (km2)Percentage (Network-Based/Euclidean)
Sanshanjie Station
Male1449.56.606.2093.91%
Female1307.65.375.0393.65%
Weekday1420.36.345.8592.29%
Weekend1389.76.075.7394.42%
Morning peak1144.14.113.8894.41%
Evening peak1460.36.706.2092.50%
Age Group 1984.83.052.8794.11%
Age Group 21394.36.115.6492.26%
Age Group 31428.66.416.0494.22%
Age Group 41359.05.805.4594.00%
Age Group 51151.24.163.9695.15%
Average1317.25.525.1793.72%
Xinglongdajie Station
Male1737.09.488.1185.59%
Female1524.77.306.0883.22%
Weekday1699.19.077.6984.75%
Weekend1593.77.986.8285.44%
Morning peak1504.77.115.9483.55%
Evening peak1612.38.176.7983.08%
Age Group 11328.65.554.6082.98%
Age Group 21599.08.036.8885.71%
Age Group 31665.08.717.4285.16%
Age Group 41556.67.616.3683.51%
Age Group 51436.06.485.3983.13%
Average1568.87.776.5584.19%

