2. Data and Methods
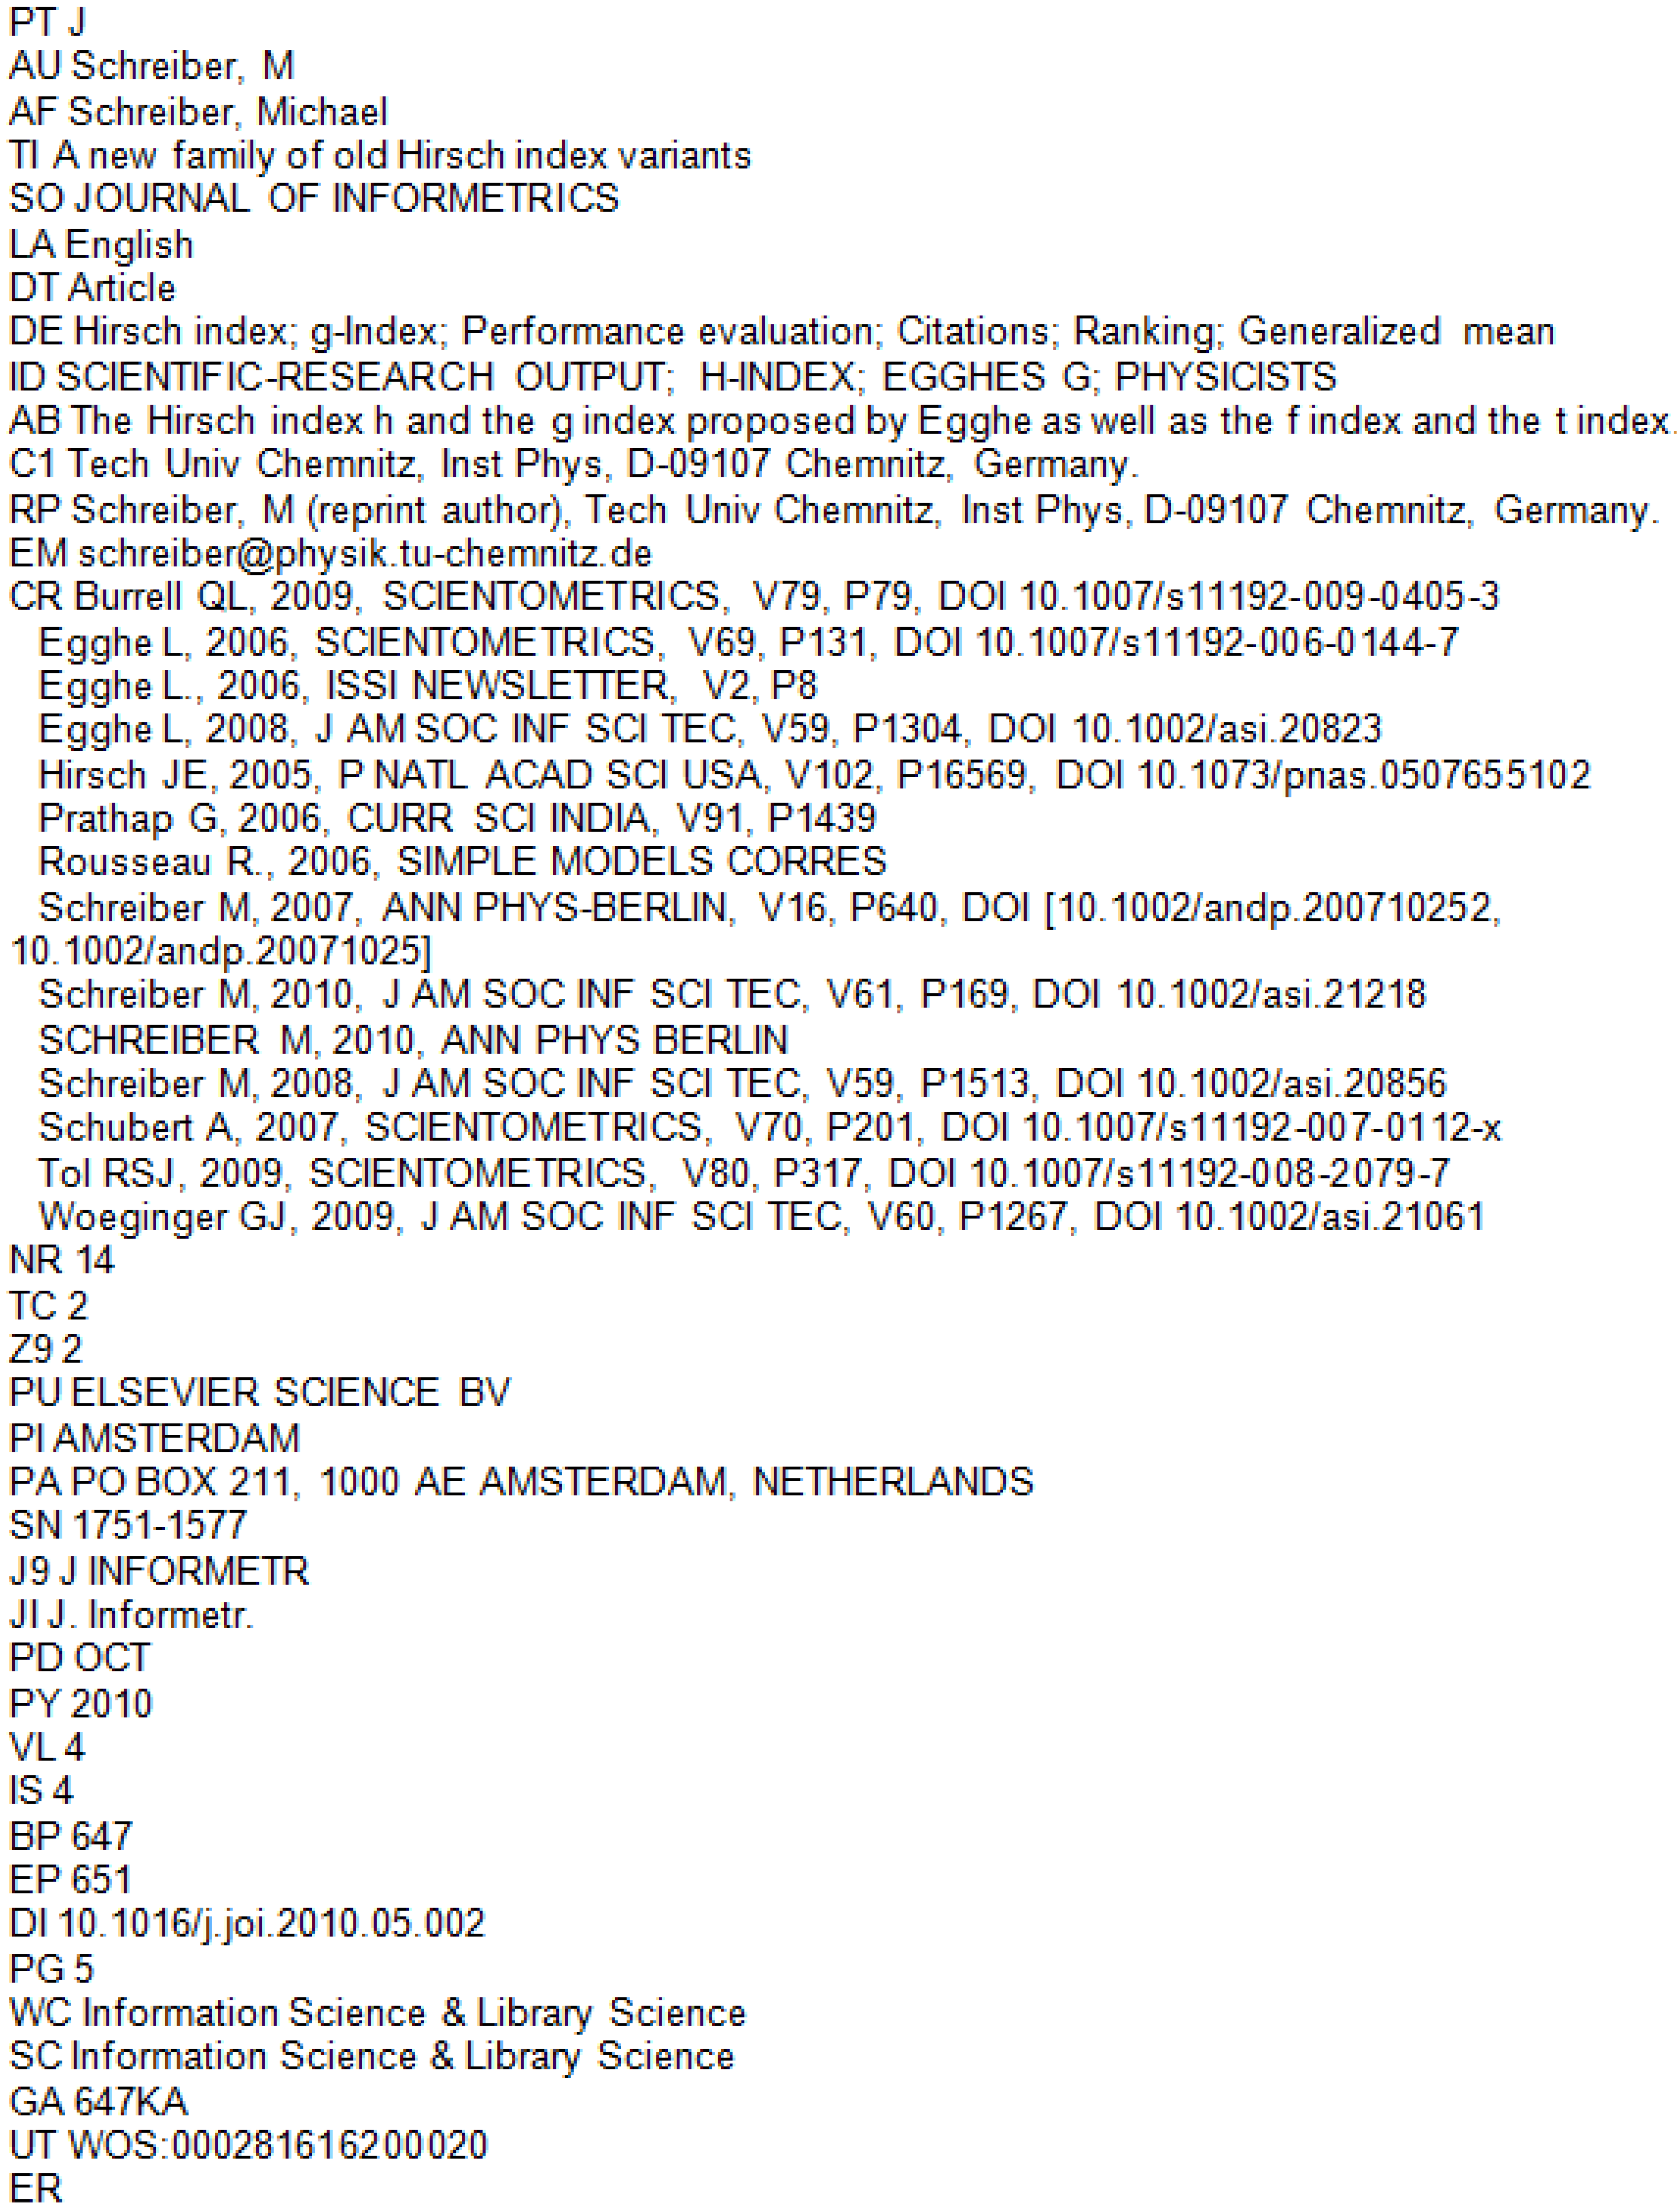
In November 2012 we manually queried the Web of Science web interface to obtain records of all articles published in the period 1991–2010 and indexed in the Social Sciences Citation Index in the research area “Information Science & Library Science” (ISLS). We were interested in the “article” document type only. In this way, we acquired plain text metadata on 46,800 journal articles. (Saving to plain text took about 50 min because a maximum of 500 records can be saved at once by anyone with a Web of Science subscription.) These metadata typically include an article’s title, journal name, volume, issue, pagination, and year as well as its authors’ names, addresses, times cited count and some other information. An example of a journal record is presented in
Figure 1. As we can see, only some of the cited references (CR) can be identified unambiguously—in this case with a digital object identifier (DOI). The remaining references can be identified using the volume, issue, and pagination or cannot be identified at all. To create a citation network from the article records retrieved (a basic, root, or seed set of articles), we need one more tool.
Figure 1.
A sample journal article record.
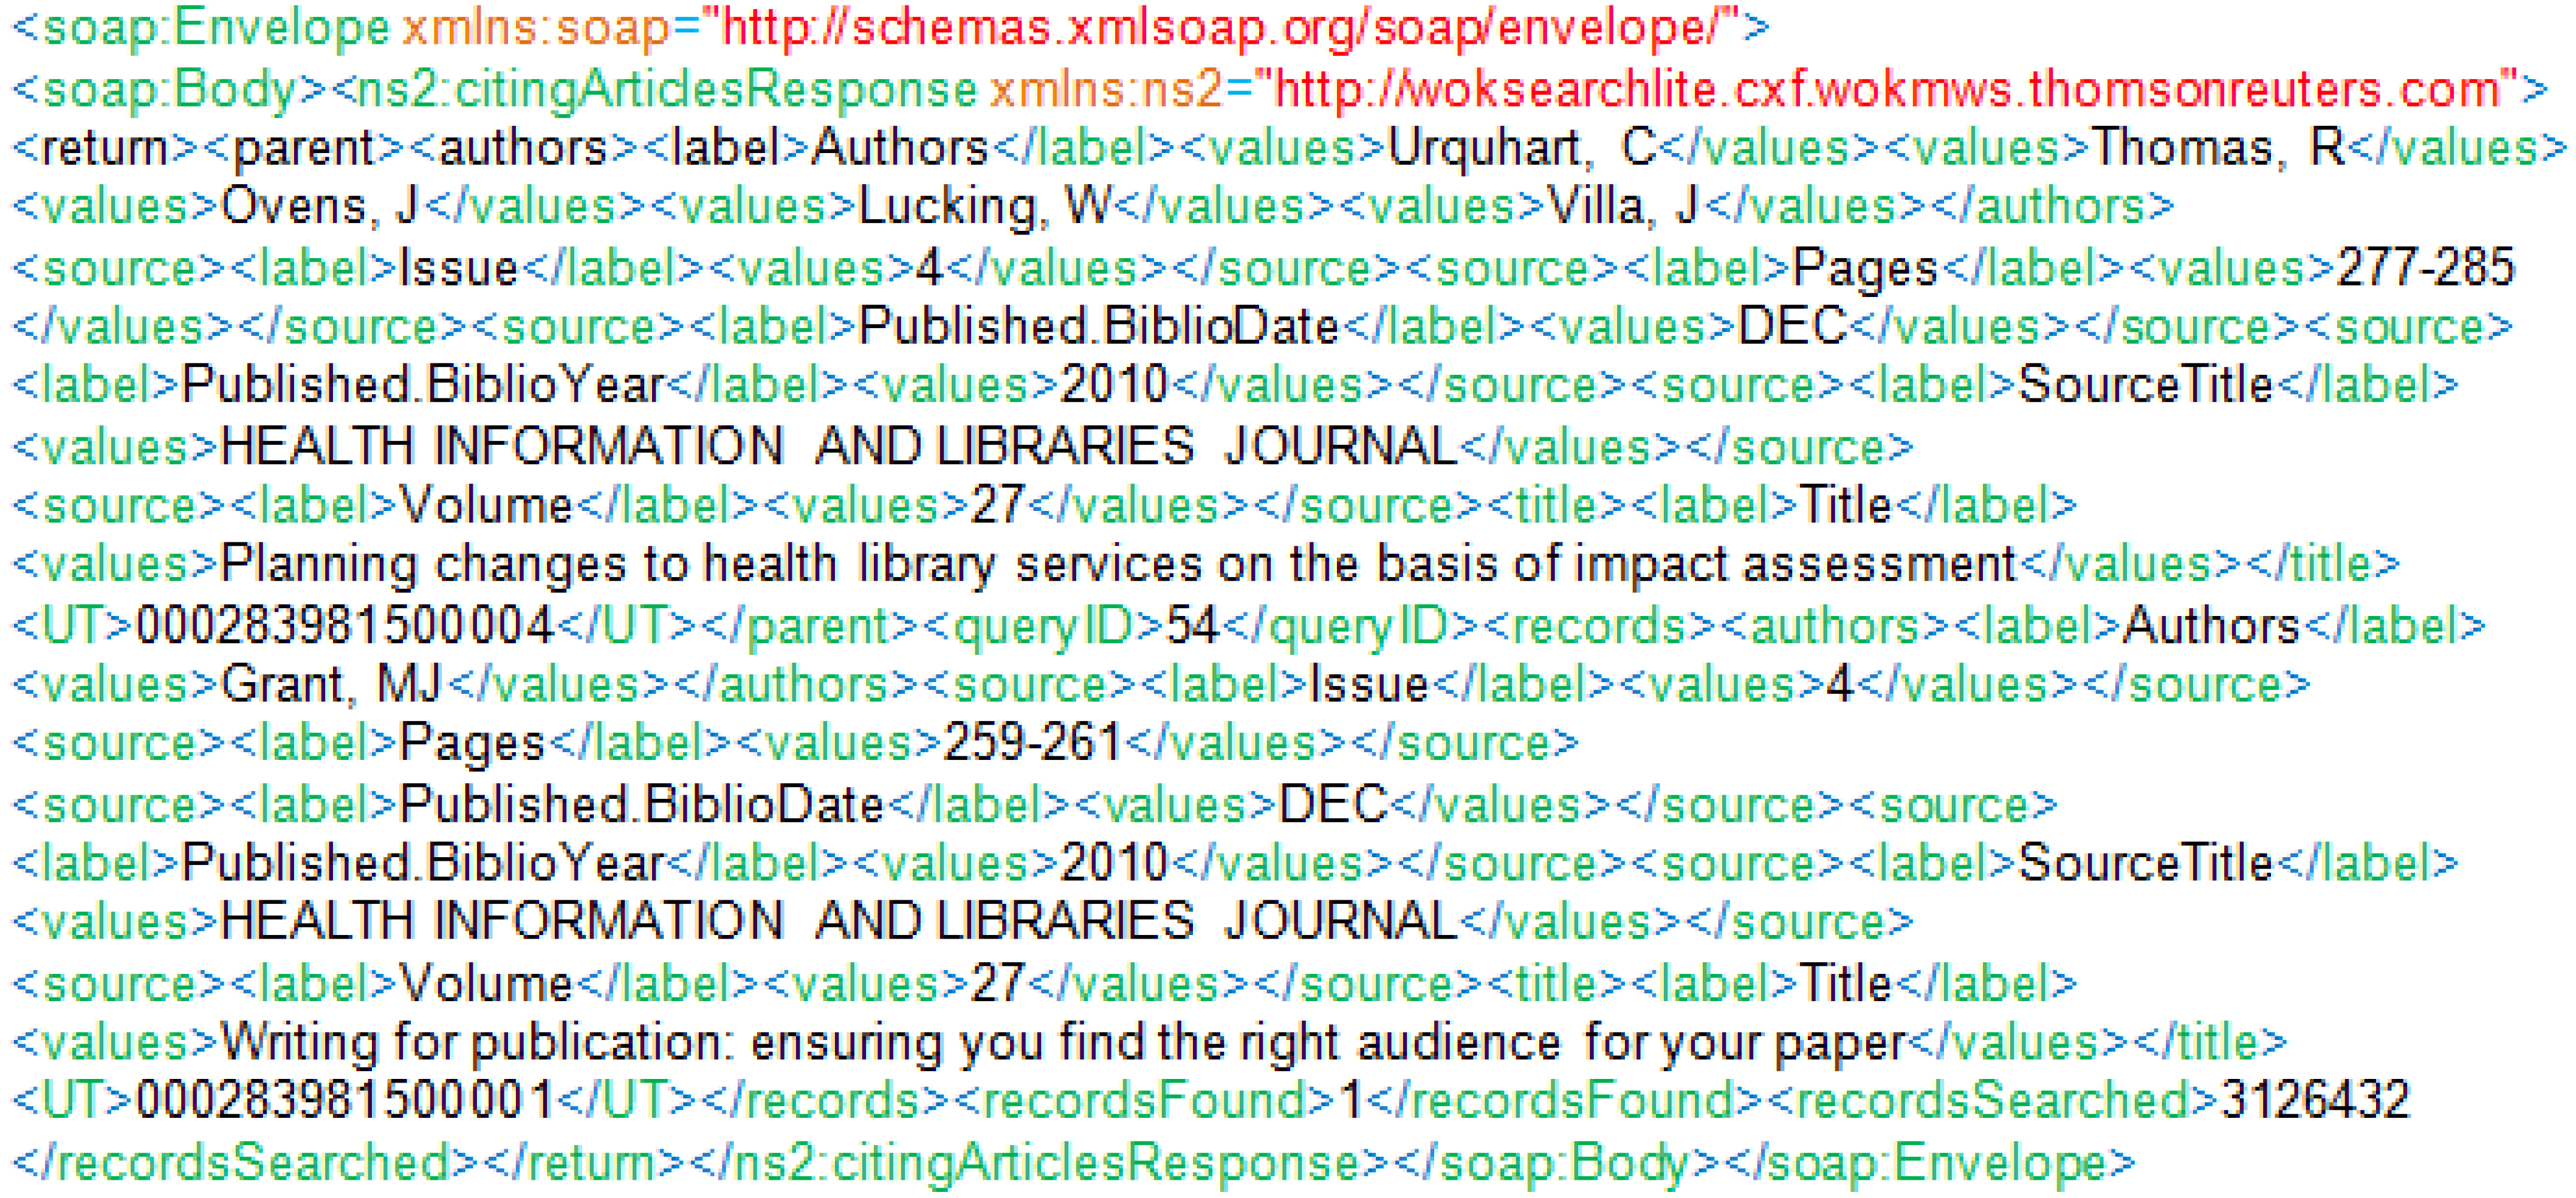
Therefore, in the next step, we used the Web Services Lite application programming interface (API) to retrieve the records of articles citing the articles in the basic set. This API is available for free to anyone with a Web of Science subscription after registration. In total, we got 175,139 citing article records. The information contained in the citing article records is somewhat less abundant than in the plain text seed article records. In particular, any author address information is missing. On the other hand, citing article records are structured in a similar way as XML records. See
Figure 2 for an example of a citing article record. In the example, an article with ID (UT) 000283981500004 is cited by an article with ID 000283981500001. These IDs can then be matched with “UT WOS” in seed article records (see bottom of
Figure 1) and, as a result, a complete citation network of the articles in the root set can be constructed. This citation graph had 94,836 edges,
i.e., slightly over 54% of all citations were citations within the seed set.
Figure 2.
A sample citing article record.
Since this paper is concerned with departments, the research depends on the extent to which affiliations and addresses of article authors are systematically present in the records we analyzed. There is no genuine affiliation information in the records, but there is often information on authors’ addresses denoted with C1 and RP like in
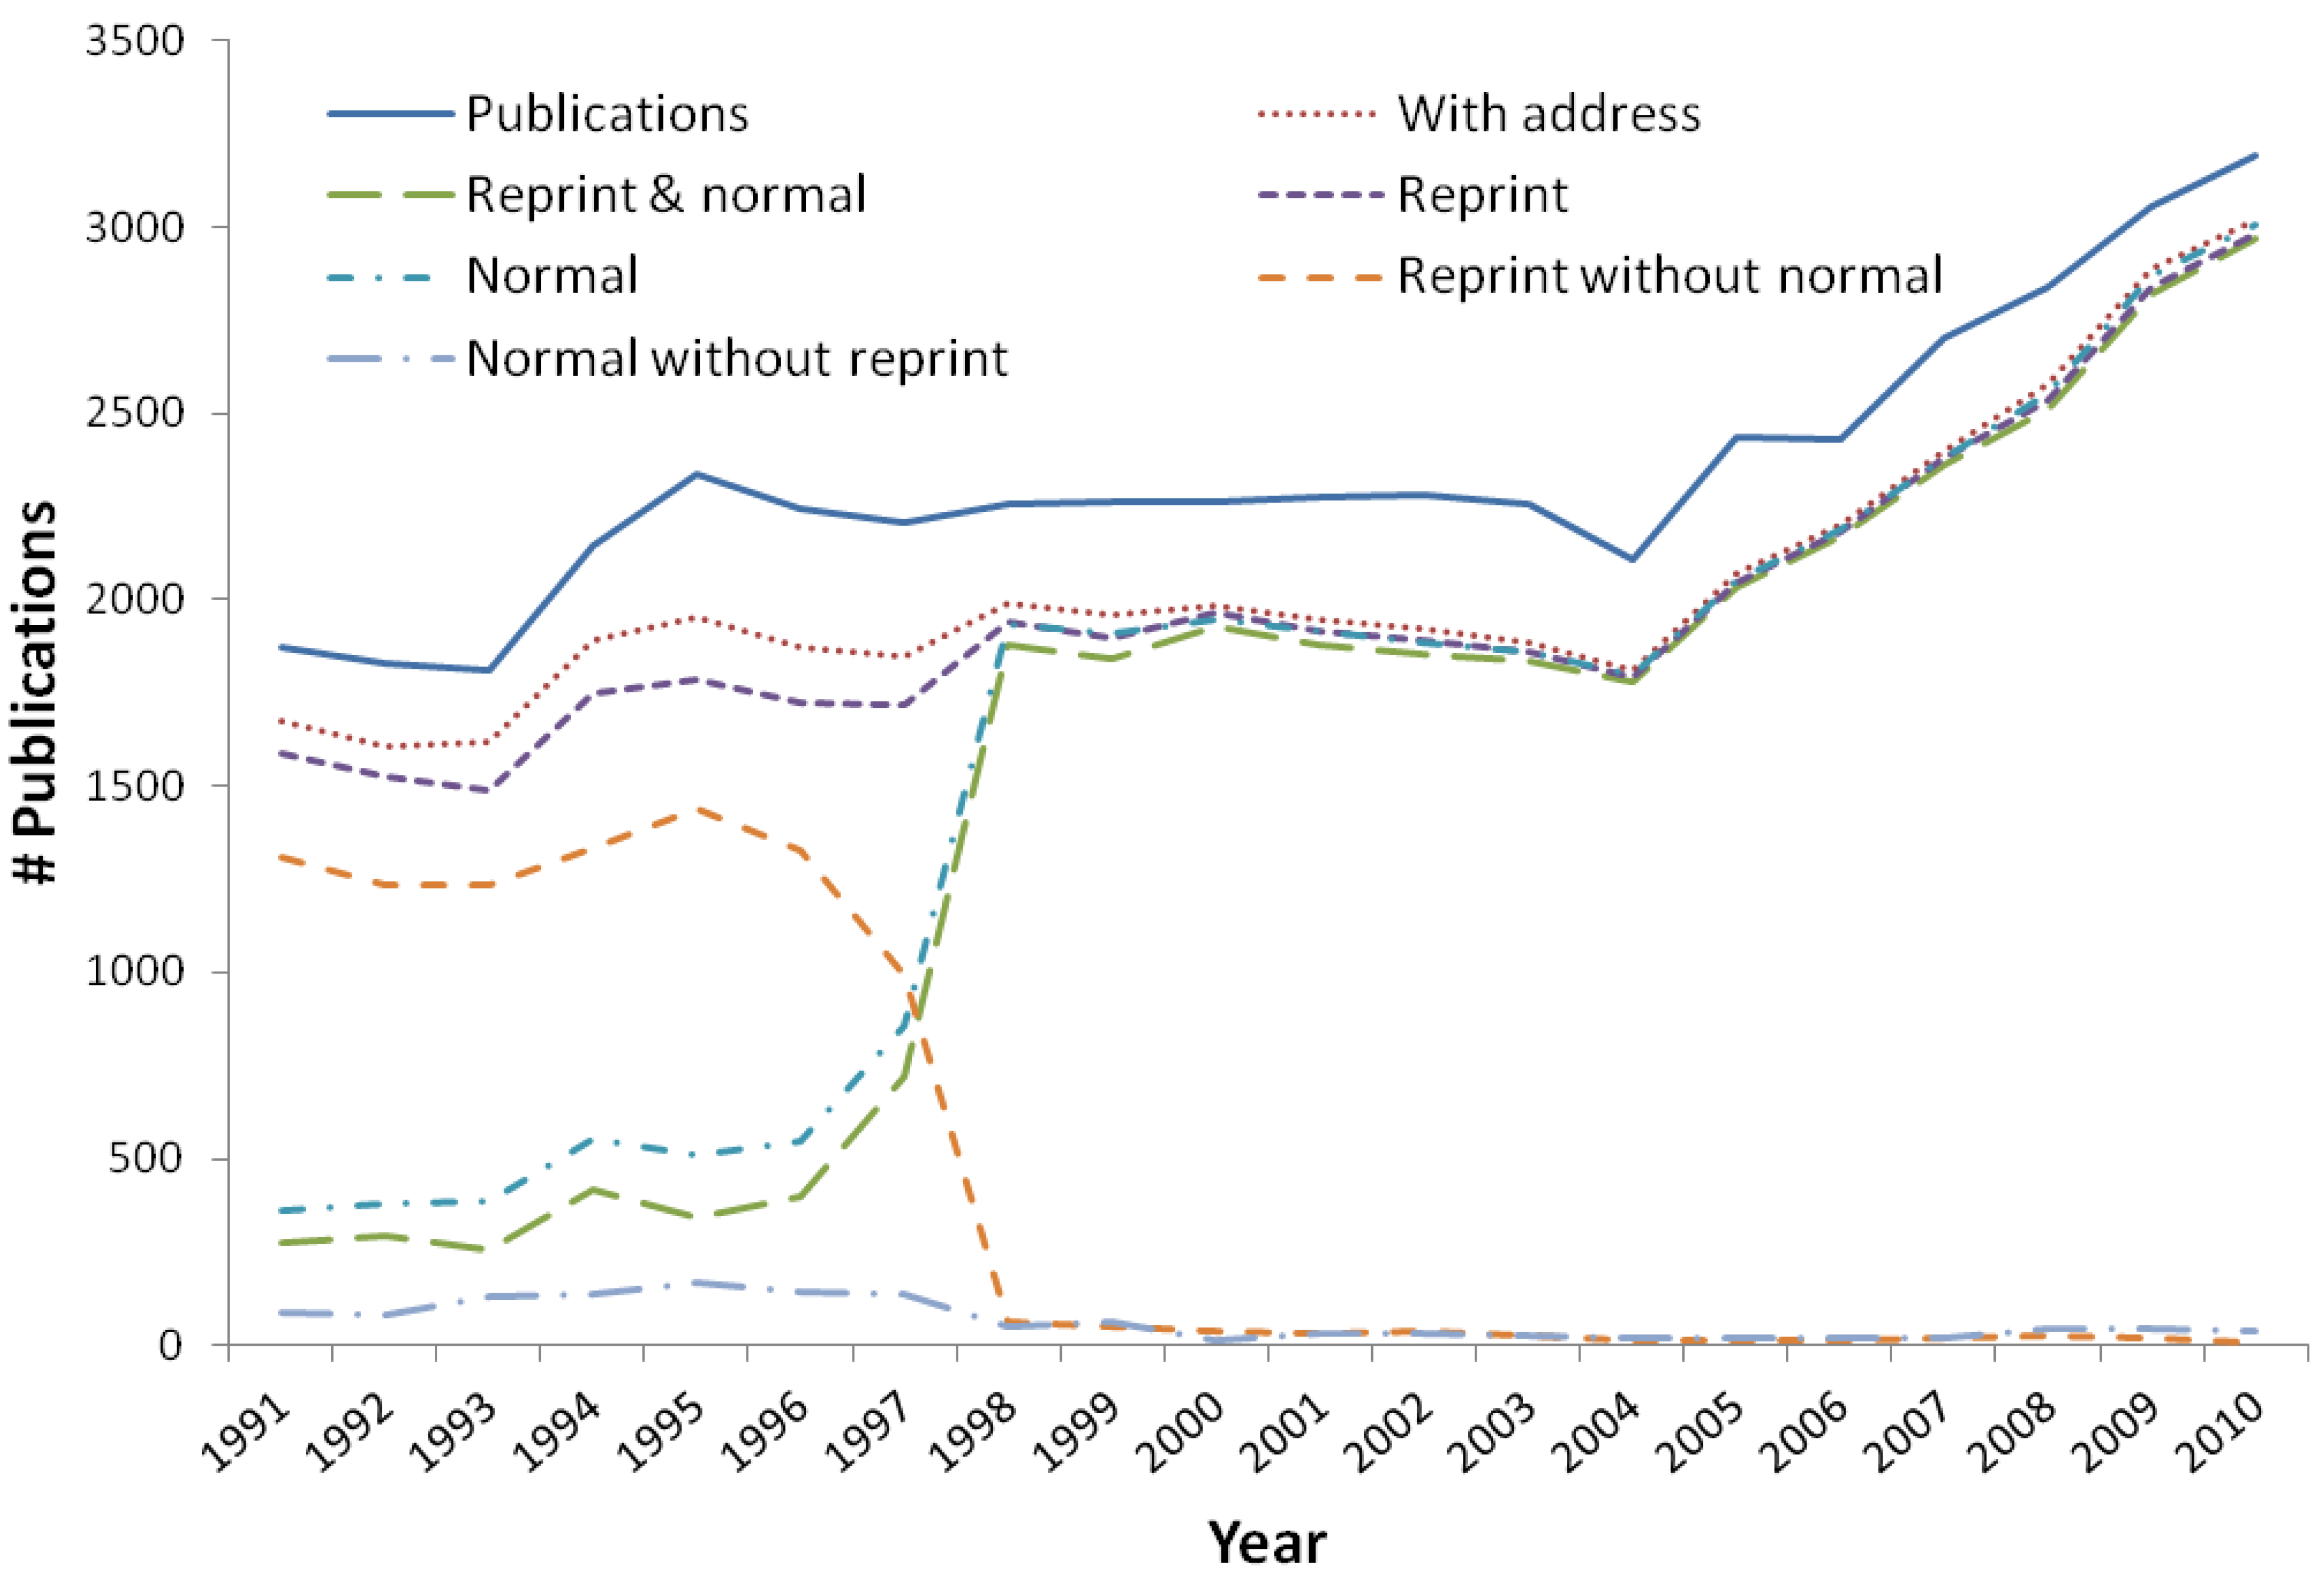
Figure 1. RP means a “reprint address”, which is the address of the corresponding author (usually, but not always, the first author), and C1 is a field containing authors’ addresses. Reprint and “normal” addresses may sometimes be the same, for instance when there is one author only. In total, almost 88% of publications had some address information associated with them and 65% had both reprint and normal address. 85% of publications had a reprint address and 68% had one normal address at least, but the latter percentage was quite different in various years under study as can be seen from
Figure 3. While the share of publications with some address information has been about 90% throughout the period, the number of publications with one normal address at least has only had a similar share since 1998. Before 1998 there was a high percentage of publications having a reprint but no normal address (from 45% to 70%), but this was almost negligible in later years and so was the number of articles having a normal address but no reprint address in the whole period 1991–2010.
Figure 3.
Numbers of publications with different types of addresses.
As can be seen in
Figure 1, addresses have a relatively clear structure starting with an institution followed with suborganizations (from bigger to smaller ones) and ending with a city and a country. Organizations (institutions) and suborganizations are written using standardized abbreviations and are delimited with commas as are cities and countries. In our experience, reprint addresses often include also other information such as street names and numbers or state or province names,
etc. This additional information can distort the common address pattern “institution, suborganizaiton1, …, suborganizationN, city (+ZIP), country”, but based on our experiments with random address samples and a manual checking of the pattern correctness, the pattern is violated in a few percent of cases even if reprint addresses are included. As a result, we made an approximation and considered all addresses in all publications in the period 1991–2010 as having an institution as their first item, a city and a country as their last item, and suborganizations in between. The number of suborganizations can vary as shown in
Table 1. In the data under study, an institution (main organization) can have up to seven suborganizations associated with it, but most affiliations consist of an institution and its suborganization. Thus, before all the experiments whose results will be reported in the next section, we retained suborganization 1 in each address and discarded the other suborganizations of higher levels. We will call the couple “institution; suborganization 1” a “department” because this is typically what is represented by that.
Table 1.
Examples of various suborganizations of an institution.
| Organization | Suborganization 1 | Suborganization 2 | Suborganization 3 |
|---|
| Indiana Univ | | | |
| Indiana Univ | Sch Lib & Informat Sci | | |
| Indiana Univ | Sch Business | Decis & Informat Syst Dept | |
| Indiana Univ | Sch Med | Dept Med | Div Gen Med & Geriatr |
3. Results and Discussion
The citation graph of departments we obtained had 18,291 nodes and 154,744 edges. The graph is directed and the edges are weighted with an average weight of 2.62 per edge. The total sum of edge weights in the graph (404,755) is the total number of citations between departments. In
Table 2 we can see the departments that received the most citations: “Indiana Univ; Sch Lib & Informat Sci”, “Leiden Univ; Ctr Sci & Technol Studies”, and “Univ Sheffield; Dept Informat Studies”. However, the numbers of publications by which the departments are represented (see the last column in
Table 2) vary significantly so “Leiden Univ; Ctr Sci & Technol Studies” with 3722 citations and 84 publications is actually relatively more cited than “Indiana Univ; Sch Lib & Informat Sci” with 4334 citations and 243 publications (44 citations per publication compared to 18). But the measure of citations per publication is obviously biased towards departments with fewer publications. For instance, the relatively most cited department in
Table 2 is “Lib Hungarian Acad Sci; Bibliometr Serv” (position 33) with 165 citations per publication.
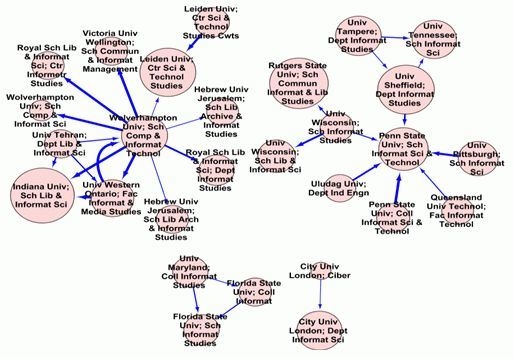
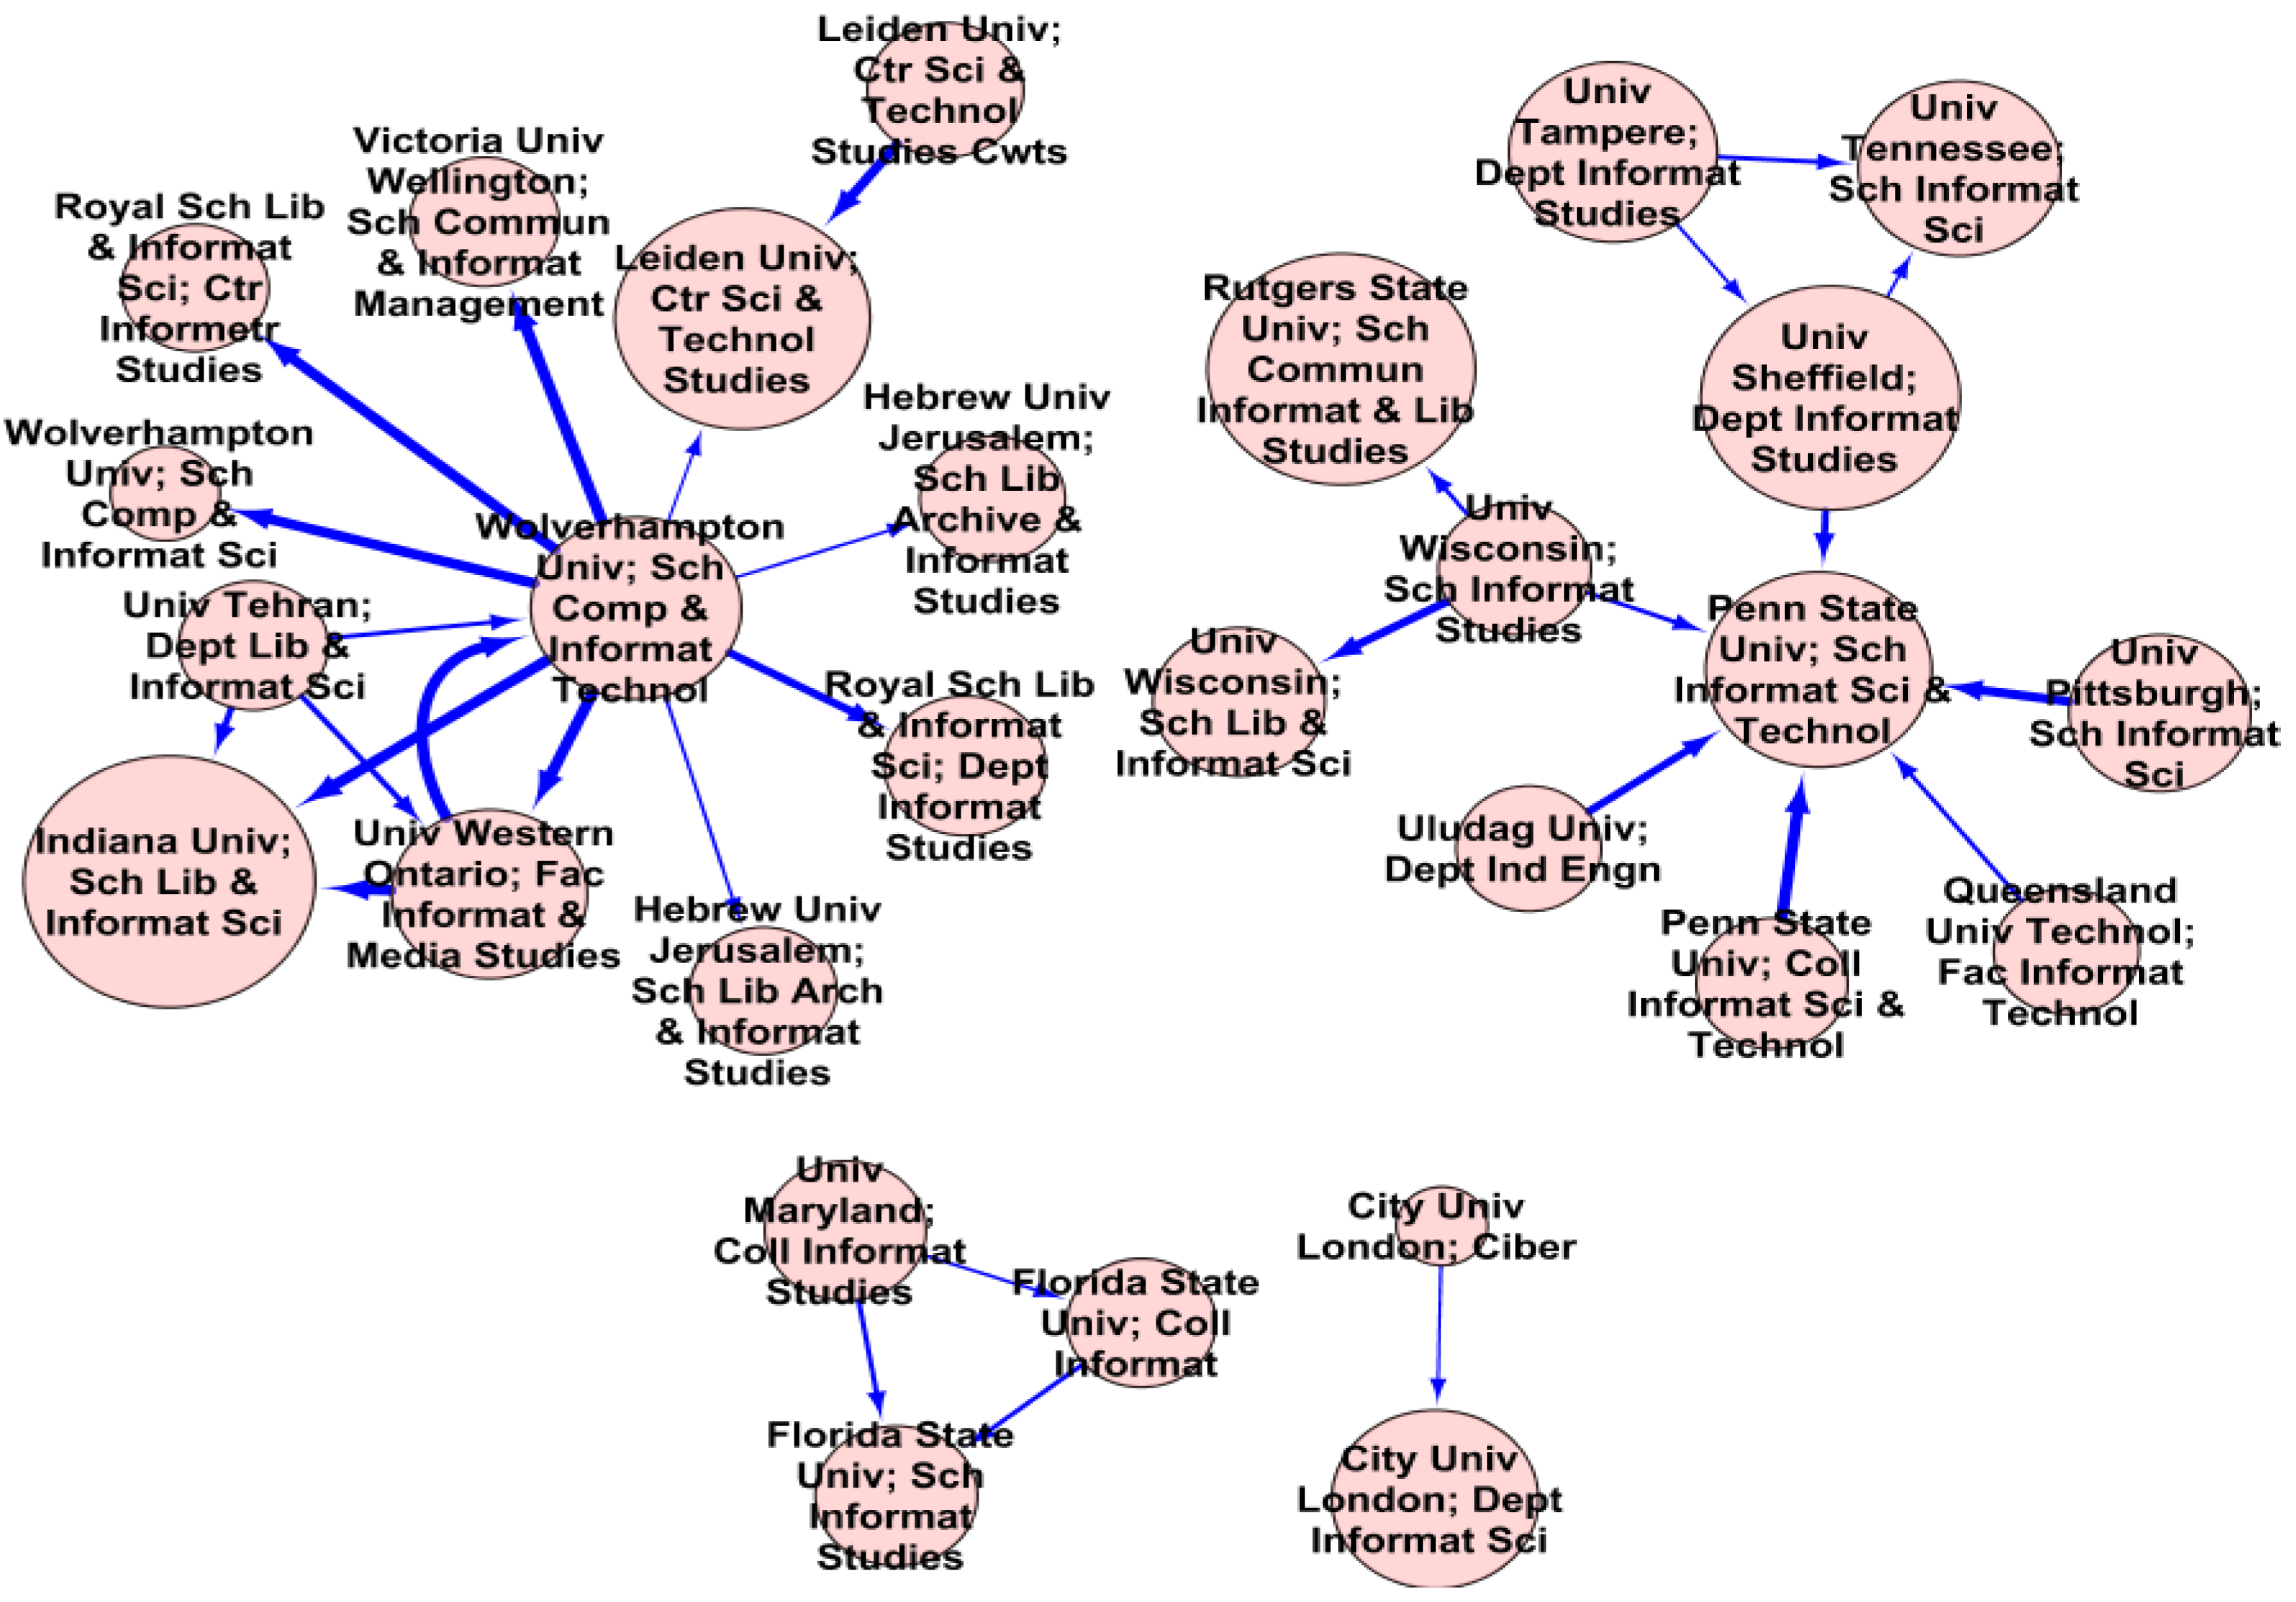
As far as the citations between individual departments are concerned, we can see the most intense of them in
Figure 4. The size of nodes is based on the “times cited” (see below for an explanation) of a department and the thickness of edges depends on the number of citations from one department to another. We can notice that there are two big components—one centred around “Wolverhampton Univ; Sch Comp & Informat Technol” and the other one around “Penn State Univ; Sch Informat Sci & Technol”. The most intense citations as such are those from “Wolverhampton Univ; Sch Comp & Informat Technol” to “Indiana Univ; Sch Lib & Informat Sci”, “Victoria Univ Wellington; Sch Commun & Informat Management”, and “Univ Western Ontario; Fac Informat & Media Studies”. There are also intra-institutional citations such as from “Wolverhampton Univ; Sch Comp & Informat Technol” to “Wolverhampton Univ; Sch Comp & Informat Sci” or from “Penn State Univ; Coll Informat Sci & Technol” to “Penn State Univ; Sch Informat Sci & Technol”, but these may sometimes be self-citations of departments that changed their names or whose names are used inconsistently. These errors are inherent in the Web of Science data and they could be removed only by means of a huge amount of manual effort. In total, we found that 4.3% of all citations were intra-institutional.
Table 2.
Top 40 “library and information science (LIS)” departments by citations.
| | Department | Citations | Publications |
|---|
| 1 | Indiana Univ; Sch Lib & Informat Sci | 4334 | 243 |
| 2 | Leiden Univ; Ctr Sci & Technol Studies | 3722 | 84 |
| 3 | Univ Sheffield; Dept Informat Studies | 3606 | 195 |
| 4 | Rutgers State Univ; Sch Commun Informat & Lib Studies | 3413 | 144 |
| 5 | Penn State Univ; Sch Informat Sci & Technol | 3361 | 56 |
| 6 | Univ Maryland; Robert H Smith Sch Business | 3013 | 52 |
| 7 | Univ Minnesota; Carlson Sch Management | 2835 | 71 |
| 8 | Univ Tennessee; Sch Informat Sci | 2661 | 118 |
| 9 | Drexel Univ; Coll Informat Sci & Technol | 2288 | 101 |
| 10 | Univ Tampere; Dept Informat Studies | 2285 | 96 |
| 11 | City Univ London; Dept Informat Sci | 2162 | 192 |
| 12 | Univ Western Ontario; Fac Informat & Media Studies | 2125 | 138 |
| 13 | Wolverhampton Univ; Sch Comp & Informat Technol | 2068 | 109 |
| 14 | Univ British Columbia; Fac Commerce & Business Adm | 1821 | 26 |
| 15 | Univ Illinois; Grad Sch Lib & Informat Sci | 1710 | 167 |
| 16 | Queens Univ; Sch Business | 1651 | 24 |
| 17 | Univ N Carolina; Sch Lib & Informat Sci | 1630 | 102 |
| 18 | Harvard Univ; Sch Med | 1516 | 143 |
| 19 | Univ Georgia; Terry Coll Business | 1484 | 38 |
| 20 | Florida State Univ; Coll Business | 1447 | 36 |
| 21 | Univ Virginia; Mcintire Sch Commerce | 1413 | 18 |
| 22 | Syracuse Univ; Sch Informat Studies | 1273 | 162 |
| 23 | Georgia State Univ; Coll Business Adm | 1266 | 24 |
| 24 | Univ Calif Irvine; Grad Sch Management | 1261 | 25 |
| 25 | Univ Wisconsin; Sch Lib & Informat Sci | 1195 | 71 |
| 26 | Royal Sch Lib & Informat Sci; Dept Informat Studies | 1158 | 31 |
| 27 | Univ Pittsburgh; Sch Informat Sci | 1150 | 84 |
| 28 | Univ So Calif; Marshall Sch Business | 1139 | 28 |
| 29 | City Univ Hong Kong; Dept Informat Syst | 1064 | 64 |
| 30 | Univ N Texas; Sch Lib & Informat Sci | 1053 | 60 |
| 31 | Univ Calif Los Angeles; Grad Sch Educ & Informat Studies | 1015 | 42 |
| 32 | Univ S Florida; Coll Business Adm | 992 | 17 |
| 33 | Lib Hungarian Acad Sci; Bibliometr Serv | 991 | 6 |
| 34 | Katholieke Univ Leuven; Steunpunt O&o Stat | 984 | 20 |
| 35 | Univ Arkansas; Sam M Walton Coll Business | 973 | 11 |
| 36 | Florida State Univ; Sch Informat Studies | 971 | 53 |
| 37 | Csic; Cindoc | 966 | 32 |
| 38 | Georgia State Univ; Dept Comp Informat Syst | 966 | 27 |
| 39 | Univ Wisconsin; Sch Lib & Informat Studies | 946 | 74 |
| 40 | Univ N Carolina; Kenan Flagler Business Sch | 926 | 13 |
Figure 4.
Most intense citations between “LIS” departments.
The citations shown in
Table 2 are based on the citation graph of departments, which was generated from the core 46,800 publication records retrieved. Citations from publications outside of this core are not counted in, but they are included in the “Times Cited” indicator which is present in each publication record retrieved (TC in
Figure 1). The ranking of departments by times cited looks different than that in
Table 2 and the top departments are presented in
Table 3. The best three departments are “Univ Minnesota; Carlson Sch Management”, “Harvard Univ; Sch Med”, and “Univ Maryland; Robert H Smith Sch Business”. Again, departments with fewer publications often have higher times cited counts. An extreme case is “Univ So Calif; Knowledge Syst Lab” with one publication only and the largest times cited in
Table 3. Note that the times cited count is not always greater than or equal to citations because both indicators are based on different citation graphs—the citation graph of articles and the citation graph of departments, respectively. Imagine a department affiliated with one article only that is merely cited once from an article with which three distinct departments are affiliated. In that case the cited department’s times cited count is 1 and its citations indicator is 3. Thus the ranks of individual departments in both rankings can differ significantly. For example, “Univ So Calif; Knowledge Syst Lab” is ranked 10th by times cited but 396th by citations or “Lib Hungarian Acad Sci; Bibliometr Serv” is 33th by citations but 155th by times cited. Anyway, the interpretation may be that “Univ So Calif; Knowledge Syst Lab” is relatively more cited by researchers from other scientific fields than from the community of library and information science whereas “Lib Hungarian Acad Sci; Bibliometr Serv” is relatively more cited from within the community than from outside of it. There is also one highly ranked “department” by times cited, namely “The Scientist; 3600 Market St”, which is wrongfully identified as such from frequent addresses associated with “The Scientist” journal articles in WoS data and which is ranked very low by citations. Nevertheless, the correlation between the department rankings by citations and by times cited is still rather high as will be shown later on. By the way, many of the present departments are not genuine LIS departments, but are affiliations of authors publishing in journals categorized as ISLS by WoS showing the multidisciplinarity of this field. On the other hand, some LIS research is also published in other WoS categories not covered by this study.
Table 3.
Top 40 “LIS” departments by times cited.
| | Department | Times Cited | Publications |
|---|
| 1 | Univ Minnesota; Carlson Sch Management | 4756 | 71 |
| 2 | Harvard Univ; Sch Med | 4051 | 143 |
| 3 | Univ Maryland; Robert H Smith Sch Business | 3860 | 52 |
| 4 | Indiana Univ; Sch Lib & Informat Sci | 3475 | 243 |
| 5 | Queens Univ; Sch Business | 3070 | 24 |
| 6 | Rutgers State Univ; Sch Commun Informat & Lib Studies | 2950 | 144 |
| 7 | Univ Virginia; McIntire Sch Commerce | 2942 | 18 |
| 8 | The Scientist; 3600 Market St | 2922 | 569 |
| 9 | Univ Sheffield; Dept Informat Studies | 2761 | 195 |
| 10 | Univ So Calif; Knowledge Syst Lab | 2696 | 1 |
| 11 | Leiden Univ; Ctr Sci & Technol Studies | 2673 | 84 |
| 12 | Univ Arkansas; Sam M Walton Coll Business | 2169 | 11 |
| 13 | Univ British Columbia; Fac Commerce & Business Adm | 2167 | 26 |
| 14 | Univ Georgia; Terry Coll Business | 2022 | 38 |
| 15 | Penn State Univ; Sch Informat Sci & Technol | 2017 | 56 |
| 16 | Florida State Univ; Coll Business | 2008 | 36 |
| 17 | Georgia State Univ; Coll Business Adm | 1967 | 24 |
| 18 | Harvard Univ; Sch Publ Hlth | 1707 | 38 |
| 19 | Univ Illinois; Grad Sch Lib & Informat Sci | 1669 | 167 |
| 20 | Wolverhampton Univ; Sch Comp & Informat Technol | 1669 | 109 |
| 21 | Univ Tampere; Dept Informat Studies | 1621 | 96 |
| 22 | City Univ London; Dept Informat Sci | 1580 | 192 |
| 23 | Drexel Univ; Coll Informat Sci & Technol | 1535 | 101 |
| 24 | Univ Tennessee; Sch Informat Sci | 1488 | 118 |
| 25 | City Univ Hong Kong; Dept Informat Syst | 1459 | 64 |
| 26 | Univ So Calif; Marshall Sch Business | 1446 | 28 |
| 27 | Georgia State Univ; Robinson Coll Business | 1421 | 25 |
| 28 | Univ Calif Irvine; Grad Sch Management | 1385 | 25 |
| 29 | Univ Western Ontario; Fac Informat & Media Studies | 1332 | 138 |
| 30 | Univ S Florida; Coll Business Adm | 1233 | 17 |
| 31 | Univ N Carolina; Sch Lib & Informat Sci | 1180 | 102 |
| 32 | Syracuse Univ; Sch Informat Studies | 1178 | 162 |
| 33 | Stanford Univ; Sch Med | 1162 | 76 |
| 34 | Univ Penn; Wharton Sch | 1141 | 49 |
| 35 | Georgia State Univ; Dept Comp Informat Syst | 1076 | 27 |
| 36 | Brigham & Womens Hosp; Div Gen Med & Primary Care | 1074 | 16 |
| 37 | Univ N Carolina; Kenan Flagler Business Sch | 1064 | 13 |
| 38 | McGill Univ; Fac Management | 1063 | 20 |
| 39 | Univ Western Ontario; Sch Business Adm | 1056 | 2 |
| 40 | Carnegie Mellon Univ; Grad Sch Ind Adm | 1046 | 15 |
We did not make an attempt to disambiguate and/or unify the names of institutions and suborganizations, but we used them as they were in WoS data. Instead, we tried to estimate the share of possible duplicate departments. The easiest way to do so was to calculate the similarities of all department names in three random samples of 500 departments using a well known algorithm and then manually check the department pairs whose similarity reached a certain threshold. The determined share of duplicate departments was always below 1%. Thus, we believe that the absence of name disambiguation and unification (which is a very time-consuming task) does not significantly affect the results of this study.
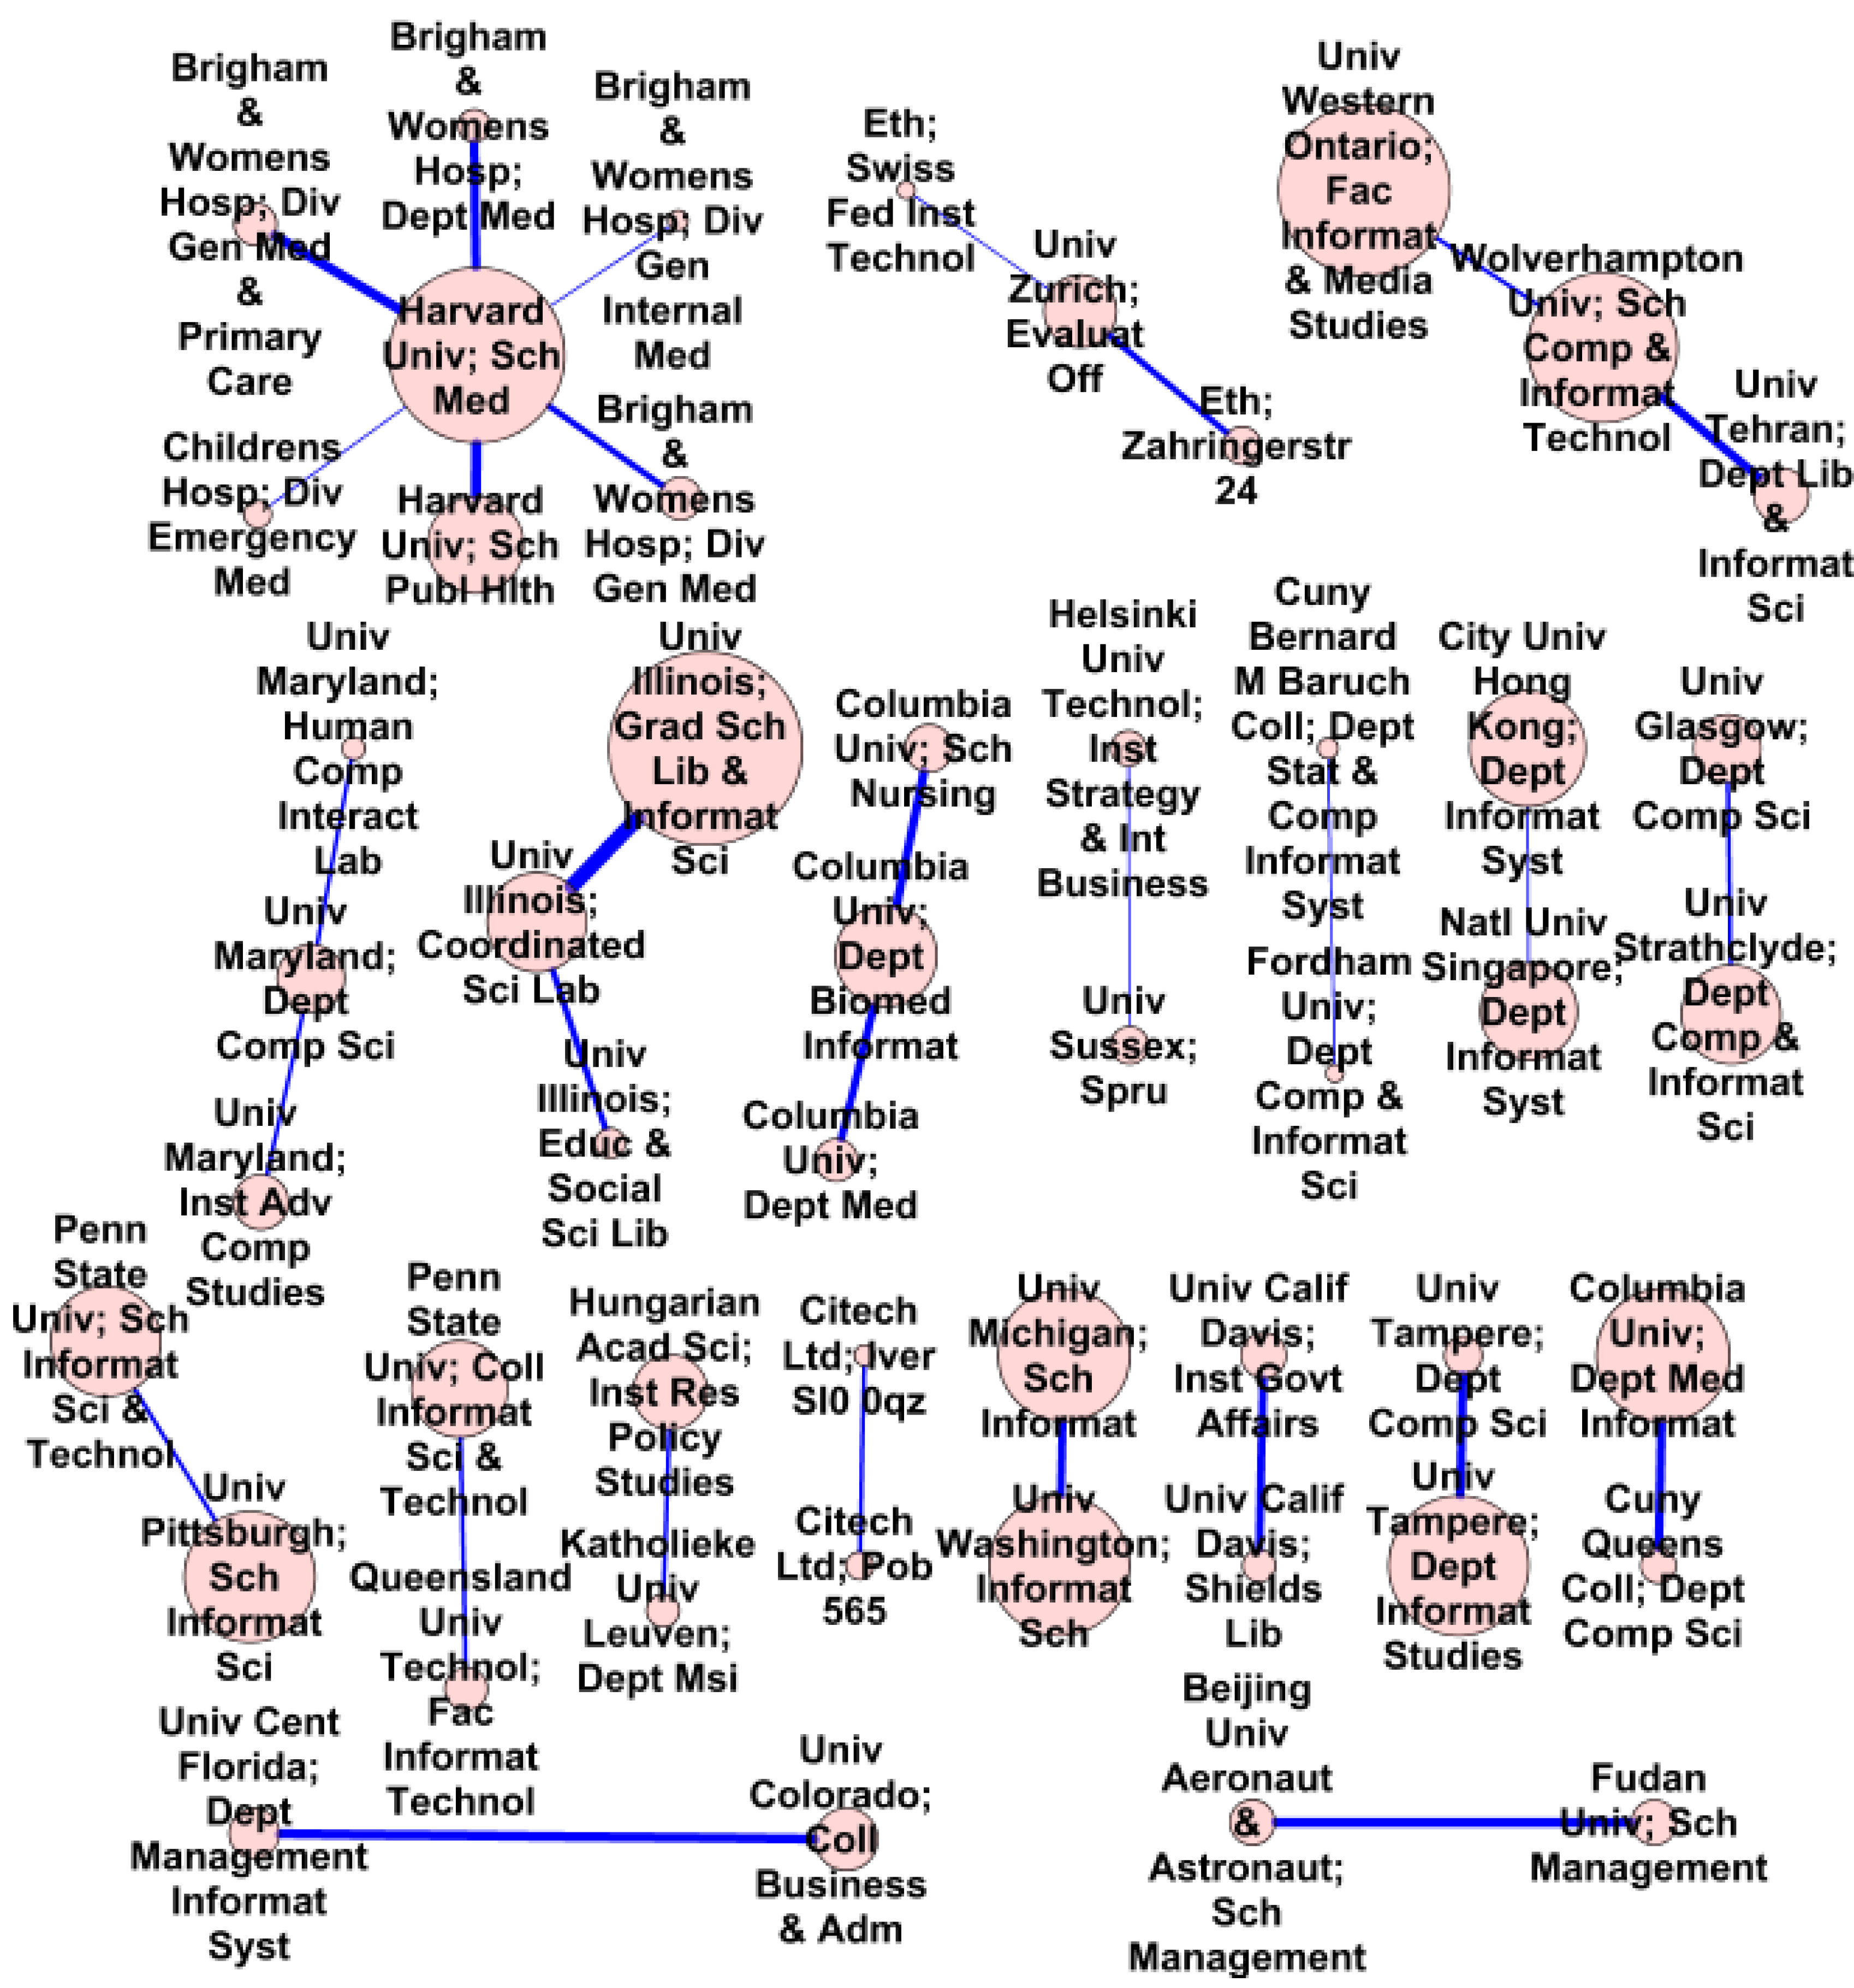
Figure 5.
Most intense collaborations between “LIS” departments.
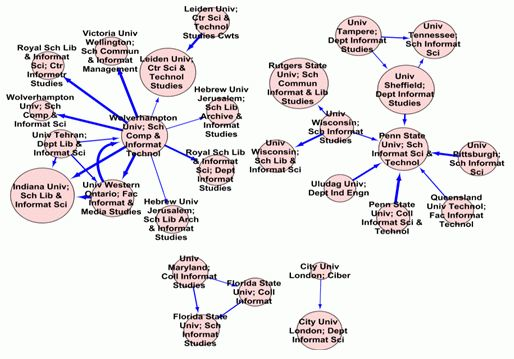
Apart from citations, we can also inspect collaboration patterns. The most intense collaborations between departments are depicted in
Figure 5, where the node size depends on the publication count of a department and the edge thickness depends on the number of collaborations. The three most intense collaborations occur between “Univ Illinois; Coordinated Sci Lab” and “Univ Illinois; Grad Sch Lib & Informat Sci” (an intra-institutional collaboration), “Brigham & Womens Hosp; Div Gen Med & Primary Care” and “Harvard Univ; Sch Med”, and “Harvard Univ; Sch Med” and “Harvard Univ; Sch Publ Hlth” (also an intra-institutional collaboration). “Harvard Univ; Sch Med” is the “centre” of the biggest community in
Figure 5 collaborating with four “Brigham & Womens Hosp” departments, with another “Harvard Univ” department, and with “Childrens Hosp; Div Emergency Med”. The share of intra-institutional interactions is substantially greater with collaborations than with citations—we found that almost 22% of all 22,569 collaborations were intra-institutional. As for the strength of the relationship between citations and collaborations, it does not seem meaningful to draw any conclusions from our data since only about 6% of collaborations occurred more than once and only about 1.5% of citations occurred more than ten times.
In addition to the rankings by citations or times cited, we created also other rankings of “LIS” departments based on other indicators:
Publications (by the number of publications),
Indegree (like citations but with all weights in the citation graph of departments set to 1),
AvgTimesCited (average times cited per publication),
HindexByTimesCited (h-index as defined by Hirsch [
15] and based on times cited),
HindexByEdges (based on citations within the graph),
HITS [
16],
PageRank [
17], and
Weighted PageRank [
18]. From these other eight rankings we only show the top 40 departments by PageRank and weighted PageRank in
Table 4 and Spearman’s rank correlations between all the rankings in
Table 5 (all significant at the 0.01 leveltwo-tailed).
The PageRank and weighted PageRank rankings are the most highly correlated rankings of all with a rank correlation coefficient of 0.996 and also the first difference in the rankings is at rank 5, where there is “Haifa Univ; Dept Geog” by PageRank and “Univ Minnesota; Carlson Sch Management” by the weighted PageRank. Otherwise, the rankings in
Table 4 are quite similar to each other but less so to the ranking by citations (correlation about 0.83) and even less to the ranking by times cited (around 0.69). PageRank-like algorithms (and also HITS) are iterative recursive methods dependent on the structure of the citation graph of departments and, therefore, they are much more related to citations than to times cited. Although the top departments shown in
Table 4 do not resemble those in
Table 2 and
Table 3, the overall rankings are still quite strongly correlated with all other rankings except
Publications. The least correlation we found between
Publications and
AvgTimesCited—only about 0.2
Publications is also the most distant ranking from all others with an average correlation of 0.483.
Finally, to conclude the section on results, in
Table 6 we present examples of the most influential departments (by times cited) of four leading universities having the greatest times cited counts in our LIS data set. These universities are “Univ Maryland”, “Indiana Univ”, “Georgia State Univ”, and “Univ Minnesota”. We can notice that there are basically two types of performance distribution at institutions—either there is one dominant department like “Carlson Sch Management” at “Univ Minnesota” or “Robert H Smith Sch Business” at “Univ Maryland” or, to a lesser extent, “Sch Lib & Informat Sci” at “Indiana Univ”, or there are several comparably well performing departments like “Coll Business Adm”, “Robinson Coll Business”, and “Dept Comp Informat Syst” at “Georgia State Univ”. Even if this example is small, we can assume that all influential institutions whose research influence is investigated at the level of departments can fit into one of these two basic performance distribution schemes.
Table 4.
Top 40 “LIS” departments by PageRank and weighted PageRank.
| | PageRank | Weighted PageRank |
|---|
| 1 | Inst Studies Res & Higher Educ; Munthes Gt 29 | Inst Studies Res & Higher Educ; Munthes Gt 29 |
| 2 | Norwegian Radium Hosp; Inst Canc Res | Norwegian Radium Hosp; Inst Canc Res |
| 3 | Univ Missouri; Med Informat Grp | Univ Missouri; Med Informat Grp |
| 4 | Univ Missouri; Program Hlth Serv Management | Univ Missouri; Program Hlth Serv Management |
| 5 | Haifa Univ; Dept Geog | Univ Minnesota; Carlson Sch Management |
| 6 | Univ Maryland; Dept Geog | Indiana Univ; Sch Lib & Informat Sci |
| 7 | Enea; Cr Casaccia | Haifa Univ; Dept Geog |
| 8 | Univ Washington; Coll Educ | Univ Hull; Inst European Publ Law |
| 9 | Washington State Univ; Edward R Murrow Sch Commun | Univ Hull; Sch Law |
| 10 | Cornell Univ; Coll Agr & Life Sci | Rutgers State Univ; Sch Commun Informat & Lib Studies |
| 11 | Cornell Univ; Coll Vet Med | Enea; Cr Casaccia |
| 12 | Univ Hull; Sch Law | Univ Maryland; Dept Geog |
| 13 | Univ Hull; Inst European Publ Law | Univ Washington; Coll Educ |
| 14 | Univ Minnesota; Carlson Sch Management | Univ Sheffield; Dept Informat Studies |
| 15 | Enea; Res Ctr Casaccia | Cornell Univ; Coll Vet Med |
| 16 | Univ Hamburg; Inst Ethnol | Queens Univ; Sch Business |
| 17 | Univ Calabria; Ctr Ingn Econ & Sociale | Leiden Univ; Ctr Sci & Technol Studies |
| 18 | Enea; Ente Nuove Tecnol Energia Ambiente | Cornell Univ; Coll Agr & Life Sci |
| 19 | Indiana Univ; Sch Lib & Informat Sci | Washington State Univ; Edward R Murrow Sch Commun |
| 20 | Rutgers State Univ; Sch Commun Informat & Lib Studies | Univ British Columbia; Fac Commerce & Business Adm |
| 21 | Queens Univ; Sch Business | Penn State Univ; Sch Informat Sci & Technol |
| 22 | Univ Vermont; Sch Business Adm | Univ Illinois; Grad Sch Lib & Informat Sci |
| 23 | Univ Sheffield; Dept Informat Studies | Univ Maryland; Robert H Smith Sch Business |
| 24 | Univ Virginia; Mcintire Sch Commerce | Harvard Univ; Sch Med |
| 25 | Leiden Univ; Ctr Sci & Technol Studies | Enea; Res Ctr Casaccia |
| 26 | Univ Maryland; Hlth Sci Lib | Univ Tennessee; Sch Informat Sci |
| 27 | Univ Illinois; Grad Sch Lib & Informat Sci | Univ Vermont; Sch Business Adm |
| 28 | Univ Michigan; Alfred Taubman Med Lib | Univ Virginia; Mcintire Sch Commerce |
| 29 | Univ Texas; Grad Sch Business | Univ Penn; Wharton Sch |
| 30 | Harvard Univ; Sch Med | Univ Tampere; Dept Informat Studies |
| 31 | Natl & Univ Lib Iceland; Interlib Loans Document Delivery Dept | Univ Calif Irvine; Grad Sch Management |
| 32 | Reykjavik Univ; European Documentat Ctr | Univ Maryland; Hlth Sci Lib |
| 33 | Georgia State Univ; Coll Business Adm | Georgia State Univ; Coll Business Adm |
| 34 | Univ Western Ontario; Sch Business Adm | Univ Georgia; Terry Coll Business |
| 35 | Univ Calif Irvine; Grad Sch Management | Carnegie Mellon Univ; Grad Sch Ind Adm |
| 36 | Univ British Columbia; Fac Commerce & Business Adm | City Univ London; Dept Informat Sci |
| 37 | Syracuse Univ; Sch Informat Studies | Univ Michigan; Alfred Taubman Med Lib |
| 38 | Univ Michigan; Head Hlth Sci Lib | Univ N Carolina; Sch Lib & Informat Sci |
| 39 | Oregon State Univ; Dept Journalism | Drexel Univ; Coll Informat Sci & Technol |
| 40 | Carnegie Mellon Univ; Grad Sch Ind Adm | Syracuse Univ; Sch Informat Studies |
Table 5.
Spearman’s rank correlation coefficients between various rankings.
| | Avg Times Cited | Citations | Indegree | Publications | Times Cited | Hindex By Edges | Hindex ByTims Cited | HITS | PR | PR weighted |
|---|
| Avg TimesCited | 1 | 0.7009 | 0.7055 | 0.2045 | 0.9513 | 0.6944 | 0.7048 | 0.6785 | 0.6358 | 0.6340 |
| Citations | 0.7009 | 1 | 0.9908 | 0.4360 | 0.7641 | 0.7805 | 0.6355 | 0.9604 | 0.8300 | 0.8342 |
| Indegree | 0.7055 | 0.9908 | 1 | 0.4270 | 0.7653 | 0.7790 | 0.6312 | 0.9623 | 0.8416 | 0.8385 |
| Publications | 0.2045 | 0.4360 | 0.4270 | 1 | 0.4561 | 0.4974 | 0.6126 | 0.4052 | 0.3917 | 0.3981 |
| TimesCited | 0.9513 | 0.7641 | 0.7653 | 0.4561 | 1 | 0.7765 | 0.8224 | 0.7352 | 0.6918 | 0.6923 |
| Hindex ByEdges | 0.6944 | 0.7805 | 0.7790 | 0.4974 | 0.7765 | 1 | 0.7879 | 0.7648 | 0.6881 | 0.6887 |
| Hindex ByTimesCited | 0.7048 | 0.6355 | 0.6312 | 0.6126 | 0.8224 | 0.7879 | 1 | 0.6153 | 0.5978 | 0.6011 |
| HITS | 0.6785 | 0.9604 | 0.9623 | 0.4052 | 0.7352 | 0.7648 | 0.6153 | 1 | 0.8020 | 0.7999 |
| PR | 0.6358 | 0.8300 | 0.8416 | 0.3917 | 0.6918 | 0.6881 | 0.5978 | 0.8020 | 1 | 0.9958 |
| PR weighted | 0.6340 | 0.8342 | 0.8385 | 0.3981 | 0.6923 | 0.6887 | 0.6011 | 0.7999 | 0.9958 | 1 |
Table 6.
Top 20 “LIS” departments of four leading universities by times cited.
| Univ Maryland | Indiana Univ |
| Robert H Smith Sch Business | 3860 | Sch Lib & Informat Sci | 3475 |
| Rh Smith Sch Business | 755 | Kelley Sch Business | 1035 |
| Coll Lib & Informat Serv | 597 | Sch Med | 709 |
| Coll Informat Studies | 565 | Sch Business | 254 |
| Asian Div | 480 | Dept Telecommun | 227 |
| Coll Business & Management | 407 | Slis | 221 |
| Dept Decis & Informat Technol | 387 | Grad Sch Business | 213 |
| Dept Comp Sci | 221 | Ctr Social Informat | 142 |
| Coll Lib & Informat Sci | 151 | Sch Publ & Environm Affairs | 141 |
| Inst Adv Comp Studies | 145 | Kelly Sch Business | 121 |
| Dept Informat Syst | 136 | Sch Informat | 89 |
| Dept Geog | 123 | Sch Educ | 70 |
| Sch Med | 100 | Regenstrief Inst Hlth Care | 62 |
| Human Comp Interact Lab | 96 | Sch Journalism | 51 |
| Amer Use Time Project | 72 | Dept Geog | 44 |
| Joint Program Survey Methodol | 69 | Inst Commun Res | 38 |
| Ctr Comp Sci | 65 | Dept Instruct Syst Technol | 35 |
| College Pk | 62 | Dept Polit Sci | 26 |
| Rh Smith Sch | 62 | Dept Amer Studies | 24 |
| Hlth Sci Lib | 58 | Roudebush Va Med Ctr | 21 |
| Georgia State Univ | Univ Minnesota |
| Coll Business Adm | 1967 | Carlson Sch Management | 4756 |
| Robinson Coll Business | 1421 | Curtis L Carlson Sch Management | 609 |
| Dept Comp Informat Syst | 1076 | Dept Informat & Decis Sci | 100 |
| J Mack Robinson Coll Business | 697 | Sch Journalism & Mass Commun | 91 |
| Comp Informat Syst Dept | 675 | Mis Res Ctr | 66 |
| Robinbson Coll Business | 220 | Dept Geog | 46 |
| Dept Management | 210 | Sch Law | 40 |
| Ctr Proc Innovat & Comp Informat Syst | 194 | Digital Technol Ctr | 38 |
| Ctr Proc Innovat | 119 | Informat & Decis Sci Dept | 35 |
| Coll Business | 77 | Biomed Lib | 32 |
| J Mack Robinson Coll Business Adm | 45 | Dept Psychol | 30 |
| Cis Dept | 40 | E Asian Lib | 24 |
| Business Adm | 36 | Coll Educ & Human Dev | 23 |
| Dept Comp Informat Ssyt | 36 | St Paul Campus Lib | 18 |
| Dept Commun | 34 | Dept Comp Sci & Engn | 17 |
| Policy Res Ctr | 24 | Sch Med | 17 |
| Coll Educ | 12 | Sch Nursing | 14 |
| Pullen Lib | 11 | 1445 Gortner Ave | 13 |
| William Russell Pullen Lib | 11 | Sci & Engn Lib | 13 |
| Dept Sociol | 8 | Walter Lib 108 | 13 |


