1. Introduction
In recent years, electronic learning (e-learning) systems have emerged as a transformative force, reshaping the landscape of smart education. Online learning systems offer significant advantages, making education more accessible, flexible, and personalized. By eliminating geographical and socioeconomic barriers, these platforms enable individuals from diverse backgrounds to access educational resources from anywhere in the world [
1]. This accessibility is especially beneficial for those who might not be able to attend traditional classroom settings due to work or family commitments [
2]. Additionally, online systems allow for a high degree of customization, catering to different learning styles and paces, which can enhance student engagement and improve learning outcomes. Moreover, online courses tend to be more cost-effective than their traditional counterparts, reducing financial barriers for learners and institutions alike. These platforms also provide students with an abundance of resources, including videos, interactive content, and extensive databases, further enriching the learning experience.
Developing a successful adaptive e-learning system is contingent upon the creation of a detailed student model, incorporating various attributes of the student. Students have unique ways of engaging with learning materials that shape their individual learning styles [
3]. These styles reflect their preferred methods for processing and understanding information. Recognizing these styles is crucial for e-learning systems to tailor content that enhances learning effectively. Traditionally, identifying learning styles involved having students complete questionnaires. However, this method has several drawbacks: it is often a boring and time-consuming task, students may not fully understand or be aware of their learning styles, leading to arbitrary responses, and the results are static, failing to account for changes in learning styles over time, such a type of learning style identification approach is known as an explicit approach [
4]. These issues highlight the need for a more dynamic and engaging approach to accurately ascertain students’ learning preferences.
Various automated methods have been developed to identify students’ learning styles by analyzing their interactions with e-learning systems to address these limitations. These automatic identification techniques offer several advantages over traditional methods. Firstly, they eliminate the need for time-consuming questionnaires by gathering data directly from students’ activities within the system [
5]. Additionally, unlike static results from questionnaires, the learning styles identified through these automated approaches are dynamic; they can adapt and change in response to shifts in students’ behaviors, ensuring a more accurate and personalized learning experience; such a type of approach is known as an implicit approach [
6]. The implicit approach is much better than the explicit approach, but it may face a cold-start problem when new users log into the system. To overcome these issues, this paper combined both approaches as we collected a minimal number of input characteristics such as learners’ previous score (categorized by fuzzy weight logic), age, gender, and lastly, filling our four questions which represented the FSLSM dimension.
Implementing automatic identification of learning styles requires using a learning style (LS) model, which classifies students based on their preferred learning methods [
7]. Various learning style models have been discussed in this paper. However, the Felder–Silverman Learning Style Model (FSLSM) is identified as particularly effective for adaptive e-learning systems according to recent studies [
8]. In this paper, the FSLSM model was chosen for the reasons described in the next section.
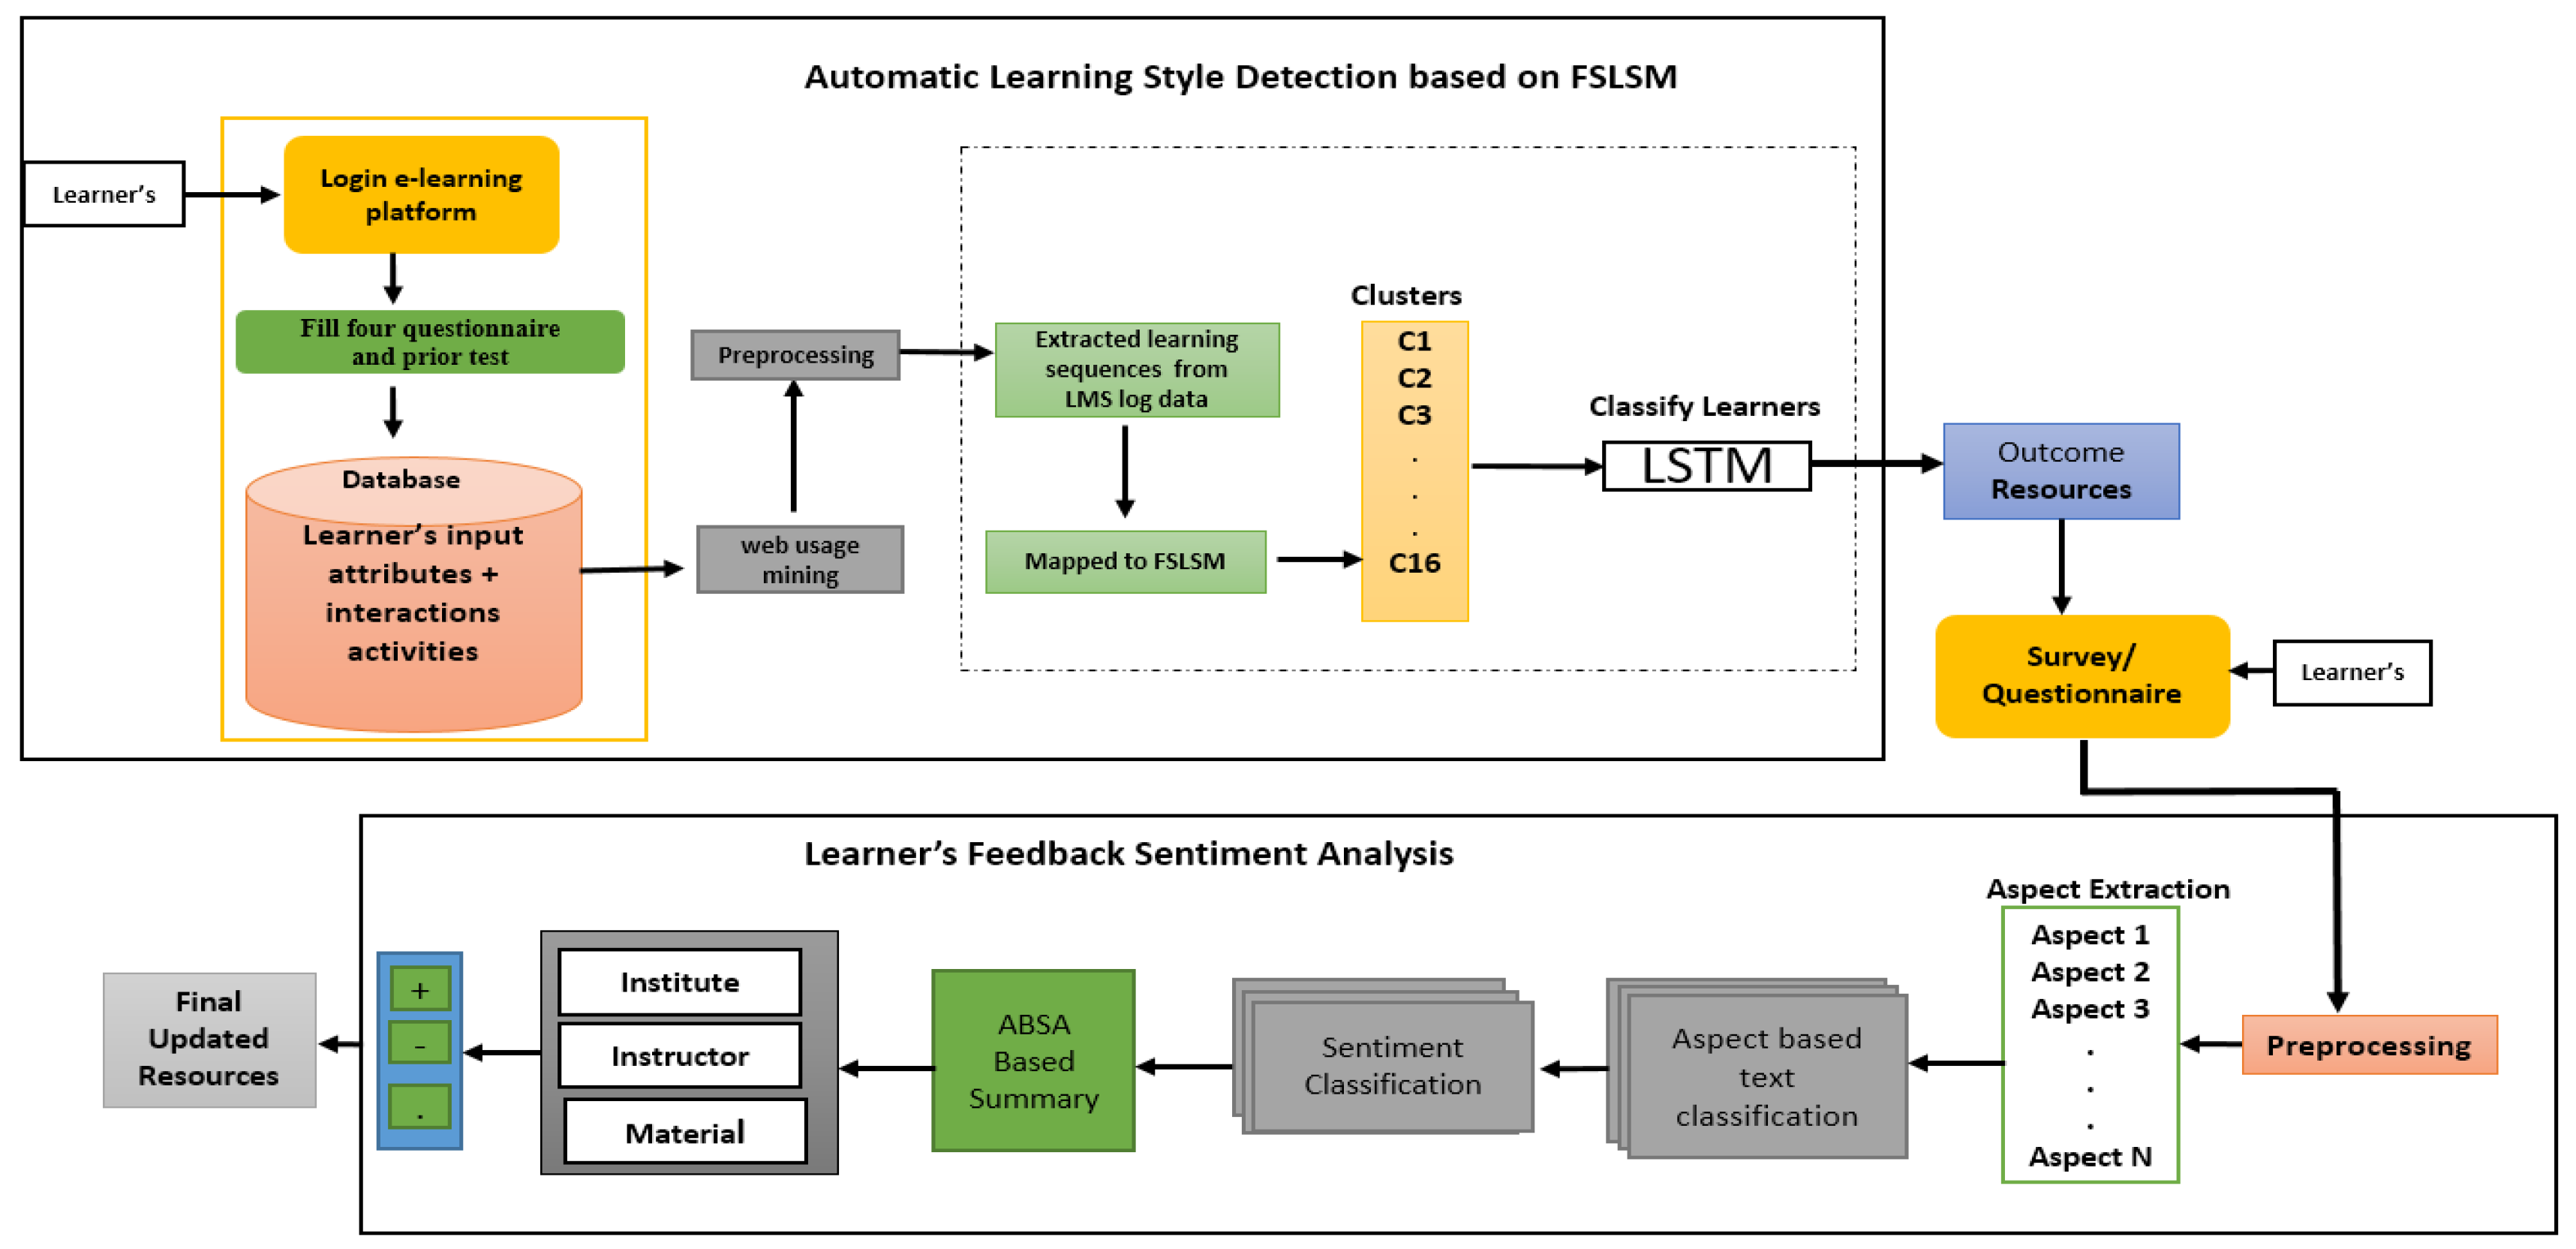
This paper proposes a hybrid approach to improve the e-learning system by integrating automatic learning style identification and simultaneously conducting sentiment analysis to improve the learning object quality further. To identify automatic learning styles, using web usage mining techniques, we analyze student behavior and obtain minimal attributes from learners when they log into the e-learning platform. The collected data on student activities from the e-learning platform’s log files organizes this information into sequences. Each sequence consists of the learning objects that a student accessed during a session. These learning objects are then aligned with the learning style combinations outlined in the FSLSM. These sequences of student activities, their input attributes, and their corresponding learning objects are used as input for long short-term memory (LSTM), a recurrent neural network (RNN) architecture capable of learning long-term dependencies in data sequences. This algorithm maps the sequences to various learning style categories.
Additionally, this paper analyzes textual feedback to improve the learning objects further by using LDA for sentiment analysis to examine textual feedback from learners. This paper proposes a novel approach to annotating unlabeled student feedback using multi-layer topic modeling and also introduces and implements a novel algorithm for sentiment extraction and mapping. Our proposed approach combines both implicit and explicit approaches of learning style identification methods, which removes the limitations of both approaches that exist individually. The experimental results of this paper not only outperform existing models in accurately detecting learning styles but also enhance the quality of learning objects, improving the overall adaptive e-learning systems.
This paper contributes the following points:
By using minimal learner inputs and learning sequences of learners, this paper designs LSTM positional encoding to classify learners; our novel approach improves the accuracy of learning style identification compared to other traditional machine learning algorithms. This novel approach addresses the limitations of traditional questionnaire-based methods, such as learners’ time consumption while filling in forms, lack of self-awareness, and static learning style results.
This paper proposes a novel approach to annotating unlabeled student feedback using multi-layer topic modeling.
This paper also introduces and implements a novel rule-based algorithm for sentiment extraction and mapping. Incorporating LDA to analyze textual feedback from learners, this research paper offers a nuanced understanding of learners’ perspectives on the educational content and the overall e-learning experience. This sentiment analysis allows for the continuous refinement of e-learning content to better align with learner needs and preferences.
The structure of this paper is outlined as follows:
Section 2 describes the literature review of related work.
Section 3 provides prerequisites and introduces the proposed methodology of this paper.
Section 4 presents the experiments conducted and the results.
Section 5 discusses and compares with other models.
Section 6 concludes the paper and discusses the limitations and future work.
2. Related Works
In academic research, a range of classification methods have been applied to automatically determine learning styles and sentiment across different models. Researchers have utilized these techniques to better understand and cater to individual learning preferences, enhancing the personalization of educational content.
According to Graf [
9], a data-driven approach utilizing artificial intelligence algorithms has been developed to automatically detect learning styles from learner interactions within a system. This method uses real behavioral data as input, with the algorithm outputting the learner’s style preferences, thereby enhancing accuracy. To ensure meaningful data for classification, web mining techniques are employed to extract detailed behavioral information, as detailed by Mahmood [
10], making the system both effective and efficient in adapting to individual learning needs.
In [
11], a novel method was introduced to identify each learner’s style using the FSLSM by extracting behaviors from Moodle logs. Decision trees were utilized for dynamic classification based on these styles, with the method’s accuracy evaluated by comparing behaviors to quiz results provided at the end of a course. This approach, however, was tested with a limited sample of 35 learners in a single Moodle-based online course.
In [
12], the authors integrated fuzzy logic with neural networks to train an algorithm capable of recognizing various learning styles. However, the algorithm’s effectiveness was limited to classifying just three dimensions of the FSLSM model: perception, input, and understanding.
In [
13], the authors employed Bayesian networks to analyze learner data from logs of chats, forums, and processing activities, detecting only three Felder–Silverman learning styles: perception, processing, and understanding. Their study illustrates the use of predictive modeling to discern specific educational traits based on interactive online behaviors.
Fuzzy logic has been utilized to automatically determine learners’ styles, as demonstrated by Troussas [
14]. Expanding on this, Crockett [
15] developed a fuzzy classification tree within a predictive model that employs independent variables captured through natural language dialogue, enhancing the precision of style assessments.
In [
16], the authors applied the Fuzzy C-Means (FCM) algorithm to categorize learning behavioral data into FSLSM categories. This clustering approach enabled a structured analysis of behavioral patterns, aligning them with defined learning styles to enhance personalized education strategies.
In [
17], a model named adaptive e-learning recommender model using learning style and knowledge-level modeling (AERM-KLLS) was developed to enhance student engagement and performance through personalized materials using questionnaires and adaptive feedback, focusing on personalized learning experiences. Another study [
18] designed an adaptive learning system based on artificial intelligence model (ALSAI model)for personalized learning environments utilizing artificial intelligence, modeling, adaptive learning, machine learning, natural language processing, and deep learning, aimed at enhancing online teaching.
Additionally, a framework was proposed in [
19] for the automatic recognition of learning styles using machine learning, FSLSM, decision tree–hidden Markov model (decision tree MM) and Bayesian model, specifically targeting the automatic identification of learning styles. Another contribution [
20] included the development of an auto-detection model for learning styles in learning management systems (LMSs), based on a literature review and machine learning algorithms.
A systematic review of machine learning techniques for identifying learning styles was conducted in [
21], highlighting the use of neural networks, deep learning, FSLSM, and visual aural read/write and kinesthetic (VARK), primarily focused on e-learning enhancement. Furthermore, a convolutional neural network learning feature descriptor (CNN-LFD) model for predicting learning styles was developed in [
22], using convolutional neural networks (CNNs), Levy flight distribution, and machine learning, aimed at e-learning environments.
There was also a survey on the automatic prediction of learning styles through a literature review, FSLSM, classification, clustering, and hybrid methods, emphasizing the prediction of learning styles [
23]. Improvement in the identification of learning styles was achieved using deep multi-target prediction and artificial neural networks in adaptive e-learning systems [
24]. Lastly, the automatic modeling of learning styles and affective states in web-based learning management systems was demonstrated in [
25] to be more appropriate than traditional questionnaires for detecting learning styles and affective states.
The literature indicates that learners’ learning styles can be automatically identified using models such as the FSLSM, which is prominently featured in these studies. Despite this, most of these investigations rely on behavioral data from just one course, limiting the robustness of their classifications. There is a noted deficiency in validating these classification processes across multiple courses, which would provide a more accurate and reliable identification of learning styles according to the FSLSM.
5. Discussion and Comparison
In this section, the proposed models are compared with other existing models in terms of overall accuracy of learning style identification and sentiment classification. To comprehensively assess the efficacy of the proposed model, firstly it is compared with two established methodologies: convolutional neural network (CNN) and genetic algorithm. The results, visualized in
Figure 14 using bar plots, highlight the significant advantages of the proposed model over the alternatives.
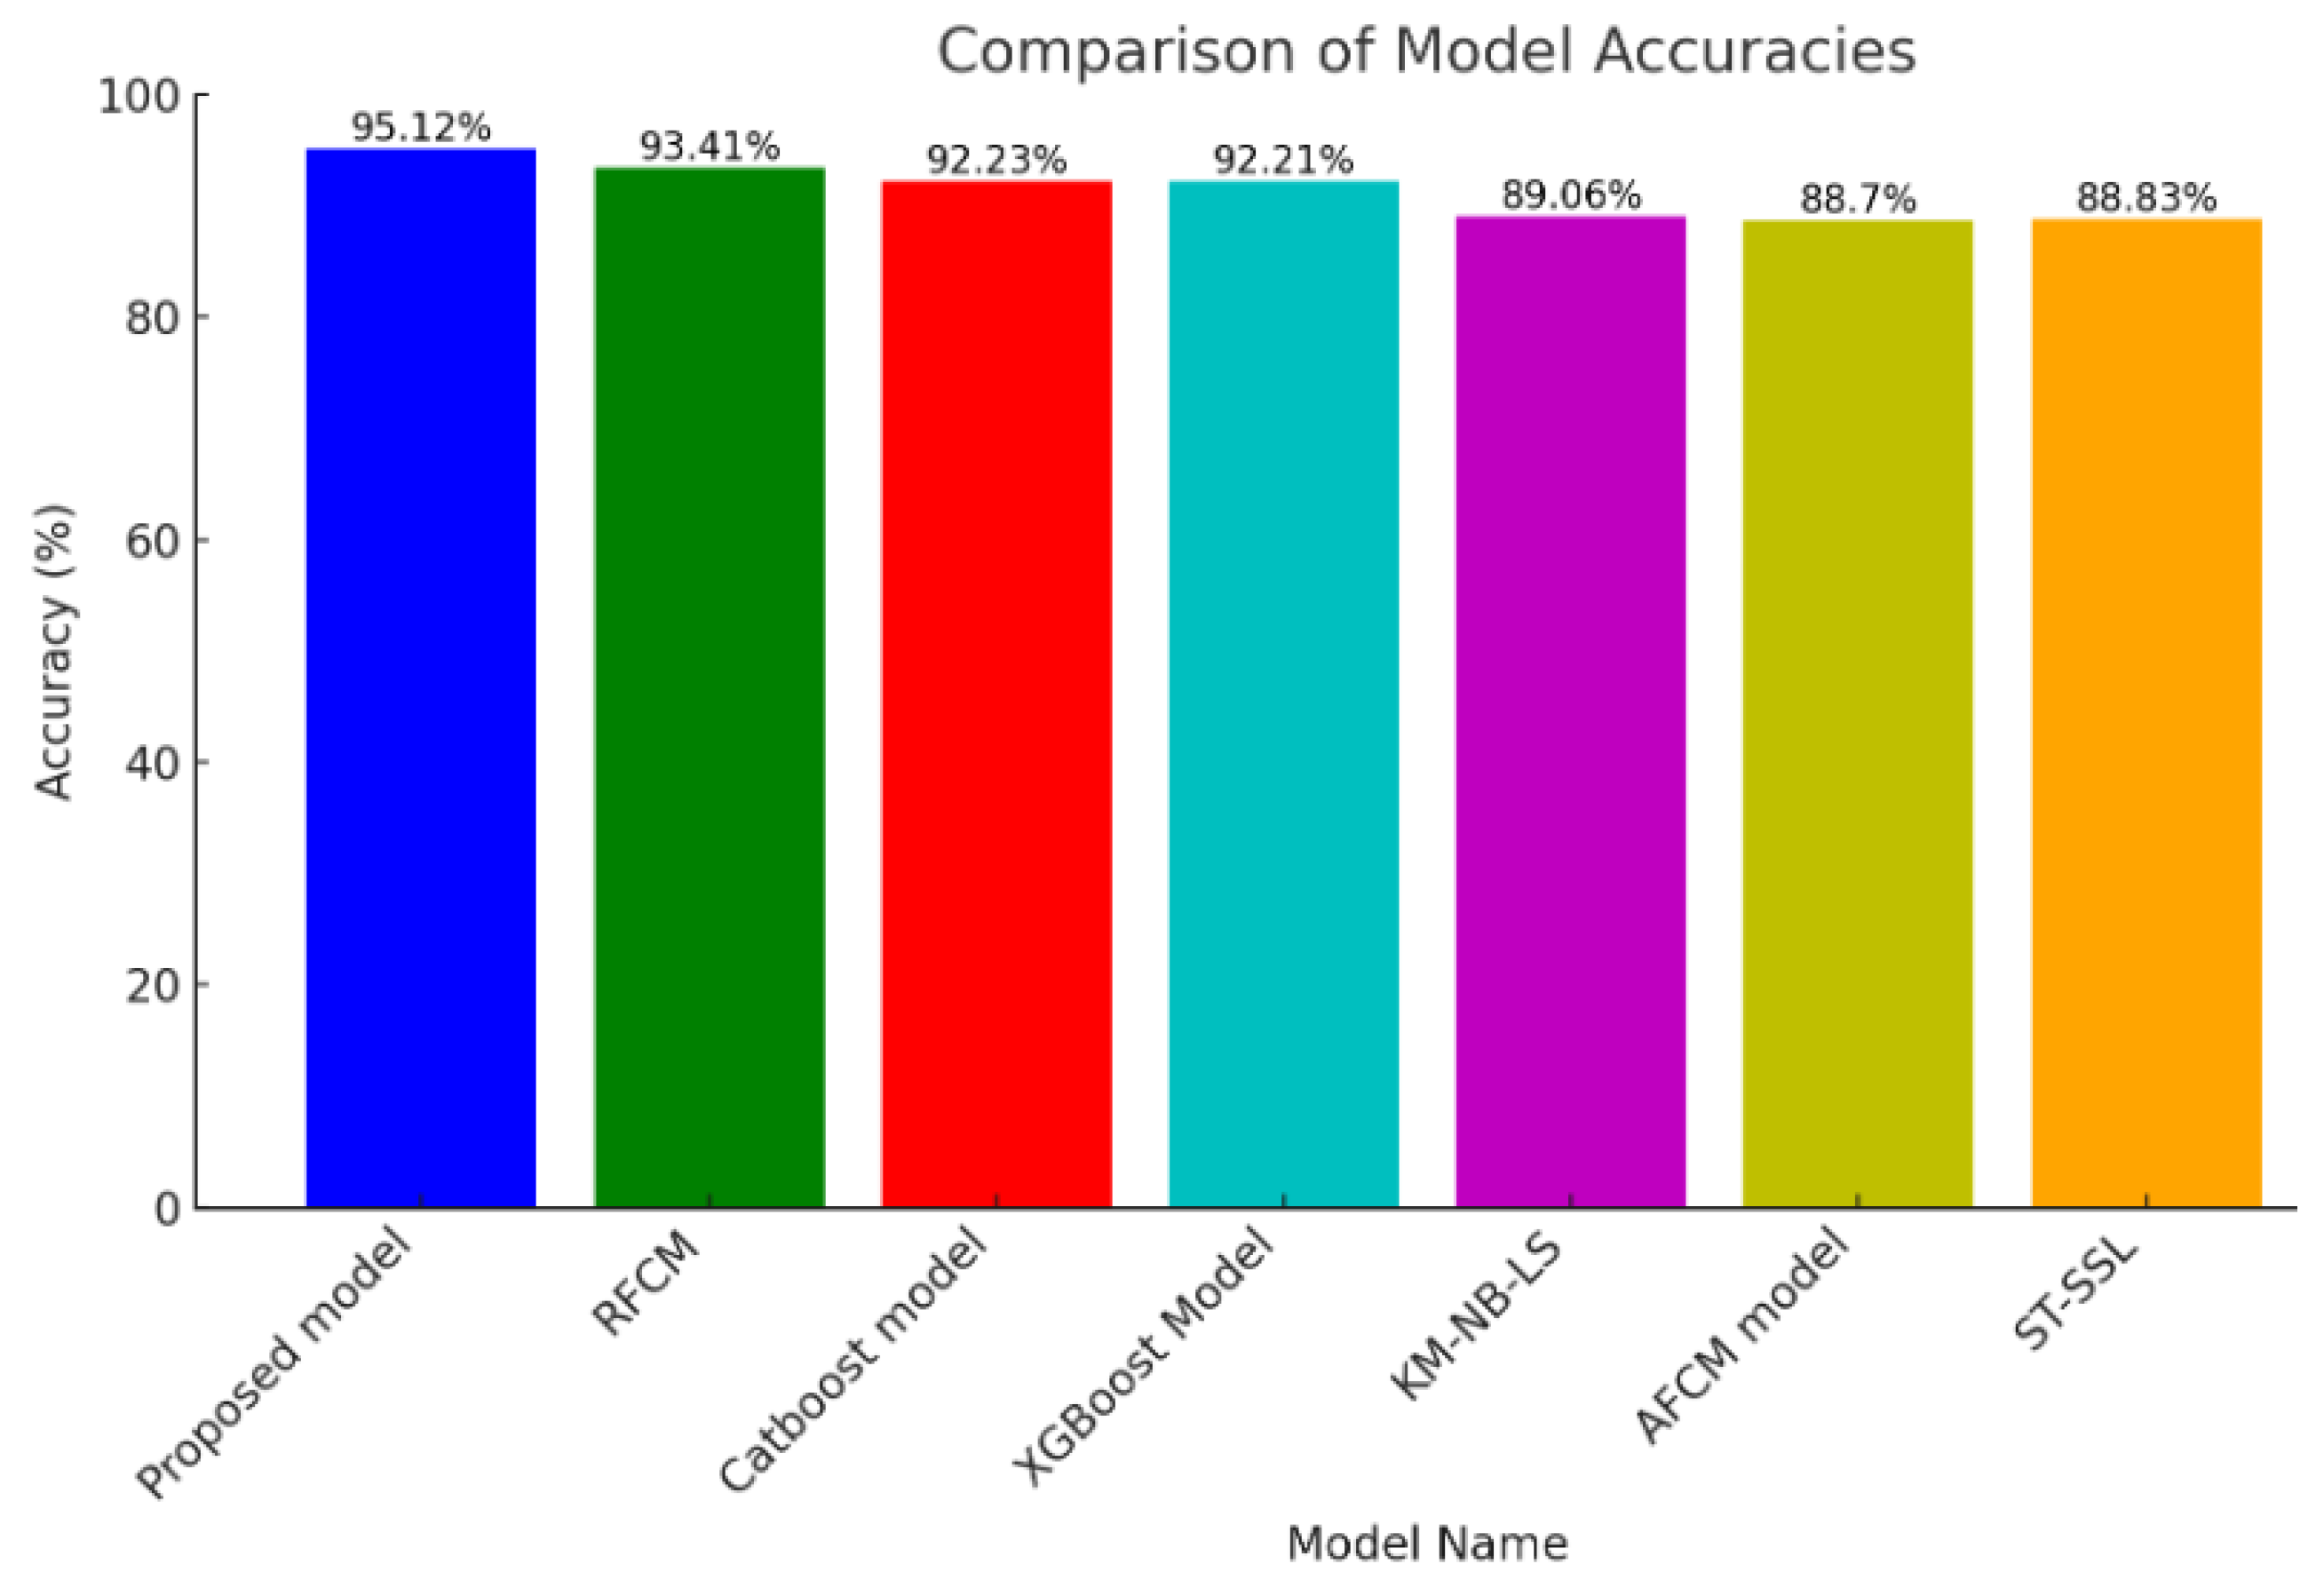
Secondly, the proposed approach’s accuracy is compared to other existing studies’ accuracy outcomes.
Figure 15 demonstrates that the proposed model achieves a 95.12% accuracy in identifying learning styles and it leads the pack by a significant margin, indicating a nuanced understanding of individual learner preferences. The other models, like the “Robust Fuzzy C-Means algorithm (RFCM)” [
77], “Category Boosting (Catboost)”, and “Extreme Gradient Boosting (XGBoost) [
78]”, show commendable accuracies, all above 92%, but they are not quite as precise as the proposed model. Models with lower accuracies, like the “K-modes Naive Bayes Learning Styles (KM-NB-LS)” [
79], “Adaptive Fuzzy C-Mean model (AFCM)” [
80], and “Self-Taught Semi-Supervised Learning (ST-SSL)” [
81], hover around 88–89%, which might suggest a less sensitive approach to the subtleties of learning styles.
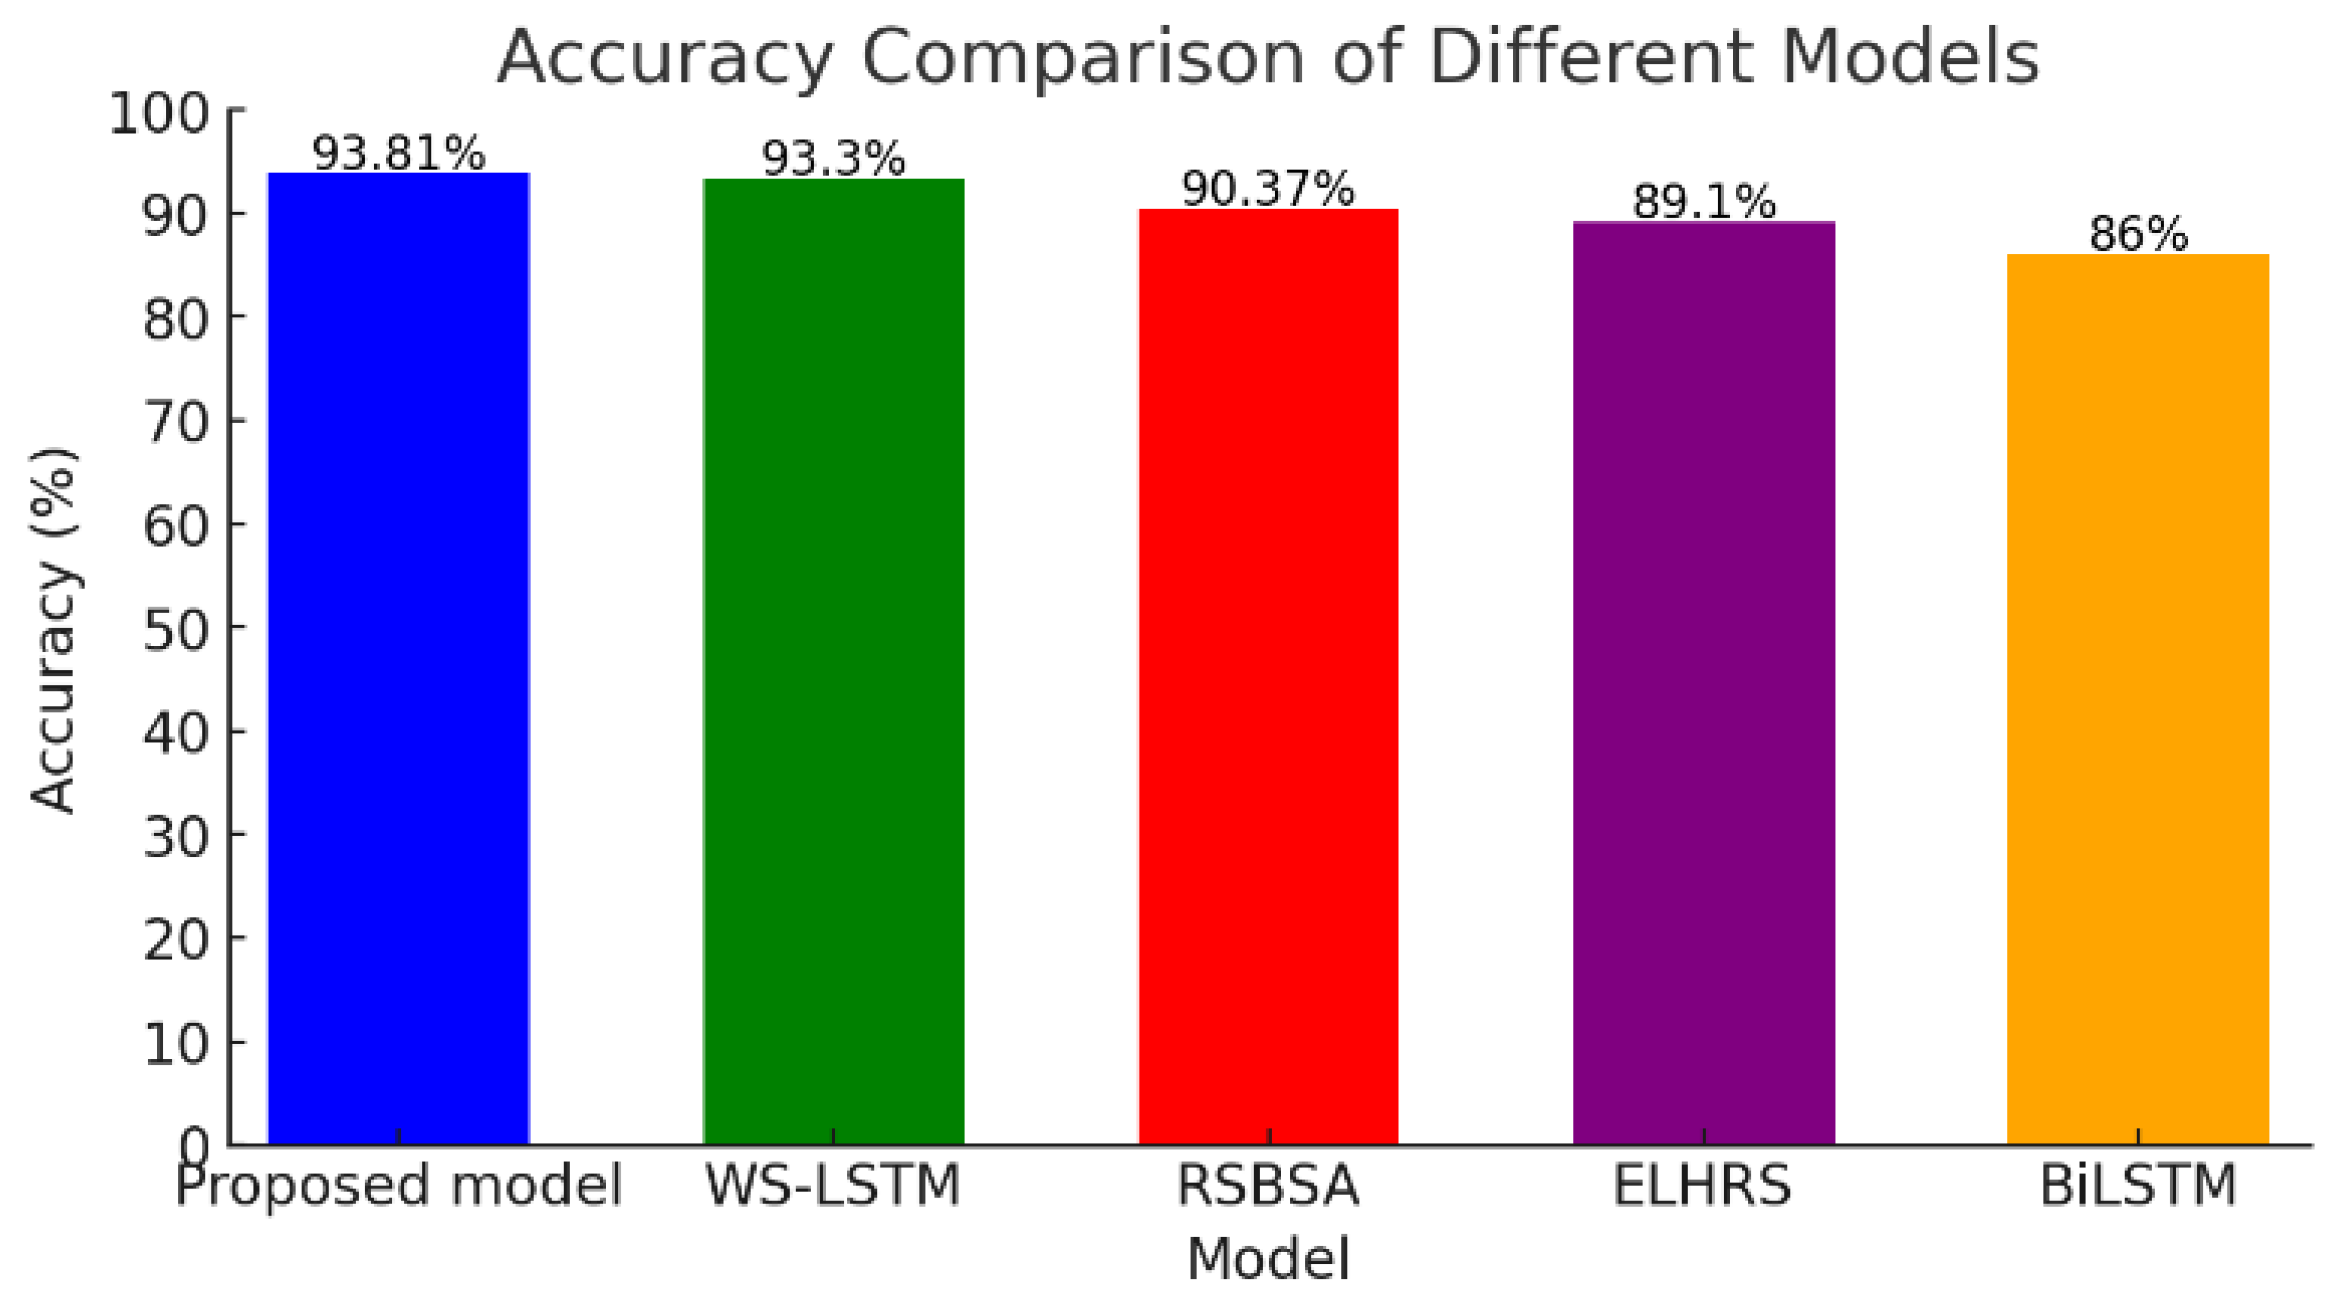
In the bar chart for sentiment analysis of learner feedback shown in
Figure 16, the proposed model’s top performance is consistent, registering an accuracy of 93.81%. This suggests that the model is not only good at identifying patterns in data for categorization but is also adept at interpreting the nuances of language—a key feature for analyzing feedback. The “Weakly Supervised Long Short-Term Memory (WS-LSTM)” [
82], which is only slightly less accurate, also demonstrates strong sentiment analysis capabilities. However, as we move down the list to models like the “Recommendation System Based on Sentiment Analysis (RSBSA)” [
83], “Enhanced e-Learning Hybrid Recommender System (ELHRS)” [
84], and “Bidirectional Long Short-Term Memory (BiLSTM)” [
85], the drop in accuracy becomes more pronounced, indicating potential challenges in fully capturing learner sentiments, especially when dealing with subtle or complex expressions.
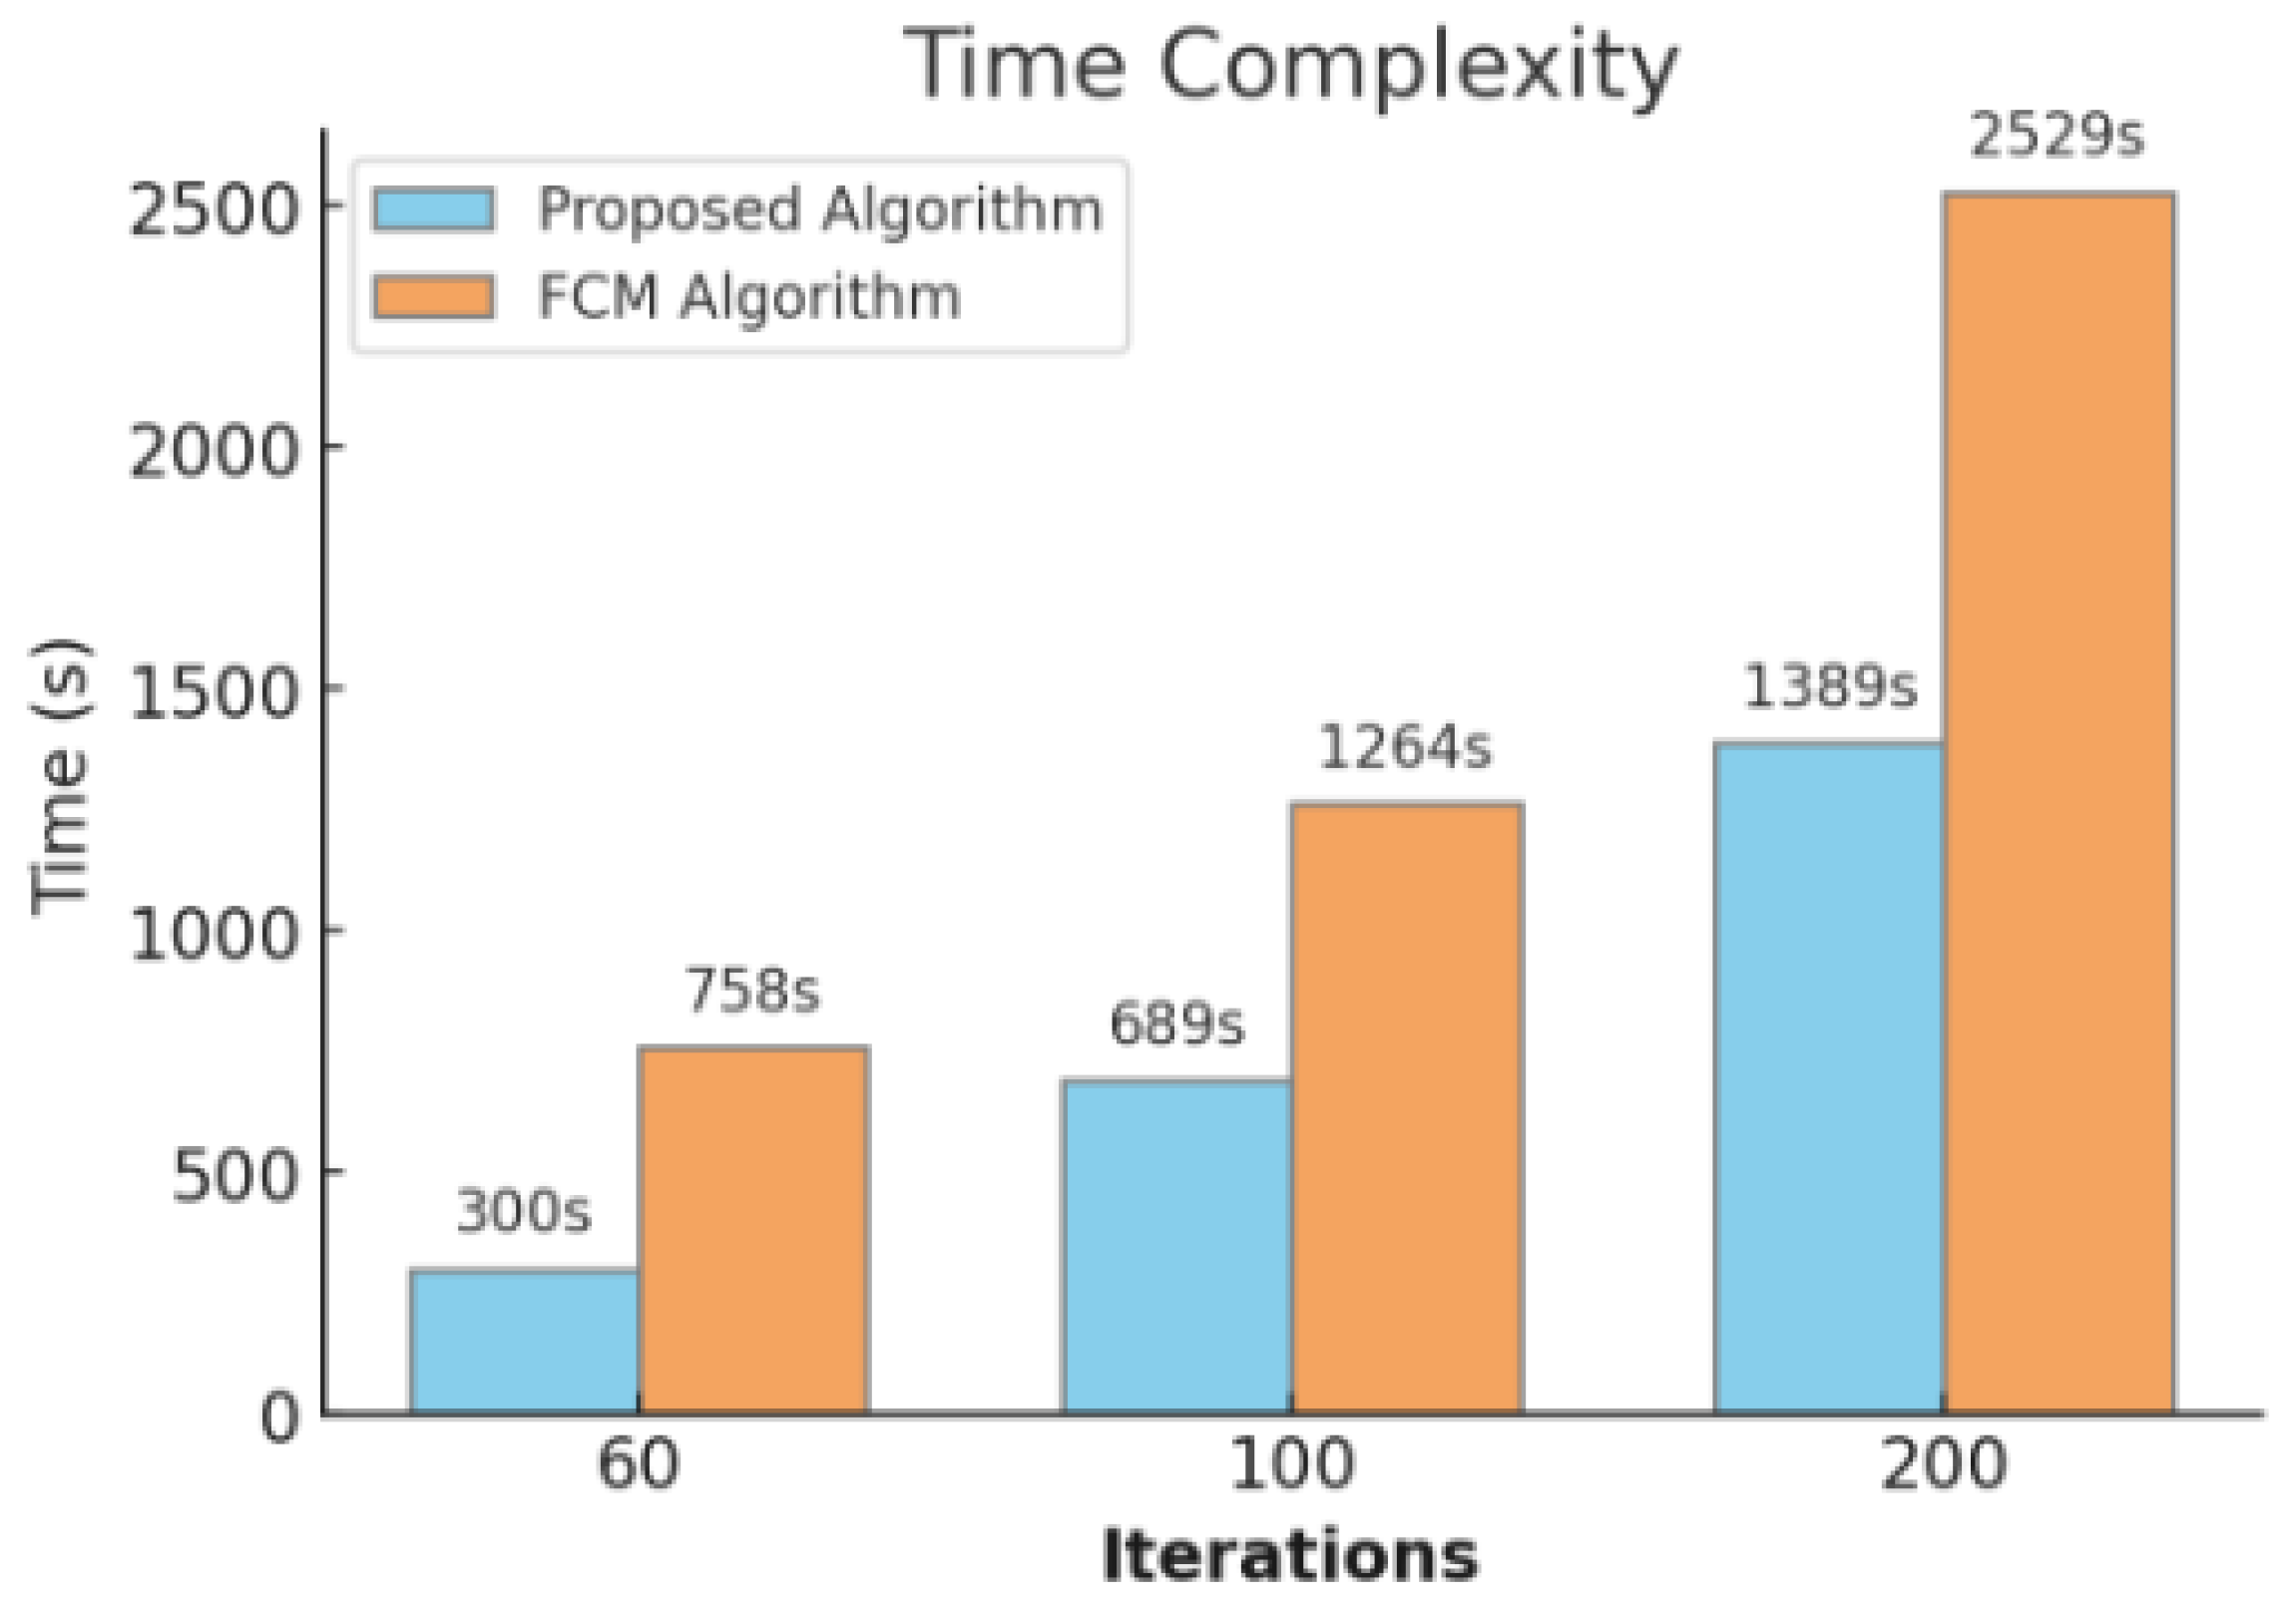
The time complexity graph shown in
Figure 17 compares the proposed algorithm against the FCM (Fuzzy C-Means) algorithm over different iteration counts. Although the proposed algorithm takes longer to execute than the FCM algorithm, the time increase is not as pronounced as the iteration count grows. For instance, at 200 iterations, the proposed algorithm takes 1389 s compared to 2529 s for the FCM algorithm, demonstrating better scalability. This demonstrates that the proposed algorithm is more efficient at handling large-scale data, a desirable trait for e-learning systems that need to process information from many users simultaneously.
The time complexity graph shown in
Figure 17 compares the proposed algorithm against the FCM (Fuzzy C-Means) algorithm over different iteration counts.
Although the proposed algorithm takes longer to execute than the FCM algorithm, the time increase is not as pronounced as the iteration count grows. For instance, at 200 iterations, the proposed algorithm takes 1389 s compared to 2529 s for the FCM algorithm, demonstrating better scalability. This demonstrates that the proposed algorithm is more efficient at handling large-scale data, a desirable trait for e-learning systems that need to process information from many users simultaneously.
6. Conclusions and Future Work
This paper proposed a hybrid deep-learning approach to improve e-learning systems. This involves two key components: automatic learning style identification and sentiment analysis. The first experiment was carried out to demonstrate the reliability of the proposed approach in determining the learning style. This approach selected an English course and 126 students to gather the data to find the learning style according to FSLSM dimensions and the response data from students were categorized into eight FSLSM categories: verbal sequential, visual, active, reflective, sensing, intuitive, and global. After 210 iterations, the final clusters were obtained. Initially when student logged into to an LMS such as Sup’Management Group, a free and open-source platform created to assist students and educators in advancing their learning experiences, they filled in four questions aligned with the dimensions of the FSLSM and the entirety of the 44-question Index of Learning Styles (ILS) based on FSLSM, as well as basic information such as age and gender. We administered a preliminary test as part of a tailored proposed approach to evaluate the students’ prior academic achievements. Implementing fuzzy weights logic to analyze the test scores helped in accurately determining each student’s level of knowledge. Secondly, from the e-learning platform, we collected 1235 sequences that reflect the behaviors of learners, with each student contributing between 1 and 35 sequences. This dataset includes the demographic information of students and their prior academic scores, and their responses to four key questions aligned with the FSLSM dimensions and 1235 learning sequences. These elements serve as inputs for our designed Transformer architecture in combination with GloVe (Global Vectors for Word Representation) word embeddings. The amalgamation of these cutting-edge technologies allowed us to navigate the complexities of student learning styles with precision and efficiency. The experiments demonstrate how the proposed model accurately categorizes students into various learning styles based on (FSLSM) and it is validated through a series of tests for accuracy, precision, recall, and F1 score. The proposed novel approach achieved a learning style prediction accuracy of 95.54%, precision of 95.54%, recall of 95.55%, and F1 score of 95.54%. The sentiment analysis further explores student feedback using LDA for topic modeling. This approach effectively uncovers key aspects and sentiments within the feedback, providing a nuanced understanding of student opinions on different facets of the e-learning system. The performance of the sentiment analysis was evaluated using a two-layer convolutional neural network (CNN), which achieved a peak accuracy of 93.81%. In conclusion, the proposed hybrid deep learning method revolutionizes e-learning by precisely tailoring content to individual learning styles, enhancing student engagement and success. By analyzing sentiments, it also offers valuable insights into student feedback, enabling continuous improvement. This approach significantly boosts the effectiveness and accessibility of online education, directly impacting students’ learning outcomes. In practice, it empowers educators to deliver more personalized, responsive, and impactful e-learning experiences.
In the future, we aim to apply the proposed learning style identification across various domains and among diverse age groups, including tertiary education students. Additionally, we plan to develop an integrated LS model, combining the FSLSM model with other cognitive frameworks. This will allow for a more comprehensive understanding of factors influencing e-learning. The identification of these hybrid learning styles will be automated through the use of advanced intelligent techniques. The proposed aspect sentiment analysis approach deals only with English language comments. However, in Pakistan, most students use Roman Urdu in their feedback, so there is a significant opportunity to enhance the system’s inclusivity and effectiveness. By incorporating the ability to process Roman Urdu, future iterations of the proposed approach could delve deeper into understanding the nuances of student feedback. Furthermore, students often employ a range of symbols and emoticons to express their opinions in online feedback systems. Therefore, a critical area of future research will involve examining how these visual elements correlate with the sentiments being expressed. By systematically analyzing the weight and sentiment of each attribute, future research aims to refine sentiment analysis techniques, thereby achieving greater precision in classifying sentiments.
Author Contributions
Conceptualization, T.H., L.Y., M.A., and A.A.; methodology, T.H., L.Y., M.A. and A.A.; software, T.H., L.Y. and M.A.; validation, L.Y., M.A. and M.A.W.; formal analysis, L.Y., M.A. and M.A.W.; investigation, M.A. and M.A.W.; resources, L.Y. and M.A.W.; writing—original draft, T.H.; writing—review and editing, L.Y., M.A., A.A. and M.A.W.; supervision, L.Y.; funding acquisition, M.A. and M.A.W. All authors have read and agreed to the published version of the manuscript.
Funding
The authors would like to thank Prince Sultan University for paying the APC of this article.
Institutional Review Board Statement
Not applicable.
Informed Consent Statement
Not applicable.
Data Availability Statement
The data presented in this study are available on request from the corresponding author.
Acknowledgments
This work was supported by EIAS Data Science Lab, College of Computer and Information Sciences, Prince Sultan University. The authors would like to thanks Prince Sultan University for their support.
Conflicts of Interest
The authors declare no conflicts of interest.
References
- Imran, M.; Almusharraf, N.; Abdellatif, M.S.; Ghaffar, A. Teachers’ perspectives on effective English language teaching practices at the elementary level: A phenomenological study. Heliyon 2024, 10, e29175. [Google Scholar] [CrossRef] [PubMed]
- Farooq, U.; Naseem, S.; Mahmood, T.; Li, J.; Rehman, A.; Saba, T.; Mustafa, L. Transforming educational insights: Strategic integration of federated learning for enhanced prediction of student learning outcomes. J. Supercomput. 2024, 1–34. [Google Scholar] [CrossRef]
- Sivarajah, R.T.; Curci, N.E.; Johnson, E.M.; Lam, D.L.; Lee, J.T.; Richardson, M.L. A review of innovative teaching methods. Acad. Radiol. 2019, 26, 101–113. [Google Scholar] [CrossRef] [PubMed]
- Karagiannis, I.; Satratzemi, M. An adaptive mechanism for Moodle based on automatic detection of learning styles. Educ. Inf. Technol. 2018, 23, 1331–1357. [Google Scholar] [CrossRef]
- Granić, A. Educational technology adoption: A systematic review. Educ. Inf. Technol. 2022, 27, 9725–9744. [Google Scholar] [CrossRef] [PubMed]
- Shoeibi, A.; Khodatars, M.; Jafari, M.; Ghassemi, N.; Sadeghi, D.; Moridian, P.; Khadem, A.; Alizadehsani, R.; Hussain, S.; Zare, A.; et al. Automated detection and forecasting of COVID-19 using deep learning techniques: A review. Neurocomputing 2024, 577, 127317. [Google Scholar] [CrossRef]
- Zhang, H.; Huang, T.; Liu, S.; Yin, H.; Li, J.; Yang, H.; Xia, Y. A learning style classification approach based on deep belief network for large-scale online education. J. Cloud Comput. 2020, 9, 1–17. [Google Scholar] [CrossRef]
- Muhammad, B.A.; Qi, C.; Wu, Z.; Ahmad, H.K. An evolving learning style detection approach for online education using bipartite graph embedding. Appl. Soft Comput. 2024, 152, 111230. [Google Scholar] [CrossRef]
- Graf, S. Adaptivity in Learning Management Systems Focussing on Learning Styles. Ph.D. Thesis, Technische Universität Wien, Vienna, Austria, 2007. Available online: http://hdl.handle.net/20.500.12708/10843 (accessed on 27 March 2024).
- Jalal, A.; Mahmood, M. Students’ behavior mining in e-learning environment using cognitive processes with information technologies. Educ. Inf. Technol. 2019, 24, 2797–2821. [Google Scholar] [CrossRef]
- Abdullah, M.A. Learning style classification based on student’s behavior in moodle learning management system. Trans. Mach. Learn. Artif. Intell. 2015, 3, 28. [Google Scholar]
- Zatarain-Cabada, R.; Barrón-Estrada, M.L.; Angulo, V.P.; García, A.J.; García, C.A.R. A learning social network with recognition of learning styles using neural networks. In Proceedings of the Advances in Pattern Recognition: Second Mexican Conference on Pattern Recognition, MCPR 2010, Puebla, Mexico, 27–29 September 2010; Springer: Berlin/Heidelberg, Germany, 2010; pp. 199–209. [Google Scholar] [CrossRef]
- García, P.; Amandi, A.; Schiaffino, S.; Campo, M. Evaluating Bayesian networks’ precision for detecting students’ learning styles. Comput. Educ. 2007, 49, 794–808. [Google Scholar] [CrossRef]
- Troussas, C.; Chrysafiadi, K.; Virvou, M. An intelligent adaptive fuzzy-based inference system for computer-assisted language learning. Expert Syst. Appl. 2019, 127, 85–96. [Google Scholar] [CrossRef]
- Crockett, K.; Latham, A.; Mclean, D.; O’Shea, J. A fuzzy model for predicting learning styles using behavioral cues in an conversational intelligent tutoring system. In Proceedings of the 2013 IEEE International Conference on Fuzzy Systems (FUZZ-IEEE), Hyderabad, India, 7–10 July 2013; IEEE: New York, NY, USA, 2013; pp. 1–8. [Google Scholar] [CrossRef]
- Kolekar, S.V.; Pai, R.M.; MM, M.P. Prediction of Learner’s Profile Based on Learning Styles in Adaptive E-learning System. Int. J. Emerg. Technol. Learn. 2017, 12, 31–51. [Google Scholar] [CrossRef]
- Aziz, A.S.; El-Khoribi, R.A.; Taie, S.A. Adaptive E-learning recommendation model based on the knowledge level and learning style. J. Theor. Appl. Inf. Technol. 2021, 99, 5241–5256. [Google Scholar]
- Kaouni, M.; Lakrami, F.; Labouidya, O. The design of an adaptive E-learning model based on Artificial Intelligence for enhancing online teaching. Int. J. Emerg. Technol. Learn. 2023, 18, 202. [Google Scholar] [CrossRef]
- Madhavi, A.; Nagesh, A.; Govardhan, A. A framework for automatic detection of learning styles in e-learning. AIP Conf. Proc. 2024, 2802, 120012. [Google Scholar] [CrossRef]
- Rashid, A.B.; Ikram, R.R.R.; Thamilarasan, Y.; Salahuddin, L.; Abd Yusof, N.F.; Rashid, Z.B. A Student Learning Style Auto-Detection Model in a Learning Management System. Eng. Technol. Appl. Sci. Res. 2023, 13, 11000–11005. [Google Scholar] [CrossRef]
- Essa, S.G.; Celik, T.; Human-Hendricks, N. Personalised adaptive learning technologies based on machine learning techniques to identify learning styles: A systematic literature review. IEEE Access 2023, 11, 48392–48409. [Google Scholar] [CrossRef]
- Alshmrany, S. Adaptive learning style prediction in e-learning environment using levy flight distribution based CNN model. Clust. Comput. 2022, 25, 523–536. [Google Scholar] [CrossRef]
- Raleiras, M.; Nabizadeh, A.H.; Costa, F.A. Automatic learning styles prediction: A survey of the State-of-the-Art (2006–2021). J. Comput. Educ. 2022, 9, 587–679. [Google Scholar] [CrossRef]
- Gomede, E.; Miranda de Barros, R.; de Souza Mendes, L. Use of deep multi-target prediction to identify learning styles. Appl. Sci. 2020, 10, 1756. [Google Scholar] [CrossRef]
- Khan, F.A.; Akbar, A.; Altaf, M.; Tanoli, S.A.K.; Ahmad, A. Automatic student modelling for detection of learning styles and affective states in web based learning management systems. IEEE Access 2019, 7, 128242–128262. [Google Scholar] [CrossRef]
- Pashler, H.; McDaniel, M.; Rohrer, D.; Bjork, R. Learning styles: Concepts and evidence. Psychol. Sci. Public Interest 2008, 9, 105–119. [Google Scholar] [CrossRef] [PubMed]
- Hauptman, H.; Cohen, A. The synergetic effect of learning styles on the interaction between virtual environments and the enhancement of spatial thinking. Comput. Educ. 2011, 57, 2106–2117. [Google Scholar] [CrossRef]
- Jegatha Deborah, L.; Baskaran, R.; Kannan, A. Learning styles assessment and theoretical origin in an E-learning scenario: A survey. Artif. Intell. Rev. 2014, 42, 801–819. [Google Scholar] [CrossRef]
- Choudhary, L.; Swami, S. Exploring the Landscape of Web Data Mining: An In-depth Research Analysis. Curr. J. Appl. Sci. Technol. 2023, 42, 32–42. [Google Scholar] [CrossRef]
- Roy, R.; Giduturi, A. Survey on pre-processing web log files in web usage mining. Int. J. Adv. Sci. Technol. 2019, 29, 682–691. [Google Scholar]
- Fawzia Omer, A.; Mohammed, H.A.; Awadallah, M.A.; Khan, Z.; Abrar, S.U.; Shah, M.D. Big Data Mining Using K-Means and DBSCAN Clustering Techniques. In Big Data Analytics and Computational Intelligence for Cybersecurity; Springer: Berlin/Heidelberg, Germany, 2022; pp. 231–246. [Google Scholar] [CrossRef]
- Nafea, S.M.; Siewe, F.; He, Y. On recommendation of learning objects using felder-silverman learning style model. IEEE Access 2019, 7, 163034–163048. [Google Scholar] [CrossRef]
- Deng, Y.; Lu, D.; Chung, C.J.; Huang, D.; Zeng, Z. Personalized learning in a virtual hands-on lab platform for computer science education. In Proceedings of the 2018 IEEE Frontiers in Education Conference (FIE), San Jose, CA, USA, 3–6 October 2018; IEEE: New York, NY, USA, 2018; pp. 1–8. [Google Scholar] [CrossRef]
- Hu, J.; Peng, Y.; Chen, X.; Yu, H. Differentiating the learning styles of college students in different disciplines in a college English blended learning setting. PLoS ONE 2021, 16, e0251545. [Google Scholar] [CrossRef]
- Hmedna, B.; El Mezouary, A.; Baz, O. How does learners’ prefer to process information in MOOCs? A data-driven study. Procedia Comput. Sci. 2019, 148, 371–379. [Google Scholar] [CrossRef]
- Reardon, M.; Derner, S. Strategies for Great Teaching: Maximize Learning Moments; Taylor & Francis: Abingdon, UK, 2023. [Google Scholar] [CrossRef]
- Seghroucheni, Y.Z.; Chekour, M. How Learning Styles Can Withstand the Demands of Mobile Learning Environments? Int. J. Interact. Mob. Technol. 2023, 17, 84–99. [Google Scholar] [CrossRef]
- Othmane, Z.; Derouich, A.; Talbi, A. A comparative study of the Most influential learning styles used in adaptive educational environments. Int. J. Adv. Comput. Sci. Appl. 2019, 10, 520–528. [Google Scholar]
- Sihombing, J.H.; Laksitowening, K.A.; Darwiyanto, E. Personalized e-learning content based on felder-silverman learning style model. In Proceedings of the 2020 8th International Conference on Information and Communication Technology (ICoICT), Yogyakarta, Indonesia, 24–26 June 2020; IEEE: New York, NY, USA, 2020; pp. 1–6. [Google Scholar] [CrossRef]
- Hidayat, N.; Wardoyo, R.; Sn, A.; Surjono, H.D. Enhanced performance of the automatic learning style detection model using a combination of modified K-means algorithm and Naive Bayesian. Int. J. Adv. Comput. Sci. Appl. 2020, 11, 638–648. [Google Scholar] [CrossRef]
- Staudemeyer, R.C. Applying long short-term memory recurrent neural networks to intrusion detection. S. Afr. Comput. J. 2015, 56, 136–154. [Google Scholar] [CrossRef]
- Kumaravel, G.; Sankaranarayanan, S. PQPS: Prior-Art Query-Based Patent Summarizer Using RBM and Bi-LSTM. Mob. Inf. Syst. 2021, 2021, 1–19. [Google Scholar] [CrossRef]
- Pamir; Javaid, N.; Javaid, S.; Asif, M.; Javed, M.U.; Yahaya, A.S.; Aslam, S. Synthetic theft attacks and long short term memory-based preprocessing for electricity theft detection using gated recurrent unit. Energies 2022, 15, 2778. [Google Scholar] [CrossRef]
- Saberi, N.; Montazer, G.A. A new approach for learners’ modeling in e-learning environment using LMS logs analysis. In Proceedings of the 6th National and 3rd International Conference of E-Learning and E-Teaching, Tehran, Iran, 3–4 March 2012; IEEE: New York, NY, USA, 2012; pp. 25–33. [Google Scholar] [CrossRef]
- Graf, S.; Viola, S.R.; Leo, T.; Kinshuk. In-depth analysis of the Felder-Silverman learning style dimensions. J. Res. Technol. Educ. 2007, 40, 79–93. [Google Scholar] [CrossRef]
- Prottasha, N.J.; Sami, A.A.; Kowsher, M.; Murad, S.A.; Bairagi, A.K.; Masud, M.; Baz, M. Transfer learning for sentiment analysis using BERT based supervised fine-tuning. Sensors 2022, 22, 4157. [Google Scholar] [CrossRef] [PubMed]
- Stevens-Smith, D.A. Brain-based teaching: Differentiation in teaching, learning, and motor skills. J. Phys. Educ. Recreat. Danc. 2020, 91, 34–42. [Google Scholar] [CrossRef]
- Hall, A.H.; Gao, Q.; Guo, Y.; Xie, Y. Examining the effects of kindergarten writing instruction on emergent literacy skills: A systematic review of the literature. Early Child Dev. Care 2023, 193, 334–346. [Google Scholar] [CrossRef]
- Al-Maroof, R.S.; Alahbabi, N.M.N.; Akour, I.; Alhumaid, K.; Ayoubi, K.; Alnnaimi, M.; Thabit, S.; Alfaisal, R.; Aburayya, A.; Salloum, S. Students’ perception towards behavioral intention of audio and video teaching styles: An acceptance study. Int. J. Data Netw. Sci. 2022, 6, 603. [Google Scholar] [CrossRef]
- Hakami, Z. Comparison between virtual and traditional learning methods for orthodontic knowledge and skills in dental students: A Quasi-Experimental Study. Healthcare 2021, 9, 1092. [Google Scholar] [CrossRef] [PubMed]
- Ariastuti, M.D.; Wahyudin, A.Y. Exploring academic performance and learning style of undergraduate students in English Education program. J. Engl. Lang. Teach. Learn. 2022, 3, 67–73. [Google Scholar] [CrossRef]
- Chen, J.; Zhang, Y.; Wei, Y.; Hu, J. Discrimination of the contextual features of top performers in scientific literacy using a machine learning approach. Res. Sci. Educ. 2021, 51, 129–158. [Google Scholar] [CrossRef]
- Saadat, M.; Bayat, M. Prediction of the unconfined compressive strength of stabilised soil by Adaptive Neuro Fuzzy Inference System (ANFIS) and Non-Linear Regression (NLR). Geomech. Geoengin. 2022, 17, 80–91. [Google Scholar] [CrossRef]
- Venkatesh, V.; Zhang, A.; Deakins, E.; Luthra, S.; Mangla, S. A fuzzy AHP-TOPSIS approach to supply partner selection in continuous aid humanitarian supply chains. Ann. Oper. Res. 2019, 283, 1517–1550. [Google Scholar] [CrossRef]
- Selva Birunda, S.; Kanniga Devi, R. A review on word embedding techniques for text classification. In Innovative Data Communication Technologies and Application: Proceedings of ICIDCA 2020; Springer: Singapore, 2021; pp. 267–281. [Google Scholar] [CrossRef]
- Yang, L.; Zhou, G. Dissecting The Analects: An NLP-based exploration of semantic similarities and differences across English translations. Humanit. Soc. Sci. Commun. 2024, 11, 50. [Google Scholar] [CrossRef]
- Pan, M.; Huang, J.X.; He, T.; Mao, Z.; Ying, Z.; Tu, X. A simple kernel co-occurrence-based enhancement for pseudo-relevance feedback. J. Assoc. Inf. Sci. Technol. 2020, 71, 264–281. [Google Scholar] [CrossRef]
- Vilar, E. Word embedding, neural networks and text classification: What is the state-of-the-art? J. Manag. Sci. 2019, 4, 35–62. [Google Scholar] [CrossRef]
- Ma, K.; Tan, Y.; Tian, M.; Xie, X.; Qiu, Q.; Li, S.; Wang, X. Extraction of temporal information from social media messages using the BERT model. Earth Sci. Informatics 2022, 15, 573–584. [Google Scholar] [CrossRef]
- Le, T.H.; Chen, H.; Babar, M.A. Deep learning for source code modeling and generation: Models, applications, and challenges. Acm Comput. Surv. (CSUR) 2020, 53, 1–38. [Google Scholar] [CrossRef]
- Garg, S.; Roy, D. A Birds Eye View on Knowledge Graph Embeddings, Software Libraries, Applications and Challenges. arXiv 2022, arXiv:2205.09088. [Google Scholar] [CrossRef]
- Khaiser, F.K.; Saad, A.; Mason, C. Sentiment analysis of students’ feedback on institutional facilities using text-based classification and natural language processing (NLP). J. Lang. Commun. 2023, 10, 101–111. [Google Scholar] [CrossRef]
- Tabassum, A.; Patil, R.R. A survey on text pre-processing & feature extraction techniques in natural language processing. Int. Res. J. Eng. Technol. 2020, 7, 4864–4867. [Google Scholar]
- Dogra, V.; Verma, S.; Chatterjee, P.; Shafi, J.; Choi, J.; Ijaz, M.F. A complete process of text classification system using state-of-the-art NLP models. Comput. Intell. Neurosci. 2022, 2022, 1883698. [Google Scholar] [CrossRef] [PubMed]
- Bhattacharjee, A.; Karami, M.; Liu, H. Text transformations in contrastive self-supervised learning: A review. arXiv 2022, arXiv:2203.12000. [Google Scholar] [CrossRef]
- Egger, R.; Gokce, E. Natural Language Processing (NLP): An Introduction: Making Sense of Textual Data. In Applied Data Science in Tourism: Interdisciplinary Approaches, Methodologies, and Applications; Springer: Berlin/Heidelberg, Germany, 2022; pp. 307–334. [Google Scholar] [CrossRef]
- Altrabsheh, N.; Cocea, M.; Fallahkhair, S. Sentiment analysis: Towards a tool for analysing real-time students feedback. In Proceedings of the 2014 IEEE 26th International Conference on Tools with Artificial Intelligence, Limassol, Cyprus, 10–12 November 2014; IEEE: New York, NY, USA, 2014; pp. 419–423. [Google Scholar] [CrossRef]
- Kalaivani, E.R.; Marivendan, E.R. The effect of stop word removal and stemming in datapreprocessing. Ann. Rom. Soc. Cell Biol. 2021, 25, 739–746. [Google Scholar]
- Pramana, R.; Subroto, J.J.; Gunawan, A.A.S.; Anderies. Systematic literature review of stemming and lemmatization performance for sentence similarity. In Proceedings of the 2022 IEEE 7th International Conference on Information Technology and Digital Applications (ICITDA), Yogyakarta, Indonesia, 4–5 November 2022; IEEE: New York, NY, USA, 2022; pp. 1–6. [Google Scholar] [CrossRef]
- Zhou, F.; Ayoub, J.; Xu, Q.; Jessie Yang, X. A machine learning approach to customer needs analysis for product ecosystems. J. Mech. Des. 2020, 142, 011101. [Google Scholar] [CrossRef]
- Xuan, T.Y.; Yahya, N.; Khan, Z.; Badruddin, N.; Yusoff, M.Z. EEG Motor Classification Using Multi-band Signal and Common Spatial Filter. In Proceedings of the International Conference on Intelligent Human Computer Interaction, Daegu, Republic of Korea, 24–26 November 2020; Springer: Berlin/Heidelberg, Germany, 2020; pp. 120–131. [Google Scholar] [CrossRef]
- Shams, H.; Jan, T.; Khalil, A.A.; Ahmad, N.; Munir, A.; Khalil, R.A. Fingerprint image enhancement using multiple filters. PeerJ Comput. Sci. 2023, 9, e1183. [Google Scholar] [CrossRef]
- Kumar, A.; Malik, A.; Batra, I.; Ahmad, N.; Johar, S. Digital society social interactions and trust analysis model. PeerJ Comput. Sci. 2022, 8, e1129. [Google Scholar] [CrossRef]
- Novera, C.N.; Ahmed, Z.; Kushol, R.; Wanke, P.; Azad, M.A.K. Internet of Things (IoT) in smart tourism: A literature review. Span. J. Mark. ESIC 2022, 26, 325–344. [Google Scholar] [CrossRef]
- Khoo, C.S.; Johnkhan, S.B. Lexicon-based sentiment analysis: Comparative evaluation of six sentiment lexicons. J. Inf. Sci. 2018, 44, 491–511. [Google Scholar] [CrossRef]
- Syed, S.; Spruit, M. Exploring symmetrical and asymmetrical Dirichlet priors for latent Dirichlet allocation. Int. J. Semant. Comput. 2018, 12, 399–423. [Google Scholar] [CrossRef]
- Azzi, I.; Jeghal, A.; Radouane, A.; Yahyaouy, A.; Tairi, H. A robust classification to predict learning styles in adaptive E-learning systems. Educ. Inf. Technol. 2020, 25, 437–448. [Google Scholar] [CrossRef]
- Alruwais, N.; Zakariah, M. Student-Engagement Detection in Classroom Using Machine Learning Algorithm. Electronics 2023, 12, 731. [Google Scholar] [CrossRef]
- El Aissaoui, O.; El Madani, Y.E.A.; Oughdir, L.; El Allioui, Y. Combining supervised and unsupervised machine learning algorithms to predict the learners’ learning styles. Procedia Comput. Sci. 2019, 148, 87–96. [Google Scholar] [CrossRef]
- Aziz, A.S.; El-Khoribi, R.A.; Taie, S.A. AFCM model to predict the learner style based on questionnaire and fuzzy C mean algorithm. J. Theor. Appl. Inf. Technol. 2021, 99, 343–356. [Google Scholar]
- Ayyoub, H.Y.; Al-Kadi, O.S. Learning Style Identification Using Semi-Supervised Self-Taught Labeling. IEEE Trans. Learn. Technol. 2024, 17, 1093–1106. [Google Scholar] [CrossRef]
- Kastrati, Z.; Imran, A.S.; Kurti, A. Weakly supervised framework for aspect-based sentiment analysis on students’ reviews of MOOCs. IEEE Access 2020, 8, 106799–106810. [Google Scholar] [CrossRef]
- Alatrash, R.; Priyadarshini, R.; Ezaldeen, H.; Alhinnawi, A. Augmented language model with deep learning adaptation on sentiment analysis for E-learning recommendation. Cogn. Syst. Res. 2022, 75, 53–69. [Google Scholar] [CrossRef]
- Ezaldeen, H.; Misra, R.; Bisoy, S.K.; Alatrash, R.; Priyadarshini, R. A hybrid E-learning recommendation integrating adaptive profiling and sentiment analysis. J. Web Semant. 2022, 72, 100700. [Google Scholar] [CrossRef]
- Alzaid, M.; Fkih, F. Sentiment Analysis of Students’ Feedback on E-Learning Using a Hybrid Fuzzy Model. Appl. Sci. 2023, 13, 12956. [Google Scholar] [CrossRef]
Figure 1.
Overview of the FSLSM: its four key dimensions, and their associated values [
39].
Figure 2.
Overall proposed framework.
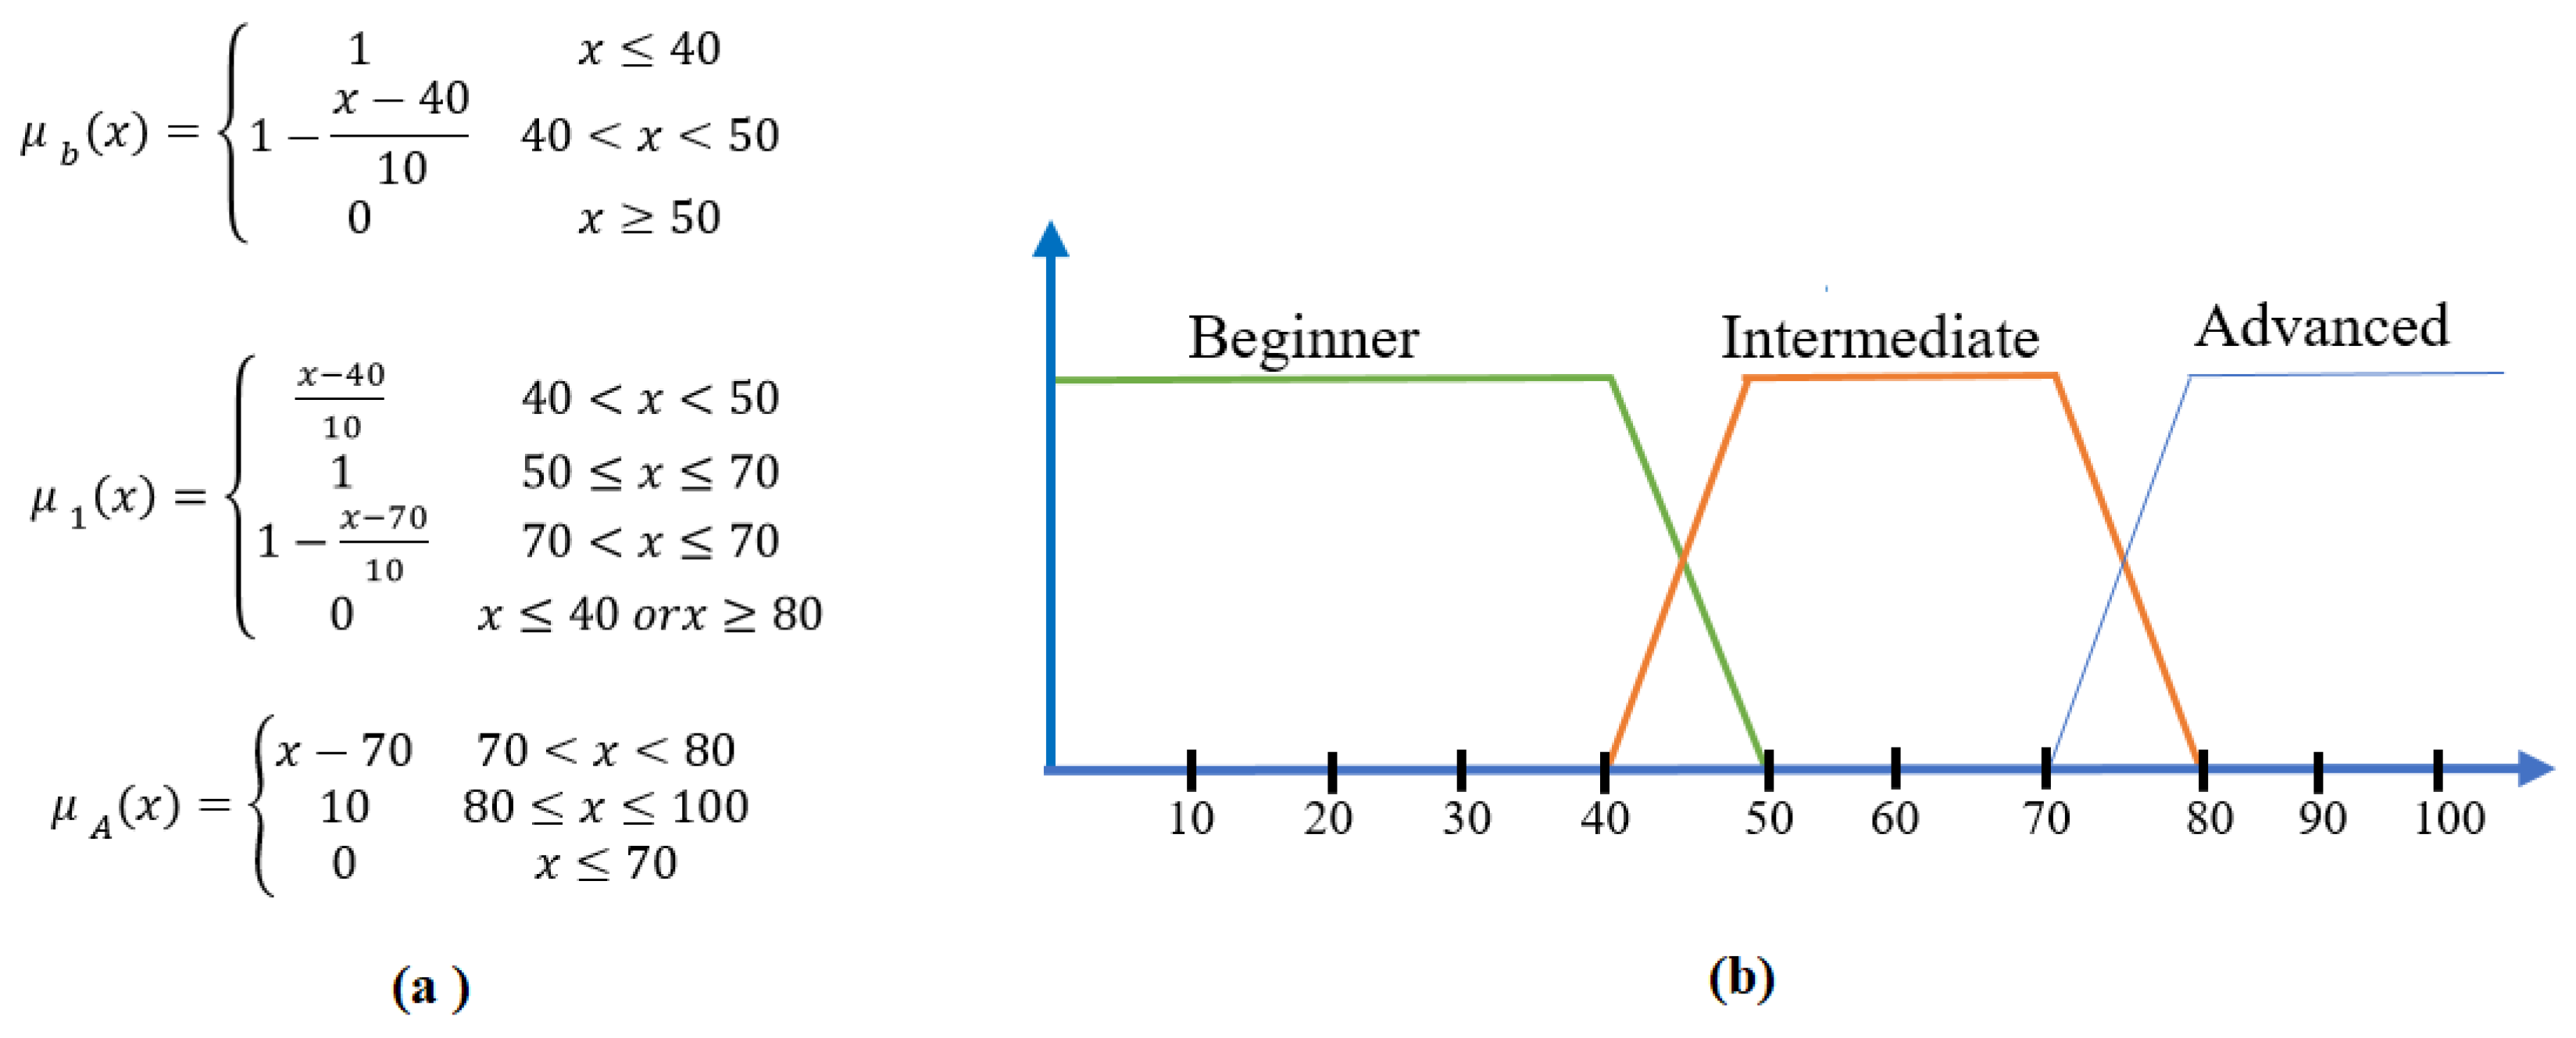
Figure 3.
Fuzzy weighting for a student’s prior academic performance. (a) Mathematical Definitions for Membership Functions (b) Graphical Representation of Membership Functions.
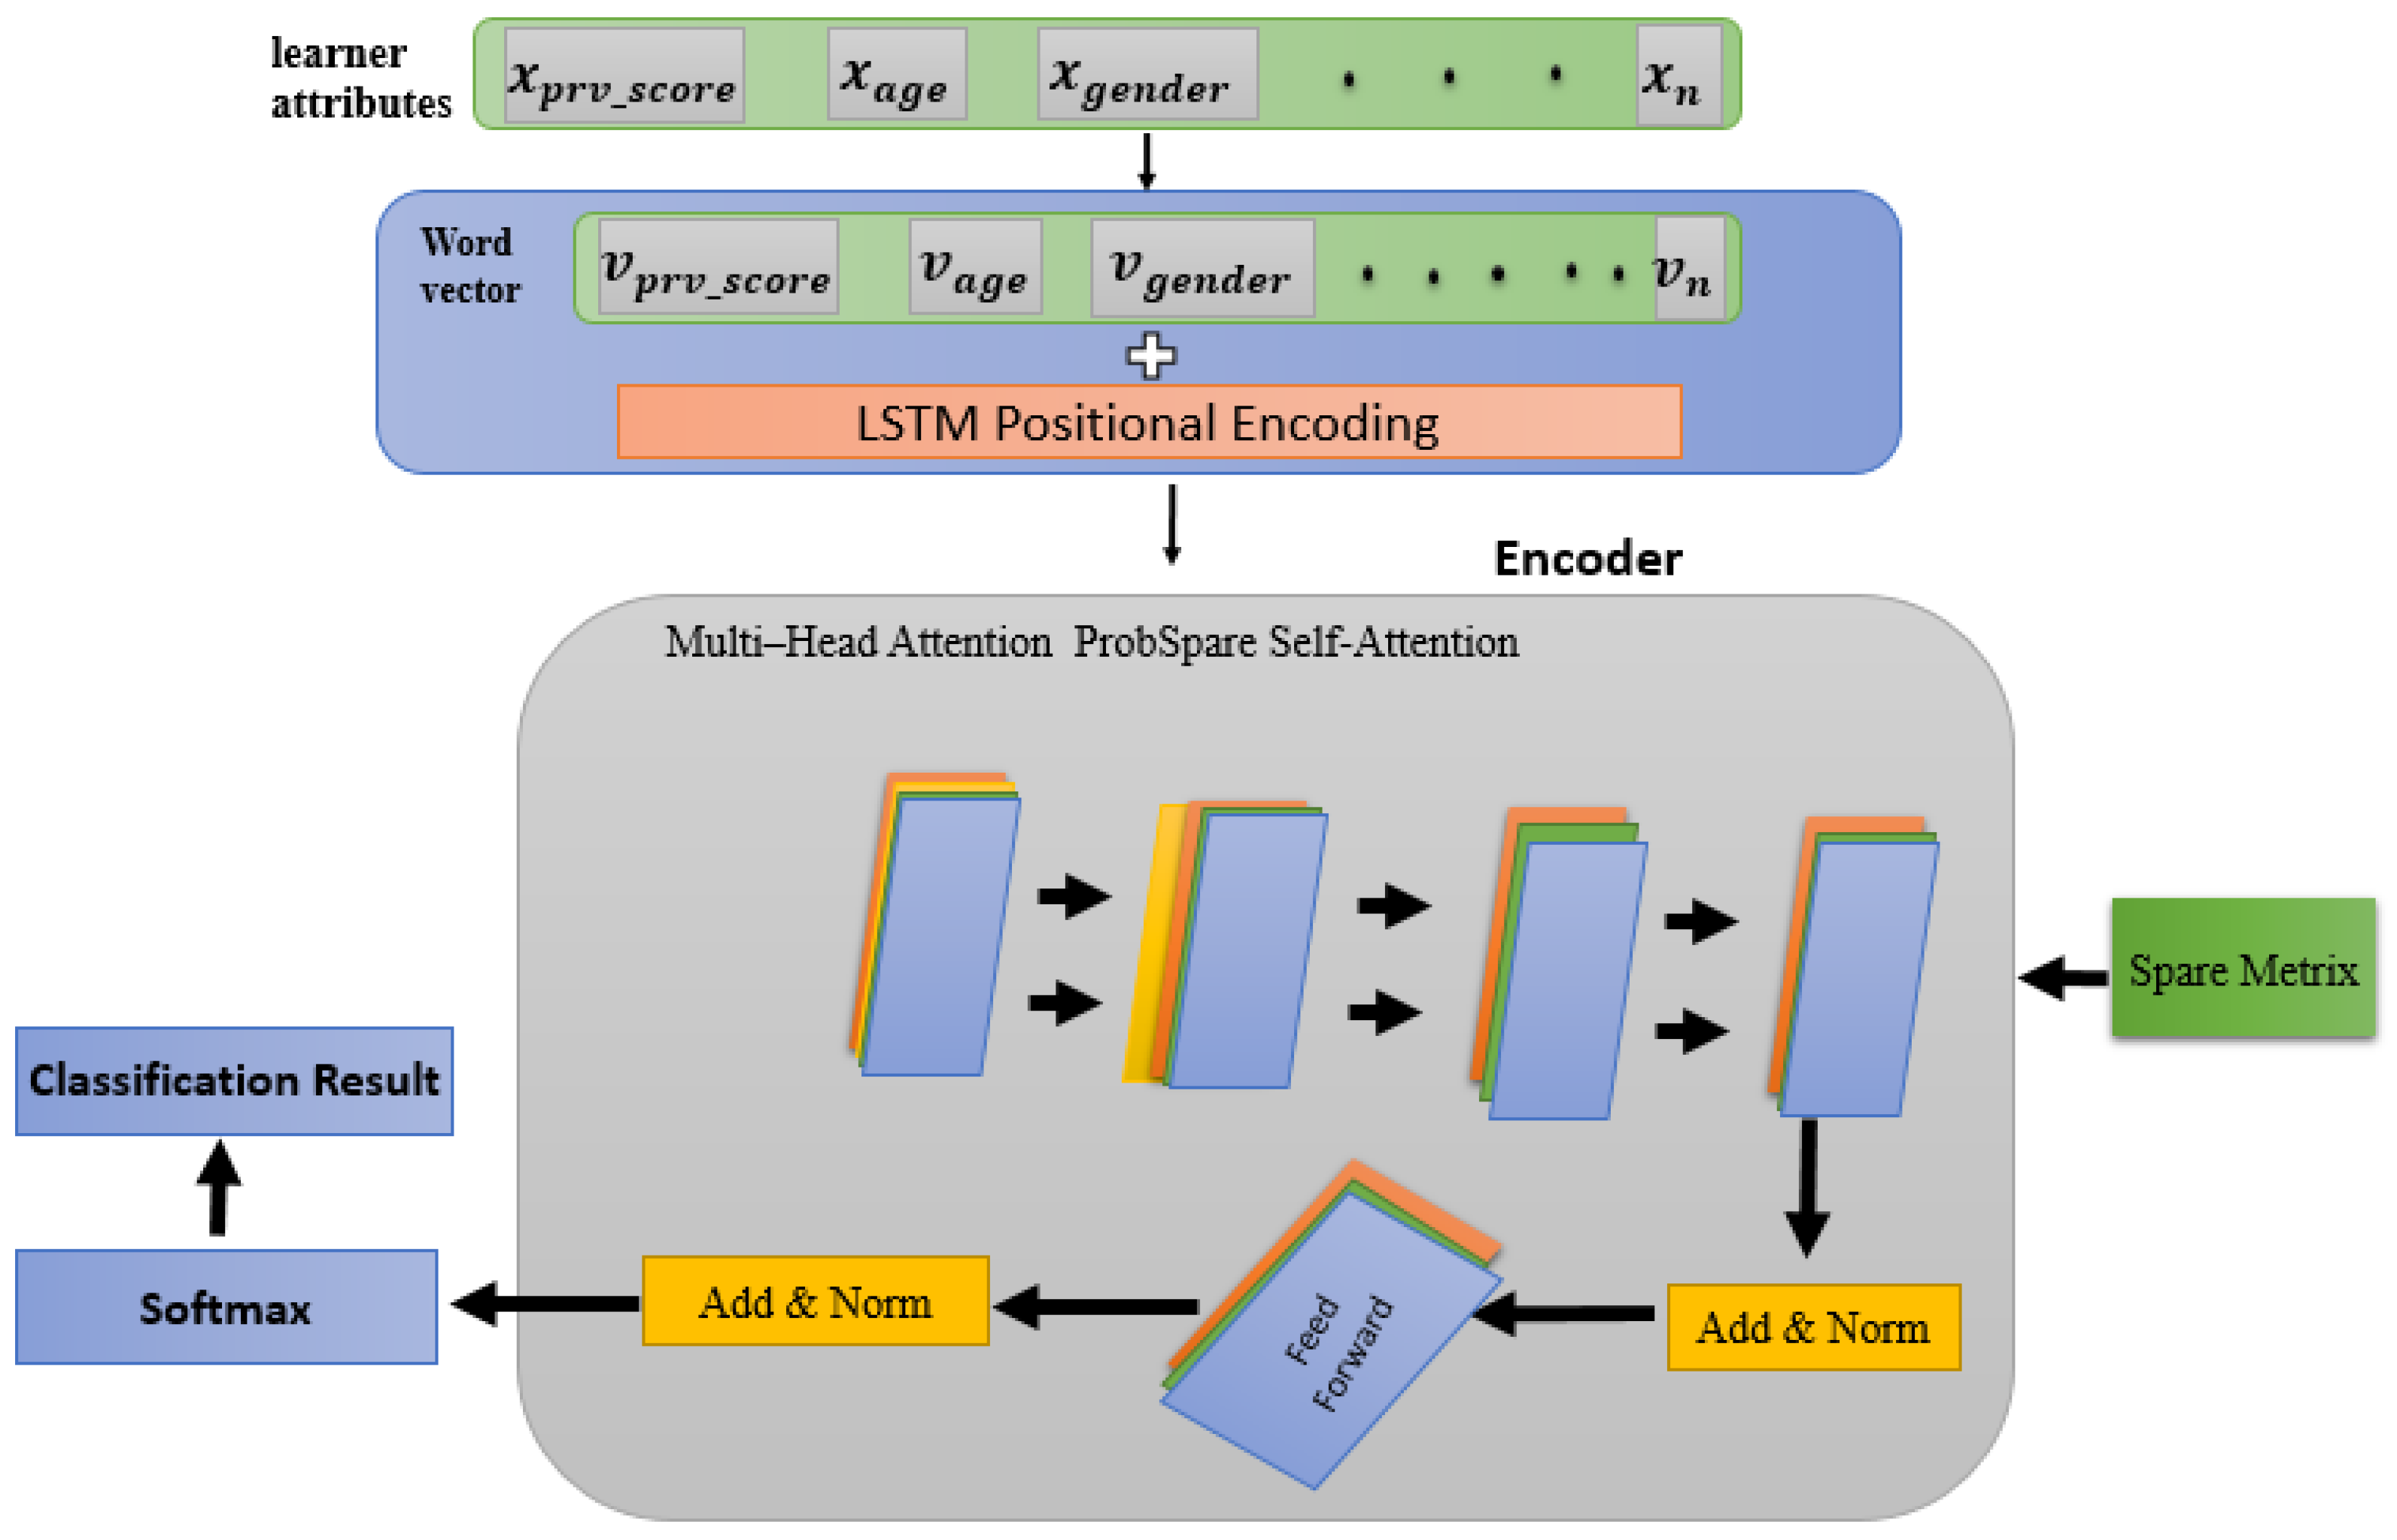
Figure 4.
Design of the LSTM positional encoding architecture in our research.
Figure 5.
The proposed framework for classifying learning styles.
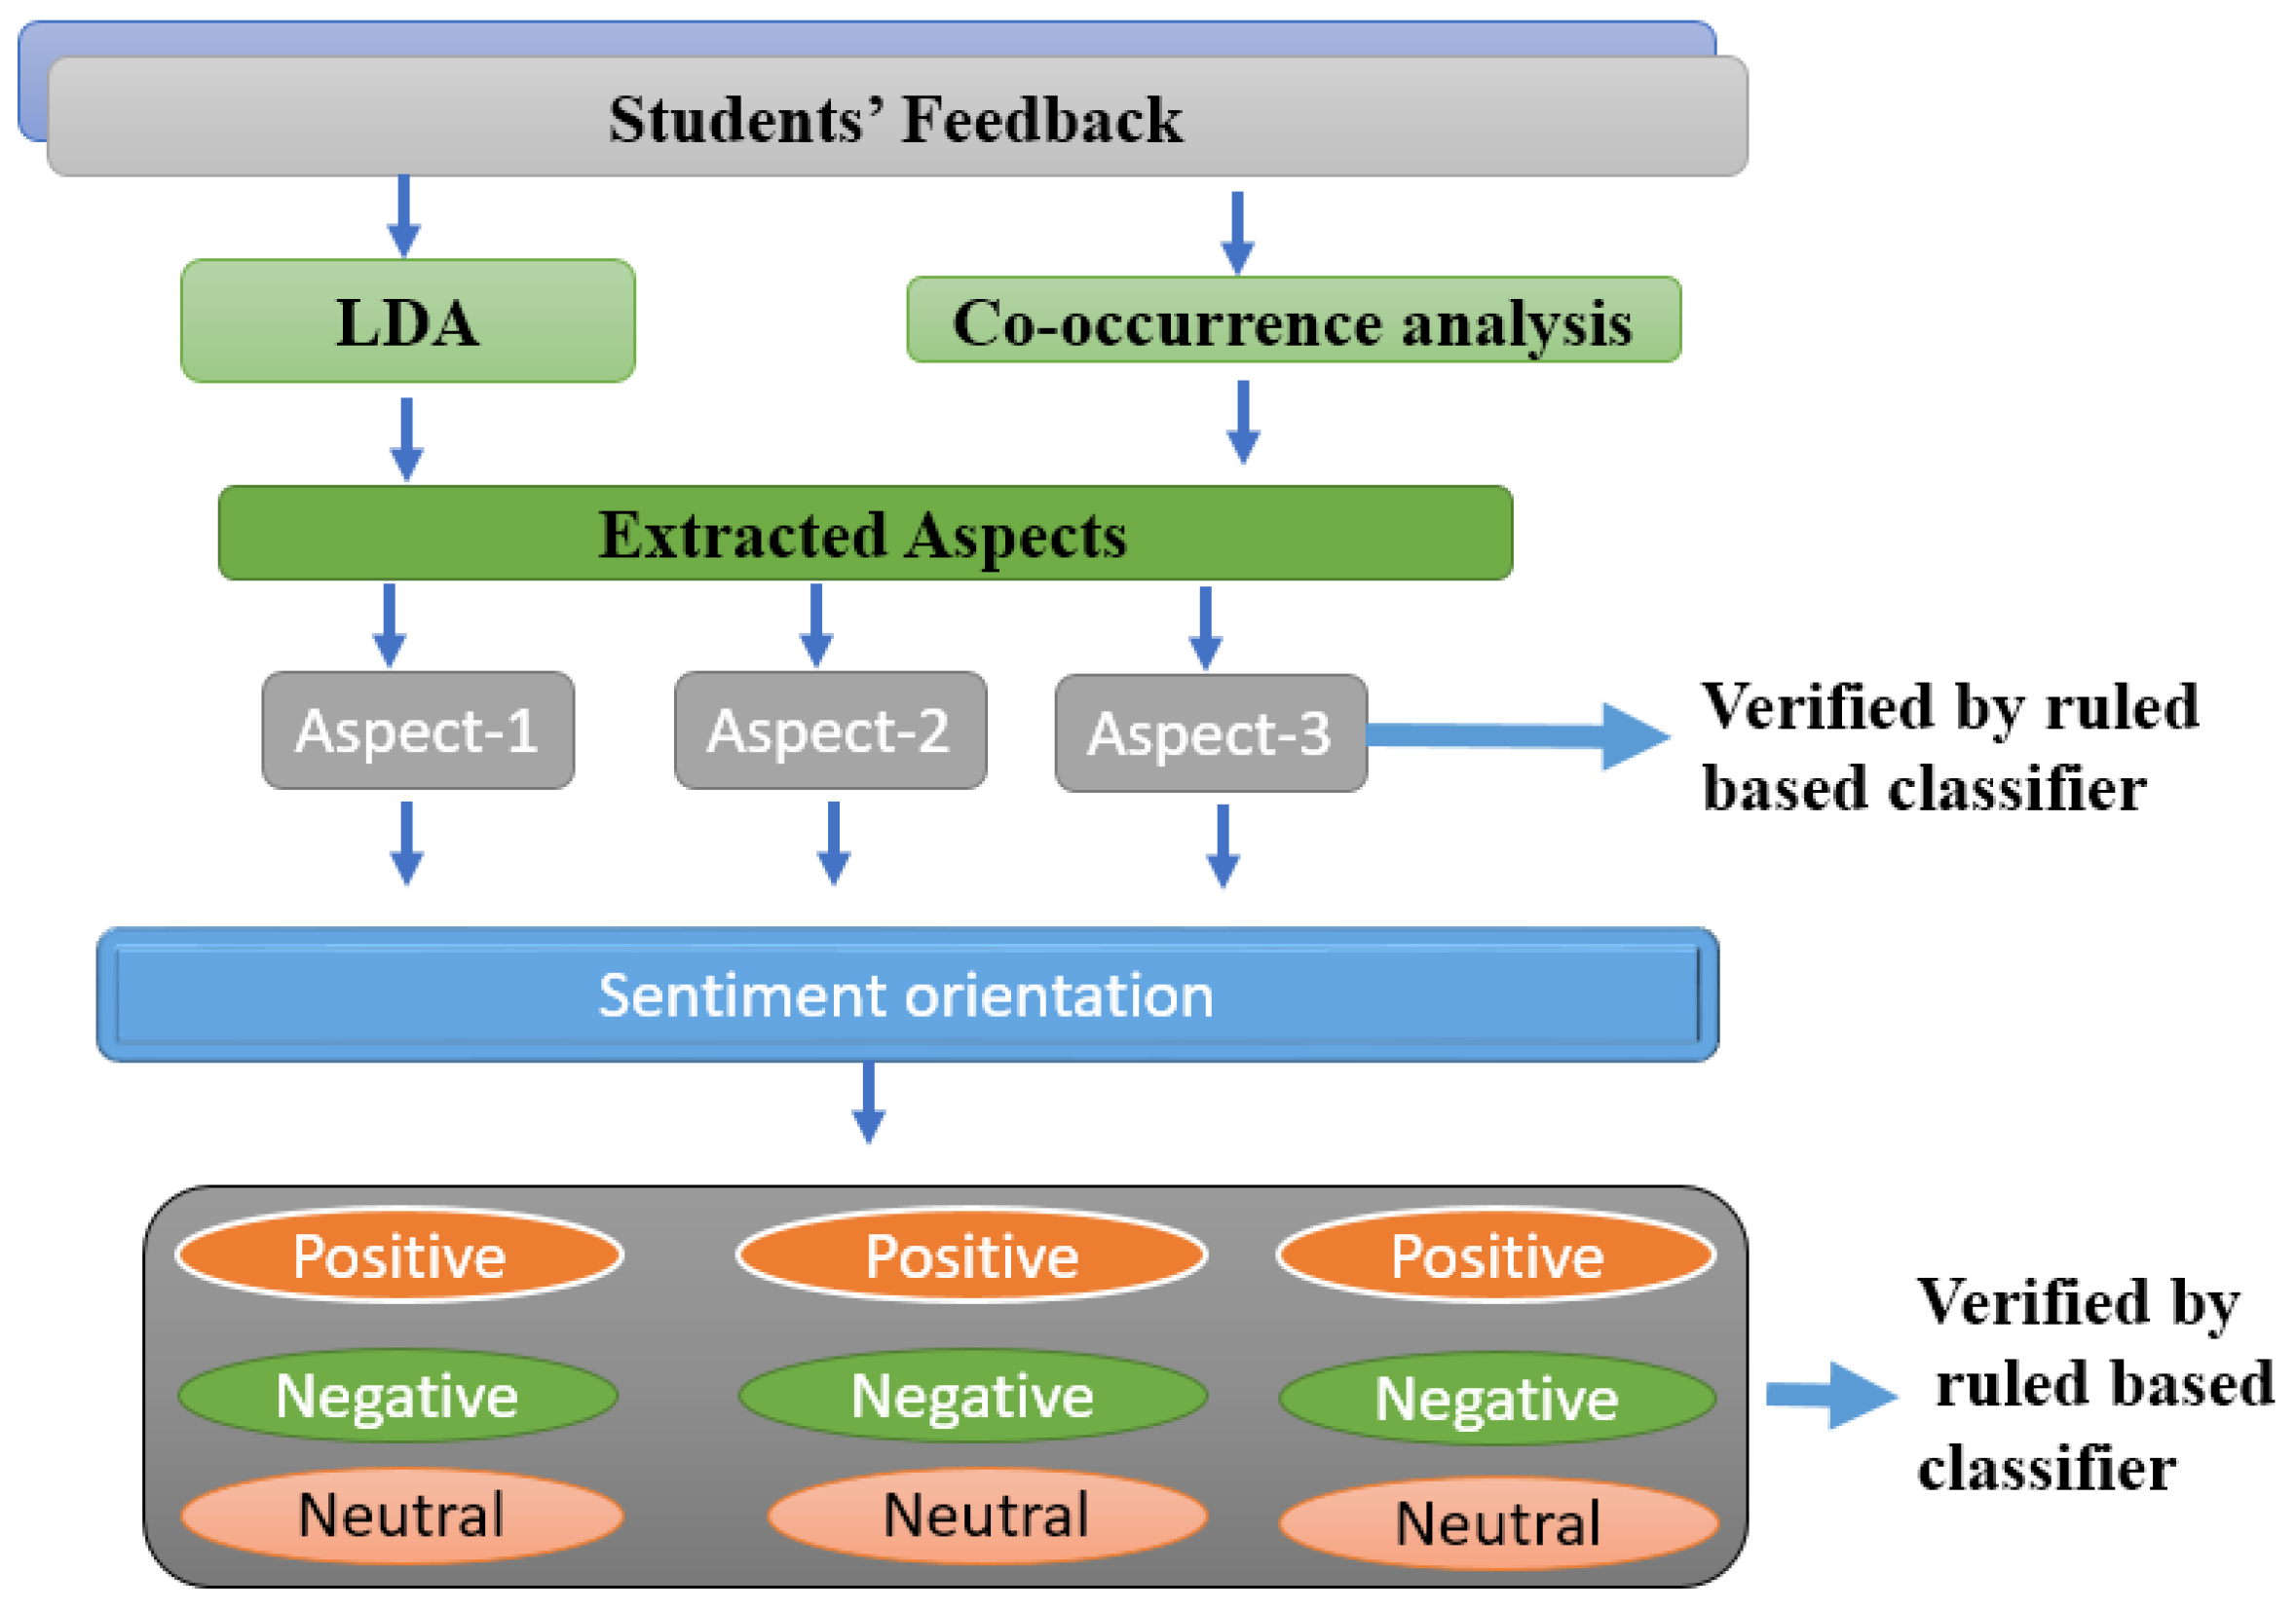
Figure 6.
Proposed framework for aspect-based sentiment classification.
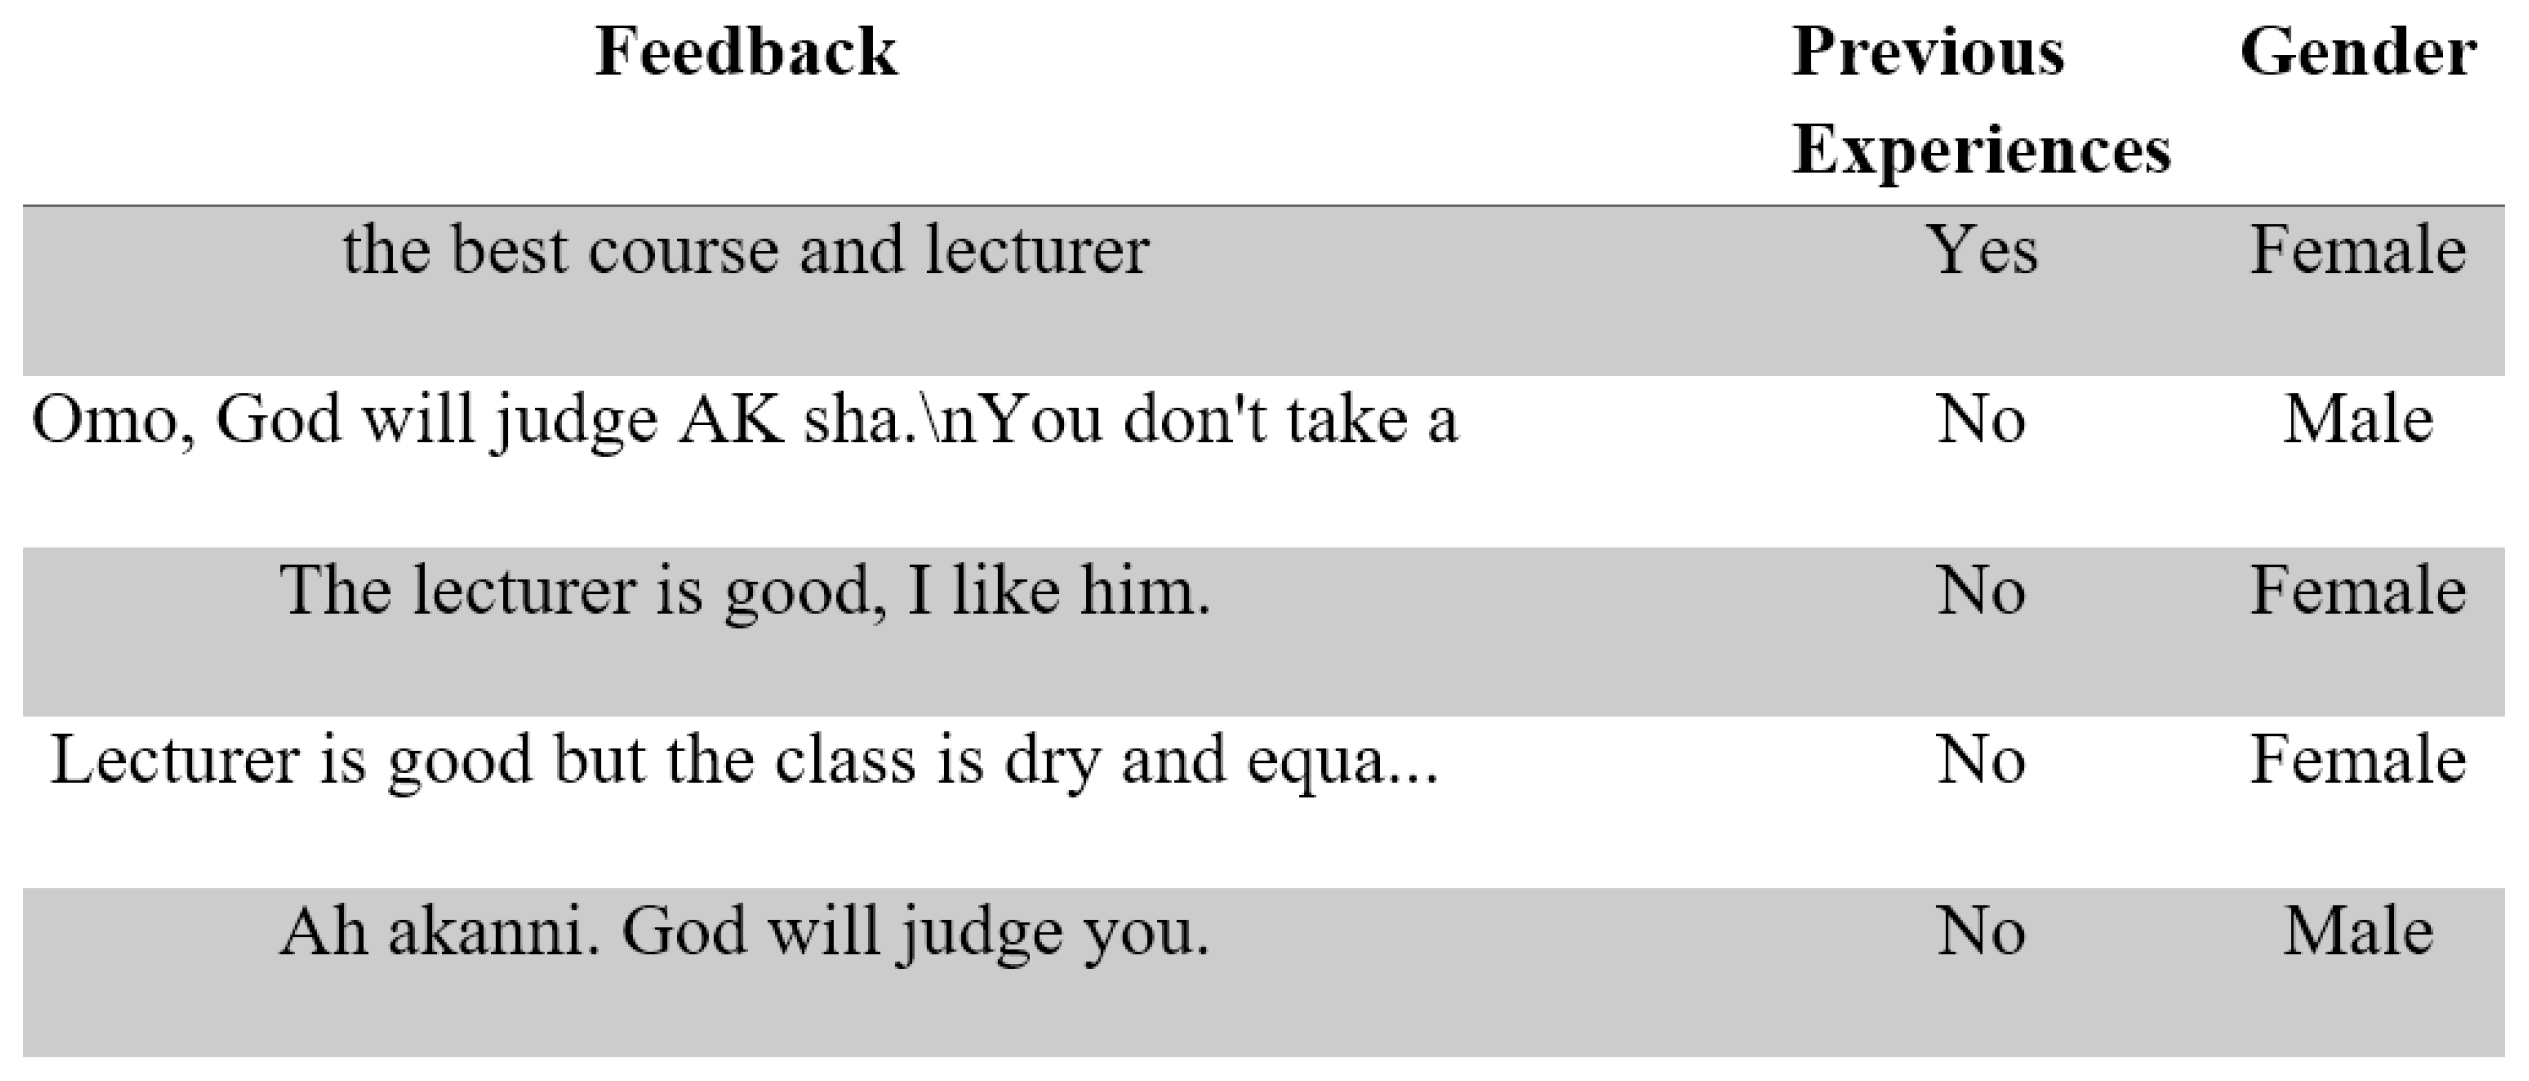
Figure 7.
Dataset sample used in our research.
Figure 8.
Multi-level framework for aspect extraction and labeling.
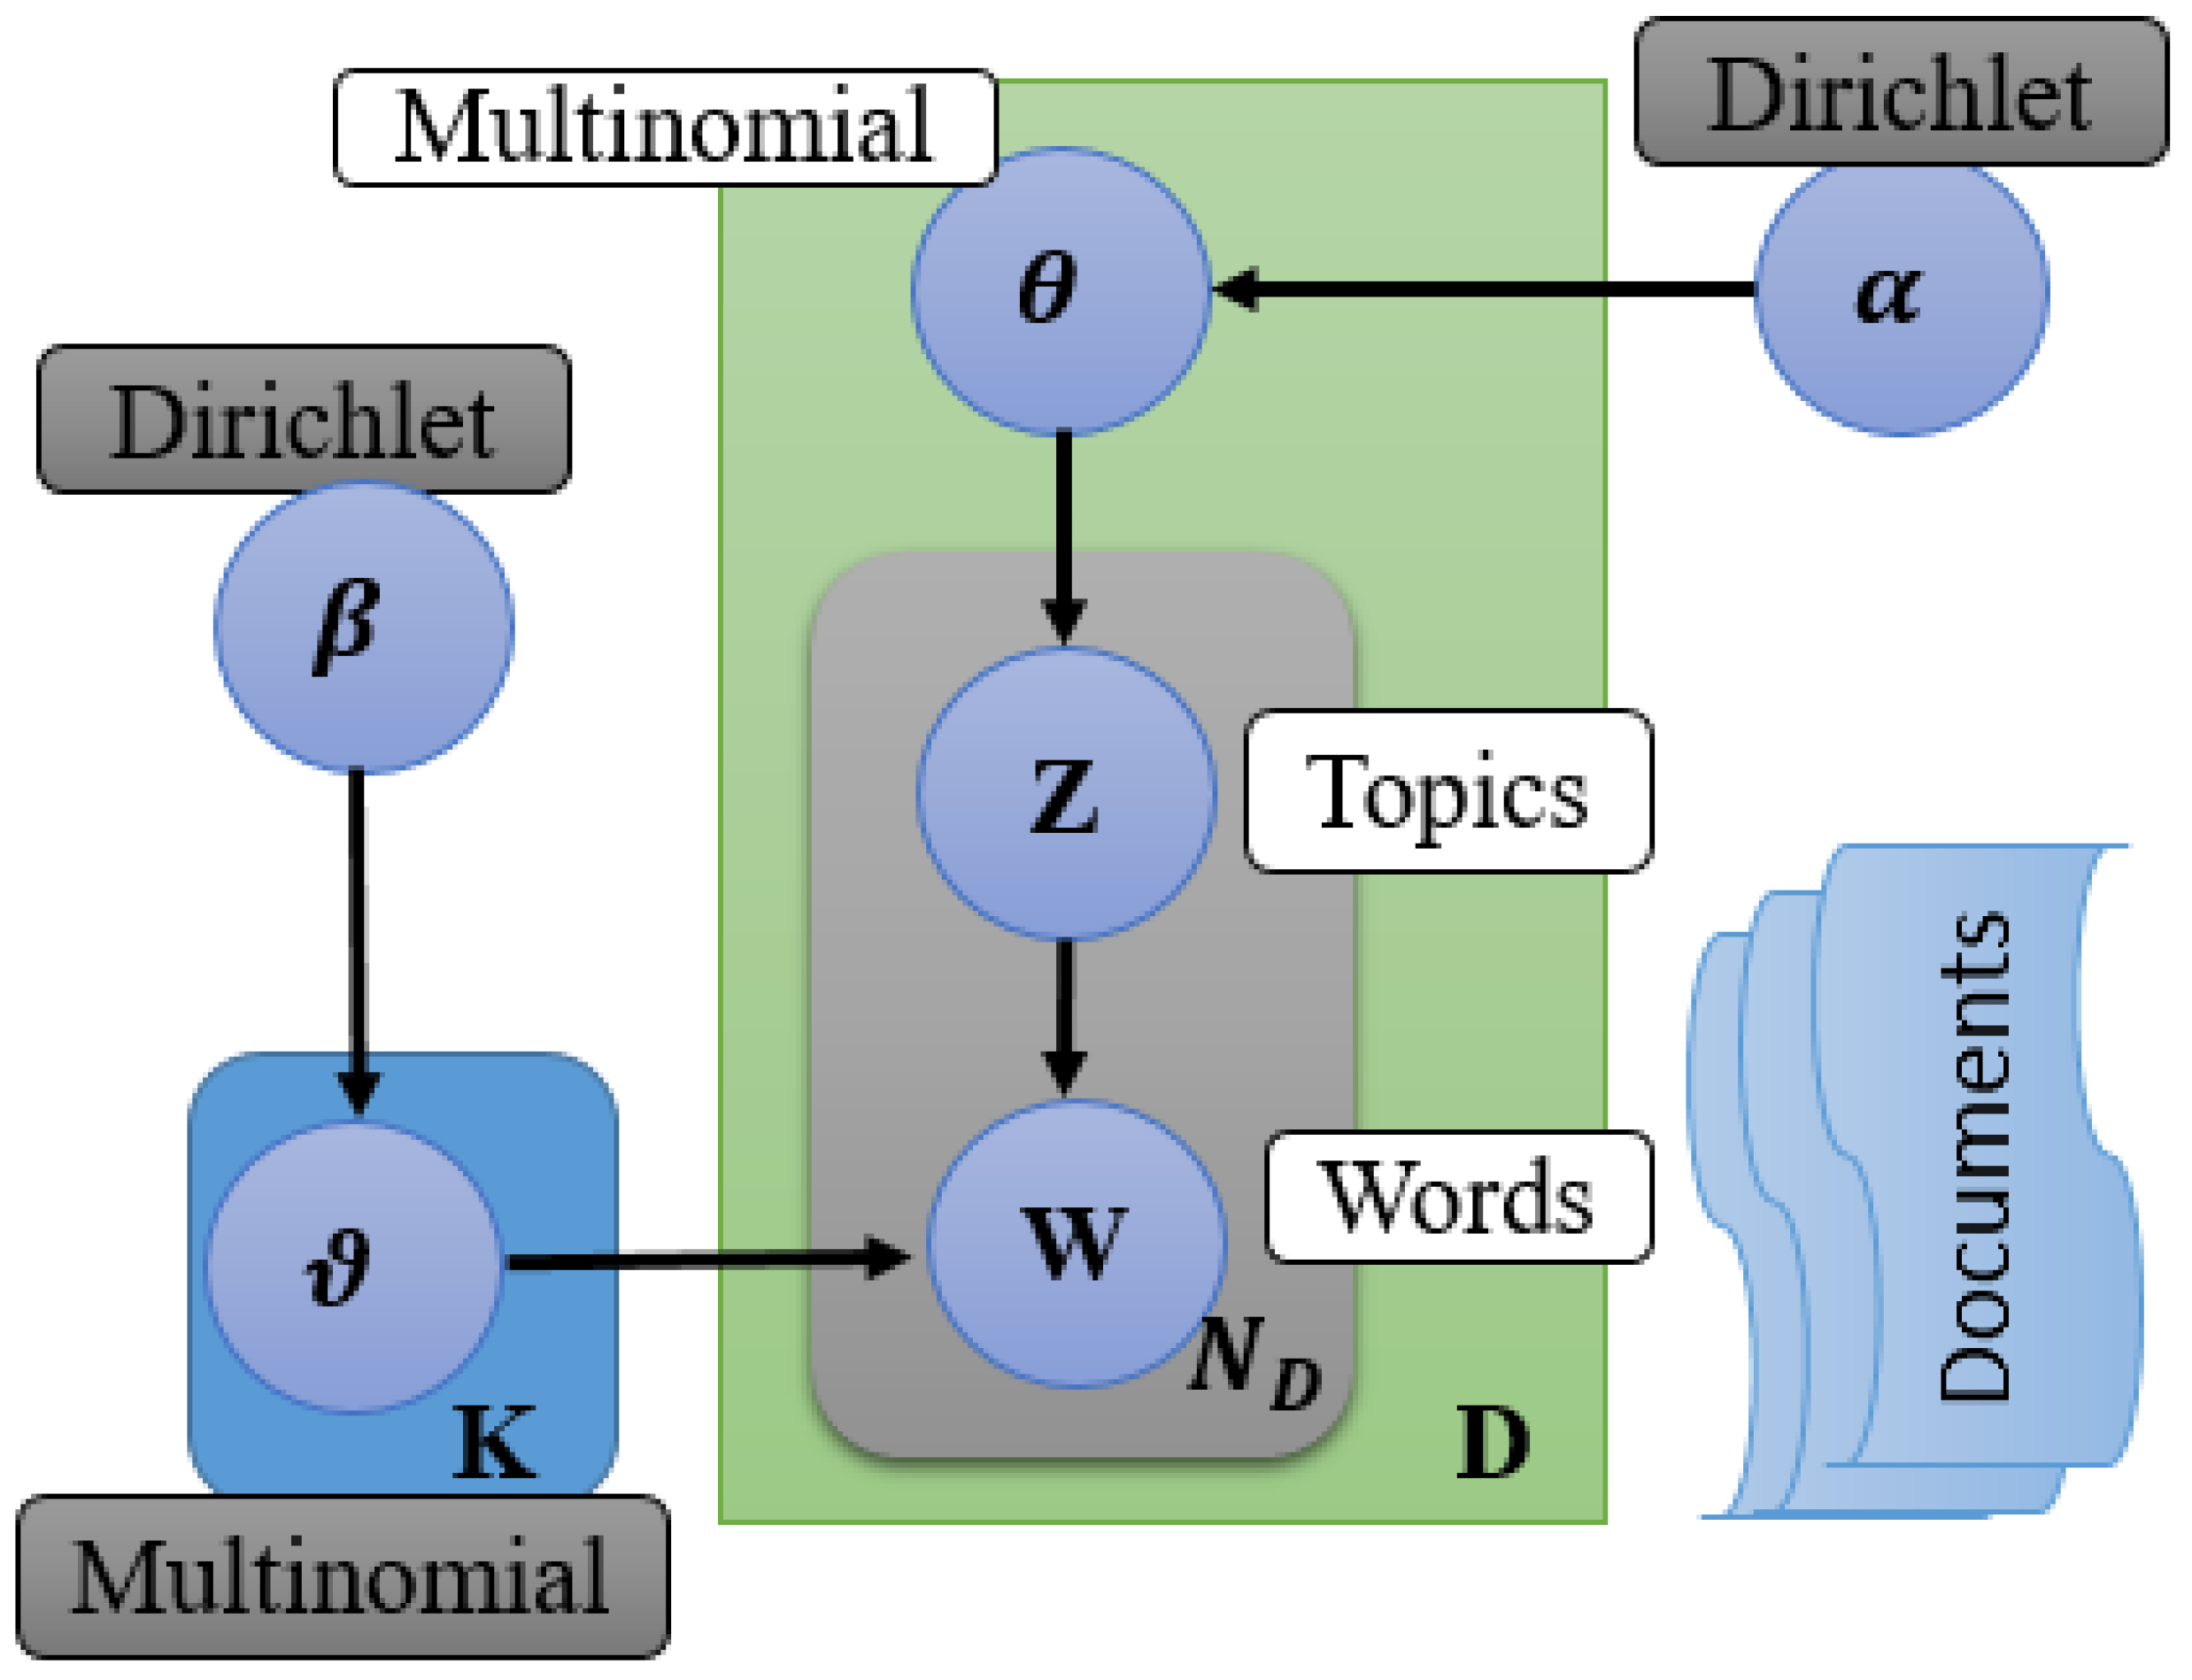
Figure 9.
The architectural illustration of the LDA topic modeling approach.
Figure 10.
Performance evaluation based on accuracy and loss metrics: (a) accuracy and validation accuracy; (b) training and validation loss.
Figure 11.
Sentiment orientation based on extracted aspects.
Figure 12.
Performance evaluation of the model by analyzing accuracy and loss graphs based on our specific dataset.
Figure 13.
Illustrating the performance of our trained models using a confusion matrix.
Figure 14.
Comparative evaluation of the proposed model with other existing models. In this context, (a–c) signify the performance metrics concerning accuracy, precision, and recall, respectively.
Figure 15.
Proposed model vs. other models for learning style identification.
Figure 16.
Proposed model vs. other models for sentiment classification performance.
Figure 17.
Proposed model and FCM algorithm time complexity comparison.
Table 1.
FSLSM learning styles: 16 combinations [
40].
| Group 1 (Active Styles) | Group 2 (Reflective Styles) |
|---|
| Active, Sensing, Visual, Sequential | Reflective, Sensing, Visual, Sequential |
| Active, Sensing, Visual, Global | Reflective, Sensing, Visual, Global |
| Active, Sensing, Verbal, Sequential | Reflective, Sensing, Verbal, Sequential |
| Active, Sensing, Verbal, Global | Reflective, Sensing, Verbal, Global |
| Active, Intuitive, Visual, Sequential | Reflective, Intuitive, Visual, Sequential |
| Active, Intuitive, Visual, Global | Reflective, Intuitive, Visual, Global |
| Active, Intuitive, Verbal, Sequential | Reflective, Intuitive, Verbal, Sequential |
| Active, Intuitive, Verbal, Global | Reflective, Intuitive, Verbal, Global |
Table 2.
LDA hyperparameters.
| Hyperparameter | Value |
|---|
| Number of Topics | 3 |
| Number of Passes | 10 |
| Document–Topic Prior Alpha | 0.01 |
| Beta (Previous Topic–Word) | 0.1 |
| Random State | 42 |
| Maximum Iterations | 500 |
| Minimum Token Frequency | 10 |
| Maximum Features | 5000 |
| Chunk Size | 2000 |
| Learning Decay | 0.7 |
| Learning Offset | 10 |
| Perplexity Score Tolerance | 0.1 |
| Mean Change Tolerance | 0.001 |
| Learning Method | ‘batch’ |
| Evaluate Every | 1 |
Table 3.
Part-of-Speech( POS) Tagging.
| No. | Feedback | POS Tagging |
|---|
| 1 | The classrooms at my university are small and not well-ventilated… | DT | NNS | IN | PRP | NN | VBP | JJ | CC | RB | RB | VBN |
| 2 | This course give us limited knowledge | DT | NN | VB | PRP | JJ | NN |
| 3 | University arranging very less Events for Students | NNP | VBG | RB | JJR | NNS | IN | NNS |
| 4 | Some course becomes difficult to understand because of technical issues… | DT | NN | VBZ | JJ | TO | VB | IN | IN | NNS |
| 5 | There is need an improvements in courses | EX | VBZ | MD | DT | NNS | IN | NNS |
| 6 | Sometimes teachers discourage students from asking the tough questions | RB | NNS | JJ | NNS | IN | VBG | DT | NN |
Table 4.
The number of sequences generated by algorithms for each cluster.
| Models | C1 | C2 | C3 | C4 | C5 | C6 | C7 | C8 | C9 | C10 | C11 | C12 | C13 | C14 | C15 | C16 |
|---|
| LSTM Algorithm | 75 | 82 | 72 | 75 | 91 | 98 | 87 | 80 | 74 | 76 | 71 | 74 | 90 | 95 | 86 | 72 |
| MCQ Method | 73 | 84 | 69 | 77 | 93 | 97 | 85 | 83 | 78 | 72 | 69 | 78 | 89 | 93 | 88 | 70 |
| K-Means Algorithm | 65 | 70 | 72 | 67 | 94 | 88 | 76 | 84 | 65 | 77 | 74 | 61 | 87 | 95 | 86 | 74 |
Table 5.
The time complexity of the proposed approach and FCM (Fuzzy C-Means) based on the number of iterations.
| 1 | Time Complexity of Proposed Algorithms | FCM Algorithm’s Time Complexity |
|---|
| 60 | 300 s | 758 s |
| 100 | 689 s | 1264 s |
| 200 | 1389 s | 2529 s |
Table 6.
Results of each dimension’s cross-validation and different algorithms.
| Algorithms | Dimensions |
|---|
| |
Input
|
Processing
|
Understanding
|
Perception
|
|---|
| Proposed Approach | 78% | 83% | 83% | 89% |
| Random Forest | 79% | 77% | 77% | 91% |
| Classifier Using Decision Tree | 73% | 74% | 74% | 90% |
| Naive Bayes | 77% | 76% | 76% | 86% |
| Logistic Regression | 79% | 80% | 80% | 87% |
| K-Nearest Neighbor | 76% | 78% | 78% | 90% |
| Analyzing Linear Discriminant | 79% | 79% | 79% | 86% |
| Cross-Validation Scores |
Table 7.
The degree of consistency between machine prediction and manual marking about Gardner’s multiple intelligence theory.
| Dominant Intelligence | Number of Students Who Have Dominant Intelligence as Determined by Manually Marking the E-Questionnaire | Number of Students Who, According to the Machine Learning Method, Have Dominant Intelligence | (Number of Students from Manual Marking /Correct Predictions Made by Machine) ∗ 100 |
|---|
| Verbal–Linguistic | 39 | 32 | 82.05% |
| Bodily–Kinesthetic | 27 | 16 | 59.26% |
| Mathematical–Logical | 43 | 36 | 83.72% |
| Visual–Spatial | 57 | 52 | 91.23% |
| Interpersonal–Intrapersonal | 34 | 26 | 76.47% |
| Total | 200 | 162 | 81.00% |
Table 8.
Confusion matrices for the classification of student learning styles.
| | C1 | C2 | C3 | C4 | C5 | C6 | C7 | C8 | C9 | C10 | C11 | C12 | C13 | C14 | C15 | C16 |
|---|
| Class 1 | 424 | 2 | 4 | 3 | 3 | 1 | 0 | 4 | 3 | 2 | 3 | 1 | 1 | 0 | 1 | 1 |
| Class 2 | 2 | 428 | 2 | 2 | 0 | 1 | 1 | 2 | 1 | 2 | 3 | 1 | 2 | 1 | 1 | 1 |
| Class 3 | 0 | 1 | 446 | 0 | 0 | 1 | 0 | 0 | 1 | 0 | 0 | 1 | 0 | 0 | 0 | 0 |
| Class 4 | 1 | 0 | 0 | 437 | 0 | 2 | 0 | 3 | 1 | 1 | 3 | 0 | 0 | 1 | 0 | 1 |
| Class 5 | 0 | 2 | 1 | 0 | 441 | 1 | 0 | 1 | 0 | 1 | 1 | 1 | 0 | 1 | 0 | 0 |
| Class 6 | 2 | 0 | 0 | 0 | 0 | 443 | 0 | 0 | 1 | 0 | 0 | 1 | 1 | 1 | 1 | 0 |
| Class 7 | 2 | 0 | 0 | 1 | 0 | 0 | 442 | 0 | 1 | 1 | 0 | 1 | 0 | 0 | 1 | 1 |
| Class 8 | 2 | 0 | 2 | 0 | 3 | 0 | 0 | 434 | 0 | 3 | 1 | 2 | 3 | 2 | 3 | 0 |
| Class 9 | 4 | 0 | 2 | 0 | 2 | 0 | 0 | 1 | 430 | 2 | 0 | 2 | 0 | 1 | 1 | 1 |
| Class 10 | 5 | 0 | 0 | 3 | 0 | 4 | 0 | 3 | 0 | 425 | 3 | 0 | 3 | 2 | 2 | 0 |
| Class 11 | 2 | 5 | 3 | 5 | 2 | 0 | 3 | 0 | 2 | 0 | 420 | 2 | 2 | 3 | 0 | 1 |
| Class 12 | 1 | 1 | 2 | 2 | 1 | 1 | 2 | 1 | 1 | 0 | 0 | 427 | 5 | 3 | 2 | 1 |
| Class 13 | 0 | 1 | 1 | 0 | 1 | 0 | 2 | 0 | 1 | 0 | 1 | 0 | 435 | 4 | 2 | 2 |
| Class 14 | 2 | 3 | 2 | 2 | 4 | 2 | 2 | 4 | 0 | 3 | 0 | 0 | 2 | 418 | 2 | 4 |
| Class 15 | 4 | 0 | 0 | 0 | 2 | 0 | 0 | 7 | 0 | 6 | 0 | 5 | 0 | 5 | 410 | 11 |
| Class 16 | 3 | 2 | 2 | 1 | 0 | 0 | 0 | 2 | 3 | 0 | 2 | 3 | 0 | 3 | 6 | 423 |
Table 9.
Evaluation of performance for each learning style classification.
| Class | Accuracy | Precision | Recall | F1 Score |
|---|
| 1 | 0.9918 | 0.94 | 0.93 | 0.93 |
| 2 | 0.9946 | 0.95 | 0.96 | 0.96 |
| 3 | 0.9965 | 0.99 | 0.96 | 0.97 |
| 4 | 0.9956 | 0.97 | 0.96 | 0.96 |
| 5 | 0.9963 | 0.98 | 0.96 | 0.97 |
| 6 | 0.9972 | 0.98 | 0.97 | 0.98 |
| 7 | 0.9975 | 0.98 | 0.98 | 0.98 |
| 8 | 0.9932 | 0.95 | 0.94 | 0.95 |
| 9 | 0.9957 | 0.96 | 0.97 | 0.97 |
| 10 | 0.9936 | 0.94 | 0.95 | 0.95 |
| 11 | 0.9935 | 0.93 | 0.96 | 0.95 |
| 12 | 0.994 | 0.95 | 0.96 | 0.95 |
| 13 | 0.9953 | 0.97 | 0.96 | 0.96 |
| 14 | 0.9918 | 0.93 | 0.94 | 0.93 |
| 15 | 0.9914 | 0.91 | 0.95 | 0.93 |
| 16 | 0.9929 | 0.94 | 0.95 | 0.94 |
Table 10.
Student feedback and aspect extraction.
| | Feedback | Extracted Aspects |
|---|
| 1 | Teacher have enough knowledge and know how to deliver lecture. | Teacher |
| 2 | Teacher gives helpful examples to make the course easier. | Course, teacher |
| 3 | Teacher’s behavior isn’t great for everyone. | Teacher |
| 4 | There have lack of lab facility therefore its not good to study here. | University |
| 5 | The university should have more fun and extra extracurricular activities, not only study. | University |
| 6 | Environment of the university is so bad, environment should be clean, I don’t want to stay here because of poor environment. | University |
| 7 | I don’t quite get what this course is about. | Course |
| 8 | I’m not happy with what we’re learning in this course. | Course |
| 9 | I like the programming part of the course. | Course |
| 10 | Teacher needs to explain things better with more details. | Teacher |
| 11 | Teacher do not have enough knowledge about practical studies. | Teacher |
| 12 | The teacher does not have good teaching experience and needs more experience. | Teacher |
| 13 | Some teacher could not arrive classroom on time, teacher must arrive on class. | Teacher |
| 14 | The cafeteria is not good need more improvement to provide better facilities for students. | University |
| 15 | I think the university administrative is so good they know how to manage resources
for students. | University |
| 16 | There is a lack of labs in the university, and more labs should be performed practically. | University |
| 17 | The university internet server is so bad, it should be improved and check their
quality regularly. | University |
| 18 | The course selection policy is bad, I don’t like it as I have to learn irrelevant subjects. | Course |
| 19 | Each course provide us excellent knowledge which boosts our skill, I happy to after completing this course. | Course |
| 20 | I did not understand course content because of lack of teacher knowledge. | Course, teacher |
| 21 | The materials we learned are not up to date its too old materials. | Course |
Table 11.
The outcomes of proposed Algorithm 1 for sentiment analysis.
| | Feedback | Extracted
Aspect | Sentiment
Orientation |
|---|
| 1 | Teacher’s behavior isn’t great for everyone. | Teacher | Negative |
| 2 | University should have more fun stuff, not just studying. | University | Neutral |
| 3 | The environment of the university is so bad, the environment should be clean,
I don’t want to stay here because
of poor environment. | University | Negative |
| 4 | I like the programming part of the course. | Course | Positive |
| 5 | The materials are not up to date, the teacher must have to provide latest materials. | Course, teacher | Negative |
| 6 | The materials we learned are not up to date; they are too old. | Course | Negative |
| 7 | The course selection procedure is so bad. | Course | Negative |
| 8 | University has less teaching staff, if increase teaching staff it will be good. | University | General |
| 9 | This course is interesting. | Course | Positive |
| 10 | University’s new library resources are very poor. | University | Negative |
| 11 | University providing more facilities. | University | Positive |
| 12 | Teacher well prepared lecture. | Teacher | Positive |
Table 12.
Extracted topics and their corresponding terms obtained through LDA.
| Topic_Num | Topic_Perc
_Contrib | Keywords | Representative Text |
|---|
| 0.0 | 0.9251 | Course, learn, study, teach, program, interesting, achieve, skill, understand, help | [learn, research, based, course, dip, machine learning, vision] |
| 1.0 | 0.9390 | Teacher, empower, overlook, often, bad, due, love, give, job, time | [teacher, bad habit, tell, teacher, thing, tell, parent, exact, opposite] |
| 2.0 | 0.9209 | University, provide, experience, big, opportunity, develop, game, offer, staff, library | [educational, institution, play, key, role, city, region, operate] |
| Disclaimer/Publisher’s Note: The statements, opinions and data contained in all publications are solely those of the individual author(s) and contributor(s) and not of MDPI and/or the editor(s). MDPI and/or the editor(s) disclaim responsibility for any injury to people or property resulting from any ideas, methods, instructions or products referred to in the content. |
© 2024 by the authors. Licensee MDPI, Basel, Switzerland. This article is an open access article distributed under the terms and conditions of the Creative Commons Attribution (CC BY) license (https://creativecommons.org/licenses/by/4.0/).


