
Linked Data Interfaces: A Survey

 , , ,
, , ,  and
and 
Abstract
:1. Introduction
1.1. Survey Methodology
1.2. Outline of the Paper
2. Knowledge Extraction
3. Traditional Visual Information Seeking Tools
- Proper Semantic Facetted Browsing: This enables users to filter search results based on relevant semantic facets, providing a more refined and meaningful search experience.
- Extension of Query String with Related Entities and Keywords: Users can explore more comprehensive and relevant search results by incorporating related entities and keywords into the search query.
- Recommendations and Cross-connections: Utilizing semantic relationships, the system can recommend related documents and provide further search suggestions based on cross-connections between entities.
4. Visualization of Semantic Data
4.1. By Interaction Paradigm
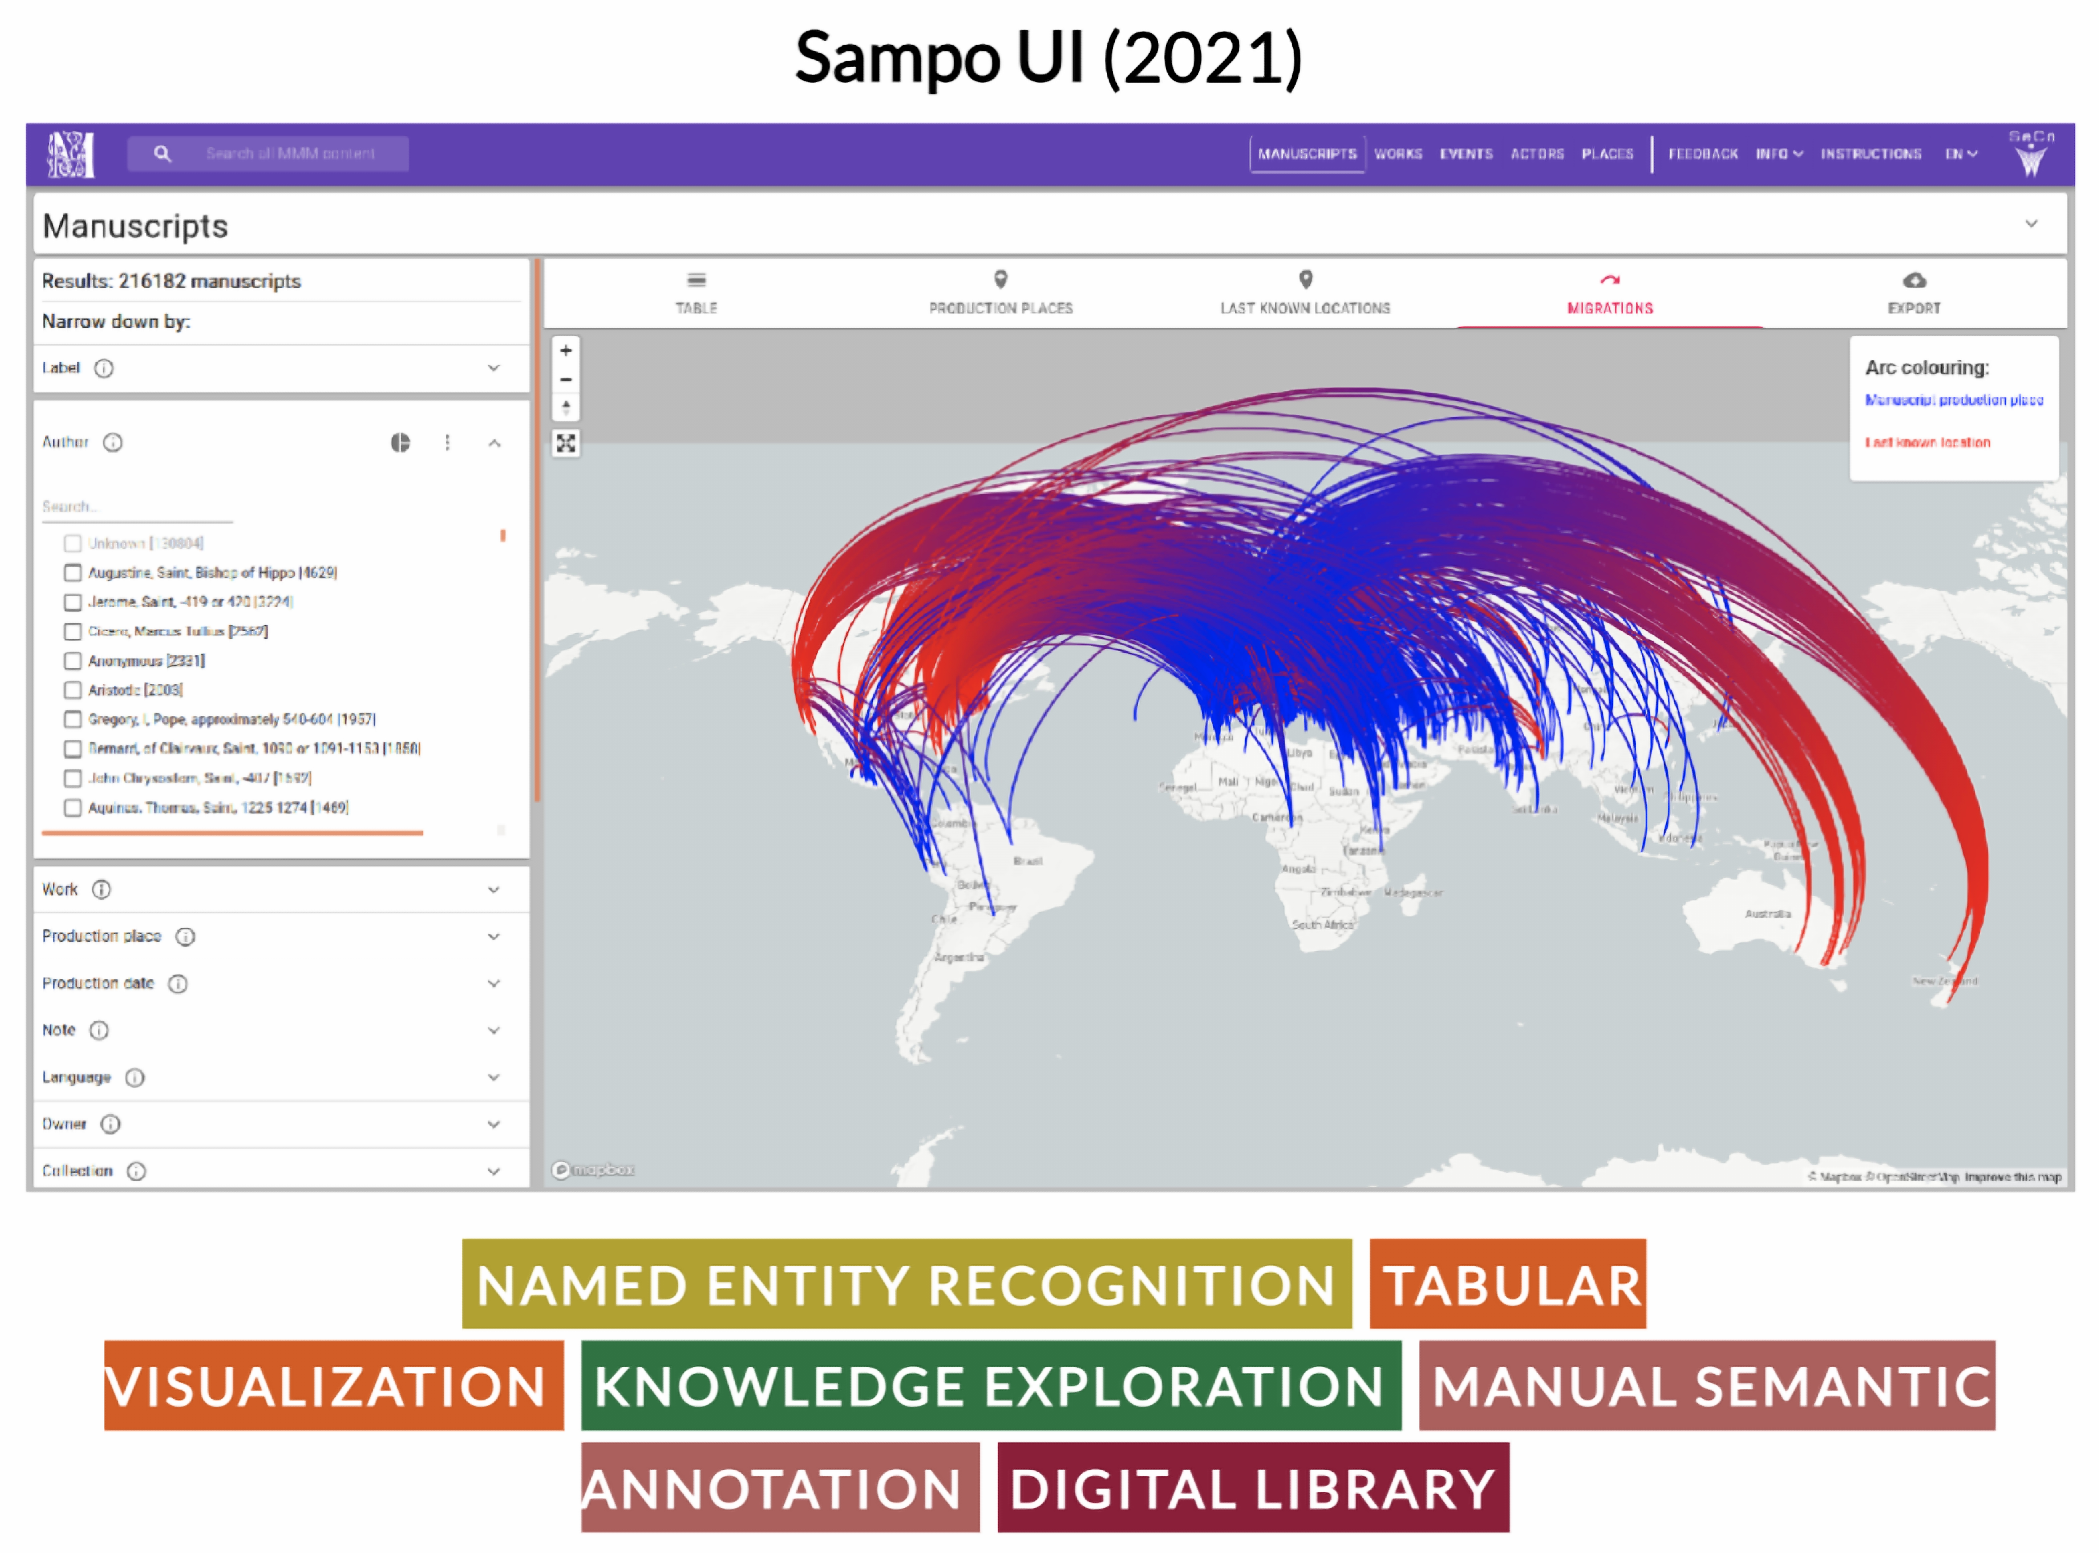
- Tabular:
- Interfaces with a tabular interaction paradigm display information about a single resource in one visualization. Views focus on tables that show specific properties linked to the asset, such as media files (e.g., photos), descriptions, or links to other linked assets.
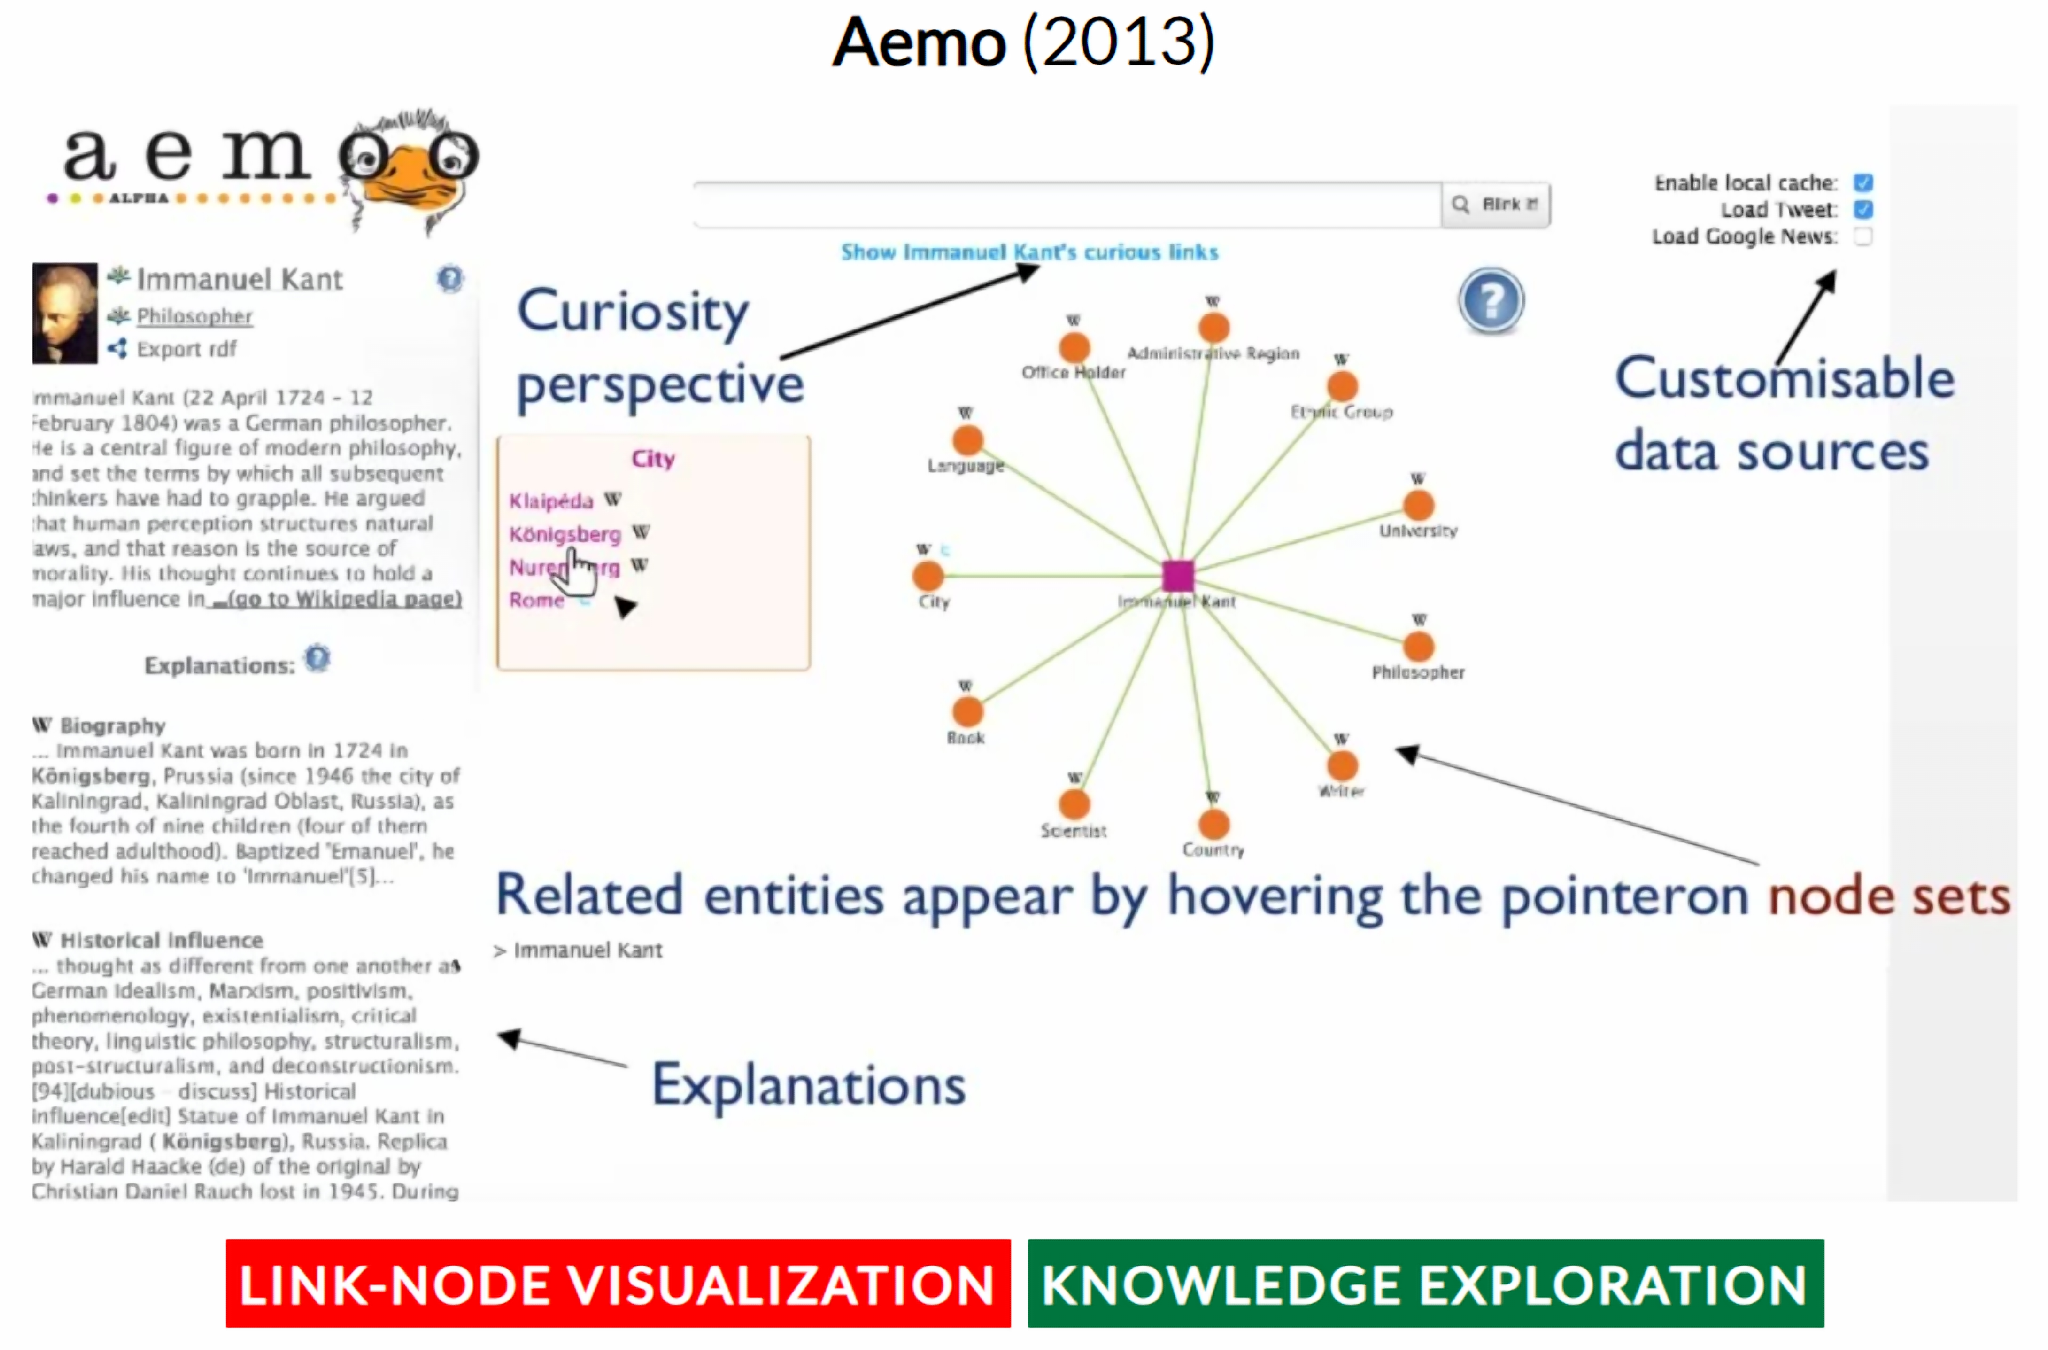
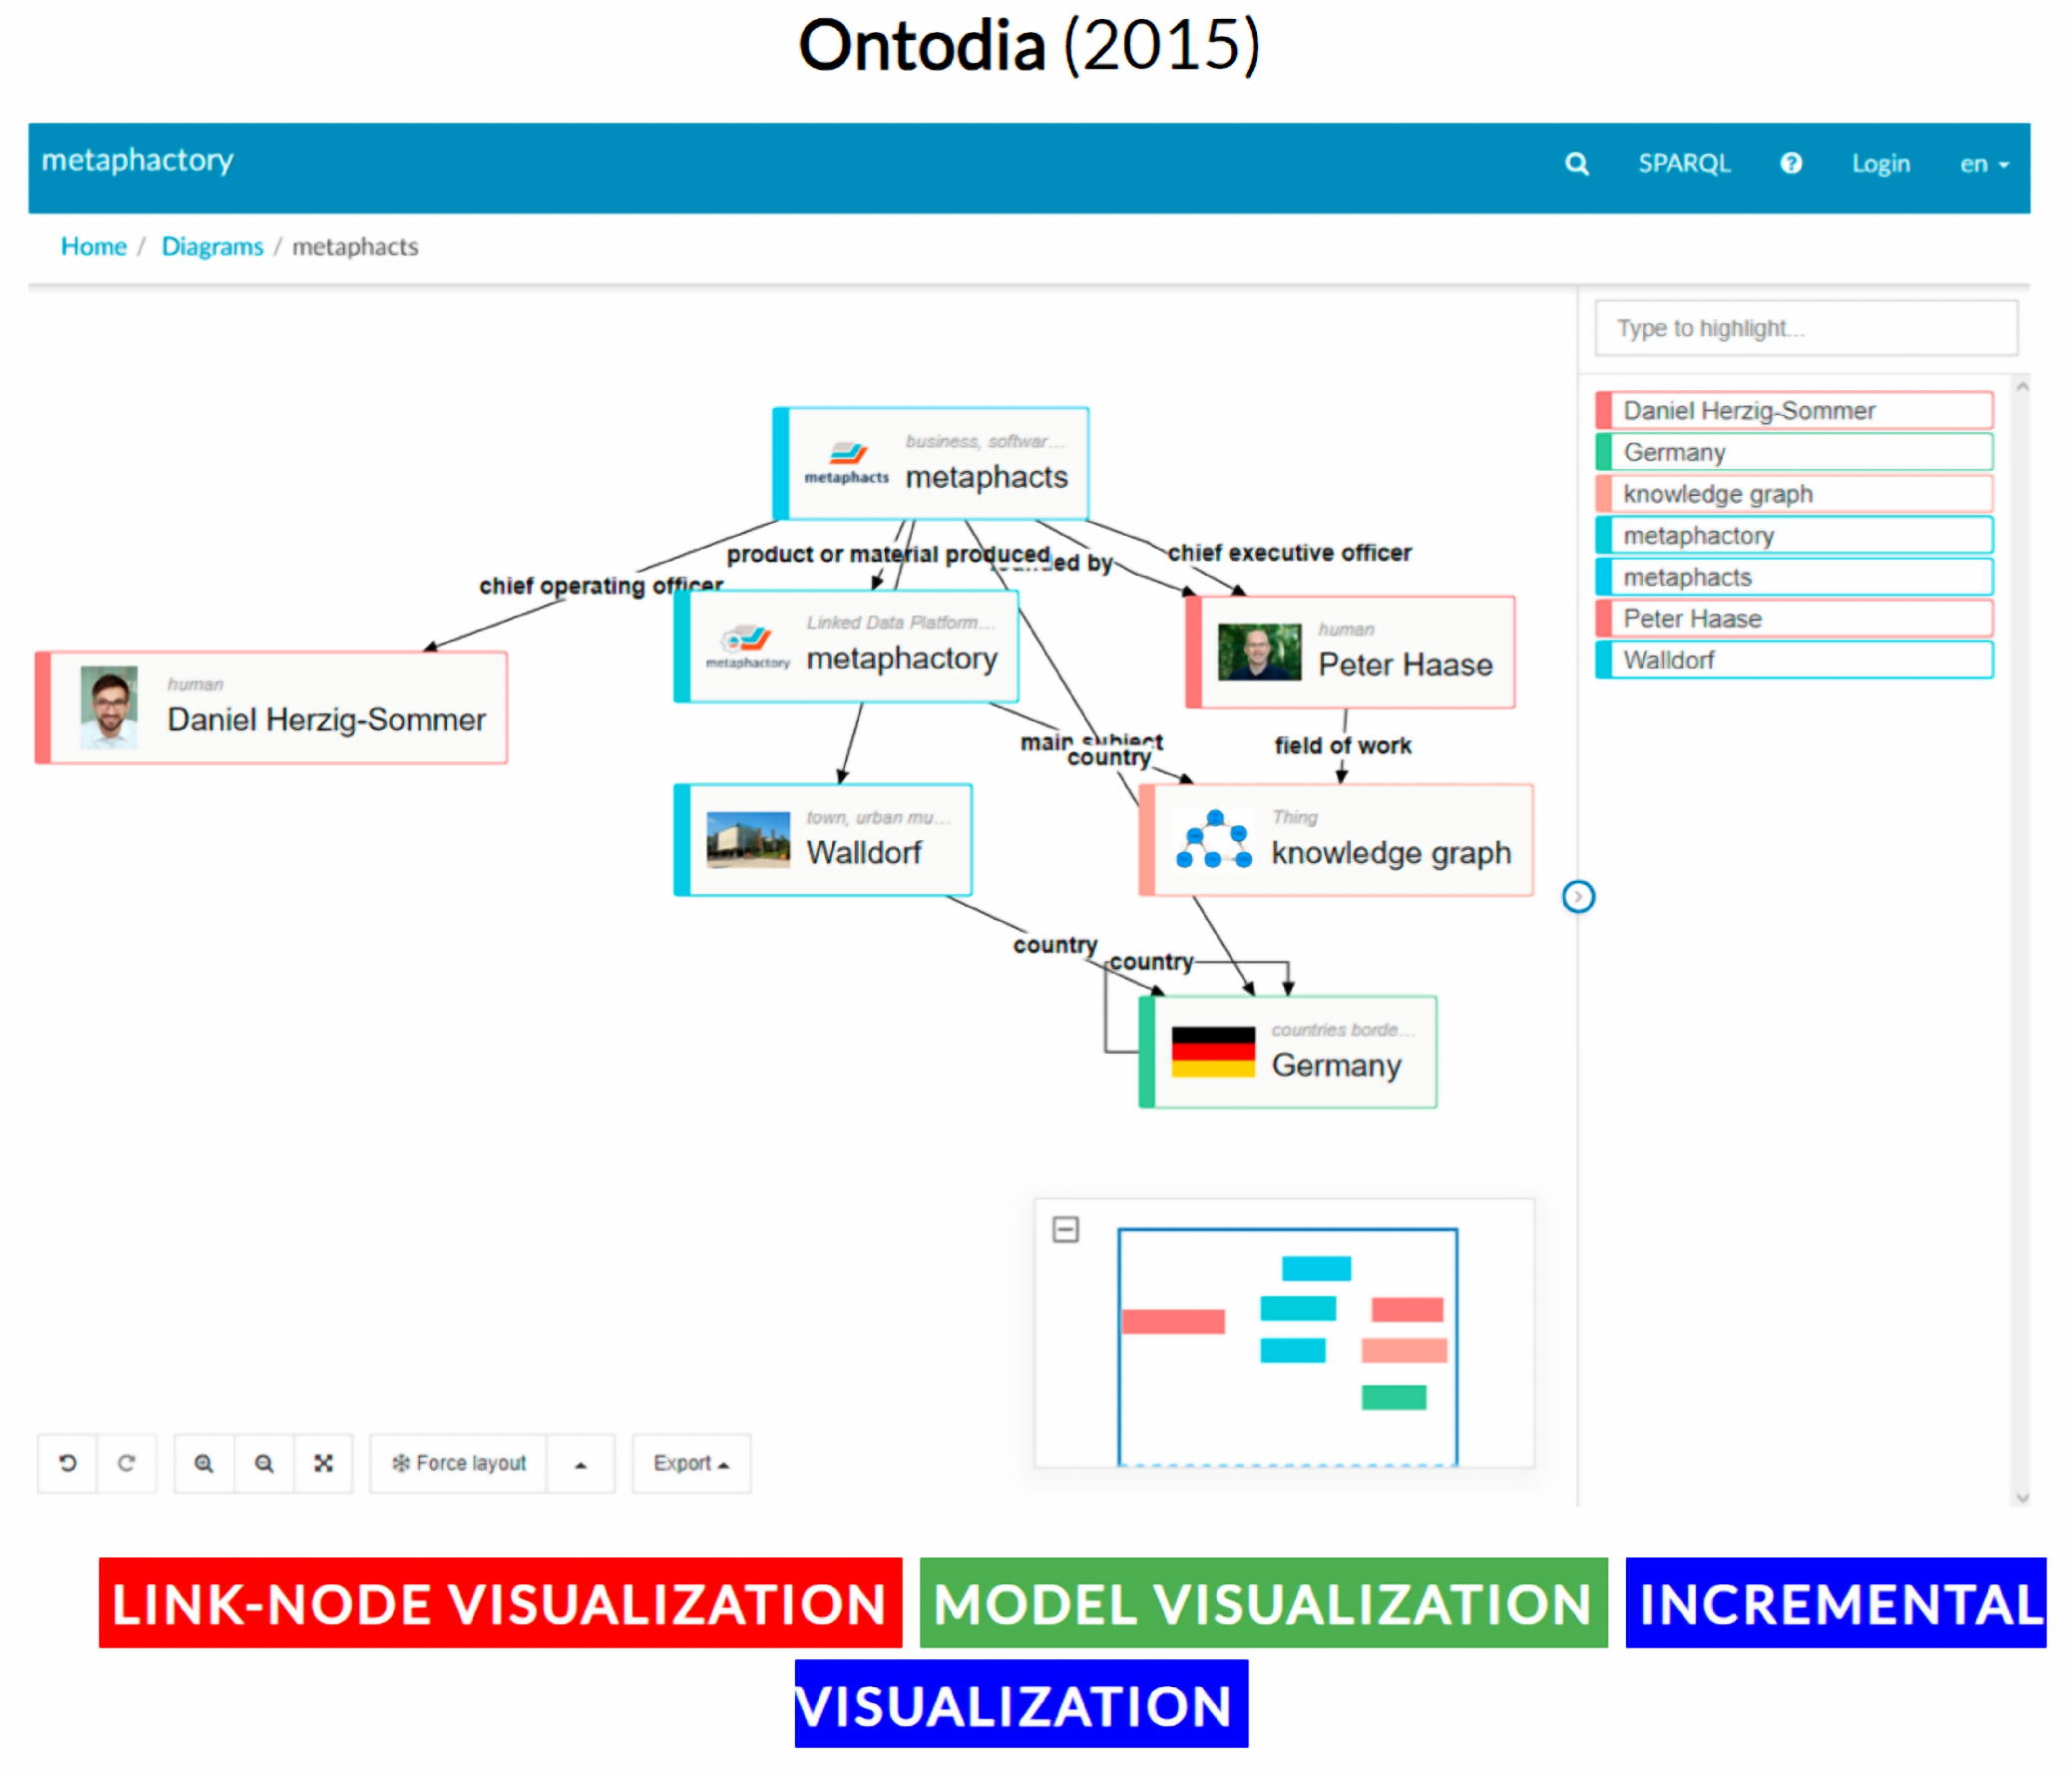
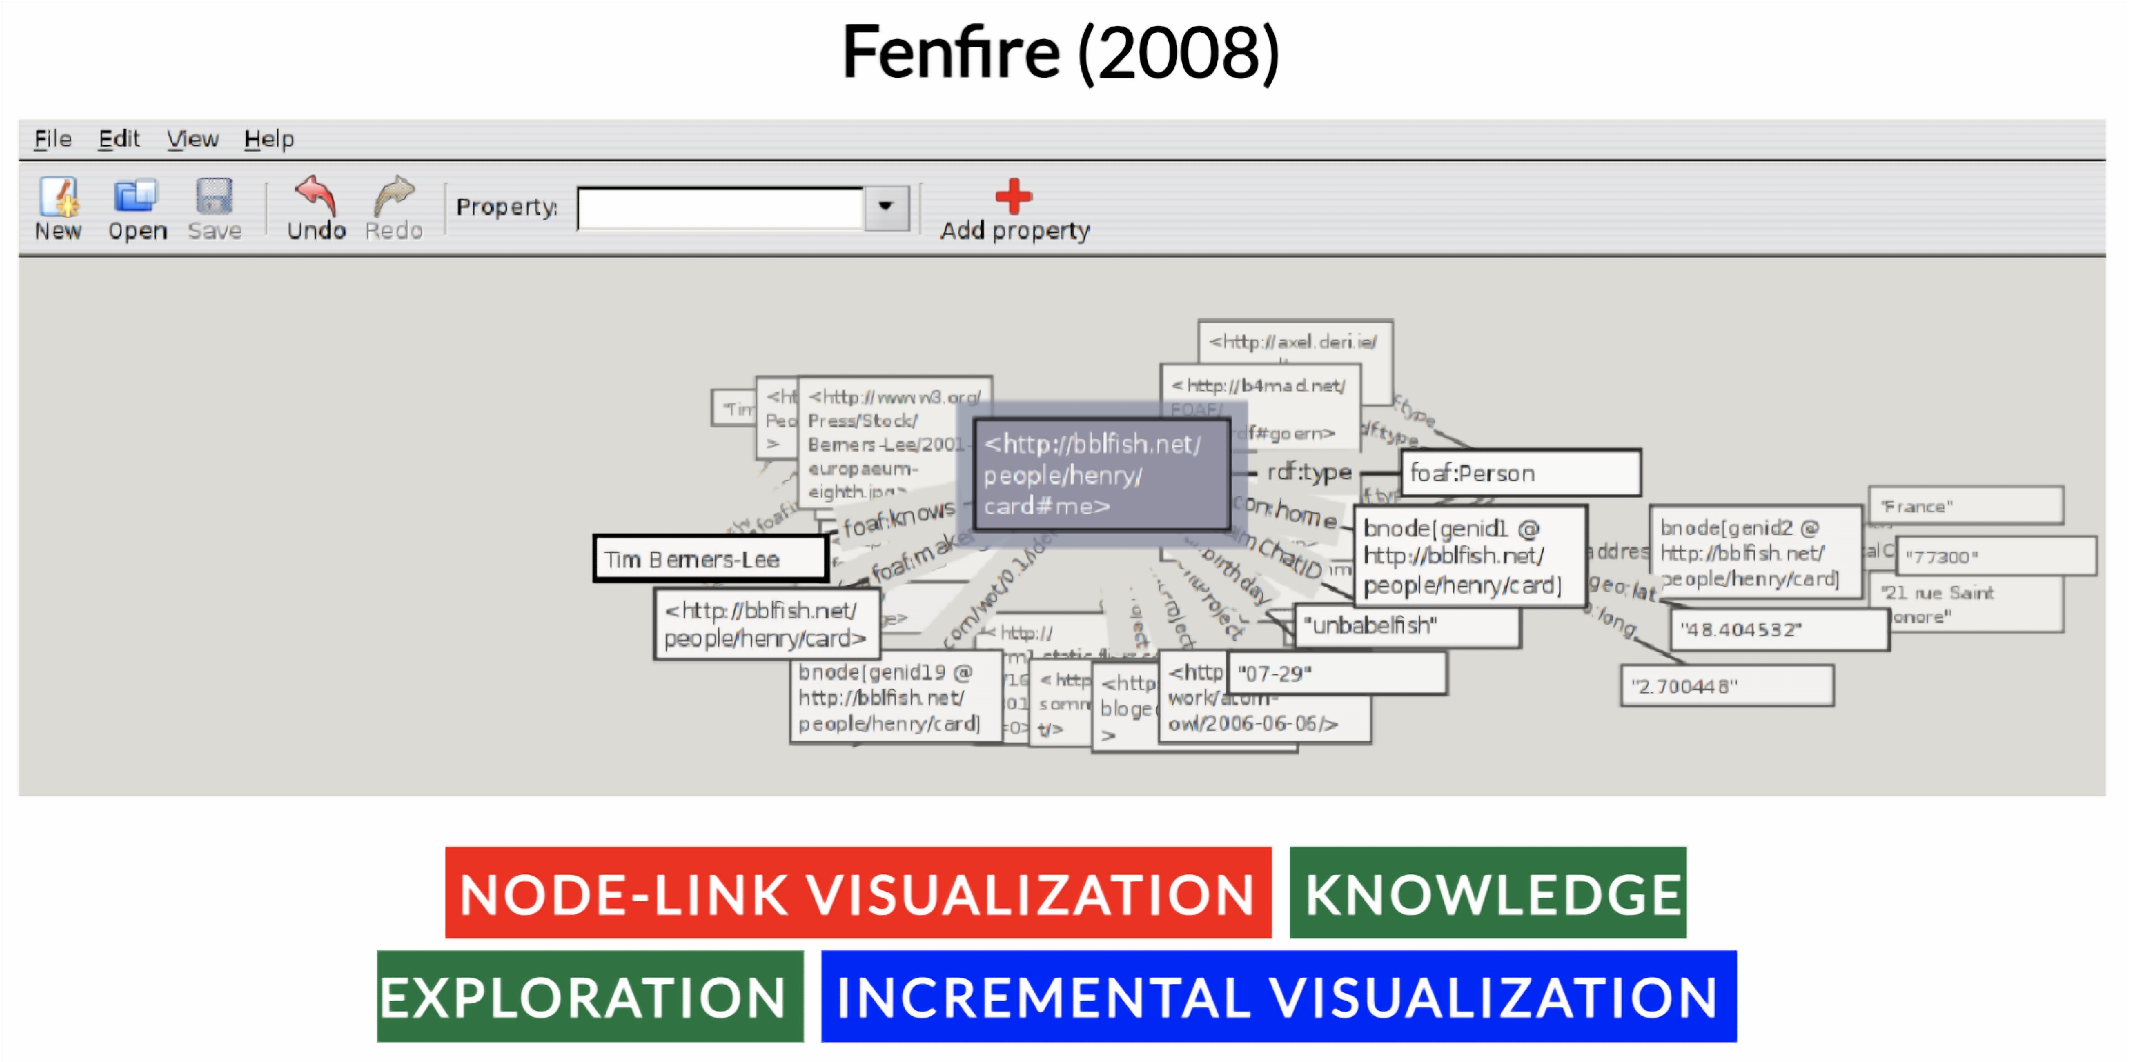
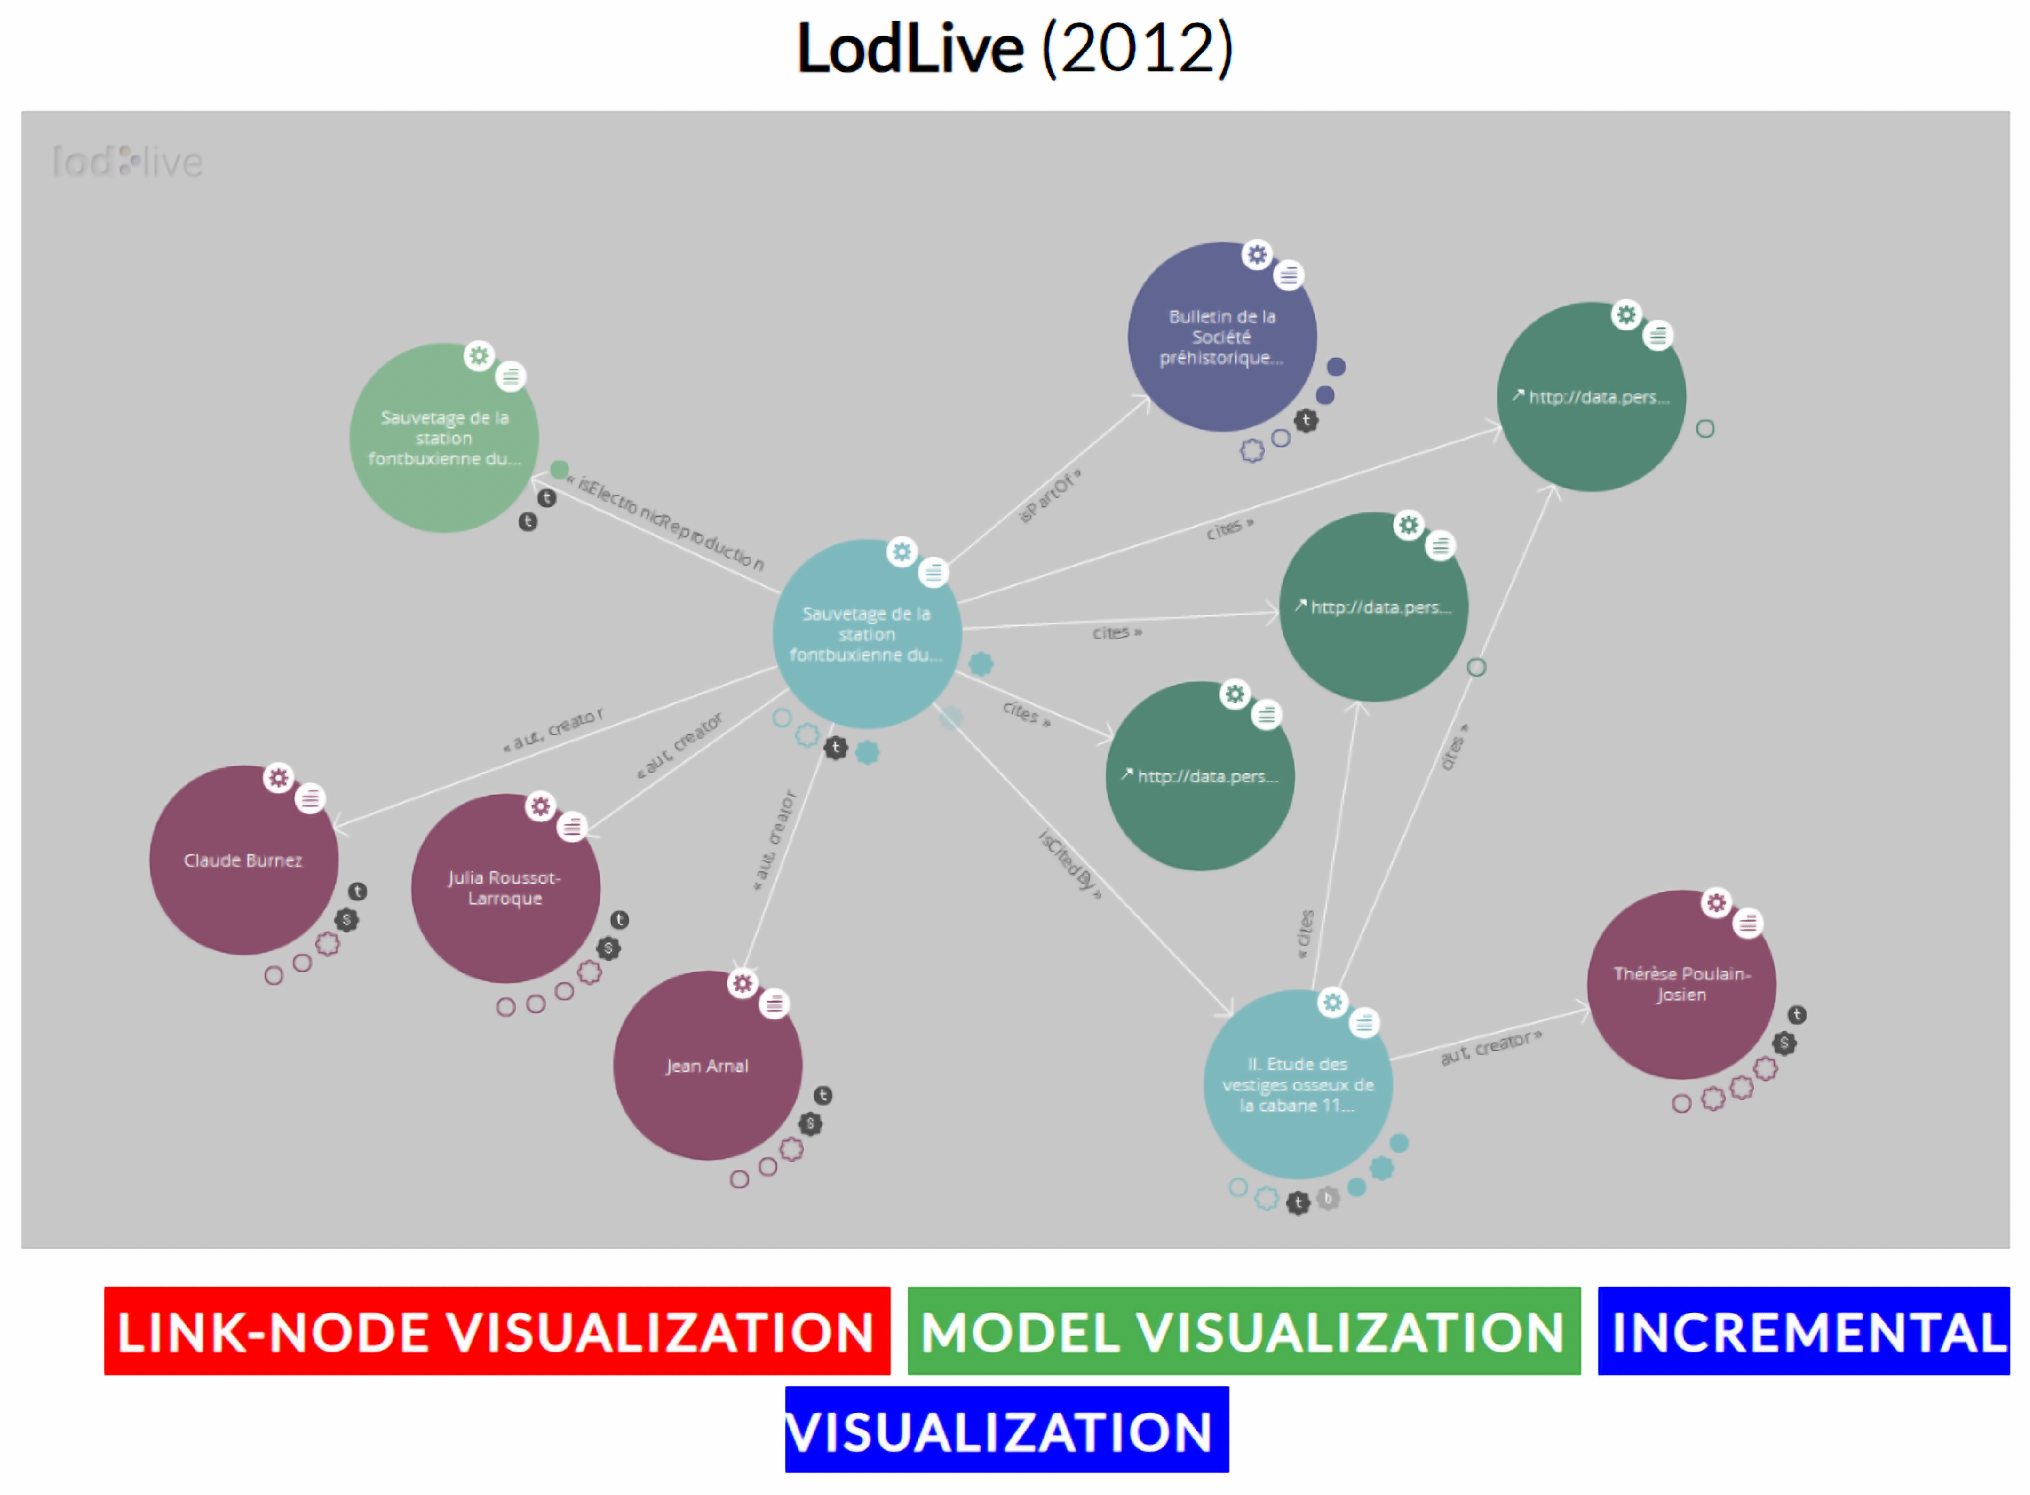
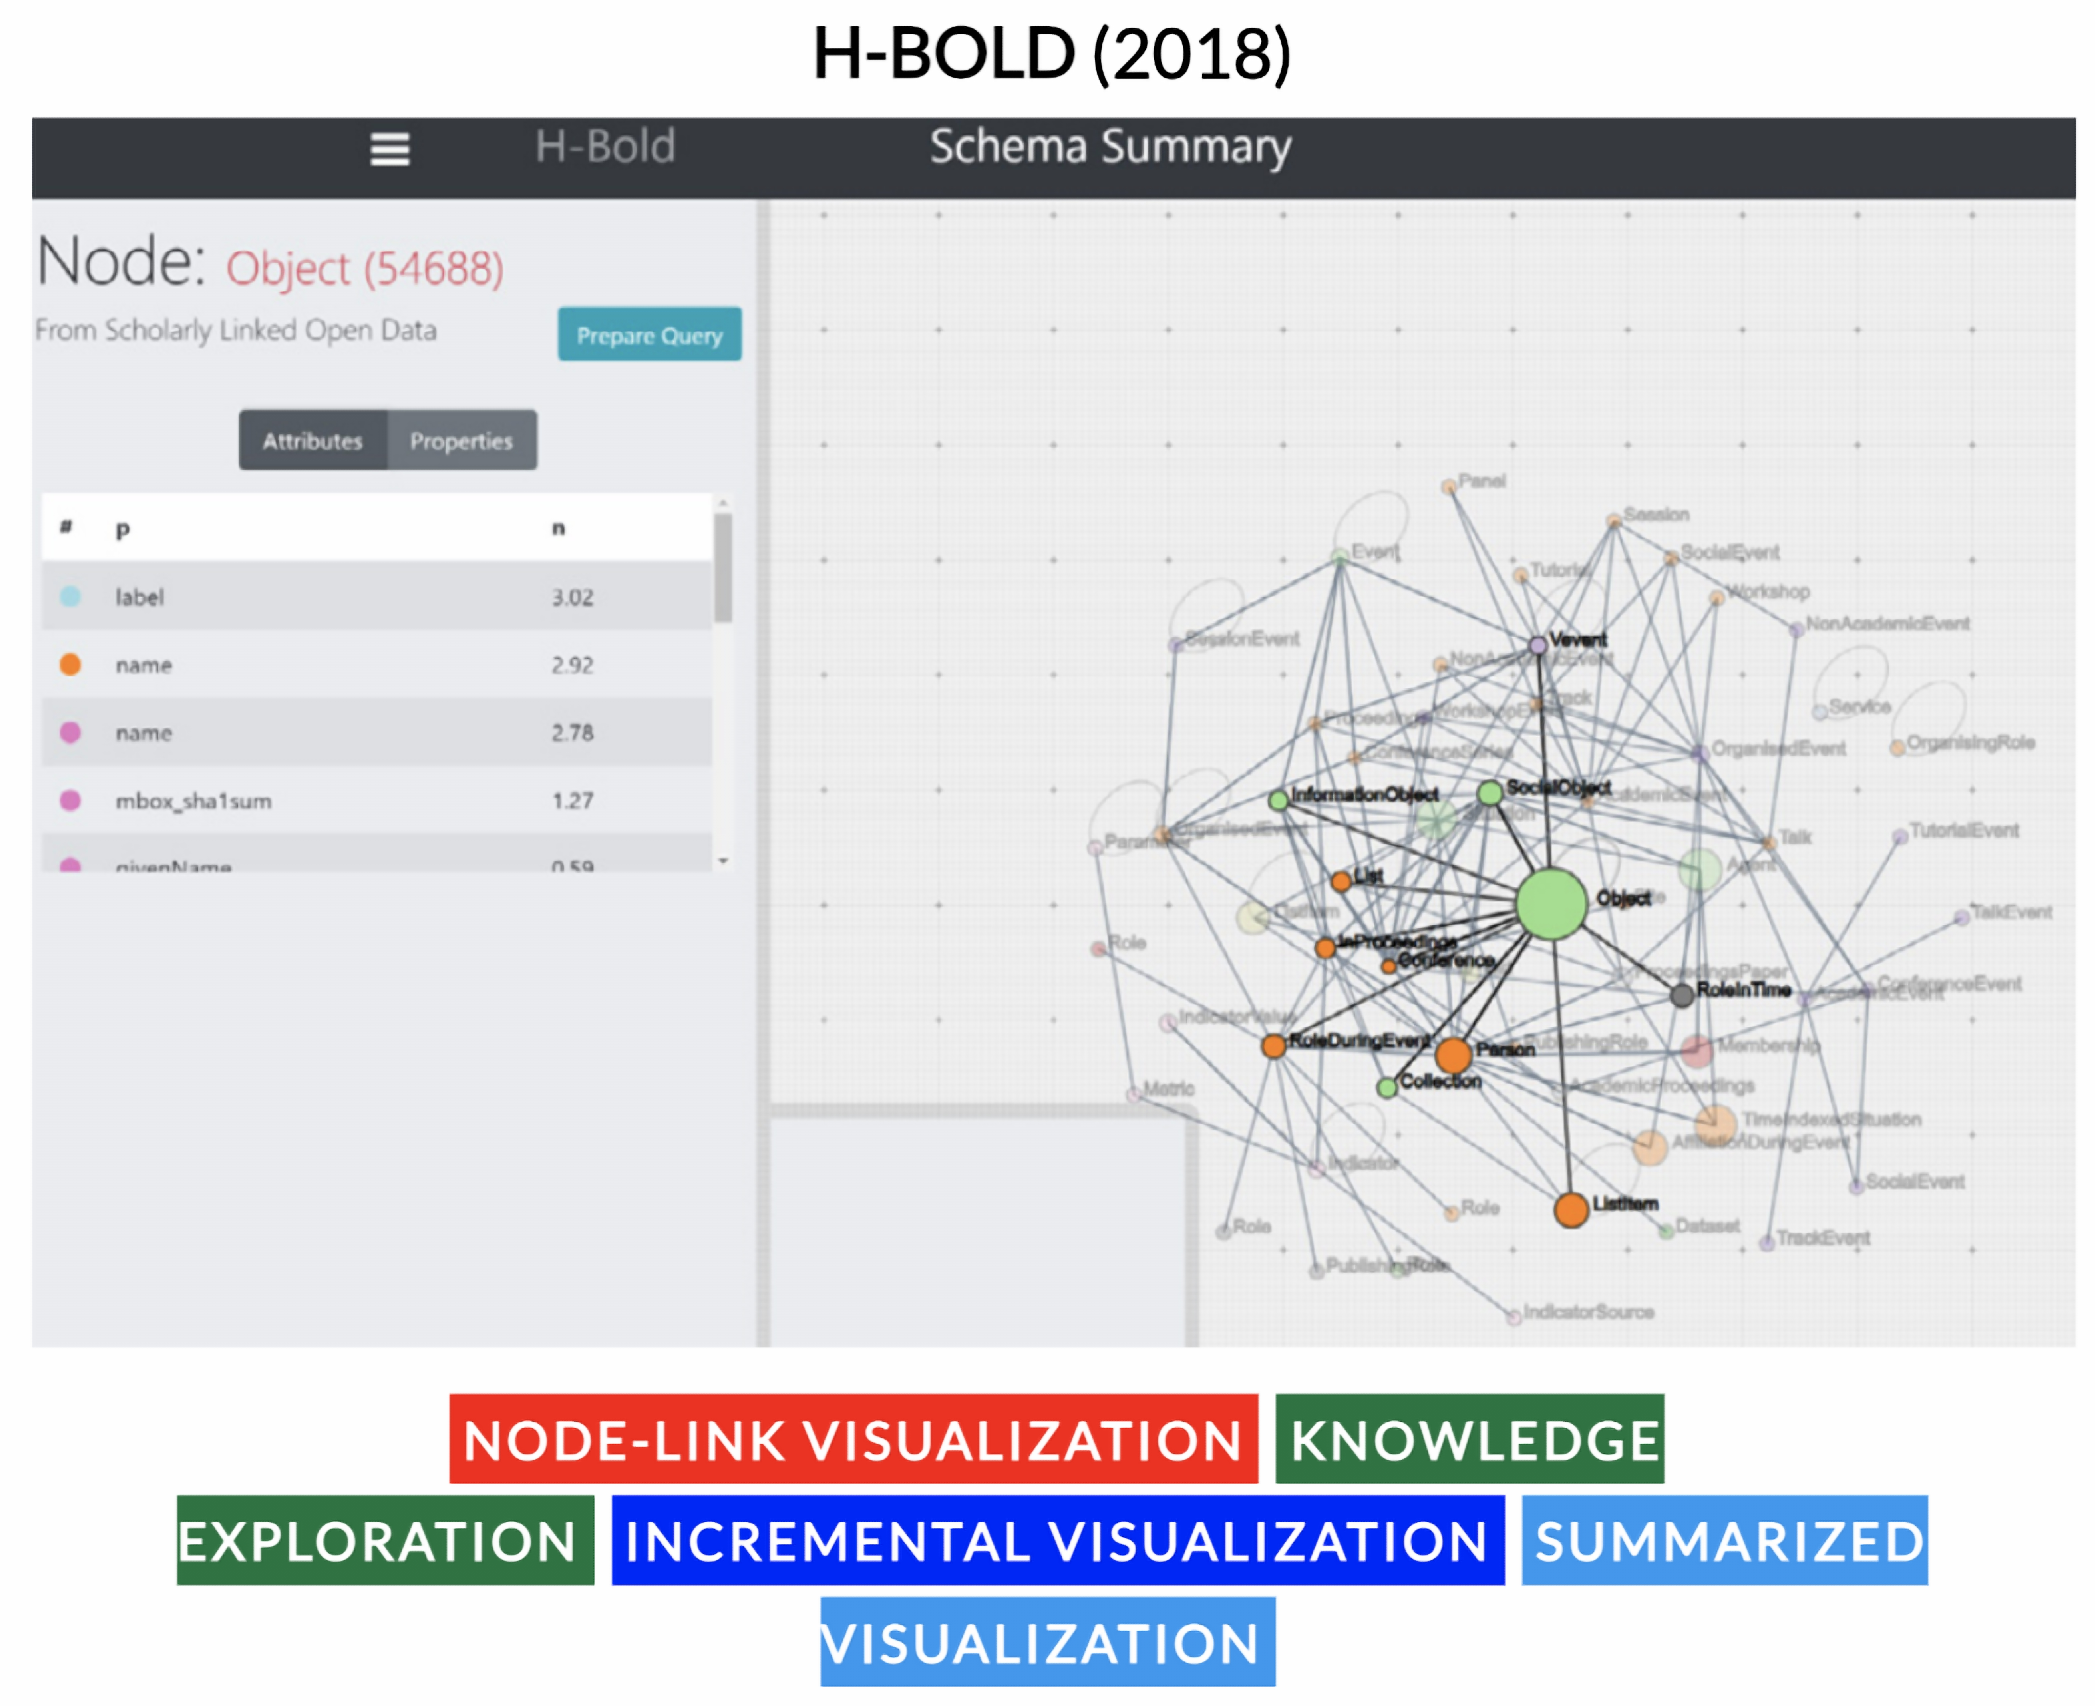
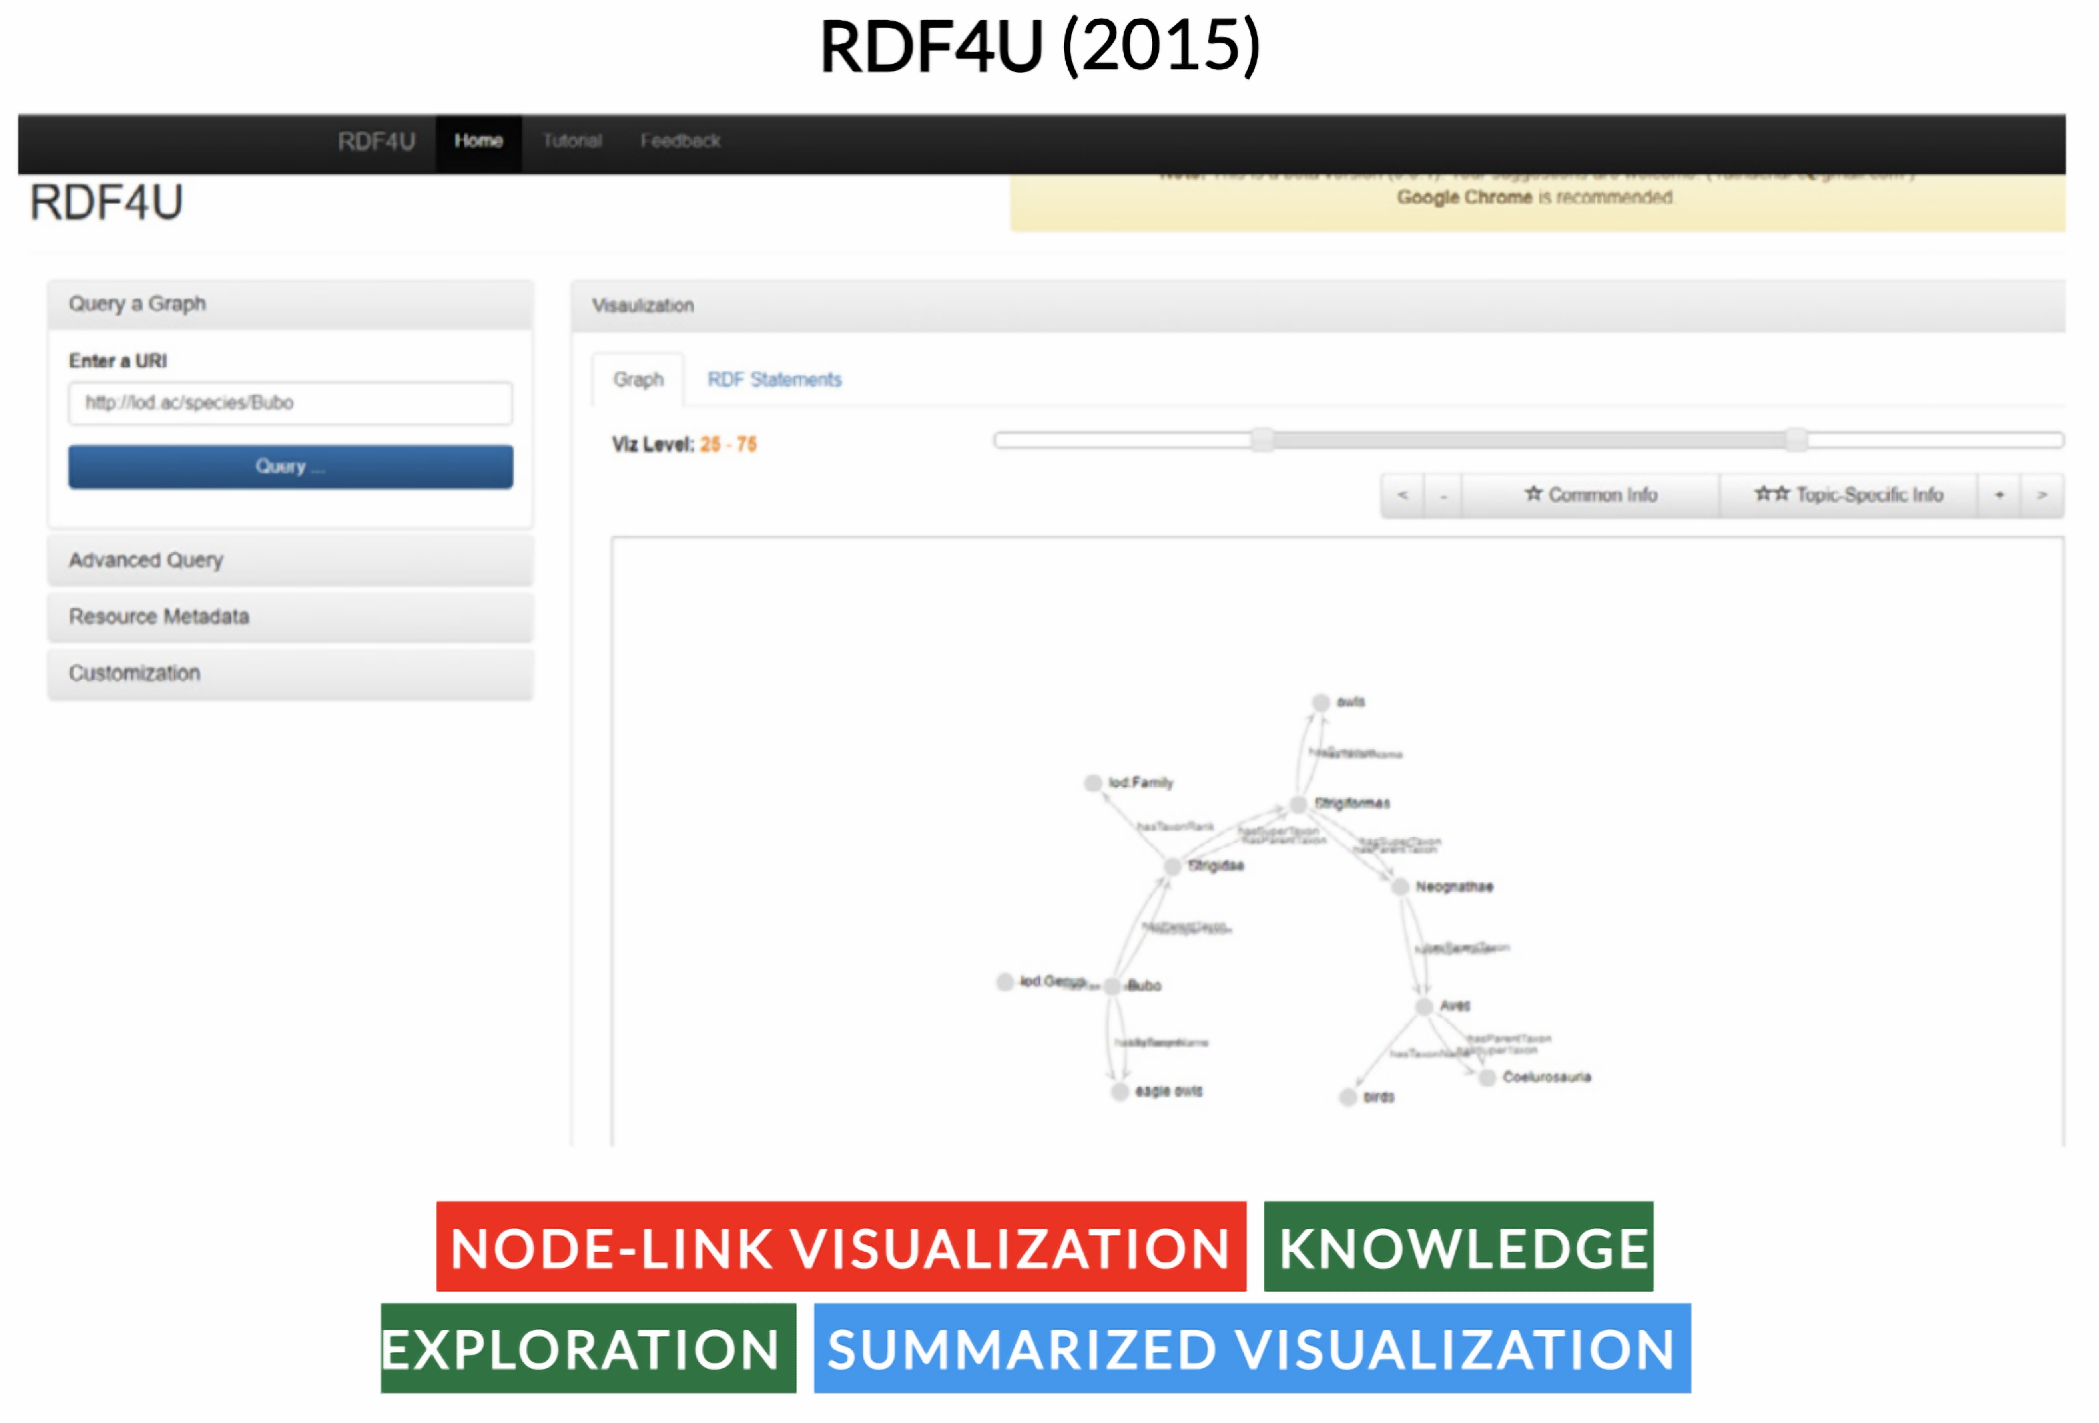
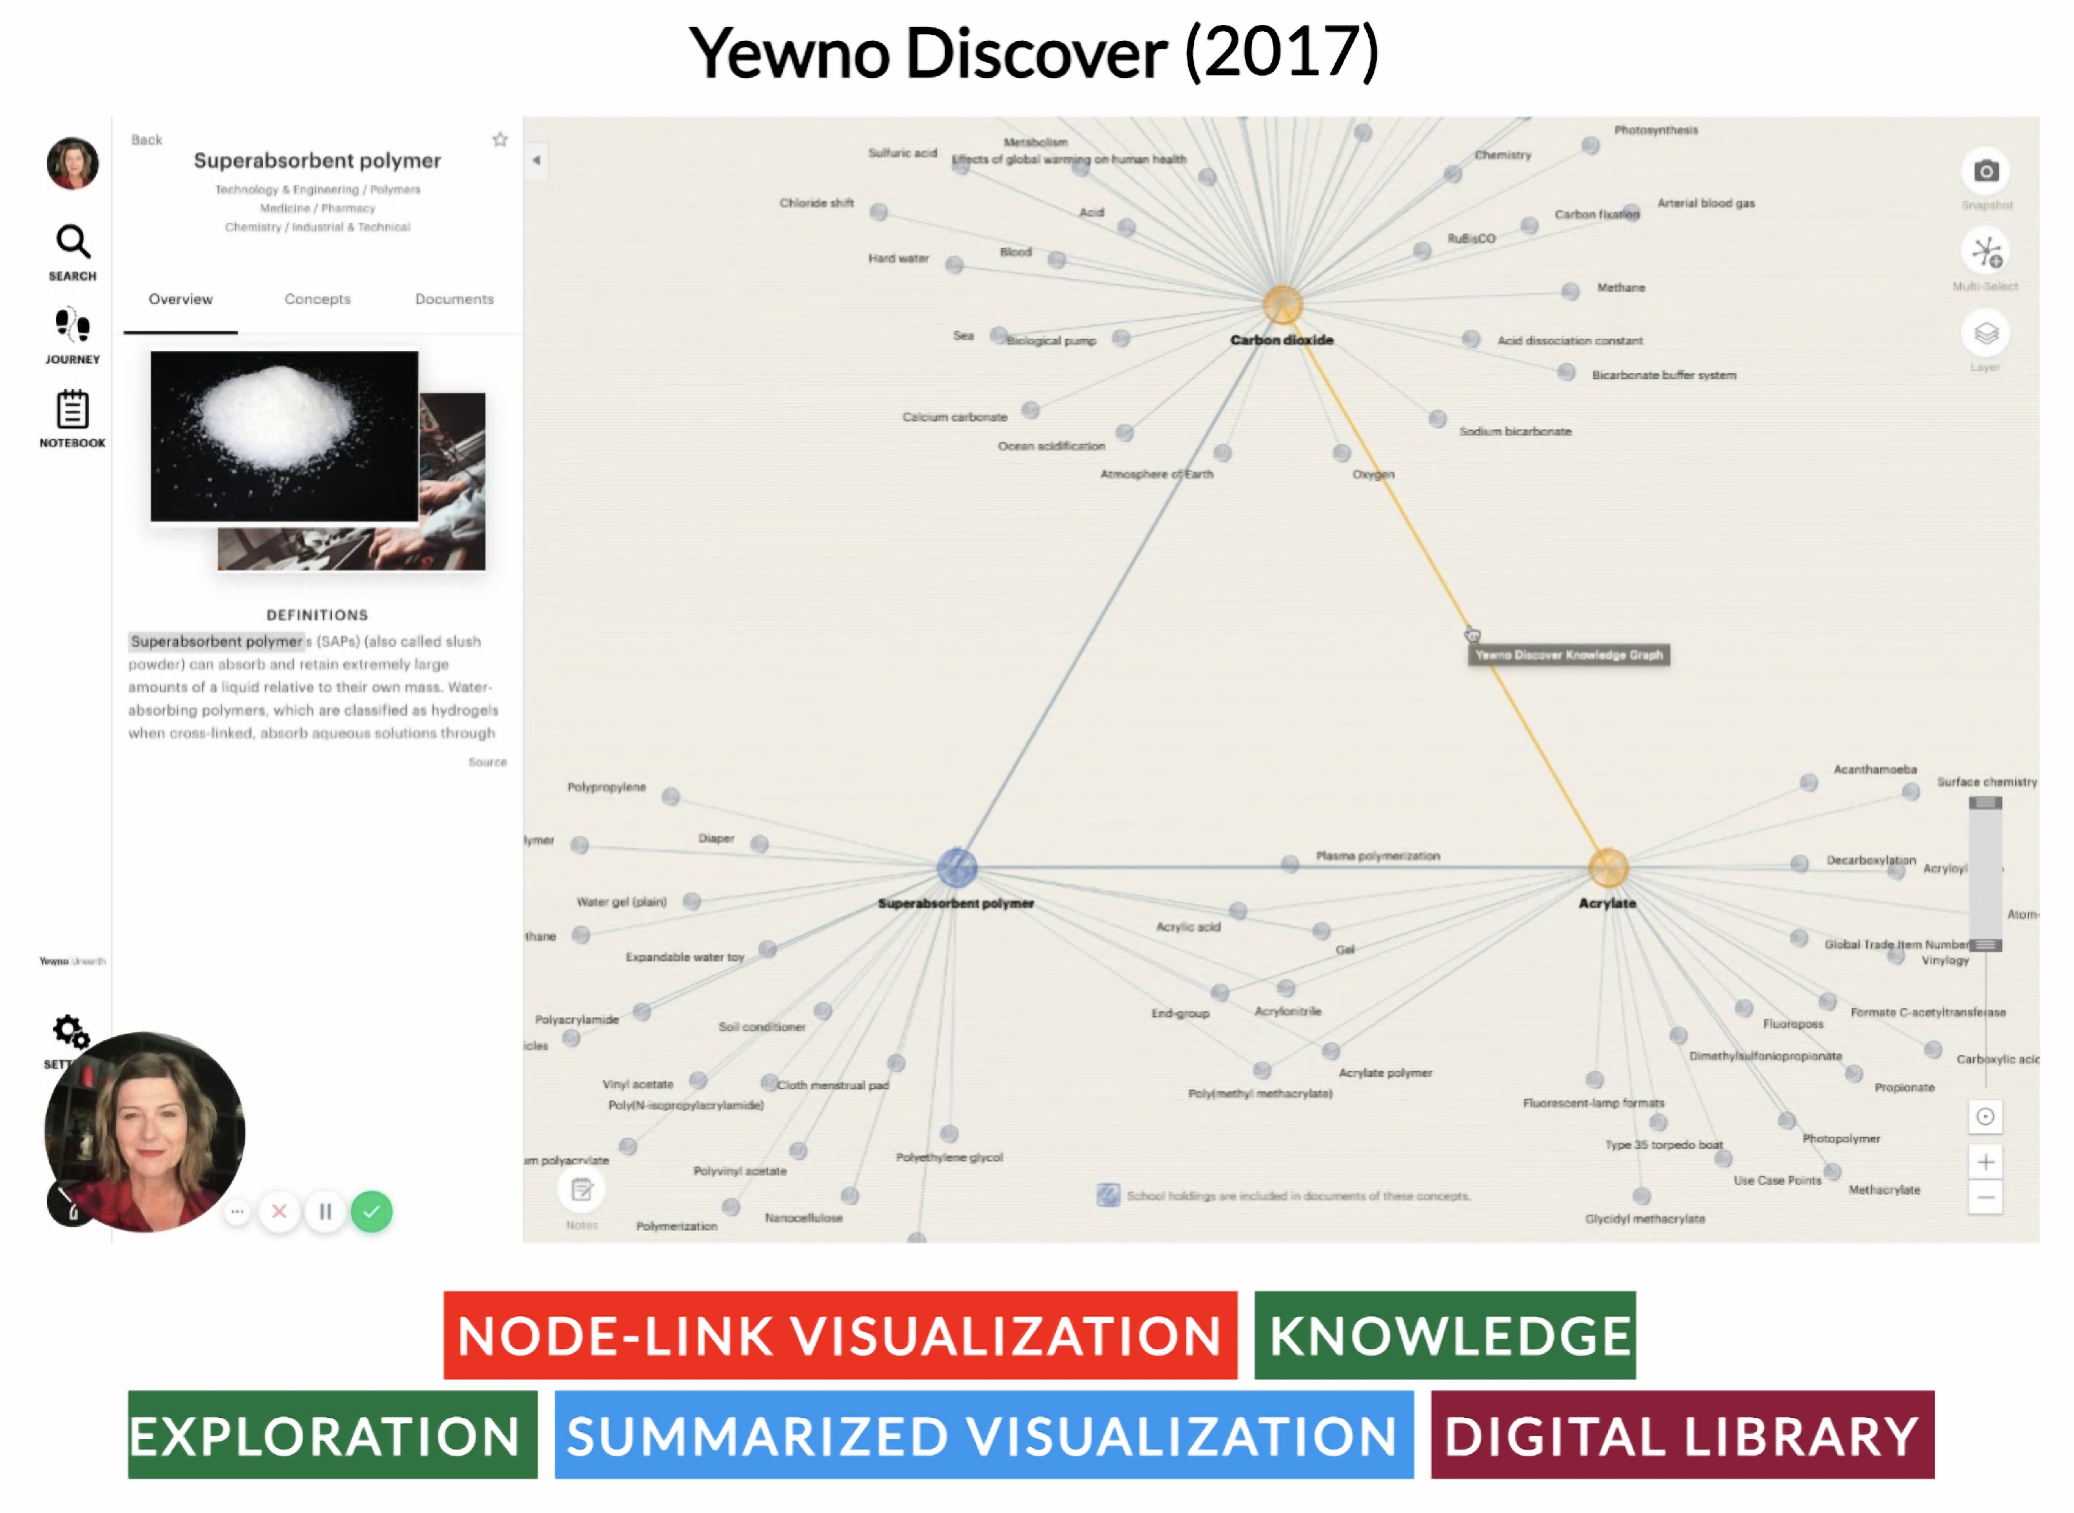
- Node-link:
- In the node-link paradigm, resources are represented by nodes or boxes, while triples are represented by arcs that connect the resources. The graph can be explored by moving from one resource to another using the relative arcs. The node-link view can be static or dynamic, with the latter allowing for interaction.
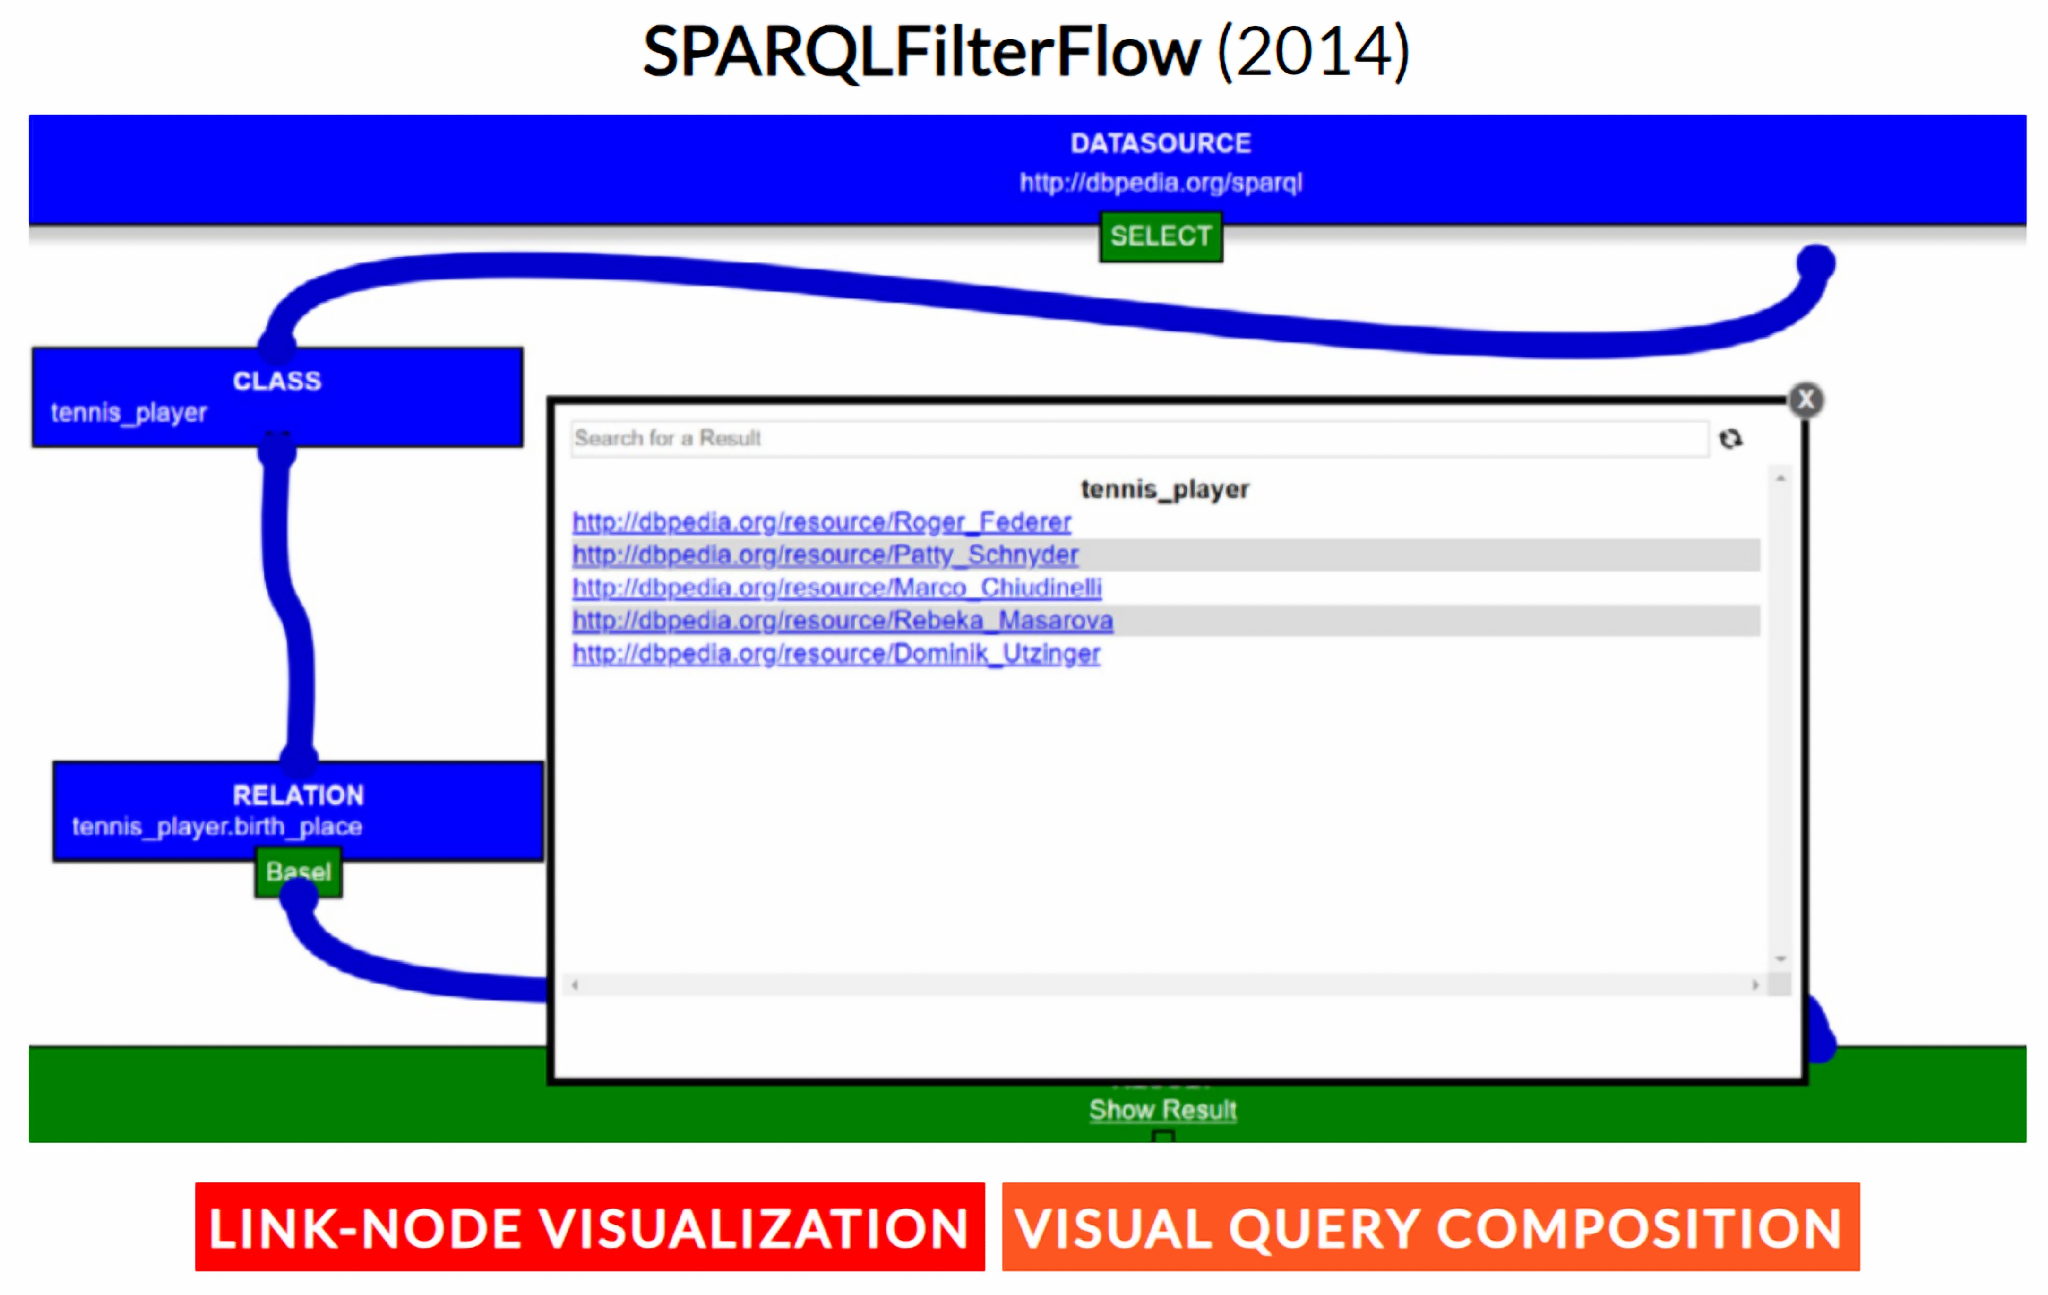
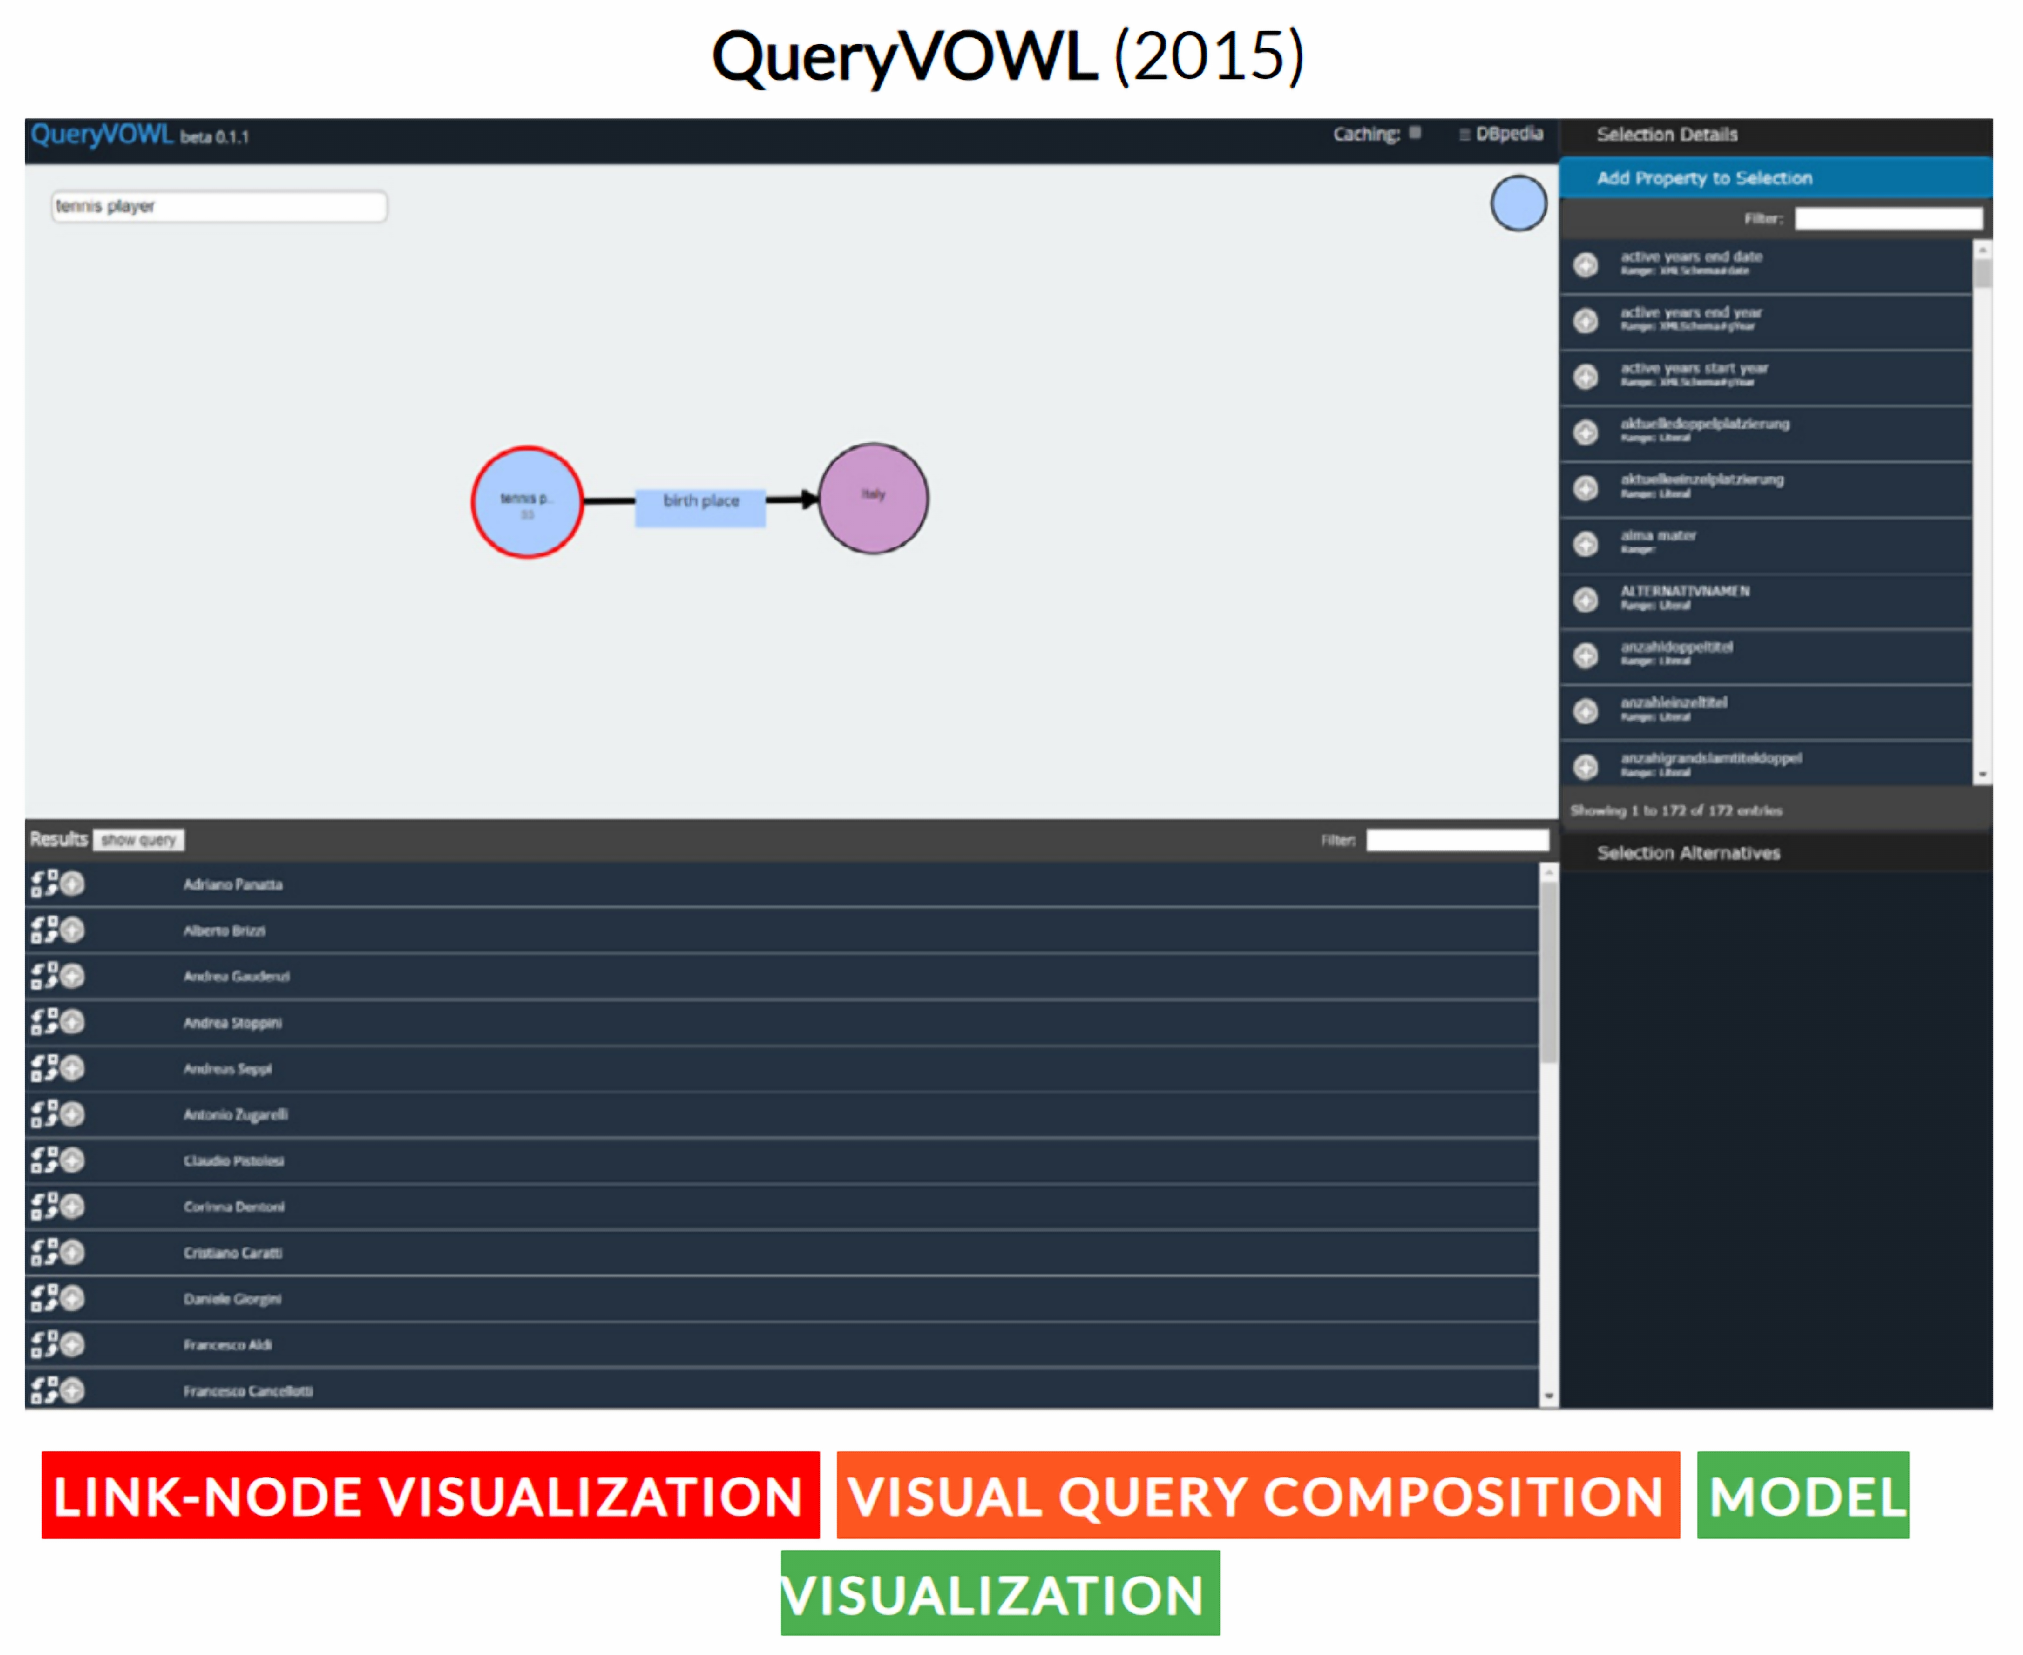
- Visual Query Composition:
- The visual query paradigm encompasses user interfaces that empower users to execute sophisticated queries without requiring expertise in the RDF model or the SPARQL language.
4.1.1. Tabular Visualization Tools
4.1.2. Node-Link Visualization Tools
4.1.3. Visual Query Composition
4.2. By Type of Information
4.2.1. Data Visualization
4.2.2. Model Visualization
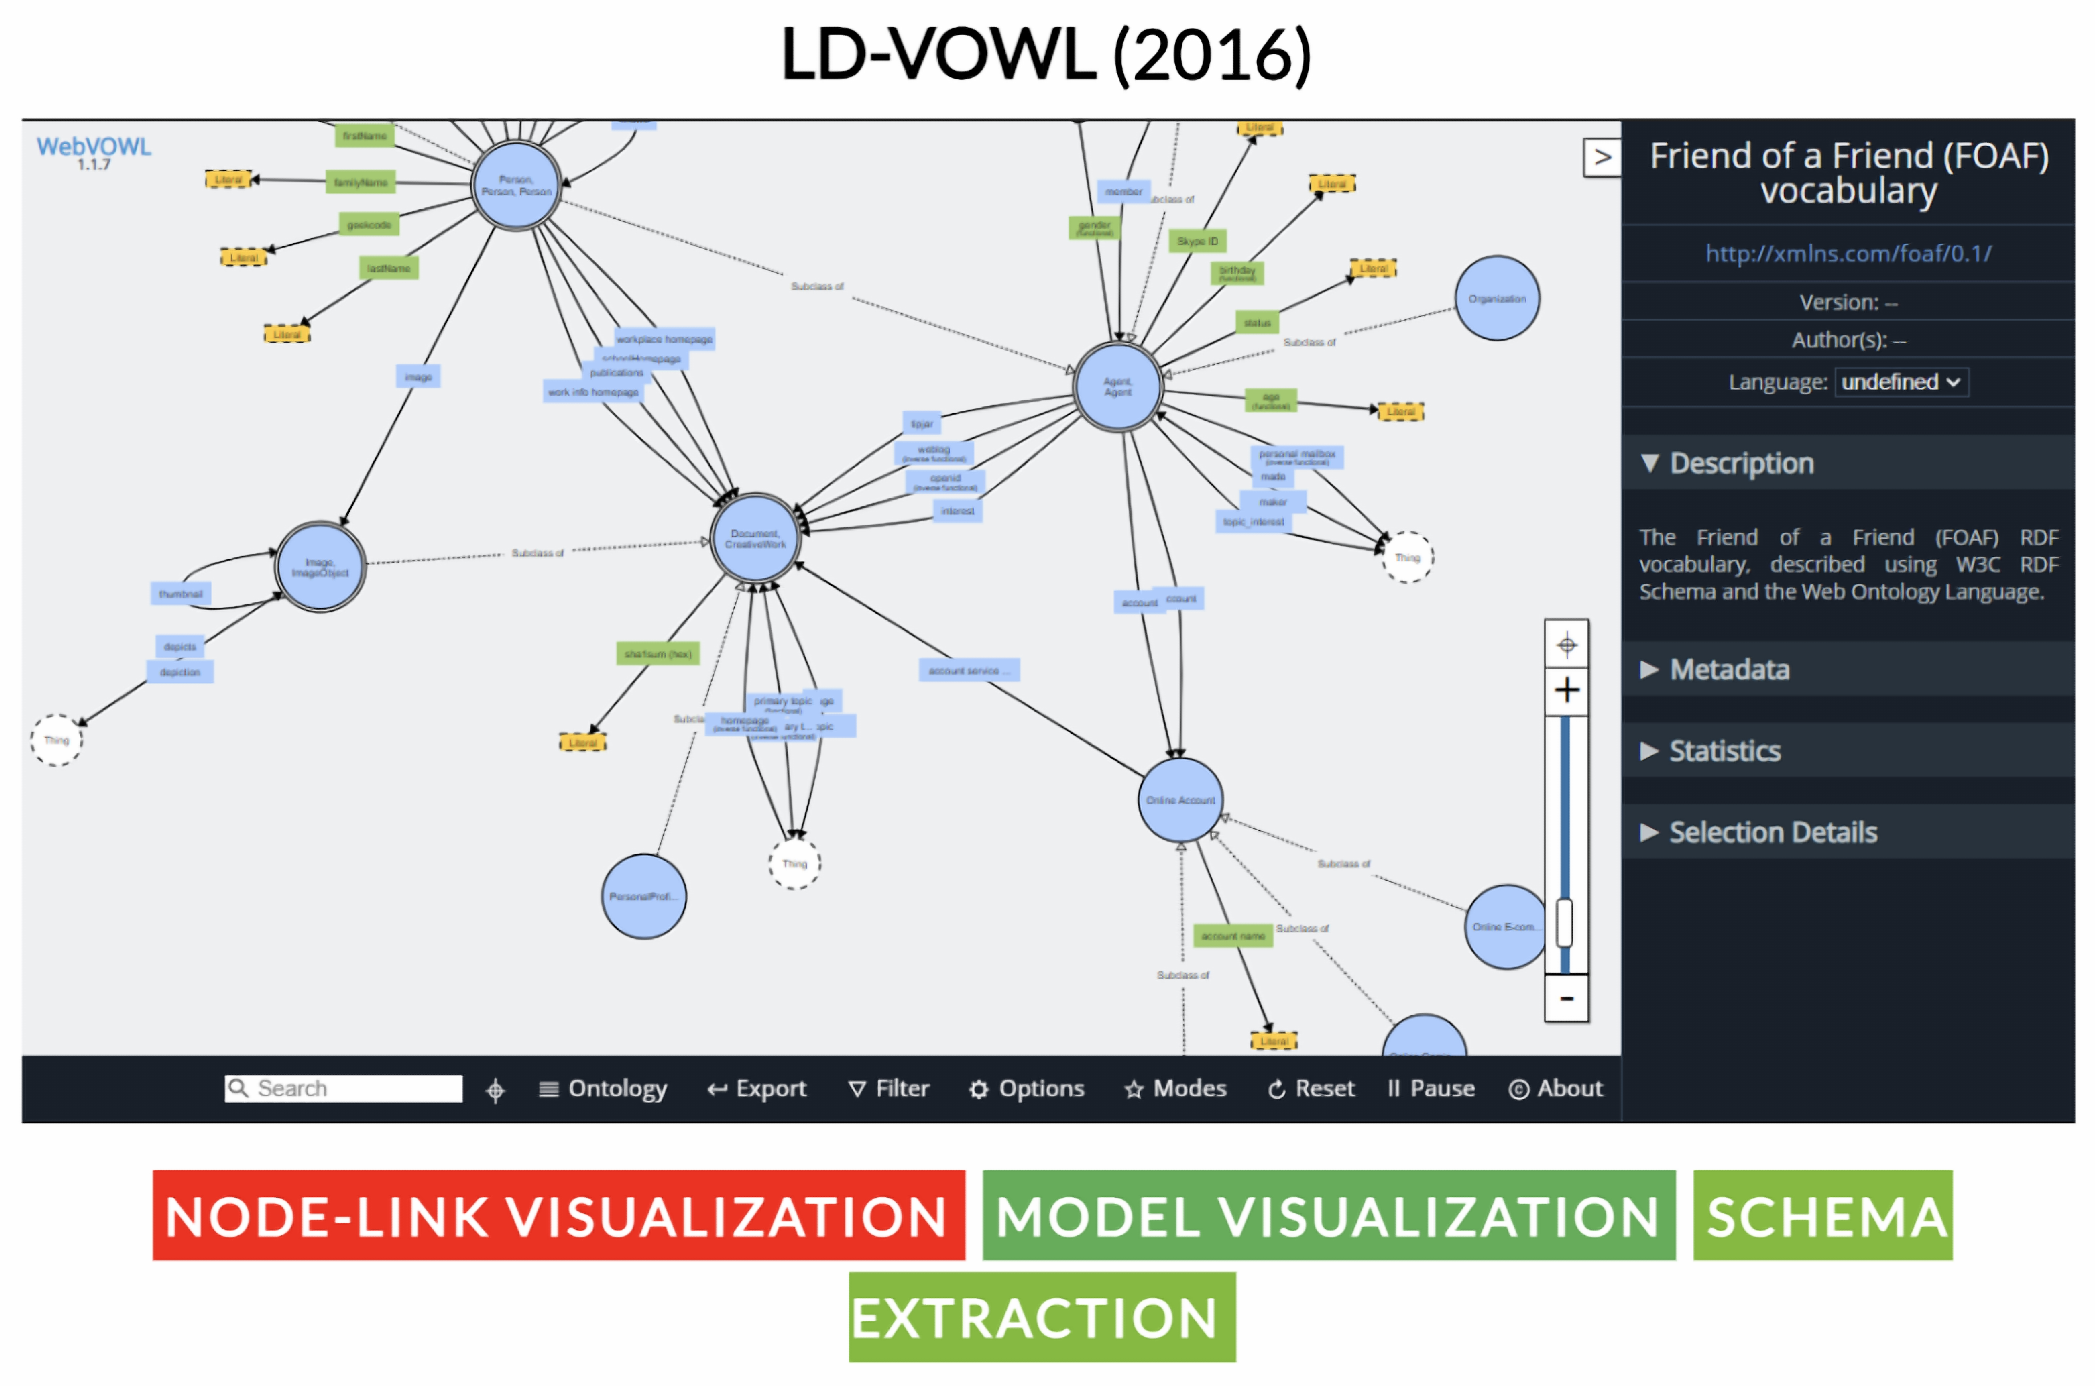
4.2.3. Data to Model Visualization (Schema Extraction)
4.3. Complexity Reduction Strategies
- Navigational visualization. This strategy centers around a particular data object, typically a resource, and facilitates exploration of its immediate surroundings or “neighborhood”. Users can navigate to directly related resources, making it a common choice in tabular interaction paradigms.
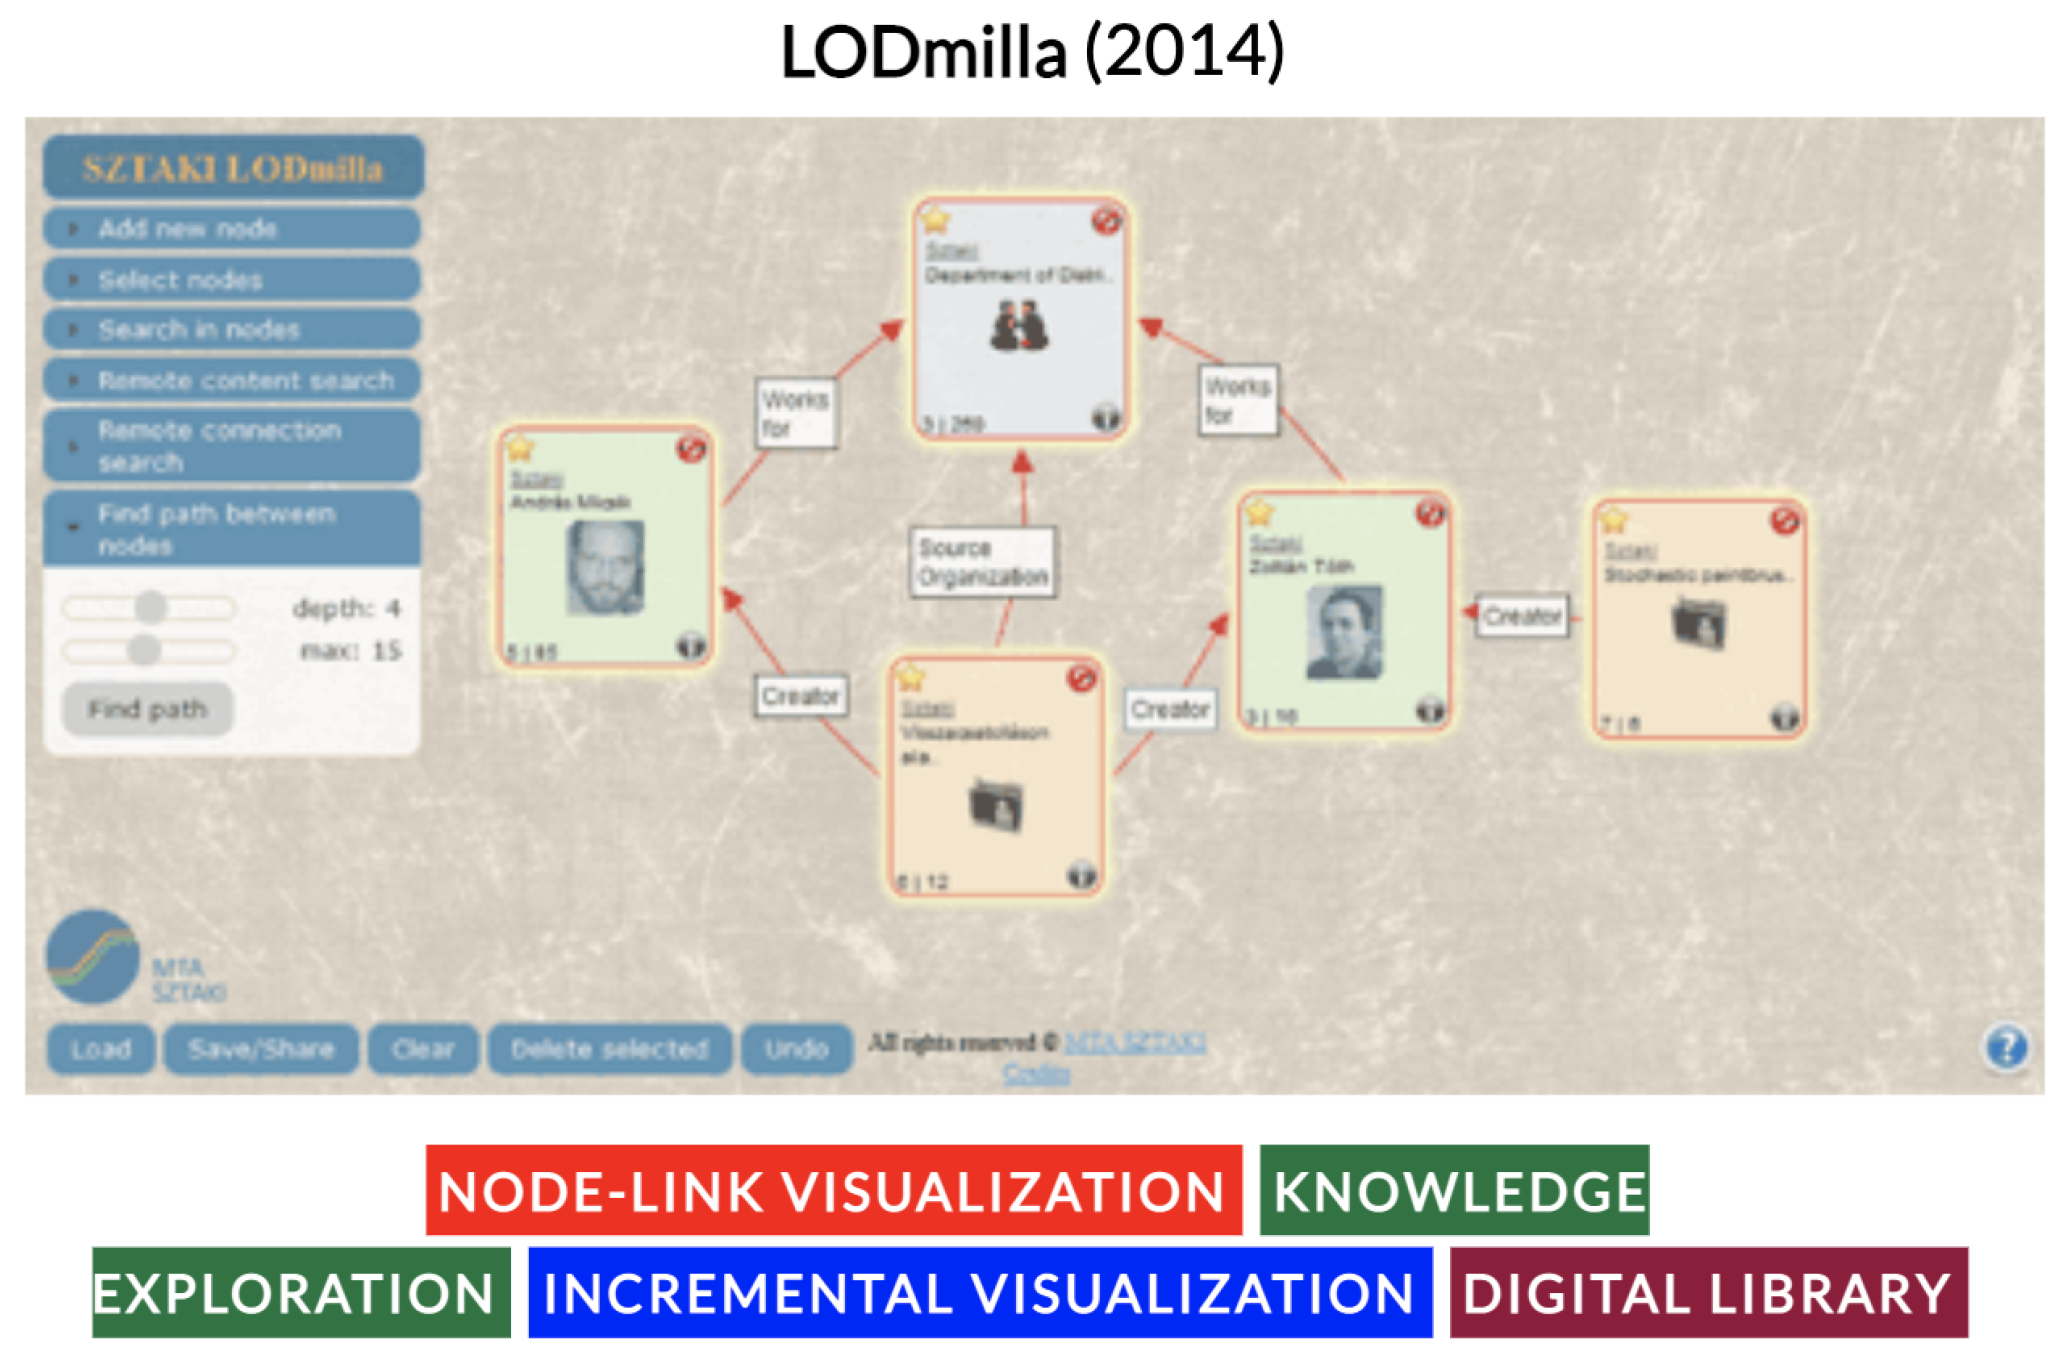
- Incremental visualization: The incremental visualization paradigm is often employed in dynamic node-link user interfaces. Users have control over a workspace where they can add or remove views of specific data objects from the dataset as needed. Shortcuts are often available to visualize data objects related to the ones already in view.
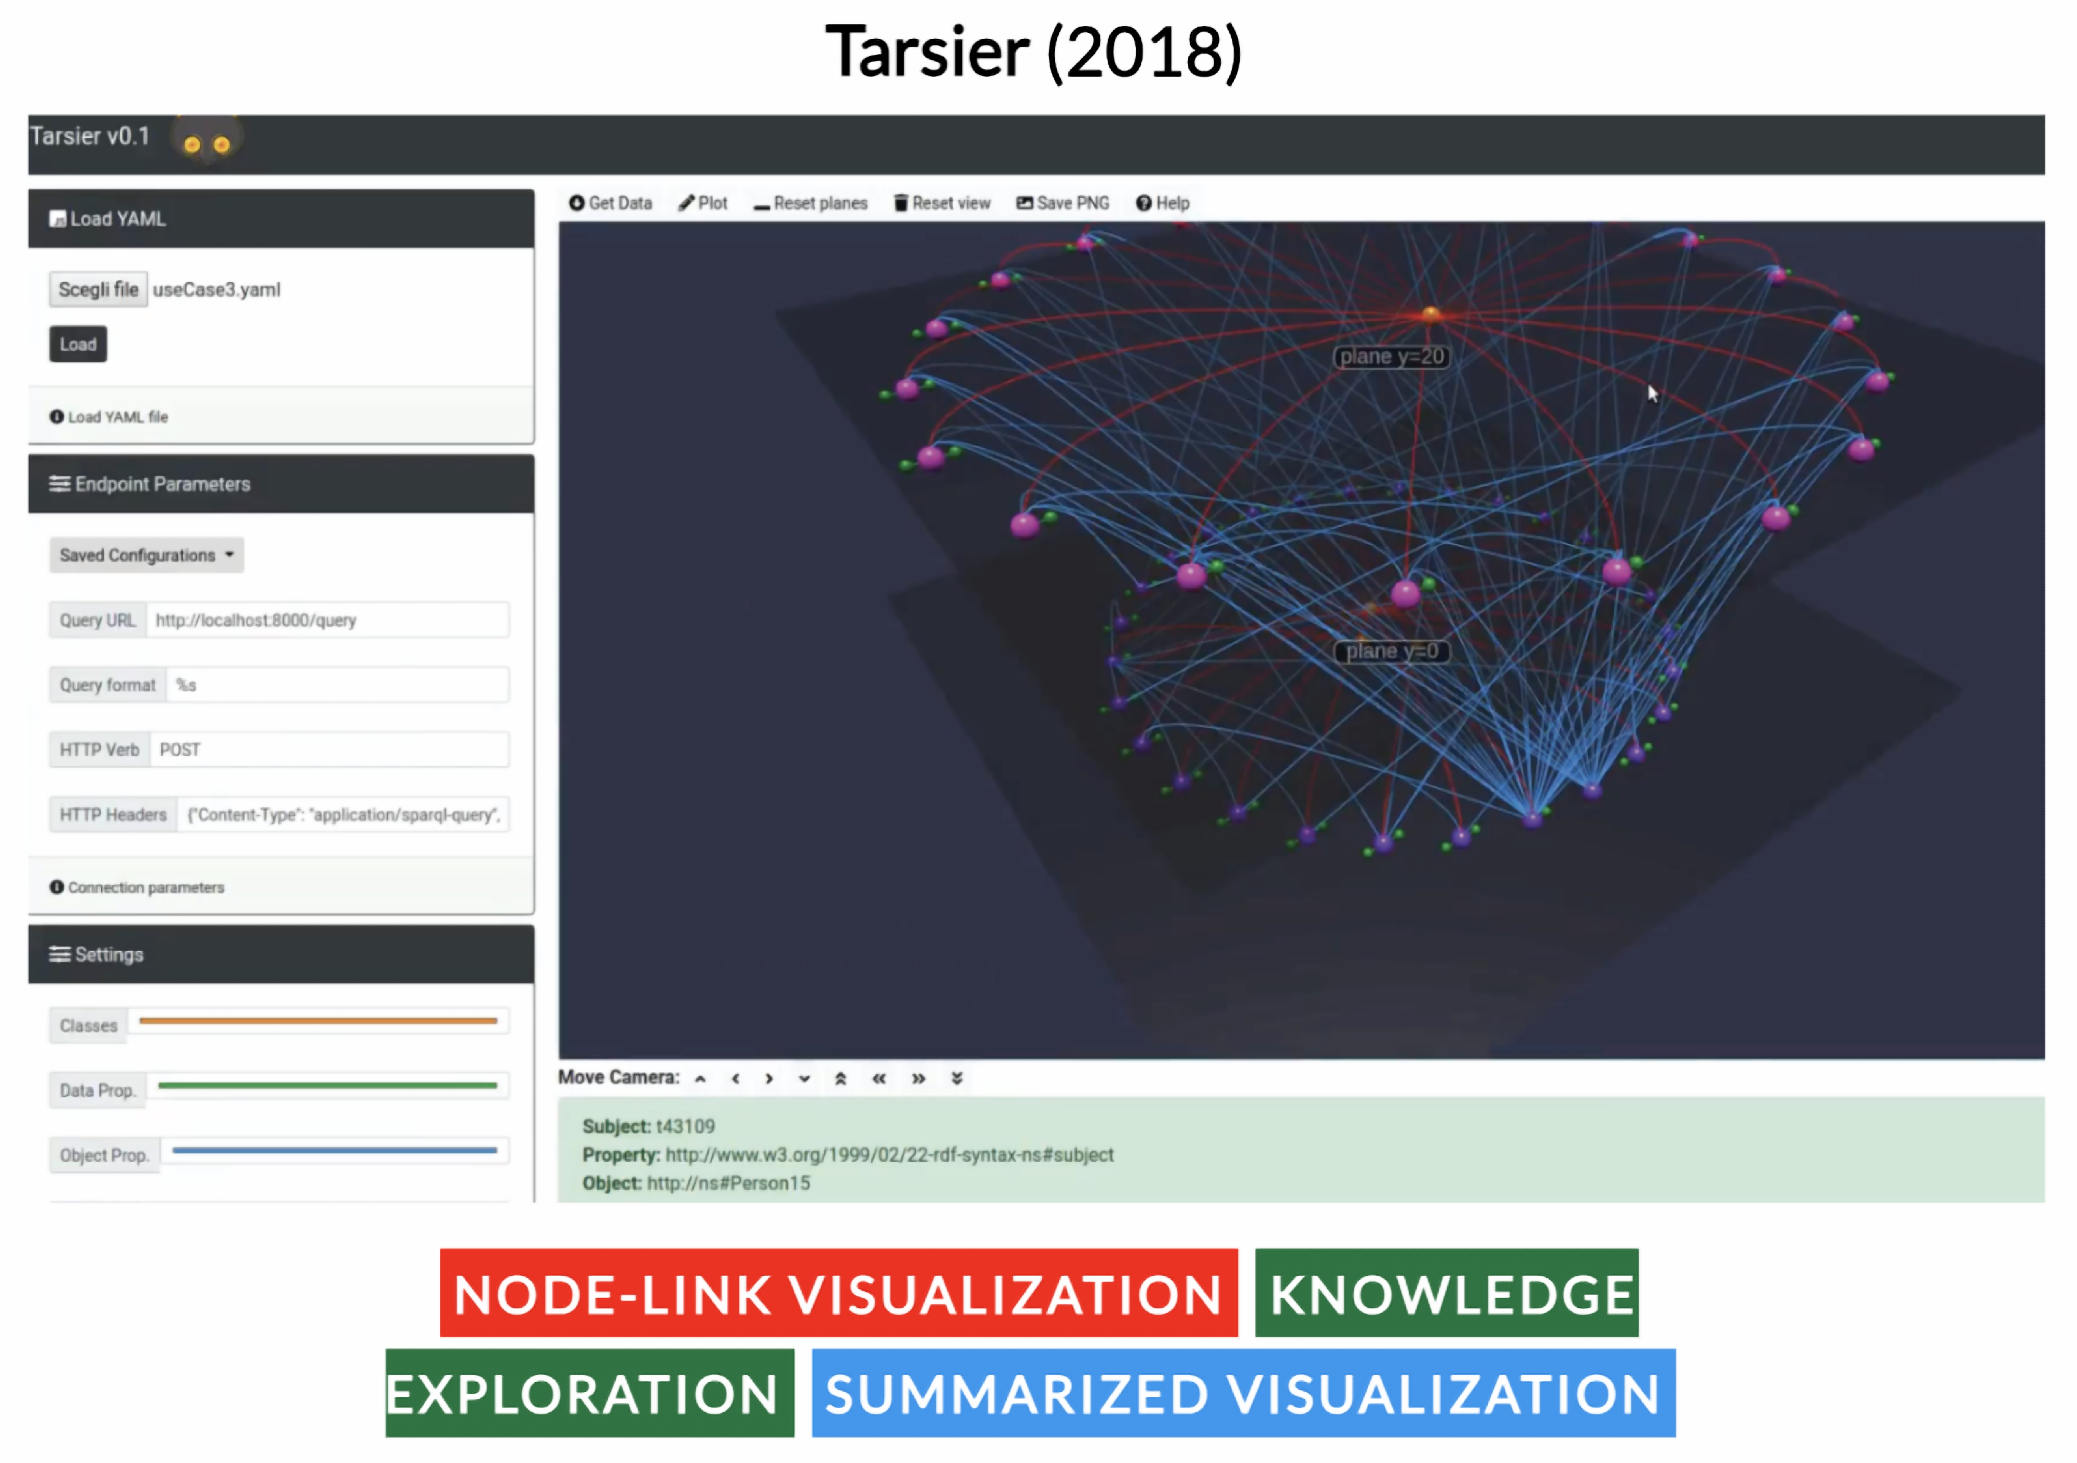
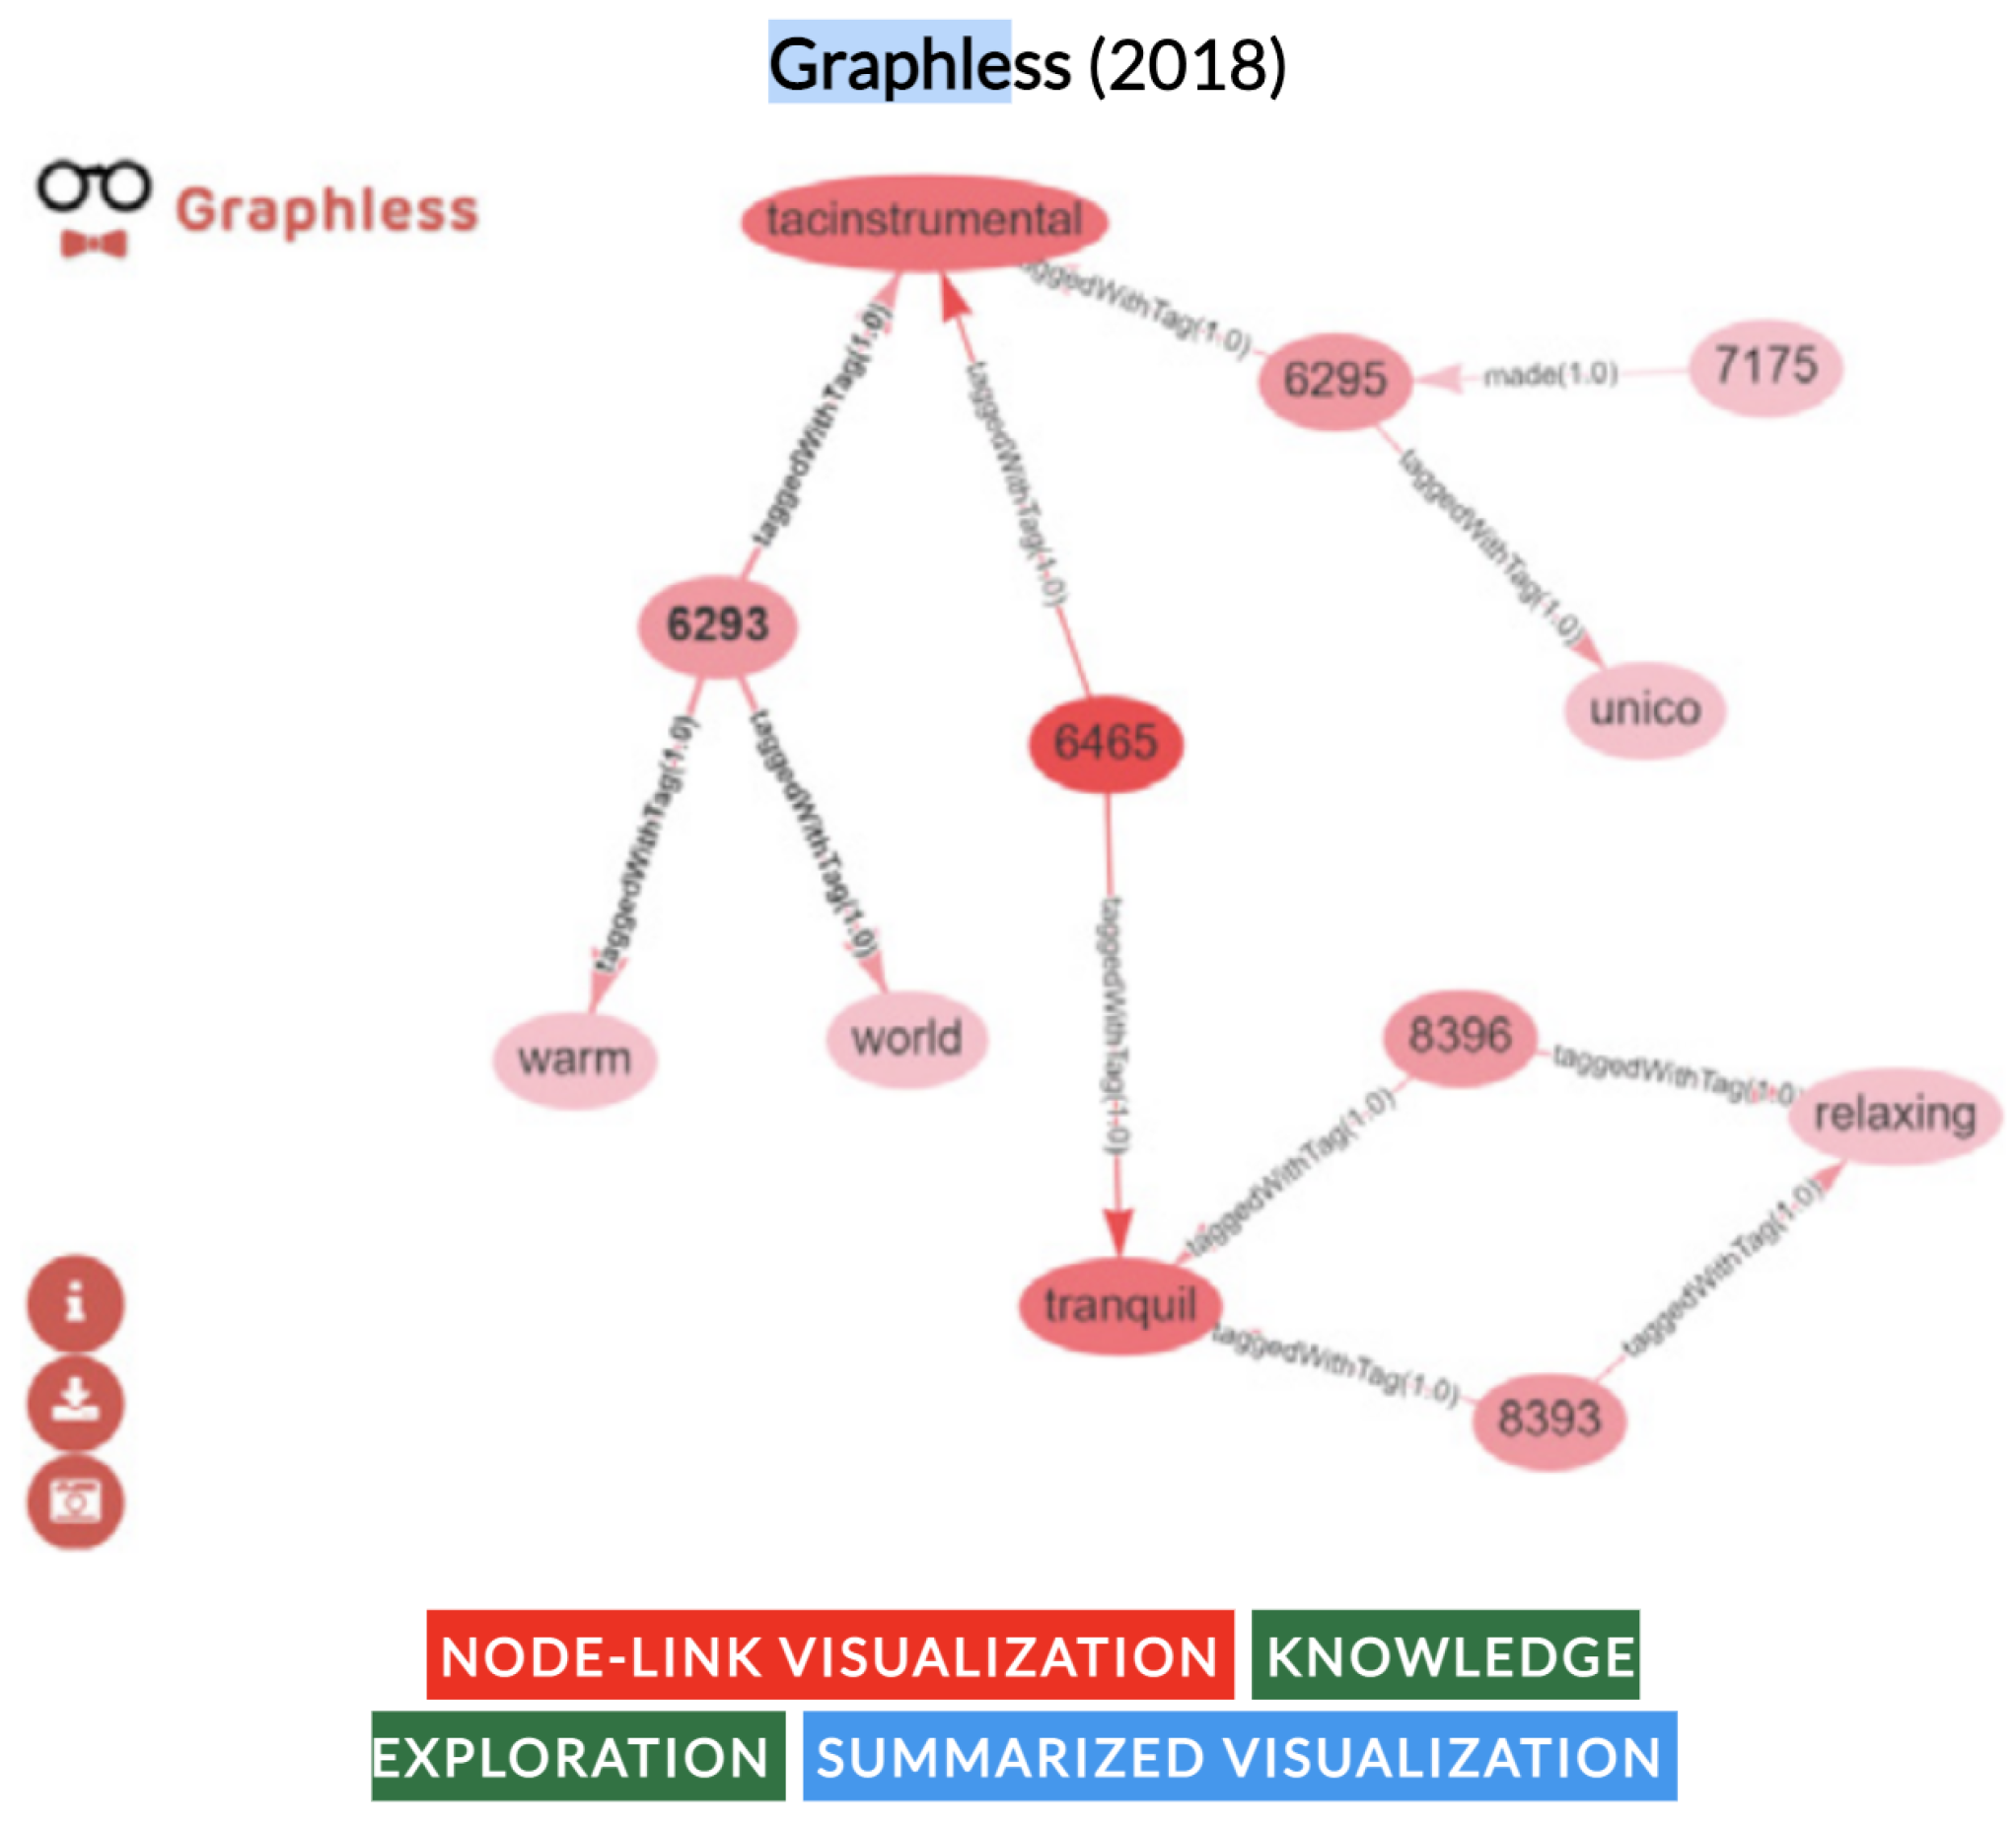
- Summarized Visualization: Some tools use data reduction techniques to generate graph summaries, providing an overview of a dataset while avoiding the issue of overplotting in large graph visualizations.
4.3.1. Navigational Visualization
- Customized relevance ranking based on individual preferences.
- Personalized search recommendations tailored to each user.
4.3.2. Incremental Visualization
4.3.3. Summarized Visualization
5. Semantic Annotations
- manual;
- automatic;
- semi-automatic.
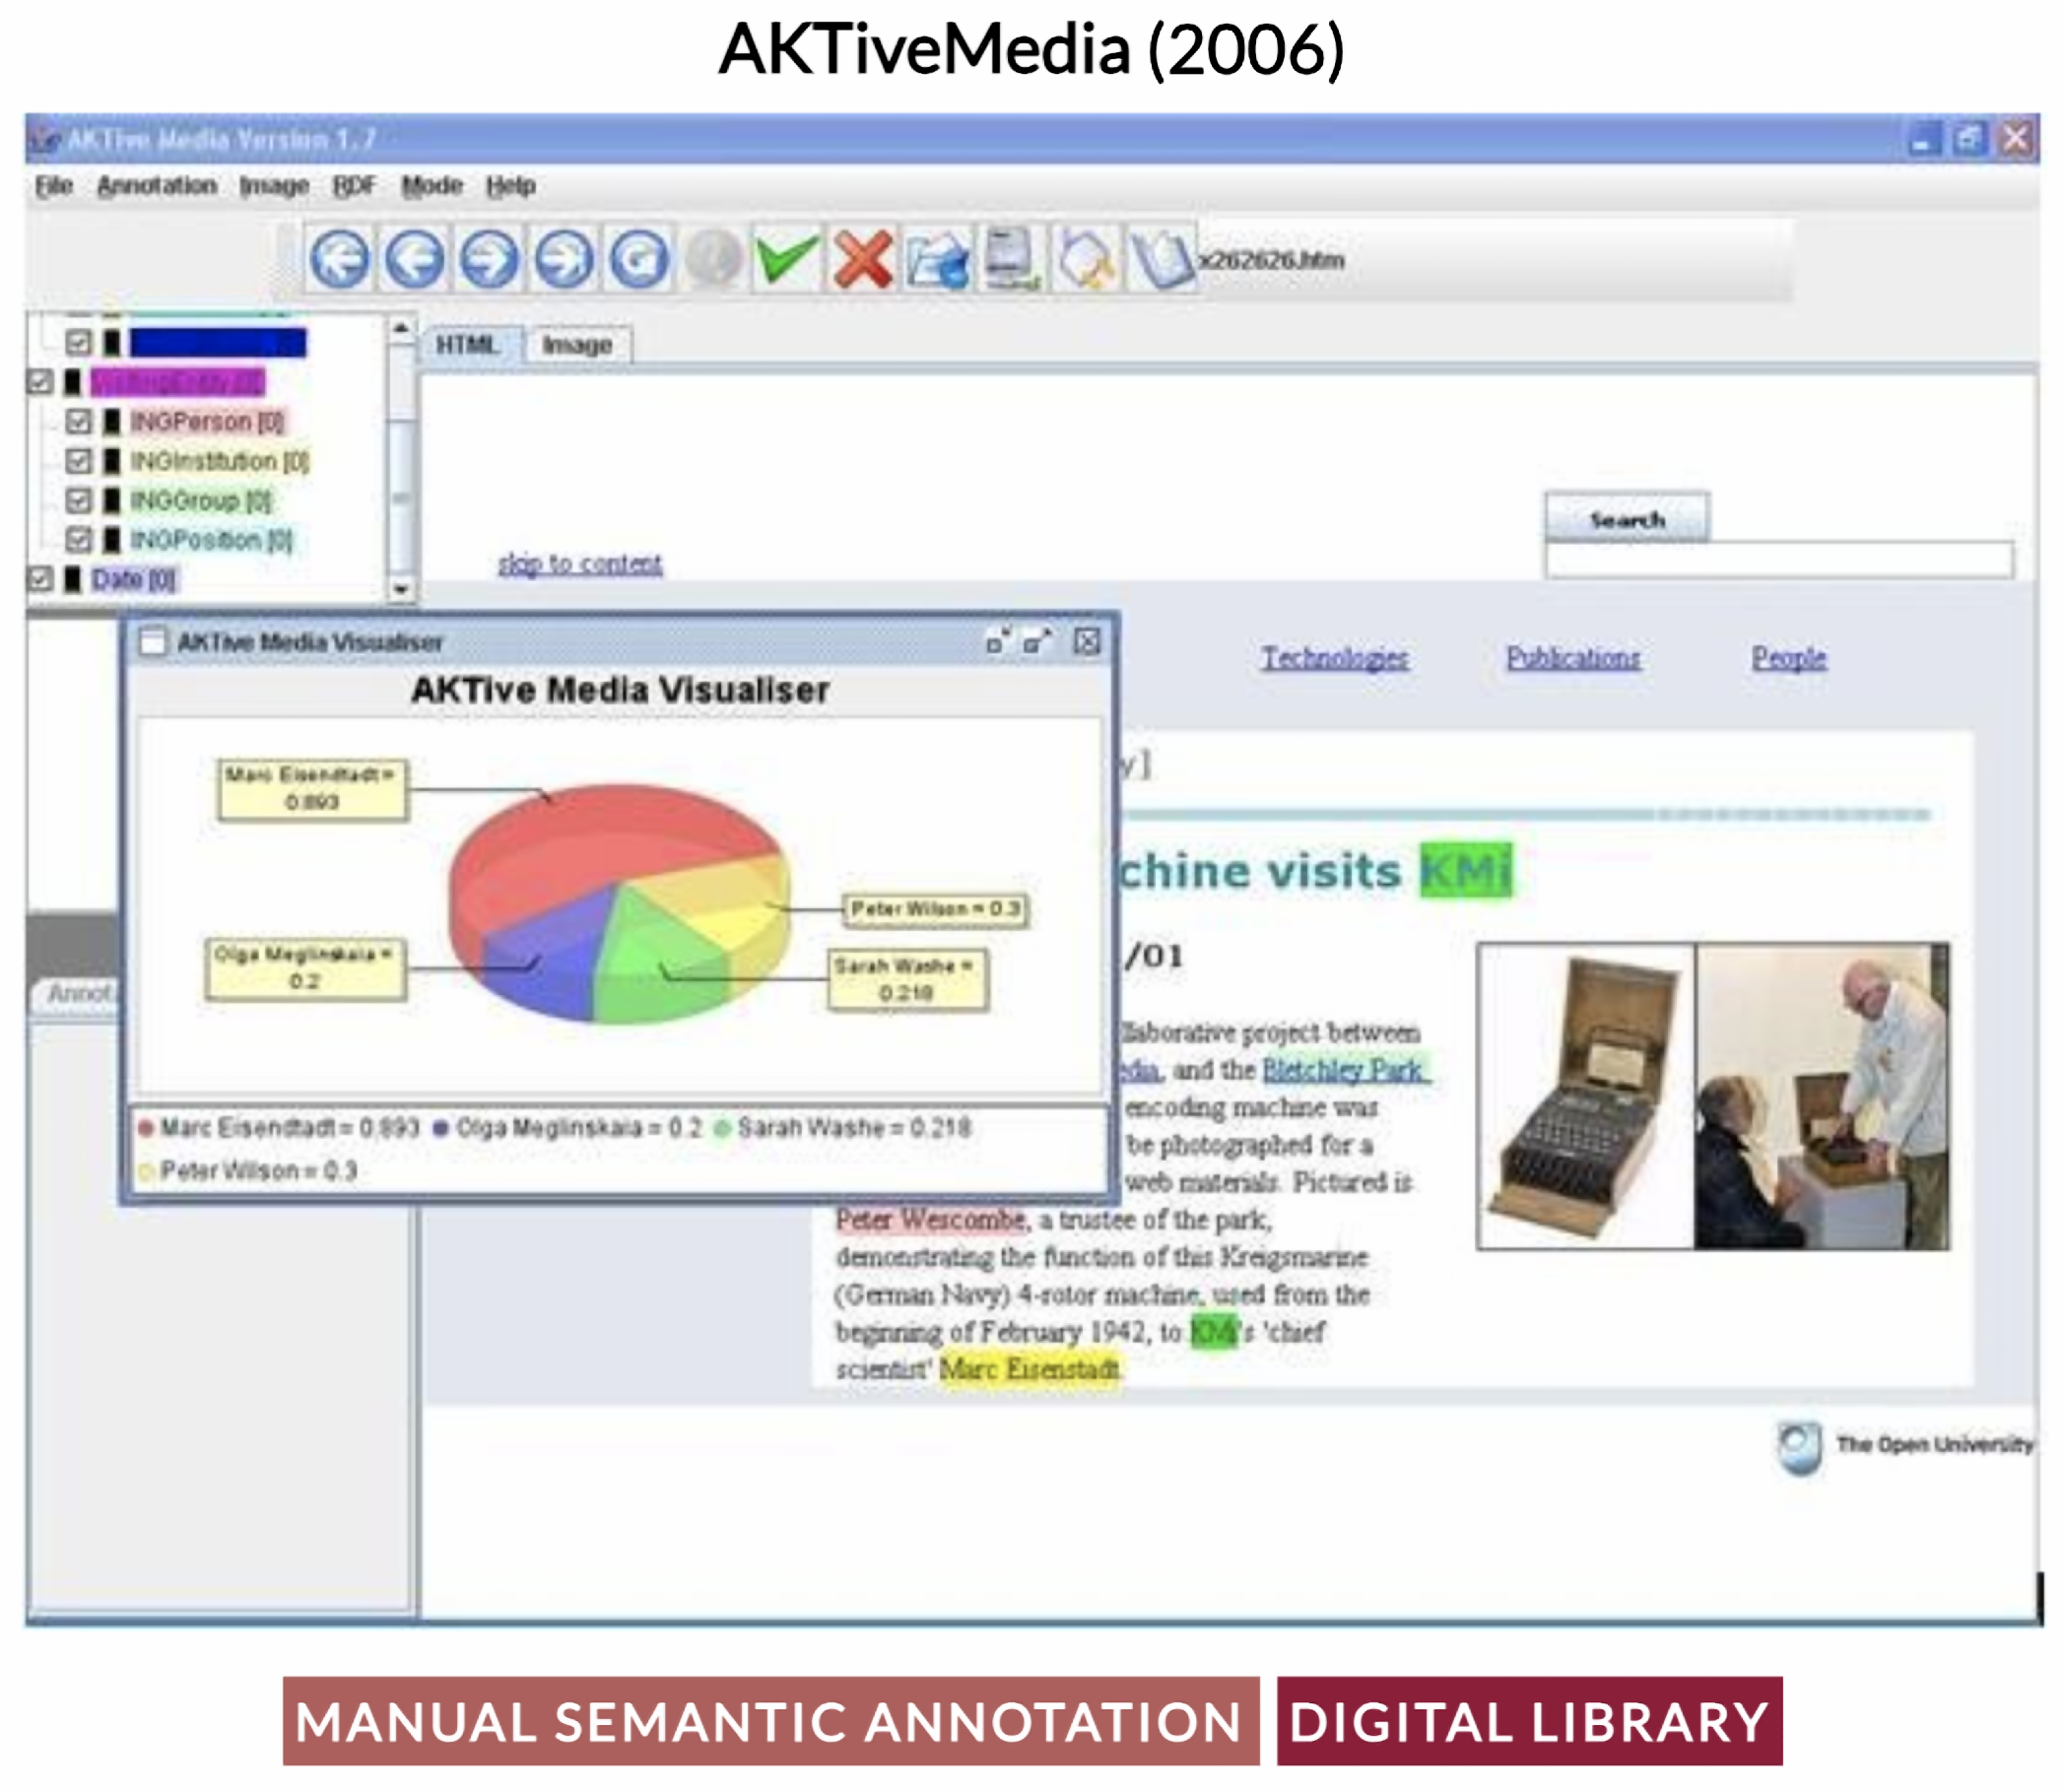
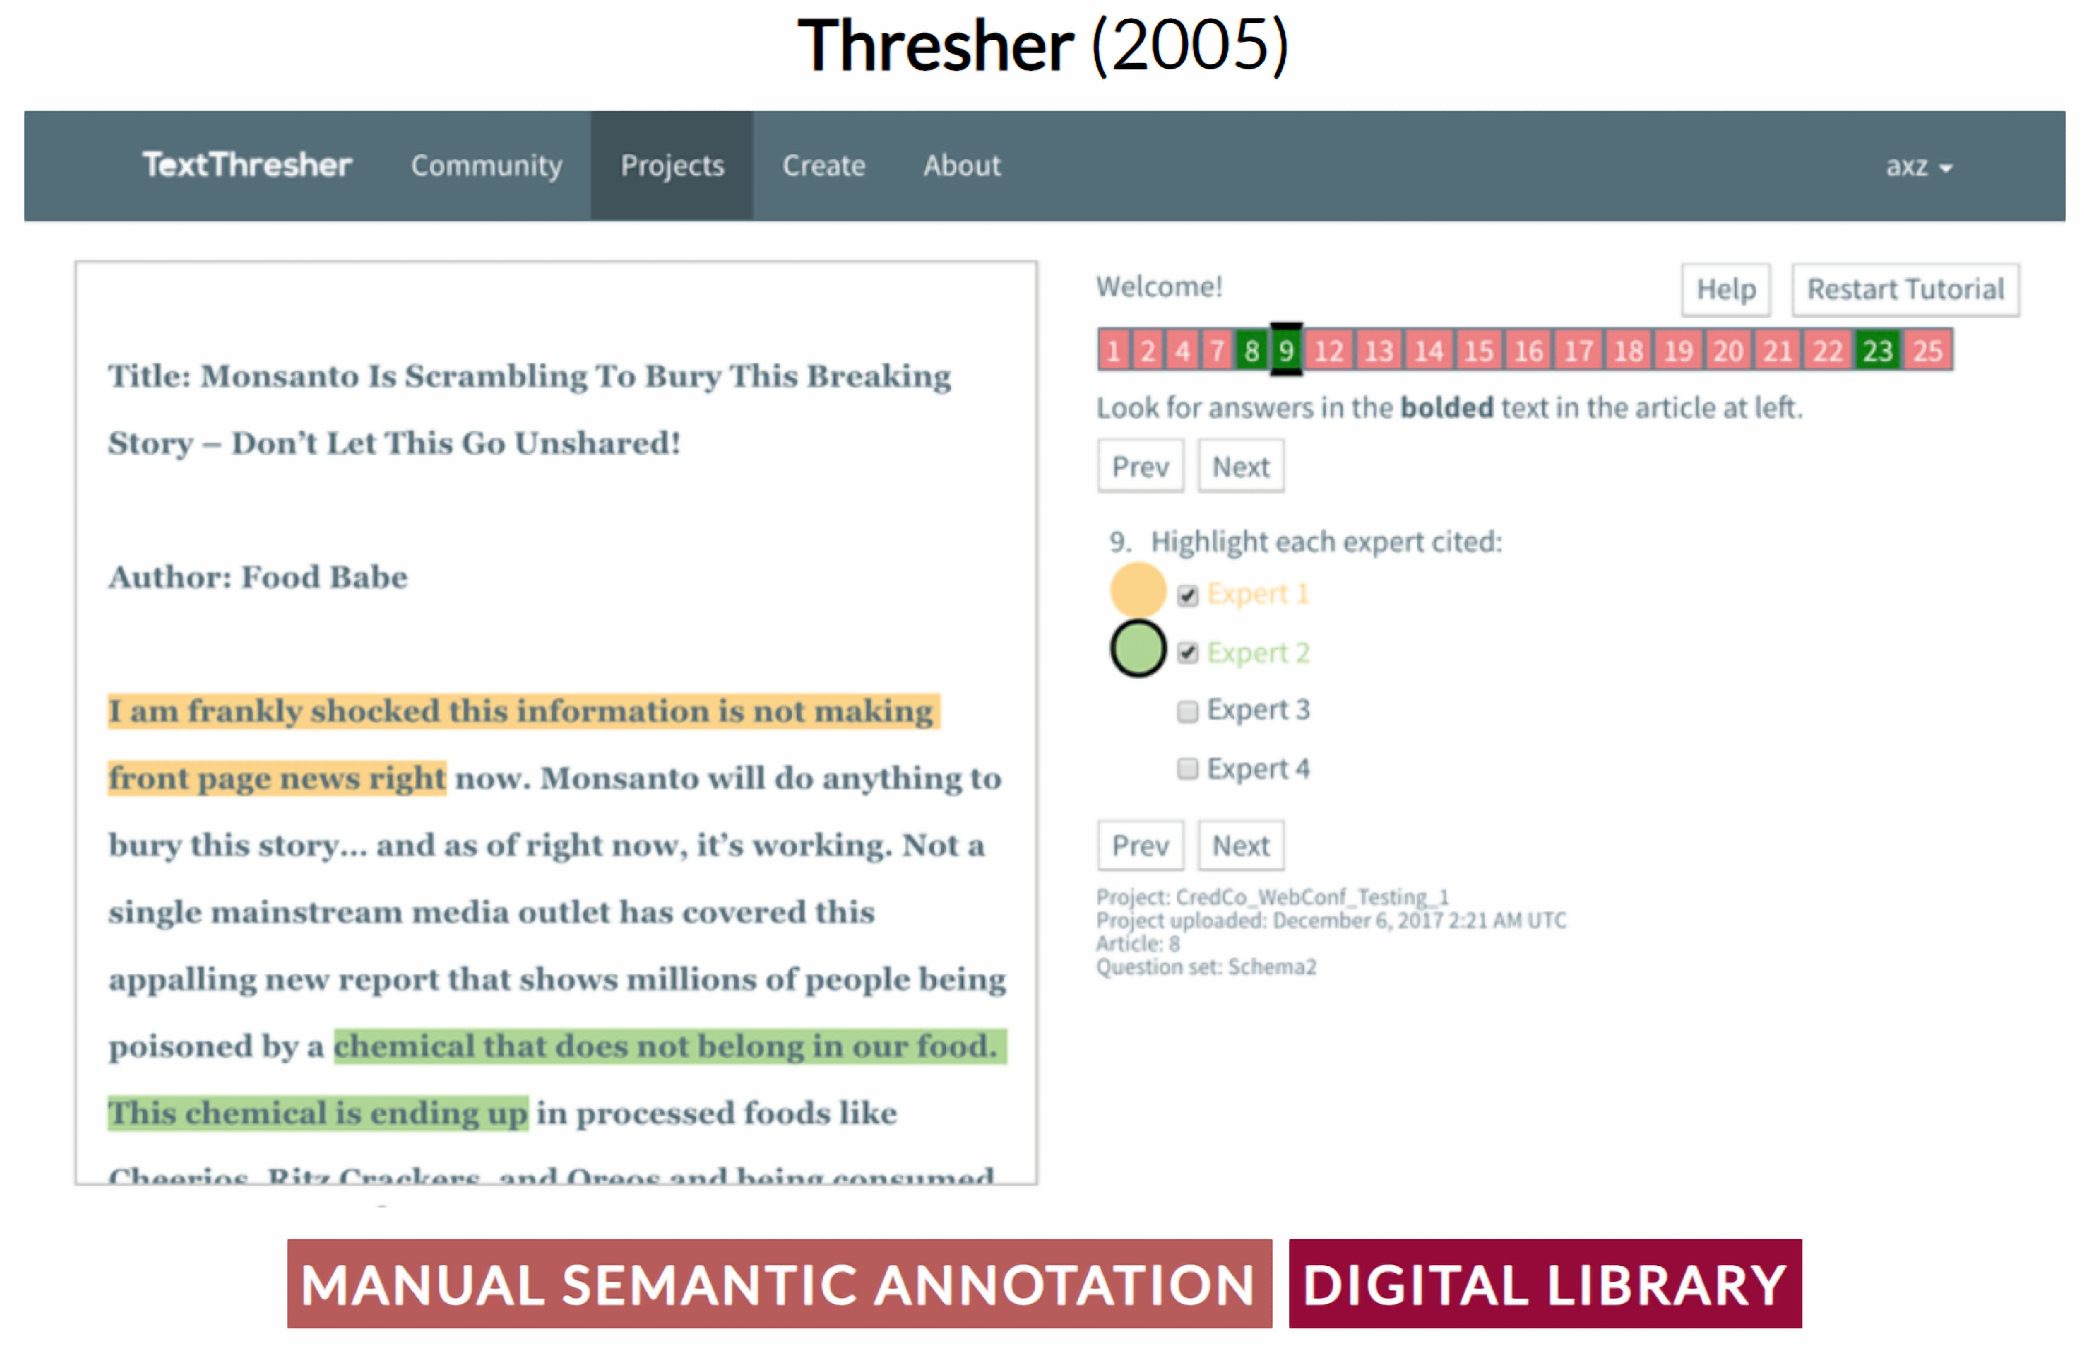
5.1. Manual
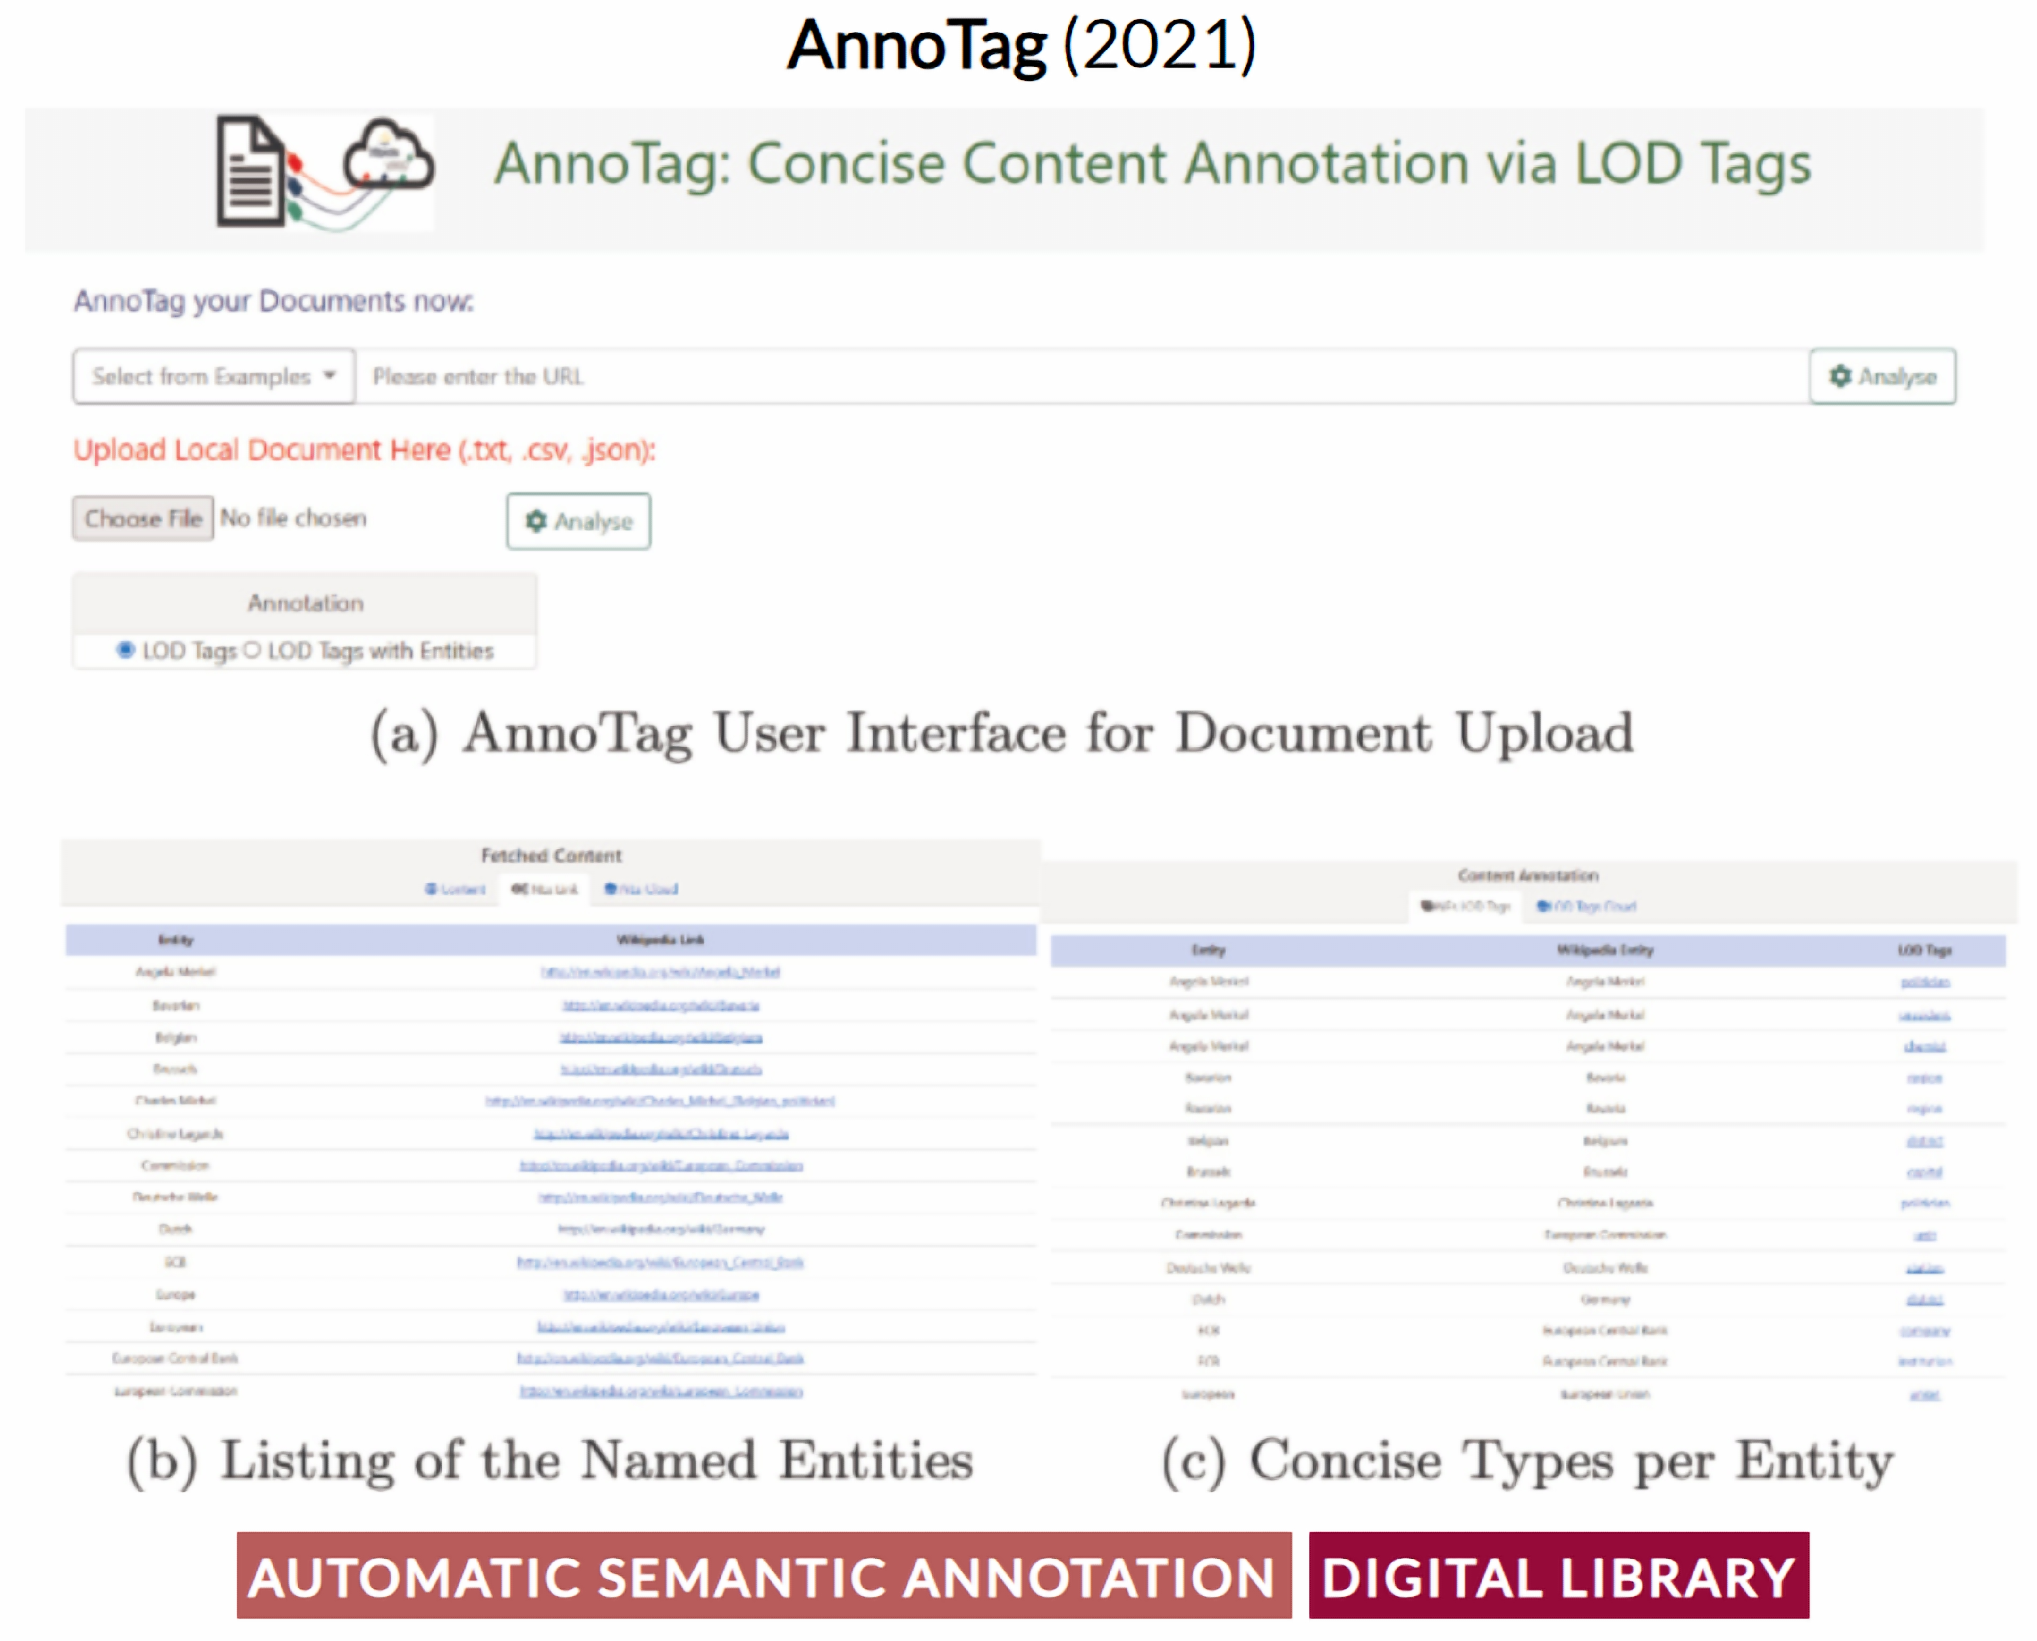
5.2. Automatic
5.3. Semi-Automatic
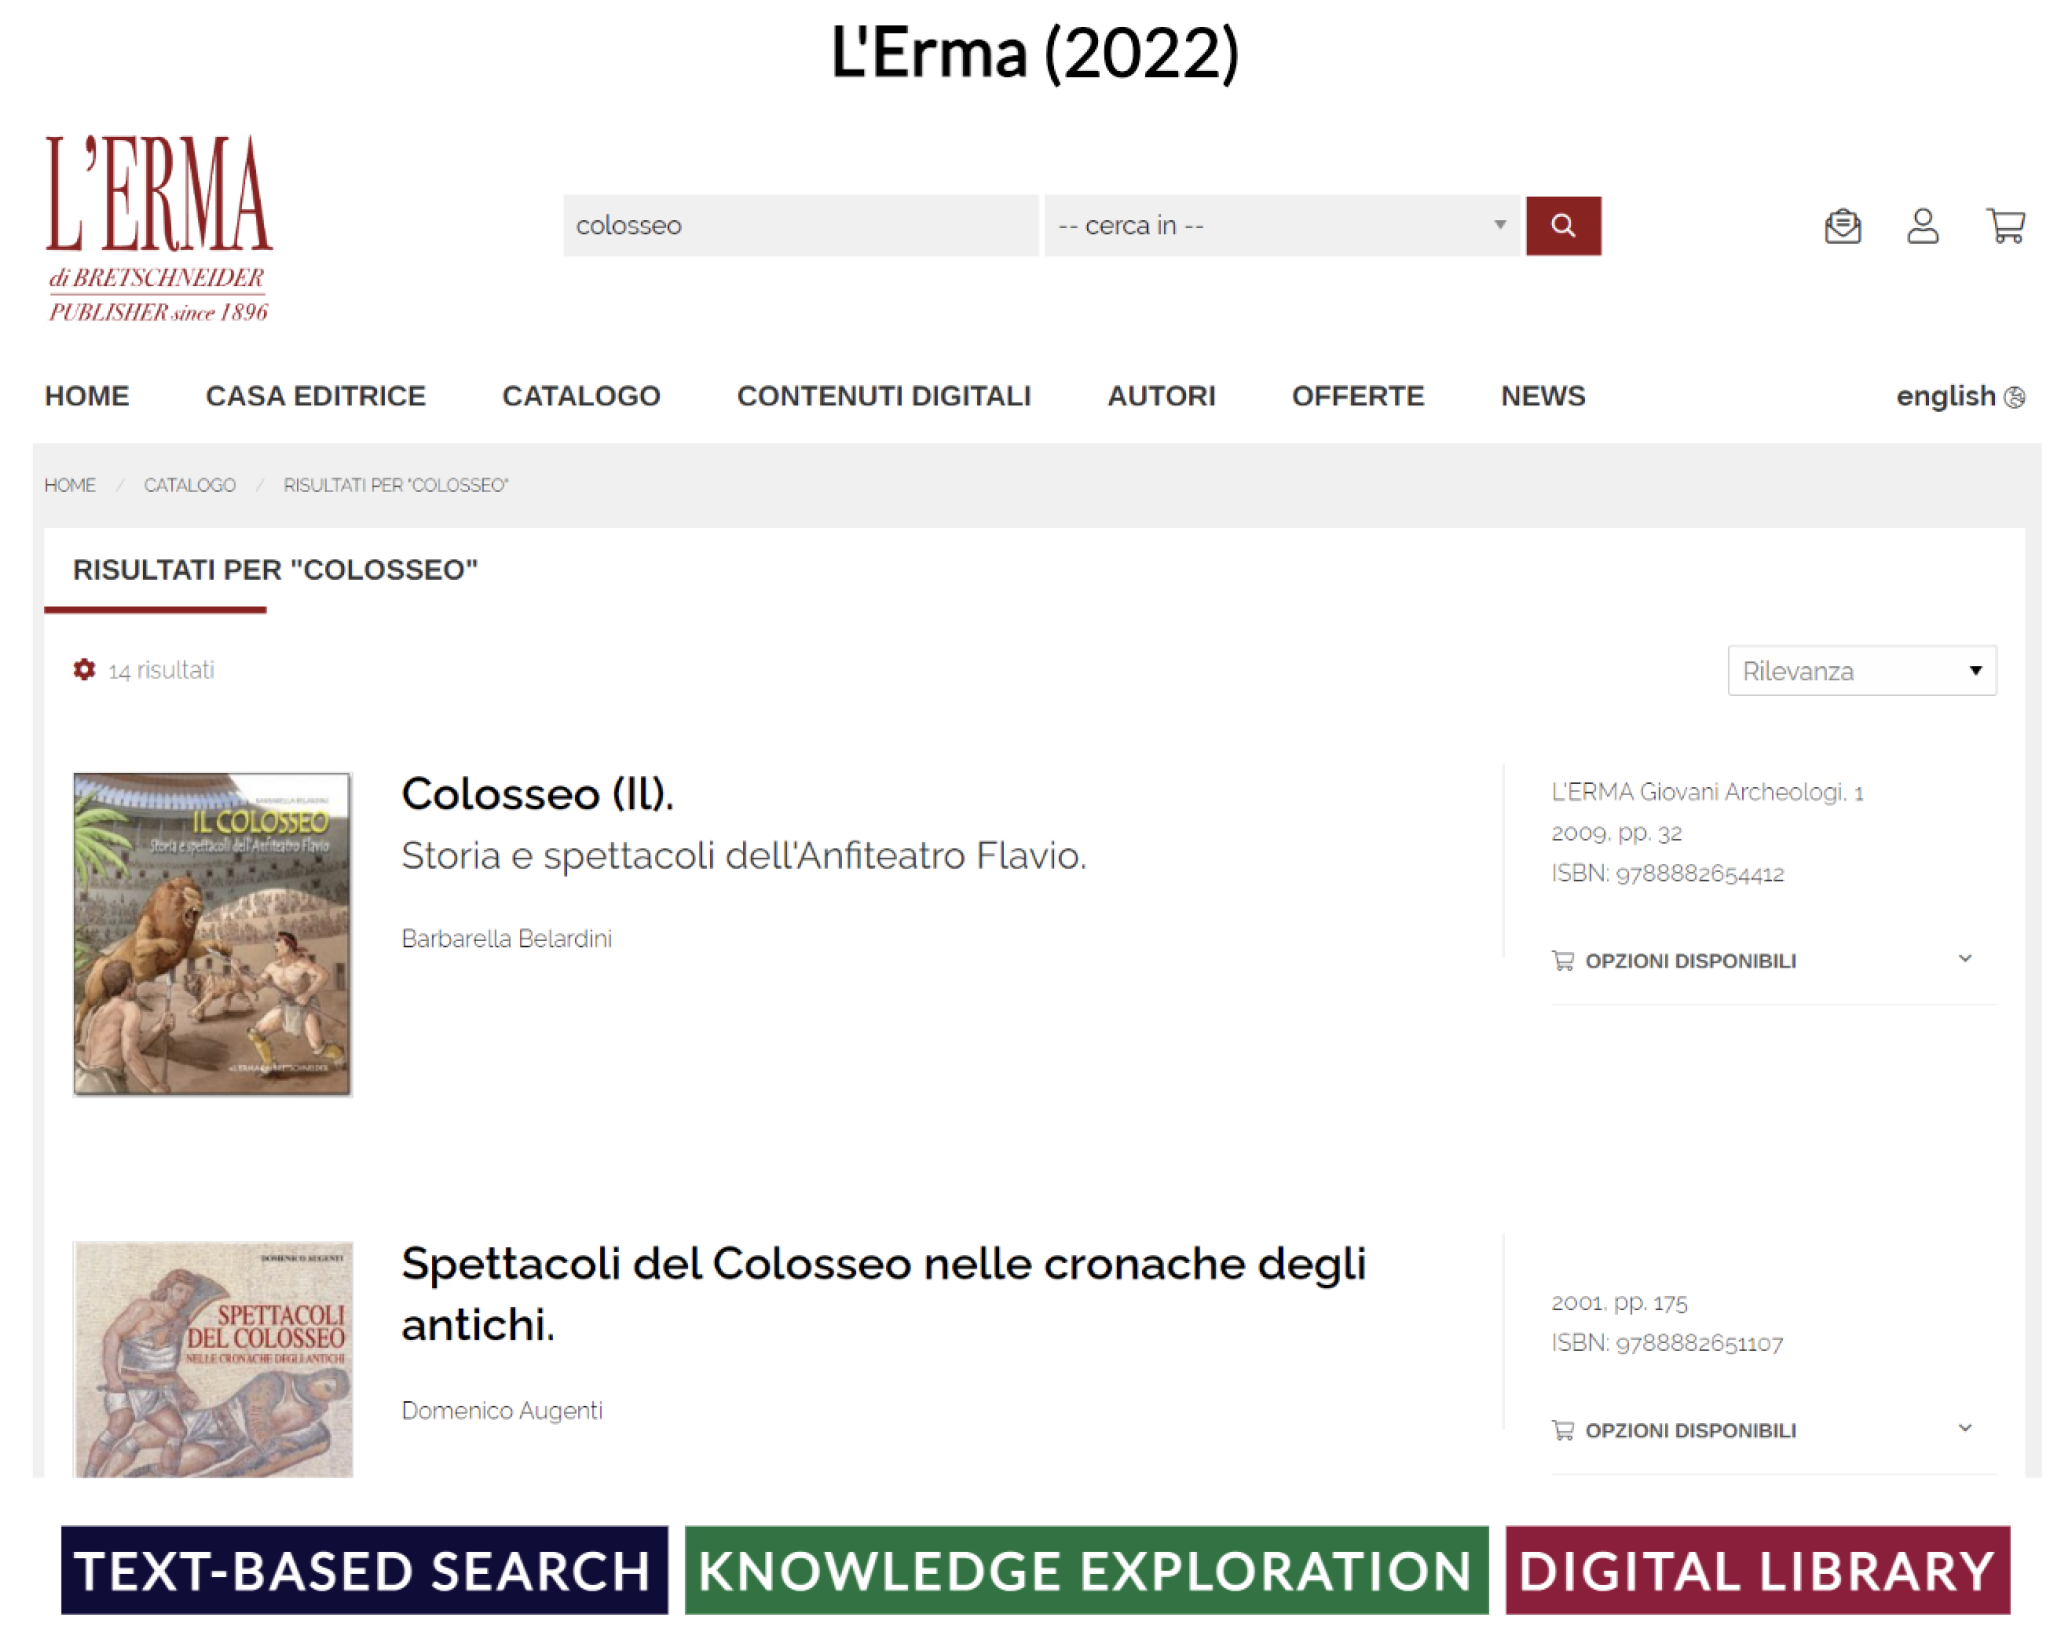
6. Exploration of a Digital Library
7. Conclusions and Emerging Trends
Author Contributions
Funding
Data Availability Statement
Conflicts of Interest
Abbreviations
| KG | Knowledge Graph |
| LD | Linked Data |
| NLP | Natural Language Processing |
| NER | Named Entity Recognition |
| NERL | Named Entity Recognition and Linking |
| AI | Artificial Intelligence |
References
- Damljanovic, D.; Agatonovic, M.; Cunningham, H. FREyA: An interactive way of querying Linked Data using natural language. In Proceedings of the The Semantic Web: ESWC 2011 Workshops: ESWC 2011 Workshops, Heraklion, Greece, 29–30 May 2011; Revised Selected Papers 8. Springer: Berlin/Heidelberg, Germnay, 2012; pp. 125–138. [Google Scholar]
- Skevakis, G.; Makris, K.; Kalokyri, V.; Arapi, P.; Christodoulakis, S. Metadata management, interoperability and Linked Data publishing support for Natural History Museums. Int. J. Digit. Libr. 2014, 14, 127–140. [Google Scholar] [CrossRef]
- Dietze, S.; Drachsler, H.; Giordano, D. A survey on linked data and the social web as facilitators for TEL recommender systems. Recomm. Syst. Technol. Enhanc. Learn. Res. Trends Appl. 2014, 1, 47–75. [Google Scholar]
- Raza, Z.; Mahmood, K.; Warraich, N.F. Application of linked data technologies in digital libraries: A review of literature. Library Hi Tech News 2019, 36, 9–12. [Google Scholar] [CrossRef]
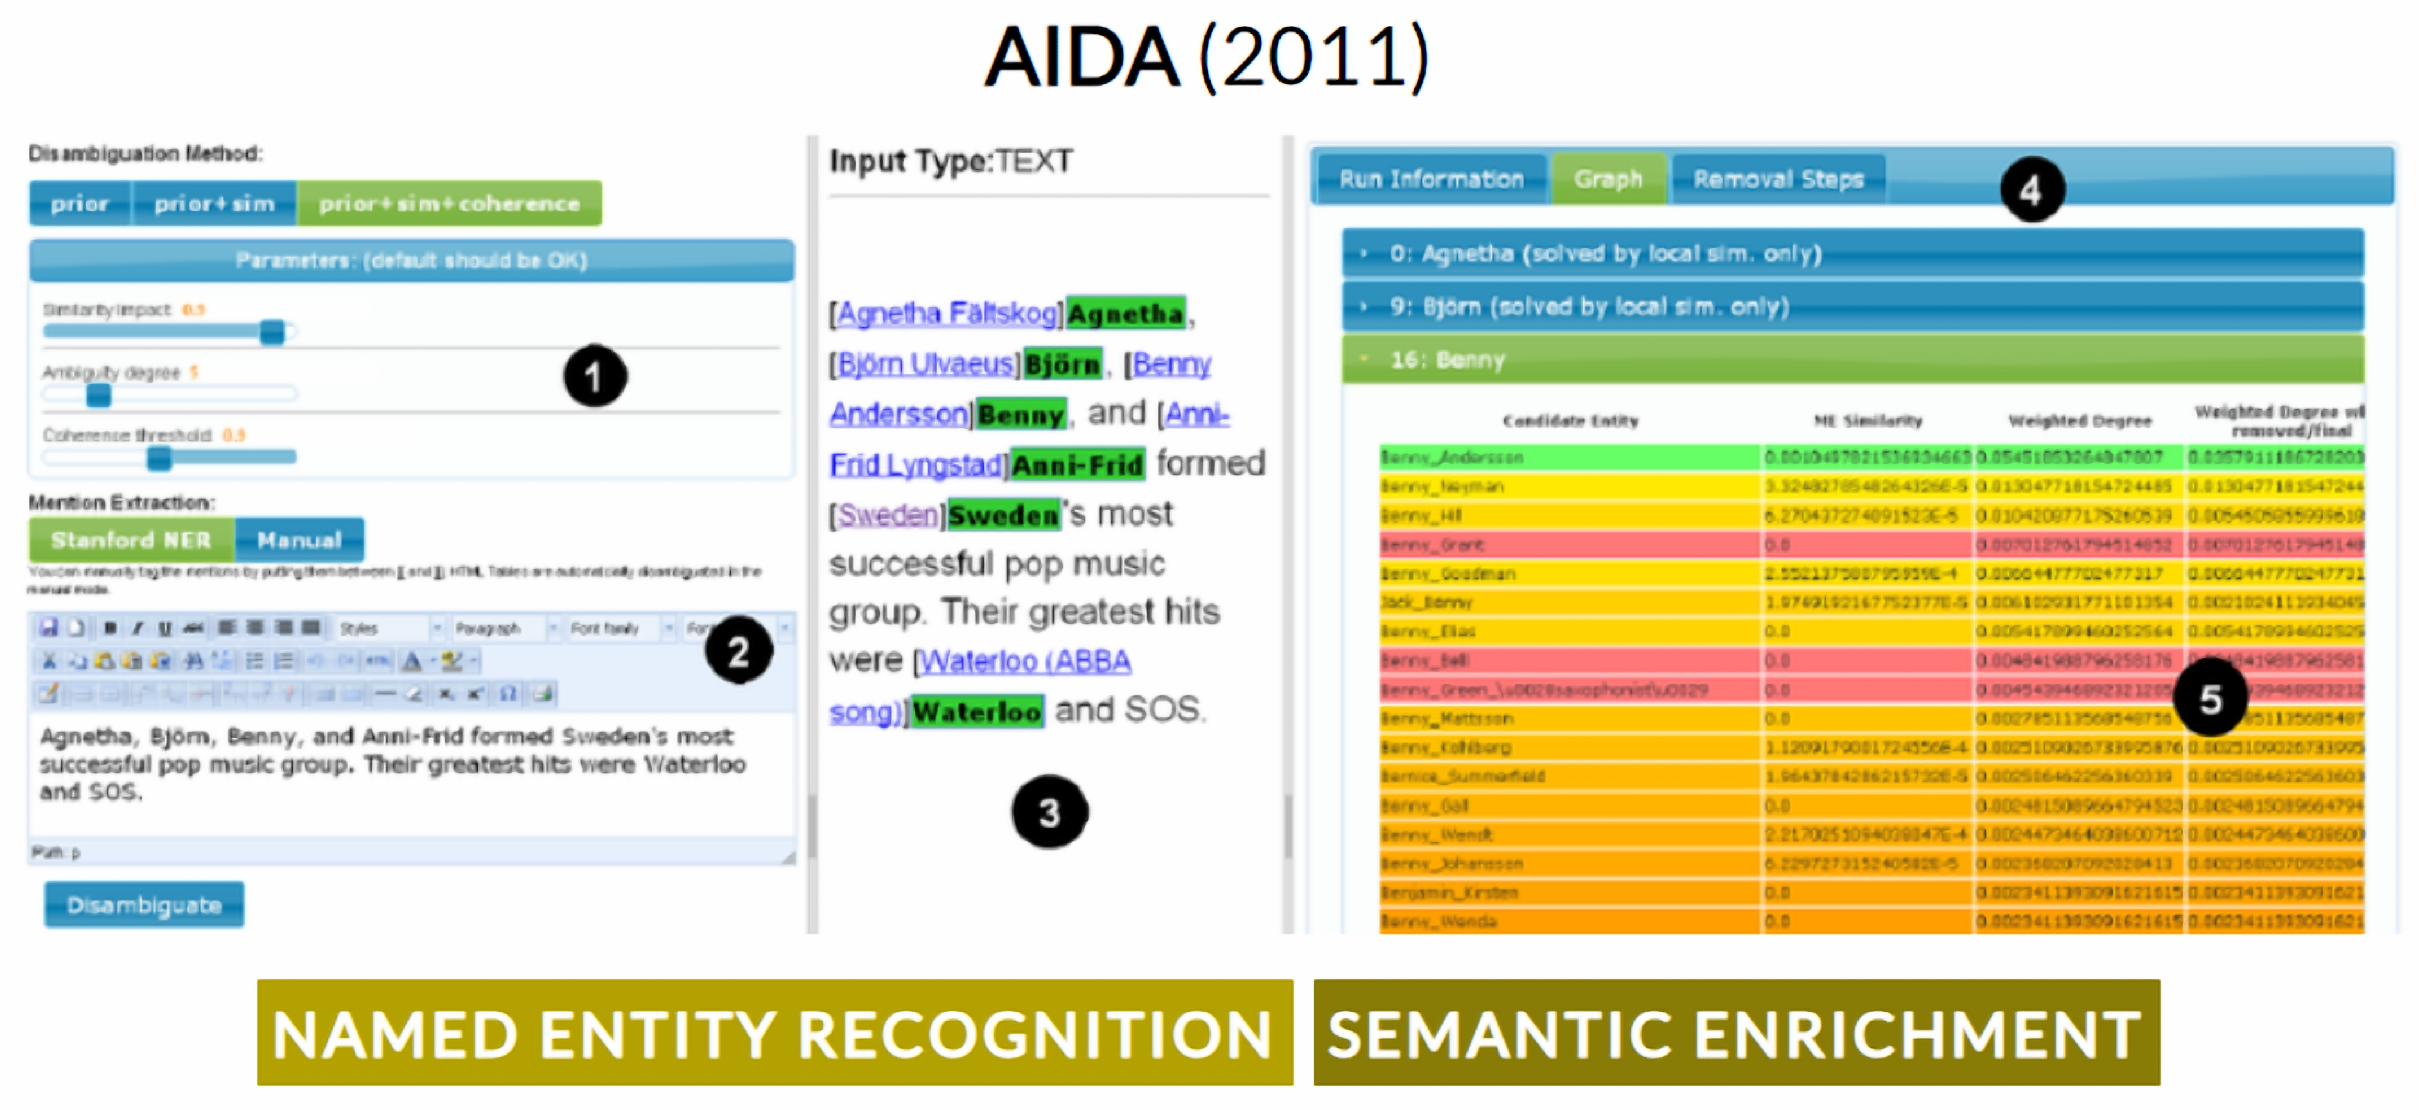
- Hoffart, J.; Yosef, M.; Bordino, I.; Fürstenau, H.; Pinkal, M.; Spaniol, M.; Taneva, B.; Thater, S.; Weikum, G. Robust disambiguation of named entities in text. In Proceedings of the 2011 Conference on Empirical Methods in Natural Language Processing, Edinburgh, UK, 27–31 July 2011; pp. 782–792. [Google Scholar]
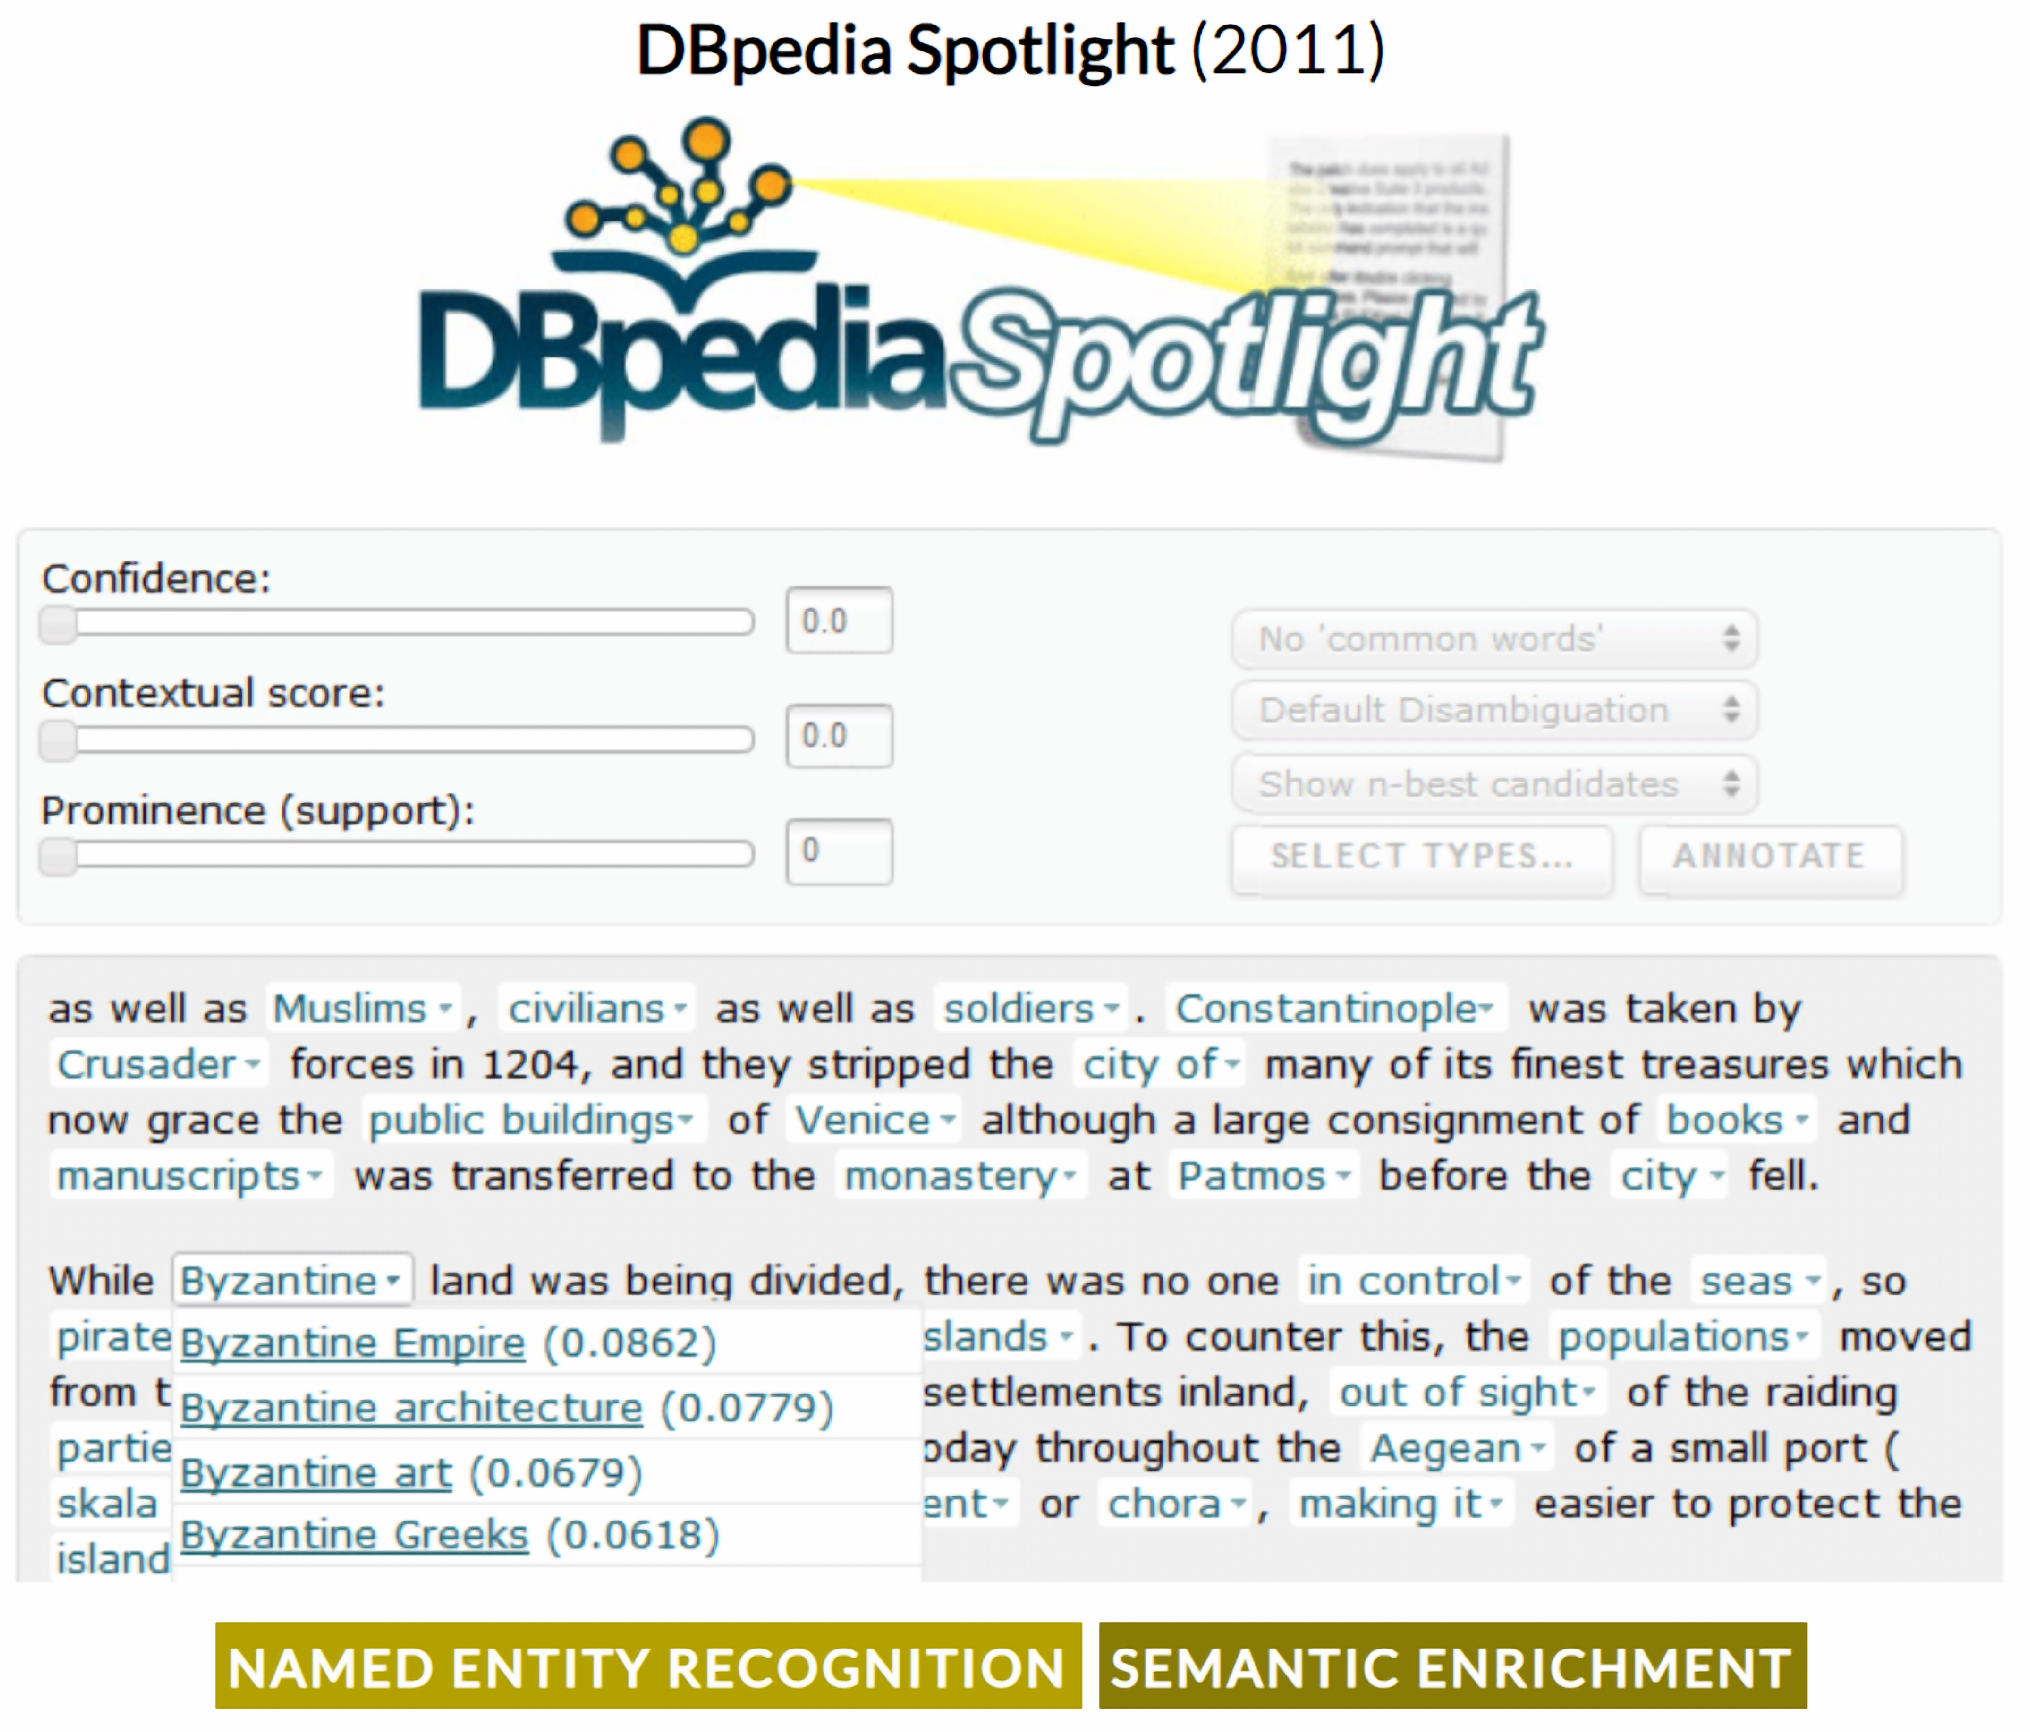
- Mendes, P.N.; Jakob, M.; García-Silva, A.; Bizer, C. DBpedia spotlight: Shedding light on the Web of Documents. In Proceedings of the 7th International Conference on Semantic Systems, Graz, Austria, 7–9 September 2011; pp. 1–8. [Google Scholar]
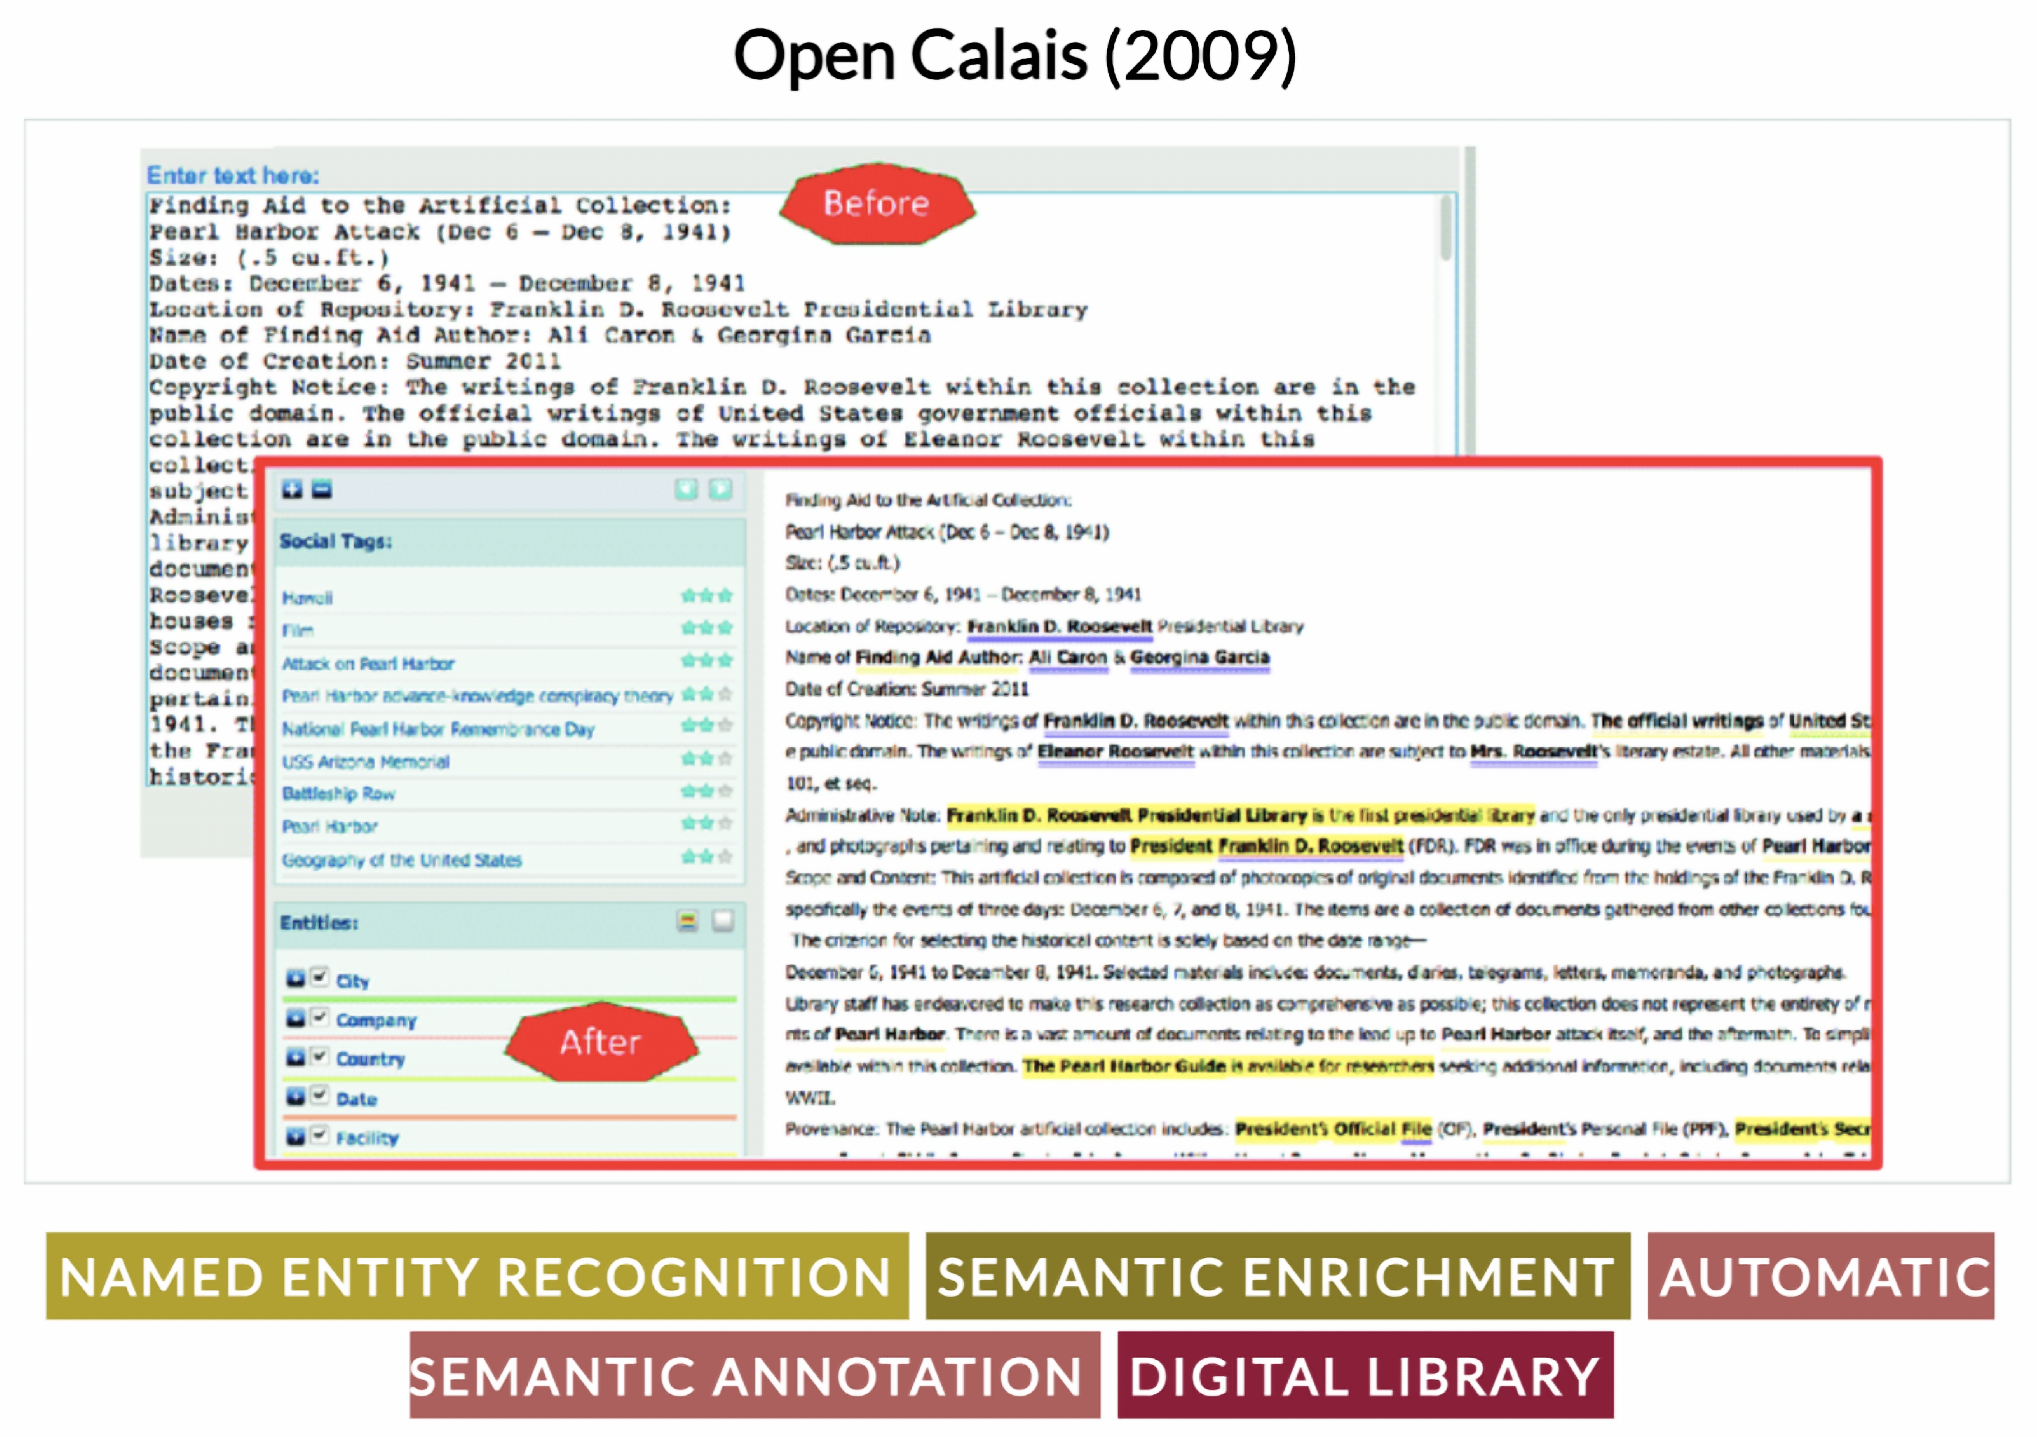
- Butuc, M. Semantically Enriching Content Using OpenCalais. Editia 2009, 9, 77–88. [Google Scholar]
- Gangemi, A. A comparison of knowledge extraction tools for the semantic web. In Proceedings of the Extended Semantic Web Conference, Berlin/Heidelberg, Germany, 26 May 2013; pp. 351–366. [Google Scholar]
- Ristoski, P.; Paulheim, H. Semantic Web in Data Mining and Knowledge Discovery: A Comprehensive Survey. J. Web Semant. 2016, 36, 1–22. [Google Scholar] [CrossRef]
- Nisheva-Pavlova, M.; Alexandrov, A. GLOBDEF: A framework for dynamic pipelines of semantic data enrichment tools. In Proceedings of the Metadata and Semantic Research: 12th International Conference, MTSR 2018, Limassol, Cyprus, 23–26 October 2018; Revised Selected Papers 12. pp. 159–168. [Google Scholar]
- Pavlova, M.N.; Alexandrov, A. Extending the GLOBDEF framework with support for semantic enhancement of various data formats. Int. J. Metadata Semant. Ontol. 2020, 14, 158–168. [Google Scholar] [CrossRef]
- Shneiderman, B. The Eyes Have It: A Task by Data Type Taxonomy for Information Visualizations. In Proceedings of the Craft of Information Visualization; Elsevier: Amsterdam, The Netherlands, 2003; pp. 364–371. [Google Scholar]
- Baeza-Yates, R.; Ribeiro-Neto, B. Modern Information Retrieval; ACM Press: New York, NY, USA, 1999; Volume 463. [Google Scholar]
- Keim, D. Information Visualization and Visual Data Mining. IEEE Trans. Vis. Comput. Graph. 2002, 8, 1–8. [Google Scholar] [CrossRef]
- Ahlberg, C.; Williamson, C.; Shneiderman, B. Dynamic queries for information exploration: An implementation and evaluation. In Proceedings of the SIGCHI Conference on Human Factors in Computing Systems; ACM: New York, NY, USA, 1992; pp. 619–626. [Google Scholar]
- Ahlberg, C.; Shneiderman, B. Visual information seeking: Tight coupling of dynamic query filters with starfield displays. In Proceedings of the SIGCHI Conference on Human Factors in Computing Systems; ACM: New York, NY, USA, 1994; pp. 313–317. [Google Scholar]
- Zloof, M. Query-by-Example: A Data Base Language. IBM Syst. J. 1977, 16, 324–343. [Google Scholar] [CrossRef]
- Berners-Lee, T.; Hendler, J.; Lassila, O. The Semantic Web. Sci. Am. 2001, 284, 34–43. [Google Scholar] [CrossRef]
- Bizer, C.; Heath, T.; Berners-Lee, T. Linked Data-The Story So Far. Int. J. Semant. Web Inf. Syst. 2009, 3, 1–22. [Google Scholar] [CrossRef]
- Singhal, A. Introducing the Knowledge Graph: Things, not Strings, 2012, 5, 3. Available online: https://www.bibsonomy.org/bibtex/23de8f9e39e3b0c5df9709b2548fbd189/fsteeg (accessed on 1 July 2023).
- Ehrlinger, L.; Wöß, W. Towards a Definition of Knowledge Graphs. In SEMANTiCS (Posters, Demos, SuCCESS). CCEURWorkshop Proceedings 2016. Volume 48. Available online: https://ceur-ws.org/Vol-1695/paper4.pdf (accessed on 30 July 2023).
- Po, L.; Bikakis, N.; Desimoni, F.; Papastefanatos, G. Linked Data Visualization: Techniques, Tools, and Big Data; Morgan & Claypool Publishers; Springer: Cham, Switzerland, 2020; Volume 10. [Google Scholar]
- Dadzie, A.; Rowe, M. Approaches to Visualising Linked Data: A Survey. Semant. Web 2011, 2, 89–124. [Google Scholar] [CrossRef]
- Marie, N.; Gandon, F. Survey of Linked Data Based Exploration Systems. In Proceedings of the IESD@ISWC; 2014, no. 1. [Online]. Available online: https://hal.inria.fr/hal-01057035/en (accessed on 1 July 2023).
- Bikakis, N.; Sellis, T. Exploration and visualization in the web of big linked data: A survey of the state of the art. arXiv 2016, arXiv:1601.08059. [Google Scholar]
- Nuzzolese, A.; Presutti, V.; Gangemi, A.; Musetti, A.; Ciancarini, P. Aemoo: Exploring knowledge on the web. In Proceedings of the 5th Annual ACM Web Science Conference, Paris, France, 2–4 May 2013; pp. 272–275. [Google Scholar]
- Micsik, A.; Tóth, Z.; Turbucz, S. LODmilla: Shared visualization of linked open data. In Proceedings of the Theory and Practice of Digital Libraries—TPDL 2013 Selected Workshops, Valletta, Malta, 22–26 September 2014; pp. 89–100. [Google Scholar]
- Micsik, A.; Turbucz, S.; Györök, A. LODmilla: A linked data browser for all. In Proceedings of the Posters Demos@SEMANTiCS 2014, CEUR-WS.org, Leipzig, Germany, 4–5 September 2014; pp. 31–34. [Google Scholar]
- Viola, F.; Roffia, L.; Antoniazzi, F.; D’Elia, A.; Aguzzi, C.; Salmon Cinotti, T. Interactive 3D exploration of RDF graphs through semantic planes. Future Internet 2018, 10, 81. [Google Scholar] [CrossRef]
- Haag, F.; Lohmann, S.; Ertl, T. SPARQLFilterFlow: SPARQL query composition for everyone. In Proceedings of the Extended Semantic Web Conference (ESWC), Anissaras, Greece, 25–29 May 2014; pp. 362–367. [Google Scholar] [CrossRef]
- Haag, F.; Lohmann, S.; Siek, S.; Ertl, T. QueryVOWL: Visual composition of SPARQL queries. In Proceedings of ESWC 2015 Satellite Events; Springer: Berlin/Heidelberg, Germany, 2015; Volume 9341, pp. 62–66. [Google Scholar]
- Haag, F.; Lohmann, S.; Siek, S.; Ertl, T. QueryVOWL: A visual query notation for linked data. In Proceedings of ESWC 2015 Satellite Events; Springer: Berlin/Heidelberg, Germany, 2015; Volume 9341, pp. 387–402. [Google Scholar]
- Vargas, H.; Aranda, C.B.; Hogan, A.; López, C. RDF Explorer: A Visual SPARQL Query Builder. In Proceedings of the The Semantic Web-ISWC 2019-18th International Semantic Web Conference, Auckland, New Zealand, 26–30 October 2019; Proceedings, Part I; Lecture Notes in Computer Science. Springer: Berlin/Heidelberg, Germany, 2019; Volume 11778, pp. 647–663. [Google Scholar] [CrossRef]
- Bottoni, P.; Ceriani, M. SPARQL Playground: A Block Programming Tool to Experiment with SPARQL. In Proceedings of the International Workshop on Visualizations and User Interfaces for Ontologies and Linked Data Co-Located with 14th International Semantic Web Conference (ISWC 2015), Bethlehem, PA, USA, 11 October 2015; CEUR Workshop Proceedings. Volume 1456, p. 103. [Google Scholar]
- Ceriani, M.; Bottoni, P. SparqlBlocks: Using Blocks to Design Structured Linked Data Queries. J. Vis. Lang. Sentient Syst. 2017, 3, 1–21. [Google Scholar] [CrossRef]
- Marlet, O.; Francart, T.; Markhoff, B.; Rodier, X. OpenArchaeo for usable semantic interoperability. In Proceedings of the First International Workshop on Open Data and Ontologies for Cultural Heritage co-located with the 31st International Conference on Advanced Information Systems Engineering, ODOCH@CAiSE 2019, Rome, Italy, 3 June 2019; CEUR Workshop Proceedings. Volume 2375, pp. 5–14. [Google Scholar]
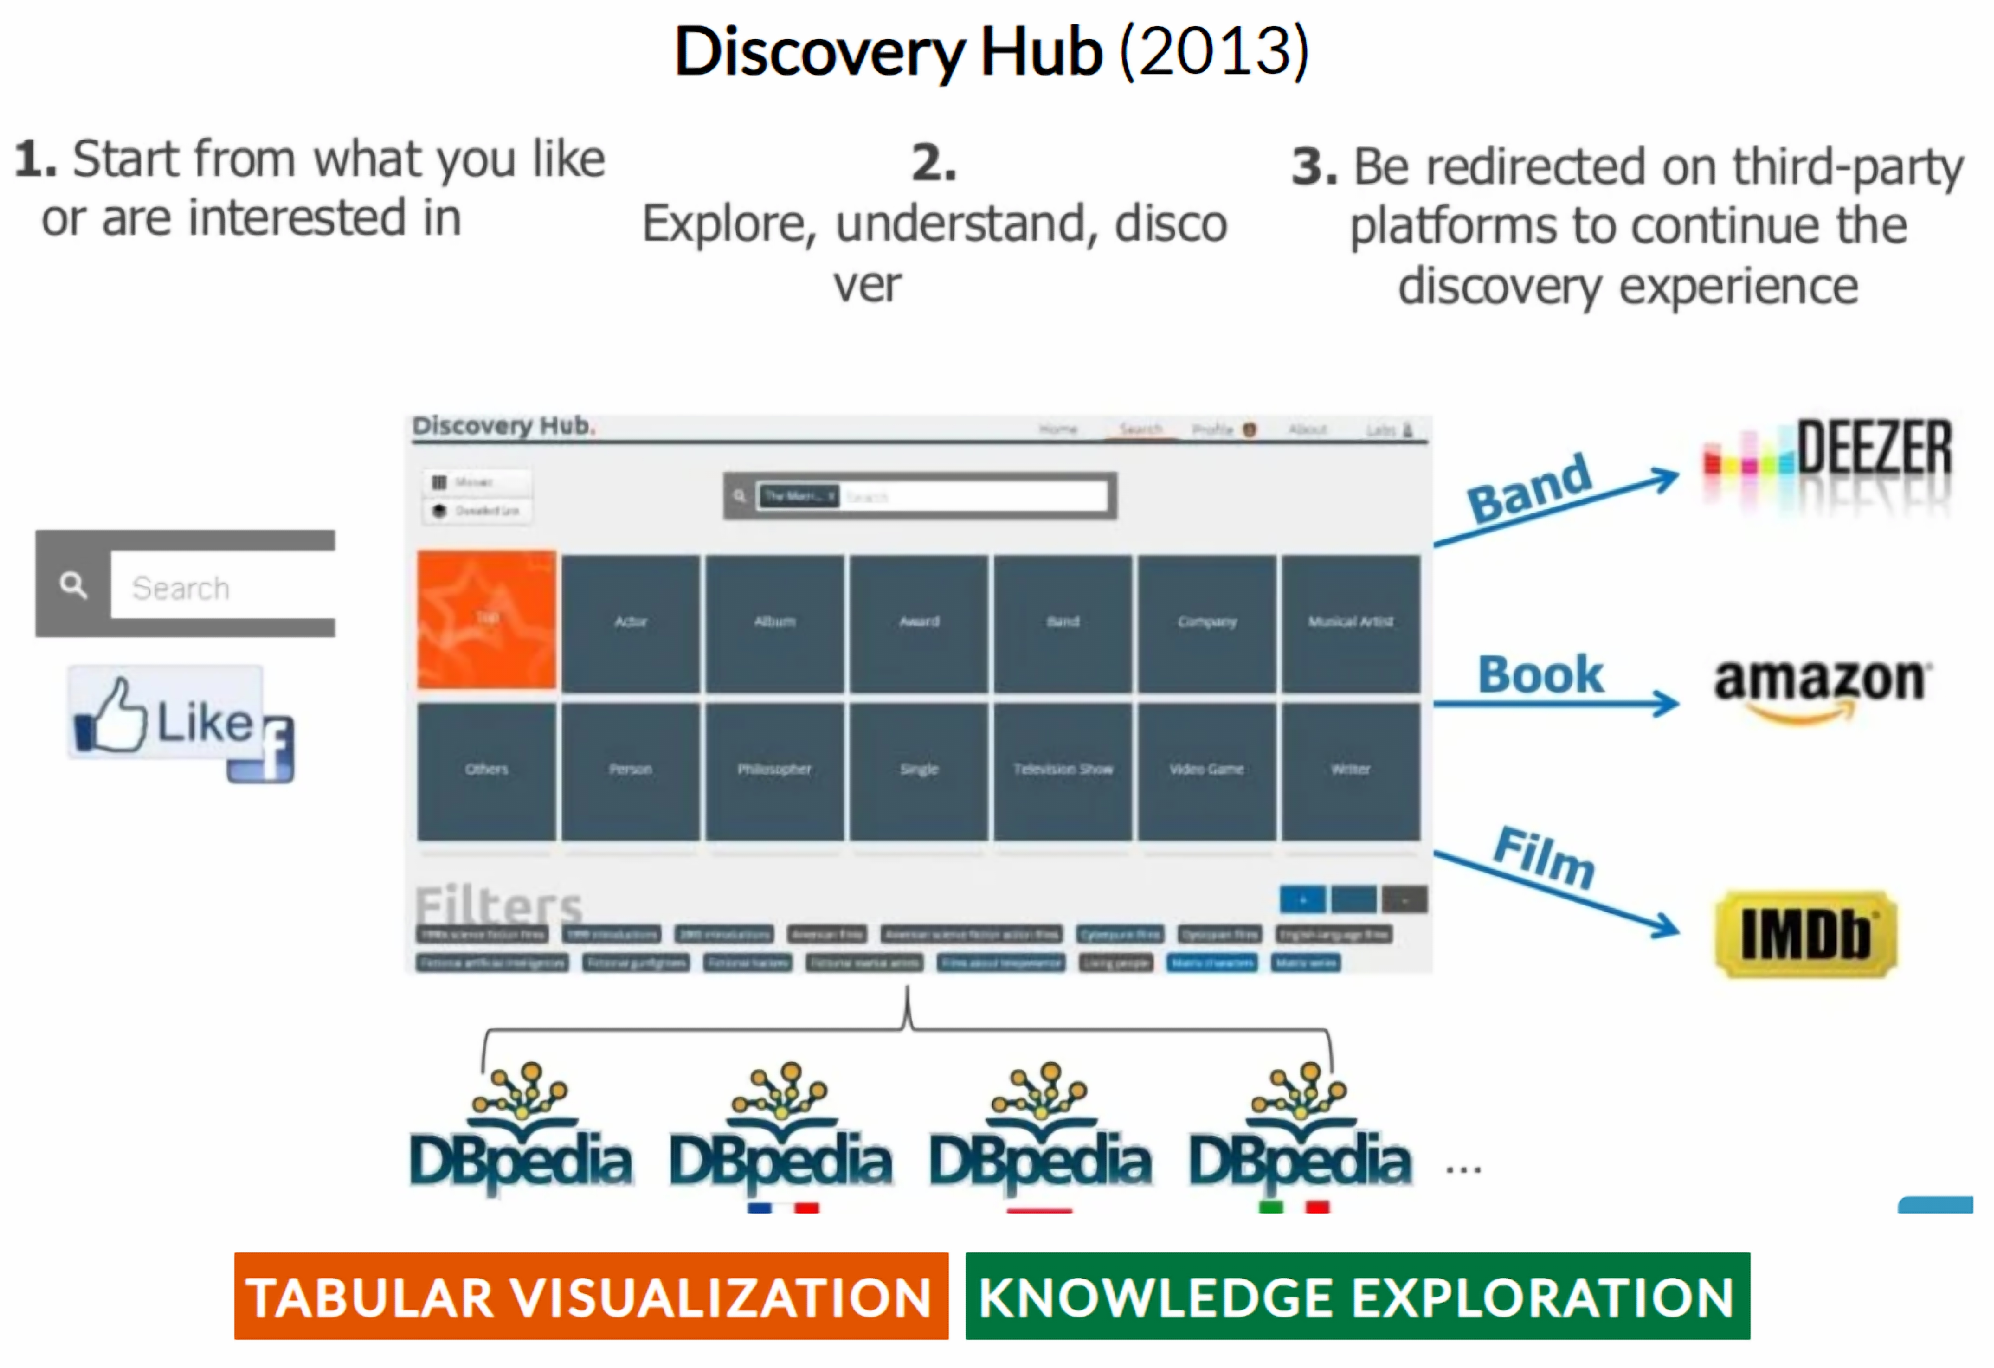
- Marie, N.; Gandon, F.; Ribiere, M.; Rodio, F. Discovery hub: On-the-fly linked data exploratory search. In Proceedings of the 9th International Conference on Semantic Systems; ACM: New York, NY, USA, 2013; pp. 17–24. [Google Scholar]
- Ferilli, S.; Redavid, D. The GraphBRAIN system for knowledge graph management and advanced fruition. In Proceedings of the Foundations of Intelligent Systems: 25th International Symposium, ISMIS 2020, Graz, Austria, 23–25 September 2020; Springer: Berlin/Heidelberg, Germany, 2020; pp. 308–317. [Google Scholar]
- Di Pierro, D.; Ferilli, S.; Redavid, D. LPG-Based Knowledge Graphs: A Survey, a Proposal and Current Trends. Information 2023, 14, 154. [Google Scholar] [CrossRef]
- Mouromtsev, D.; Pavlov, D.; Emelyanov, Y.; Morozov, A.; Razdyakonov, D.; Galkin, M. The Simple Web-based Tool for Visualization and Sharing of Semantic Data and Ontologies. In Proceedings of the ISWC, Bethlehem, PA, USA, 11–15 October 2015. [Google Scholar]
- Lohmann, S.; Link, V.; Marbach, E.; Negru, S. WebVOWL: Web-based Visualization of Ontologies. In Proceedings of the EKAW, Linkoping, Sweden, 24–28 November 2014. [Google Scholar]
- Anutariya, C.; Dangol, R. VizLOD: Schema Extraction And Visualization Of Linked Open Data. In Proceedings of the 2018 15th International Joint Conference on Computer Science and Software Engineering (JCSSE), Nakhonpathom, Thailand, 11–13 July 2018; pp. 1–6. [Google Scholar] [CrossRef]
- Weise, M.; Lohmann, S.; Haag, F. Ld-vowl: Extracting and visualizing schema information for linked data. In Proceedings of the 2nd International Workshop on Visualization and Interaction for Ontologies and Linked Data, Kobe, Japan, 17 October 2016; pp. 120–127. [Google Scholar]
- van Dam, J.; Koehorst, J.; Schaap, P.; dos Santos, V.; Suárez-Diez, M. RDF2Graph a tool to recover, understand and validate the ontology of an RDF resource. J. Biomed. Semant. 2015, 6, 39. [Google Scholar] [CrossRef] [PubMed]
- Hastrup, T.; Cyganiak, R.; Bojars, U. Browsing linked data with fenfire. In Proceedings of the International World Wide Web Conference (WWW), Beijing, China, 21–25 April 2008. [Google Scholar]
- Camarda, D.; Mazzini, S.; Antonuccio, A. Lodlive, exploring the web of data. In Proceedings of the I-SEMANTICS 2012-8th International Conference on Semantic Systems, I-SEMANTICS’12, Graz, Austria, 5–7 September 2012; ACM: New York, NY, USA, 2012; pp. 197–200. [Google Scholar]
- Po, L.; Malvezzi, D. High-level visualization over big linked data. In Proceedings of the CEUR WORKSHOP PROCEEDINGS, CEUR-WS, Hotel Plejsy, Slovakia, 21–25 September 2018; Volume 2180. [Google Scholar]
- Chawuthai, R.; Takeda, H. RDF Graph Visualization by Interpreting Linked Data as Knowledge. In Proceedings of the JIST, Yichang, China, 4–7 November 2015. [Google Scholar]
- Santana-Pérez, I. Graphless: Using Statistical Analysis and Heuristics for Visualizing Large Datasets. VOILA@ ISWC 2018, 2187, 1–12. [Google Scholar]
- Neves, M.; Ševa, J. An extensive review of tools for manual annotation of documents. Briefings Bioinform. 2019, 22, 146–163. [Google Scholar]
- Loreggia, A.; Mosco, S.; Zerbinati, A. Sentag: A web-based tool for semantic annotation of textual documents. In Proceedings of the ThirtySixth AAAI Conference on Artificial Intelligence; AAAI Press: Washington, DC, USA, 2022. [Google Scholar]
- Chakravarthy, M.A.; Ciravegna, P.F.; Lanfranchi, M.V. AKTiveMedia: Cross-media document annotation and enrichment. In Proceedings of the Semantic Web for the Working Ontologist; ACM: New York, NY, USA, 2006. [Google Scholar]
- Popov, B.; Kiryakov, A.; Ognyanoff, D.; Manov, D.; Kirilov, A. KIM – a semantic platform for information extraction and retrieval. Nat. Lang. Eng. 2004, 10, 375–392. [Google Scholar] [CrossRef]
- Hogue, A.; Karger, D. Thresher: Automating the unwrapping of semantic content from the world wide web. In Proceedings of the 14th International Conference on World Wide Web, Chiba, Japan, 10–14 May 2005; pp. 86–95. [Google Scholar]
- Kumar, A.; Spaniol, M. Annotag: Concise content annotation via lod tags derived from entity-level analytics. In Proceedings of the Linking Theory and Practice of Digital Libraries, TPDL 2021, Virtual Event, 13–17 September2021; Proceedings 25. Springer International Publishing: Berlin/Heidelberg, Germany, 2021; pp. 175–180. [Google Scholar]
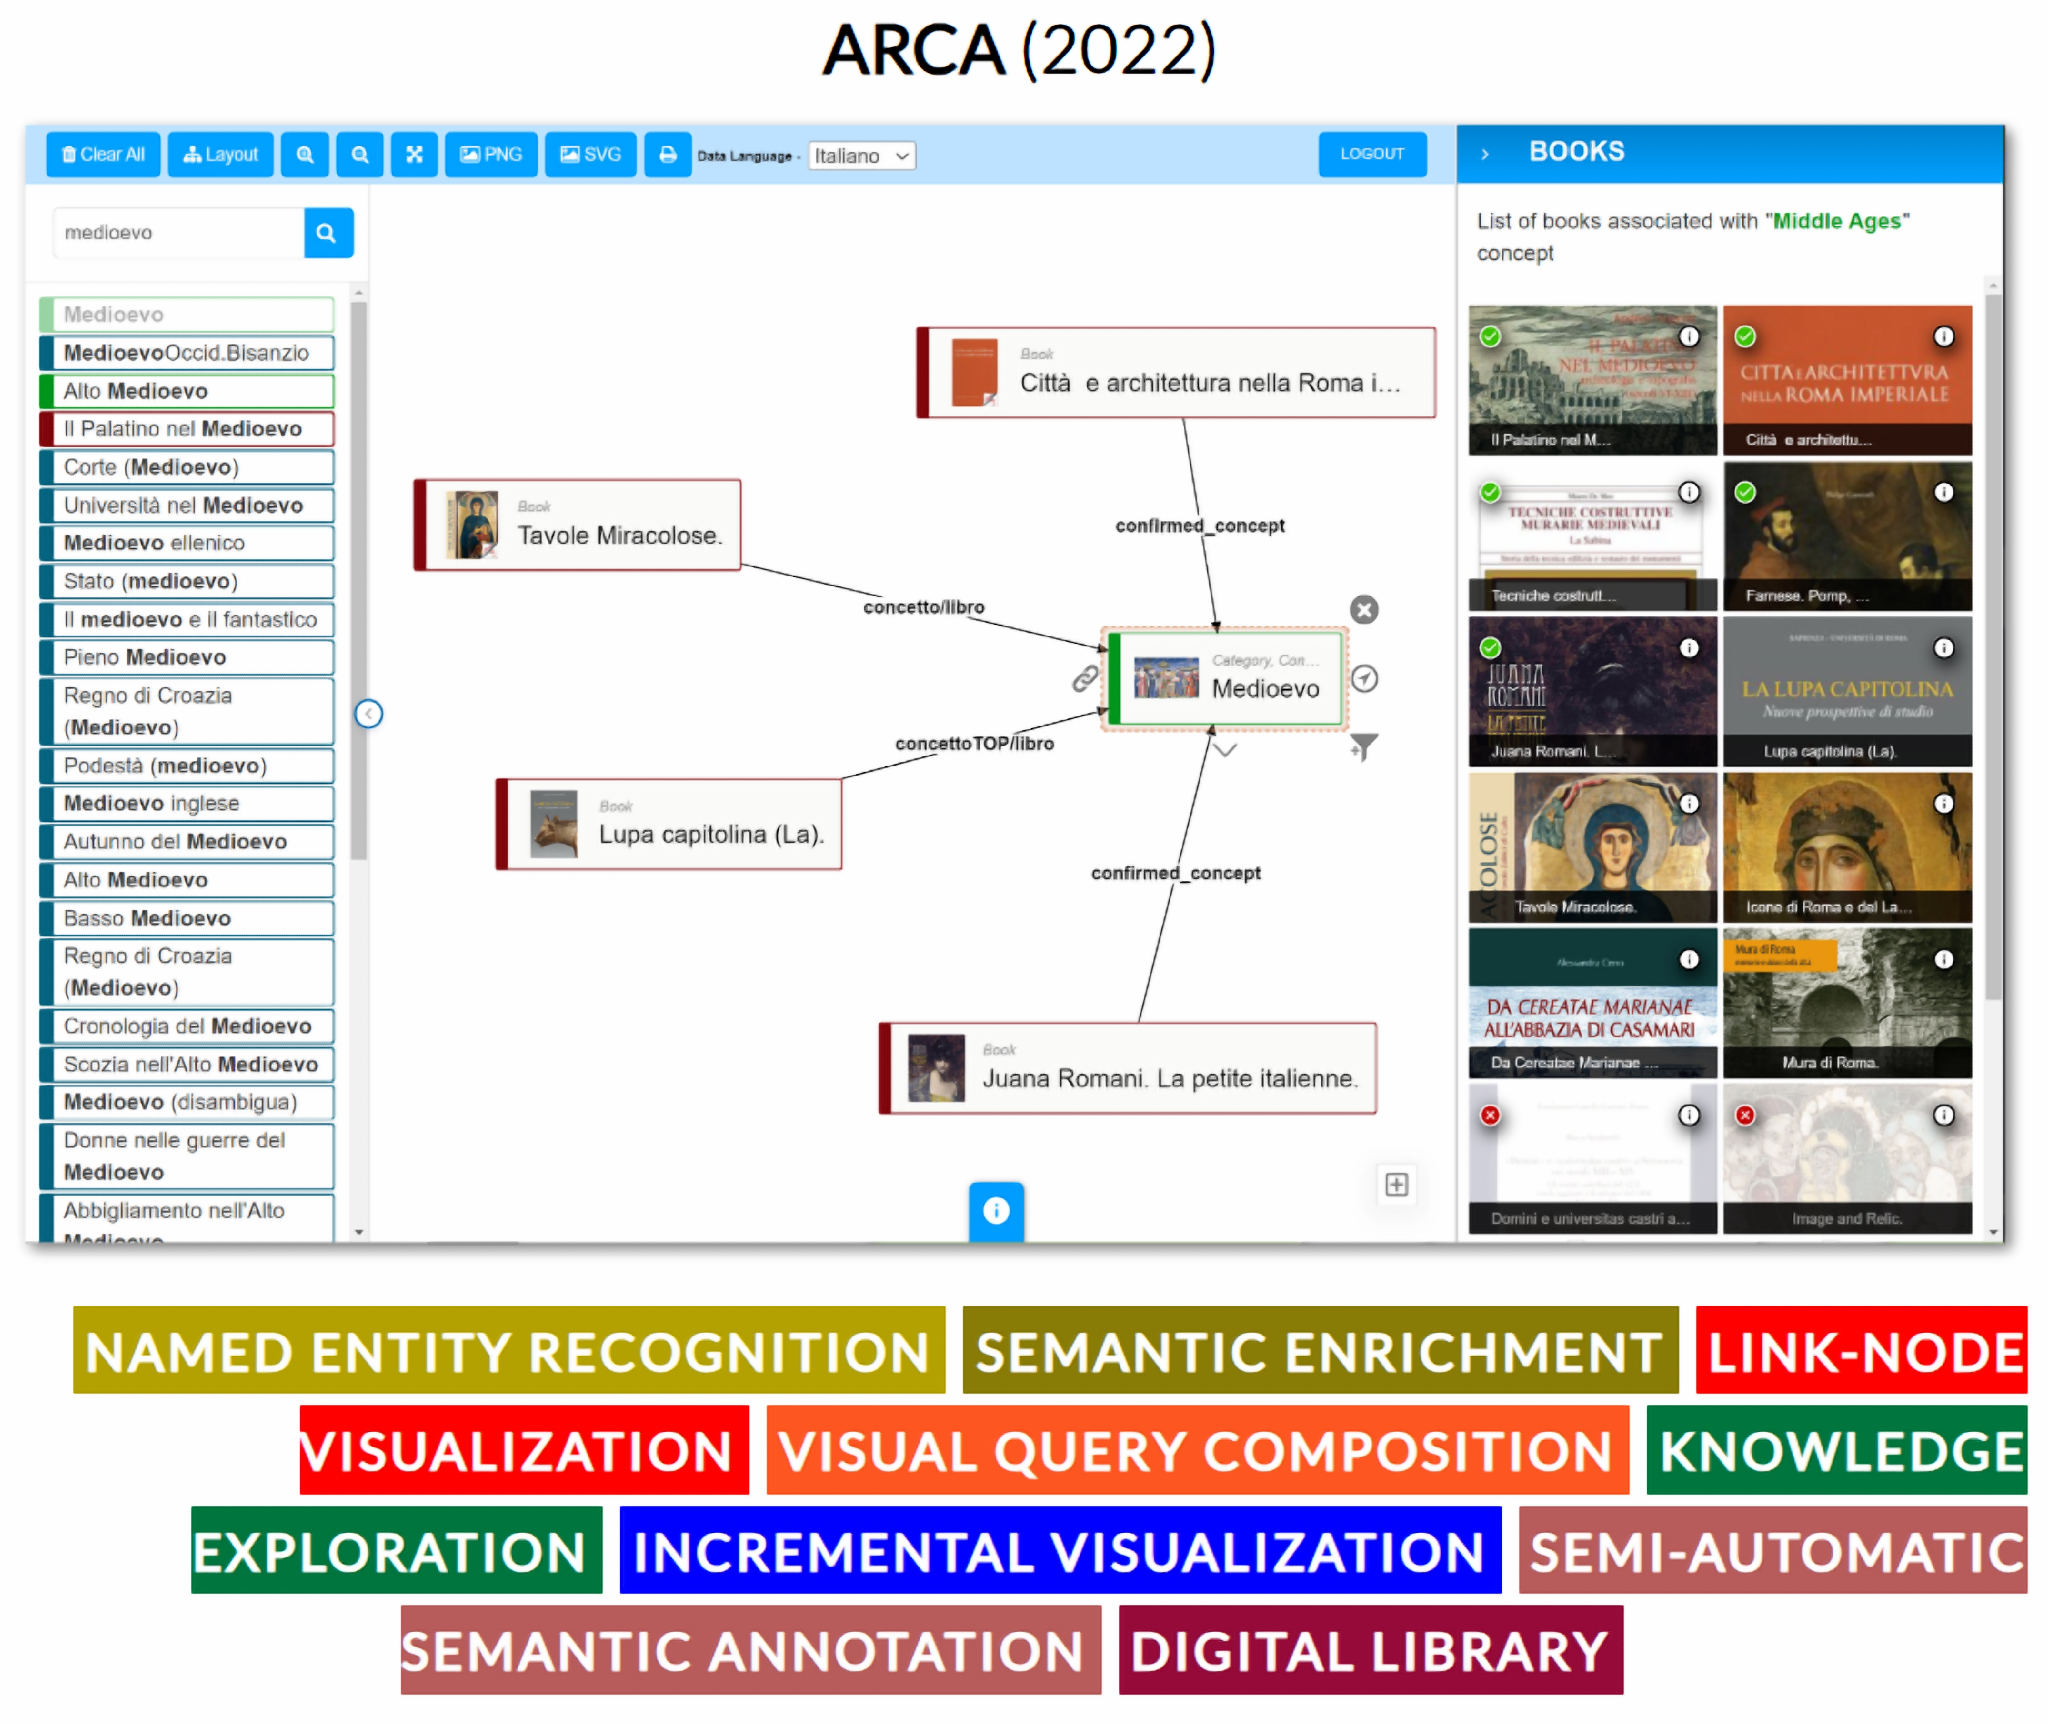
- Bernasconi, E.; Ceriani, M.; Mecella, M. Academic Research Creativity Archive (ARCA). In Proceedings of the International Conference on Research Challenges in Information Science, Barcelona, Spain, 17–20 May 2021; pp. 713–714. [Google Scholar]
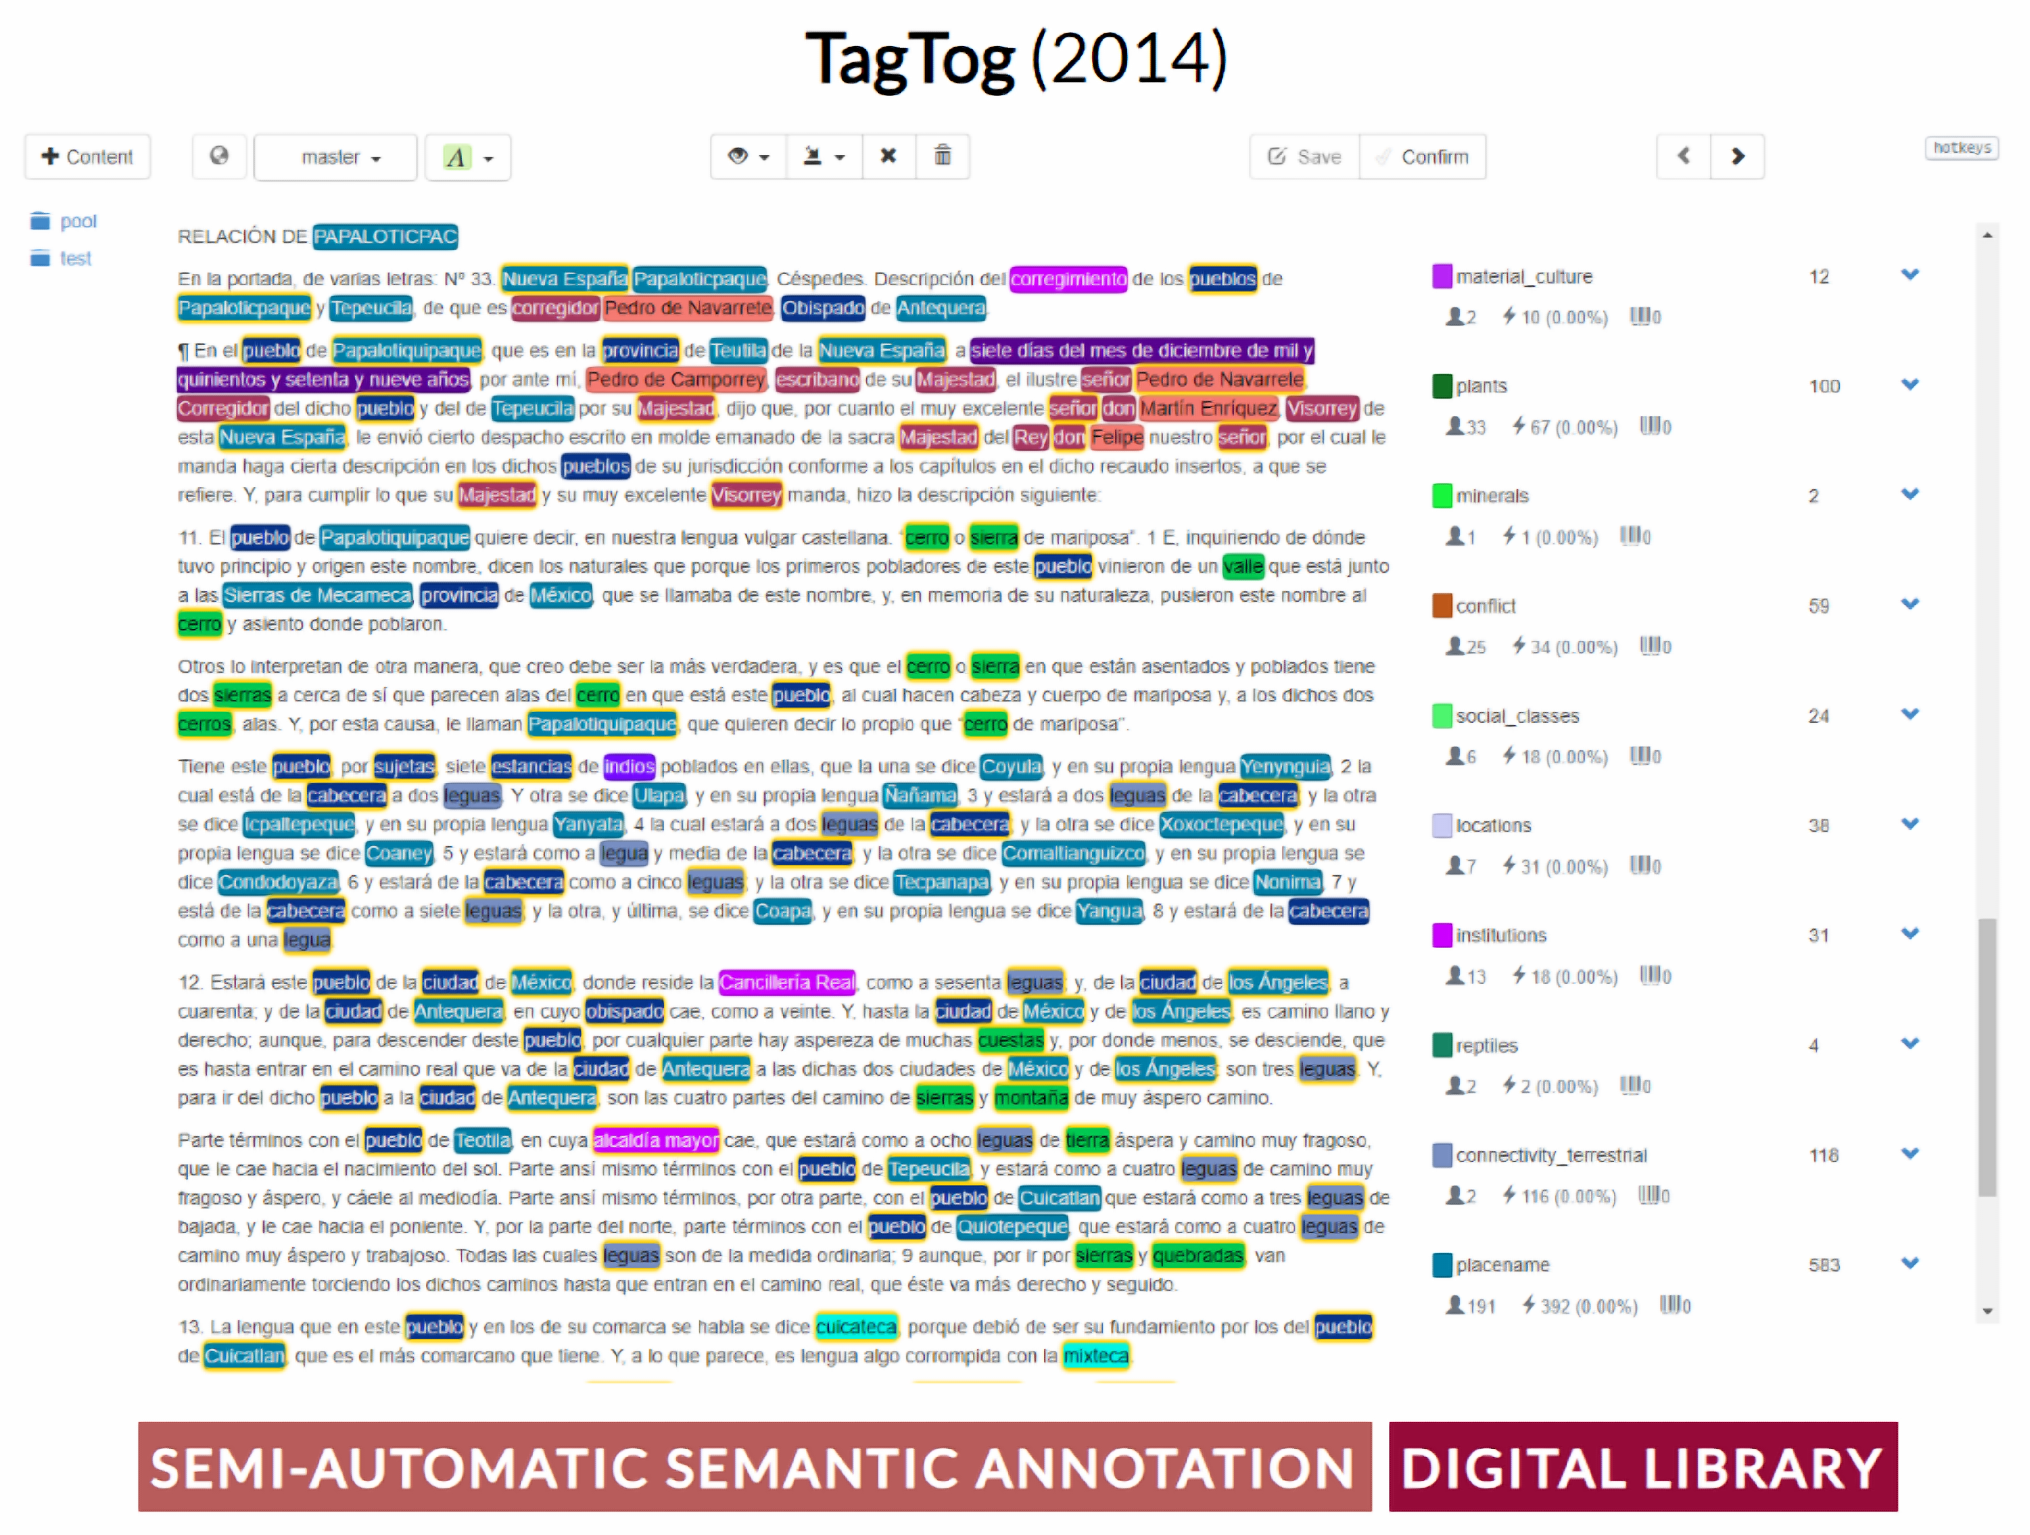
- Cejuela, J.M.; McQuilton, P.; Ponting, L.; Marygold, S.J.; Stefancsik, R.; Millburn, G.H.; FlyBase Consortium. tagtog: Interactive and text-mining-assisted annotation of gene mentions in PLOS full-text articles. Database 2014, 2014, bau033. [Google Scholar] [CrossRef]
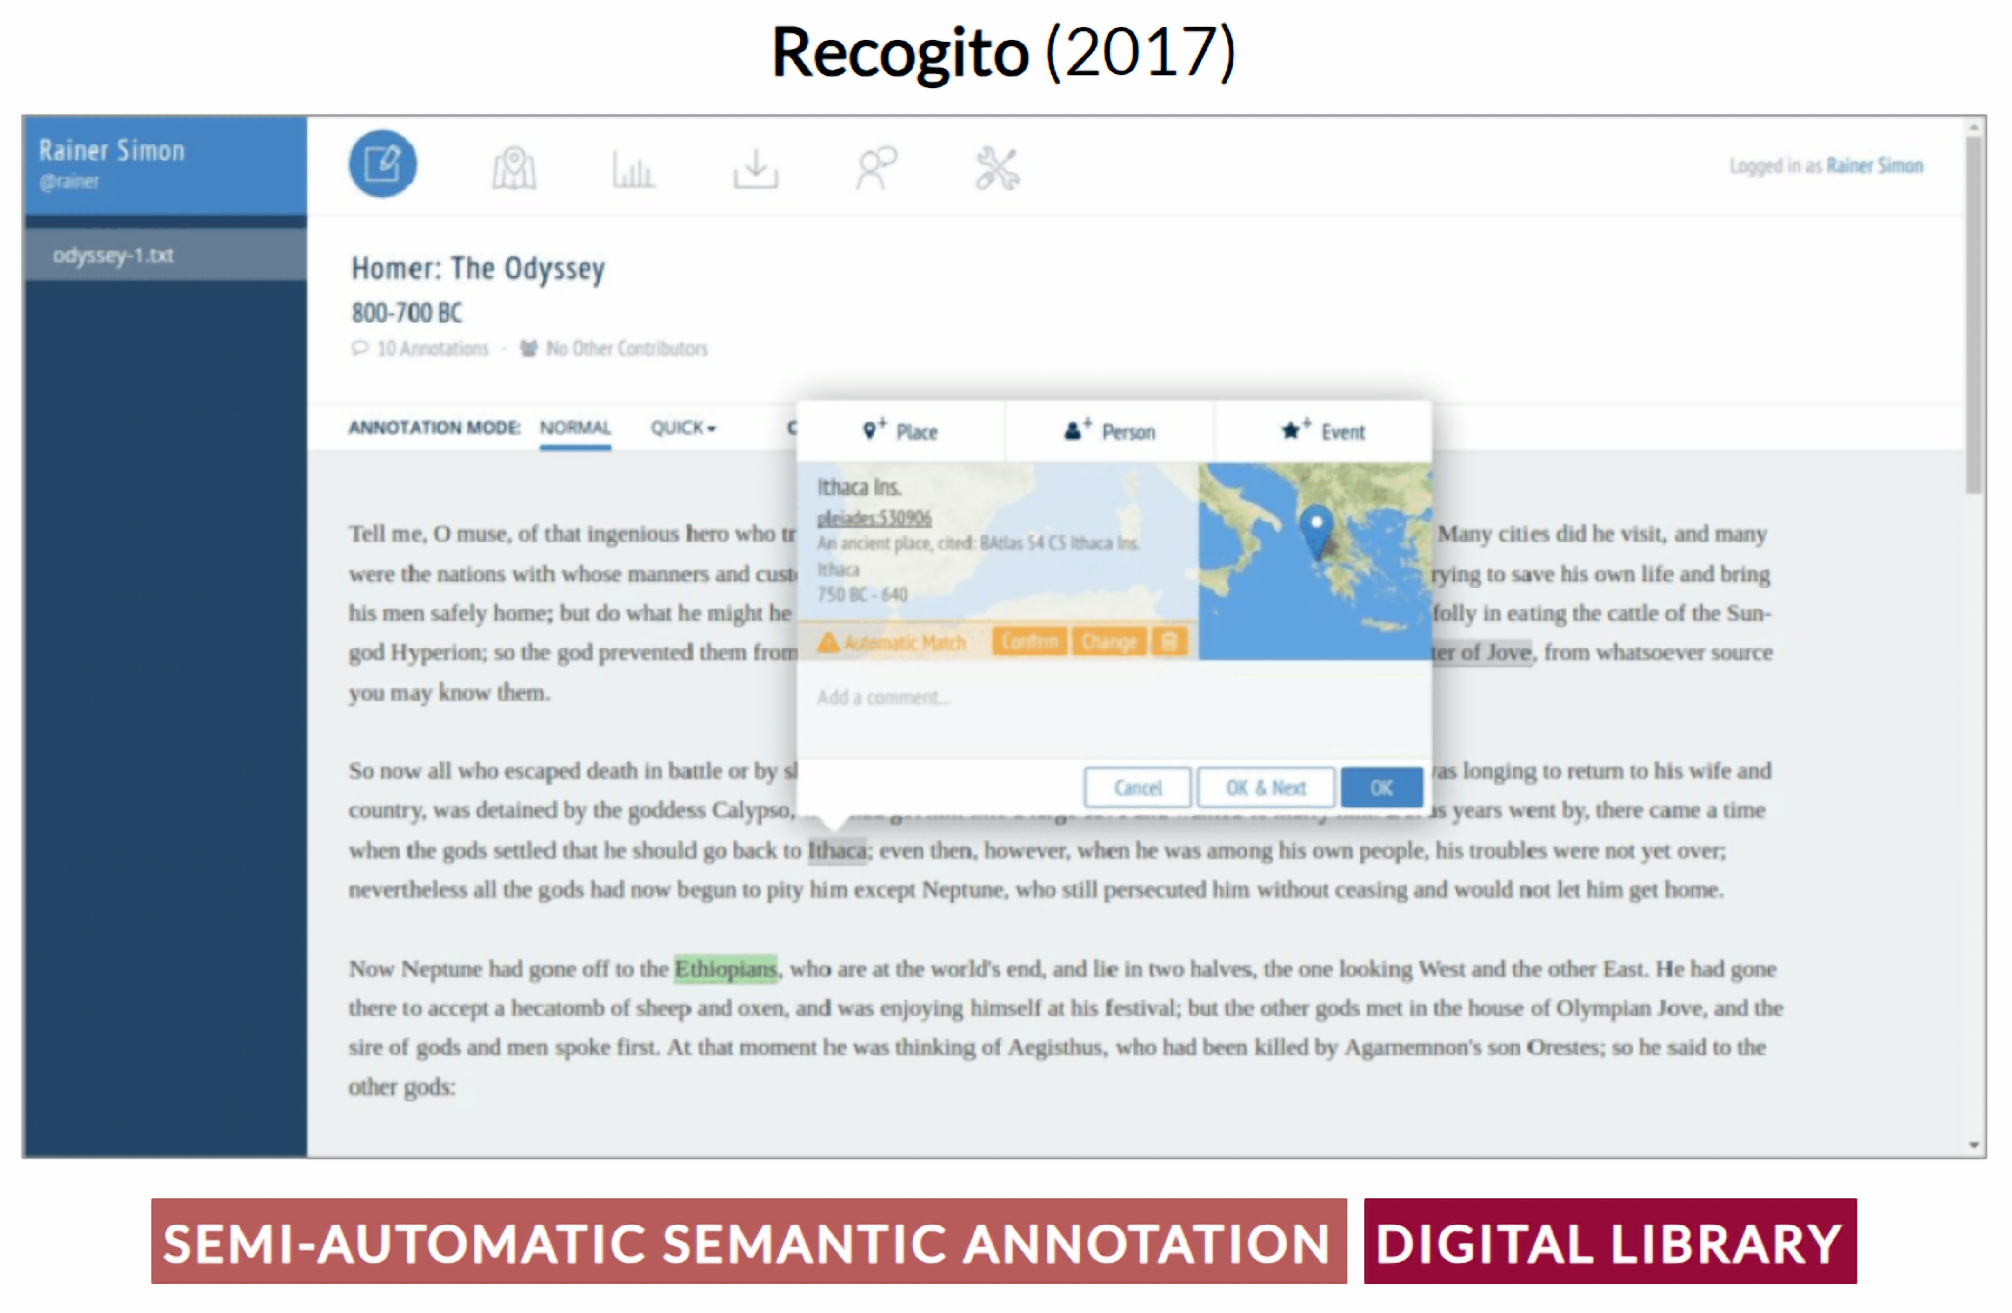
- Simon, R.; Barker, E.; Isaksen, L.; De Soto CaNamares, P. Linked Data Annotation Without the Pointy Brackets: Introducing Recogito 2. J. Map Geogr. Libr. 2017, 13, 111–132. [Google Scholar] [CrossRef]
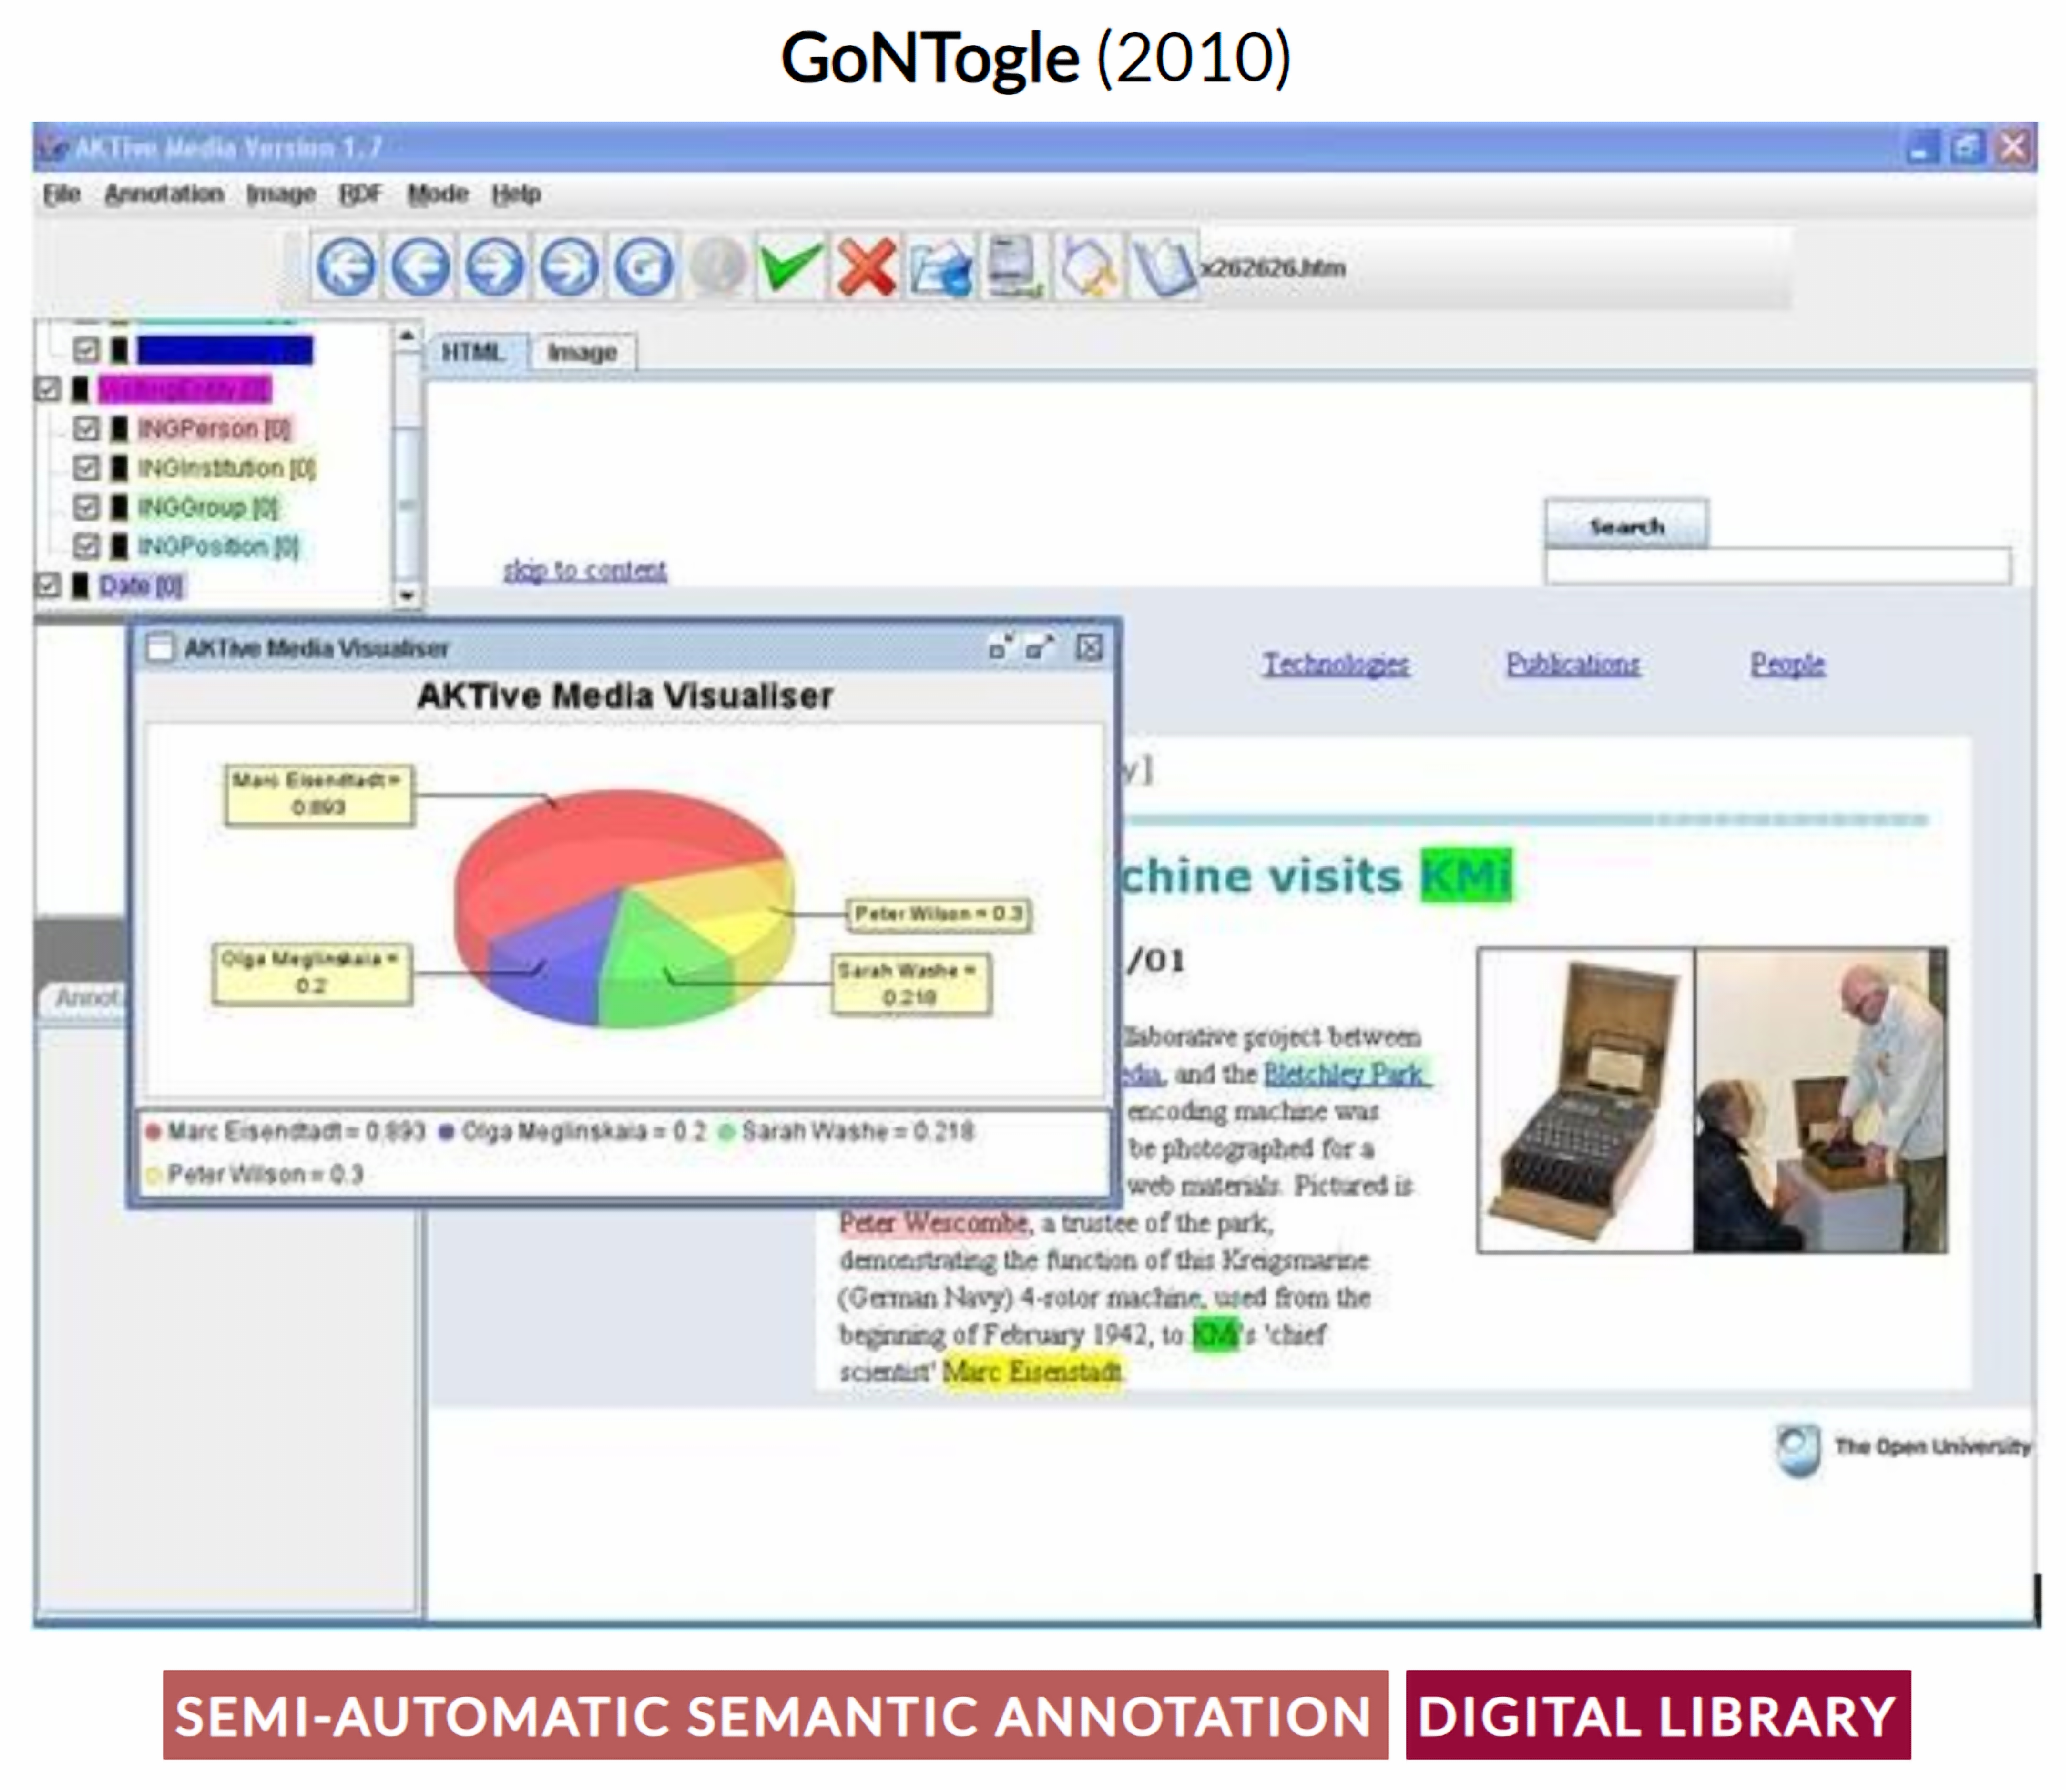
- Giannopoulos, G.; Bikakis, N.; Dalamagas, T.; Sellis, T. GoNTogle: A tool for semantic annotation and search. In Proceedings of the Extended Semantic Web Conference, ESWC 2010, Heraklion, Greece, 30 May–3 June 2010; Proceedings, Part II 7. Springer: Berlin/Heidelberg, Germany, 2010; pp. 376–380. [Google Scholar]
- Bolina, M. Yewno Discover. Nord. J. Inf. Lit. High. Educ. 2019, 11, 1. [Google Scholar] [CrossRef]
- Ikkala, E.; Hyvönen, E.; Rantala, H.; Koho, M. Sampo-UI: A full stack JavaScript framework for developing semantic portal user interfaces. Semant. Web 2021, 13, 69–84. [Google Scholar] [CrossRef]
- Bernasconi, E.; Ceriani, M.; Mecella, M.; Catarci, T. Design, realization, and user evaluation of the ARCA system for exploring a digital library. Int. J. Digit. Libr. 2023, 24, 1–22. [Google Scholar] [CrossRef] [PubMed]
- Bernasconi, E.; Ceriani, M.; Mecella, M.; Catarci, T.; Capanna, M.; Fazio, C.; Marcucci, R.; Pender, E.; Petriccione, F. ARCA. semantic exploration of a bookstore. In Proceedings of the International Conference on Advanced Visual Interfaces, Salerno, Italy, 28 September–2 October 2020; pp. 1–3. [Google Scholar] [CrossRef]
- Bernasconi, E.; Ceriani, M.; Mecella, M.; Morvillo, A. Automatic Knowledge Extraction from a Digital Library and Collaborative Validation. In Proceedings of the International Conference on Theory and Practice of Digital Libraries, Padua, Italy, 20–23 September 2022; pp. 480–484. [Google Scholar] [CrossRef]


Disclaimer/Publisher’s Note: The statements, opinions and data contained in all publications are solely those of the individual author(s) and contributor(s) and not of MDPI and/or the editor(s). MDPI and/or the editor(s) disclaim responsibility for any injury to people or property resulting from any ideas, methods, instructions or products referred to in the content. |
© 2023 by the authors. Licensee MDPI, Basel, Switzerland. This article is an open access article distributed under the terms and conditions of the Creative Commons Attribution (CC BY) license (https://creativecommons.org/licenses/by/4.0/).
Share and Cite
Bernasconi, E.; Ceriani, M.; Di Pierro, D.; Ferilli, S.; Redavid, D. Linked Data Interfaces: A Survey. Information 2023, 14, 483. https://doi.org/10.3390/info14090483
Bernasconi E, Ceriani M, Di Pierro D, Ferilli S, Redavid D. Linked Data Interfaces: A Survey. Information. 2023; 14(9):483. https://doi.org/10.3390/info14090483
Chicago/Turabian StyleBernasconi, Eleonora, Miguel Ceriani, Davide Di Pierro, Stefano Ferilli, and Domenico Redavid. 2023. "Linked Data Interfaces: A Survey" Information 14, no. 9: 483. https://doi.org/10.3390/info14090483
APA StyleBernasconi, E., Ceriani, M., Di Pierro, D., Ferilli, S., & Redavid, D. (2023). Linked Data Interfaces: A Survey. Information, 14(9), 483. https://doi.org/10.3390/info14090483