Article

Sentiment Analysis on Multimodal Transportation during the COVID-19 Using Social Media Data

1
Department of Civil Engineering and Engineering Mechanics, Columbia University, New York, NY 10027, USA
2
Data Science Institute, Columbia University, New York, NY 10027, USA
*
Author to whom correspondence should be addressed.
Information 2023, 14(2), 113; https://doi.org/10.3390/info14020113
Submission received: 13 December 2022 / Revised: 3 February 2023 / Accepted: 8 February 2023 / Published: 10 February 2023

Abstract

:
This paper aims to leverage Twitter data to understand travel mode choices during the pandemic. Tweets related to different travel modes in New York City (NYC) are fetched from Twitter in the two most recent years (January 2020–January 2022). Building on these data, we develop travel mode classifiers, adapted from natural language processing (NLP) models, to determine whether individual tweets are related to some travel mode (subway, bus, bike, taxi/Uber, and private vehicle). Sentiment analysis is performed to understand people’s attitudinal changes about mode choices during the pandemic. Results show that a majority of people had a positive attitude toward buses, bikes, and private vehicles, which is consistent with the phenomenon of many commuters shifting away from subways to buses, bikes and private vehicles during the pandemic. We analyze negative tweets related to travel modes and find that people were worried about those who did not wear masks on subways and buses. Based on users’ demographic information, we conduct regression analysis to analyze what factors affected people’s attitude toward public transit. We find that the attitude of users in the service industry was more easily affected by MTA subway service during the pandemic.

1. Introduction

The COVID-19 pandemic has a great impact on people’s travel behavior, mode choice in particular. Fearing that the subway systems accelerate virus spreading and infection, a majority of transit commuters have shifted to buses [1,2], private vehicles, or bikes [3], leading to adversarial impact including more speeding tickets, surging bike traffic, and more crashes with cyclist injuries [4]. As the lifeline of New York City (NYC), mass transit, including subways and buses, once carried over 6 million person trips daily and 1.5 billion annually, but this ridership has dropped by approximately 70% (for subways) and 50% (for buses) compared to 2019. Unfortunately, such a substantial drop in public transportation ridership has also been seen across the globe [5]. On the other hand, many people are surely in a disadvantaged position due to lack of accessibility to safer travel modes, given that 75% of essential workers are people of color and 60% of them are renters who spend on average 1.5 h commuting on public transportation [6].
The goal of this paper is to understand people’s attitudinal changes and concerns about different travel modes after the pandemic, which can assist urban planners and policymakers for greater preparedness and resilience to future pandemics.

1.1. Related Work

There are many studies leveraging the mobility data to study how aggregate traffic patterns evolve during the pandemic. A comprehensive analysis on public transit (i.e., subways and buses) has been conducted to investigate the relationship between the trend of mobility usage and the number of confirmed cases during the pandemic [7,8]. The impact of government policies on the mobility usage is mainly investigated in two phases: March 2020–May 2020 (i.e., the stay-at-home order [9]) and June 2020–August 2020 (i.e., the reopening phase [10]). In our work, the temporal range is January 2020–January 2022. We believe a long time window can well capture several waves of coronavirus after the pandemic. Survey data is also utilized to understand the impact of the pandemic on people’s travel patterns [2]. However, the number of respondents in the survey is limited. Compared to survey data, social media data allows us to more easily reach a larger population. Therefore, in this work, we aim to understand the attitude of individual users toward multimodal transportation by using social media data. We analyze people’s sentiments and concerns about travel modes and their mode choices in real world (i.e., mobility usage in NYC open data). This study is mainly focused on NYC for several reasons. First, NYC was the epicenter of the pandemic, which caused a substantial disruption to people’s travel activities. Secondly, NYC’s multimodal transportation infrastructure system, comprised of subways, buses, bicycles, taxis, and pedestrians, provides an ideal platform to understand how travel mode choices have shifted among various travel modes and to what extent transit is influenced due to people’s fear of coronavirus spreading in a closed environment. Thirdly, NYC data contains aggregate traffic counts of subway, bike, and taxi usage, which is a valuable source for comparison with social media data.
Existing work leverages social media data to analyze travel behaviors, including activity pattern classification [11], location inference [12], travel activity estimation [13], and longitudinal travel behavior inference [14]. A forecasting model is proposed to predict mode choices according to the check-in information of individual tweets [15]. Users’ travel frequency and similarity is studied to understand the impact of the pandemic [16]. These studies mainly focus on the check-in information on social media. However, the geolocation information obtained from social media check-ins is limited given the fact that many users do not disclose their latitude and longitude information when posting tweets. Many studies apply natural language processing (NLP) tools to a large amount of the textual information on social media. To identify traffic accidents, a classifier is developed to extract spatiotemporal information from tweets [17]. Some studies analyze the impact of tweets on public opinion regarding government policies [18,19] and information sharing and spreading [20,21]. The number of coronavirus-related contexts shows that social media has become a ubiquitous platform for health information sharing and education [20].

1.2. Contributions of This Paper

The contributions of this paper include: (1) We develop travel mode classifiers based on a transformer-based model (BERT) to determine whether tweets are related to mode choices or not. (2) Sentiment analysis is performed to study people’s attitude toward mode choices and concerns about different modes. We make a comparison of social media data and aggregate mobility usage in NYC open data. (3) We collect users’ demographic information and conduct a regression analysis to investigate what factors can influence people’s attitude toward public transit.
The remainder of the paper is organized as follows. Section 2 describes the data sample we use for analysis. Section 3 introduces how we develop travel mode and sentiment classifiers, using NLP tools. Section 4 presents results, including sentiment analysis on travel modes and regression analysis on users’ demographic information. Section 5 concludes the paper.

2. Data Collection

In this section, we introduce data collected from social media and NYC open data.

2.1. Social Media Data

Social media provides textual data like tweets. We use Twitter API to fetch tweets related to travel modes in NYC from January 2020 to January 2022. Keyword lists to collect tweets are shown as follows:
  • Subway: subway, metroline, path, MTA, LIRR, shuttle, train, light rail, transit.
  • Bus: bus, ferry, ferries, public transport.
  • Car: taxi, car, vehicle, parking, cab, Uber, Lyft.
  • Bike: bike, citibike, bicycle, bike share.
All tweets include user ID, username, tweet ID, tweet text, and timestamp. We collect 296,924 tweets in total.
Note that when we collect tweets by the keyword list-Car, we do not separate the mode choice-private vehicle from taxi/Uber. However, the mode-private vehicle plays a different role from taxi/Uber during the pandemic. We develop a travel model classifier to determine whether a tweet is related to private vehicle or taxi/Uber, which will be introduced in Section 3.2.
Social media also provides demographic information if there is no privacy restriction. With the ID of each user, we then manually collect demographic information, including gender, age and occupation (Section 4.2).

2.2. NYC Open Data

Mobility usage in NYC open data demonstrates the number of trips in different travel modes. The data includes:

3. Methodology

This section demonstrates how we leverage natural language processing (NLP) tools to analyze textual information from individual tweets. Figure 1 shows the work flow of our text mining. We first preprocess tweets and then adopt a transformer-based NLP model: bidirectional encoder representation from transformers (BERT) to develop travel mode and sentiment classifiers. Travel mode classifiers determine whether tweets are related to mode choices. The sentiment classifier determines sentiment categories (“positive” and “negative”) for tweets. Based on travel mode and sentiment classifiers, we can investigate the content of negative tweets related to different travel modes and analyze concerns about each travel mode. We introduce the details of our text mining methodology in the following subsections.

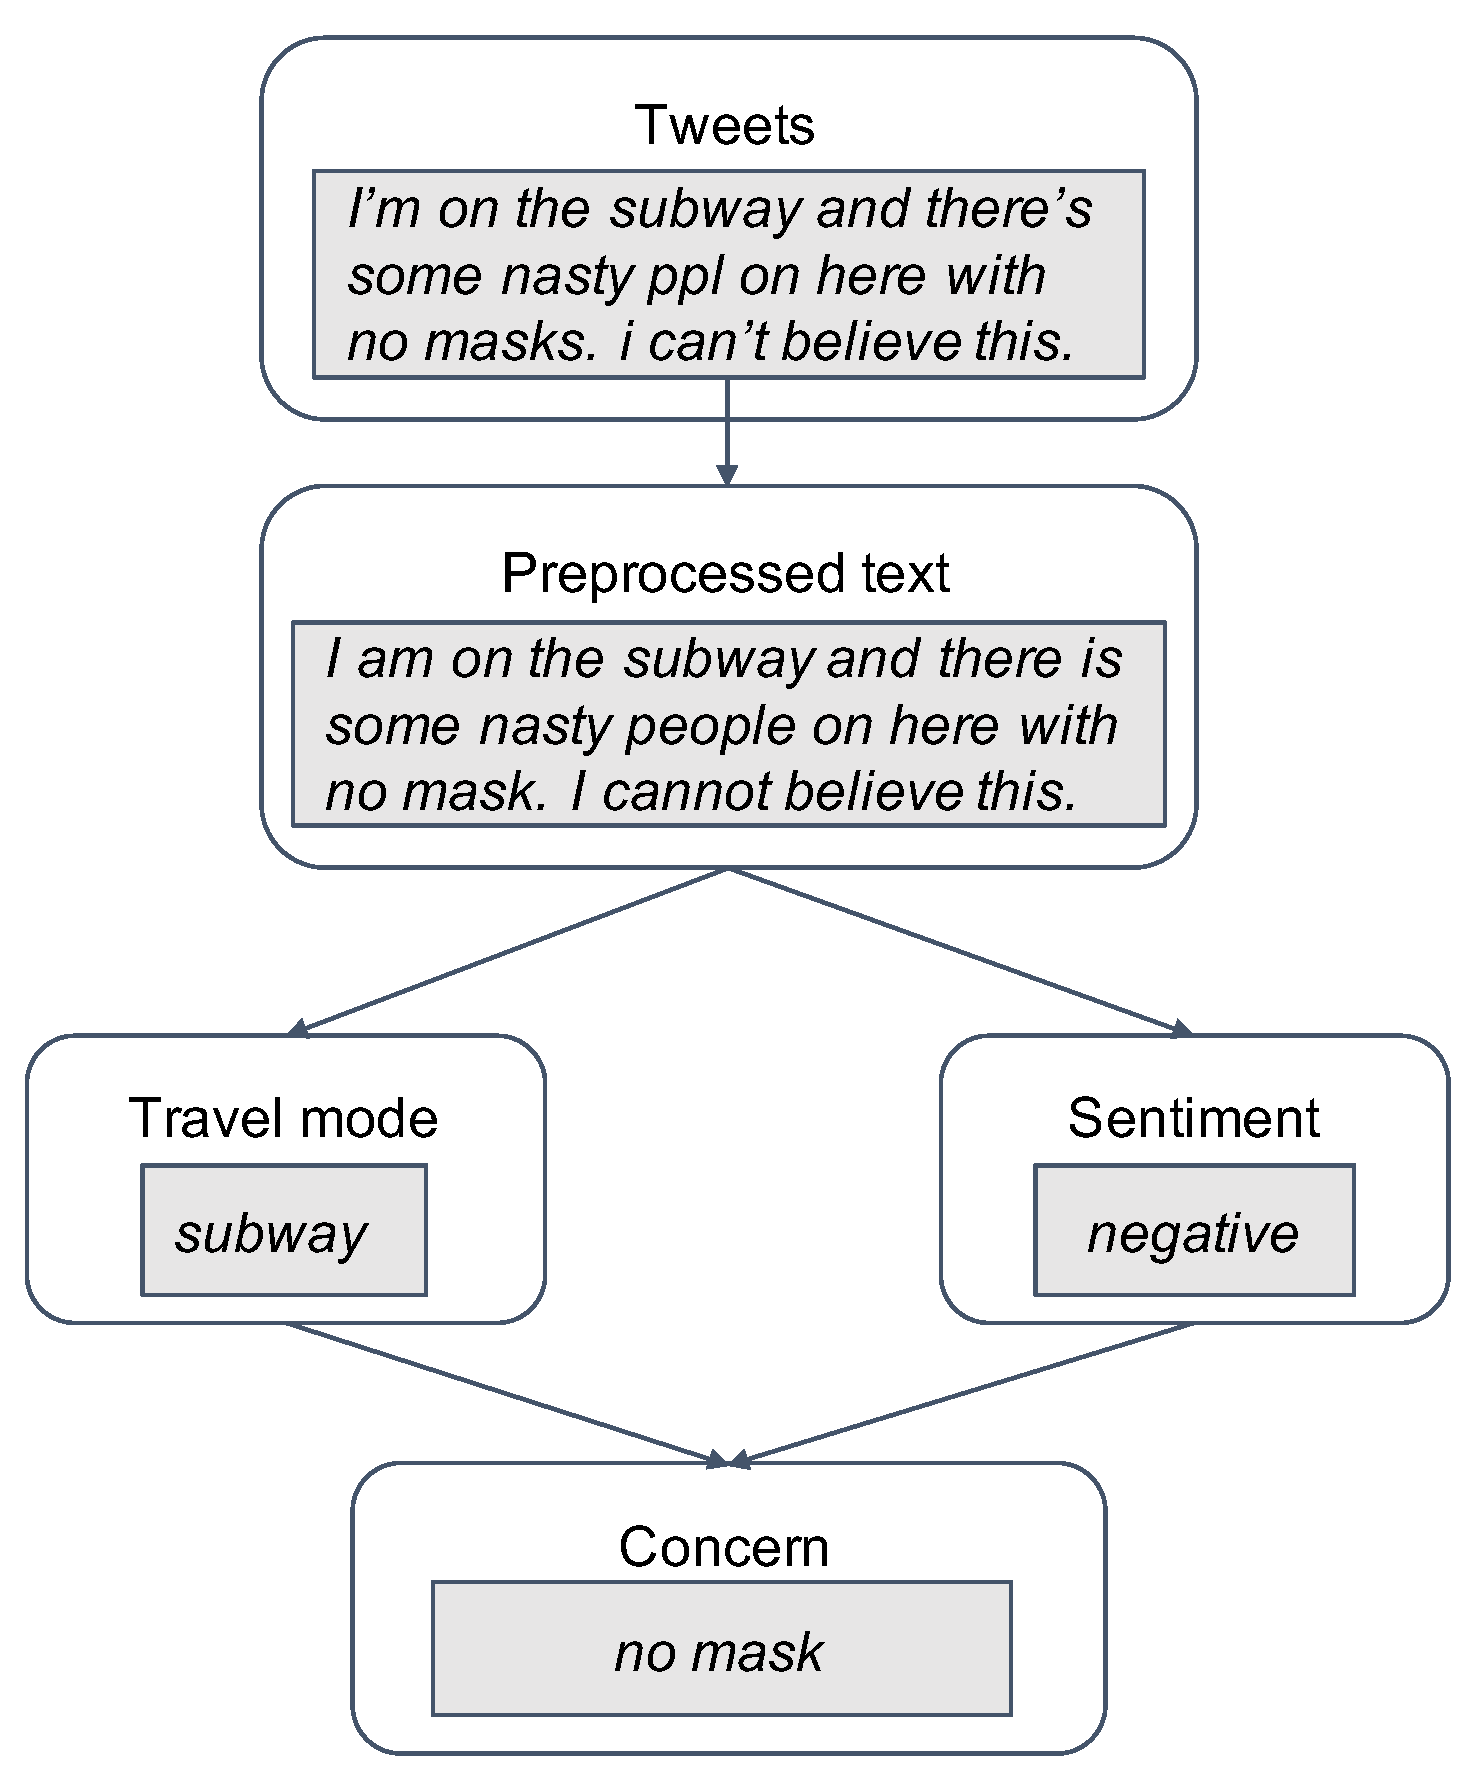
3.1. Data Preprocessing

We preprocess tweets as follows: (1) Convert accented characters to English. (2) Expand contractions. (3) Convert slang expressions to proper texts (https://github.com/Deffro/text-preprocessing-techniques/blob/master/slang.txt, accessed on 1 August 2021). We use the package “tweet-preprocessor” in Python3 to clean the data.

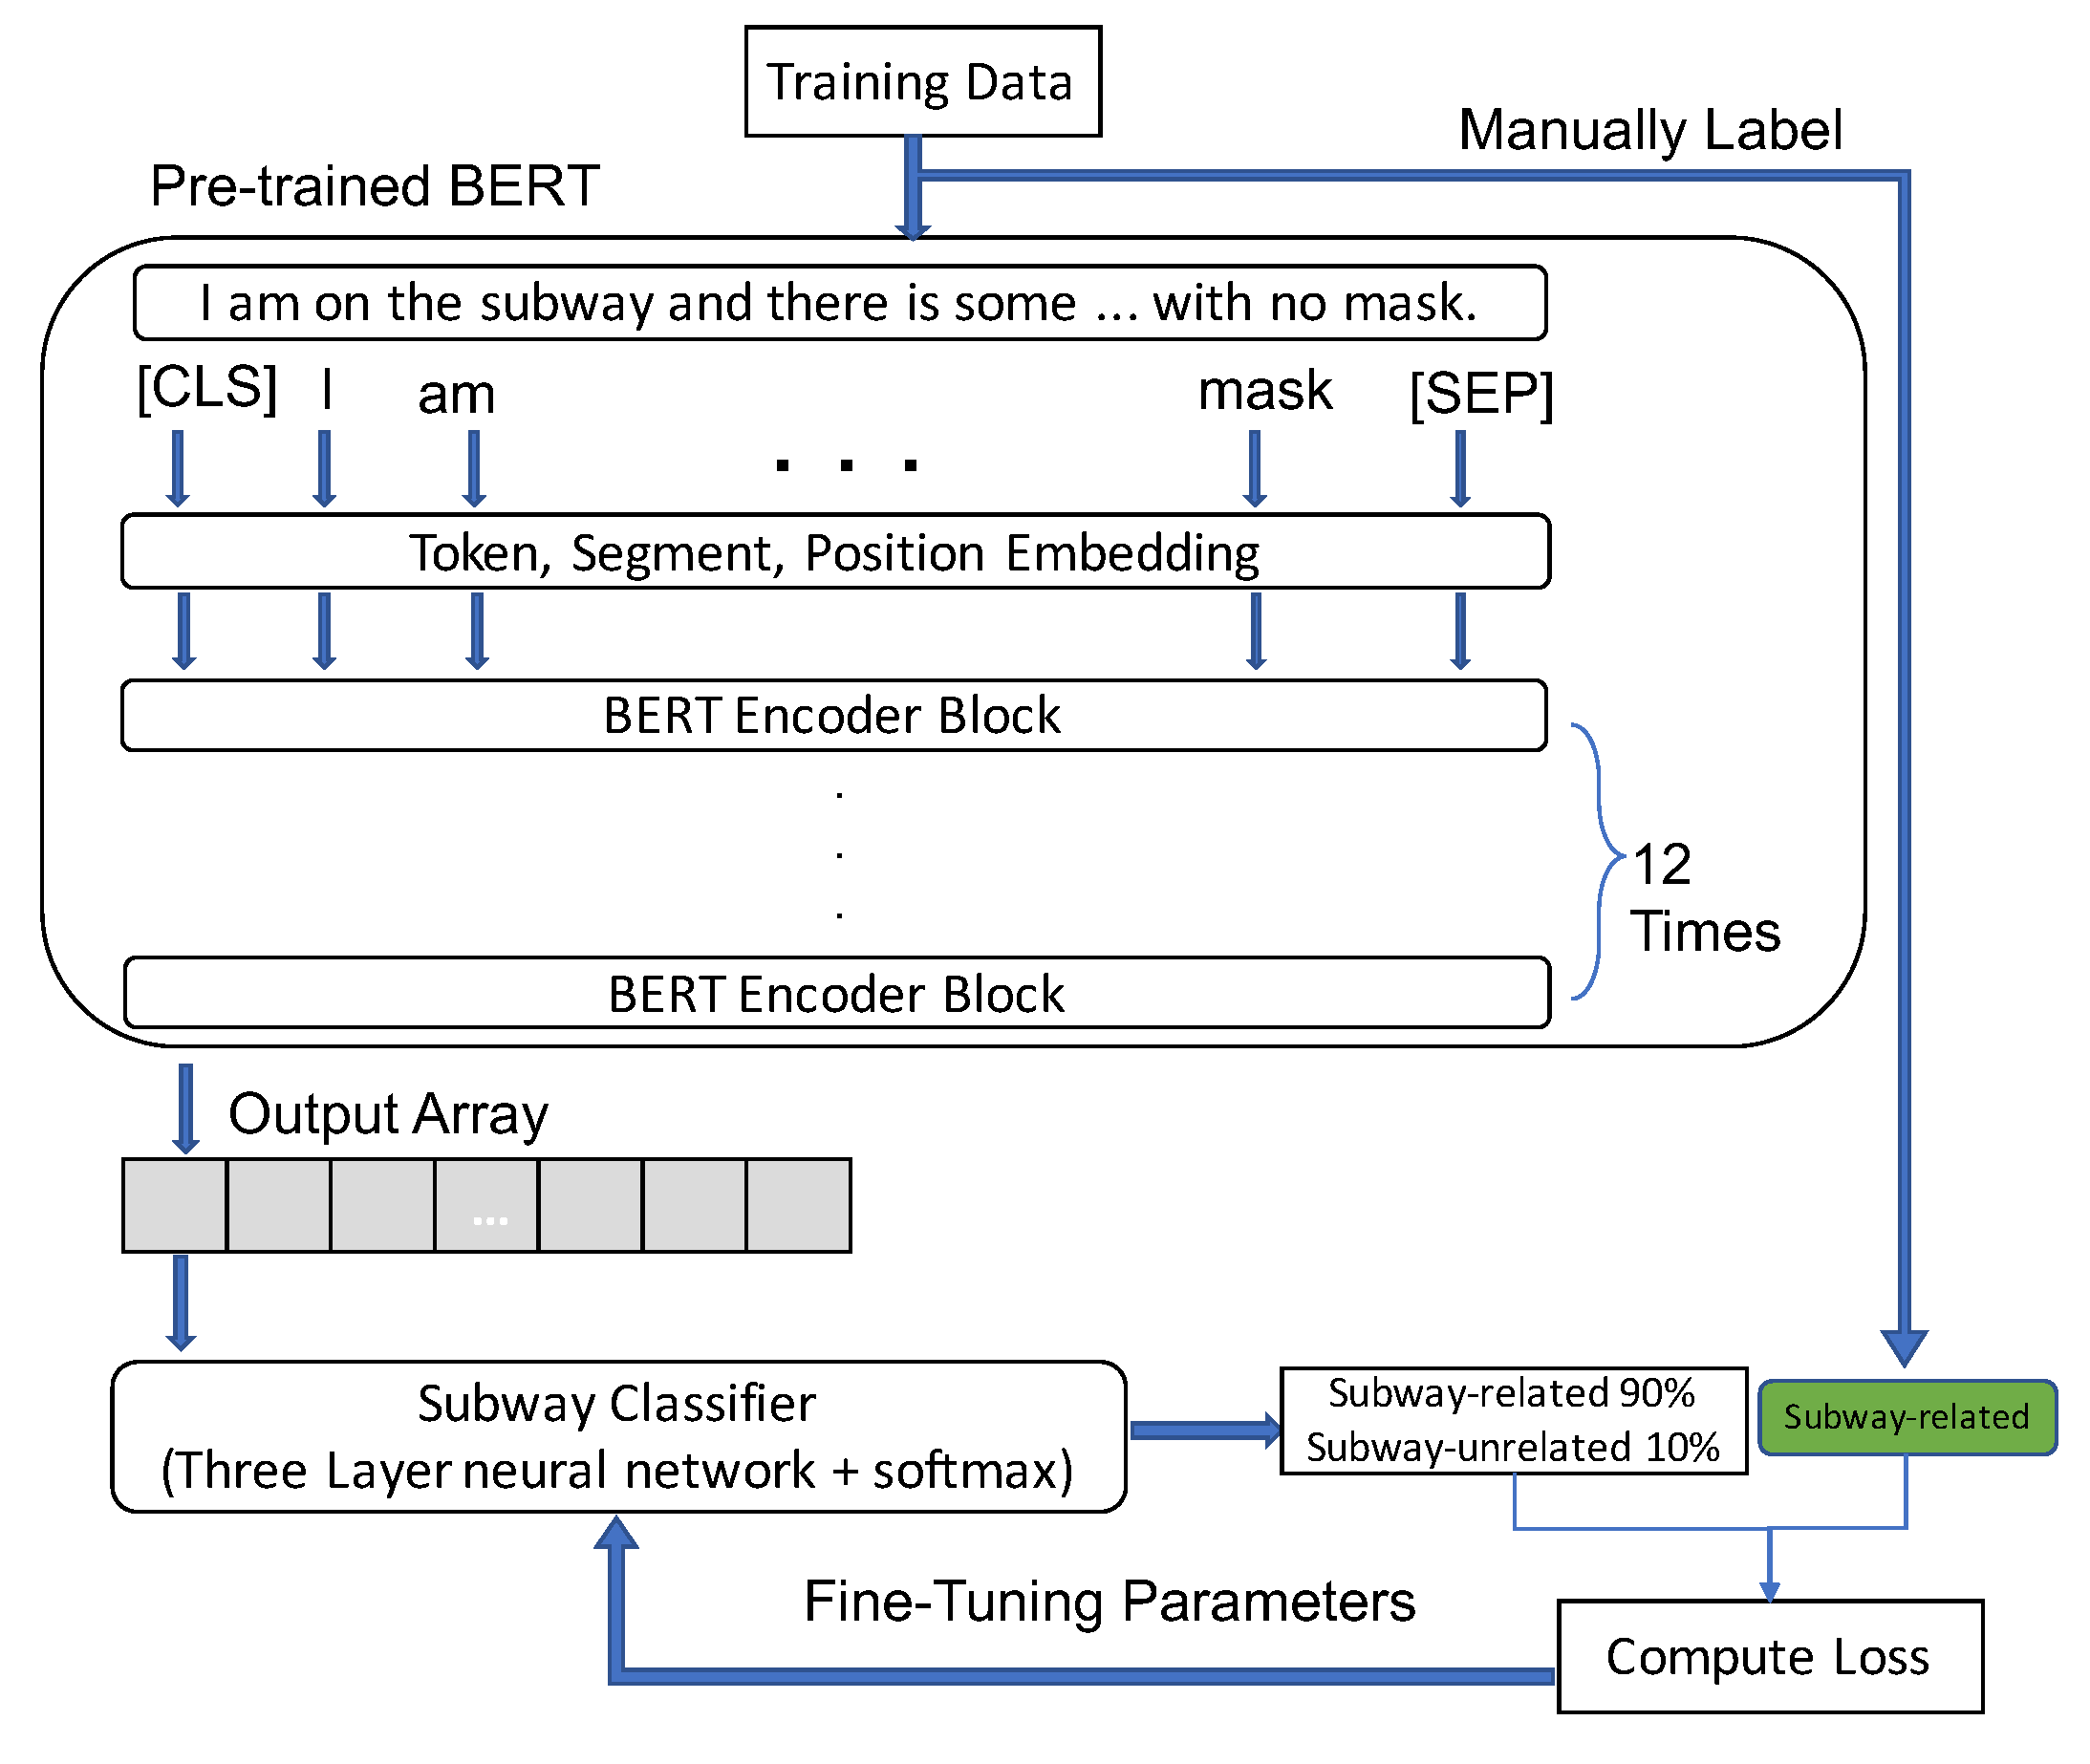
3.2. Travel Mode Classifier

To extract travel mode information from tweets, we need to first decide whether a tweet is related to some travel mode. Studies apply keyword lists to filter tweets regarding mode choices [15,18]. However, keyword lists induce noises in the data and lower the accuracy. For example, instead of a mode choice, “subway” refers to the Subway store in many tweets. Therefore, we build a classifier for each mode choice based on BERT [22] in order to determine whether a tweet is mode-related or mode-unrelated.
We first briefly introduce data labeling: For tweets collected by the keyword list of a mode choice (Section 2.1), we randomly select 2000 of them and manually label these tweets as mode-related or mode-unrelated. For example, “I’m on the subway and there is some nasty ppl on here with no masks. I can’t believe this” is labelled as “subway-related” (Figure 1). Note that we separate private vehicle from taxi/Uber in this work, because it is safe to use private vehicles when COVID-19 is spreading. Accordingly, tweets fetched by the keyword list of cars includes labels such as “private vehicle-related”, “taxi/Uber-related” or “car-unrelated”.
We use the labelled data to train the classifier for each mode and apply the trained model to determine mode choice for the remaining unlabelled data. Take the subway classifier as an example, we first look into the training process (Figure 2). The labelled data is split into training and validation data. The training data is the input of the flow chart. We first tokenize a sentence and add a token [CLS] in front of the sentence, which is used for classification tasks, and a separator token [SEP], representing the end of the sentence. The next step is to pass the tokenized sentence to a pretrained BERT encoding system [23]. The subway classifier is a neural network with one input layer, three hidden layers, and one output layer. The input of the classifier is the output representation from the pretrained BERT encoding system. The output of the classifier is the probability of “subway-related” and “subway-unrelated”. We choose cross-entropy as the loss function. After fine-tuning parameters in the neural network, the classifier can achieve 85.97% accuracy with our validation data.

3.3. Sentiment Classifier

Similar to travel mode classifiers, we develop a sentiment classifier to determine sentiment categories for each tweet: positive or negative. To train the sentiment classifier, we first label each tweet in a data sample with sentiment categories. Labellers are graduate students from departments of computer science, data science, and civil engineering. Each pair of students is assigned to the labeling work for tweets scraped by the keyword list of one category. For example, when two students label tweets collected by the keyword list of the subway category, each student works independently on the same data sample to identify the sentiment category of the tweet. For each pair of labellers, we calculated the proportion of tweets labeled as the same category to measure their concordance. If the concordance score is lower than 0.9 (i.e., more than 10% of tweets are marked by different categories), the data sample is then relabeled by another pair of labellers. The labelled data is split into training and validation data. The input of the classifier is the output representation of the original tweet in the pretrained BERT encoding system. The output of the classifier is the probability of sentiment categories. The classifier has one input layer, three hidden layers and one output layer with the softmax function as the activation function. After fine-tuning parameters in the neural network, the sentiment classifier can achieve 94% accuracy with our validation data.
We apply travel mode and sentiment classifiers to extract all negative tweets related to travel modes and analyze people’s attitudes toward each mode. The results are presented in Section 4.

4. Results

In this section, we aim to understand
  • how people’s attitudes toward travel mode choices change during the pandemic; and
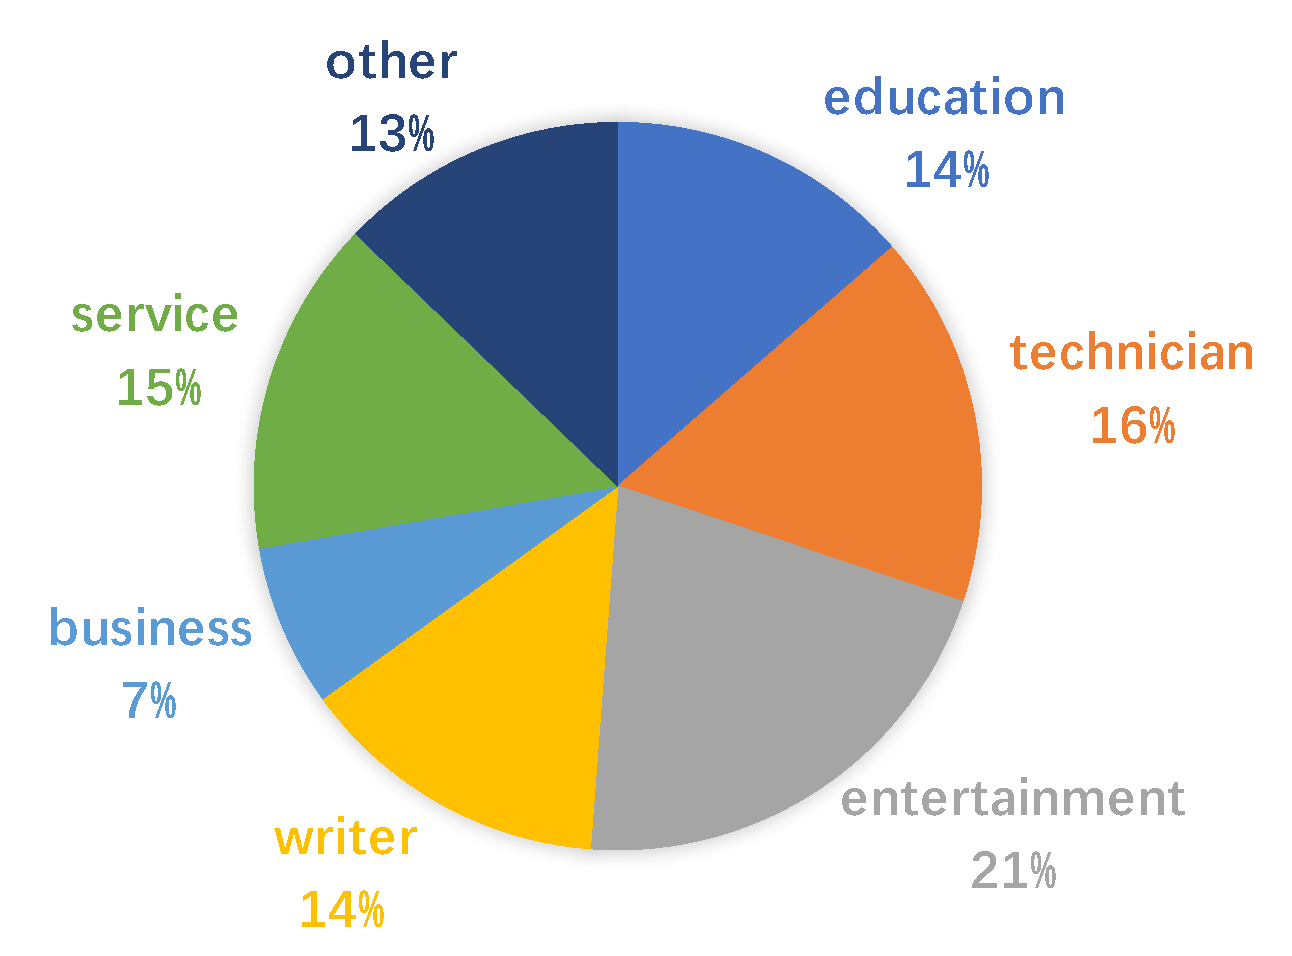
  • how users’ demographics impact their attitude toward mode choices.

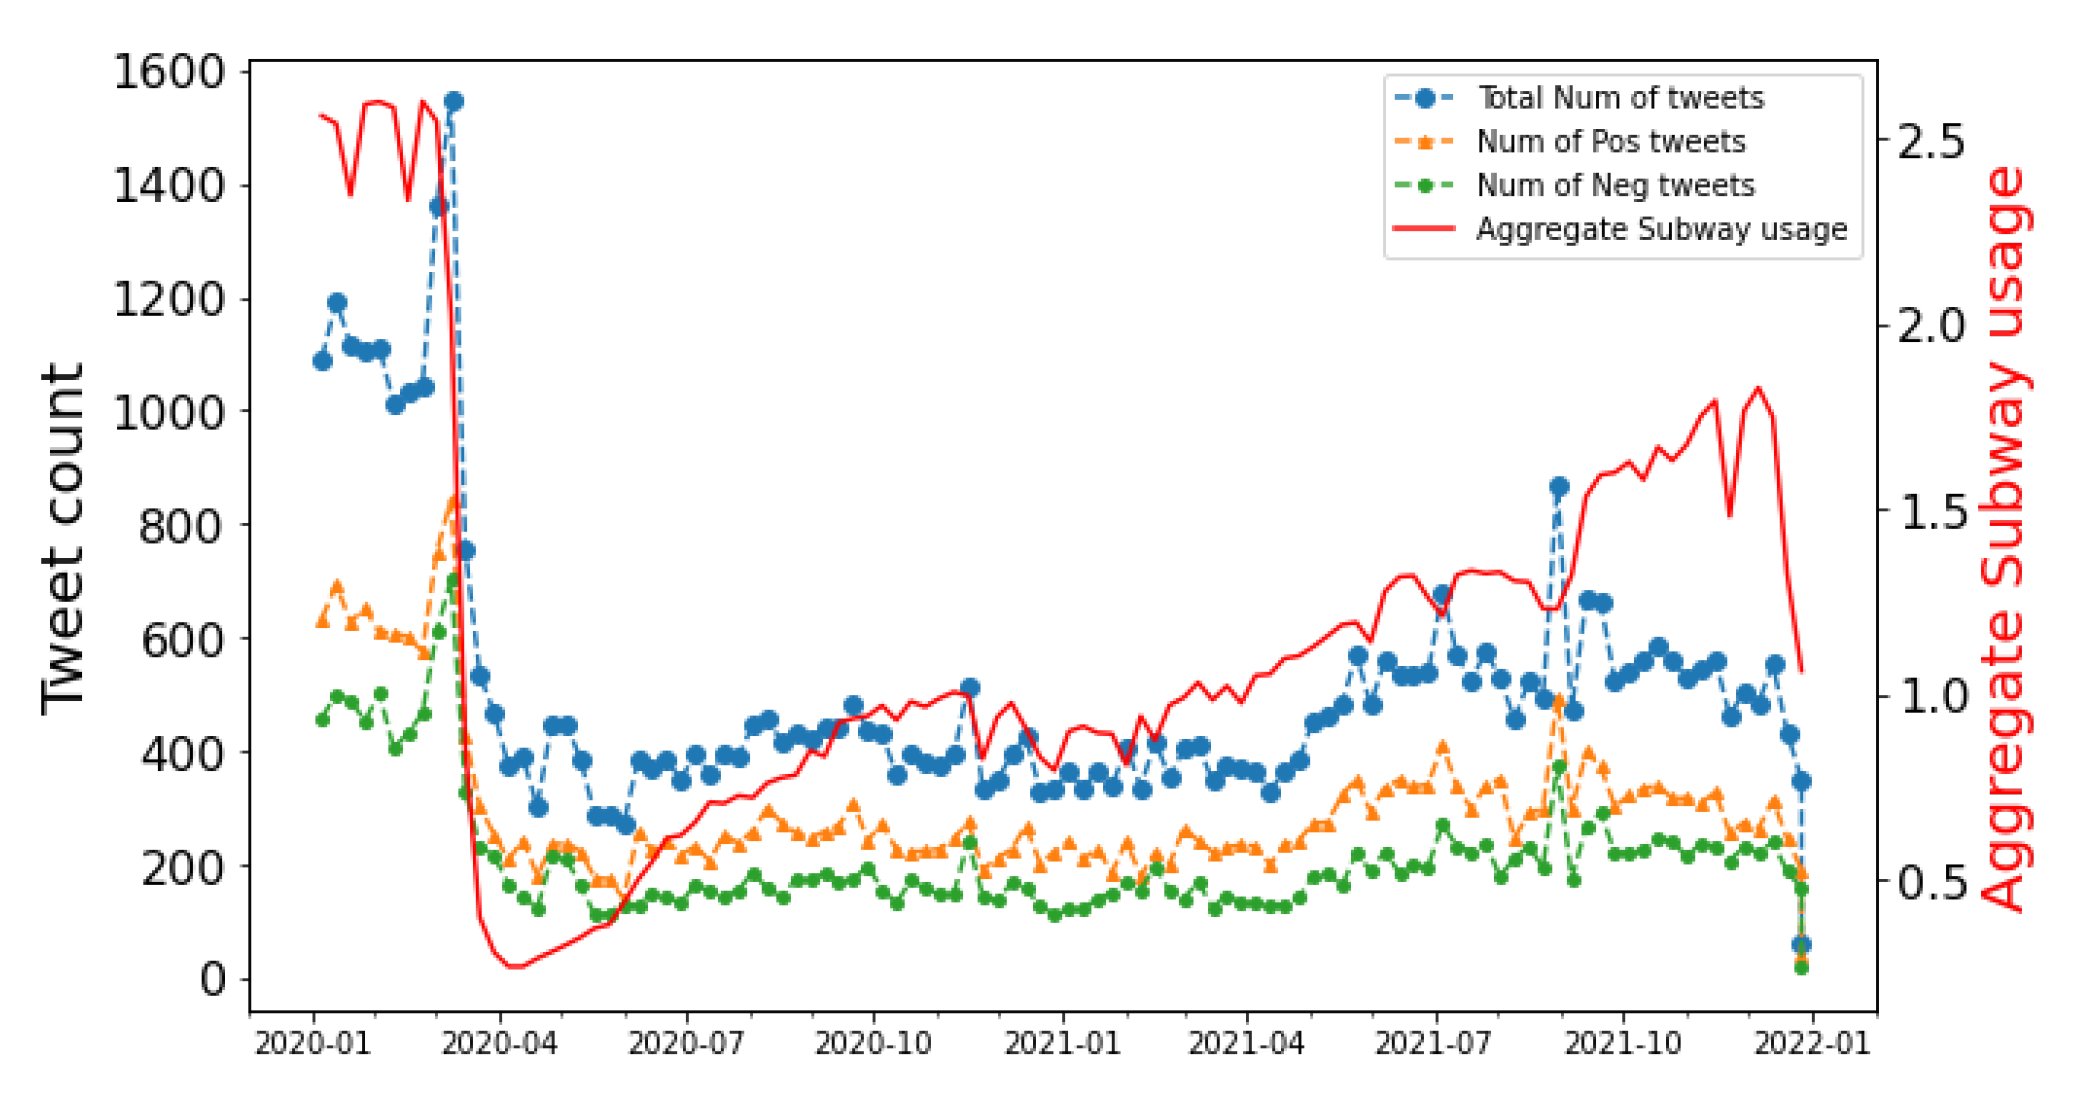
4.1. Sentiment Analysis on Travel Mode

In this subsection, we present people’s attitude and concerns toward travel modes, and a comparison of tweets related to travel modes and the mobility usage in NYC.
Figure 3 plots the number of tweets related to subway and the subway usage (unit: 1 × 10 7 ) in the real world. The x-axis is the timeline. The left and right y-axes represent the number of tweets and the number of subway trips in NYC, respectively. The blue dashed line is the total number of tweets related to subway. The orange and green dashed lines represent the number of positive and negative tweets, respectively. The red solid line is the total number of exits in subway stations.
People’s attitude toward subway. We look into orange (positive tweets) and green (negative tweets) lines. It is shown that before March 2020, more than 50% of users had a positive attitude toward the subway. The number of positive and negative tweets decreased by 50% around mid-March 2020. This means that the subway was less mentioned on social media when the stay-at-home order began. Note that the number of positive tweets shares the similar trend with the number of negative tweets across the timeline. This is because topics about subway usage are intensely debated among Twitter users, especially among those who are essential workers. For example, “yes, i wear my hospital badge now on the subway so that people will not come near me”.
Concerns about subway. Figure 4a uses a word cloud to present the content of negative tweets related to subway. One major concern is “mask”. People are worried about being infected by those who do not wear masks in the subway system. Many users complain about crowdedness (“people”) and traffic delay (“minutes”, “hours”). This is because the MTA reduced subway service in the last week in March 2020 and the first week in January 2022.
From social media to real world. We look into red and blue lines in Figure 3. The number of tweets related to subway decreased drastically around mid-March 2020, which is consistent with the trend of subway usage. This is because when the stay-at-home order began (22 March 2020), people did not travel and the subway was mentioned less on social media. The subway usage shows an increasing trend starting from June 2020 because people started getting back to work at the reopening phase (9 June 2020). The number of tweets related to the subway and subway usage kept going up after April 2021. This is because an increasing number of people traveled after they got the first vaccination. Note that the number of tweets and the subway usage starts decreasing near the end of 2021. This is probably because many people were afraid of the Omicron variant (November 2021), and travel demand decreased.
Figure 5 plots the number of tweets related to bikes and bike usage (unit: 1 × 10 5 ) in NYC open data. People’s attitude toward bike. We look into orange and green lines. More than 50% people had a negative attitude toward bikes before March 2020. The number of positive tweets slightly decreased when the stay-at-home order began and then increased after April 2020. The number of negative tweets went down after mid-March 2020. It means that a majority of users had a positive attitude toward bikes during the pandemic. Note that after 2021, the number of negative tweets related to bikes increased while the number of positive ones decreased. This is because many people complained about parking space and bike lanes occupied by private vehicles (Figure 4b). For example, “Toyota xxx blocked the bike lane near 6 Lexington Ave”.
Concerns about bikes. Figure 4b shows that in contrast to public concerns about the subway, the major concern of bike does not include anything related to the pandemic. Most negative tweets are about bike lanes and parking spaces. For example, “just riding my bike merrily along the east river green way lane and boom, a new chain link fence blocking my way. lane closed. no warning no detour signs”.
From social media to real-world. We look into red and blue lines in Figure 5. It is shown that the total number of tweets shared a similar trend with bike usage in NYC. The number of tweets and bike trips slightly decreased around mid-March 2020. This is because travel demand decreased when the stay-at-home order began. After April 2020, the number of bike trips and tweets related to bike went up because many commuters shifted from subways to bikes during the pandemic. We also find that the bike usage has a seasonal pattern: during the winter, the bike usage decreased and bike was less mentioned on social media.
Figure 6 plots the number of tweets related to buses. The blue line denotes the total number of tweets. The orange and green lines represent the number of positive and negative tweets, respectively.
People’s attitude toward buses. It is shown that a majority of people had a positive attitude toward buses. The total number of tweets related to buses decreased around mid-March 2020. This is because travel demand decreased after the stay-at-home order. The total number of tweets increased by 50% around June 2020. It indicates that users consider buses as a reliable travel mode during the pandemic.
Concerns about buses. Figure 4c shows that in contrast to public concerns about subways or bikes, the major concern about the bus is the “driver”. Many users complain about bus drivers. For example, “the bus driver used many swear words”. Some people are also worried about those who do not wear masks on buses.
From social media to real world. Our finding from tweets that a majority of users have a positive attitude toward buses is consistent with the conclusion in [1] that the bus usage increased during the pandemic.
Figure 7 plots the number of tweets related to taxi/Uber and the taxi usage (unit: 1 × 10 6 ) in NYC. People’s attitude toward taxi/Uber. We look into the orange and green lines. It is shown that after March 2020, the number of positive and negative tweets decreased by 40% and 65%, respectively. This is because travel demand decreased and taxi/Uber was less mentioned on Twitter. During the time period of April 2020-June 2020, a majority of people (more than 70%) had a positive attitude toward taxi/Uber. This is probably because many commuters considered taxi/Uber as a good substitute for the subway.
Concerns about taxi/Uber. Figure 4d shows that the major concern about taxis/Ubers was the price because the trip fare increased during the pandemic [24].
From social media to real world. We look into blue and red lines in Figure 7. The number of tweets related to taxi/Uber decreased by 56% after mid-March 2020, which is consistent with the trend of taxi usage. The explanation is that travel demand decreased after the stay-at-home order. After May 2020, the number of taxi trips slowly increased.
Figure 8 plots the number of tweets related to private vehicles. People’s attitude toward private vehicles. The orange line indicates that most tweets related to private vehicles are positive. The number of tweets related to private vehicle decreased by 20% when the stay-at-home order (22 March 2020) began because travel demand decreased. After that, the number of tweets related to private vehicles increased and reached a peak around June 2020. This is probably because people considered private vehicle as a reliable travel mode during the pandemic.
Concerns about private vehicles. Figure 4e shows that public concerns on private vehicles are about persistent issues, including street conditions and parking spaces.
From social media to real world. Our finding from tweets that a majority of people have a positive attitude toward private vehicle is consistent with the conclusion in [3] that the usage of private vehicles increased during the pandemic.
We summarize our findings as follows.
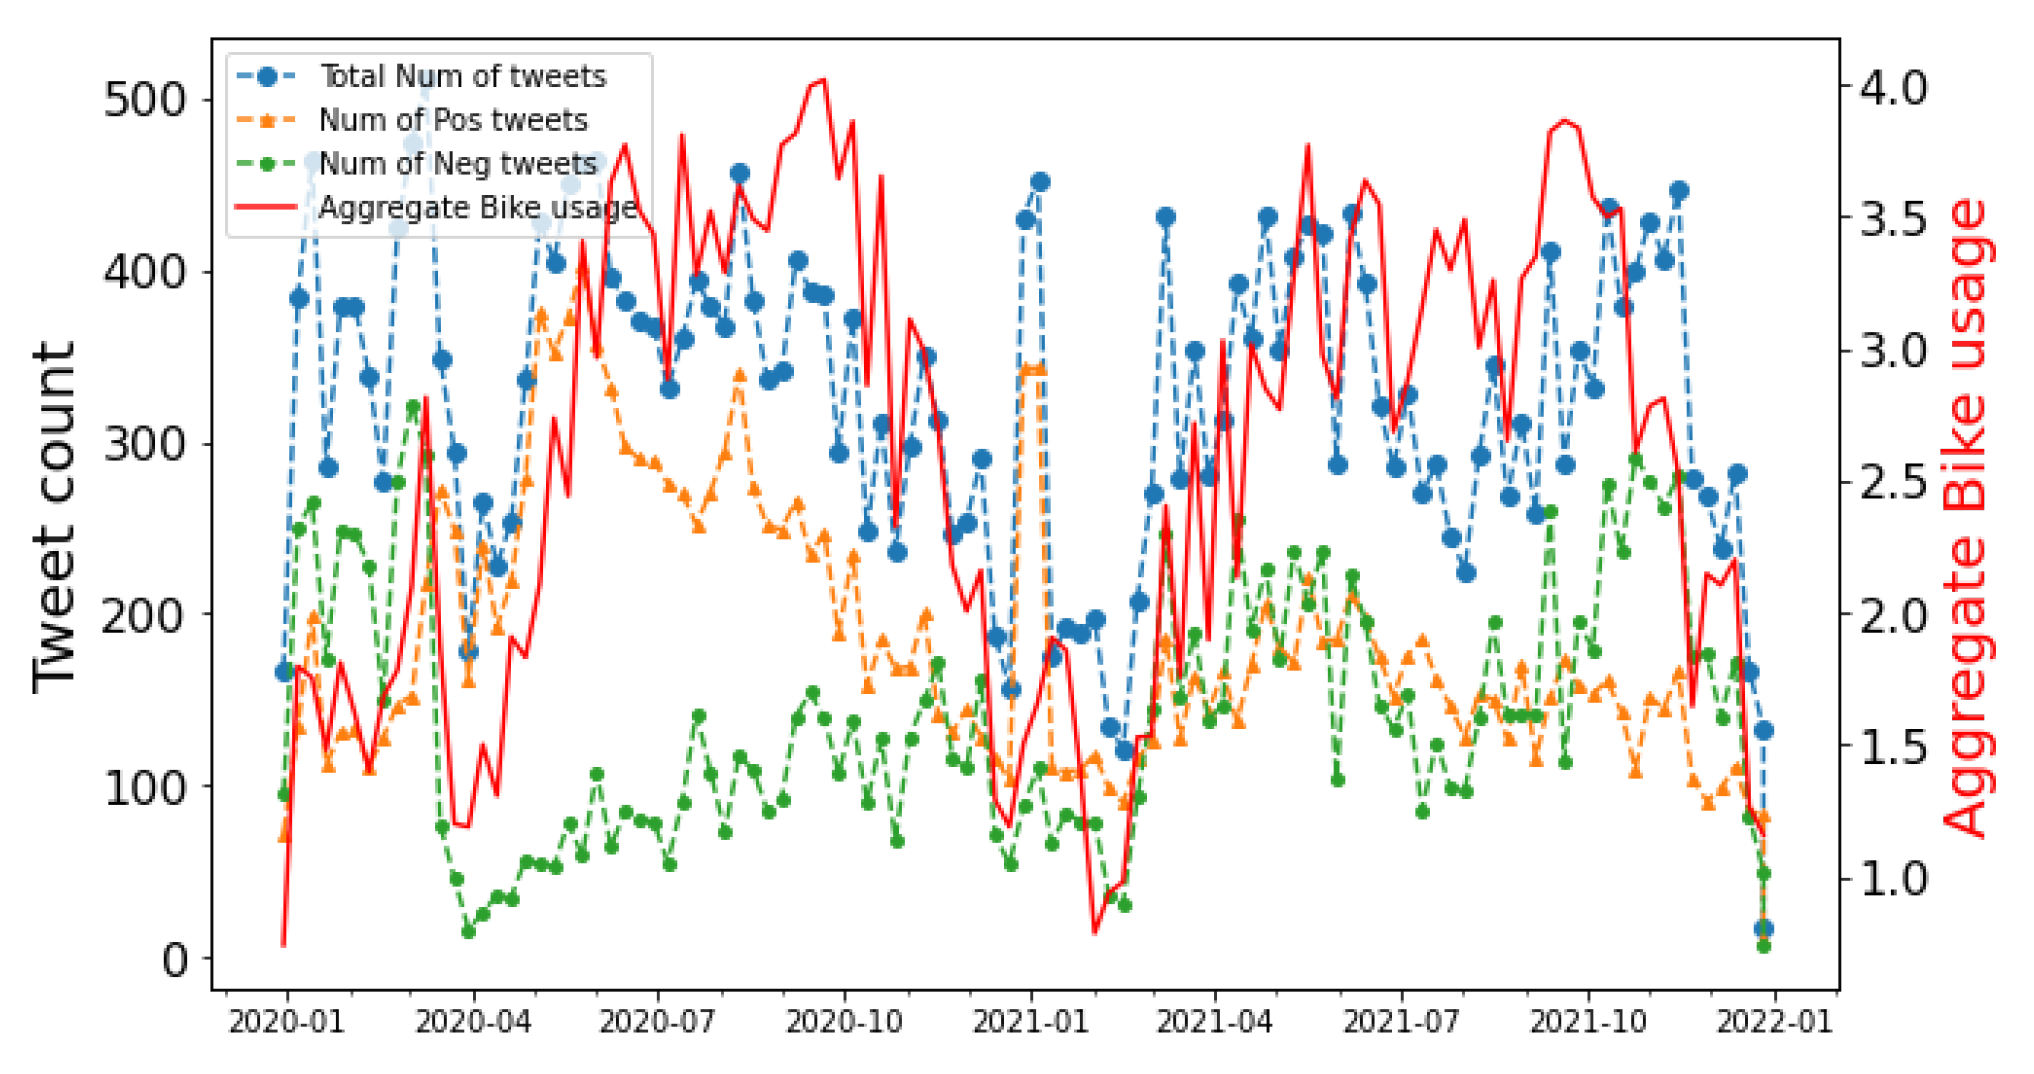
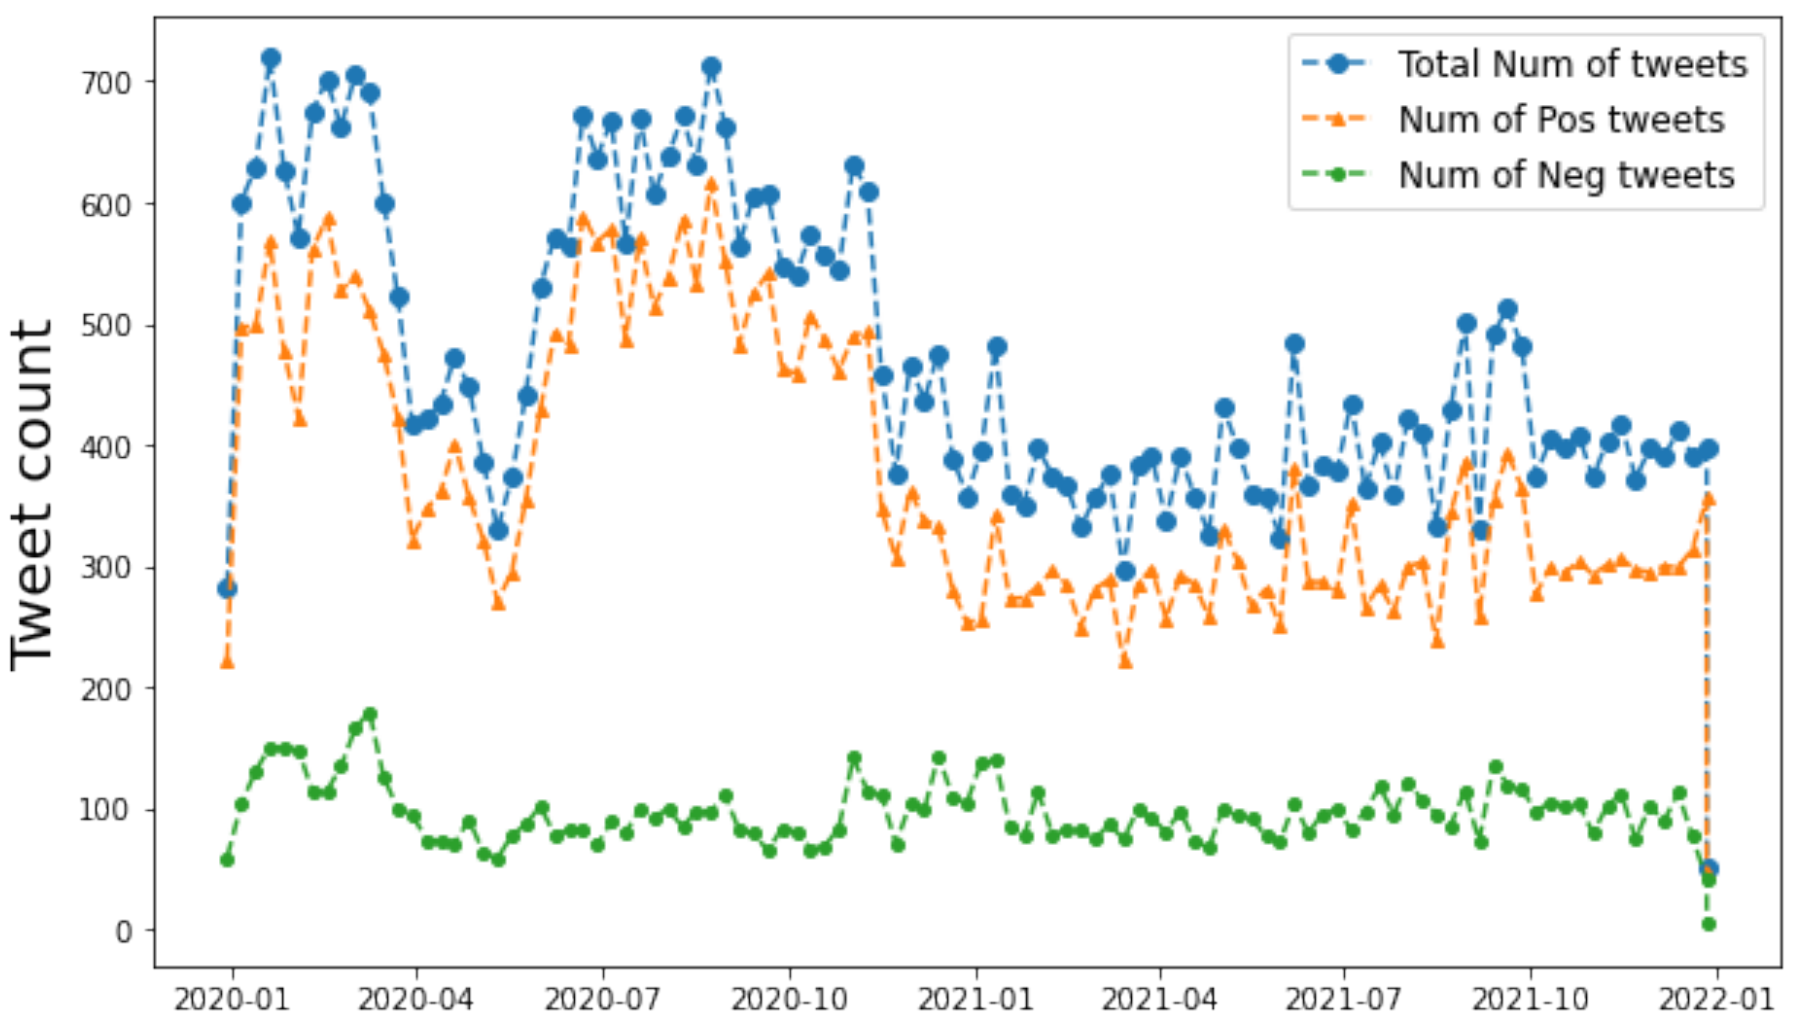
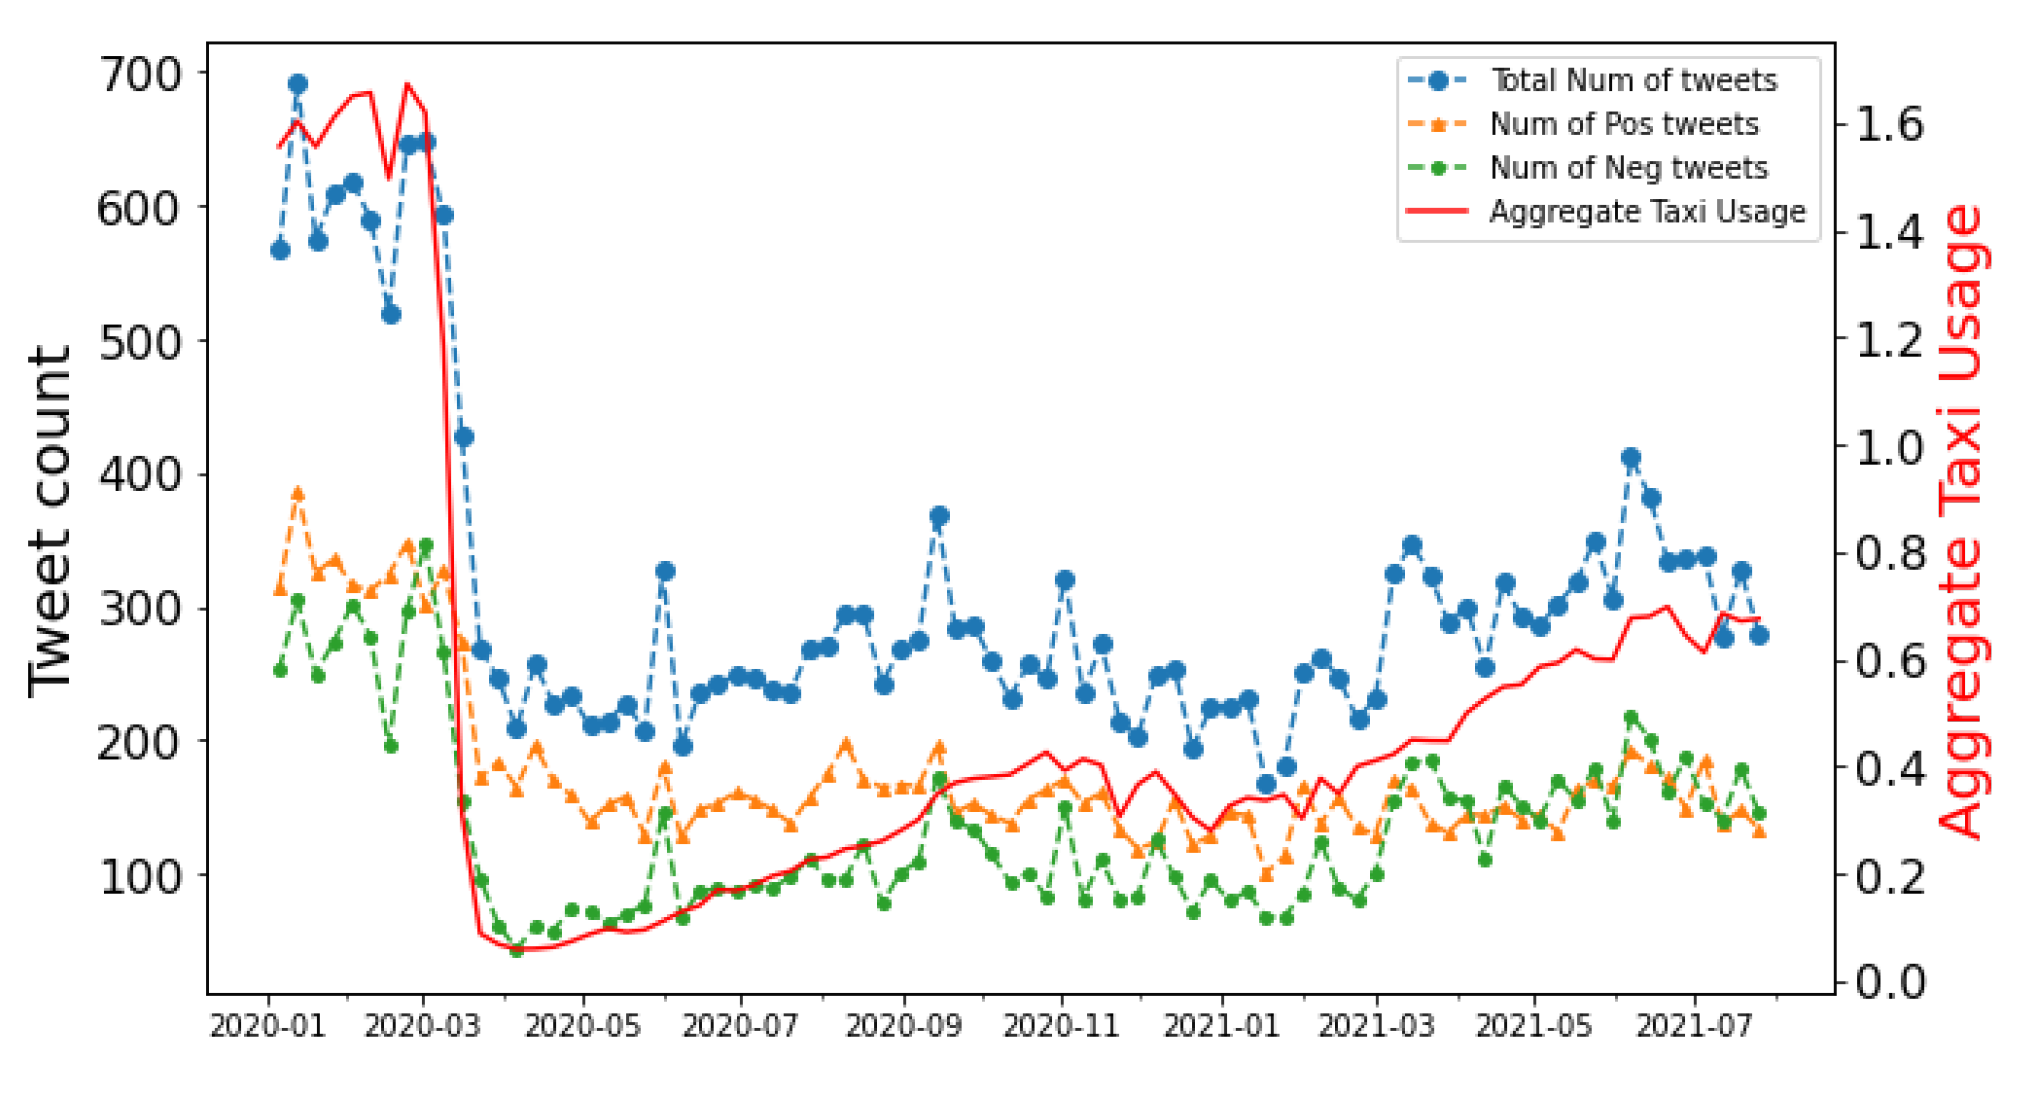
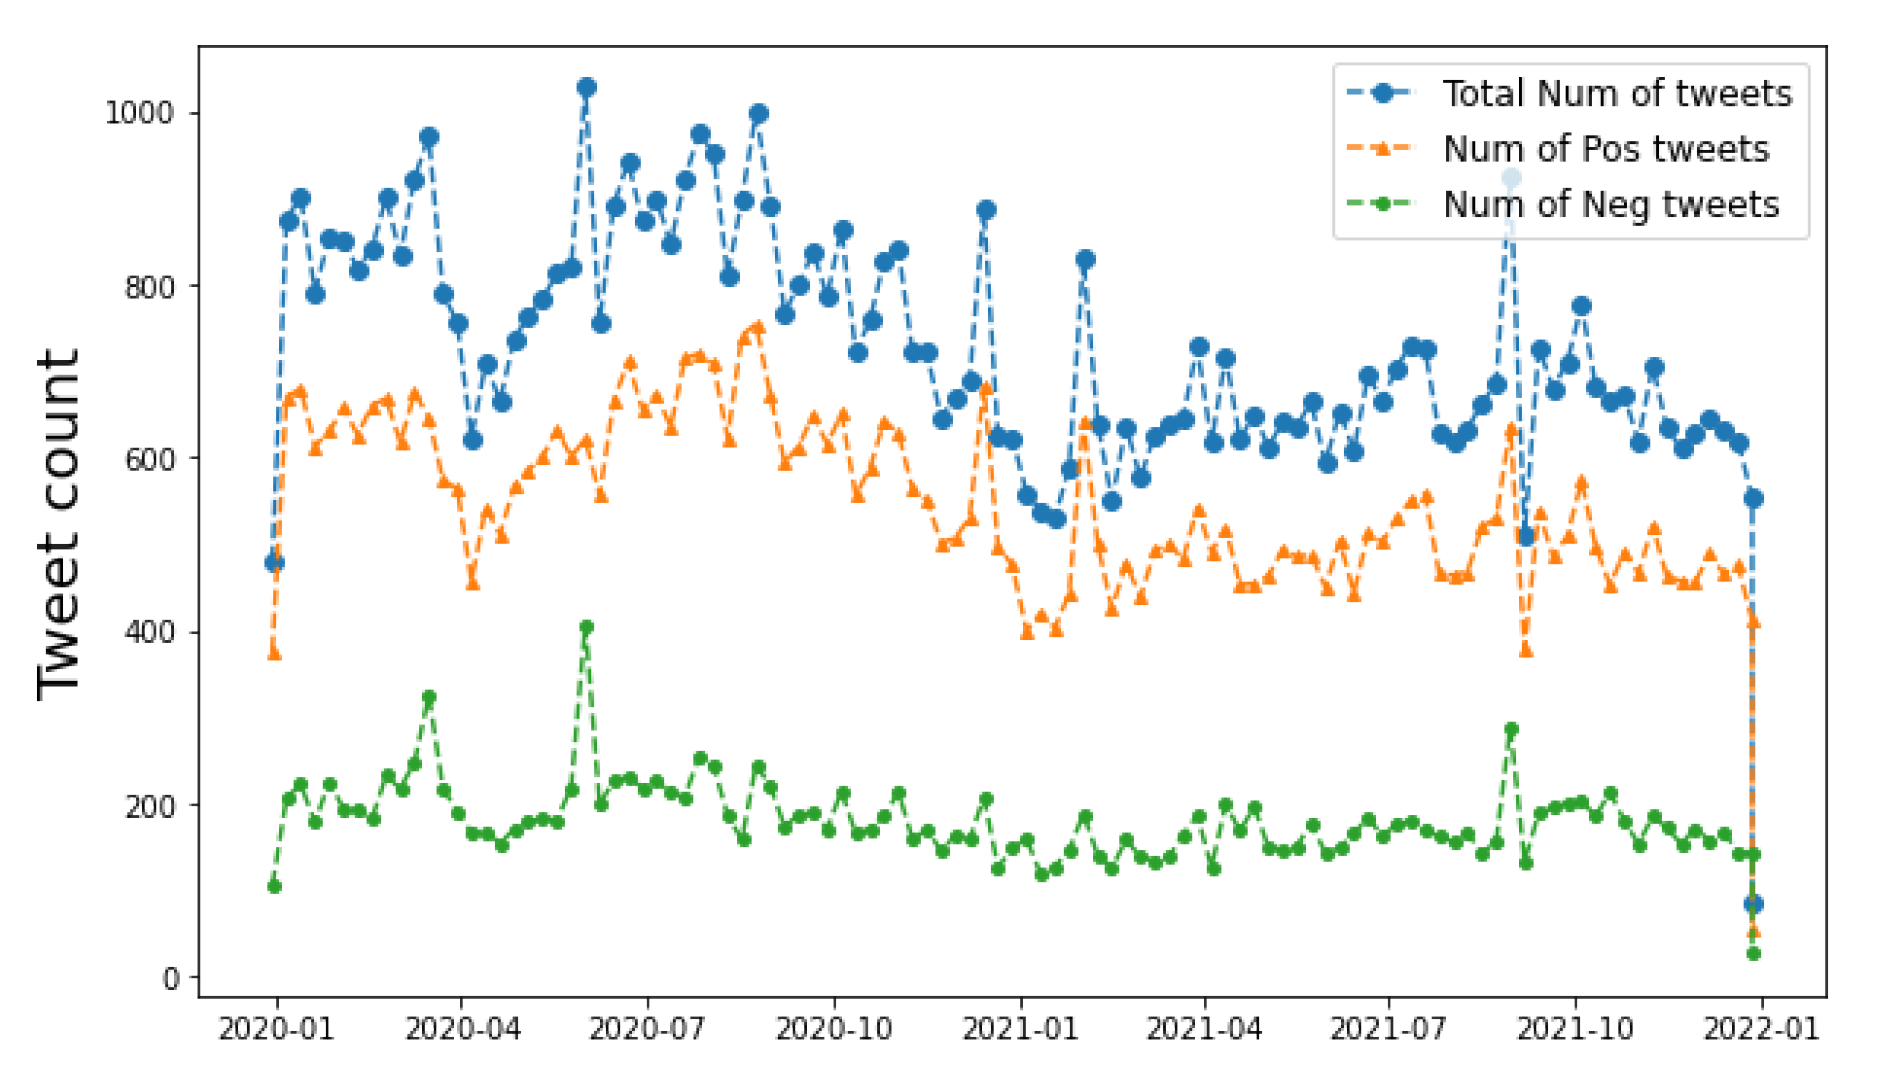
  • When the stay-at-home order began (March 2020), the number of tweets related to all travel modes and the mobility usage drastically decreased because travel demand decreased.
  • When the reopening phase began (June 2020), the number of positive tweets related to bus, bike, and private vehicles increased. Users believed that these travel modes are reliable during the pandemic and many commuters shifted from subways to buses, bikes, and private vehicles.
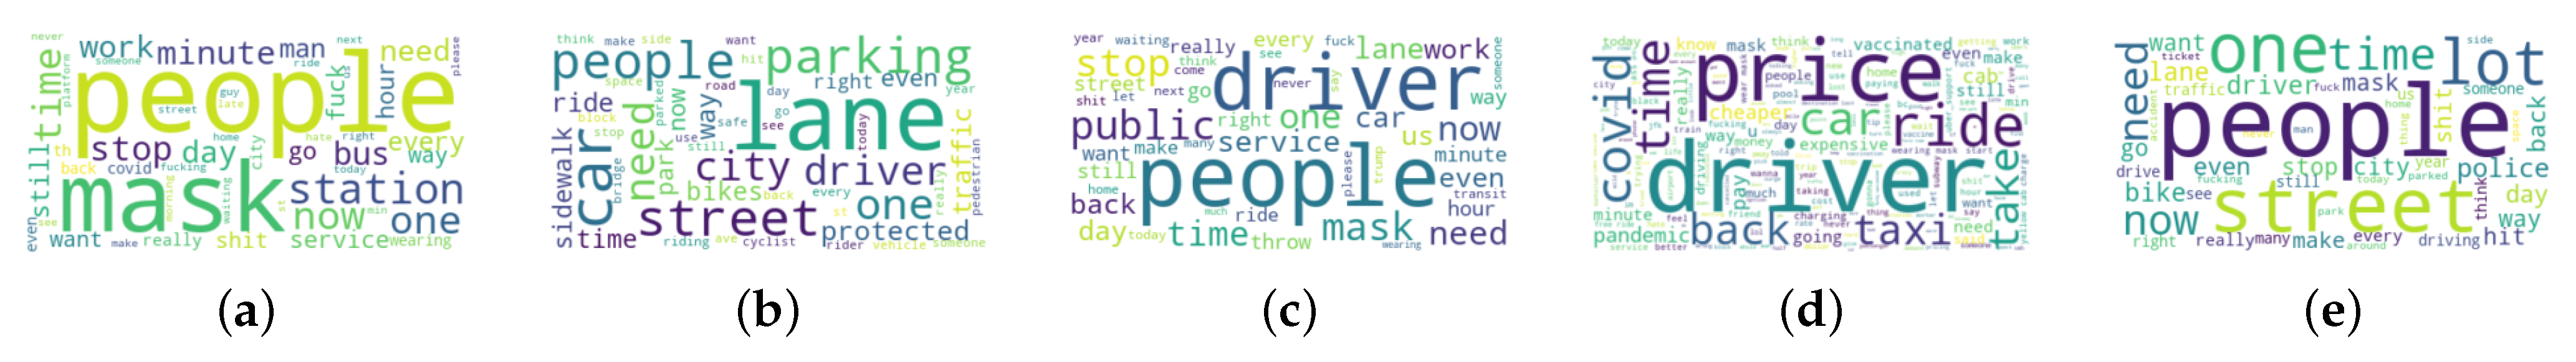
  • People were worried about being affected by those who do not wear masks on subways and buses. Public concerns about other modes (bikes, taxis/Ubers, and private vehicles) were about persistent issues. Many users cared about street conditions, parking spaces, bike lane usage, and the price of ride hailing.

4.2. Relationship between Sentiment and User Demographics

In this section, we use regression analysis to study the relationship between users’ demographic information and their attitudes toward public transits. People’s attitudes toward the subway are discrete predictors of regression models. The features include people’s demographic information, and indicator variables about different phases across the time line. The indicators include January 2020–March 2020 (before the pandemic), March 2020–July 2020 (after the stay-at-home order), July 2020–May 2021 (the reopening phase), and May 2021–January 2022 (more than 50% people in NYC get at least on dose of vaccination). We manually collect demographic information of 375 Twitter users. 60% of users are male and 40% of them are female. We divide users into three groups: the young (≤30), middle-aged (30∼65), and the elderly (≥65). The proportions of young, middle-aged, and elderly groups are 40%, 53%, and 7%, respectively. We generalize several categories of occupations and plot them in Figure 9.
We split data into training and test data with a ratio of 8:2. The data is split in a stratified fashion to make sure both training and test data have balanced classes, which are positive, neutral, and negative. The 10-fold cross validation method is used in the training process to avoid overfitting. Regression analysis is performed by three different approaches as follows.
  • Multinomial logistic regression: In the multinomial logistic regression model, we use the softmax function to normalize all features.
  • Random forest: This is a tree-based model that ensembles all predictions from many decision trees by ranking the predictions.
  • XGBoost: This stands for gradient boosted trees, which apply gradient descent methods to produce a strong prediction model from an ensemble of weak prediction models like decision trees.
The scikit-learn package in Python3 is used to implement logistic regression and random forest. The XGBoost package in Python3 is used to implement XGBoost.
Figure 10 illustrates the feature importance from XGBoost results. We can see that the reopening phase has a significant effect on people’s attitude toward the subway. One’s status as a middle-aged or service industry workers represents an important factor affecting people’s sentiment. This is because compared to others, people whose occupation is service-oriented need to commute in NYC by using the subway. They are easily influenced by MTA service during the pandemic. The prediction accuracy of XGBoost, logistic regression, and random forest are 73.4%, 60.9%, and 65.6%, respectively. XGBoost outperforms the other two.

5. Conclusions

In this paper, we leverage tweets to understand the public opinion on travel modes during the pandemic. We use the BERT model to identify individual tweets related to travel modes. Based on travel mode information extracted from tweets, we perform sentiment analysis to see how people’s attitudes toward travel mode changed during the pandemic and investigate public concerns about mode choices. We also study how users’ demographic information influence their sentiments.
Our findings are summarized as follows: (1) The sentiment analysis shows that people had concerns about those who did not wear masks on the subway or bus. A majority of people had a positive attitude toward the bus, bikes, and private vehicles during the pandemic, which is consistent with the phenomenon that many commuters shifted away from the subway to these modes [1,2,3]. (2) The comparison of social media and mobility data shows that a positive correlation between mobility usage and tweets related to travel modes did not always exist during the pandemic [16,18]. The trend of mode-related tweets is aligned with the usage of mobility from March 2020 to June 2020 because the stay-at-home order reduces the total travel demand. The positive correlation between social media data and aggregate mobility usage is not significant during the time period without any policies (e.g., 2021). In fact, a negative correlation may appear when the usage of subway or bikes increases because more users make complaints about the service. (3) The relationship between users’ attitude toward subway and their demographics indicates that government policies during the pandemic had an impact on users in the service industry who needed to commute in NYC. More advanced methods along with survey data [2] should be proposed to quantify the impact of policies on individual users.
We briefly discuss the limitations of this work. (1) The mobility data regarding private vehicles is not considered in this paper because there is no open data source providing detailed information about the usage of private vehicles in NYC. (2) There are many other travel modes, such as the scooter, for individual users, which could also be incorporated into multimodal transportation.
This work can be extended in several ways. (1) We can look into how return-to-work policies of different companies or industries affect people’s attitude toward travel mode choices and whether there exists a correlation between return-to-work policies and the mobility usage. (2) We will analyze more textual information extracted from Twitter to analyze the change of travel behavior, including travel frequency, travel distance, and interpersonal similarity.

Author Contributions

Conceptualization, X.C. and X.D.; methodology, X.C. and Z.W.; validation, X.C. and Z.W.; writing—original draft preparation, X.C.; writing—review and editing, X.D.; visualization, Z.W.; supervision, X.D.; project administration, X.D.; funding acquisition, X.D. All authors have read and agreed to the published version of the manuscript.

Funding

This research received no external funding.

Data Availability Statement

Not applicable.

Conflicts of Interest

We confirm that neither the manuscript nor any parts of its content are currently under consideration or published in another journal. All authors have approved the manuscript and agree with its submission to the journal “Information”.

References

  1. Goldbaum, C.; Hu, W. Why New York Buses Are on the Rise in a Subway City. 6 July 2020. Available online: https://www.nytimes.com/2020/07/06/nyregion/mta-buses-nyc-coronavirus.html (accessed on 11 January 2020).
  2. Chen, X.; Shea, R.; Di, X. Travel Pattern Analysis on Switching Behavior in Response to the COVID-19 Pandemic. arXiv 2023. submitted. [Google Scholar]
  3. MTA. Subway and Bus Ridership for 2019. 2020. Available online: https://new.mta.info/agency/new-york-city-transit/subway-bus-ridership-2019 (accessed on 11 January 2020).
  4. Cuba, J. NYPD: Bike Injuries Are Up 43 Percent during Coronavirus Crisis. 19 March 2020. Available online: https://nyc.streetsblog.org/2020/03/25/experts-senate-bills-25b-for-transit-wont-be-enough/ (accessed on 11 January 2020).
  5. Goldbaum, C. Is the Subway Risky? It May Be Safer than You Think. 2 August 2020. Available online: https://www.nytimes.com/2020/08/02/nyregion/nyc-subway-coronavirus-safety.html?referringSource=articleShare (accessed on 8 March 2020).
  6. Stringer, S.M. New York City’s Frontline Workers. 26 March 2020. Available online: https://comptroller.nyc.gov/reports/new-york-citys-frontline-workers/ (accessed on 11 January 2020).
  7. Zuo, F.; Wang, J.; Gao, J.; Ozbay, K.; Ban, X.J.; Shen, Y.; Yang, H.; Iyer, S. An interactive data visualization and analytics tool to evaluate mobility and sociability trends during COVID-19. arXiv 2020, arXiv:2006.14882. [Google Scholar]
  8. Bernardes, S.D.; Bian, Z.; Thambiran, S.S.M.; Gao, J.; Na, C.; Zuo, F.; Hudanich, N.; Bhattacharyya, A.; Ozbay, K.; Iyer, S.; et al. NYC Recovery at a Glance: The Rise of Buses and Micromobility. arXiv 2020, arXiv:2009.14019. [Google Scholar]
  9. Kamga, C.; Moghimi, B.; Vicuna, P.; Mudigonda, S.; Tchamna, R. Mobility Trends in New York City during COVID-19 Pandemic: Analyses of Transportation Modes throughout May 2020; University Transportation Research Center: New York, NY, USA, 2020. [Google Scholar]
  10. Wang, D.; He, B.Y.; Gao, J.; Chow, J.Y.; Ozbay, K.; Iyer, S. Impact of COVID-19 Behavioral Inertia on Reopening Strategies for New York City Transit. arXiv 2020, arXiv:2006.13368. [Google Scholar] [CrossRef]
  11. Hasan, S.; Ukkusuri, S.V. Urban activity pattern classification using topic models from online geo-location data. Transp. Res. Part Emerg. Technol. 2014, 44, 363–381. [Google Scholar] [CrossRef]
  12. Zheng, X.; Chen, W.; Wang, P.; Shen, D.; Chen, S.; Wang, X.; Zhang, Q.; Yang, L. Big data for social transportation. IEEE Trans. Intell. Transp. Syst. 2015, 17, 620–630. [Google Scholar] [CrossRef]
  13. Lee, J.H.; Davis, A.W.; Yoon, S.Y.; Goulias, K.G. Activity space estimation with longitudinal observations of social media data. Transportation 2016, 43, 955–977. [Google Scholar] [CrossRef]
  14. Zhang, Z.; He, Q.; Zhu, S. Potentials of using social media to infer the longitudinal travel behavior: A sequential model-based clustering method. Transp. Res. Part Emerg. Technol. 2017, 85, 396–414. [Google Scholar] [CrossRef]
  15. Shou, Z.; Cao, Z.; Di, X. Similarity Analysis of Spatial-Temporal Mobility Patterns for Travel Mode Prediction Using Twitter Data. In Proceedings of the 2020 IEEE 23rd International Conference on Intelligent Transportation Systems (ITSC), Rhodes, Greece, 20–23 September 2020; pp. 1–6. [Google Scholar] [CrossRef]
  16. Chen, X.; Di, X. How the COVID-19 Pandemic Influences Human Mobility? Similarity Analysis Leveraging Social Media Data. In Proceedings of the 2022 IEEE 25th International Conference on Intelligent Transportation Systems (ITSC), Macau, China, 8–12 October 2022; pp. 2955–2960. [Google Scholar]
  17. Yao, W.; Qian, S. From Twitter to traffic predictor: Next-day morning traffic prediction using social media data. Transp. Res. Part Emerg. Technol. 2021, 124, 102938. [Google Scholar] [CrossRef]
  18. Ye, Q.; Ozbay, K.; Zuo, F.; Chen, X. Impact of Social Media Use on Travel Behavior during COVID-19 Outbreak: Evidence from New York City. Transp. Res. Rec. 2020, grc-747481. [Google Scholar]
  19. Rahman, M.M.; Ali, G.N.; Li, X.J.; Samuel, J.; Paul, K.C.; Chong, P.H.; Yakubov, M. Socioeconomic factors analysis for COVID-19 US reopening sentiment with Twitter and census data. Heliyon 2021, 7, e06200. [Google Scholar] [CrossRef] [PubMed]
  20. Sadri, A.M.; Hasan, S.; Ukkusuri, S.V.; Cebrian, M. Exploring network properties of social media interactions and activities during Hurricane Sandy. Transp. Res. Interdiscip. Perspect. 2020, 6, 100143. [Google Scholar] [CrossRef]
  21. Wong, A.; Ho, S.; Olusanya, O.; Antonini, M.V.; Lyness, D. The use of social media and online communications in times of pandemic COVID-19. J. Intensive Care Soc. 2020, 22, 255–260. [Google Scholar] [CrossRef] [PubMed]
  22. Devlin, J.; Chang, M.W.; Lee, K.; Toutanova, K. BERT: Pre-training of Deep Bidirectional Transformers for Language Understanding. In Proceedings of the 2019 Conference of the North American Chapter of the Association for Computational Linguistics: Human Language Technologies (NAACL-HLT), Minneapolis, MN, USA, 2–7 June 2019. [Google Scholar]
  23. Chen, X.; Zeng, H.; Xu, H.; Di, X. Sentiment Analysis of Autonomous Vehicles After Extreme Events Using Social Media Data. In Proceedings of the 2021 IEEE International Intelligent Transportation Systems Conference (ITSC), Indianapolis, IN, USA, 19–22 September 2021; pp. 1211–1216. [Google Scholar]
  24. Szymkowski, S. Uber and Lyft Ride Costs Have Skyrocketed Amid the Pandemic. 2021. Available online: https://www.cnet.com/roadshow/news/uber-lyft-ride-costs-pandemic/ (accessed on 1 March 2022).
Figure 1. Work flow of text mining.
Information 14 00113 g001
Figure 2. Subway classifier.
Information 14 00113 g002
Figure 3. Subway.
Figure 3. Subway.
Information 14 00113 g003
Figure 4. Wordmap. (a) Subway; (b) Bike; (c) Bus; (d) Taxi/Uber; (e) Private vehicle.
Information 14 00113 g004
Figure 5. Bike.
Figure 5. Bike.
Information 14 00113 g005
Figure 6. Bus.
Figure 6. Bus.
Information 14 00113 g006
Figure 7. Taxi/Uber.
Information 14 00113 g007
Figure 8. Private vehicle.
Information 14 00113 g008
Figure 9. Occupation.
Information 14 00113 g009
Figure 10. Feature importance ranking from XGBoost.
Information 14 00113 g010
Disclaimer/Publisher’s Note: The statements, opinions and data contained in all publications are solely those of the individual author(s) and contributor(s) and not of MDPI and/or the editor(s). MDPI and/or the editor(s) disclaim responsibility for any injury to people or property resulting from any ideas, methods, instructions or products referred to in the content.

