
Optimal Hiding Strategy for Transshipments under Trade Embargoes

Department of Law, Economics, Politics, and Modern Languages, LUMSA University, 00193 Rome, Italy
*
Author to whom correspondence should be addressed.
Information 2023, 14(12), 650; https://doi.org/10.3390/info14120650
Submission received: 11 November 2023
/
Revised: 30 November 2023
/
Accepted: 3 December 2023
/
Published: 6 December 2023
(This article belongs to the Section Information Processes)
Abstract
:Trade embargoes, often imposed for political, economic, or security reasons, have long been a tool of international diplomacy. Transshipments may be employed as a strategic mechanism by nations and organizations to circumvent trade embargoes. Transshipment involves rerouting goods through intermediary ports or countries to obscure their origin, destination, or the parties involved. This practice may be subject to investigation, which could lead to exposing the entities employing it. Strategic management of transshipments has to be devised by those entities (the attackers) battling against the transshipment detection mechanisms adopted by the embargo-setters (the defenders). In this paper, we consider an entity exploiting transshipments through several intermediaries. We derive an optimal strategy for that entity wishing to minimize the probability of being exposed. Our strategy provides the optimal number of intermediaries and the optimal distribution of goods among those intermediaries.
1. Introduction
Trade embargoes, often referred to simply as embargoes, are a common trade move that is imposed by a country on another country, consisting of the restriction or prohibition on the import/export of certain goods/services to or from another country. This restriction is typically implemented as a punitive or coercive measure for political, economic, or security reasons. Trade embargoes are used as a tool of foreign policy to exert pressure on a targeted country, often with the goal of influencing its behaviour, complying with international agreements, or addressing various concerns, such as human rights violations, national security threats, or violations of international law. Embargoes can vary in scope, ranging from a partial ban on specific products to a comprehensive prohibition on nearly all trade with the targeted nation. For example, the United States has imposed embargoes on several countries, including Cuba [1,2], Iran [3], and North Korea [4], which limit the ability of US companies to trade with these countries.
In response to these trade restrictions, embargoed countries may use transshipments to bypass the restrictions and continue trading with other countries. Transshipments refer to the process of transferring goods or cargo from one transportation vehicle or mode to another during the course of their journey from the point of origin to the final destination. In this context, they are used to route trades through a third country that is not under an embargo, thereby avoiding the restrictions imposed on the embargoed country. The case of interest here is shown in Figure 1, where the entity (country/company) A is under embargo and cannot import directly from V (the broken link represents the embargo) and exploits B as a bridge to bypass the embargo. Hence, B will import from V and will redirect the imported goods to A. The geometric shape of this trade arrangement gives it the name triangulation, though in the following, we will mostly employ the more generic term transshipment.
One of the key benefits of trade triangulations is that they allow companies to bypass trade restrictions and continue trading with embargoed countries. This can help companies maintain their market share and preserve their relationships with their customers in embargoed countries. Additionally, trade triangulations can help companies access new markets and expand their business opportunities. Another benefit of trade triangulations is that they may help companies reduce costs and improve efficiency. For example, by routing their trade through a third country, companies may take advantage of lower shipping costs and more favourable trade agreements. A company that routes its trade through a country with a free trade agreement with both the embargoed country and the country of origin may be able to take advantage of lower tariffs and other trade benefits.
Of course, costs associated with routing trade through a third country may also increase, due, e.g., to transportation costs, customs duties, and other fees. Additionally, trade triangulations can result in longer delivery times, as goods must be transported through a third country.
This practice is not exempt from risks, since the origin country (V in Figure 1) may detect the abnormal flow of goods to B, which will have to add the good to be redirected to A to its own imports from B. Any increase in import by the bridge B may be a hint that it is acting as an accomplice in a trade triangulation. In order to limit such risk, the embargoed country A may employ several bridges and distribute its import needs across them. A sample case, where the embargoed country sources through two bridges ( and ) is shown in Figure 2. The problem that arises here is: How may the embargoed country A optimally allocate its import need across a set of n bridges so as to minimise the probability of being exposed? We refer to the optimal allocation as the optimal hiding strategy for the embargoed country, since it employs the bridges as a tool to hide itself from the country from which it is forbidden to import.
In this paper, we tackle that issue and find the import allocation across the bridges that minimises the probability of being exposed under a softmax-like distribution. Our solution is a closed formula for the case of two bridges and leads to a system of nonlinear equations (to be solved numerically) in the case of n bridges. We also prove that the allocation is quite far from being proportional and exhibits a sharp threshold effect in that potential bridges are not allocated any share of the import needs of the embargoed country till their import volume stays below a given fraction of the largest importer among the bridges. Our major contributions are as follows:
- We model the transshipment problem under trade embargoes and postulate a probability of a bridge being exposed;
- We provide a closed formula for the optimal import allocation in the case of two bridges;
- We numerically solve the optimal import allocation problem for the case of n bridges;
- We identify the threshold effect and provide bounds for the minimum import volumes of bridges;
Our paper is organized as follows. We review the literature on embargoes and transshipments in Section 2. We formulate the optimal hiding strategy (i.e., the optimal import allocation) problem mathematically in Section 3. We solve the problem in Section 4.1 for the case of two bridges and Section 4.2 for the case of n bridges. The threshold effect is dealt with in both sections for the respective cases.
2. Trade Networks, Embargoes, and Transshipments
Our study concerns the use of trade triangulations (which are specific cases of transshipments) to bypass trade embargoes. In this section, we review the literature on embargoes and transshipments. In most cases, embargoes are a major form of sanctions against a country. In this paper, we will often refer to sanctions under the understanding that they include embargoes as their major tool.
The general features of sanctions are reviewed in [5]. It has been shown in [6] that they are not modern tools, and their history can be traced back to the Middle Ages. Coming to modern times, their continuous use in the trade relationship between the U.S.A. on one side and the USSR and China on the other side is illustrated in [7], while the embargoes on arms trade between the European Union and China has been examined in [8]. Recent examples of embargoes are: the Iran–Contra Affair in the 1980s, when the United States imposed an arms embargo on Iran, but members of the US government secretly sold weapons to Iran and used the proceeds to fund anti-communist rebels in Nicaragua (see the full story on https://www.britannica.com/event/Iran-Contra-Affair, accessed on 5 December 2023); the Oil-for-Food Program in the 1990s, when the United Nations imposed a trade embargo on Iraq following its invasion of Kuwait, but Iraq was able to bypass the embargo by participating in the Oil-for-Food Program, which allowed it to sell oil in exchange for humanitarian supplies (see the full story on https://www.britannica.com/place/Iraq/The-UN-embargo-and-oil-for-food-program, accessed on 5 December 2023); North Korea, which has been subject to numerous trade embargoes over the years, but has been able to bypass them by engaging in illicit activities such as counterfeiting, drug trafficking, and arms sales (see the list of sanctions against North Korea on https://ofac.treasury.gov/sanctions-programs-and-country-information/north-korea-sanctions, accessed on 5 December 2023); and Cuba, which has been subject to a trade embargo since the 1960s, but Cuba has been able to bypass it by trading with other countries, particularly Russia, China, and Venezuela (see the story on https://www.britannica.com/story/pro-and-con-cuba-embargo, accessed on 5 December 2023).
The impact of embargoes on the economy of both sides involved has been dealt with in several papers, typically through the analysis of specific cases. The modifications to trade networks after the invasion of Ukraine have been examined in [9,10]. Sanctions have been shown to lengthen recession periods in Iran in [11] and to impact overall trade volumes in [12]. Their use for reasons other than political has also been examined, e.g., in [13] when they are of a sanitary nature, and [14], when they are due to human rights violations.
A direct consequence of embargoes is the opening of new trade routes to compensate for losing those that are closed due to the embargo. The case of coal import in Poland after the embargo from Russia is analysed in [15]. Evidence of trade triangulations through neighbouring countries is shown in [16]. Also, a concrete case of bypassing the oil embargo against South Africa through maritime activities in the 1970s is described in [17]. The use of transshipments by North Korea to bypass embargoes is analysed in [18]. A way of detecting such triangulations through the increase in stock prices related to demand increase is proposed in [19]. However, the net effect due to the reduction of other trade activities may be negative for the neighbouring countries acting as bridges [20,21].
3. The Optimal Hiding Problem in Transshipments
Having reviewed the relevance of embargoes and the use of transshipments through a third party (trade triangulation) to bypass them, in this section, we provide the mathematical formulation of the bypassing strategy for the embargoed country.
We refer to a generalization of Figure 2, where we have the embargoed country A, which cannot import directly from V, but may exploit n bridges to route the goods from A to itself. The mechanism may rely on a subsidiary or shell company in the countries acting as bridges, which do not have a trade embargo with Country V. For the sake of brevity, we refer to the country A subject to the embargo as the attacker, and the country V from which import is sought as the defender or victim. The overall volume of goods that the attacker wishes to import indirectly from the defender through the bridges is . The volumes of the same goods that the bridges import prior to being used as bridges are, respectively, . Since the bridges have to accommodate the additional import volume , their import volumes will grow: each candidate bridge will have to import both the volume needed for its own consumption and that needed for the attacker’s consumption (which it will route to the attacker). For the generic country , the new import volume from V will be
with the constraint
since the attacker wishes to have all its import needs satisfied. We assume that: (a) the embargo has been decided and enforced by the victim country, so that the country subject to embargo (the attacker) cannot import the goods directly from the victim (the country that has established the embargo); (b) the attacker is able to find countries that already import those goods from the victim and are willing to act as bridges towards the attacker; (c) the quantity of goods required by the attacker can be made available by the victim (i.e., the import needs of the attacker can be met by the export capabilities of the victim).
At the same time, the import increase by a bridge may be a sign of a trade triangulation and may be exploited by the victim to detect possible triangulations, as suggested in [19]. The victim may become aware of the attack on either bridge by identifying anomalous surges in imported quantities. If the identification is correct, that would expose the role of country as a bridge. We postulate that the probability of the attack through bridge i being exposed follows the generalized logistic distribution, also known as Richards’ curve [22]: the formula is actually a simple case of the generalized logistic distribution where , , , , and . It has been used in different contexts, e.g., in [23,24].
where is the overloading factor of bridge i. When the overloading factor is zero, the bridge is not apportioned with an additional import quota. We can see in Figure 3 how the probability of a bridge being exposed grows with its overloading factor.
Since either bridge can be detected by the victim, the attacker is itself exposed when even a single bridge is exposed. The overall probability that A’s attack will be detected is
Of course, the attacker seeks the minimum probability of being exposed, i.e., of hiding behind the bridges (hence, the name hiding strategy). For that purpose, it may choose the suitable apportionment factors , , through which it distributes its overall import volume need among the bridges. Then, its problem is the following constrained optimization one:
where , subject to
4. Optimal Hiding Strategy
In this section, we examine how to derive the optimal hiding strategy, i.e., the optimal allocation of the additional import volume across the bridges. We consider first the case of two bridges and then the general case of n bridges.
4.1. The Case of Two Bridges
We assume that our attacker (i.e., the nation or company wishing to bypass the embargo) may choose two nations/companies as bridges (either or both). We recall the notation established in Section 3 and call the attacker A and the two bridges and . The victim, i.e., the nation/company promoting the embargo, is V.
The quantities imported by the two bridges prior to their use as bridges towards A are and , respectively. The attacker needs to distribute its import need between the two bridges. Since , we can simplify the notation and consider the share of as , so that , with . Then, the quantities that and import from V after including what they need to satisfy A’s request are
Similarly, the probability of the attackers being exposed is a special case of Equation (4):
We can now solve the optimal allocation problem embodied by Equation (5).
By recalling the probability of a bridge being exposed, as described by Equation (3), the overall probability of the attacker being exposed can be written as:
The attacker’s aim is to minimise through a proper choice of the allocation weight . We note that minimising can be simplified through the following development:
In order to look for the minimum of the function appearing in the last term in Equation (10), we zero its derivative. By defining the overloading ratio for the i-th bridge as , , that derivative is
We are sure that the search for the extremal point by zeroing the first derivative leads us to a minimum, since the second derivative is positive:
By recalling Equations (10) and (11), we can conclude that minimizing is tantamount to finding the roots of the following equation (zeroing the first derivative):
By dividing all terms by the positive term , we obtain the final equation to be solved:
Equation (14) has to be solved numerically. In order to obtain some further insight into this equation, we write it in the following form:
We now have to look for the value of that solves Equation (15). That value will give us the optimal distribution of load on the two candidate bridges. However, we will find out that Equation (15) does not always allow for a solution. In order to prove this statement, we first prove the following Lemma 1.
Lemma 1.
There exists an infinite number of couples for which the equation admits no solution for any value of
Proof of Lemma 1.
We can easily observe that the function D is a growing function of and a decreasing function of .
In fact, the first-order derivatives are, respectively:
Since D is a growing function of , we can be sure that, for any , there exists a value such that for any and any . Since , we have infinite couples for which regardless of the value of .
Similarly, since D is a decreasing function of , we can be sure that, for any , there exists a value such that for any and any . Since , we have infinite couples for which regardless of the value of .
Those two results guarantee that there is an infinite number of couples for which , regardless of . □
Though Lemma 1 only provides us with a non-existence proof, we can find a necessary condition on the values of the import volumes and to obtain a solution for the optimal allocation problem.
Theorem 1.
If the ratio of import volumes does not satisfy the inequality , the optimal allocation problem has no solution in
Proof.
We can write the optimal allocation Equation (15) in the following form
Since both exponentials in Equation (18) are lower-bounded by zero and upper-bounded by one, the following inequality holds
If this inequality does not hold, the optimal allocation Equation (18) cannot be satisfied. Since the two bounds are reciprocals of each other, the theorem statement easily follows. □
We can complete the framework by looking at what happens when the optimal allocation problem has no solution in . We can formulate the following theorem.
Theorem 2.
When the optimal allocation problem has no solution for , the best hiding strategy is to allocate the whole import volume on the bridge with the larger import volume
Proof.
If the probability of the attacker being exposed does not reach its minimum inside the interval , then it either reaches a maximum inside that interval or is a monotonous function of . In either case, the minimum must lie on either extreme of the interval, i.e., when either or . We must therefore look at the values taken by the probability of the attacker being exposed given by Equation (9) when .
We have, respectively,
and
The minimum (optimal) value of is reached for when
Hence, when (i.e., the bridge is the larger importer), the optimal strategy for the attacker is to allocate all the additional import volume on itself. □
Theorem 1 tells us that we obtain a non-trivial solution (i.e., different from either or ) only when the initial import volumes of the two bridges are not too imbalanced. Further, Theorem 2 tells us that, when the ratio of their import volumes exceeds those bounds (i.e., one bridge imports more than twice the volume of the other bridge), the optimal strategy for the attacker is to fully rely on the larger importer. A further consequence of Theorem 2 is that we can identify a threshold on the volume imported by the smaller importer for it to be able to be allocated some fraction of the import need of the attacker.
This threshold effect is evident if we plot the solution, i.e., the value of that gives the optimal (i.e., minimum exposure probability) solution to the import allocation problem. We show the space of solutions in Figure 4 when . As expected, the attacker tends to apportion most of the load to the heavier importer. However, when the ratio of original import volumes is pretty imbalanced, we obtain or , which means that the attacker actually uses just one bridge (ther larger one). In Figure 4, we observe that, for any value of , (i.e., all the excess load is on Bridge 2) as long as stays above some threshold (i.e., the import is small enough). For example, when , we can read on Figure 4 that all the excess import passes through Bridge 2 as long as (i.e., as long as the plot in Figure 4 stays in the dark area, corresponding to ) or, alternatively, as long as the ratio of imports of the two bridges is . That means that Bridge 1 starts getting involved in the triangulation by the attacker when its original import is at least 76.9% of that of Bridge 2. We can then conclude that the bounds in Equation (18) are both loose, and the range of imbalances giving nontrivial allocations is even narrower. In Figure 5, we see how the optimal apportionment value moves between its extremes. When is very low ( is a heavy importer), the transition is very sharp, so the optimal solution is to rely on either importer but not on both. For all practical purposes, we can identify a threshold value for that marks the passage from one importer to the other. When grows (the importer is not so heavy with respect to the additional burden asked for by the attacker), the transition is more gradual, so there is a region where both importers are to be used with various degrees of apportionment between them. In general, we can identify three intervals in the range of (the same can be said for ), where the additional import to satisfy the attacker is respectively assigned to only (interval ), to both and (interval ), and then to only (interval ), as you can see in Figure 6.
If we look at the first threshold marking the passage from interval to , we are searching for the value marking the passage from the heavy dark area to a lighter one in Figure 4, i.e., for the special value . By setting in Equation (15), we obtain
We recall that this is the import value of Bridge for which it starts actually being employed as a bridge (Bridge being the heavier importer of the two). We can also look at the value marking the passage from region to , i.e., when Bridge receives all the additional volume () and becomes the heavier importer. We are now looking for . By setting in Equation (15), we obtain
where we notice the perfect symmetry with respect to Equation (23).
We can gain a quantitative understanding of the width of such intervals by looking at Figure 7, where we have plotted both thresholds. We see that when the pre-transshipment import by the alternative bridge is very high (hence, is very low), the co-existence range for the two bridges is very narrow, and there is a sudden passage from the only bridge being to being (or vice versa). Instead, when imports just a fraction of the additional load, the co-existence range (vertical distance between the two curves) widens, and the bridge is involved in the transshipment even if it is not a heavy importer.
An alternative way to look at the share of transshipment between the two candidate importers is through the loading ratio , i.e., the maximum loading ratio such that all the transshipment is still carried out through Bridge 2. We can recall Equation (23) and manipulate it as follows by exploiting the definition of the overloading ratios ’s:
We can see the resulting plot in Figure 8.
4.2. The Case of n Bridges
After considering the particular case of two bridges, which has provided us with some insights into the threshold effect associated with the optimal strategy, we now turn to the general case of n bridges.
We first recall the general terminology set in Section 3. The impost volumes by the bridges before and after their involvement in the triangulation are and , , respectively. Namely, the value is the volume imported by candidate bridge before triangulation, while is the volume imported by the candidate bridge after its involvement in the triangulation, when it also has to carry a share of the volume required by the attacker. The , are the sharing factors, with the constraint .
The probability of being exposed for the single bridge is given by Equation (3), while that for the attacker is shown in Equation (4).
Since the attacker wishes to minimise the probability of being exposed, but the constraint has to be satisfied, the attacker has to solve a constrained minimization problem, for which it can use the Lagrange multiplier approach [25]. The optimization problem would be
where two constraints appear, but it can be transformed by the Lagrange approach into the unconstrained problem
The minimization equation to solve is now the set
As to the first term in this equation, by applying the product rule, we have
The second term in Equation (28) is instead simply
After inserting these results into Equation (28), we obtain the system of equations
Since the terms and h do not depend on the specific bridge, the following identity must hold
This identity provides us with independent equations, each one involving a couple of bridges, which, together with the constraint equation , give us the solution for the import shares for the present state of import volumes described by the set of , .
The solutions depend, of course, on the ex ante status of imports, i.e., the set of that we have just mentioned. The possible combinations of those values are infinite. However, we already know from the case of two bridges that some combinations do not lead to a repartition of the additional import, but rather concentrate the additional import into one bridge (or more, but less than n, since we now have n bridges rather than two). Actually, if we sort the ex ante imports in descending order (without loss of generality), we can hypothesize to have some such that for . We can follow the same approach as for the case of two bridges. In fact, we can write Equation (32) as follows
For any couple of bridges (and in particular for and any k), we can write
We can again note that the right-hand term is bounded, so that
Since by construction, we must have to obtain a non-zero solution for .
In order to obtain some insights into the way the import volume of the attacker is to be distributed among the bridges, we can hypothesize some regular distributions for the current import volumes s.
In particular, here, we consider a uniform distribution and a generalized Zipf distribution.
In the case of a uniform distribution, we assume that the generic import volume is a random variable following a uniform distribution. Without loss of generality, we can also assume that . In this case, we have no average difference among bridges. However, for each instantiation of the problem, the import volumes will not be equal. We can sort the import volumes of any realization of the random variables and use their order statistics, so as to obtain average results. We know that the expected values of the order statistics for a uniform distribution, when volumes exhibit an upper bound b (the lower bound being zero), are given by the formula [26]:
The existence of an upper bound is a safe assumption, since import volumes are anyway upper-bounded by the export capacity of the nation/organization from which the bridges are sourcing. If we recall the bound on the import ratios given by Equation (35), we can derive the maximum number of bridges that can be allocated a non-zero fraction of the overall additional import volume through the following inequality
Under uniform distribution, roughly half of potential bridges will not be allocated any additional load, i.e., they will be excluded from the list of actual bridges that the attacker employs. However, the condition expressed by the inequality (37) is a sufficient condition for a bridge not to be assigned a share of the import volume needed by the attacker. The actual bound is tighter (i.e., lower) than that. Since we are considering the case where the import volumes are random variables, we can resort to MonteCarlo simulation to estimate that bound. We expect the number of actual bridges (i.e., bridges supporting a share of the import volume ) to be a function both of the number n of candidate bridges and the overall overloading factor k defined by the following equation:
We can now run a MonteCarlo simulation, in which we generate 10,000 instances of groups of n potential bridges’ import volumes for selected values of the overall overloading factor. At each simulation run, we compute the number of actual bridges, i.e., the number of bridges that receive a non-zero allocation, and average them through the simulation runs to estimate the expected number of actual bridges.
In Figure 9, where the overloading factor k is shown as a parameter, we see that the fraction of candidate bridges that are actually employed does not depend on the number of candidate bridges (since we observe pretty linear trends) but grows with the overloading factor. As the needs of the attacker increase over the volume presently carried by the bridges, the attacker has to rely on more and more bridges.
We can examine the impact of the overloading factor in more depth in Figure 10, where we observe that the growth of the number of actual bridges is sublinear.
As a volume distribution suitable for describing a realistic situation, we can also recall the generalized Zipf law, which assumes that the import volumes obey the following (deterministic) equation
Zipf law has been found to hold both for the goods exported by a single country and for the exports of a fixed good by all the countries in the world [27]. Other examples of its application in macroeconomics are its use to model the Gross Domestic Product (GDP) [28], the GDP per capita [29], the market distribution [30], and the distribution of telco customer [31]. A final example in trade is given in [32], where the Zipf law is used to describe the size of regional container ports.
Before providing some numerical results when imports follow the generalized Zipf law, we can see which bridges can actually be involved in the optimal apportionment of the additional import load. In fact, using Equation (39), the following condition must hold (a necessary but not sufficient) to have
from which we have , which is plotted in Figure 11.
5. Discussion and Conclusions
We have analysed the case of trade triangulations, where a country tries to bypass embargoes through the use of other countries, which are not subject to embargoes, as bridges. The envisaged context consists of the embargoed country trying to import goods/services through those bridges.
Our investigation has produced the following two major findings:
- It is possible to find an optimal hiding strategy (i.e., a strategy that minimizes the probability of being exposed) for the country that wishes to bypass an embargo;
- The optimal strategy does not use all the candidate bridges, but just the largest importers;
These findings allow the embargoed country to focus on a subset of bridges, avoiding dispersing its energies (needed to establish and maintain friendly ties with would-be bridges) among too many countries candidates to act as bridges.
At the same time, this investigation allows countries that wish to impose embargoes to assess the probability of exposing the embargoed country and its allies in the bypassing operation. Since the embargoed country will select the largest importers as its allies, that is also an indication for the embargo-setting country to direct its attention.
It is to be noted that both the embargoed country and the embargo-setting country face consequences from the application of the hiding strategy. The embargoed country certainly achieves a short-term gain, since it enjoys immediate access to necessary goods, mitigating economic hardships. At the same time, it faces long-term risks: if discovered, the country could face severe diplomatic repercussions, including stricter sanctions, damaged international relations, and increased isolation. At the same time, the success of the triangulation undermines the effectiveness of the embargo, potentially prompting the embargo-setting country to enhance enforcement measures or seek alternative diplomatic solutions. Also, the discovery of the triangulation may strain relations with other countries (e.g., the bridges) and erode the embargo-setter’s credibility in international agreements.
An investigation path we envisage for future research is to incorporate those impacts in the analysis; in particular, possible detection countermeasures by the embargo-setting country, formulating a strategic game between it, the embargoed country, and the potential bridges.
Author Contributions
Conceptualization, M.N.; methodology, M.N.; software, P.F.; validation, M.N. and P.F.; formal analysis, M.N.; investigation, M.N. and P.F.; data curation, P.F.; writing—original draft preparation, P.F.; writing—review and editing, M.N.; visualization, P.F.; supervision, M.N. All authors have read and agreed to the published version of the manuscript.
Funding
This research received no external funding.
Data Availability Statement
Data is contained within the article.
Conflicts of Interest
The authors declare no conflict of interest.
Abbreviations
The following abbreviations are used in this manuscript:
| DOAJ | Directory of open access journals. |
| GDP | Gross domestic Product. |
| MDPI | Multidisciplinary Digital Publishing Institute. |
| U.S.A. | United States of America. |
| USSR | Union of Soviet Socialist Republics. |
References
- Gordon, J. The US embargo against Cuba and the diplomatic challenges to Extraterritoriality. In Fletcher Forum of World Affairs; JSTOR: New York, NY, USA, 2012; pp. 63–79. [Google Scholar]
- Griswold, D. Four Decades of Failure: The US Embargo against Cuba; Cato Institute: San Francisco, CA, USA, 2005; Volume 12. [Google Scholar]
- Torbat, A.E. Impacts of the US trade and financial sanctions on Iran. World Econ. 2005, 28, 407–434. [Google Scholar] [CrossRef]
- Whitty, M.; Kim, S.; Crick, T. The effectiveness of economic sanctions: The case of North Korea. North Korean Rev. 2006, 2, 50–65. [Google Scholar] [CrossRef]
- Osborne, D. Shipping finance and sanctions. In Ship Building, Sale and Finance; Informa Law from Routledge: London, UK, 2016; pp. 241–258. [Google Scholar]
- Stantchev, S. The medieval origins of embargo as a policy tool. Hist. Political Thought 2012, 33, 373–399. [Google Scholar]
- Cain, F. America’s trade embargo against China and the East in the Cold War Years. J. Transatl. Stud. 2020, 18, 19–35. [Google Scholar] [CrossRef]
- Li, Y. The Influence of Brexit on the UK’s Arms Trade Policy and Arms Embargo on China. In Brexit and After: Perspectives on European Crises and Reconstruction from Asia and Europe; Springer Nature: Berlin/Heidelberg, Germany, 2021; pp. 199–213. [Google Scholar]
- Erdoháti-Kiss, A.; Janik, H.; Tóth, A.; Tóth-Naár, Z.; Erdei-Gally, S. The effectiveness of Russian import sanction on the international apple trade: Network theory approach. J. East. Eur. Cent. Asian Res. JEECAR 2023, 10, 712–726. [Google Scholar] [CrossRef]
- Mahlstein, K.; McDaniel, C.; Schropp, S.; Tsigas, M. Estimating the economic effects of sanctions on Russia: An allied trade embargo. World Econ. 2022, 45, 3344–3383. [Google Scholar] [CrossRef]
- Saeed Iranmanesh, M.; Norallah Salehi, A.; Seyyed Abdolmajid Jalaee, B. Using fuzzy logic method to investigate the effect of economic sanctions on business cycles in the Islamic Republic of Iran. Appl. Comput. Intell. Soft Comput. 2021, 2021, 8833474. [Google Scholar] [CrossRef]
- Cheptea, A.; Gaigné, C. Russian food embargo and the lost trade. Eur. Rev. Agric. Econ. 2020, 47, 684–718. [Google Scholar] [CrossRef]
- Gohin, A. On the economic costs of the Russian embargos on food products. Rev. d’ÉConomie Polit. 2017, 127, 71–91. [Google Scholar] [CrossRef]
- Naylor, R.T. Patriots and Profiteers: Economic Warfare, Embargo Busting, and State-Sponsored Crime; McGill-Queen’s Press-MQUP: Montreal, QC, Canada, 2008. [Google Scholar]
- Stala-Szlugaj, K.; Grudziński, Z. Alternative directions of coal supply to Poland as a result of the Russian-Ukrainian war. Gospod. Surowcami Miner. 2022, 38, 31–47. [Google Scholar]
- Bove, V.; Böhmelt, T. Arms imports in the wake of embargoes. Eur. J. Int. Relat. 2021, 27, 1114–1135. [Google Scholar] [CrossRef]
- Desai, A. The oil embargo, the apartheid state and piracy on the high seas. Man India 2014, 94, 427–438. [Google Scholar]
- Lieggi, S.; Shaw, R.; Toki, M. Taking control: Stopping North Korean WMD-related procurement. Bull. At. Sci. 2010, 66, 21–34. [Google Scholar] [CrossRef]
- Della Vigna, S.; La Ferrara, E. Detecting illegal arms trade. Am. Econ. J. Econ. Policy 2010, 2, 26–57. [Google Scholar] [CrossRef]
- Slavov, S.T. Innocent or Not-so-innocent Bystanders: Evidence from the Gravity Model of International Trade About the Effects of UN Sanctions on Neighbour Countries. World Econ. 2007, 30, 1701–1725. [Google Scholar] [CrossRef]
- Baronchelli, A.; Caruso, R.; Ricciuti, R. Trade in small arms and light weapons: Are embargoes effective? World Econ. 2022, 45, 1336–1361. [Google Scholar] [CrossRef]
- Richards, F.J. A flexible growth function for empirical use. J. Exp. Bot. 1959, 10, 290–301. [Google Scholar] [CrossRef]
- Alaimo Di Loro, P.; Divino, F.; Farcomeni, A.; Jona Lasinio, G.; Lovison, G.; Maruotti, A.; Mingione, M. Nowcasting COVID-19 incidence indicators during the Italian first outbreak. Stat. Med. 2021, 40, 3843–3864. [Google Scholar] [CrossRef]
- Hammill, M.; Lesage, V.; Gosselin, J.F.; Bourdages, H.; De March, B.; Kingsley, M. Evidence for a decline in northern Quebec (Nunavik) belugas. Arctic 2004, 54, 183–195. [Google Scholar] [CrossRef]
- Bertsekas, D.P. Constrained Optimization and Lagrange Multiplier Methods; Academic Press: Cambridge, MA, USA, 2014. [Google Scholar]
- Naldi, M.; D’Acquisto, G. Performance of the Vickrey auction for digital goods under various bid distributions. Perform. Eval. 2008, 65, 10–31. [Google Scholar] [CrossRef]
- Liu, B.; Gao, J. Understanding the non-Gaussian distribution of revealed comparative advantage index and its alternatives. Int. Econ. 2019, 158, 1–11. [Google Scholar] [CrossRef]
- Shao, J.; Ivanov, P.C.; Urošević, B.; Stanley, H.E.; Podobnik, B. Zipf rank approach and cross-country convergence of incomes. Europhys. Lett. 2011, 94, 48001. [Google Scholar] [CrossRef]
- Avakian, A.; Podobnik, B.; Piskor, M.; Stanley, H.E. Capital death in the world market. Phys. Rev. E 2014, 89, 032805. [Google Scholar] [CrossRef]
- Naldi, M.; Flamini, M. Dynamics of the Hirschman–Herfindahl index under new market entries. Econ. Pap. J. Appl. Econ. Policy 2018, 37, 344–362. [Google Scholar] [CrossRef]
- Naldi, M.; Salaris, C. Rank-size distribution of teletraffic and customers over a wide area network. Eur. Trans. Telecommun. 2006, 17, 415–421. [Google Scholar] [CrossRef]
- Chen, J.; Liu, A.; Di, Z.; Wan, Z.; Tian, Y.; Li, K.X.; Huang, T.; Zhao, M. Evolvement of rank-size distribution of regional container ports: Case study of Yangtze River Delta of China. IEEE Access 2019, 7, 61273–61282. [Google Scholar] [CrossRef]
Figure 1.
Trade triangulation.

Figure 2.
Combination of two trade triangulations.
Figure 3.
Probability of bridge being exposed.
Figure 4.
Optimal distribution for two bridges.
Figure 5.
Impact of Bridge 2’s import on optimal .
Figure 6.
Assignment regions.
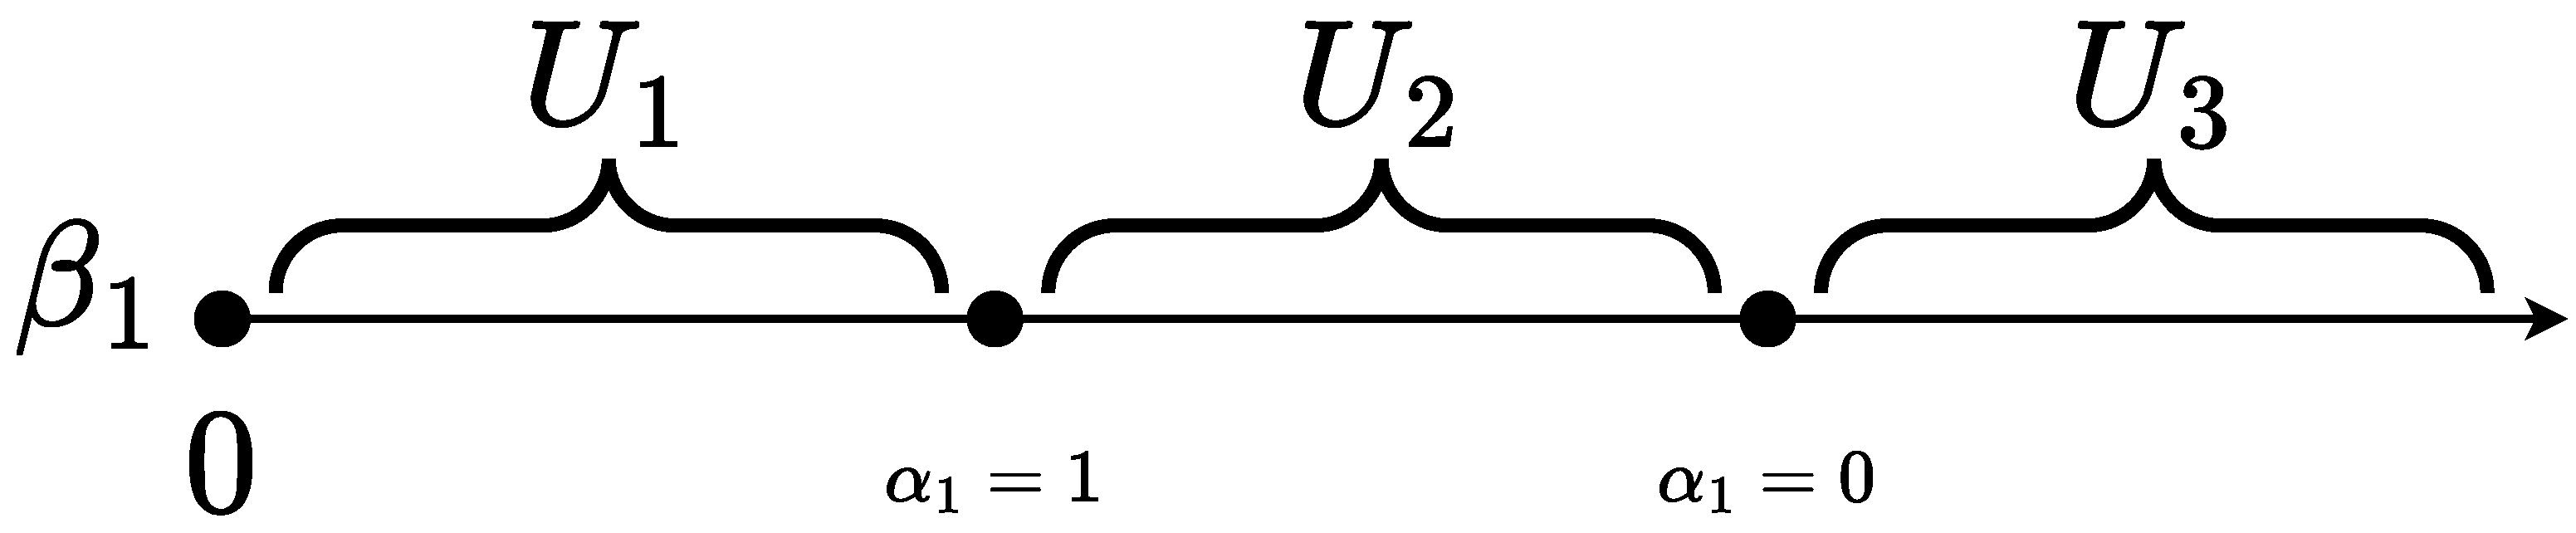
Figure 7.
Overloading factors.
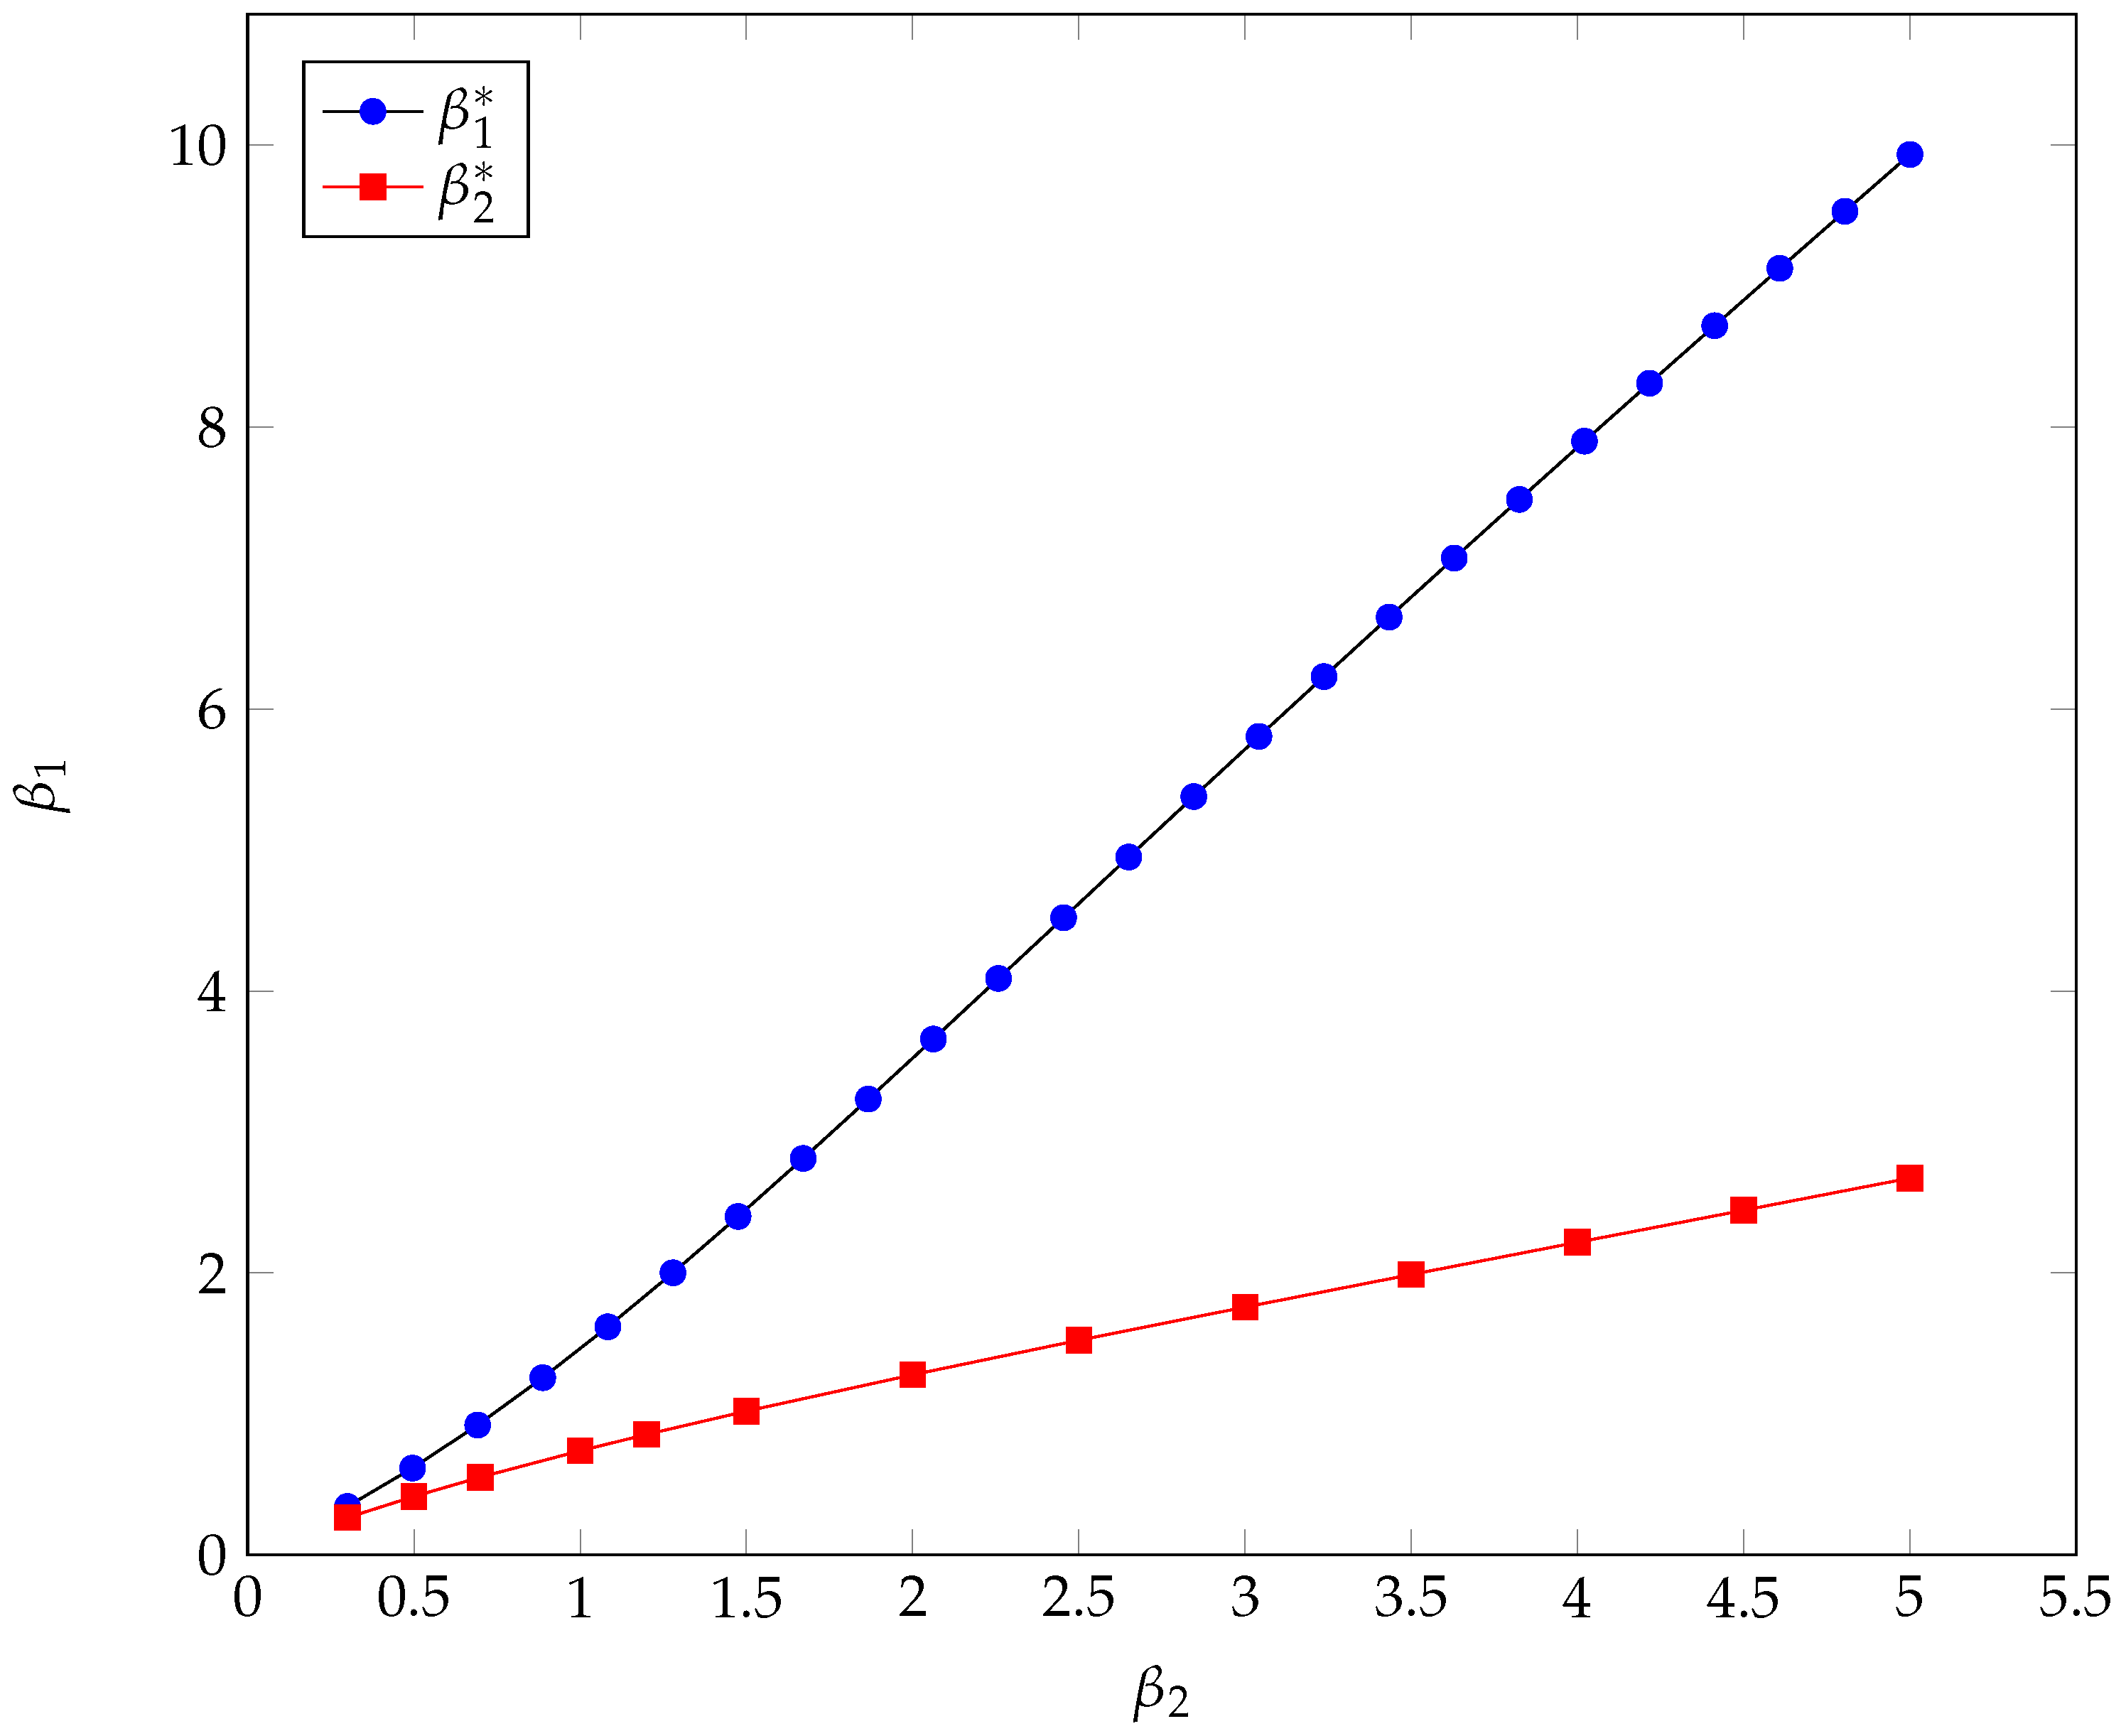
Figure 8.
Loading ratio.
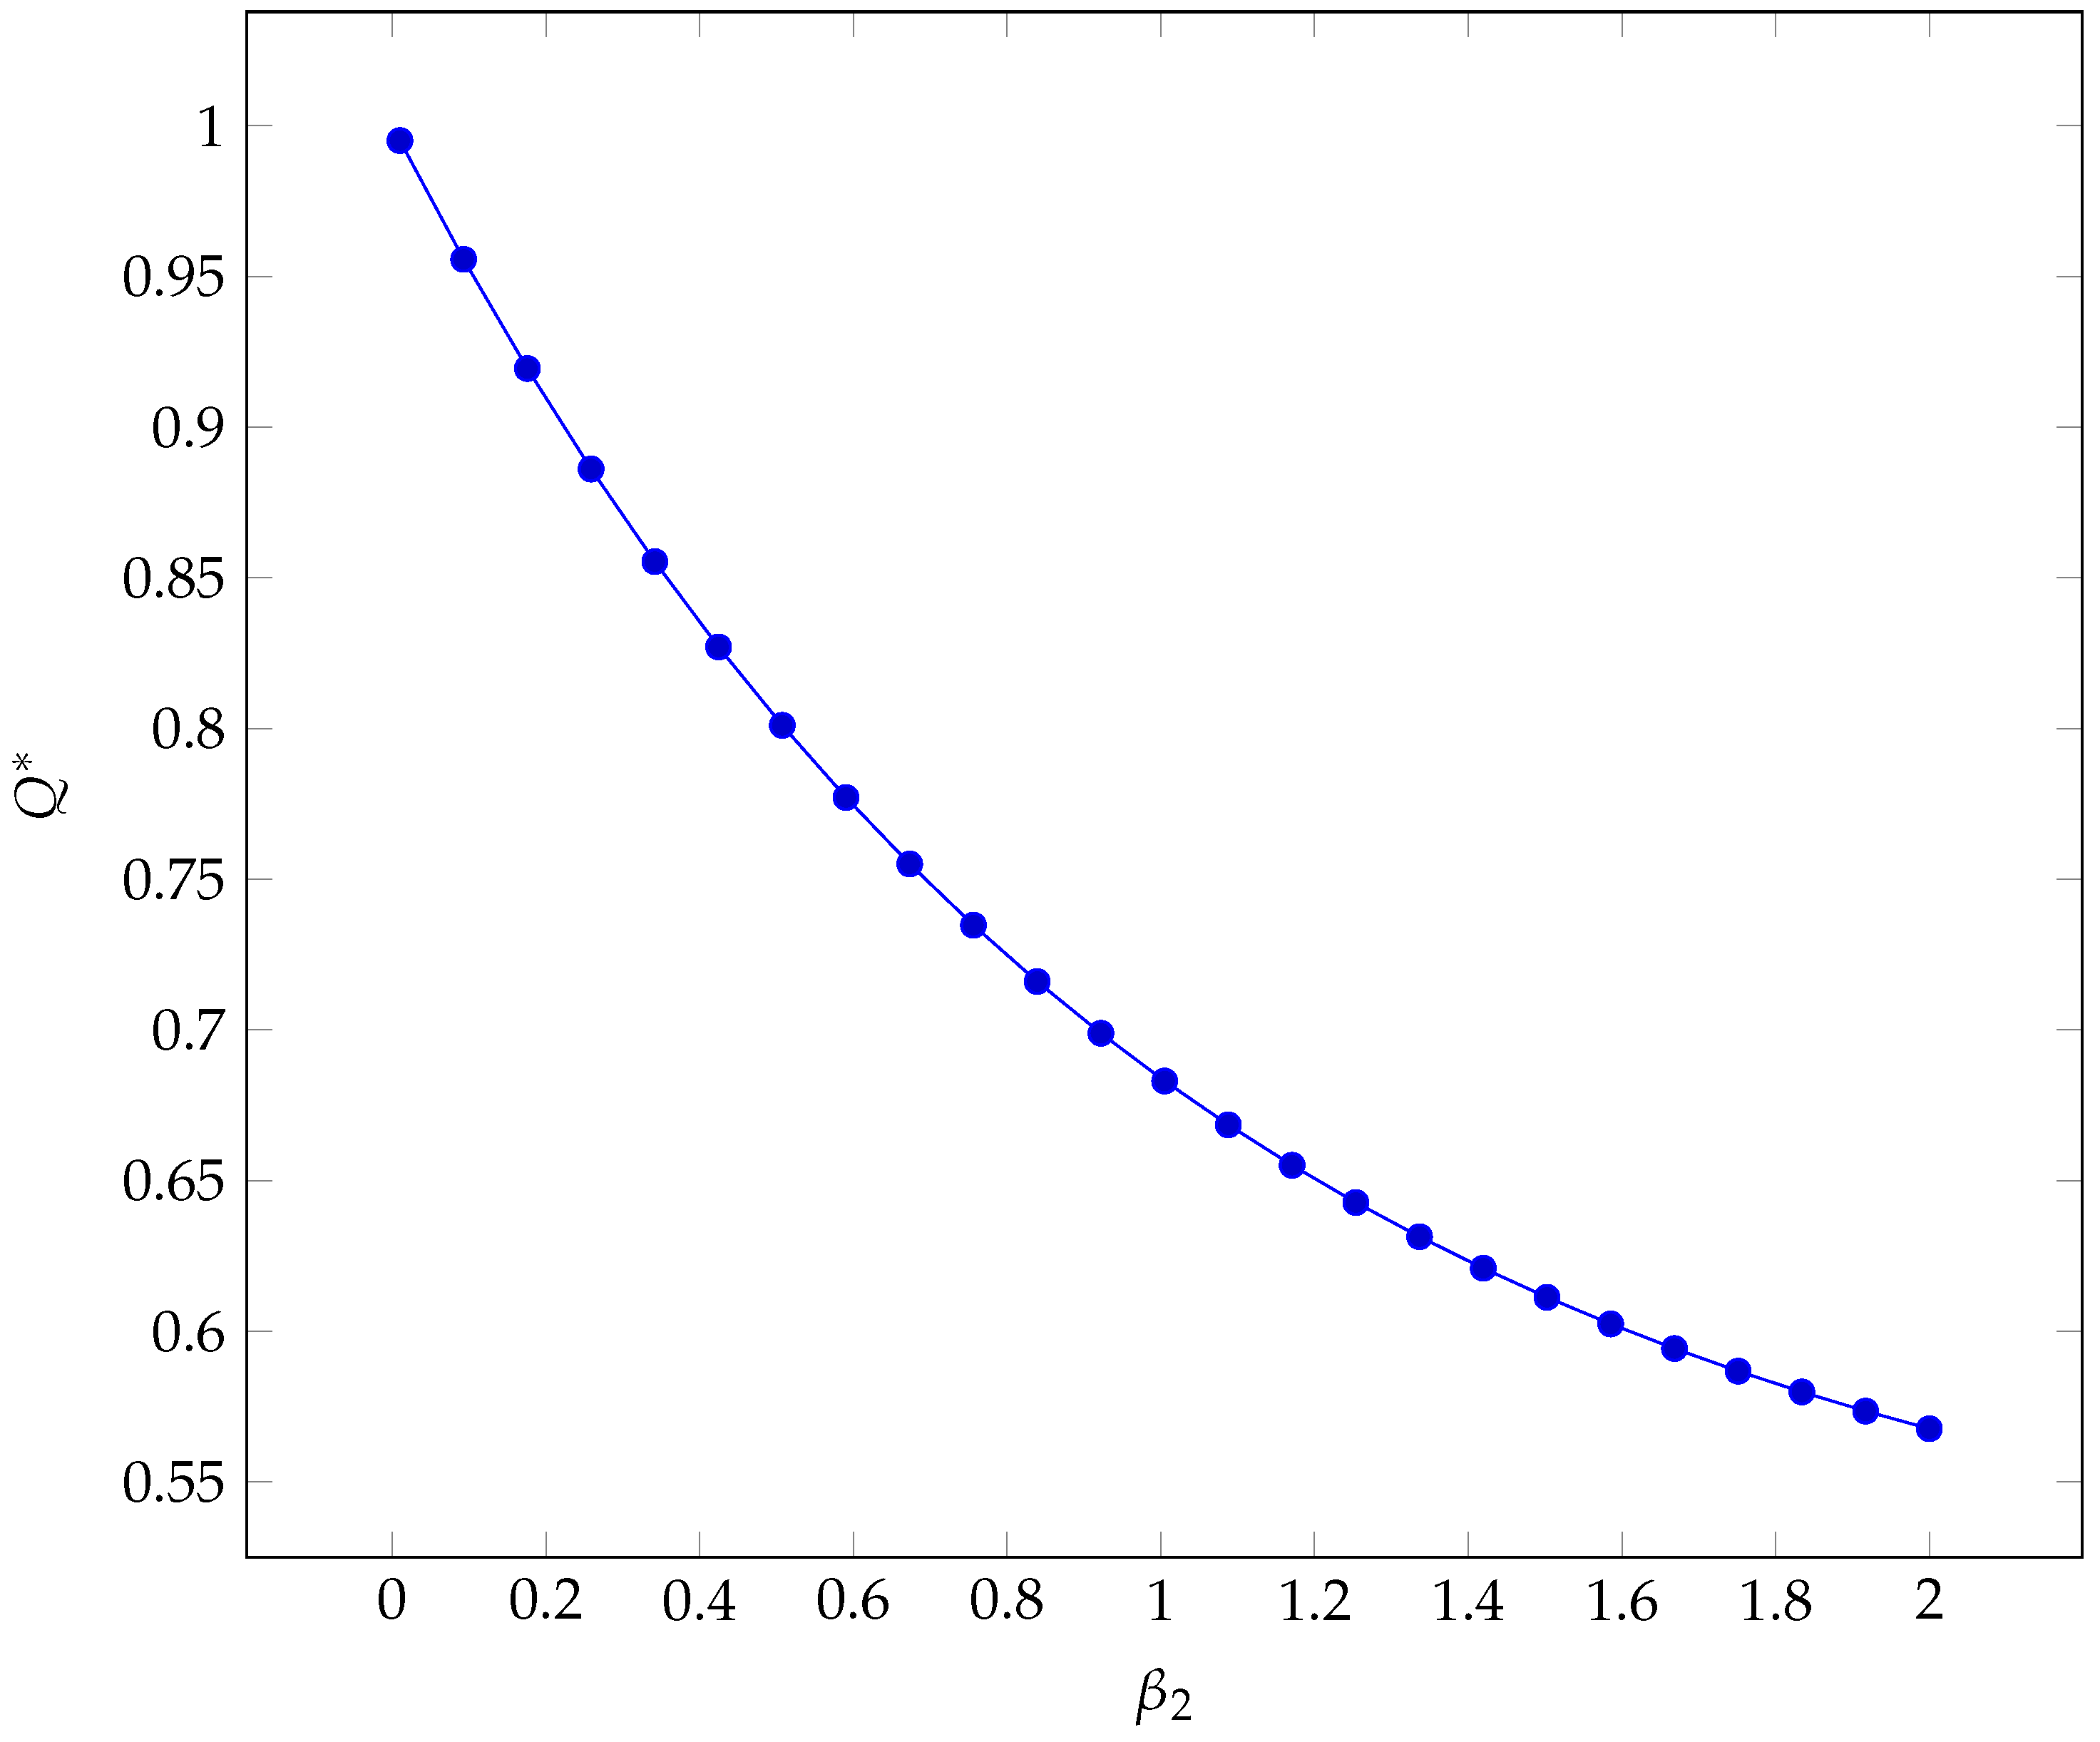
Figure 9.
Selection of candidate bridges.

Figure 10.
Impact of the overloading factor on the number of bridges.
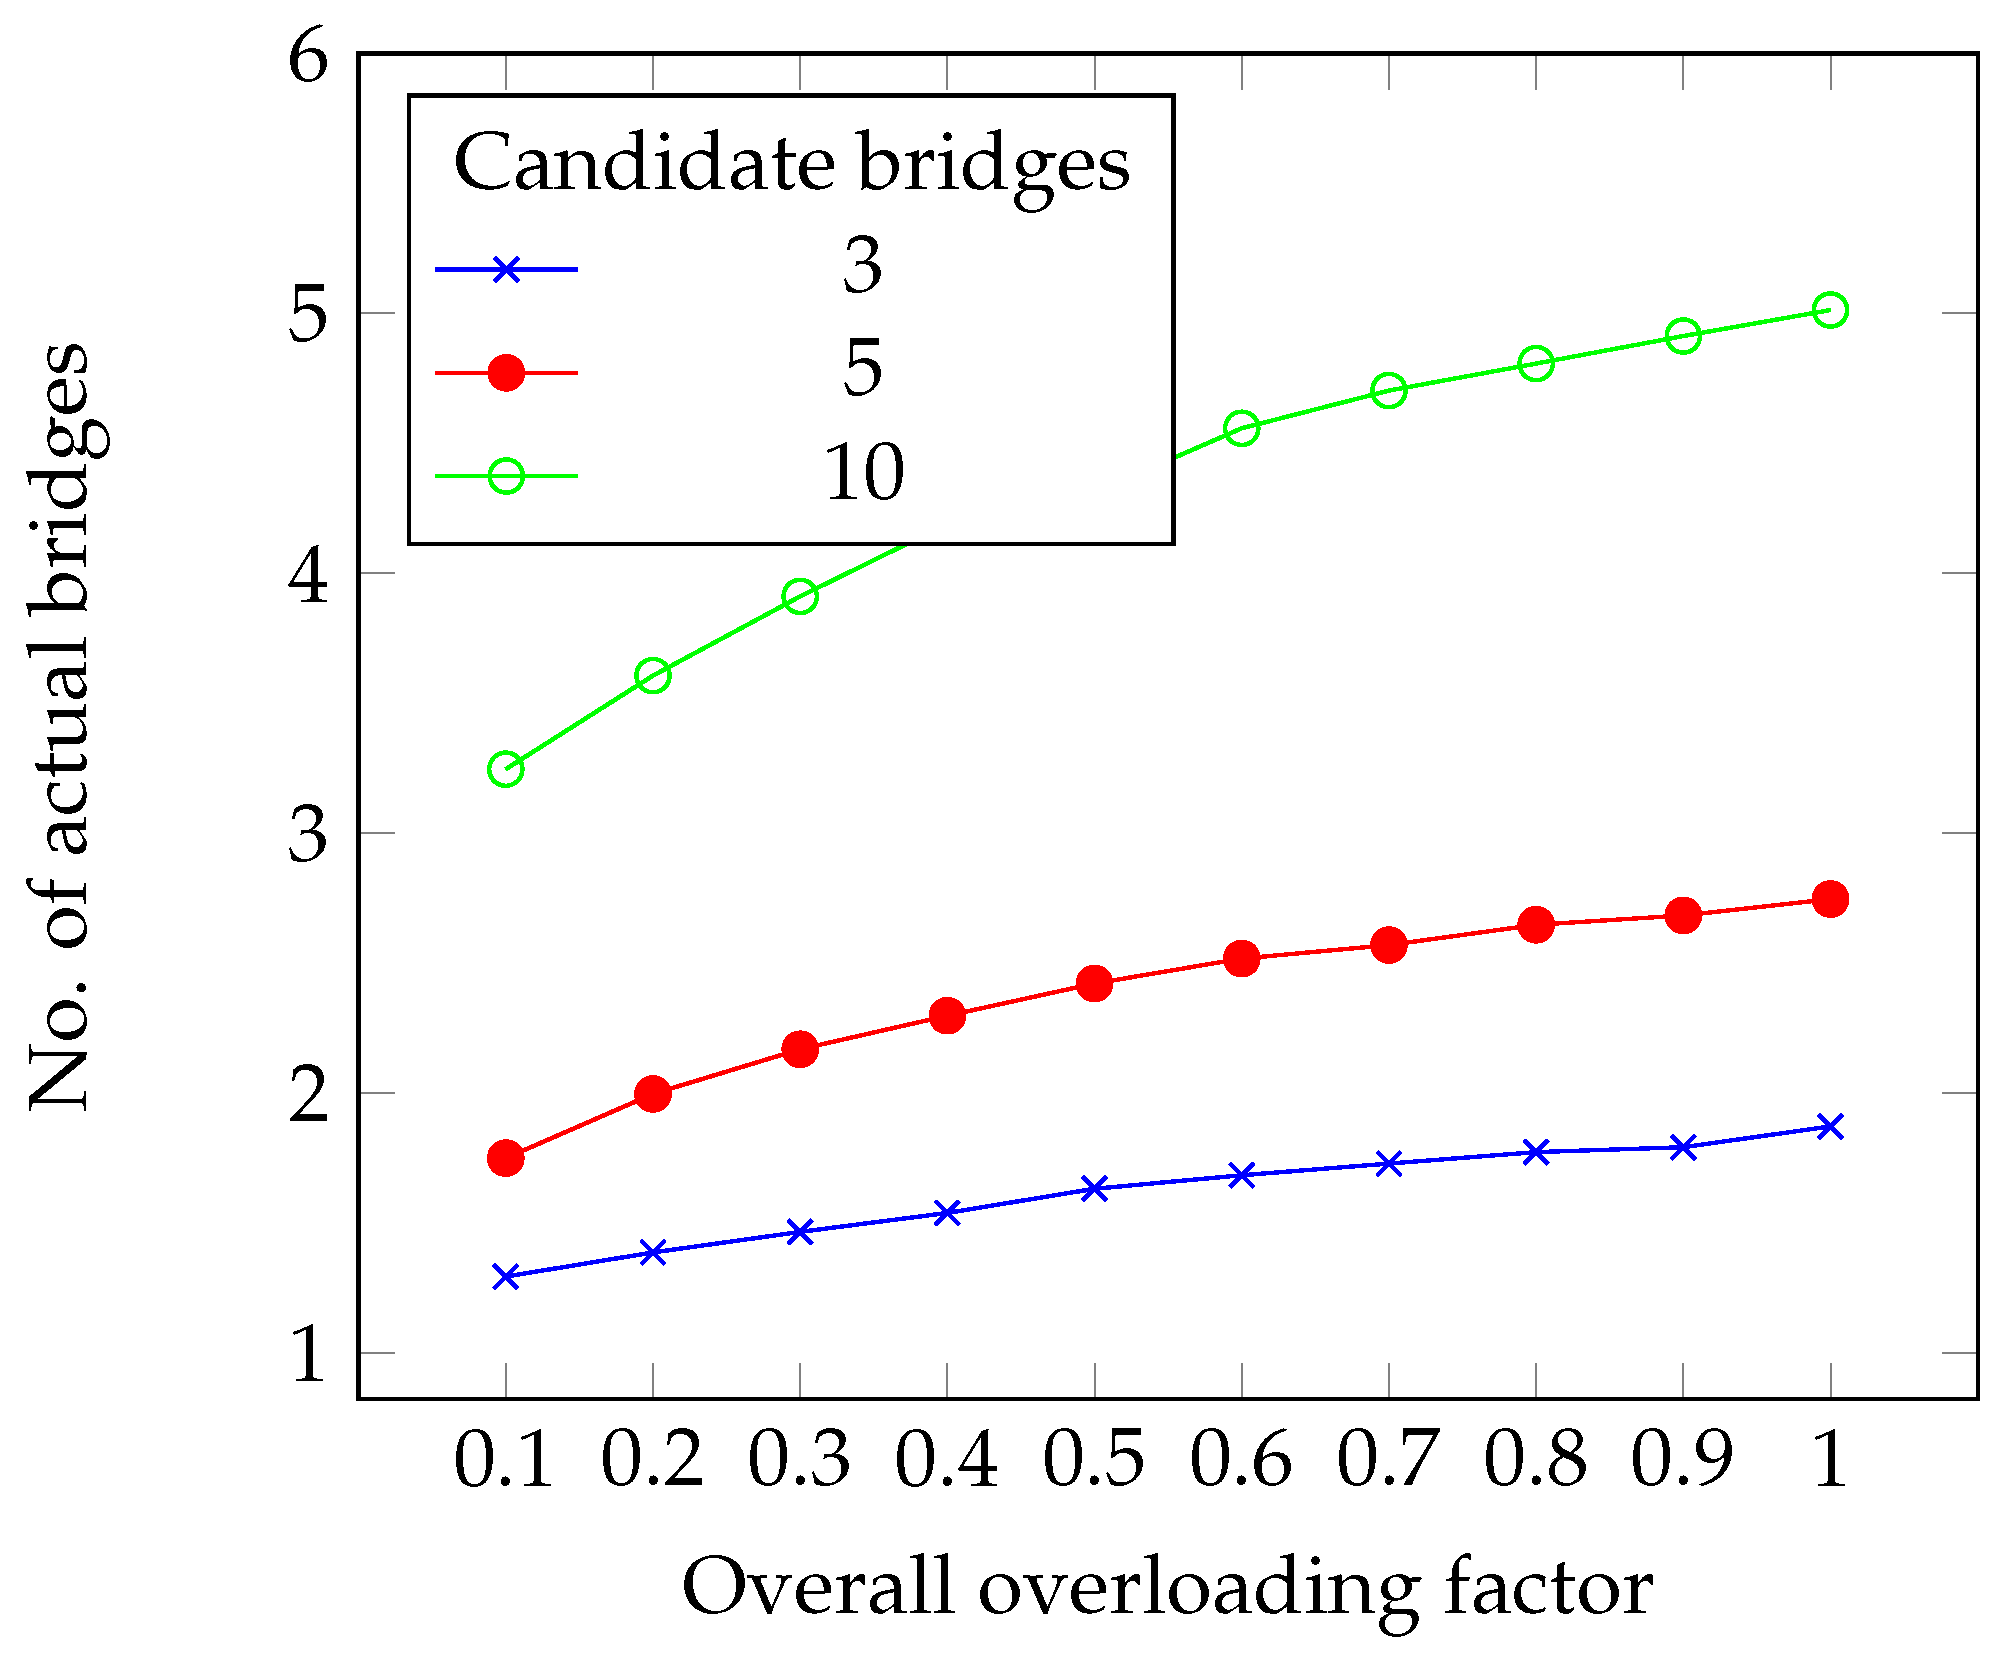
Figure 11.
Maximum number of actual bridges.

Disclaimer/Publisher’s Note: The statements, opinions and data contained in all publications are solely those of the individual author(s) and contributor(s) and not of MDPI and/or the editor(s). MDPI and/or the editor(s) disclaim responsibility for any injury to people or property resulting from any ideas, methods, instructions or products referred to in the content. |
© 2023 by the authors. Licensee MDPI, Basel, Switzerland. This article is an open access article distributed under the terms and conditions of the Creative Commons Attribution (CC BY) license (https://creativecommons.org/licenses/by/4.0/).
Share and Cite
MDPI and ACS Style
Fantozzi, P.; Naldi, M. Optimal Hiding Strategy for Transshipments under Trade Embargoes. Information 2023, 14, 650. https://doi.org/10.3390/info14120650
AMA Style
Fantozzi P, Naldi M. Optimal Hiding Strategy for Transshipments under Trade Embargoes. Information. 2023; 14(12):650. https://doi.org/10.3390/info14120650
Chicago/Turabian StyleFantozzi, Paolo, and Maurizio Naldi. 2023. "Optimal Hiding Strategy for Transshipments under Trade Embargoes" Information 14, no. 12: 650. https://doi.org/10.3390/info14120650
Note that from the first issue of 2016, this journal uses article numbers instead of page numbers. See further details here.