Article

Early Prediction of At-Risk Students in Secondary Education: A Countrywide K-12 Learning Analytics Initiative in Uruguay

by
Emanuel Marques Queiroga
1,2,*,
Matheus Francisco Batista Machado
3,
Virgínia Rodés Paragarino
4,
Tiago Thompsen Primo
2 and
Cristian Cechinel
2,3,*
1
Instituto Federal do Rio Grande do Sul, IFSul, Pelotas 96015560, Brazil
2
Centro de Desenvolvimento Tecnológico (CDTEC), Universidade Federal de Pelotas (UFPel), Pelotas 96010610, Brazil
3
Centro de Ciências, Tecnologias e Saúde (CTS), Universidade Federal de Santa Catarina (UFSC), Araranguá 88906072, Brazil
4
Comisión Sectorial de Enseñanza, Universidad de la República, Udelar, Montevideo 11200, Uruguay
*
Authors to whom correspondence should be addressed.
Information 2022, 13(9), 401; https://doi.org/10.3390/info13090401
Submission received: 22 June 2022 / Revised: 11 August 2022 / Accepted: 17 August 2022 / Published: 23 August 2022
(This article belongs to the Special Issue Artificial Intelligence Applications for Education)

Abstract

:
This paper describes a nationwide learning analytics initiative in Uruguay focused on the future implementation of governmental policies to mitigate student retention and dropouts in secondary education. For this, data from a total of 258,440 students were used to generate automated models to predict students at risk of failure or dropping out. Data were collected from primary and secondary education from different sources and for the period between 2015 and 2020. Such data contains demographic information about the students and their trajectories from the first grade of primary school to the second grade of secondary school (e.g., student assessments in different subjects over the years, the amount of absences, participation in social welfare programs, and the zone of the school, among other factors). Predictive models using the random forest algorithm were trained, and their performances were evaluated with F1-Macro and AUROC measures. The models were planned to be applied in different periods of the school year for the regular secondary school and for the technical secondary school ((before the beginning of the school year and after the first evaluation meeting for each grade). A total of eight predictive models were developed considering this temporal approach, and after an analysis of bias considering three protected attributes (gender, school zone, and social welfare program participation), seven of them were approved to be used for prediction. The models achieved outstanding performances according to the literature, with an AUROC higher than 0.90 and F1-Macro higher than 0.88. This paper describes in depth the characteristics of the data gathered, the specifics of data preprocessing, and the methodology followed for model generation and bias analysis, together with the architecture developed for the deployment of the predictive models. Among other findings, the results of the paper corroborate the importance given in the literature of using the previous performances of the students in order to predict their future performances.

1. Introduction

The educational system of Uruguay has experienced important problems associated with backwardness and disengagement in recent decades [1]. Even though the system is characterized by universal coverage at the primary level, it is possible to observe that the student grade retention, dropout rates, and non-enrollment rates increase as the education system progresses, while age-appropriate coverage decreases [2]. As a result, a signification portion of the students has difficulty remaining enrolled in the educational system [3,4].
For instance, during the transition from primary to secondary education, the educational system of Uruguay usually experiences a drop in students of 10%. Moreover, from the total of students at the age of 13 years old, 26% are overage for their grades, and 3% are dropping out the system. In secondary education, during the transition from basic secondary education to upper secondary education (when students are from 15 to 17 years old), there is an increase of 20% in students that are overage for their grades, and the proportion of students who drop out of the educational system increases by 27%. In the year 2015, Uruguay experienced the lowest graduation rates during the 12 years of compulsory education. Lastly, 31% of student graduations occurred at the age of 19 years old, and 40% were at the age of 24 years old [3].
Previous work conducted by Pereda [5] explored the social, economical, historical, and political aspects associated with this situation in Uruguay. According to Pereda [5], lag, dropping out, and absenteeism are the three most important explanatory factors related to educational disengagement. Therefore, the identification of these aspects in educational trajectories allows one to establish early action in order to mitigate the risks and increase the chances of academic success.
The abundant amount of data generated by the digitalization of academic management systems has opened new perspectives for the analysis of educational data. The approach known as learning analytics [6] seeks to understand and improve educational processes through the multi-technical processing of data and products generated by students and teachers [7]. The field of learning analytics aims to develop data based educational solutions that can be useful for the many stakeholders involved in the teaching and learning processes so that such process can be constantly improved [8].
Among the techniques used by learning analytics, one can mention statistical models, educational data mining (EDM), machine learning, natural language processing (PLN), computer vision, and new algorithms resulting from research in artificial intelligence. These techniques allow the processing of large volumes of data from different educational systems to generate solutions that support decisions focused on the improvement of different educational scenarios [9,10,11,12,13].
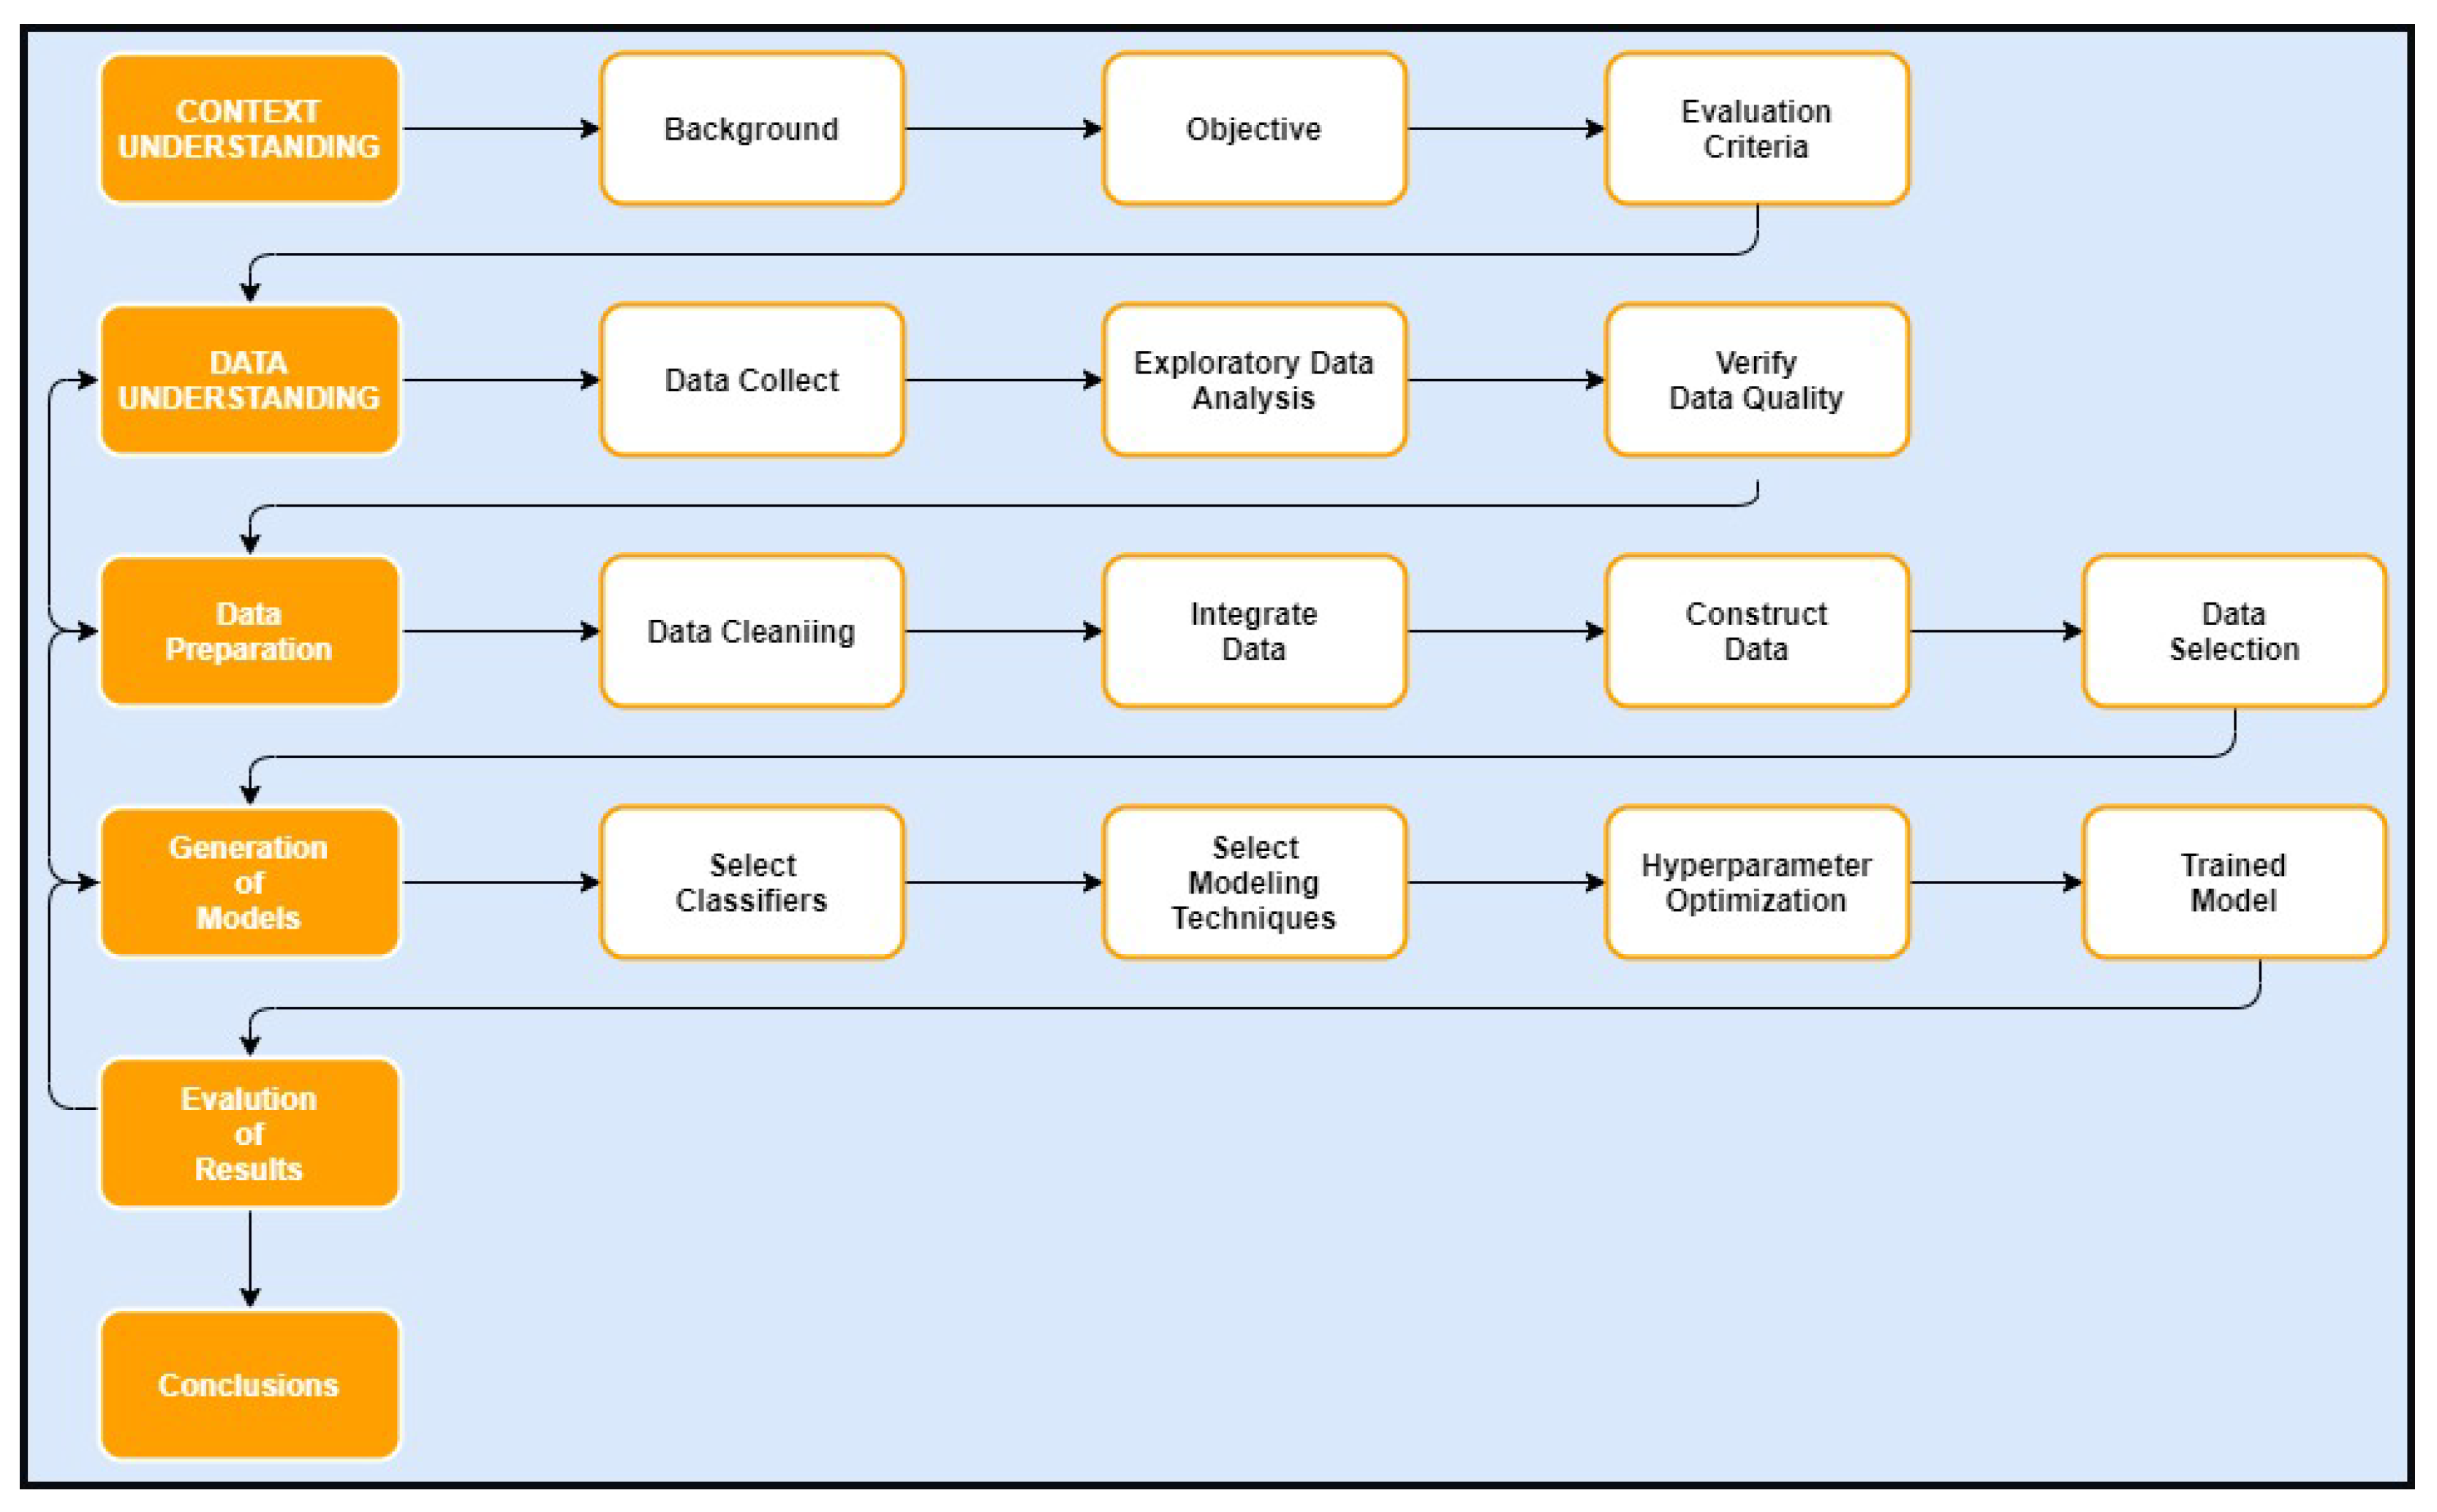
The present paper presents the methodology followed for the development of automated models to detect students at risk of dropping out at the secondary level in Uruguay. For this, the Clow cycle method [12] was adopted as a baseline for the steps executed. In addition to the creation of the predictive models, this paper covers a deep exploratory analysis of the data used for the work together with the description of the resulting system developed to identify students at risk of disengagement. The experiments and implementation developed in this work continue the previous work conducted in [14,15]. Moreover, the work presented here was conducted under the fAIrLAC initiative of the Inter-American Development Bank (IDB). The fAIrLAC initiative intends to influence public policies by promoting the development of artificial intelligence (AI) solutions in a responsible and ethical way [16,17].
The present paper intends to answer the following research questions:
  • RQ1: Is it possible to generate an LA-based methodology that encompasses data acquisition, data transformation, and the generation of models that can help to identify students at risk of dropping out at secondary level early?
  • RQ2: Is the transformation of data from different databases into time series a viable alternative from a preprocessing point of view? If so, are the final results generated by the prediction models using this technique satisfactory?
  • RQ3: Is it possible to generate and analyze explainable models based on machine learning so that biases can be identified and corrected when necessary?
  • RQ4: Which features are the most important to predict students at risk of dropping out in Uruguay at the secondary level early?
The remainder of this paper is organized as follows. Section 2 describes some characteristics of the educational system in Uruguay, and Section 3 presents the theoretical background and related works. Section 4 explains the methodology followed in the present work, and Section 5 describes the models generated for predicting students at risk. Section 6 presents the most important results achieved by this project, and Section 7 depicts how the predictive models are deployed to the authorities. Finally, Section 9 remarks on the most important findings of this work.

2. Context Understanding: An Overview of Education in Uruguay

Uruguay is located to the extreme south of Latin America, with a population of around 3.4 million inhabitants and comprising 176,215 million square kilometers. Uruguay presents a huge concentration of its population in urban areas (92% of the population). Moreover, about 50% of the population lives in the metropolitan region of the capital (Montevideo). In the context of Latin America, Uruguay is the third country in the Human Development Index (HDI) with a rating of 0.817 [18,19], and it currently has one of the highest levels of connectivity in Latin America, with more than 80% of the population having access to the internet [20].
The Uruguayan basic education system comprises preschool and primary and secondary education, with public schools accounting for around 85% of enrollments [21]. In addition to this, university education is characterized by a policy of free and unrestricted admission, with no other condition than the completion of high school to be admitted to a university. The University of the Republic (UDELAR) is the most important player, with 90% of the enrollments in higher education [11,22]. The educational system as a whole is managed by the National Administration of Public Education (ANEP) (Administración Nacional de Educación Pública; https://www.anep.edu.uy/acerca-anep, accessed on 10 January 2022), a government agency responsible for planning and managing public educational policies. For the present initiative, ANEP is the key stakeholder interested in the predictive models, and it is responsible for providing all the databases required for that.
Uruguay has been developing a series of social policies to combat inequality. Within these policies, one can highlight the Ceibal Plan [23,24]. The Ceibal Plan is a series of educational programs aimed at the digital inclusion of the Uruguayan population. These programs are based on a tripod of proposals aimed at students, teachers, and students’ families. In this context, a series of activities is developed, seeking to improve the quality of education through technological systems based on information and communication technologies (ICTs).
For instance, one of the outstanding programs within Ceibal is called “One laptop per child”, where since 2007, the government has distributed a laptop to each child enrolled in basic education and created a network of technological assistance for such equipment throughout the country. In addition, there are several other programs that seek to include the tripod involved in the project, with programs aimed at training and qualifying teachers, involving families in educational activities, producing technological educational resources, providing free internet to students in schools and at home, and technological educational activities aimed at student development, such as teaching robotics.
However, despite these multiple efforts, the Uruguayan educational system still faces high rates of student retention and disengagement. This situation is already being experienced in the early years of primary education. For instance, in 2012, around 27% of fourth-year students in primary education experienced some kind of delay in their training [1].
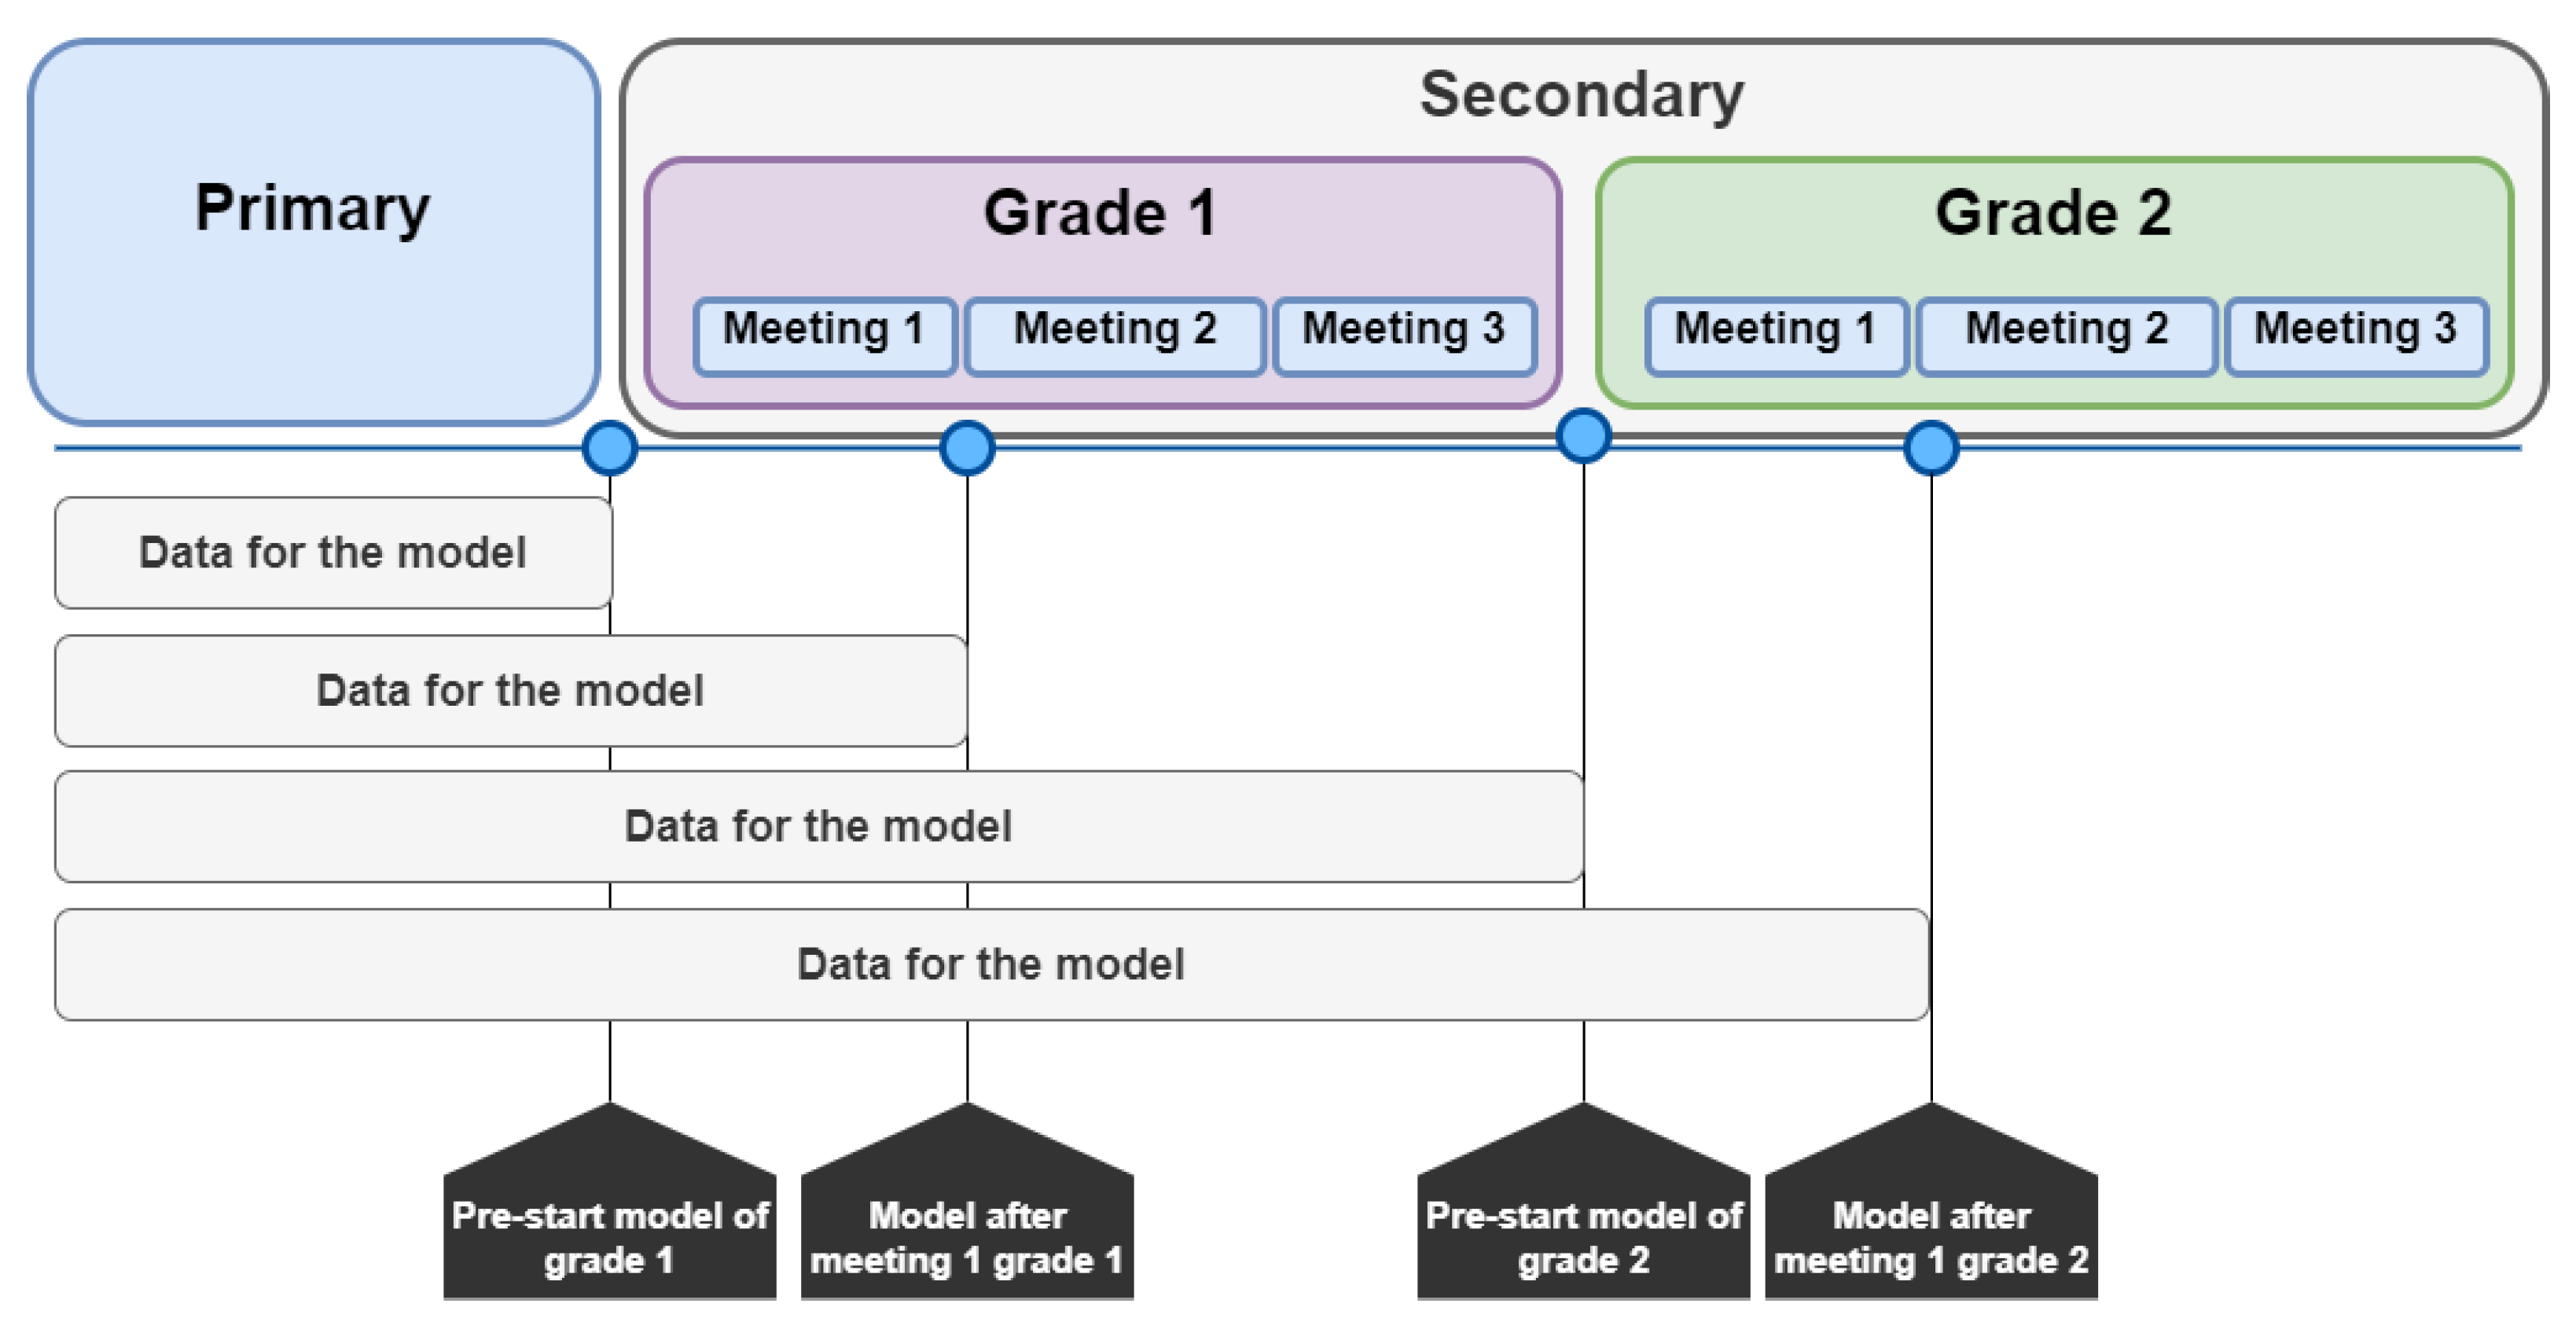
Primary education in Uruguay begins at the first grade (for children at the age of 6) and ends at the sixth grade (for children at the age of 11). Secondary education is divided into two cycles (basic and upper secondary education), each with a duration of 3 years. The basic cycle of secondary education comprises the seventh, eighth, and ninth grades for children from 12 and 14 years old. Upper secondary education is also known as bachillerato, which lasts 3 years and completes the education cycle for young people. This cycle can be compared to high school in Brazil and the United States.
This work focuses on basic secondary education (seventh, eighth, and ninth grades). Education for children in these groups is divided into two different models in Uruguay: normal secondary education (named CES) and technical vocational education (named UTU). These different teaching models have their own characteristics, such as different methodologies, calendars, schools, and courses. Still, these educational models present several sub-models of their own, which will be briefly mentioned later in this work.

3. Theoretical Background

Learning analytics (LA) is a recent area of research that emerged during the early 2000s [25] and which established itself as a new field during the first Learning Analytics and Knowledge Conference (LAK) in 2011 [8,26]. According to [27], learning analytics can be defined as “the measurement, collection, analysis and description of data about the students and their contexts, to understand and optimizing learning and the environments in which it takes place” [26].
LA is considered a multidisciplinary research area that encompasses a number of other research fields, such as machine learning, artificial intelligence, statistics, and data visualization, among others [8,28]). LA seeks to make use of different techniques from these fields to develop methods that can help improve learning in the different educational scenarios.
According to [29], LA aims to fully understand the many dimensions related to learning, and it seeks to analyze the different aspects associated with specific situations and problems faced in education. These problems may be, for example, a student finishing or not finishing a given course or achieving or not achieving certain performance in a given assessment. The idea is to observe and analyze the scenarios observing the behavior of different parties (e.g., students, professors, and coordinators) by using a more holistic method [29]. Therefore, LA involves a continuous cycle process that is always improving itself and that does not have a predetermined end. LA solutions and strategies should constantly be tested and re-evaluated. This is one of the reasons why [25] considers the field of LA to maintain a deep proximity to other areas other than educational data mining, such as business intelligence (BI) and semantic web and recommendation systems.
The present work can be classified under the scope of predictive learning analytics, as it is focused on the development of automated models for early prediction of students at risk of dropping out. The remainder of this section will present a brief bibliographical review of the related works.

Related Work

With the growing interest in predictive learning analytics, several researchers sought to model data coming from educational institutions in order to extract information and knowledge that can be used to improve teaching and learning processes. Predictive learning analytics problems are basically divided between performance prediction [30,31] and dropout prediction (evasion prediction) [32,33,34]. However, according to [35], both of these types of prediction are linked, as performance is a relevant factor for student retention, with some studies pointing out that poor performance can lead students to disengagement [11,36,37].
Predictive learning analytics may use data coming from different sources and types, such as academic systems [31,35], learning environments [32,33,38,39], demographic information [30,31,40] expenditure and income data [30,41], and multimodal data coming from sensors and other sources [42,43].
Existing works usually test several classifiers in order to select the ones with the best performance. Among them, it is possible to see some converging toward the use of decision trees with emphasis on the random forest approach [30,34,43,44,45]. Decision trees are algorithms used for supervised classification that generate a tree structure that sorts the unknown samples. The approach uses the data coming from the training dataset in order to create a tree able to classify the unknown samples without necessarily testing all the values of their attributes [43,46]. Decision trees are considered a white-box approach, with models that are understandable and readable by humans. This is an important feature for educational scenarios, as it allows some sort of explicable nature to the reasoning behind a given decision or prediction.
Although the majority of learning analytics initiatives are normally restricted to smaller datasets related to disciplines, courses, institutions, or case studies, a number of works have also started to explore information related to wider contexts and using educational data covering an entire country or state [47].
This was the case for the work developed by Frostad et al. [48], which evaluated the chances of a secondary student to dropout. The authors developed regression models using sociodemographic data from 2045 students from secondary schools in the Sør-Trøndelag Norwegian region. The authors identified a number of factors associated with students who dropped out, such as the mother’s instruction level, the level of support provided by the school and the teacher, and the amount of friends the student had inside his or her school class.
The use of data about the performance of the students in previous years to predict dropout is an approach that is also being adopted in the literature. For instance, Nagy and Molontay [49] obtained satisfactory results for predicting dropout at the tertiary level by using demographic information and data about the performances of the students in secondary school. The authors used data from 15,825 undergraduate students (from the economics program) and achieved an AUC between 0.808 and 0.811 to predict students dropping out. In the same direction, Lehrl et al. [50] used data from 554 students since pre-primary school to evaluate how learning and performance in the early years affects future educational problems such as dropping out and retention at secondary school. The authors demonstrated that the results in the early years of school are directly related to performance in secondary school, especially when considering the topics of reading, language, and alphabetization. This is an important finding that encourages the use of data from primary education to predict possible problems in secondary education.
In Latin America, research such as [15,33,51] sought to map large amounts of data in academic systems in order to predict the results and situations of students. Marquez [33], for example, proposed a system based on evolutionary algorithms to predict the dropout rate of high school students in Mexico. For this, data with 60 attributes were used, ranging from the admission test to the research data distributed to students, obtaining satisfactory results in the predictions. Moreover, Macarini et al. [15] described a countrywide K-12 learning analytics initiative in Uruguay, focusing on better understanding Uruguay’s educational data and the secondary level students’ trajectories inside the educational system. In that work, several databases were used to generate association rules related to students at risk of failure. Clustering techniques were also applied to better understand the characteristics of the different groups of students. The authors reported important findings, such as that the amount of absences (non-attendances both unjustified and justified) can be used as a predictor of the risk of failure. Dashboards were also provided for visualizing students’ trajectories throughout the school years and to compare students’ performances in the different subjects between schools. Finally, the authors described a total of eight main challenges faced during the implementation of a countrywide LA initiative. The work of [15] was used as a basis for the implementation of the present project.
Another remarkable initiative is the work of Hernández-Leal et al. [51], which used educational data from several sources of primary and secondary education at the state of Santander (Colombia). The authors integrated data originating from different educational levels to search students’ patterns related to their performances. The authors used different data modeling techniques, such as decision trees and t-SNE clustering. Among the results, the authors demonstrated that the performance of the students in previous years was associated with their current performance, and some sociodemographic features (such as social level and zone residence) were also important predictors of failure by the students.

4. Methodology

This section introduces exploratory data analysis (EDA) and feature engineering to build a set of data (variables) that allows the development of automatic models for the early identification of students at risk of dropping out. The methodology applied here is based on the Cross Industry Standard Process for Data Mining (CRISP-DM; Figure 1). The sequence explains the CRISP-DM model used and its six stages.
  • Context understanding: identification and understanding of the problem context, as well as defining the research hypotheses and the project requirements.
    -
    Background: understanding of the problem to be worked on and formulation of the research hypotheses.
    -
    Project objective: definition of research objectives and questions.
    -
    Evaluation criteria: definition of the metrics that will be used to evaluate the results.
  • Data understanding: consists of data collection and exploratory data analysis (EDA), as well as the search for relevant sources that can add data to the project. In this phase, data are collected, different attributes are analyzed, and their qualities are measured.
  • Data preparation: consists of the four-step feature engineering process.
    -
    Integrating data: the process of combining data from different databases into an integrated database.
    -
    Data cleansing: the process of detecting and correcting or removing incorrect or corrupt records as well as inconsistent data.
    -
    Data building: the process of creating variables (resources) that do not exist in the original data.
    -
    Data selection: the process of selecting and fitting the data that will be used as input in the predictive models. This can include the stages of handling outliers and deleting irrelevant data.
  • Model generation (modeling): an iterative step that occurs in conjunction with data preparation and in which different models are tested with different input sets and hyperparameters.
  • Results evaluation: In this step, the selected models are evaluated based on the metrics and objectives established in the previous steps. Models that meet the success criteria are delivered.
  • Delivery and conclusions: This stage consists of the delivery of the models, together with the manuals and the training of the ANEP technical team to use the solutions (to generate databases and retrain the models for the coming years).

4.1. Data Understanding

The data used in this work were provided by the National Administration of Public Education (ANEP) and collected from nine different educational management systems.
The different databases gathered for this project were preprocessed and transformed to generate three main datasets used for model generation: (1) the Primary Education (PE) database, (2) the Regular Secondary Education (CES) database (The acronym CES comes from Consejo de Educación Secundaria (i.e., Secondary Education Council)), and (3) the Technical Secondary Education (UTU) database (The acronym UTU comes from Universidad del Trabajo del Uruguay (i.e., Labor University of Uruguay)).
These databases were built from information collected from several other secondary databases, such as a database of students’ trajectories and performances, database about social welfare programs, database related to the absences of the students, and a database with information about schools, among others. The data were available for the period from 2015 to 2020. During this period, 261,446 students completed their primary education. From these, 258,440 were present in the secondary databases (194,636 in CES and 63,804 in UTU), while 3006 did not appear in the secondary databases. For these 261,446 students, we had the complete information cycle (complete primary education and first and second grades of secondary education). The specifics of each database are presented in the following sections.

4.1.1. Primary Education (PE) Database

The objective of the work with the Primary Education database was the creation of a data structure that would allow the integration of the trajectories of students during their primary education with the data of students in secondary education. Such integration allowed the development of models to predict students dropping out before they began their secondary studies. For this, data were collected from 614,307 students born between 2004 and 2013. These students belonged to 2088 schools distributed in the 19 departments (states) of Uruguay. From the total number of students in the database, 62,601 presented information for complete primary education cycles. The data were available for the period from 2015 to 2020. During this period, 261,446 students completed their education. From these, 258,440 were present in the secondary database (194,636) and UTU (63,804), while 3006 did not appear in any of these databases. Therefore, for these 261,446 students, we had the complete information cycle (primary data and secondary data) in the two main planes up to the sixth year of primary education. Examples of data stored in the PE include students’ scores on assessments, school codes, classes, departments, jurisdictions, type of school zone (rural or urban), areas, and subareas, among others.

4.1.2. Regular Secondary Education (CES) Database

The work with the Regular Secondary Education (CES) database was guided by the creation of a data structure that would allow the early identification of students who showed indicators of failure or dropping out in the first and second year of secondary education. Examples of information from this database which were used for modeling students at risk include subjects (disciplines) taken by the students together with the performances achieved by them, presence or absence during the courses, whether the students were part of social welfare programs or not, and data about the students’ schools. In total, data from 213,620 students were used from the period between 2016 and 2019. It is important to mention that the school year in secondary education in Uruguay is organized in three trimesters and that at the end of each trimester, the teachers evaluate their students in so-called meetings (three meetings per year). After each trimester, students receive their assessments (ratings) in each subject. At these meetings, the absences of the students (justified and unjustified) are also computed. All this information was available in the CES database.

4.1.3. Technical Secondary Education (UTU) Database

The UTU database stored information about technical education that was offered in Uruguay and was integrated with regular secondary education. In this educational model, students attended secondary and technical school at the same time (after finishing primary education). Technical education in Uruguay is organized into three years. In turn, each year (grade) is organized into bimesters (four bimesters per year). The creation of the UTU database utilized similar data to the CES database. However, these two teaching models contain different internal structures, such as the calendar and the number of evaluation meetings. Thus, it was necessary that the databases were generated separately despite having the same origin. In the end, the UTU database contained 46,994 students, of which 17,923 presented complete education cycles in the database (i.e., data from the first, second, and third grades) and were considered in the forecasting process.
More details about how each database was created is given in Section 4.3.

4.2. Fairness and Exploratory Analysis of Protected Groups

The results obtained by machine learning algorithms were a direct reflection of the input data and the treatment dedicated to them. Some attributes (variables) can generate bias in the predictive models, generating wrong assumptions in the learning process and in the final results of the models. To avoid this kind of situation, it was recommended in [52] to use methods to assess the fairness of the results generated by the prediction algorithms. Precisely, it was proposed in [52] to evaluate the datasets and define those attributes that can generate some kind of unfairness in the prediction process (e.g., gender and other demographic data). After the creation of the predictive models, the performances were then compared with the fairness in relation to the so-called protected groups (groups related to the attributes previously selected).
For this work, the following attributes related to protected groups were defined to be taken into account for the identification of biases in the models: gender, social welfare program, and school zone (location). The following subsections present an exploratory analysis of these attributes, and Section 6.3 presents an overview of how the bias analysis was performed while considering them.

4.2.1. Gender

Assuring fairness in learning machine predictive models is a complex task [53]. Several authors point out that one of the most significant issues to be tackled in this direction is to ensure equity between genders during automated predictions. Considering that one normally observes inequity between genders inside the data [53,54,55], it is expected that the predictive models will reflect unequal behavior toward one category to the detriment of another. However, such predictions do not always accurately represent the behavior of these categories [55]. Therefore, it was necessary to analyze gender as an input variable beforehand in order to avoid hidden biases inside the predictive models.
Table 1 presents the absolute frequencies and percentages of students according to gender in the three databases, together with the percentages of approval or “possible problem”. As can be seen in Table 1, the UTU database had a higher percentage of male students than female students, with a difference of 20.44%. In the CES database, the percentages of male and female students were very close, with only a 4.84% difference between the two genders.
Regarding the percentage of students who engaged in the educational system and completed their studies, the UTU database had 68.2% of the female students completing their studies against 61.4% of the male students. The CES database presented similar data to the UTU database in this respect. For the CES, 62.3% of the female students completed their studies against 59.2% of the male students. The data presented here referred only to the students whose trajectories were being used to generate the predictive models.
Figure 2 shows Pearson’s correlation between “gender” and the students’ final statuses in the first and second grades of secondary education (ResultYear1 and ResultYear2, respectively) for the CES database. As is possible to see, the correlation coefficients were close to zero, indicating that there was no correlation between the students’ genders and their performances.

4.2.2. Social Welfare Program

The attribute “Social Welfare Program” is binary information representing whether the student or his or her family was part of governmental compensatory social policies throughout the student’s primary education trajectory. This information was integrated with both the CES and UTU databases. Table 2 shows the number of students (or families) who were part of compensatory social policies during primary school. As is possible to see in the table, in percentage terms, the UTU students participated more in compensatory social policies during primary education than the CES students (70.2% for UTU against 41.1% for CES).
Table 3 presents the combination of the gender and social welfare program attributes in primary school and the students final statuses in the first grade of secondary education. It is possible to observe that students of both genders who participated in social welfare programs had fewer problems in their education. When one analyzes the female gender, only 3.8% presented a possible problem in their training against 4.7% for males.

4.2.3. School Zone

The third attribute considered to protect specific groups against possible bias was the area in which the school was located. This attribute indicates whether the student attends a rural or an urban school. Table 4 presents the number of students and their final statuses by grade and database. As is possible to see in the table, there was a huge concentration of students in urban areas.

4.3. Data Preparation

Data preparation was performed using the Python programming language and the following main libraries: NumPY, Pandas, and Scikit-learn. This step included data integration, data cleaning, the derivation of new features, and data selection. The EDA stage played a significant role in data preparation, collaborating with insights and helping to identify issues such as the characteristics of the attributes (distribution, type, categories, etc.), the impact of each database in the process, and the importance of inserting new variables.

Data Integration and Data Construction

The first step for data integration was to identify the educational path that students took after finishing primary education. For this, the identifications of the students on the PE database were compared to the identifications of the students on the CES and UTU databases. After this step, it was possible to verify the following situations: students who dropped out of the educational system after primary education, students who engaged in regular secondary education, and students who engaged in technical secondary education. In a second step, the following additional information was generated: the number of years the student was in the databases, the first and last years of the student in the databases, and the first and final grades of the student in the databases. All this information helped to further consolidate the student’s school life cycle for the years available in the databases (from primary school to the two first years of secondary school).
The next step involved transformation of the data contained in the three databases into time series. A time series is characterized by data collections that are directly interconnected by time, being widely used in various areas such as economics, statistics, finance, and epidemiology [56]. For the context of this project, the most important sequences of data generated were student evaluations over the years for the different subjects (disciplines), students and family in social welfare programs over the years, and students’ presence and absences during the academic cycle [57]. The motivation behind this strategy is to represent a student’s progress over time. Figure 3 presents a graphical view of this approach.
The following is a brief description of each database after transformation and integration:
  • The PE database had 137 columns with information such as students’ evaluations in the different subjects separated by grade (from the first to the sixth grade), information about the schools (location, code, and department, among others), averages (means) of the students’ evaluations in each grade, students’ final evaluations in each grade, and the quartile where the students’ evaluations were in comparison to the school. Finally, information from a total of 62,601 students was available in the database and with a temporal effect.
  • At the secondary educational level, there is a higher number of subjects (disciplines). Moreover, students are evaluated in meetings that take place every 2–3 months. In these meetings, students receive an evaluation rating (grade) for each subject in which they are enrolled (e.g., mathematics, foreign language, and arts, among others). Schools regularly perform three meetings per year and a fourth meeting at the end of the year when it is necessary and for the students who still need to take extra exams. Considering this scenario, the top 10 available subjects were filtered. New attributes were then generated for each evaluation of each meeting of each subject using the following syntax: Yi-Mj-Subject, where i stands for the number of the year (grade) and j stands for the number of the meeting. For instance, the attribute Y1-M1-English represents the assessment of the student in English for the first meeting of the first year. In addition, the number of absences of the students in each class of each subject were also computed. Absences in the context of this project could be justified absences or unjustified absences.
  • The generation of the final UTU database followed the same principles as those for the CES database’s generation. The difference here is that UTU database had a greater number of disciplines, and the top 12 subjects were selected.

5. Generation of the Predictive Models

This stage involves a number of different aspects, such as tests with different algorithms, selection of the algorithms to be used, filtering the data while considering its characteristics and contribution to the performance of the models, and configuration of the hyperparameters.
The target attribute (dependent variable) in this project was the student’s final status at the end of the year. This status could be “approved”, “failed”, or “dropped out”. Each one of these statuses was inferred from the databases available as follows:
  • To be considered “approved” in a given year (grade), the student must be enrolled in the courses of the next year (grade) in the database.
  • The student is considered “failed” in a given year if he or she is enrolled in the same grade in the database for the following year.
  • The student is classified as “dropped out” if he or she does not appear as enrolled in any courses in the database in the following year.
The categories “failed” and “dropped out” were grouped into a single category named “possible problem” in order to allow a binary prediction.

5.1. Selection of Algorithms

The first step for the generation of the models was the selection of algorithms that could meet the requirements established by the Responsible AI manual of the IDB fAIrLAC [16] and that presented good performance. According to the fAIrLAC manual, the predictive models needed to be explainable and auditable, with the suggestion of using white-box models. The manual highlighted the importance of understanding the reasoning behind the automated decisions and classifications.
The following algorithms were initially tested with the first raw databases for CES and UTU obtained during preprocessing: random forest (RF), decision tree (DT), Adaboost (ADA), multilayer perceptron (MLP), naive Bayes Gaussian (NB), and logistic regression (RL). The neural network (MLP) was included to make a performance comparison, since machine learning studies usually show that MLP presents good results in this type of application [58].
The algorithms that presented the best results were random forest and MLP, with both showing very similar performances. Some tests were also performed with more advanced ensemble algorithms, such as gradient boosting [59] and XGBoost [60], but both were discarded because they did not present significantly higher performances than the previous ones. Considering these results, random forest was selected to be used in the sequence of the project. This decision was made based on the RF model architecture and the performance achieved in the first tests. Furthermore, even though random forest is considered a black-box model, its models can be easily transformed into interpretable ones. For this transformation, we chose to use the TreeInterpreter package (https://github.com/andosa/treeinterpreter) (accessed on 10 May 2022), which generates visualizations of the trees through the decomposition of the models.

5.2. Data Preprocessing Configurations for Training

A total of eight different combinations of configurations and data preprocessing were tested with random forest models to evaluate which ones presented the best performances. These different combinations are described below:
  • I1—Raw database: application of the random forest algorithm with its default configuration using the raw database.
  • I2—Weights (target variable): application of the algorithm in its default configuration using the weights of the target variable with SKLearn’s class-weight parameter.
  • I3—Feature Selection: a feature selection application for selecting the top 20 attributes and the training algorithm using these variables.
  • I4—Resource selection + database balancing: application of combination I3 in conjunction with the application of database balancing techniques.
  • I5—Resource selection + database balancing + weights (variable target): application of combination I4 with the increase in stage I2.
  • I6—Resource selection + balancing + weights + GridSearch: application of combination I5, adding the hyperparameterization of the algorithms with the GridSearch application [34,61].
  • I7—Pipeline generated from the TPOT automated learning library: use of the Python automated machine learning tool using TPOT genetic programming [62].
  • I8—Using the ImbLearn library [63] with the EditedNearestNeighbours, SMOTE, and PCA methods.

5.3. Evaluation of the Predictive Models

The strategy defined for the application and evaluation of the models followed the “Technical Manual of Responsible AI—AI Life Cycle” provided by fAIrLAC [64]. Thus, the algorithms were trained and tested using k 10 cross-validation. For the combinations where data balance was applied (iterations I4, I5, and I6), this was manually programmed and applied only to the training dataset. In other words, the data were divided into 10 folds, and the one used for testing was not balanced.
Three different metrics were used to evaluate the performance of the models: F1-Macro, F1-Micro, and AUROC. AUROC stands for the the area under the ROC curve, where the Y axis represents the true positive rate (TPR) or sensitivity ( T P / ( T P + F N ) ) and the X axis represents the true negative rate (TNR) or specificity ( T N / ( T N + F P ) ) .
The selection of these metrics took into consideration the recommendations provided by the “Technical Manual of Responsible AI—AI Life Cycle” provided by fAIrLAC [64] for binary classifiers and the existing examples already published in the fields of educational data mining and learning analytics, such as those from Baker and Inventado [8], Romero et al. [65], Gasevic et al. [66], and Romero and Ventura [67].

5.4. Temporal Approach for the Models and Retraining Periods

The main idea of the work was to generate predictive models to identify early those students at risk of dropping out or failure so that it would be possible for professors and school coordinators to take actions in order to mitigate this situation. For this, it was necessary that the output of the models was provided in time for such actions to be taken. Specifically, four predictive models were generated for each database related to secondary education (CES and UTU). Figure 4 helps to illustrate the temporal approach adopted for the models. As can be seen from the figure, two of these models were focused on predicting students at risk at the beginning of the school year (one model for each grade), and the other two models were intended to be used after the first evaluation meeting of the school year. What follows is a more in-depth explanation of each of the models:
  • Grade 1 pre-start model (M1G1): This model must be used before the 1st grade classes start and would be used with the primary data and social welfare programs that students are part of.
  • Grade 1 post-meeting 1 model (M2G1): This model must be used after the first evaluation meeting and with the incorporation of new data obtained from that meeting (grade and absence results).
  • Grade 2 pre-start model (M1G2): This model must be used prior to the start of second grade classes and would use primary school data, first grade student outcomes, and data on social welfare programs for high school students.
  • Grade 2 post-meeting 1 model (M2G2): This model must be used after the first evaluation meeting of the second grade and with the incorporation of the new data obtained from that meeting (grade and absence results).
It is suggested that all models should be retrained once a year after the end of each school year.

6. Results

This subsection presents the best results obtained for each model, considering the F1-Macro and AUROC evaluation metrics.

6.1. Results for the CES Predictive Models

Table 5 presents the best results obtained for each of the CES models and the respective preprocessing combination that generated these results. As one can see in the table, all models had F1-macro scores and an AUROCs greater than 0.87. Figure 5 presents a temporal view of how the performance of the models evolved through the grades.
The results demonstrate that the approach of creating a lifetime of CES data was satisfactory. Through this approach, the models were able to reach an outstanding discrimination (AUC > 0.90) for all four scenarios of the CES data. In the worst case scenario, the models were able to correctly identify the final statuses of the students in 91% of the cases.

6.2. Results for the UTU Predictive Models

Table 6 presents the results of the models for the UTU database. As can be seen in the table, the initial model (M1G1-UTU) presented the worst results, with F1-Macro and AUCROC results of 0.68. However, from the second model (M2G1-UTU), the performance grew, with results above 0.93 (F1-macro) and 0.95 (AUCROC). Figure 6 presents a temporal view of how the performances of the models evolved through the grades.
Here, the results also demonstrated that the approach of creating a lifetime of the students was satisfactory for the UTU context. However, the M1G1-UTU model did not achieve good predictive results and was not implemented in the final solution. We believe the poor performance of this given model may be related to the small amount of data used as the input in comparison with the other models. It seems that for the specific case of the UTU context, data from primary education were not sufficient to generate good classifiers. When new data were coming from the secondary education period (until after the first meeting), the models began to achieve good performances (e.g., model M2G1-UTU achieved a performance of 95%).

6.3. Analysis of Bias

Bias analysis seeks to evaluate the predictive models regarding their ability to provide unbiased decisions toward any protected group. For this, issues such as the behavior of the models for the input data and whether the behavior is somehow biased are evaluated [68].
All resulting predictive models that used any attribute related to the protected groups previously defined (see Section 4.2) were evaluated using the What-if tool (https://pair-code.github.io/what-if-tool/) (accessed on 10 May 2022). Table 7 describes the models generated, the protected group attributes used by them, and the bias found in the analysis.
Figure 7 presents the visualization of the bias analysis for the social welfare program attribute in the M1G1 model. As can be seen in the figure, the F1-Macro score for category 1 (yes, social welfare program received) was 0.80, while the F1-Macro score for category 0 (no social welfare program received) was 0. This indicates a bias toward the students who participated in social welfare programs.
With the detection of bias toward the social welfare program and gender attributes in the M1G1-UTU model, the remaining predictive models generated from the other preprocessing combinations were also tested. However, all the remaining models also presented a bias toward these attributes. Considering this, a new round of predictive models was generated while removing the protected attributes. However, the resulting models for this round did not reach acceptable performance. Table 8 presents the confusion matrix for the model with the best performances when the attributes “gender” and “social welfare program” were not considered in the input. This model obtained an AUCROC of 0.49, an F1-Macro score of 0.06, and an F1-Micro score of 0.06. Due to the limitations of the models for M1G1-UTU, they were not recommended to be used in practice.

7. Predictive Models Deployment

LA is distinguished for defining a greater focus on the process and how the developed solutions are used to improve teaching and learning in a continuous way. The results provided by LA solutions should be incorporated into the teaching and learning cycle, allowing interventions and providing new and improved scenarios that are again continuously improved by these solutions.
The deployment of the predictive models and the strategies for retraining them are essential for completing a fruitful LA solution. As was previously mentioned, the models developed here are recommended to be retrained twice a year (at the beginning of the school year and after the first evaluation meeting). Together with these recommendations, this project also developed a web API to use the models and provide the classification of the students according to their risk.
The API was developed using Python together with the Flask framework (https://flask.palletsprojects.com/en/2.1.x/) (accessed on 10 May 2022) to build the web server. The Pandas and Celery (https://docs.celeryq.dev/en/stable/) (accessed on 10 May 2022) libraries were used in the API. Pandas is a library that facilitates the manipulation and treatment of data, and Celery is an asynchronous queue of tasks implemented in Python and oriented to the passing of distributed messages in real time.
Queue handling was performed using RabbitMQ (https://www.rabbitmq.com/) (accessed on 10 May 2022) as a broker to transport messages between processes. Version v4 of RabbitMq was used, and as in later versions, messages larger than 128 MB were not handled by default, as required by this project. A Redis (https://redis.io/ (accessed on 10 May 2022)) was used as a backend in Celery, as it is a very efficient key value database for searching the results of tasks. Docker and Docker Compose were used to create Celery containers for the Redis, Rabbit, and API applications. To interact with the API, Python scripts and the application’s frontend were developed. On the frontend, the javascript programming language and the ReactJS framework (
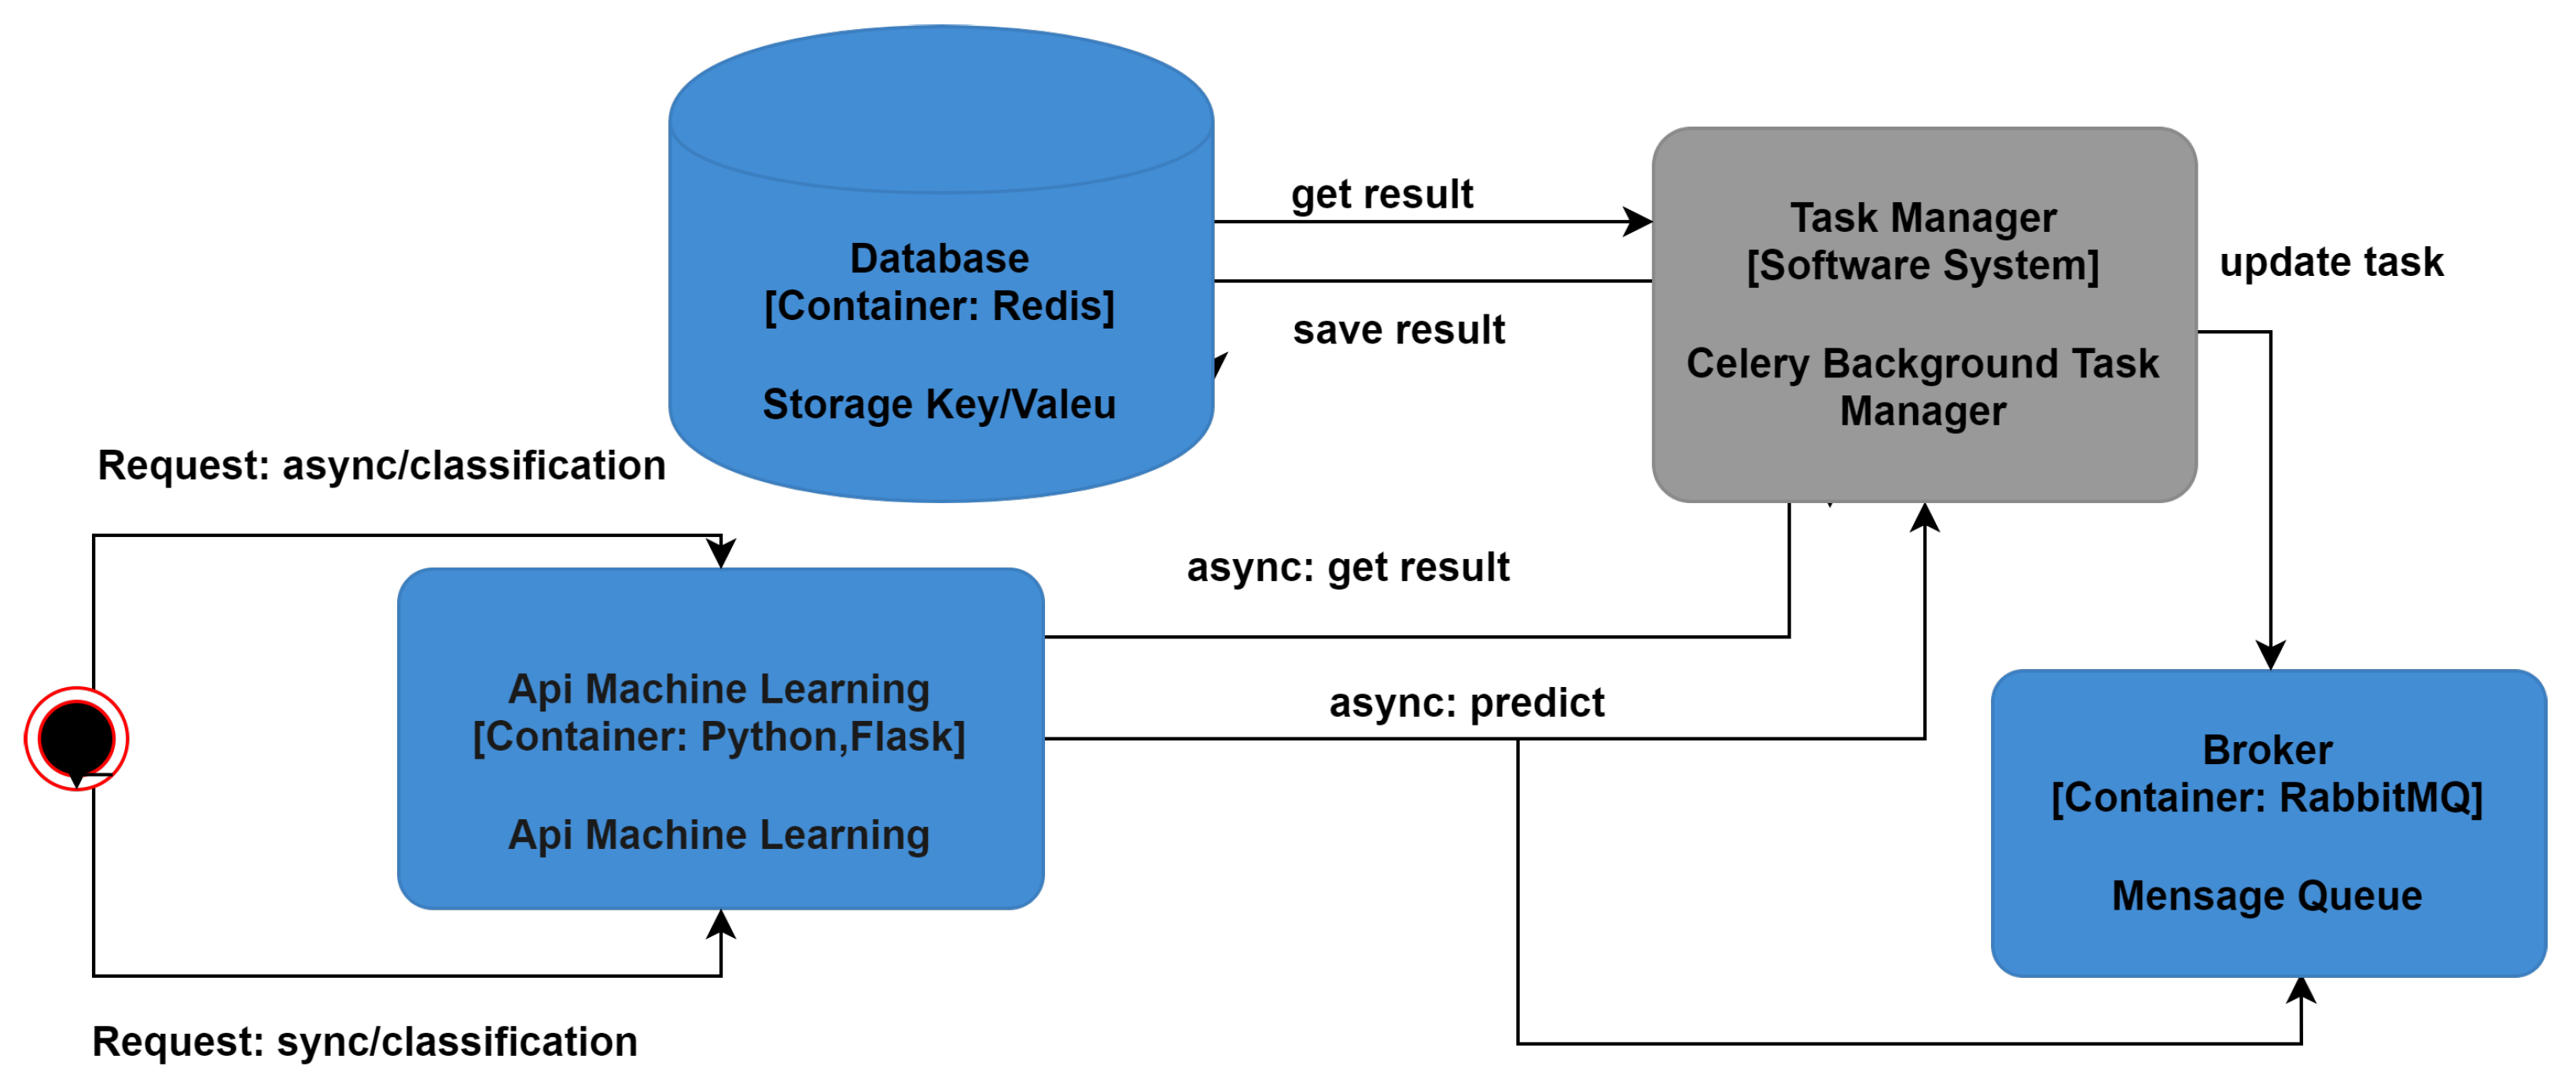
https://reactjs.org/) (accessed on 10 May 2022) were used to style the CSS3 frontend application. The machine learning API architecture was designed to support both asynchronous and synchronous predictions. Figure 8 presents an overview of how the API operates.
In asynchronous prediction, the user will send the CSV file containing the students’ data and will immediately receive a token to check the prediction results afterward. The API will receive an HTTP/POST request with the CSV appended and the information of which model to use. This information may be sent from the web interface or from a terminal running a Python script. Celery is used by the asynchronous system to process the prediction task in the background, which will collect the information received in the HTTP request from the queue in RabbitMq. Then, Celery will start processing the forecast. When processing is complete, a message is sent to the queue with the results of the prediction. Therefore, when the query is made by the user through the token, the prediction result will be retrieved. At this point, a cache of results will be created in Redis, and the result will be sent to the user in HTML and CSV formats, along with the information displayed in the interface. In case the API has not finished processing the predictions while the user is consulting the results, the user will receive a message that the prediction is in progress and that the user will need to try to retrieve the results again later.
At the end of the prediction process, the user can consult the results and use them to make descriptions, such as the final statuses of the students (approved or possible problem) by region, by school, or by participating in social welfare programs, among other factors. It is important to highlight that the classification of each instance involves uncertainties. Together with the results for the final statuses of the students, the API also presents the probability of certainty of the classification provided by the automated model.
In synchronous prediction, the API will receive an HTTP/POST request. Together with the request, it will be sent the CSV file containing the data and the information about which model should perform the prediction (e.g., M1G1-CES or M1G2-UTU). In this model, the API will process the CSV file and start making the prediction. The user who requested the prediction must wait for the process to finish before receiving the results. Once the prediction is completed, the user will receive the results in the HTML and CSV formats together with other information about the prediction.

8. Discussion

RQ1: Is it possible to generate an LA-based methodology that encompasses data acquisition, data transformation, and the generation of models that can help to identify early students at risk of dropping out at the secondary level?
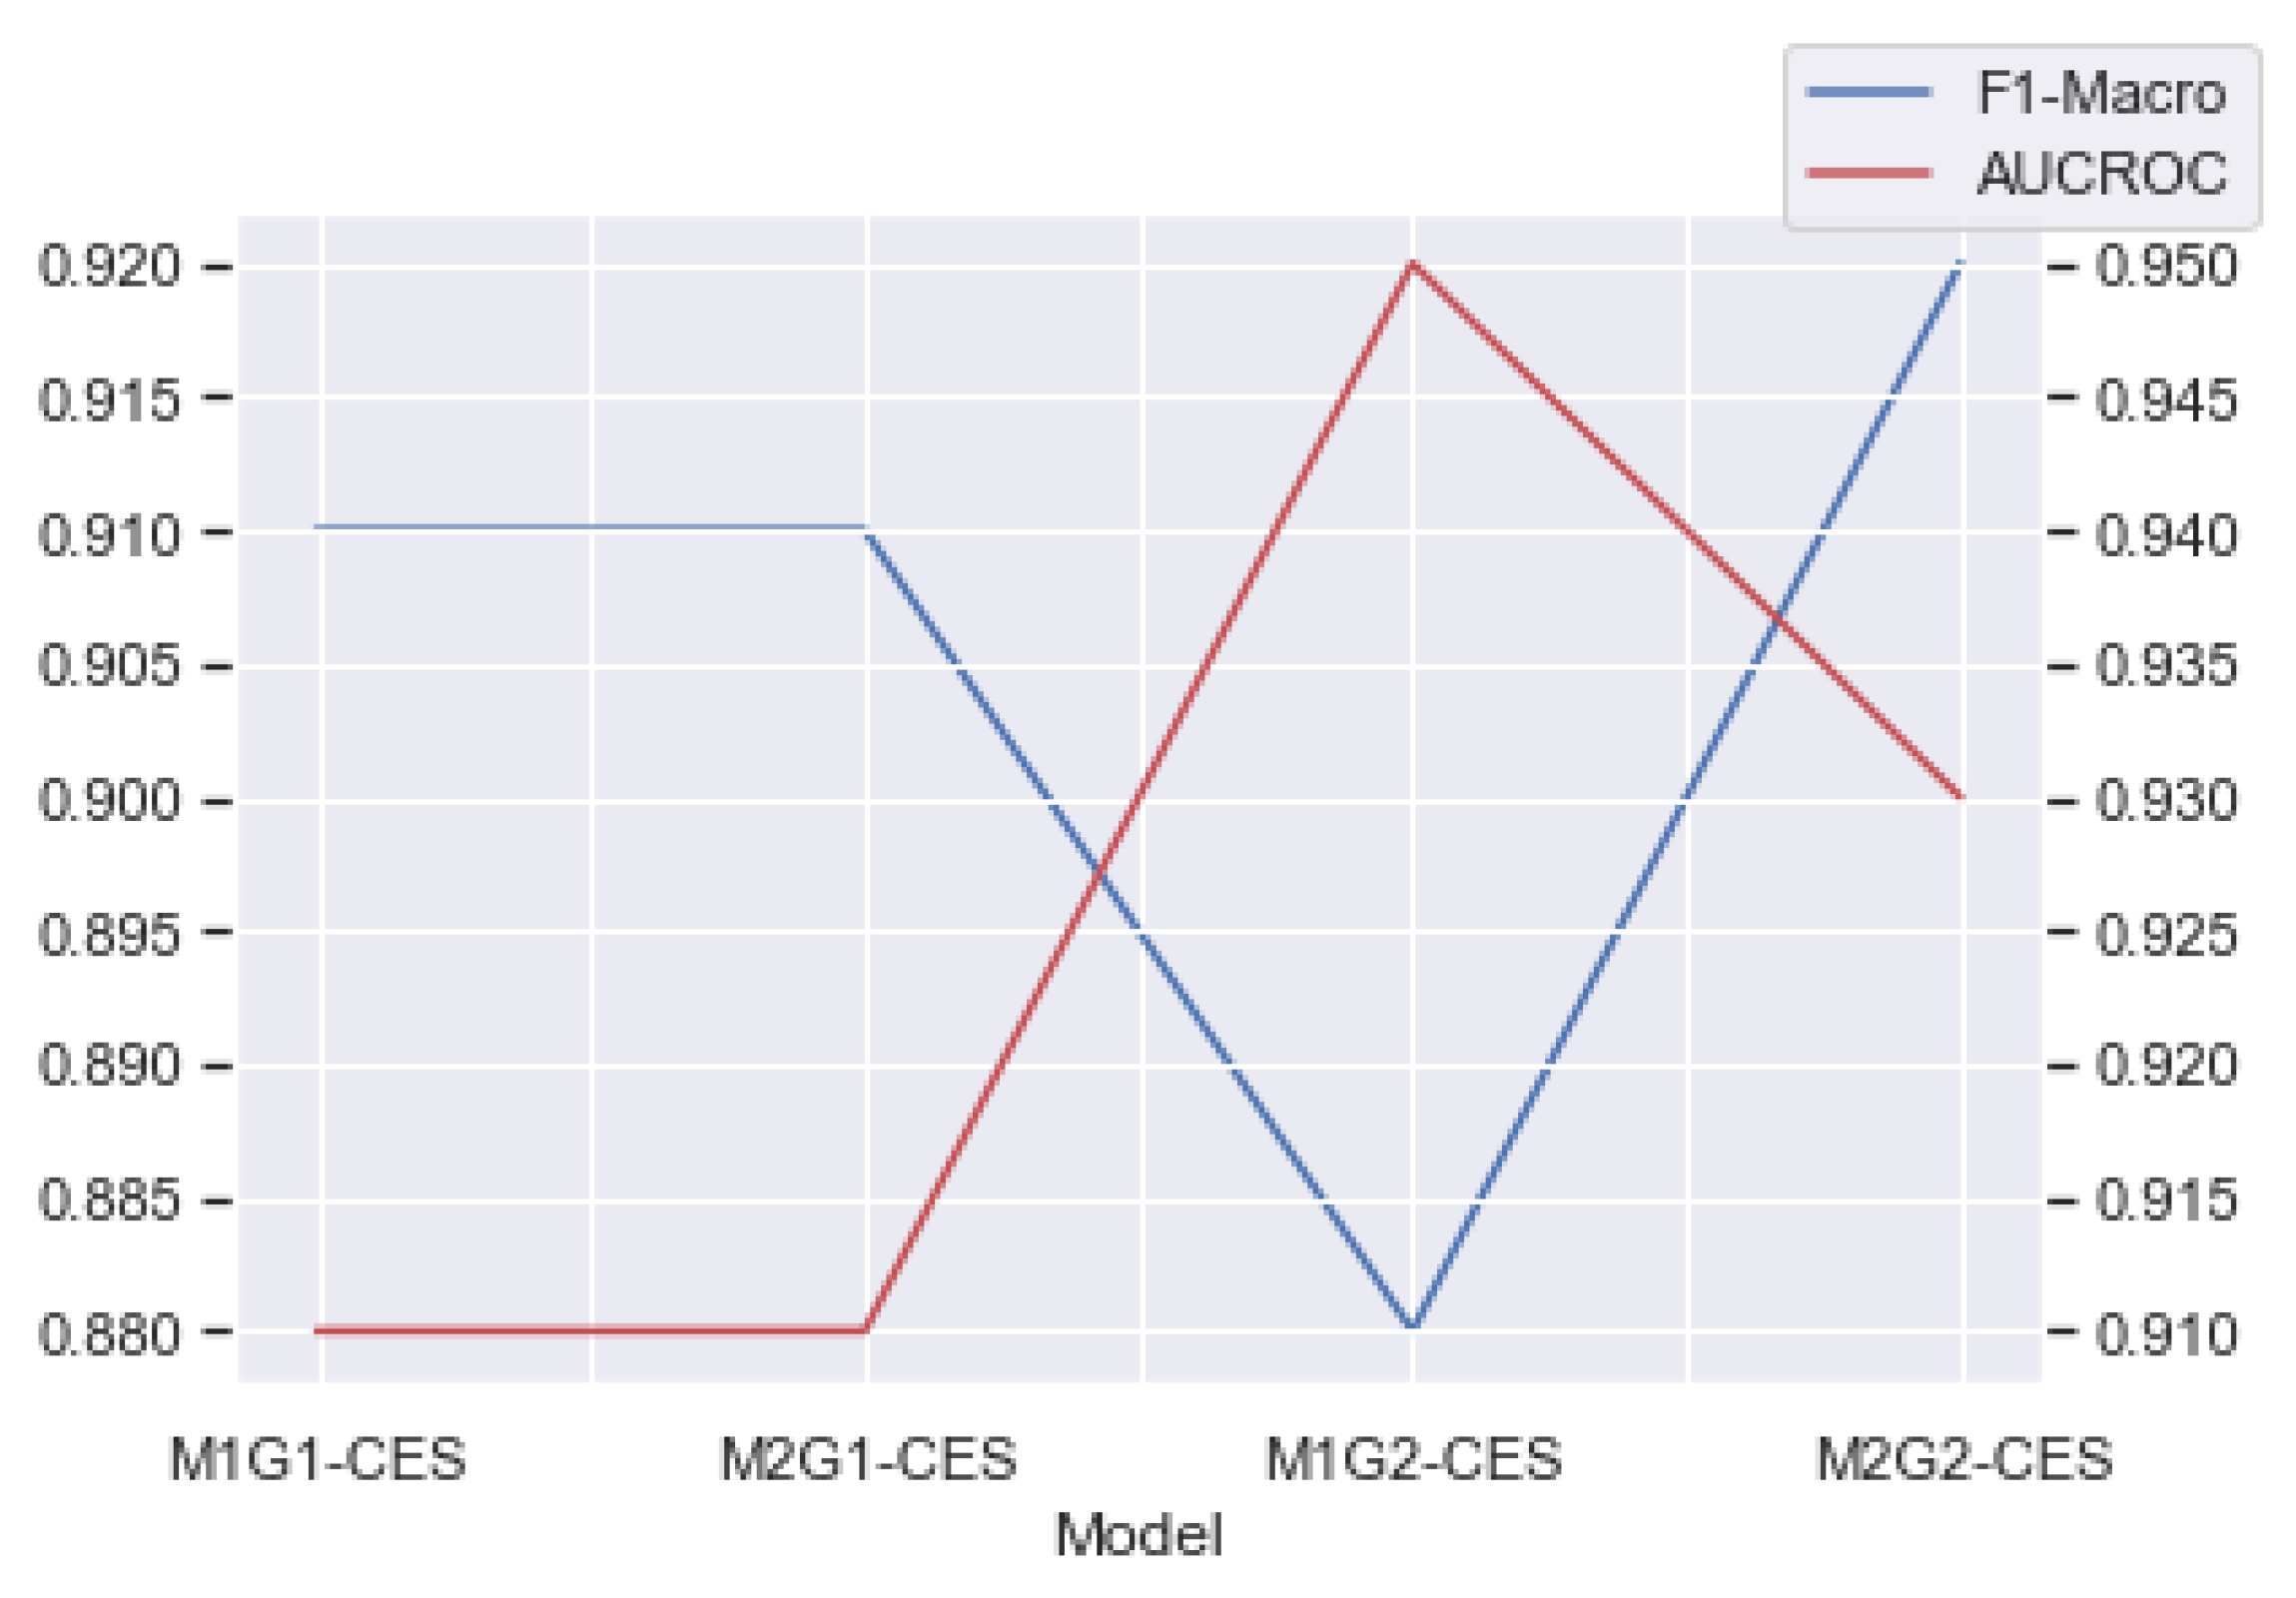
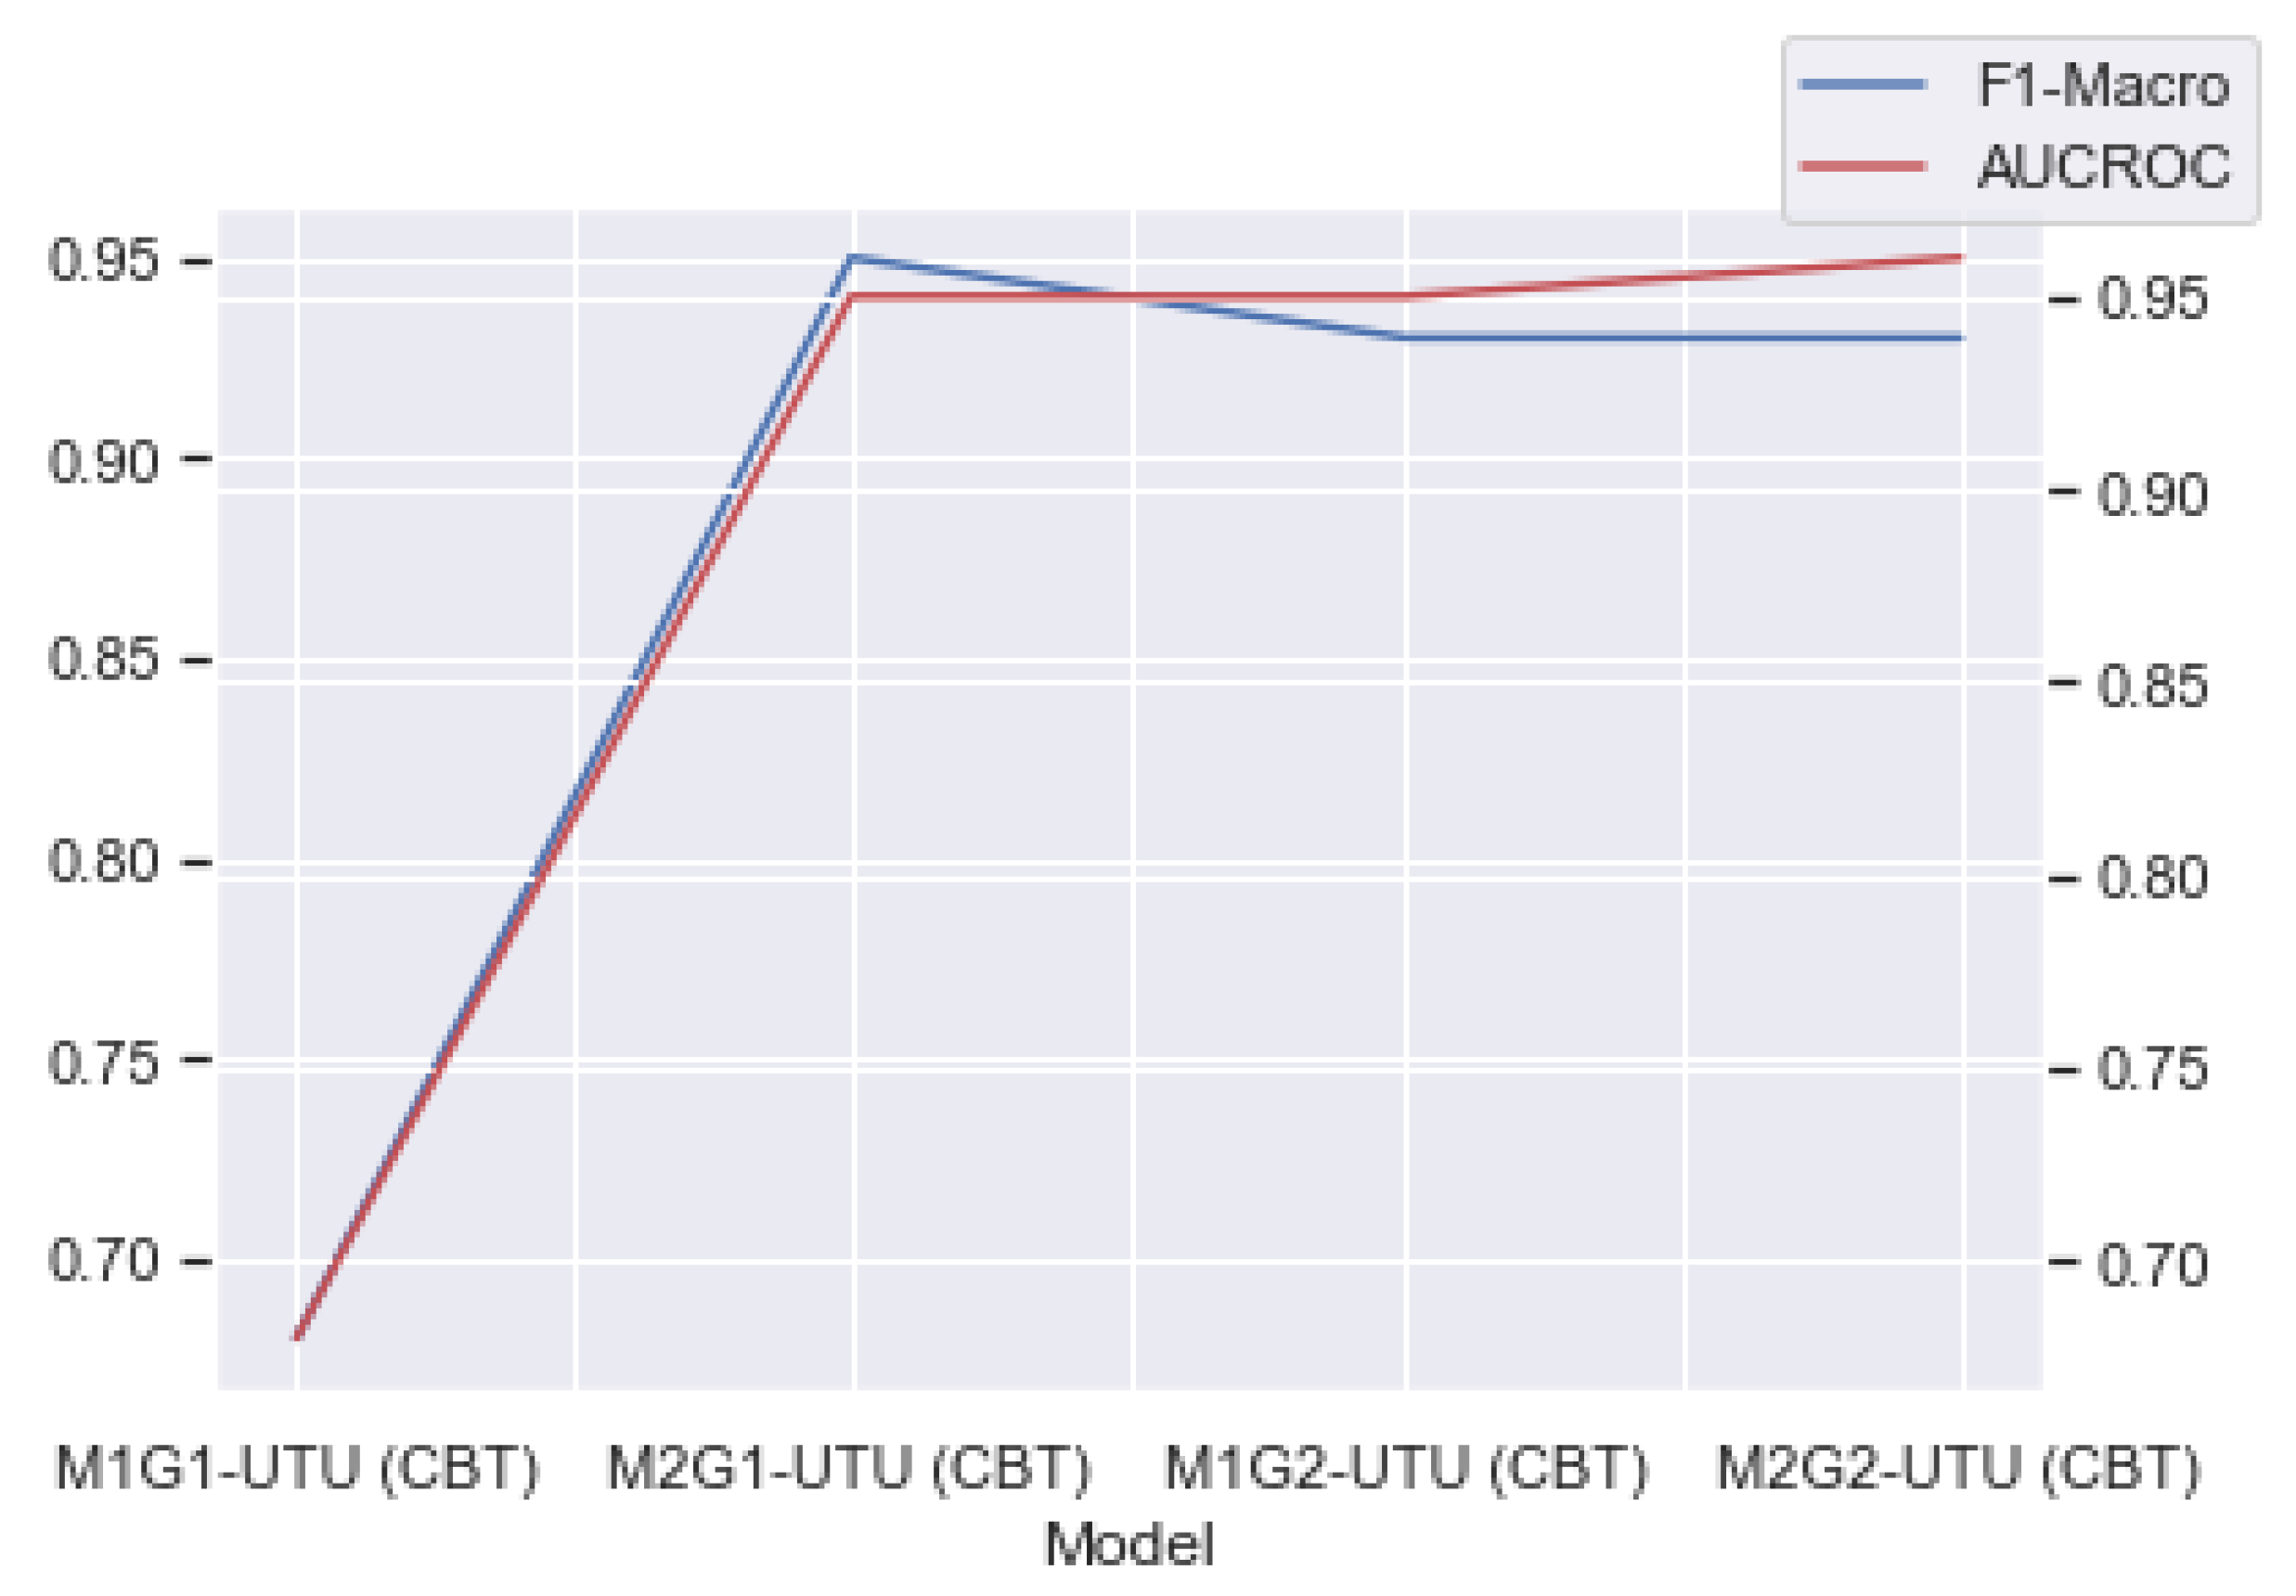
Yes, it is possible to generate this methodology. In general, the results found were satisfactory, with only one model (among the eight) not showing good results and being discarded. All other models achieved AUROC values higher than 0.91, which is an outstanding discrimination when considering the scale provided by Gašević et al. [69]. These results were also confirmed by the F1-macro values, where the worst value was 0.88. Specifically, when one analyzed only the four pre-start models for the CES and UTU databases (M1G1 and M1G2), three of them were able to classify students who would face a possible problem (failure or dropping out) at that given grade and with great performance. Moreover, the four post-meeting 1 models for the CES and UTU databases (M2G1 and M2G2) presented great performance and were able to be used to classify students who were at risk. These results confirm the viability of the proposed methodology to identify early students at risk at the beginning of the school year and after the first evaluation meeting of the school year. Moreover, from the results obtained by the models, it is possible to see that their performances increased as more information was provided as input for them.
However, this methodology still has some limitations, such as the need for annual manual collection of data, annual preprocessing, and retraining of the predictive models. Future works will be focused on the direct integration of the predictive models with the different databases so that the data collection step can be automated, thus facilitating the process and optimizing the time spent in this part of the workflow.
Another issue to be deeply discussed in the next phases of the project is related to which stakeholders should have access to the prediction results. From the beginning, this project was designed to solely grant ANEP’s managers access to the results so that these results could help the development of institutional and educational policies based on the data. Considering this, teachers and students would not have access to the results at this initial phase, which is a practice aligned with the current learning analytics literature and recommendations for this kind of work [70]. Whether or not other stakeholders should also access the results of these predictions is still subject to future discussion.
RQ2: Is the transformation of data from different databases into time series a viable alternative from a preprocessing point of view? If so, are the final results generated by the prediction models using this technique satisfactory?
Yes, from the preprocessing point of view, it was possible to generate time series from the collection and integration of data from the different databases, thus generating information and knowledge about the educational system and students.
Regarding the results, the models presented very good performances (with the exception of M1G1-UTU). The results found in the experiments show that it is possible to generate predictive models that can help in the identification of students with a tendency to face some problems (dropout or failure) during secondary school. However, these models need to be trained annually with new data that can represent the changes taking place in the student population. This can generate a complex situation, since these models used data prior to the COVID-19 pandemic and may not present good results with data from the pandemic period. It is understood that new educational scenarios that emerged from the pandemic will possibly require future adaptations in the predictive models.
RQ3: Is it possible to generate and analyze explainable models based on machine learning so that biases can be identified and corrected when necessary?
Yes, this is possible. In this project, the random forest algorithm was chosen, considering this as the algorithm to generate the models so that the reasoning of the models could be open and understood by humans. Moreover, currently, there are several techniques and libraries that can assist in testing and verifying possible biases in machine learning models. In this work, the What-if tool was used to help in this part of the analysis. The tool allowed us to analyze the models regarding the bias in the attributes that were previously selected as protected. In the analyses performed, only one model generated bias (M1G1-UTU). This model was eliminated from the work, as it was not possible to correct this bias after several interactions.
RQ4: Which features are the most important to predict students at risk in secondary school in Uruguay early?
A large number of attributes were generated that served as input for the models. The strategy adopted to avoid the curse of dimensionality was the application of procedures for selecting input variables and to reduce them to the 20 most important ones, together with the use of the random forest algorithm, which was particularly suited to dealing with this problem [71].
Thus, for each predictive model, a prior step was carried out: selecting the top 19 most important features that could help with classification. To calculate the most important features to be used as input for the models, the predictive power score (PPS) was used. This metric calculates a value between 0 (no predictive power) and 1 (perfect predictive power), representing the relationship between the different attributes against the target [72,73]. This metric is widely used in time series, as it has the ability to point out how much a given variable says about another.
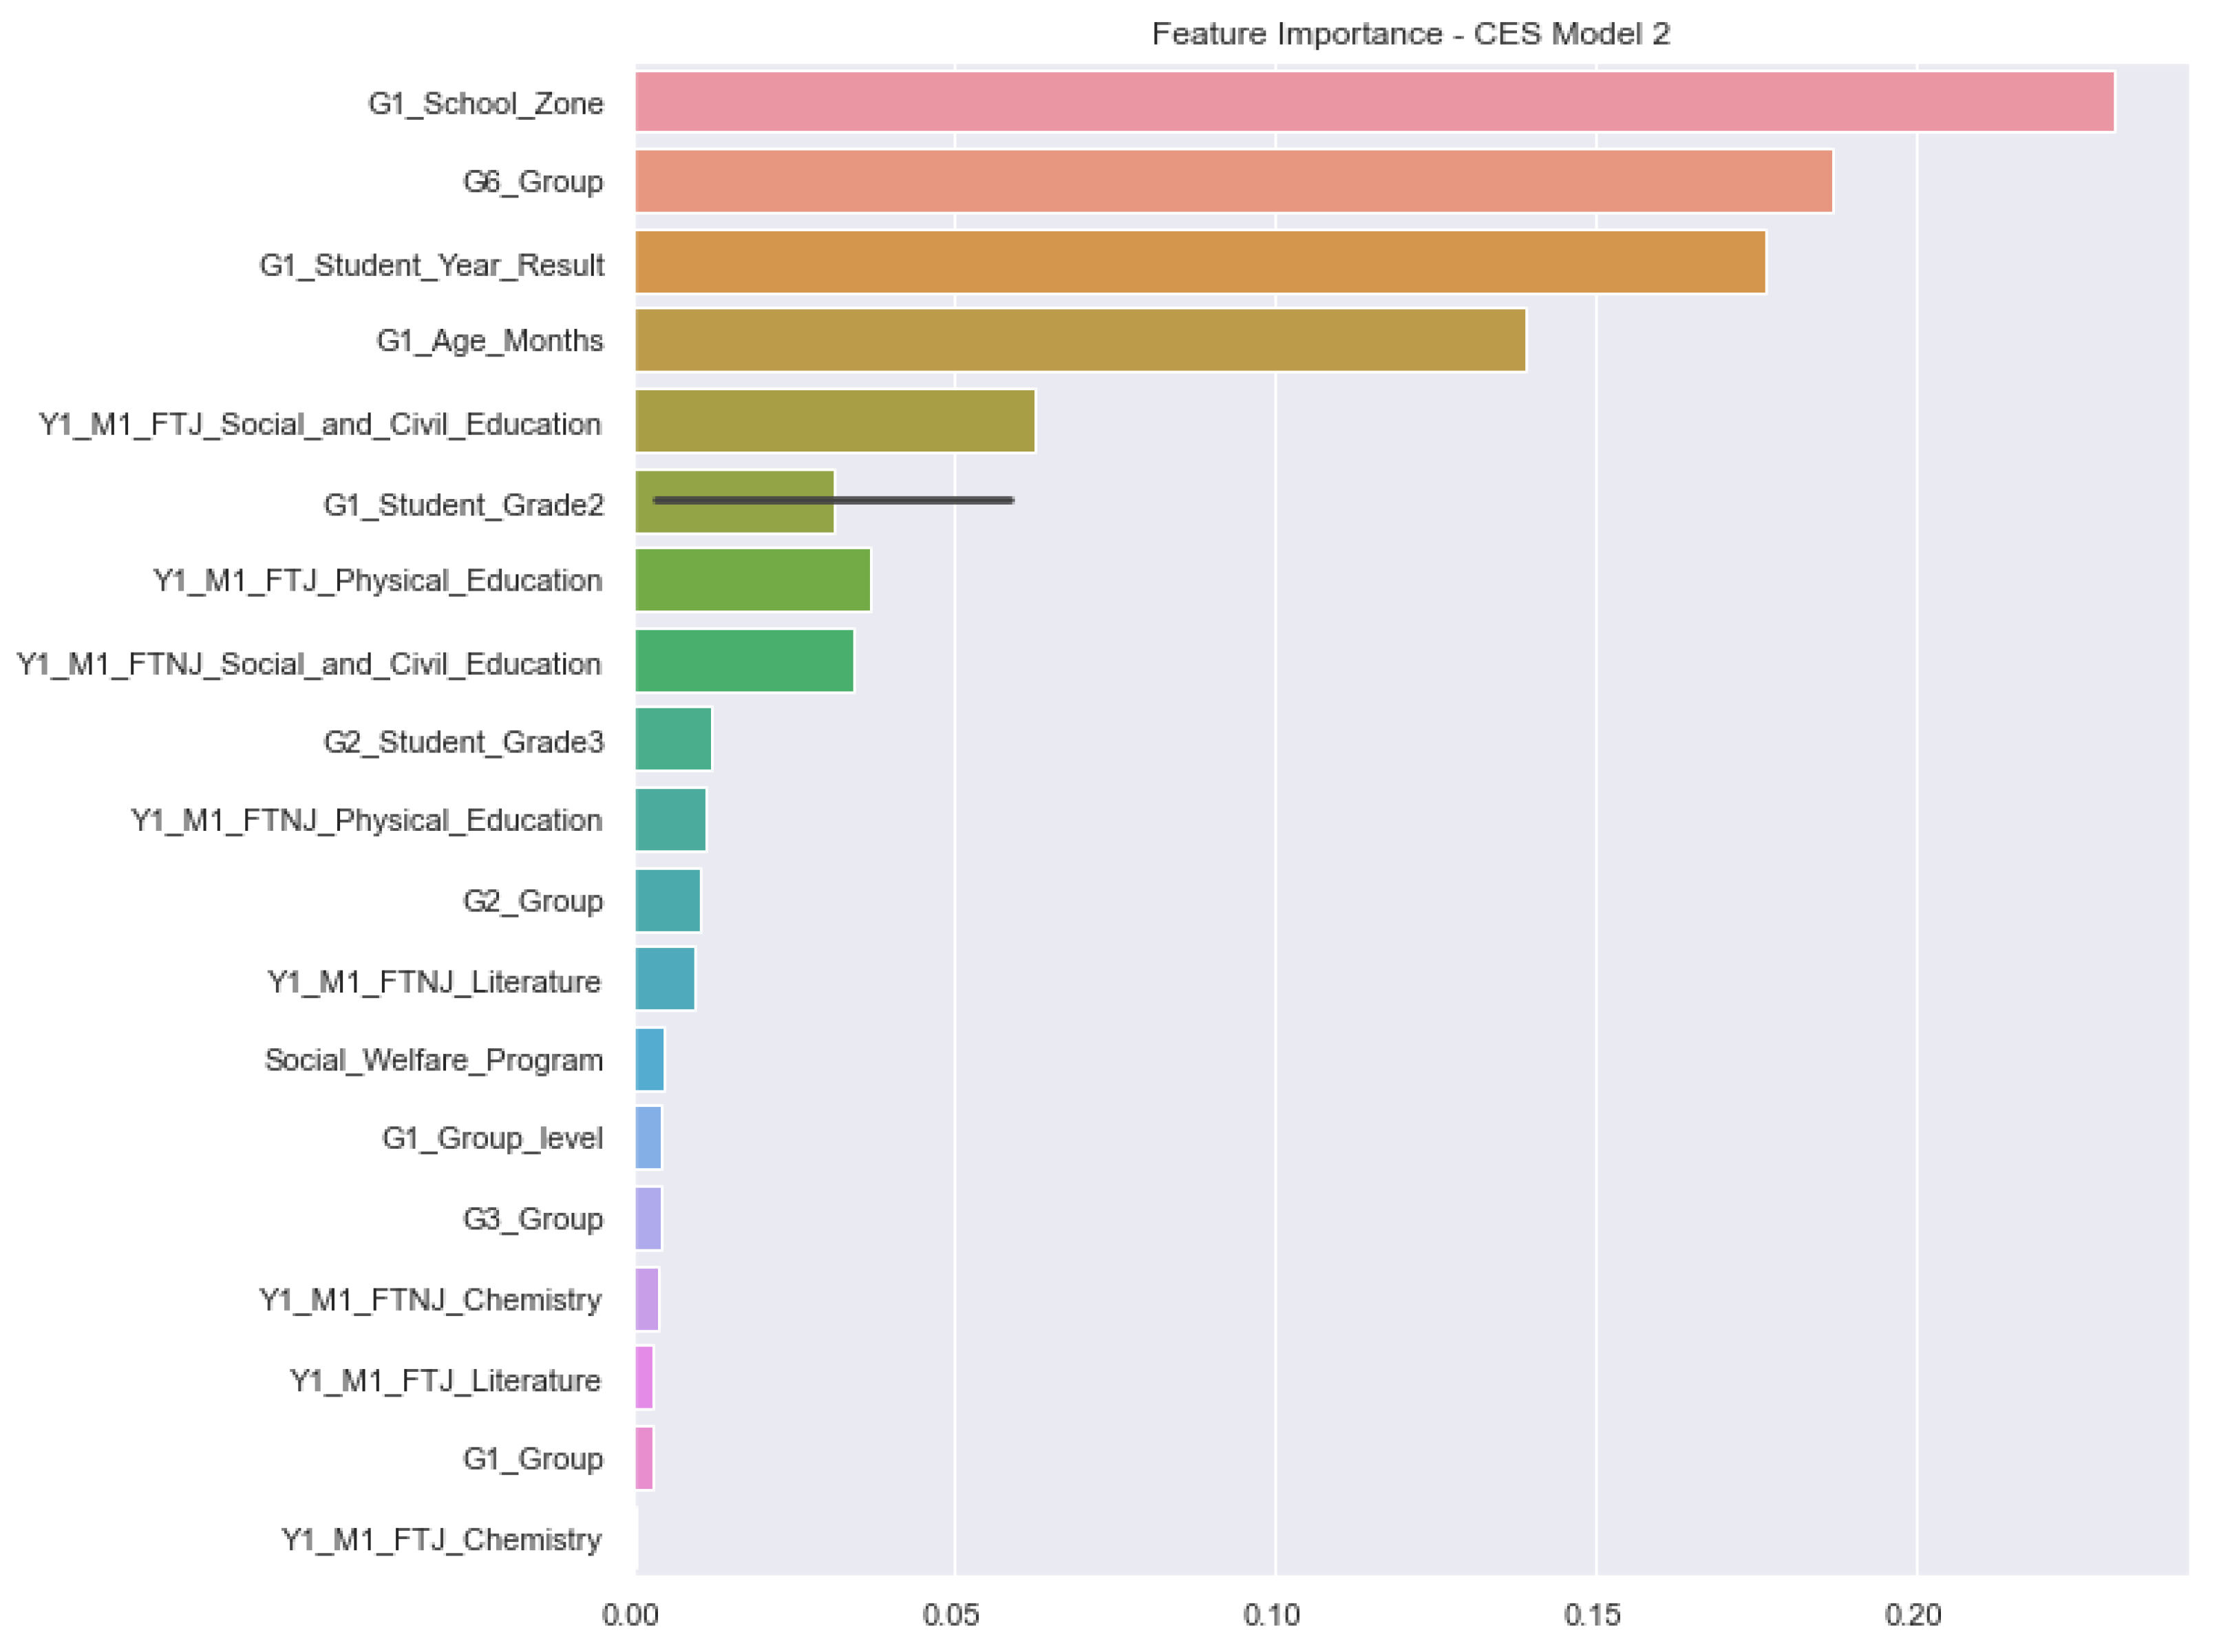
Figure 9 presents the list of the most important features for M2G1-CES as an example. As can be seen in the figure, the most important features for this model combine information related to primary education together with information about the first meeting of secondary education. The two most important attributes for this model are related to the school zone (rural or urban) in the first year in primary school and the student grouping based on their assessments in the sixth year of primary school.
From the analysis, it is also possible to see that from the 10 most important features (attributes), the first 5 of them and the tenth one are related to information from primary education. This demonstrates that educational problems in the studied context may have their origins in the first years of school. This finding corroborates previous findings in the literature [74,75,76]. Aside from that, this also confirms the findings of Nagy and Molontay [49] and Hernández-Leal et al. [51], who highlighted the importance of using information about the performance of the students in the early years of education in order to predict their performance in secondary education.
For instance, for this model, the attribute G1_School_Zone presented a PPS of 0.23, followed by the attribute G6_Group with a PPS of 0.19. Moreover, the findings for the M2G1-CES model were very similar to the ones for the M2G1-UTU model in terms of the most important features. For the second year (grade 2), the assessment of the students in some of the subjects (disciplines) was among the top 10 most important features to be used as input by the models (M1G2-CES, M2G2-CES, M1G2-UTU, and M2G2-UTU). This again confirmed the importance of using data from primary education to predict students at risk at the secondary level.

9. Conclusions

Learning analytics is a new research area that is gradually growing and consolidating itself. However, the main focus of the research in this field is still toward higher education, with less attention directed to the primary and secondary educational levels [13,44,45,77]. The present research specifically covers the adoption of LA in secondary education, and at the same time, it seeks to assist Uruguay in the formation of institutional and governmental policies by detecting at-risk students early.
The present work proposed a methodology to predict at-risk students in secondary education at a national level. Together with the proposal, it was also possible to present the performances of the models running with real data collected from students and covering their school cycles from the first year of primary education to the second year of secondary education. A total of eight models were generated and tested to avoid any bias, and seven of them were approved to be adopted. Moreover, an API was developed and described so that these models could be deployed to the authorities responsible for running them. As the learning analytics process is cyclical, several manuals, reports, and training videos were also generated to facilitate the annual retraining of the models by the stakeholders of ANEP.
The data understanding stage allowed the establishment of an initial set of main variables that could be used in the process of generating early prediction models for students at risk at the secondary level. Initial results suggest that the primary school data, together with the sociocultural student data, helped to partially improve the performance of the predictive models by approximately 4%. Moreover, exploratory data analysis revealed sensitive issues that were hidden in the data, such as that the population of students who participated in some kind of social welfare program during primary school had fewer problems during secondary school than the population that did not participate in social welfare programs. This situation was observed for both the CES and UTU databases and may indicate that current social policies are aimed in the right direction.
Throughout the process, several limitations were encountered for the advancement of the project. We can highlight some of them, such as the failure to obtain budget data, which could reveal new information about schools and the relationship between investment and results. Moreover, issues related to the crossing of data with the states and regions of the country and the gross domestic product (GDP) were not explored in this project and should be considered in future improvements.
Future works should also focus on adding new functionalities to the developed API. Possible improvements could be the development of graphical visualization of the results, the analysis and cross-referencing of the data, new statistical metrics to evaluate the results, and the automation of tasks related to preprocessing. Ideas for reports and dashboards for this context were already previously proposed by Macarini et al. [15].
Another possible future work is the evaluation of the features that are considered the most important for prediction. For this, the graphical visualization of those features, together with the application of clustering algorithms, may help with the identification of potential groups of at-risk students.
In this same direction, the use of alternative classification algorithms may result in better performance by the models. Algorithms such as the ones proposed by Saberi-Movahed et al. [78] use evolutionary programming in different moments of classification, and they demonstrated satisfactory improvements in the performances of the models. Finally, the use of different metrics for the evaluation of the models may allow a more in-depth overview of the results.
At the current stage of the project, it was possible to verify the efficiency of the predictive models in the task they were proposed to perform and, at the same time, guarantee their fairness and explainability. However, it is still necessary to assess how the adoption and interpretation of the predictive results will be effective in allowing governmental institutions to take actions to prevent dropouts and foster public policies. It is expected that the process of adoption of the LA solution will be arduous, as was already mentioned by previous works in the field [45,79]. It is important to highlight that the work developed here is the first initiative toward the adoption of a learning analytics solution in secondary education at the national level in Latin America [44].

Author Contributions

E.M.Q.: experimental data analysis, algorithm development, experiment conduction, result descriptions, and manuscript writing; M.F.B.M.: API development and manuscript writing; V.R.P.: manuscript writing, editing, review, educational policies proposals, and project coordination; C.C.: methodology definition, experiment set-up, manuscript writing, editing, review, and project coordination. T.T.P.: manuscript writing, editing, and review. All authors have read and agreed to the published version of the manuscript.

Funding

This work was supported by Udelar (University of the Republic) and the Inter-American Development Bank through contract number RG-T3450-P004 (2020) “Desarrollo de un modelo predictivo de riesgos de desvinculación educativa” and partially supported by Coordenação de Aperfeiçoamento de Pessoal de Nível Superior—Brasil (CAPES), Finance Code 001. Cristian Cechinel was partially supported by the Brazilian National Council for Scientific and Technological Development (CNPq) (DT-2 Productivity in Technological Development and Innovative Extension scholarship, proc.305731/2021-1).

Institutional Review Board Statement

Not applicable.

Informed Consent Statement

Not applicable.

Data Availability Statement

All data were presented in the main text.

Conflicts of Interest

The authors declare no conflict of interest.

References

  1. Santín, D.; Sicilia, G. Measuring the efficiency of public schools in Uruguay: Main drivers and policy implications. Lat. Am. Econ. Rev. 2015, 24, 1–28. [Google Scholar] [CrossRef]
  2. Filgueira, F.; Gutiérrez, M.; Papadópulos, J. A perfect storm? Welfare, care, gender and generations in Uruguay. Dev. Chang. 2011, 42, 1023–1048. [Google Scholar] [CrossRef] [PubMed]
  3. INEED. Informe Sobre El Estado de la Educación en Uruguay 2015–2016; INEED: Montevideo, Uruguay, 2017. [Google Scholar]
  4. Ravela, P. A formative approach to national assessments: The case of Uruguay. Prospects 2005, 35, 21–43. [Google Scholar] [CrossRef]
  5. Pereda, T.F.C. Explicar/Intervenir Sobre la Desafiliación Educativa en la Enseñanza Media. El Uruguay Desde la SociologÍa VIII, Montevideo, Uruguay, 2008; Volume 165. Available online: https://www.colibri.udelar.edu.uy/jspui/bitstream/20.500.12008/7598/1/El%20Uruguay%20desde%20la%20Sociologia%2008.pdf#page=165 (accessed on 31 May 2022).
  6. Siemens, G.; Long, P. Penetrating the fog: Analytics in learning and education. EDUCAUSE Rev. 2011, 46, 30. [Google Scholar]
  7. Hilliger, I.; Ortiz-Rojas, M.; Pesántez-Cabrera, P.; Scheihing, E.; Tsai, Y.S.; Muñoz-Merino, P.J.; Broos, T.; Whitelock-Wainwright, A.; Pérez-Sanagustín, M. Identifying needs for learning analytics adoption in Latin American universities: A mixed-methods approach. Internet High. Educ. 2020, 45, 100726. [Google Scholar] [CrossRef]
  8. Baker, R.S.; Inventado, P.S. Educational data mining and learning analytics. In Learning Analytics; Springer: Berlin/Heidelberg, Germany, 2014; pp. 61–75. [Google Scholar]
  9. Campbell, J.P.; DeBlois, P.B.; Oblinger, D.G. Academic analytics: A new tool for a new era. EDUCAUSE Rev. 2007, 42, 40. [Google Scholar]
  10. Márquez-Vera, C.; Cano, A.; Romero, C.; Ventura, S. Predicting student failure at school using genetic programming and different data mining approaches with high dimensional and imbalanced data. Appl. Intell. 2013, 38, 315–330. [Google Scholar] [CrossRef]
  11. Queiroga, E.M.; Enríquez, C.R.; Cechinel, C.; Casas, A.P.; Paragarino, V.R.; Bencke, L.R.; Ramos, V.F.C. Using Virtual Learning Environment Data for the Development of Institutional Educational Policies. Appl. Sci. 2021, 11, 6811. [Google Scholar] [CrossRef]
  12. Clow, D. The learning analytics cycle: Closing the loop effectively. In Proceedings of the 2nd International Conference on Learning Analytics And Knowledge, Vancouver British, CO, Canada, 29 April–2 May 2012; pp. 134–138. [Google Scholar]
  13. Kovanovic, V.; Mazziotti, C.; Lodge, J. Learning Analytics for Primary and Secondary Schools. J. Learn. Anal. 2021, 8, 1–5. [Google Scholar] [CrossRef]
  14. Macarini, L.A.; dos Santos, H.L.; Cechinel, C.; Ochoa, X.; Rodés, V.; Casas, A.P.; Lucas, P.P.; Maya, R.; Alonso, G.E.; Díaz, P. Towards the implementation of a countrywide K-12 learning analytics initiative in Uruguay. Interact. Learn. Environ. 2019, 28, 1–25. [Google Scholar] [CrossRef]
  15. Macarini, B.; Antonio, L.; Cechinel, C.; Batista Machado, M.F.; Faria Culmant Ramos, V.; Munoz, R. Predicting Students Success in Blended Learning—Evaluating Different Interactions Inside Learning Management Systems. Appl. Sci. 2019, 9, 5523. [Google Scholar] [CrossRef] [Green Version]
  16. Pombo, C.; Cabrol, M.; González Alarcón, N.; Roberto, S.Á. fAIr LAC: Responsible and Widespread Adoption of Artificial Intelligence in Latin America and the Caribbean. 2020. Available online: https://publications.iadb.org/publications/english/document/fAIr-LAC-Responsible-and-Widespread-Adoption-of-Artificial-Intelligence-in-Latin-America-and-the-Caribbean.pdf (accessed on 31 May 2022).
  17. Arias Ortiz, E.; Giambruno, C.; Muñoz Stuardo, G.; Pérez Alfaro, M. Camino Hacia la Inclusión Educativa: 4 Pasos Para la Construcción de Sistemas de Protección de Trayectorias: Paso 1: Exclusión Educativa en ALC:¿ Cómo los Sistemas de Protección de Trayectorias Pueden Ayudar? Coherent Digital, LLC: Alexandria, CO, USA, 2021. [Google Scholar] [CrossRef]
  18. Bogliaccini, J.A.; Rodríguez, F. Education system institutions and educational inequalities in Uruguay. In Cepal Review; United Nations: San Francisco, CA, USA, 2015. [Google Scholar]
  19. Bozkurt, A.; Jung, I.; Xiao, J.; Vladimirschi, V.; Schuwer, R.; Egorov, G.; Lambert, S.; Al-Freih, M.; Pete, J.; Olcott, D., Jr.; et al. A global outlook to the interruption of education due to COVID-19 pandemic: Navigating in a time of uncertainty and crisis. Asian J. Distance Educ. 2020, 15, 1–126. [Google Scholar]
  20. Silveira, I.F.; Casali, A.; Bezeira, A.V.M.; Sprock, A.S.; Collazos, C.A.; Cechinel, C.; Muñoz-Arteaga, J.; Maldonado-Mahauad, J.; Chacón-Rivas, M.; Motz, R.; et al. Iguales en las diferencias: Iniciativas de investigación transnacionales sobre Informática Educativa en Latinoamérica en el periodo 2010–2020. Rev. Bras. Inform. Educ. Ao 2021, 29, 1060–1090. [Google Scholar] [CrossRef]
  21. Bucheli, M.; Lustig, N.; Rossi, M.; Amábile, F. Social spending, taxes, and income redistribution in Uruguay. Public Financ. Rev. 2014, 42, 413–433. [Google Scholar] [CrossRef] [Green Version]
  22. Dirección General de Planeamiento. Estadísticas Básicas 2018 de la Universidad de la República; Technical Report; Universidad de la República: Montevideo, Uruguay, 2018. [Google Scholar]
  23. Rivoir, A.L. Innovación Para la Inclusión Digital. El Plan Ceibal en Uruguay; Fundación Ceibal: Montevideo, Uruguay, 2009. [Google Scholar]
  24. Rivera Vargas, P.; Cobo, C. Plan Ceibal en Uruguay: Una política pública que conecta inclusión e innovación. In Políticas Públicas para le Equidad Social. Santiago de Chile: Colección Políticas Públicas; Fundación Ceibal: Montevideo, Uruguay, 2018. [Google Scholar]
  25. Ferguson, R. Learning analytics: Drivers, developments and challenges. Int. J. Technol. Enhanc. Learn. 2012, 4, 304–317. [Google Scholar] [CrossRef]
  26. 1st International Conference on Learning Analytics and Knowledge 2011. 2011. Available online: https://dl.acm.org/doi/proceedings/10.1145/2090116 (accessed on 18 August 2022).
  27. Siemens, G. Learning analytics: The emergence of a discipline. Am. Behav. Sci. 2013, 57, 1380–1400. [Google Scholar] [CrossRef] [Green Version]
  28. Chatti, M.A.; Dyckhoff, A.L.; Schroeder, U.; Thüs, H. A reference model for learning analytics. Int. J. Technol. Enhanc. Learn. 2013, 4, 318–331. [Google Scholar] [CrossRef]
  29. Siemens, G.; Baker, R.S.d. Learning analytics and educational data mining: Towards communication and collaboration. In Proceedings of the 2nd International Conference on Learning Analytics And Knowledge, Vancouver British, CO, Canada, 29 April–2 May 2012; pp. 252–254. [Google Scholar]
  30. Phauk, S.; Okazaki, T. Integration of Educational Data Mining Models to a Web-Based Support System for Predicting High School Student Performance. Int. J. Comput. Inf. Eng. 2021, 15, 131–144. [Google Scholar]
  31. Cortez, P.; Silva, A.M.G. Using Data Mining to Predict Secondary School Student Performance; EUROSIS-ETI: Oostende, Belgium, 2008. [Google Scholar]
  32. Detoni, D.; Cechinel, C.; Matsumura Araújo, R. Modelagem e Predição de Reprovação de Acadêmicos de Cursos de Educação a Distância a partir da Contagem de Interações. Rev. Bras. Inform. Educ. Ao 2015, 23, 1. [Google Scholar]
  33. Márquez-Vera, C.; Cano, A.; Romero, C.; Noaman, A.Y.M.; Mousa Fardoun, H.; Ventura, S. Early dropout prediction using data mining: A case study with high school students. Expert Syst. 2016, 33, 107–124. [Google Scholar] [CrossRef]
  34. Queiroga, E.M.; Lopes, J.L.; Kappel, K.; Aguiar, M.; Araújo, R.M.; Munoz, R.; Villarroel, R.; Cechinel, C. A learning analytics approach to identify students at risk of dropout: A case study with a technical distance education course. Appl. Sci. 2020, 10, 3998. [Google Scholar] [CrossRef]
  35. Zohair, L.M.A. Prediction of Student’s performance by modelling small dataset size. Int. J. Educ. Technol. High. Educ. 2019, 16, 27. [Google Scholar] [CrossRef]
  36. Aldowah, H.; Al-Samarraie, H.; Fauzy, W.M. Educational data mining and learning analytics for 21st century higher education: A review and synthesis. Telemat. Inform. 2019, 37, 13–49. [Google Scholar] [CrossRef]
  37. Saqr, M.; López-Pernas, S. The Dire Cost of Early Disengagement: A Four-Year Learning Analytics Study over a Full Program. In Proceedings of the European Conference on Technology Enhanced Learning, Bolzano, Italy, 20–24 September 2021; pp. 122–136. [Google Scholar]
  38. Queiroga, E.; Cechinel, C.; Araújo, R.; da Costa Bretanha, G. Generating models to predict at-risk students in technical e-learning courses. In Proceedings of the 2016 XI Latin American Conference on Learning Objects and Technology (LACLO), San Carlos, Costa Rica, 3–7 October 2016; pp. 1–8. [Google Scholar]
  39. Fernandes, E.; Holanda, M.; Victorino, M.; Borges, V.; Carvalho, R.; Van Erven, G. Educational data mining: Predictive analysis of academic performance of public school students in the capital of Brazil. J. Bus. Res. 2019, 94, 335–343. [Google Scholar] [CrossRef]
  40. Lykourentzou, I.; Giannoukos, I.; Nikolopoulos, V.; Mpardis, G.; Loumos, V. Dropout prediction in e-learning courses through the combination of machine learning techniques. Comput. Educ. 2009, 53, 950–965. [Google Scholar] [CrossRef]
  41. Daud, A.; Aljohani, N.R.; Abbasi, R.A.; Lytras, M.D.; Abbas, F.; Alowibdi, J.S. Predicting student performance using advanced learning analytics. In Proceedings of the 26th International Conference on World Wide Web Companion, Perth, Australia, 3–7 April 2017; pp. 415–421. [Google Scholar]
  42. Di Mitri, D.; Scheffel, M.; Drachsler, H.; Börner, D.; Ternier, S.; Specht, M. Learning pulse: A machine learning approach for predicting performance in self-regulated learning using multimodal data. In Proceedings of the Seventh International Learning Analytics & Knowledge Conference, Vancouver British, CO, Canada, 13–17 March 2017; pp. 188–197. [Google Scholar]
  43. Camacho, V.L.; de la Guía, E.; Olivares, T.; Flores, M.J.; Orozco-Barbosa, L. Data Capture and Multimodal Learning Analytics Focused on Engagement with a New Wearable IoT Approach. IEEE Trans. Learn. Technol. 2020, 13, 704–717. [Google Scholar] [CrossRef]
  44. Cechinel, C.; Ochoa, X.; Lemos dos Santos, H.; Carvalho Nunes, J.B.; Rodés, V.; Marques Queiroga, E. Mapping learning analytics initiatives in latin america. Br. J. Educ. Technol. 2020, 51, 892–914. [Google Scholar] [CrossRef]
  45. Bruno, E.; Alexandre, B.; Ferreira Mello, R.; Falcão, T.P.; Vesin, B.; Gašević, D. Applications of learning analytics in high schools: A Systematic Literature review. Front. Artif. Intell. 2021, 4, 737891. [Google Scholar]
  46. Michalski, R.S.; Carbonell, J.G.; Mitchell, T.M. Machine Learning: An Artificial Intelligence Approach; Springer Science & Business Media: Berlin/Heidelberg, Germany, 2013. [Google Scholar]
  47. Sclater, N.; Peasgood, A.; Mullan, J. Learning analytics in higher education. Lond. Jisc. Accessed Febr. 2016, 8, 176. [Google Scholar]
  48. Frostad, P.; Pijl, S.J.; Mjaavatn, P.E. Losing all interest in school: Social participation as a predictor of the intention to leave upper secondary school early. Scand. J. Educ. Res. 2015, 59, 110–122. [Google Scholar] [CrossRef]
  49. Nagy, M.; Molontay, R. Predicting dropout in higher education based on secondary school performance. In Proceedings of the 2018 IEEE 22nd International Conference on Intelligent Engineering Systems (INES), Las Palmas de Gran Canaria, Spain, 21–23 June 2018; pp. 389–394. [Google Scholar]
  50. Lehrl, S.; Ebert, S.; Blaurock, S.; Rossbach, H.G.; Weinert, S. Long-term and domain-specific relations between the early years home learning environment and students’ academic outcomes in secondary school. Sch. Eff. Sch. Improv. 2020, 31, 102–124. [Google Scholar] [CrossRef]
  51. Hernández-Leal, E.; Duque-Méndez, N.D.; Cechinel, C. Unveiling educational patterns at a regional level in Colombia: Data from elementary and public high school institutions. Heliyon 2021, 7, e08017. [Google Scholar] [CrossRef] [PubMed]
  52. Gardner, J.; Brooks, C.; Baker, R. Evaluating the fairness of predictive student models through slicing analysis. In Proceedings of the 9th International Conference on Learning Analytics & Knowledge, Tempe, AZ, USA, 4–8 March 2019; pp. 225–234. [Google Scholar]
  53. Sun, T.; Gaut, A.; Tang, S.; Huang, Y.; ElSherief, M.; Zhao, J.; Mirza, D.; Belding, E.; Chang, K.W.; Wang, W.Y. Mitigating gender bias in natural language processing: Literature review. arXiv 2019, arXiv:1906.08976. [Google Scholar]
  54. Cao, Y.T.; Daumé, H., III. Toward Gender-Inclusive Coreference Resolution: An Analysis of Gender and Bias Throughout the Machine Learning Lifecycle. Comput. Linguist. 2021, 47, 615–661. [Google Scholar] [CrossRef]
  55. Leavy, S. Gender bias in artificial intelligence: The need for diversity and gender theory in machine learning. In Proceedings of the 1st International Workshop on Gender Equality In Software Engineering, Gothenburg, Sweden, 28 May 2018; pp. 14–16. [Google Scholar]
  56. Wei, W.W. Time series analysis. In The Oxford Handbook of Quantitative Methods in Psychology: Statistical Analysis; Oxford University Press: England and Cary, NC, USA, 2006; Volume 2. [Google Scholar]
  57. Diggle, P.; Al-Wasel, I. Time Series: A Biostatistical Introduction; Oxford University Press: England and Cary, NC, USA, 1990. [Google Scholar]
  58. Pires de Lima, R.; Marfurt, K. Convolutional neural network for remote-sensing scene classification: Transfer learning analysis. Remote Sens. 2019, 12, 86. [Google Scholar] [CrossRef] [Green Version]
  59. Friedman, J.H. Greedy function approximation: A gradient boosting machine. Ann. Stat. 2001, 29, 1189–1232. [Google Scholar] [CrossRef]
  60. Chen, T.; Guestrin, C. Xgboost: A scalable tree boosting system. In Proceedings of the 22nd ACM Sigkdd International Conference on Knowledge Discovery and Data Mining, San Francisco, CA, USA, 13–17 August 2016; pp. 785–794. [Google Scholar]
  61. Bergstra, J.S.; Bardenet, R.; Bengio, Y.; Kégl, B. Algorithms for hyper-parameter optimization. In Proceedings of the Advances in Neural Information Processing Systems, Granada, Spain, 12–15 December 2011; pp. 2546–2554. [Google Scholar]
  62. Olson, R.S.; Urbanowicz, R.J.; Andrews, P.C.; Lavender, N.A.; Kidd, L.C.; Moore, J.H. Automating Biomedical Data Science Through Tree-Based Pipeline Optimization. In Proceedings of the Applications of Evolutionary Computation: 19th European Conference, EvoApplications 2016, Porto, Portugal, 30 March–1 April 2016; Springer International Publishing: Berlin/Heidelberg, Germany, 2016; pp. 123–137. [Google Scholar] [CrossRef] [Green Version]
  63. Lemaître, G.; Nogueira, F.; Aridas, C.K. Imbalanced-learn: A Python Toolbox to Tackle the Curse of Imbalanced Datasets in Machine Learning. J. Mach. Learn. Res. 2017, 18, 1–5. [Google Scholar]
  64. González, F.; Ortiz, T.; Ávalos, R.S. IA Responsable: Manual Técnico: Ciclo de Vida de la Inteligencia Artificial; Inter-American Development Bank: Washington, DC, USA, 2020. [Google Scholar] [CrossRef]
  65. Romero, C.; Ventura, S.; Pechenizkiy, M.; Baker, R.S. Handbook of Educational Data Mining; CRC Press: Boca Raton, FL, USA, 2010. [Google Scholar]
  66. Gasevic, D.; Tsai, Y.; Dawson, S.; Pardo, A. How do we start? An approach to learning analytics adoption in higher education. Int. J. Inf. Learn. Technol. 2019, 36, 342–353. [Google Scholar] [CrossRef] [Green Version]
  67. Romero, C.; Ventura, S. Educational data mining and learning analytics: An updated survey. Wiley Interdiscip. Rev. Data Min. Knowl. Discov. 2020, 10, e1355. [Google Scholar] [CrossRef]
  68. Mehrabi, N.; Morstatter, F.; Saxena, N.; Lerman, K.; Galstyan, A. A survey on bias and fairness in machine learning. ACM Comput. Surv. (CSUR) 2021, 54, 1–35. [Google Scholar] [CrossRef]
  69. Gašević, D.; Dawson, S.; Rogers, T.; Gasevic, D. Learning analytics should not promote one size fits all: The effects of instructional conditions in predicting academic success. Internet High. Educ. 2016, 28, 68–84. [Google Scholar] [CrossRef] [Green Version]
  70. Herodotou, C.; Rienties, B.; Verdin, B.; Boroowa, A. Predictive learning analytics ‘at scale’: Towards guidelines to successful implementation in Higher Education based on the case of the Open University UK. J. Learn. Anal. 2019, in press.
  71. Athey, S.; Tibshirani, J.; Wager, S. Generalized random forests. Ann. Stat. 2019, 47, 1148–1178. [Google Scholar] [CrossRef] [Green Version]
  72. Mai-Nguyen, A.V.; Tran, V.L.; Dao, M.S.; Zettsu, K. Leverage the Predictive Power Score of Lifelog Data’s Attributes to Predict the Expected Athlete Performance. In Proceedings of the CLEF (Working Notes), Thessaloniki, Greece, 25 September 2020. [Google Scholar]
  73. Oksanen, T.; Tiainen, M.; Skrifvars, M.B.; Varpula, T.; Kuitunen, A.; Castrén, M.; Pettilä, V. Predictive power of serum NSE and OHCA score regarding 6-month neurologic outcome after out-of-hospital ventricular fibrillation and therapeutic hypothermia. Resuscitation 2009, 80, 165–170. [Google Scholar] [CrossRef]
  74. Zeichner, K. Rethinking the connections between campus courses and field experiences in college-and university-based teacher education. J. Teach. Educ. 2010, 61, 89–99. [Google Scholar] [CrossRef] [Green Version]
  75. Fall, A.M.; Roberts, G. High school dropouts: Interactions between social context, self-perceptions, school engagement, and student dropout. J. Adolesc. 2012, 35, 787–798. [Google Scholar] [CrossRef] [Green Version]
  76. Hosokawa, R.; Katsura, T. Effect of socioeconomic status on behavioral problems from preschool to early elementary school–A Japanese longitudinal study. PLoS ONE 2018, 13, e0197961. [Google Scholar] [CrossRef] [Green Version]
  77. Queiroga, E.; Cechinel, C.; Aguiar, M. Uma abordagem para predição de estudantes em risco utilizando algoritmos genéticos e mineração de dados: Um estudo de caso com dados de um curso técnico a distância. In Proceedings of the Anais dos Workshops do Congresso Brasileiro de Informática na Educação, Brasilia, Brazil, 11–14 November 2019; Volume 8, p. 119. [Google Scholar]
  78. Saberi-Movahed, F.; Najafzadeh, M.; Mehrpooya, A. Receiving more accurate predictions for longitudinal dispersion coefficients in water pipelines: Training group method of data handling using extreme learning machine conceptions. Water Resour. Manag. 2020, 34, 529–561. [Google Scholar] [CrossRef]
  79. Brown, M. Seeing students at scale: How faculty in large lecture courses act upon learning analytics dashboard data. Teach. High. Educ. 2020, 25, 384–400. [Google Scholar] [CrossRef]
Figure 1. Modelo CRISP-DM.
Information 13 00401 g001
Figure 2. Correlation between students’ genders and final statuses for the CES database.
Information 13 00401 g002
Figure 3. Database structure.
Information 13 00401 g003
Figure 4. Temporal approach for the models and retraining periods.
Information 13 00401 g004
Figure 5. Performance of the models along the grades for the CES database.
Information 13 00401 g005
Figure 6. Performance of the models through the grades for the UTU database.
Information 13 00401 g006
Figure 7. Bias analysis for the social welfare program attribute in the M1G1-UTU model.
Information 13 00401 g007
Figure 8. API operation.
Information 13 00401 g008
Figure 9. Feature importance for M2G1-CES. FTJ stands for justified absences, and FTNJ stands for non-justified absences. For instance, Y1_M1_FTNJ_Literature means the number of unjustified absences in Literature until Meeting 1 during Year 1 (grade 1). Group stands for the classification of the student performance according to the quartile of the performances of all students at that grade.
Information 13 00401 g009
Table 1. Number and percentage of students per database and final situations according to gender.
GenderUTUCESTotal
TotalApr.Prob.TotalApr.Prob.Total
Freq.%Freq.%Freq.%Freq.%Freq.%Freq.%Freq.%
Female11.2539.787.67768.2335,7431.77111.9752.4269.8262.3542.15437.65123.2250.94
Male17.0260.2210.44961.3665.8038.64101.6447.5860.2659.2941.37840.71118.6749.06
Table 2. Number of students on social welfare programs per database.
Social Welfare Program in Primary EducationUTUCESTotal
Freq.%Freq.%Freq.%
Yes19.85870.2187.86641.13107.72444.53
No8.42229.79125.75458.87134.17655.47
Table 3. Percentages of students with benefits in primary school considering gender and problematic situations.
GenderResult Grade 1Social Welfare Program in PrimaryStudents
Amount%
FApprovedNo14,9078.24
Yes37,06820.50
Possible ProblemNo35,23719.50
Yes69173.83
MApprovedNo13,0917.24
Yes32,18717.80
Possible ProblemNo32,90018.20
Yes84784.69
Table 4. Number of students in urban and rural areas for CES and UTU databases.
DatabaseGradeUrban ZoneRural ZoneMissing DataTotal
Aprov.FailureTotalAprov.FailureTotalAprov.FailureTotal
CES189,75846,876136,6343752170354558416061447143,536
286,68310,85497,5373720320404068768755102,332
UTU116,04615,37231,41819361242317814420534934,945
29102694416,04612157211936667814418,126
Table 5. Best results for CES predictive models.
ModelBest PreprocessingF1-MacroAUCROC
M1G1-CESI10.910.91
M2G1-CESI10.910.91
M1G2-CESI80.880.95
M2G2-CESI10.920.93
Table 6. Best results for UTU predictive models.
ModelBest PreprocessingF1-MacroAUCROC
M1G1-UTUI70.680.68
M2G1-UTUI60.950.95
M1G2-UTUI80.930.95
M2G2-UTUI80.930.96
Table 7. Protected group attributes and the existence of bias.
Data BaseModelUsed Protected Group Attributes (Marked with X)Bias
GenderSchool ZoneSocial Welfare Program
CESM1G1-CES----
M2G1-CES----
M1G2-CESXXXNo
M2G2-CESXXXNo
UTUM1G1X-XYes
M2G1XXXNo
M1G2----
M2G2XXXNo
Table 8. Confusion matrix of model not using gender and social welfare program attributes.
Prediction
0 (Possible Problem)1 (Approved)
Real Status0 (Possible Problem)1796534
1 (Approved)9267
Publisher’s Note: MDPI stays neutral with regard to jurisdictional claims in published maps and institutional affiliations.

