
Exploring Life in Concentration Camps through a Visual Analysis of Prisoners’ Diaries


Abstract
:1. Introduction
2. Related Work
2.1. Timeline Visualizations
2.2. Calendar Visualizations
2.3. Visualization of World War II Victims
2.4. Visualization of Diaries
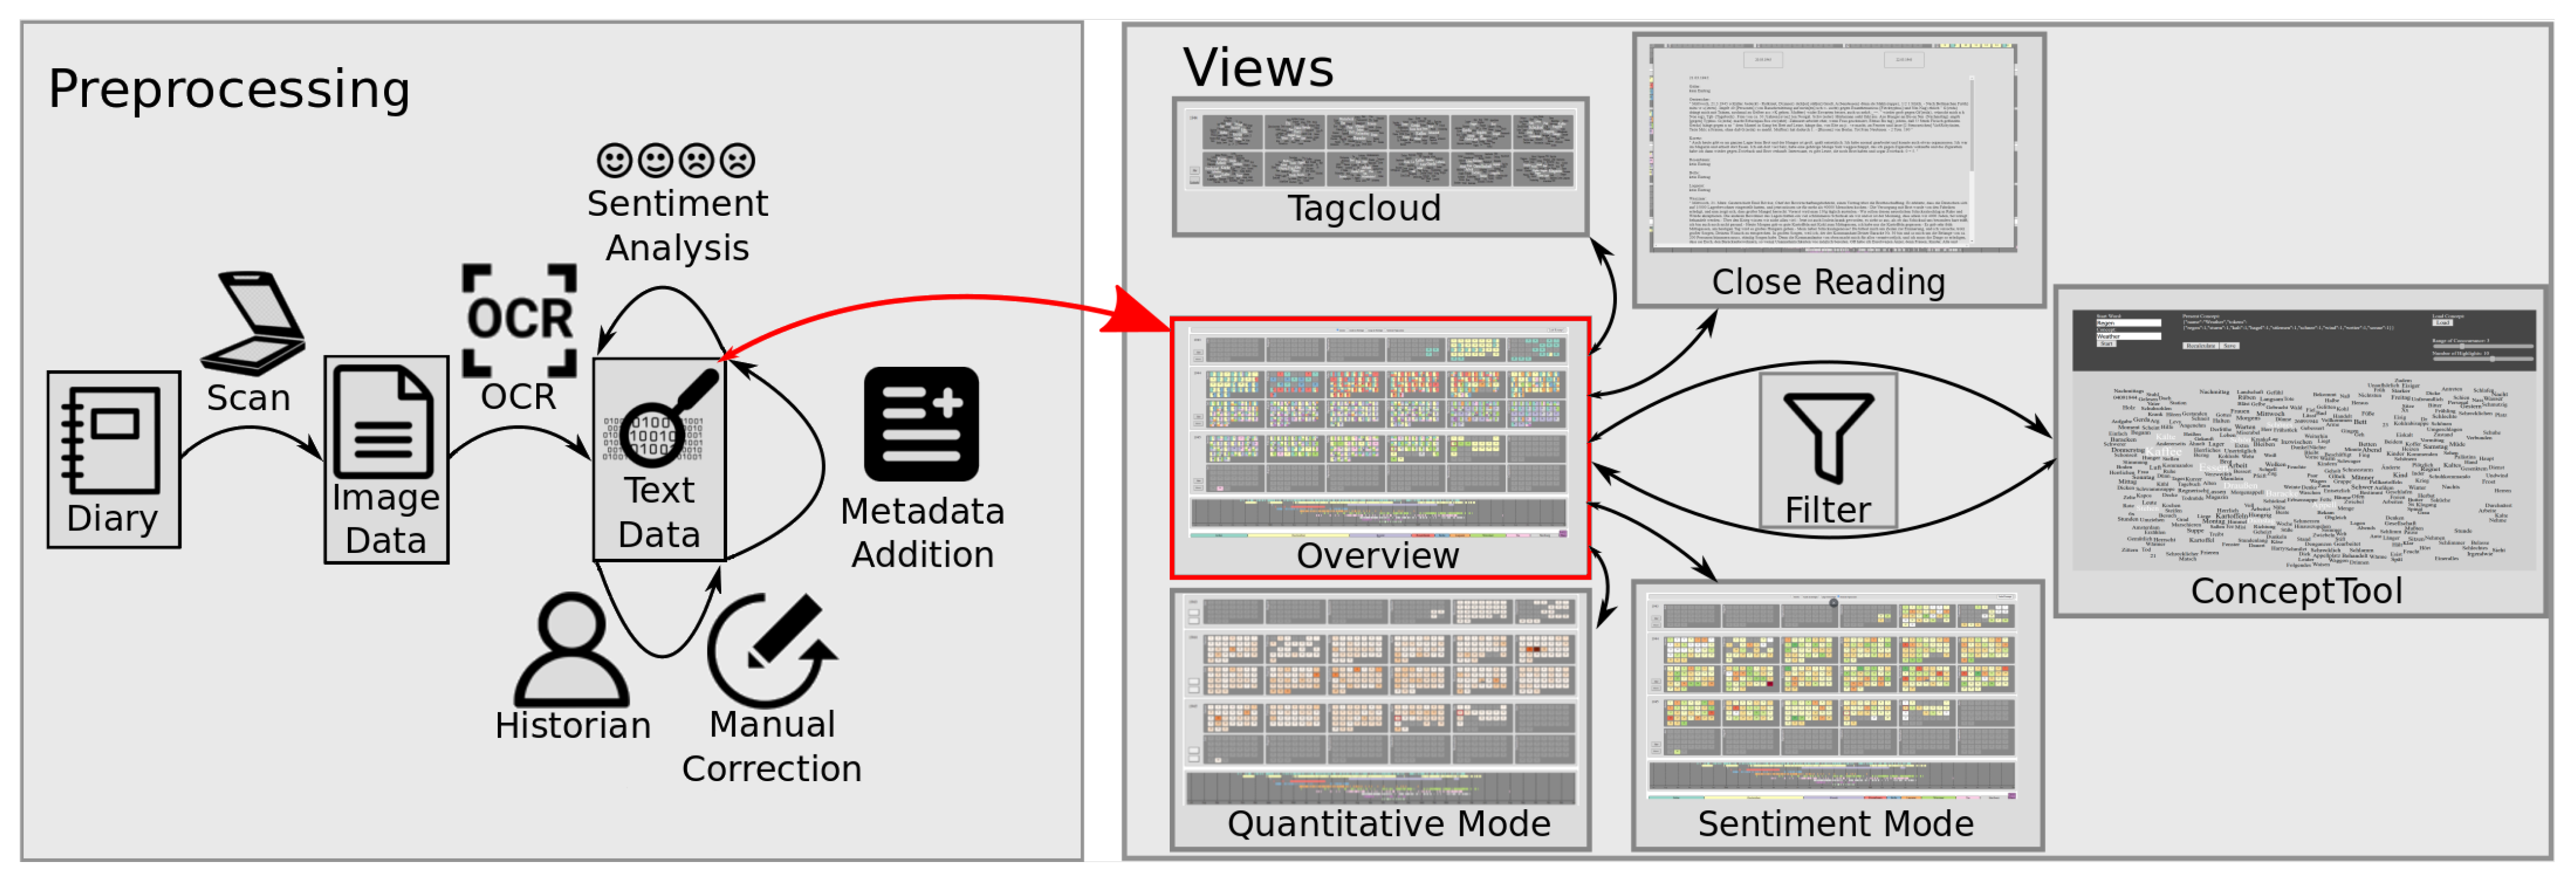
3. Dataset and Preprocessing
Preprocessing
4. Visual Analysis of Diaries from Concentration Camps
4.1. Visualizations
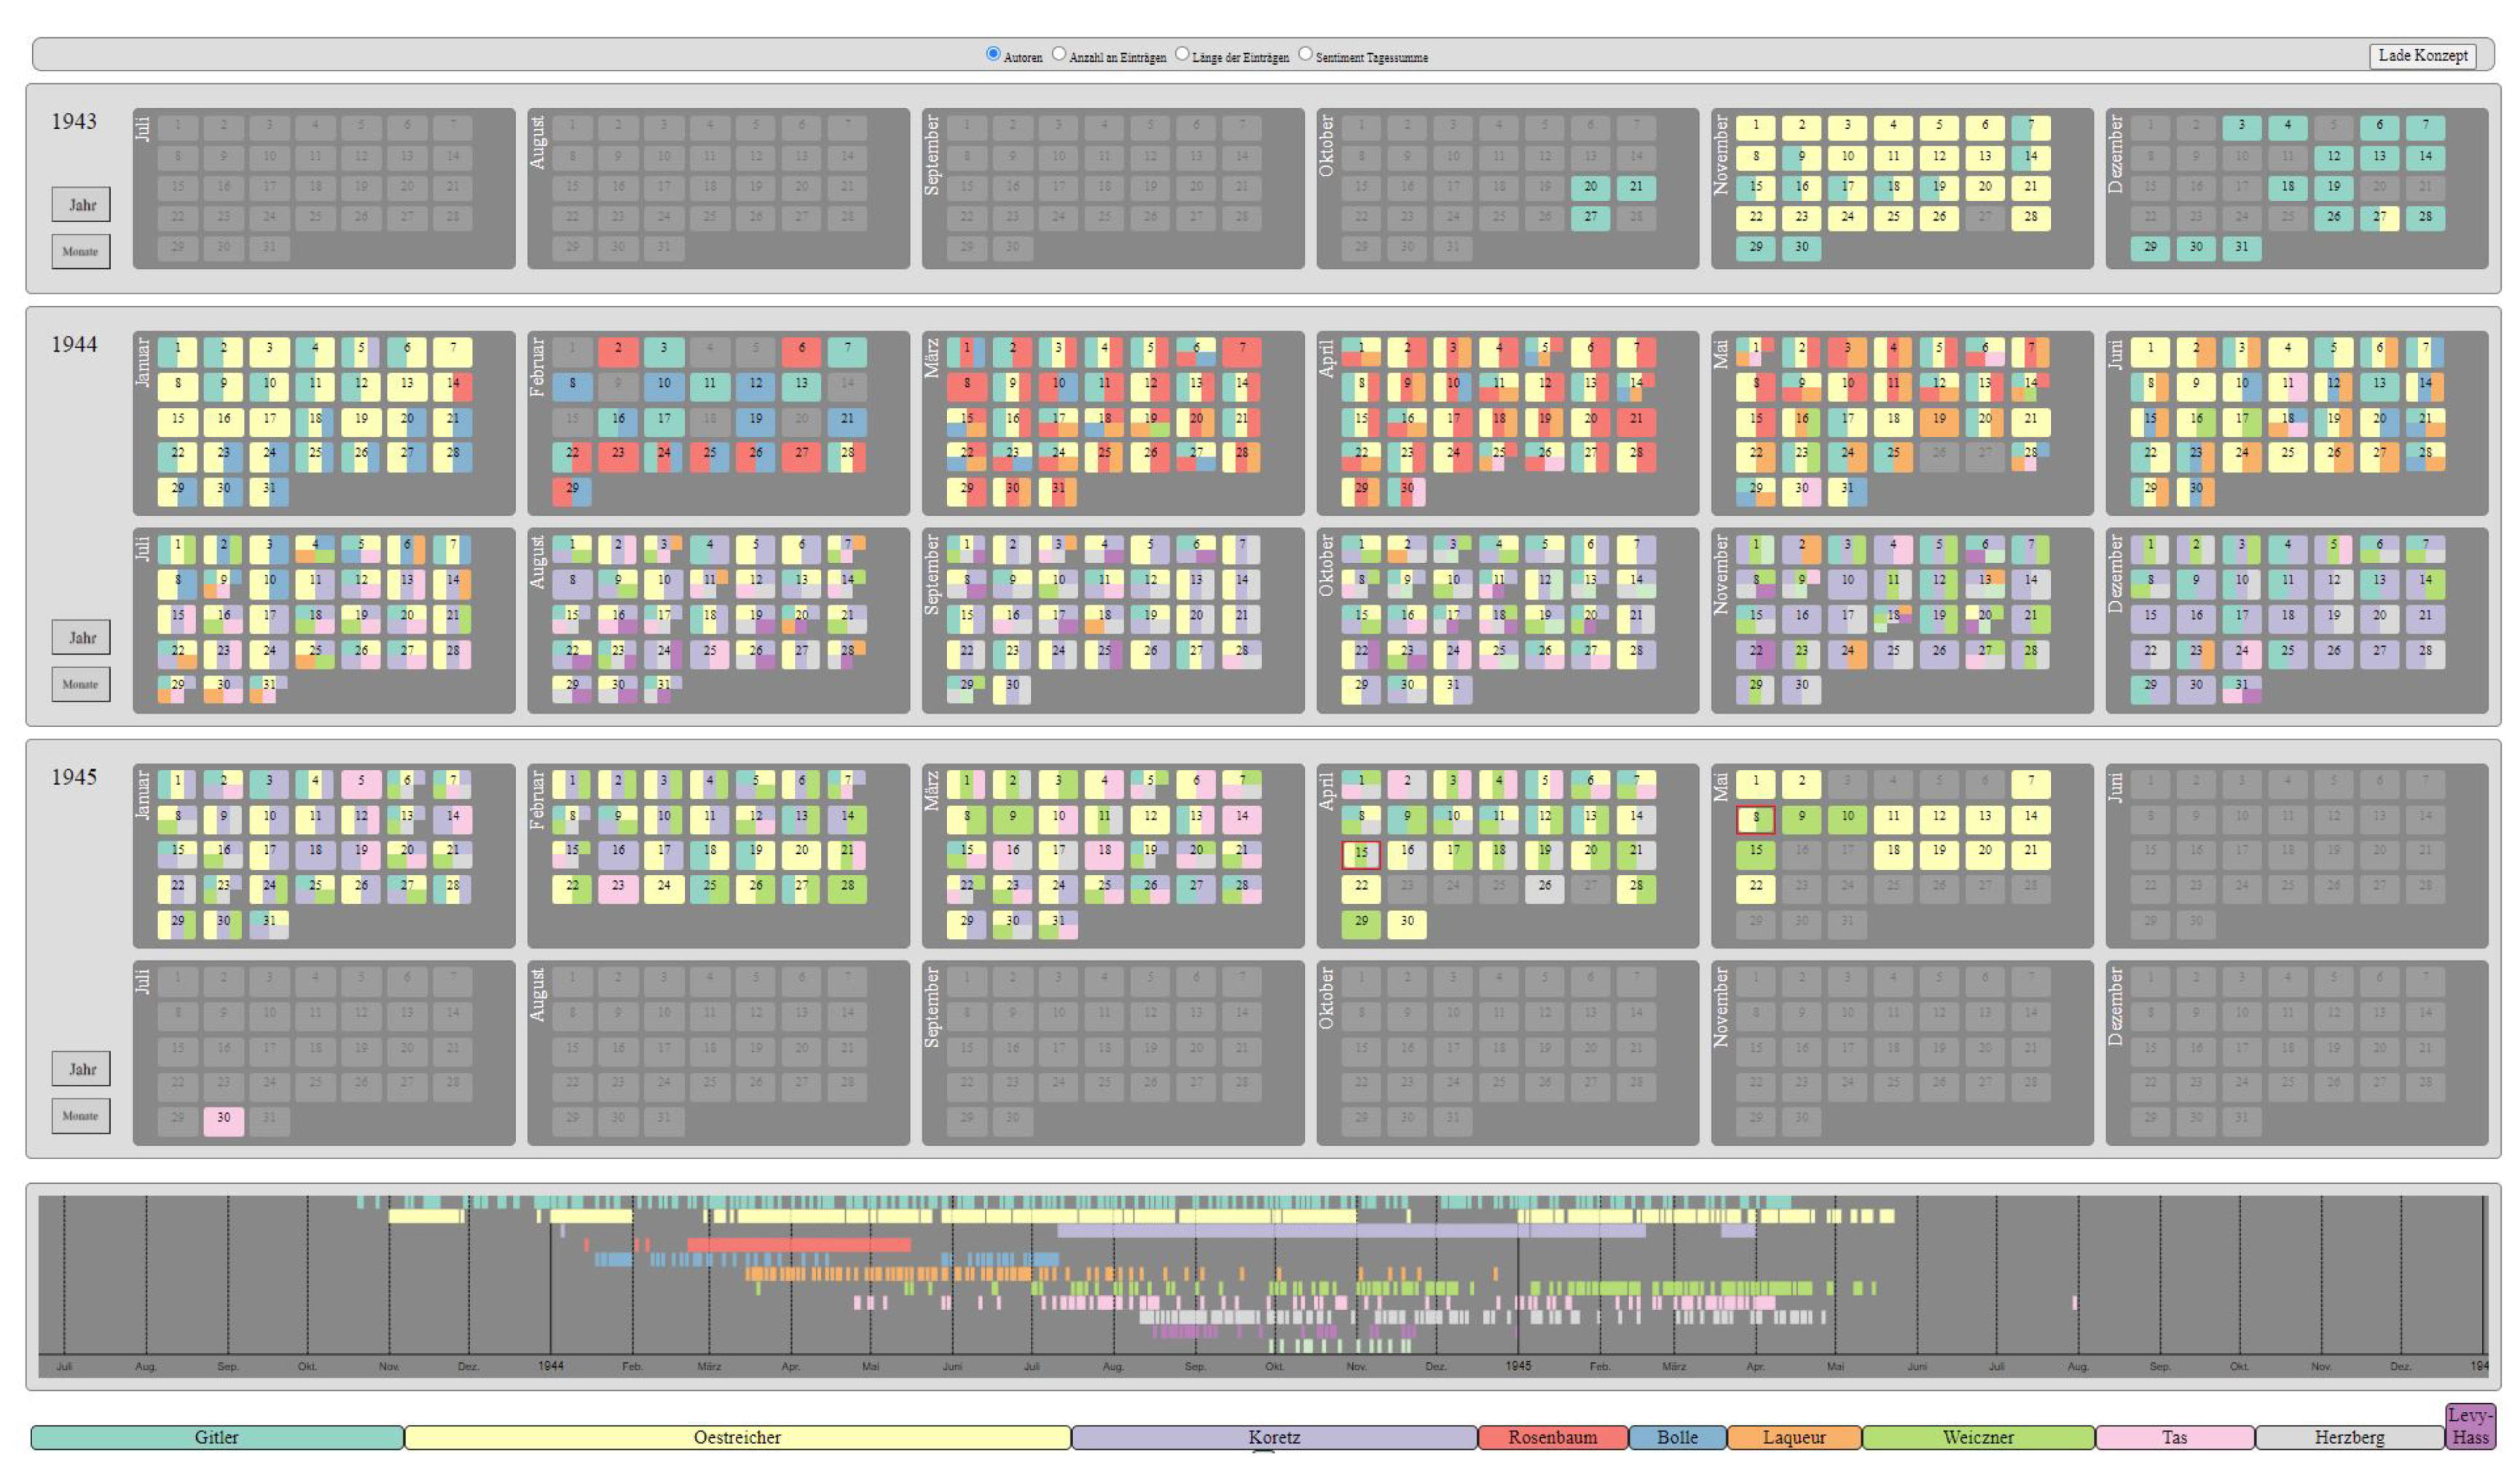
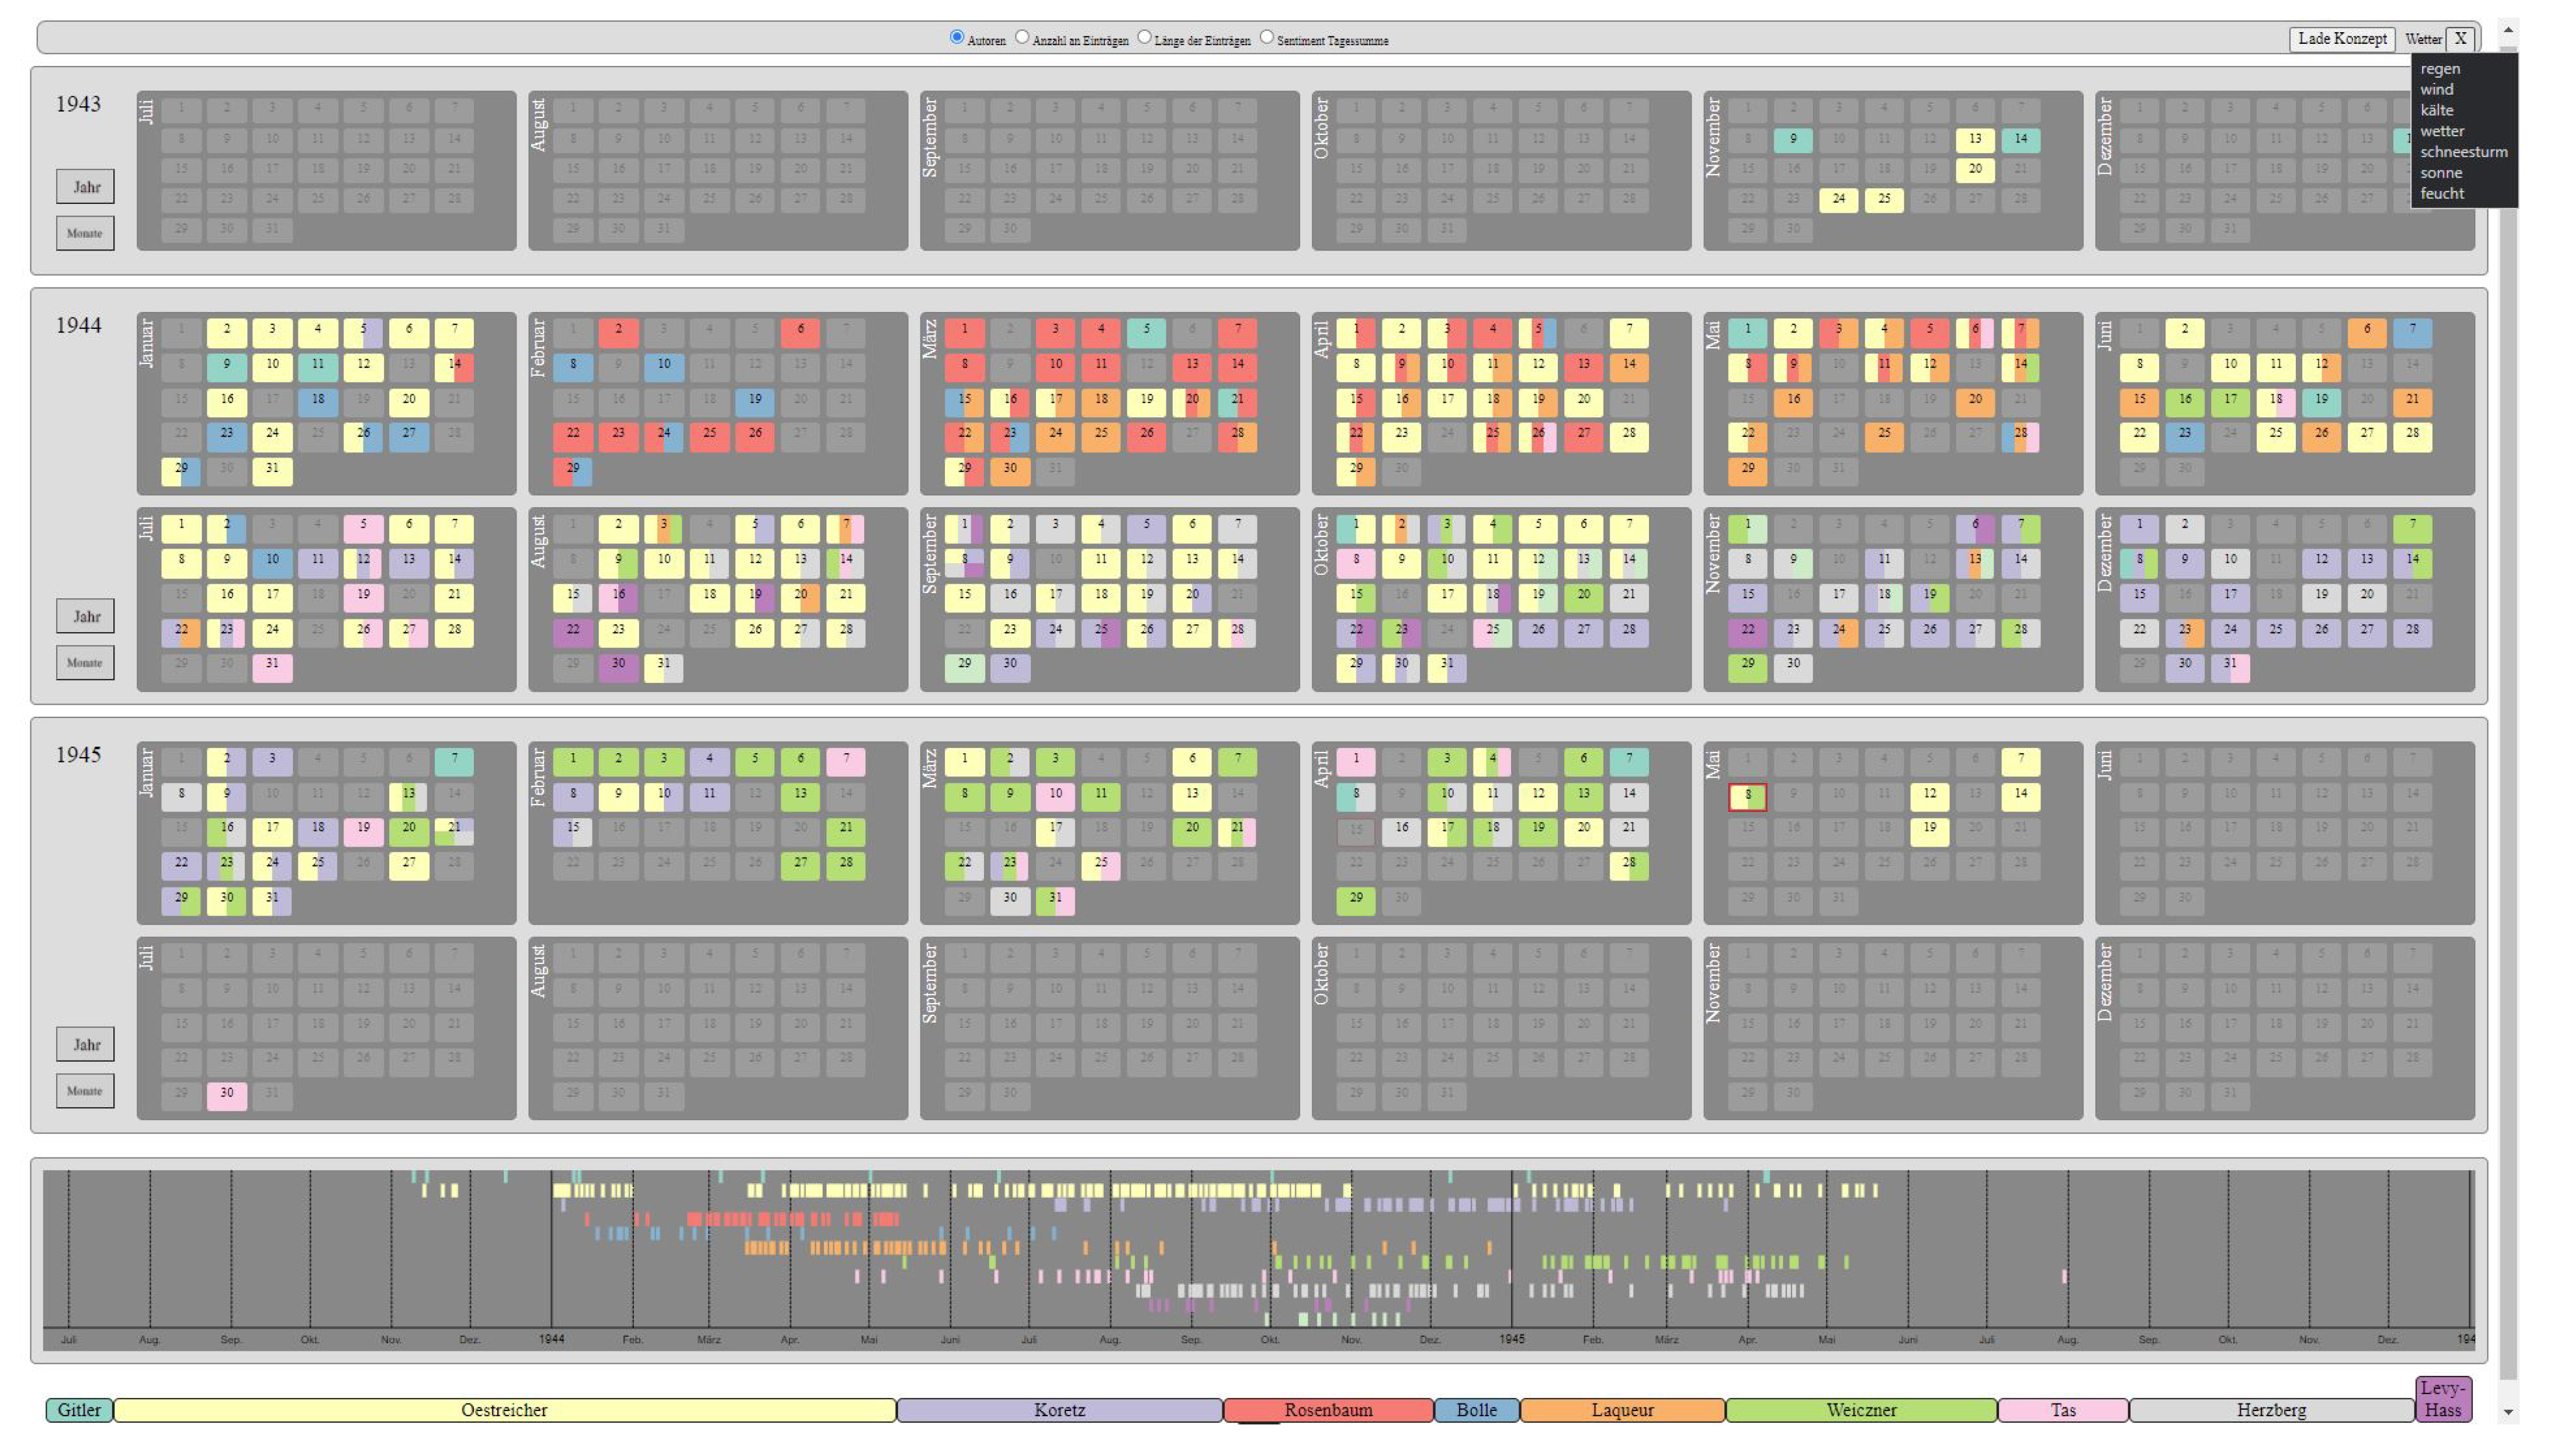
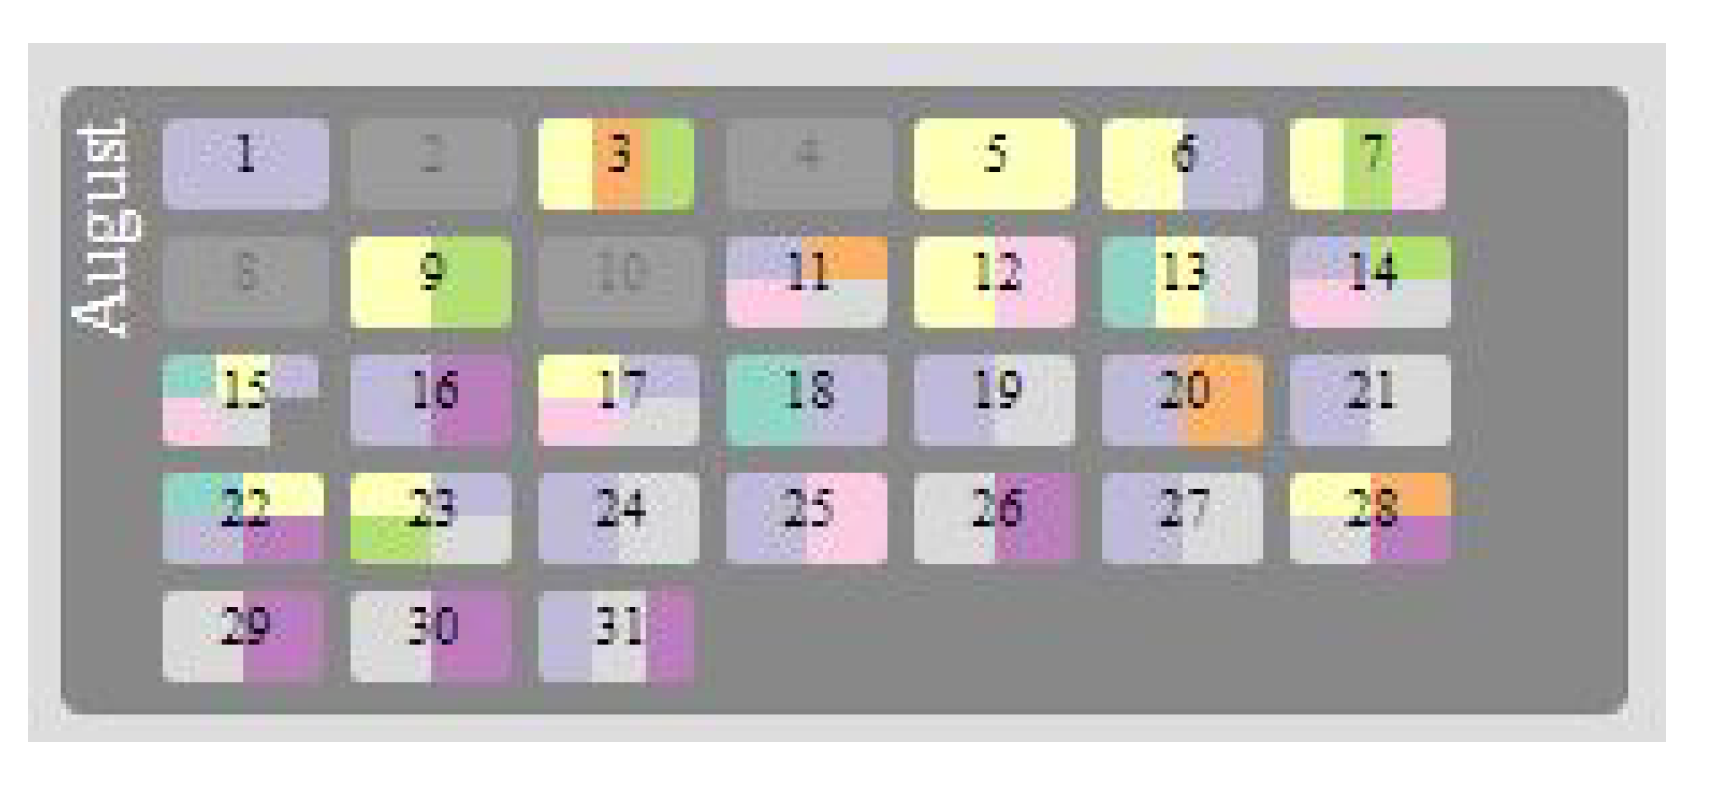
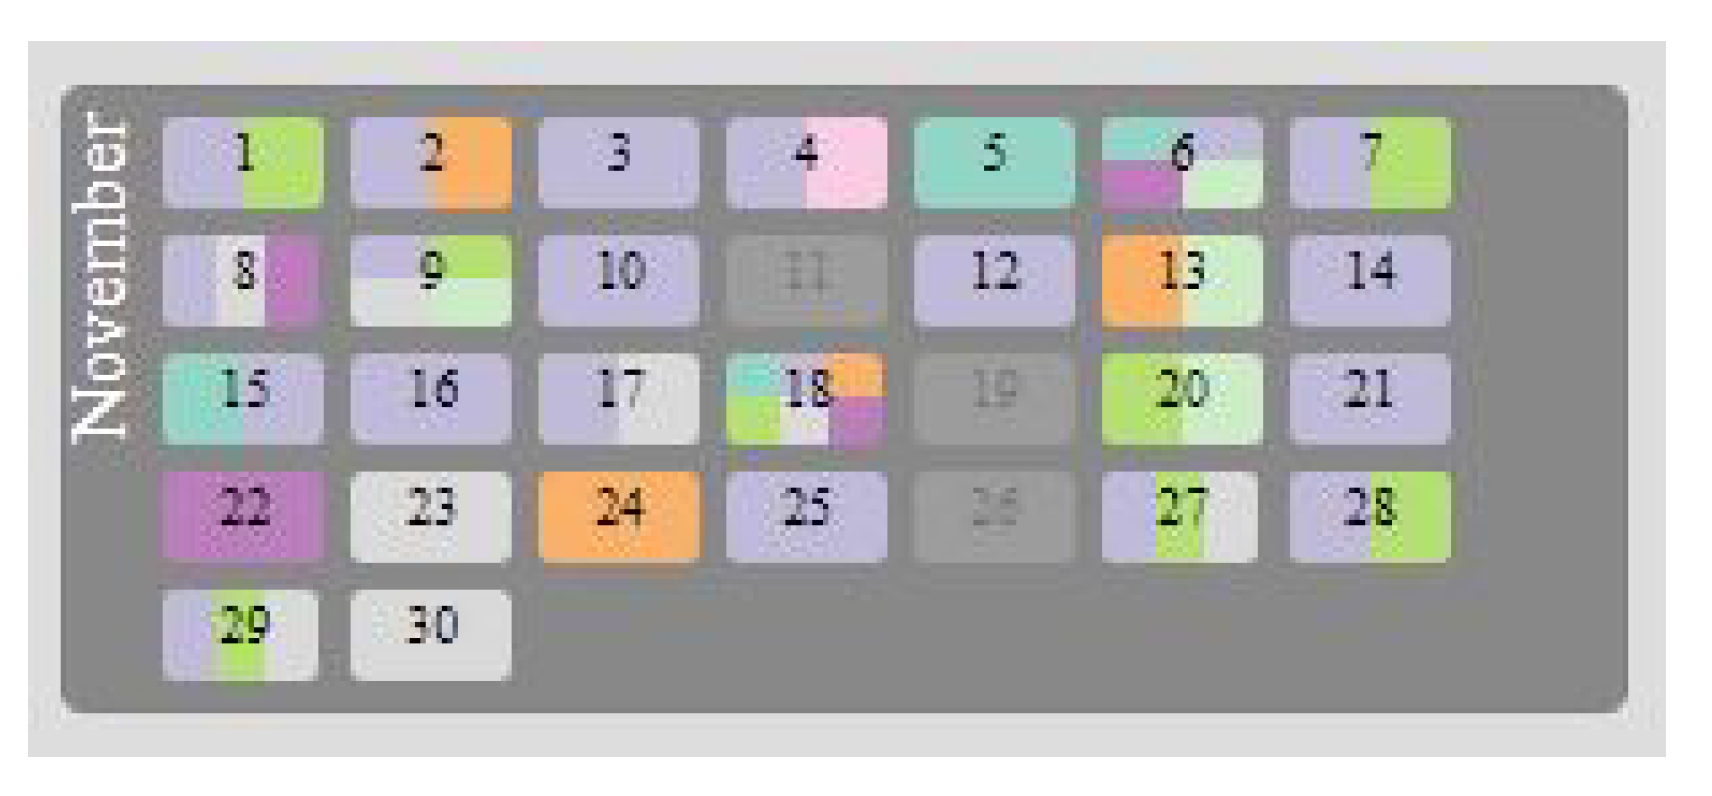
4.1.1. CalendarView
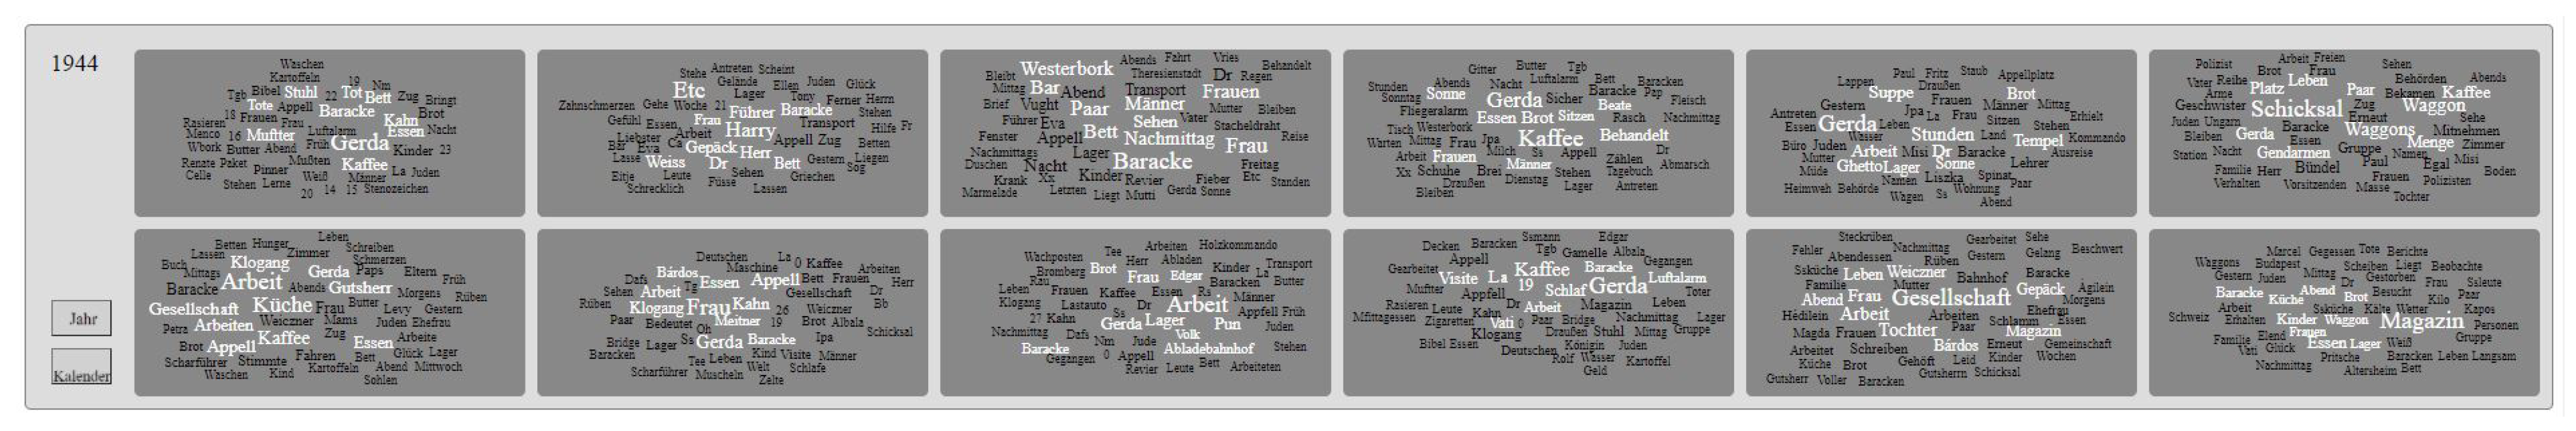
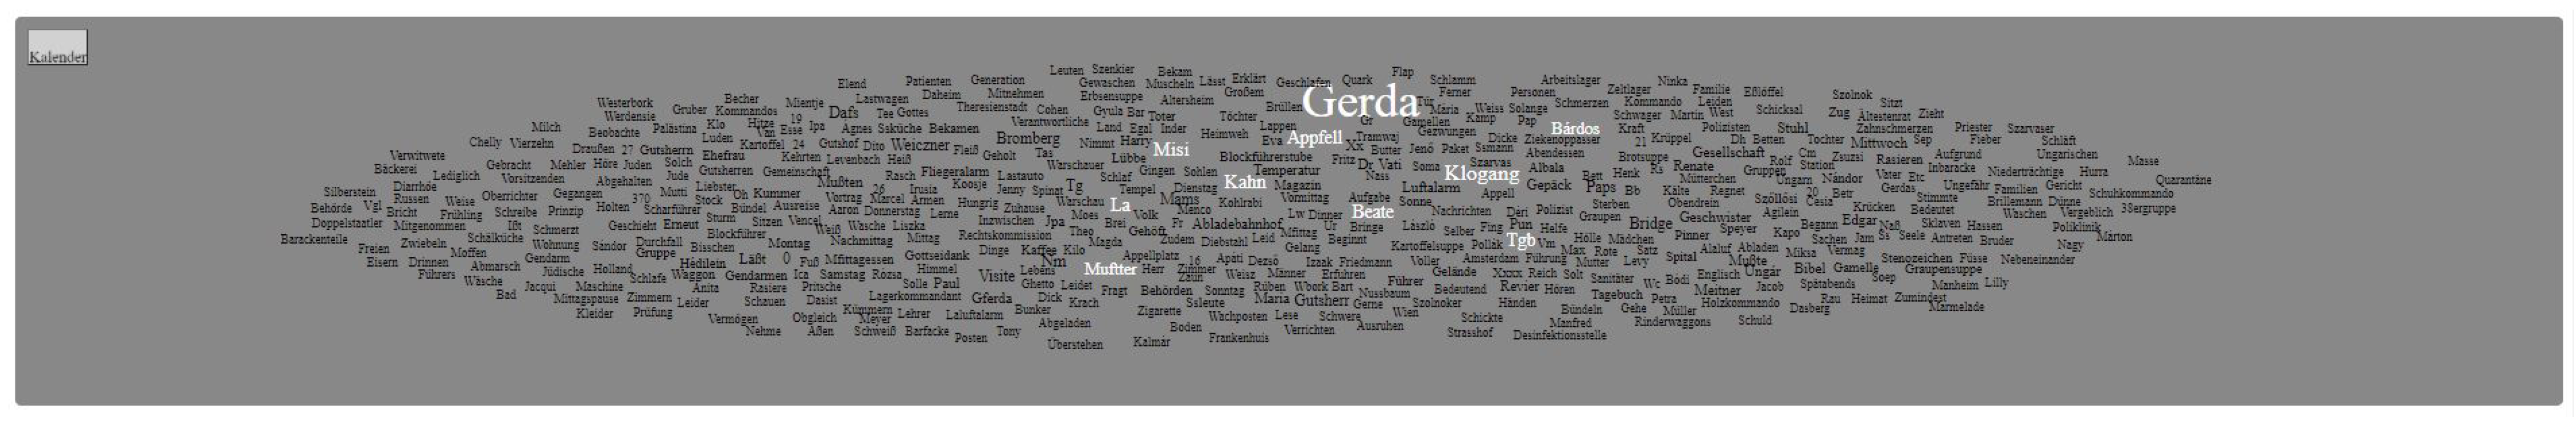
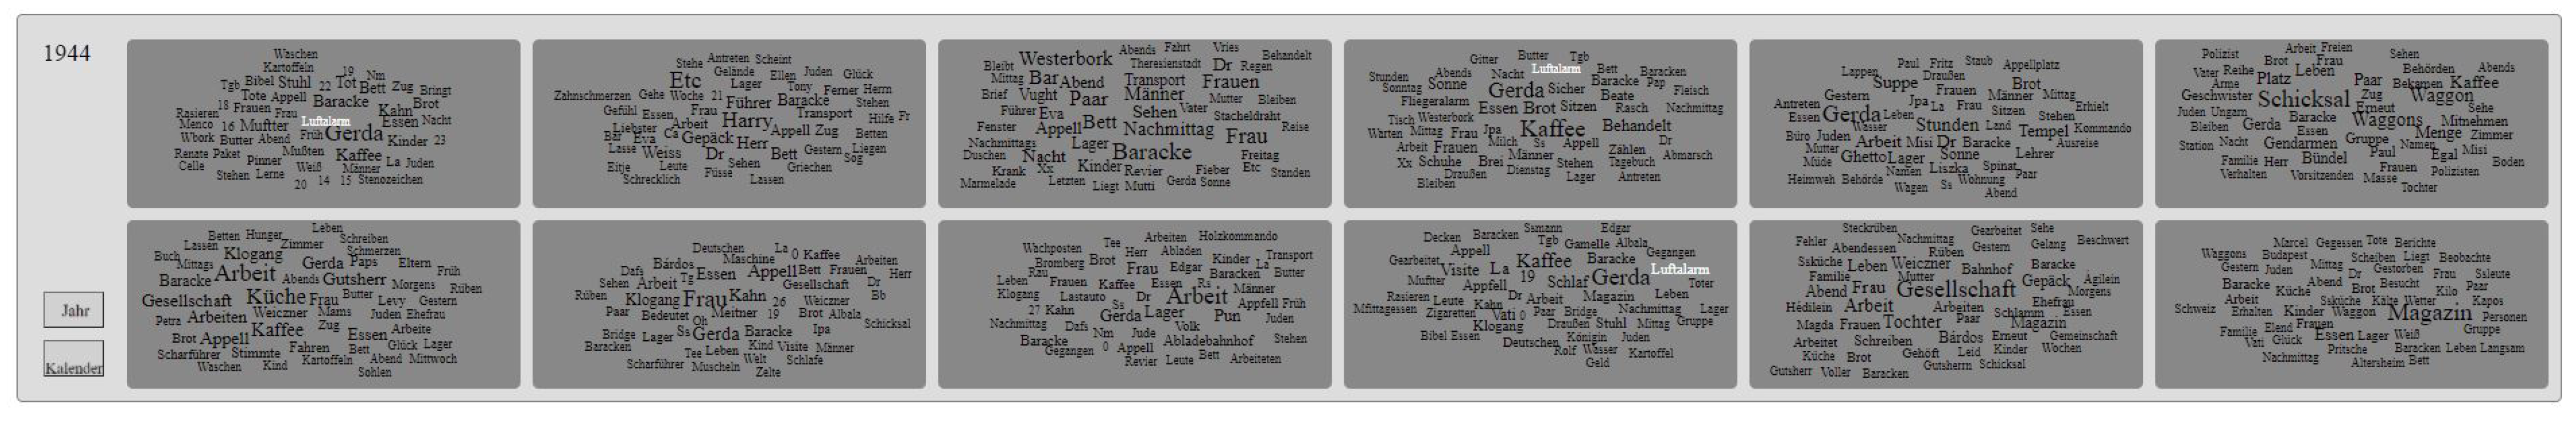
4.1.2. Tag Cloud
4.1.3. Close Reading Text
4.2. Visual Analysis
4.2.1. Filters
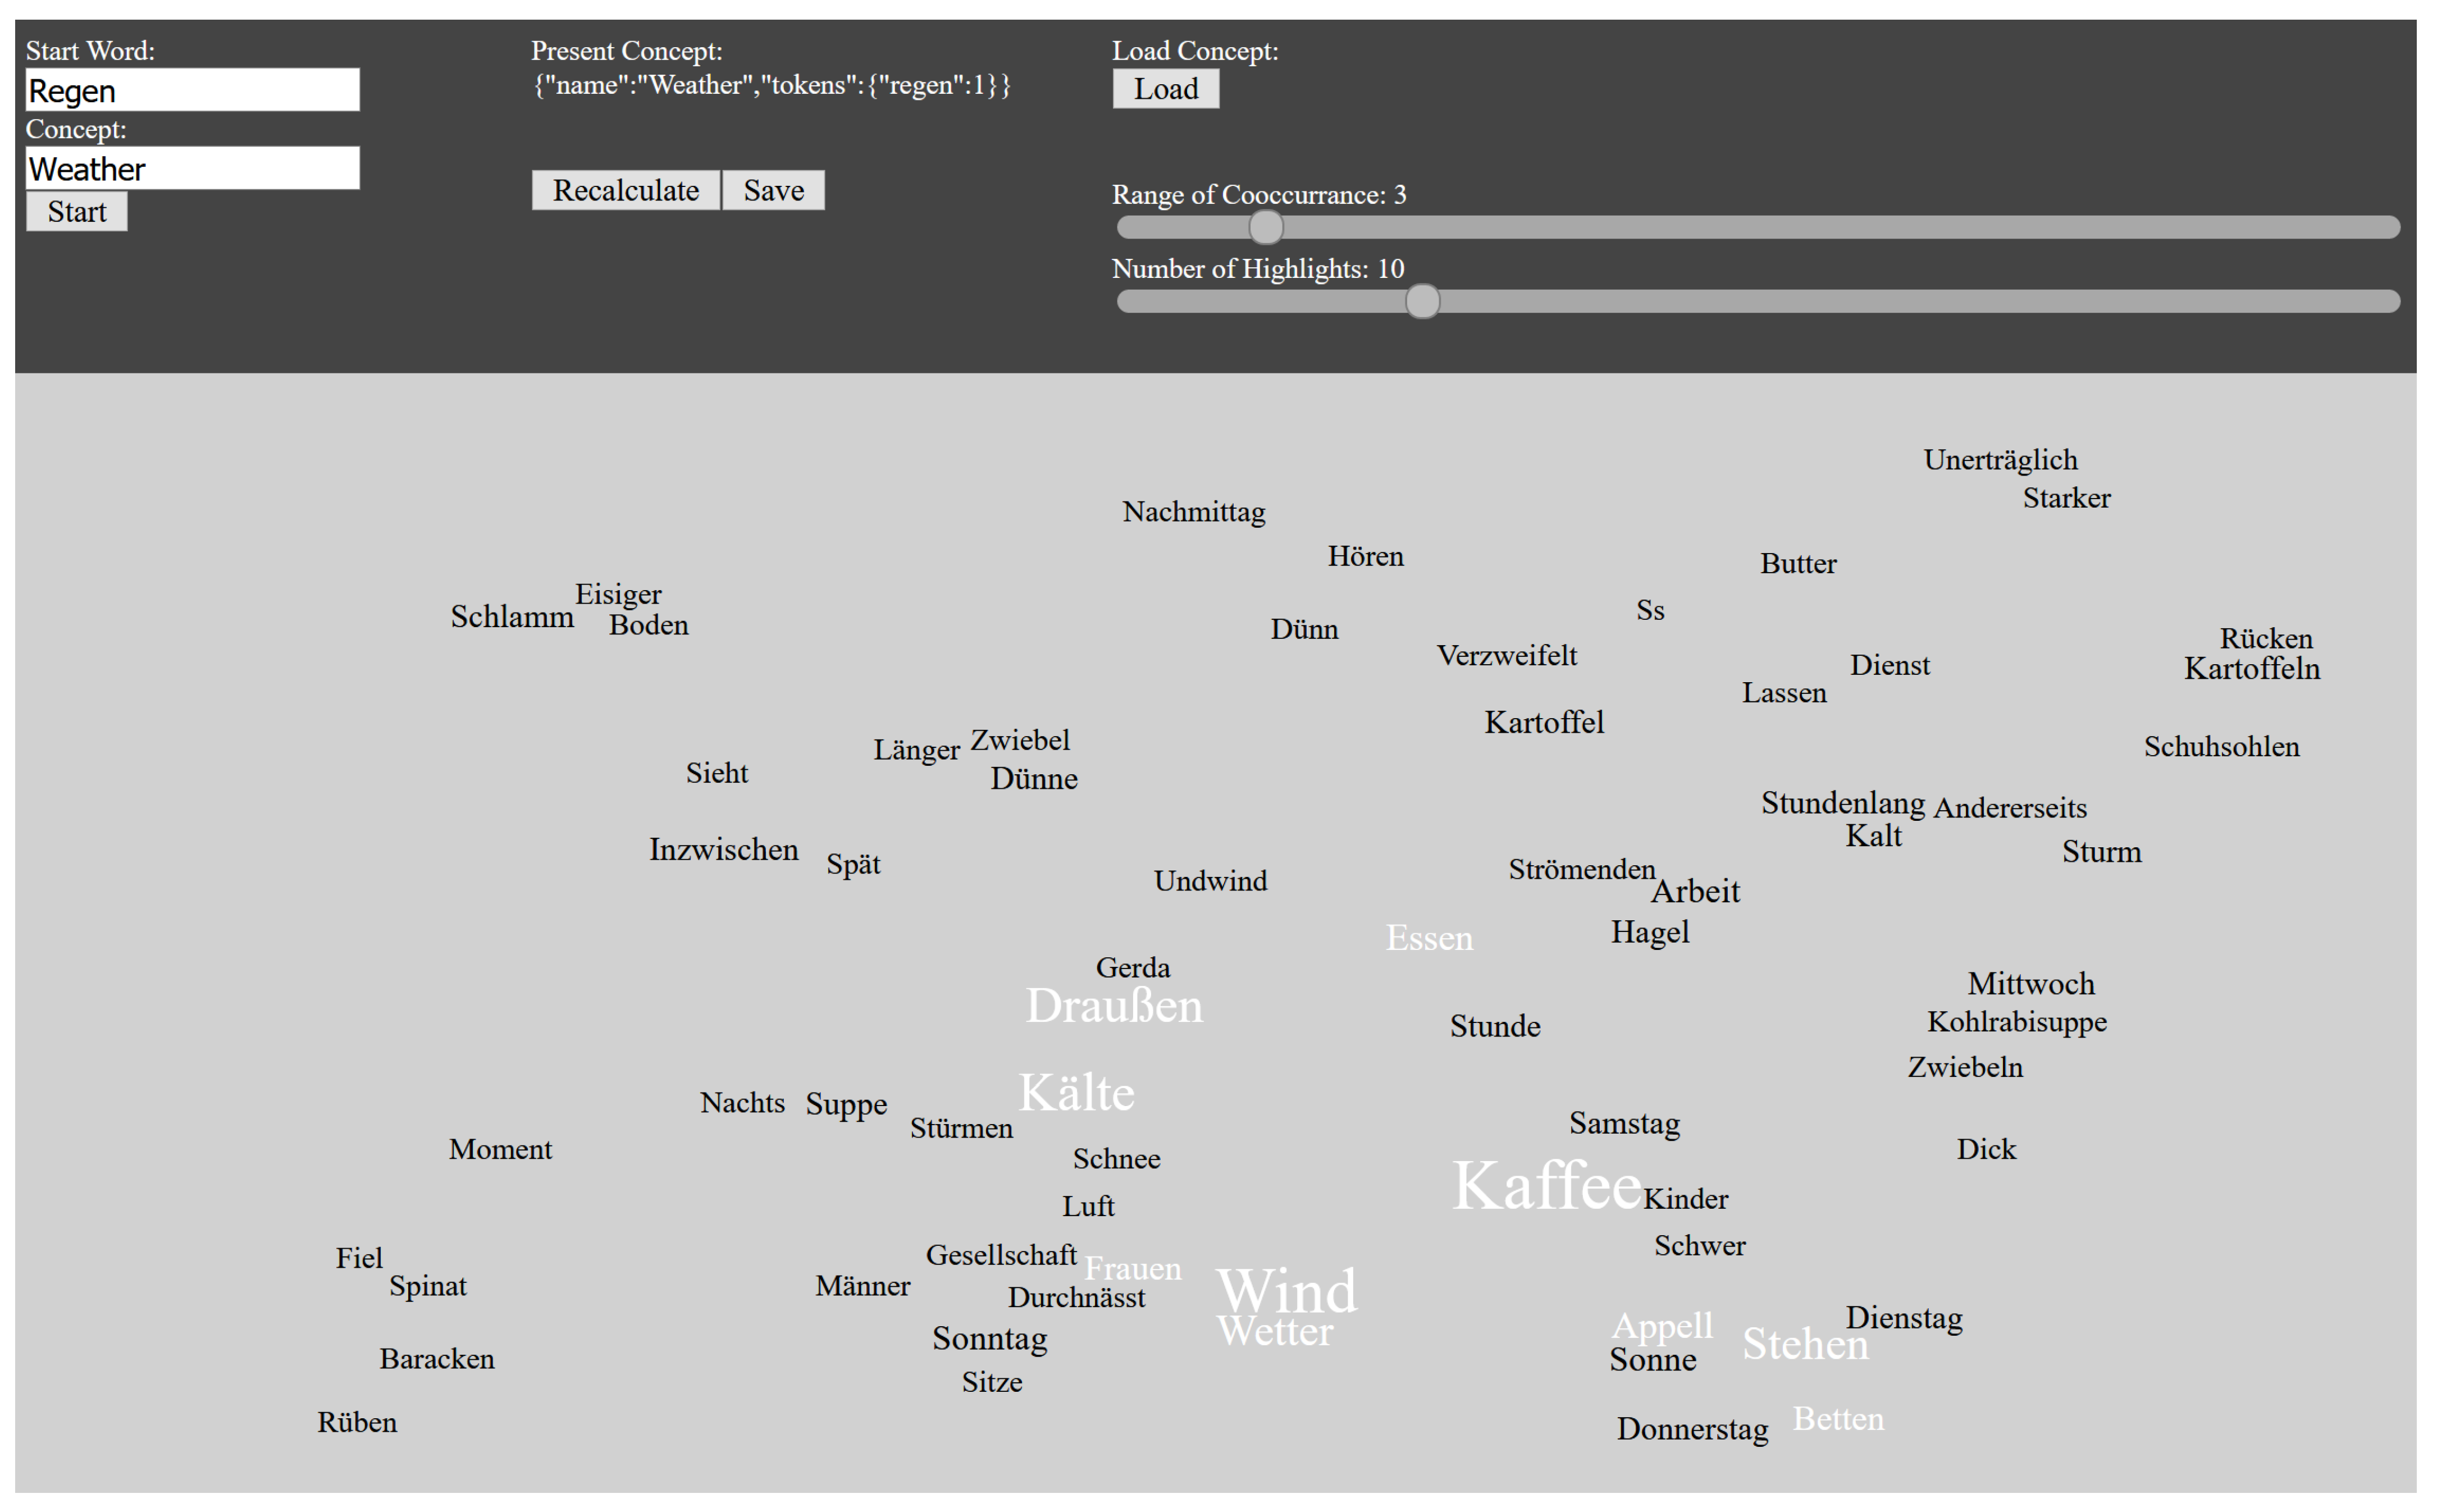
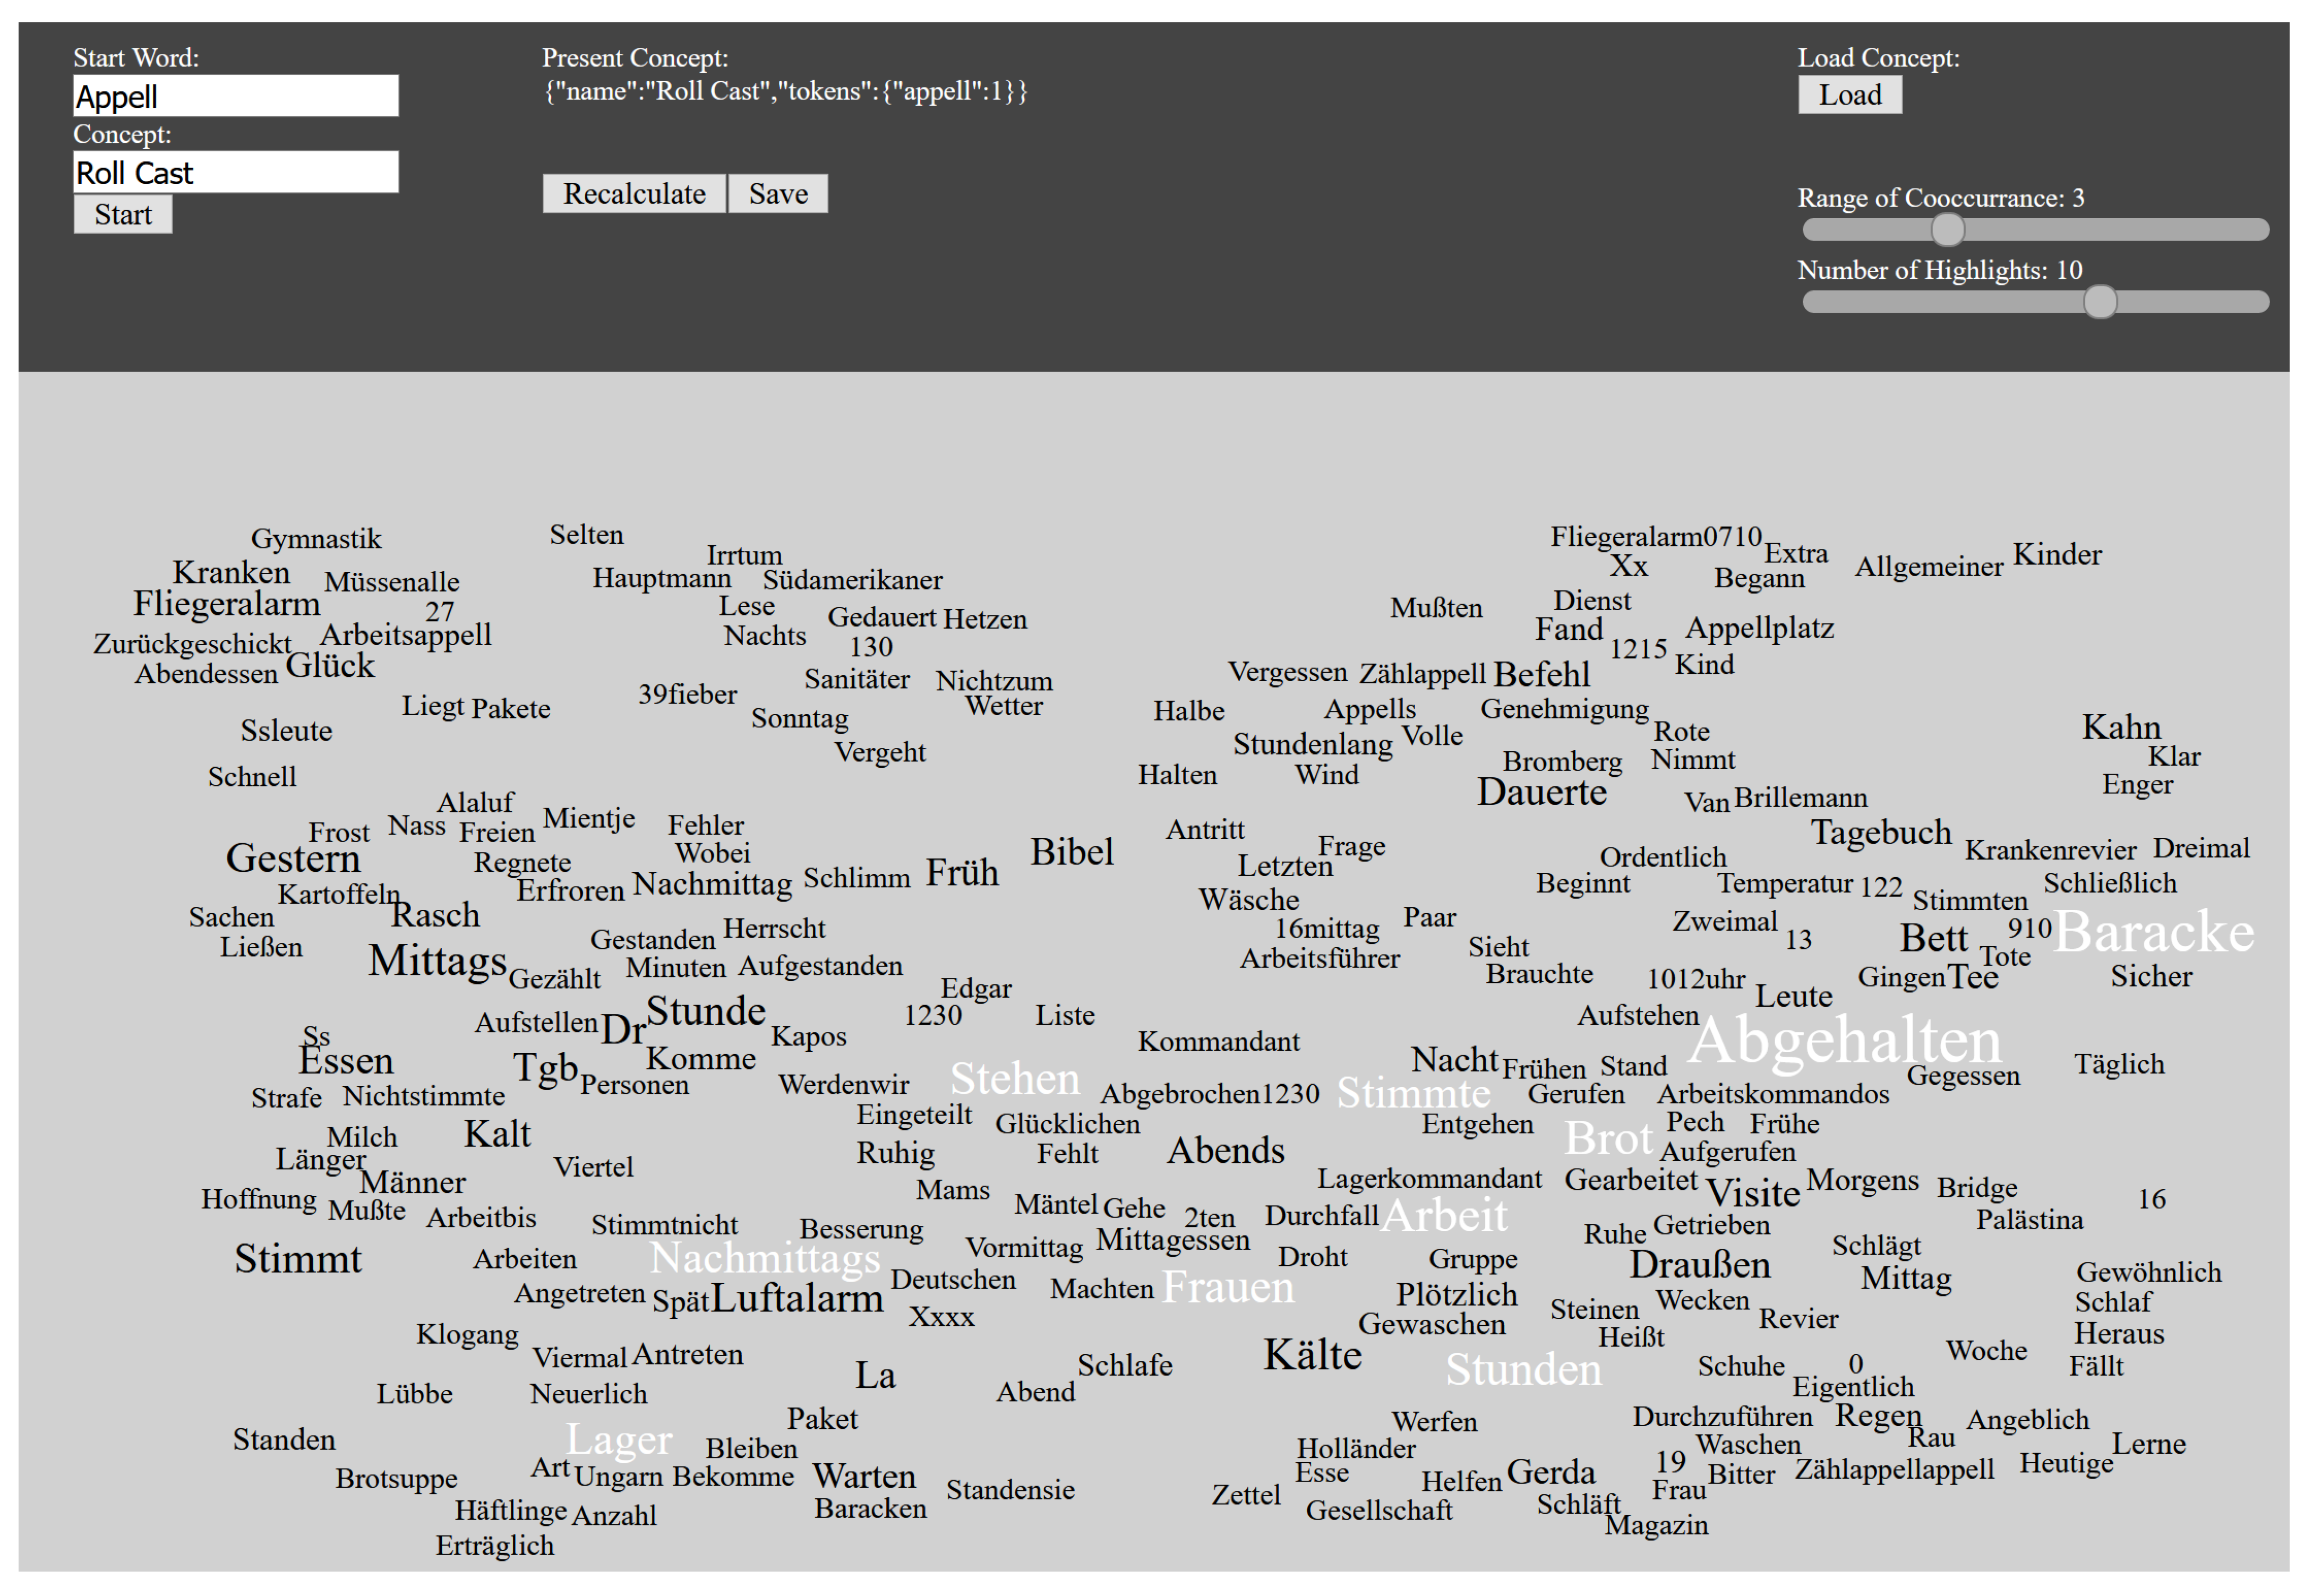
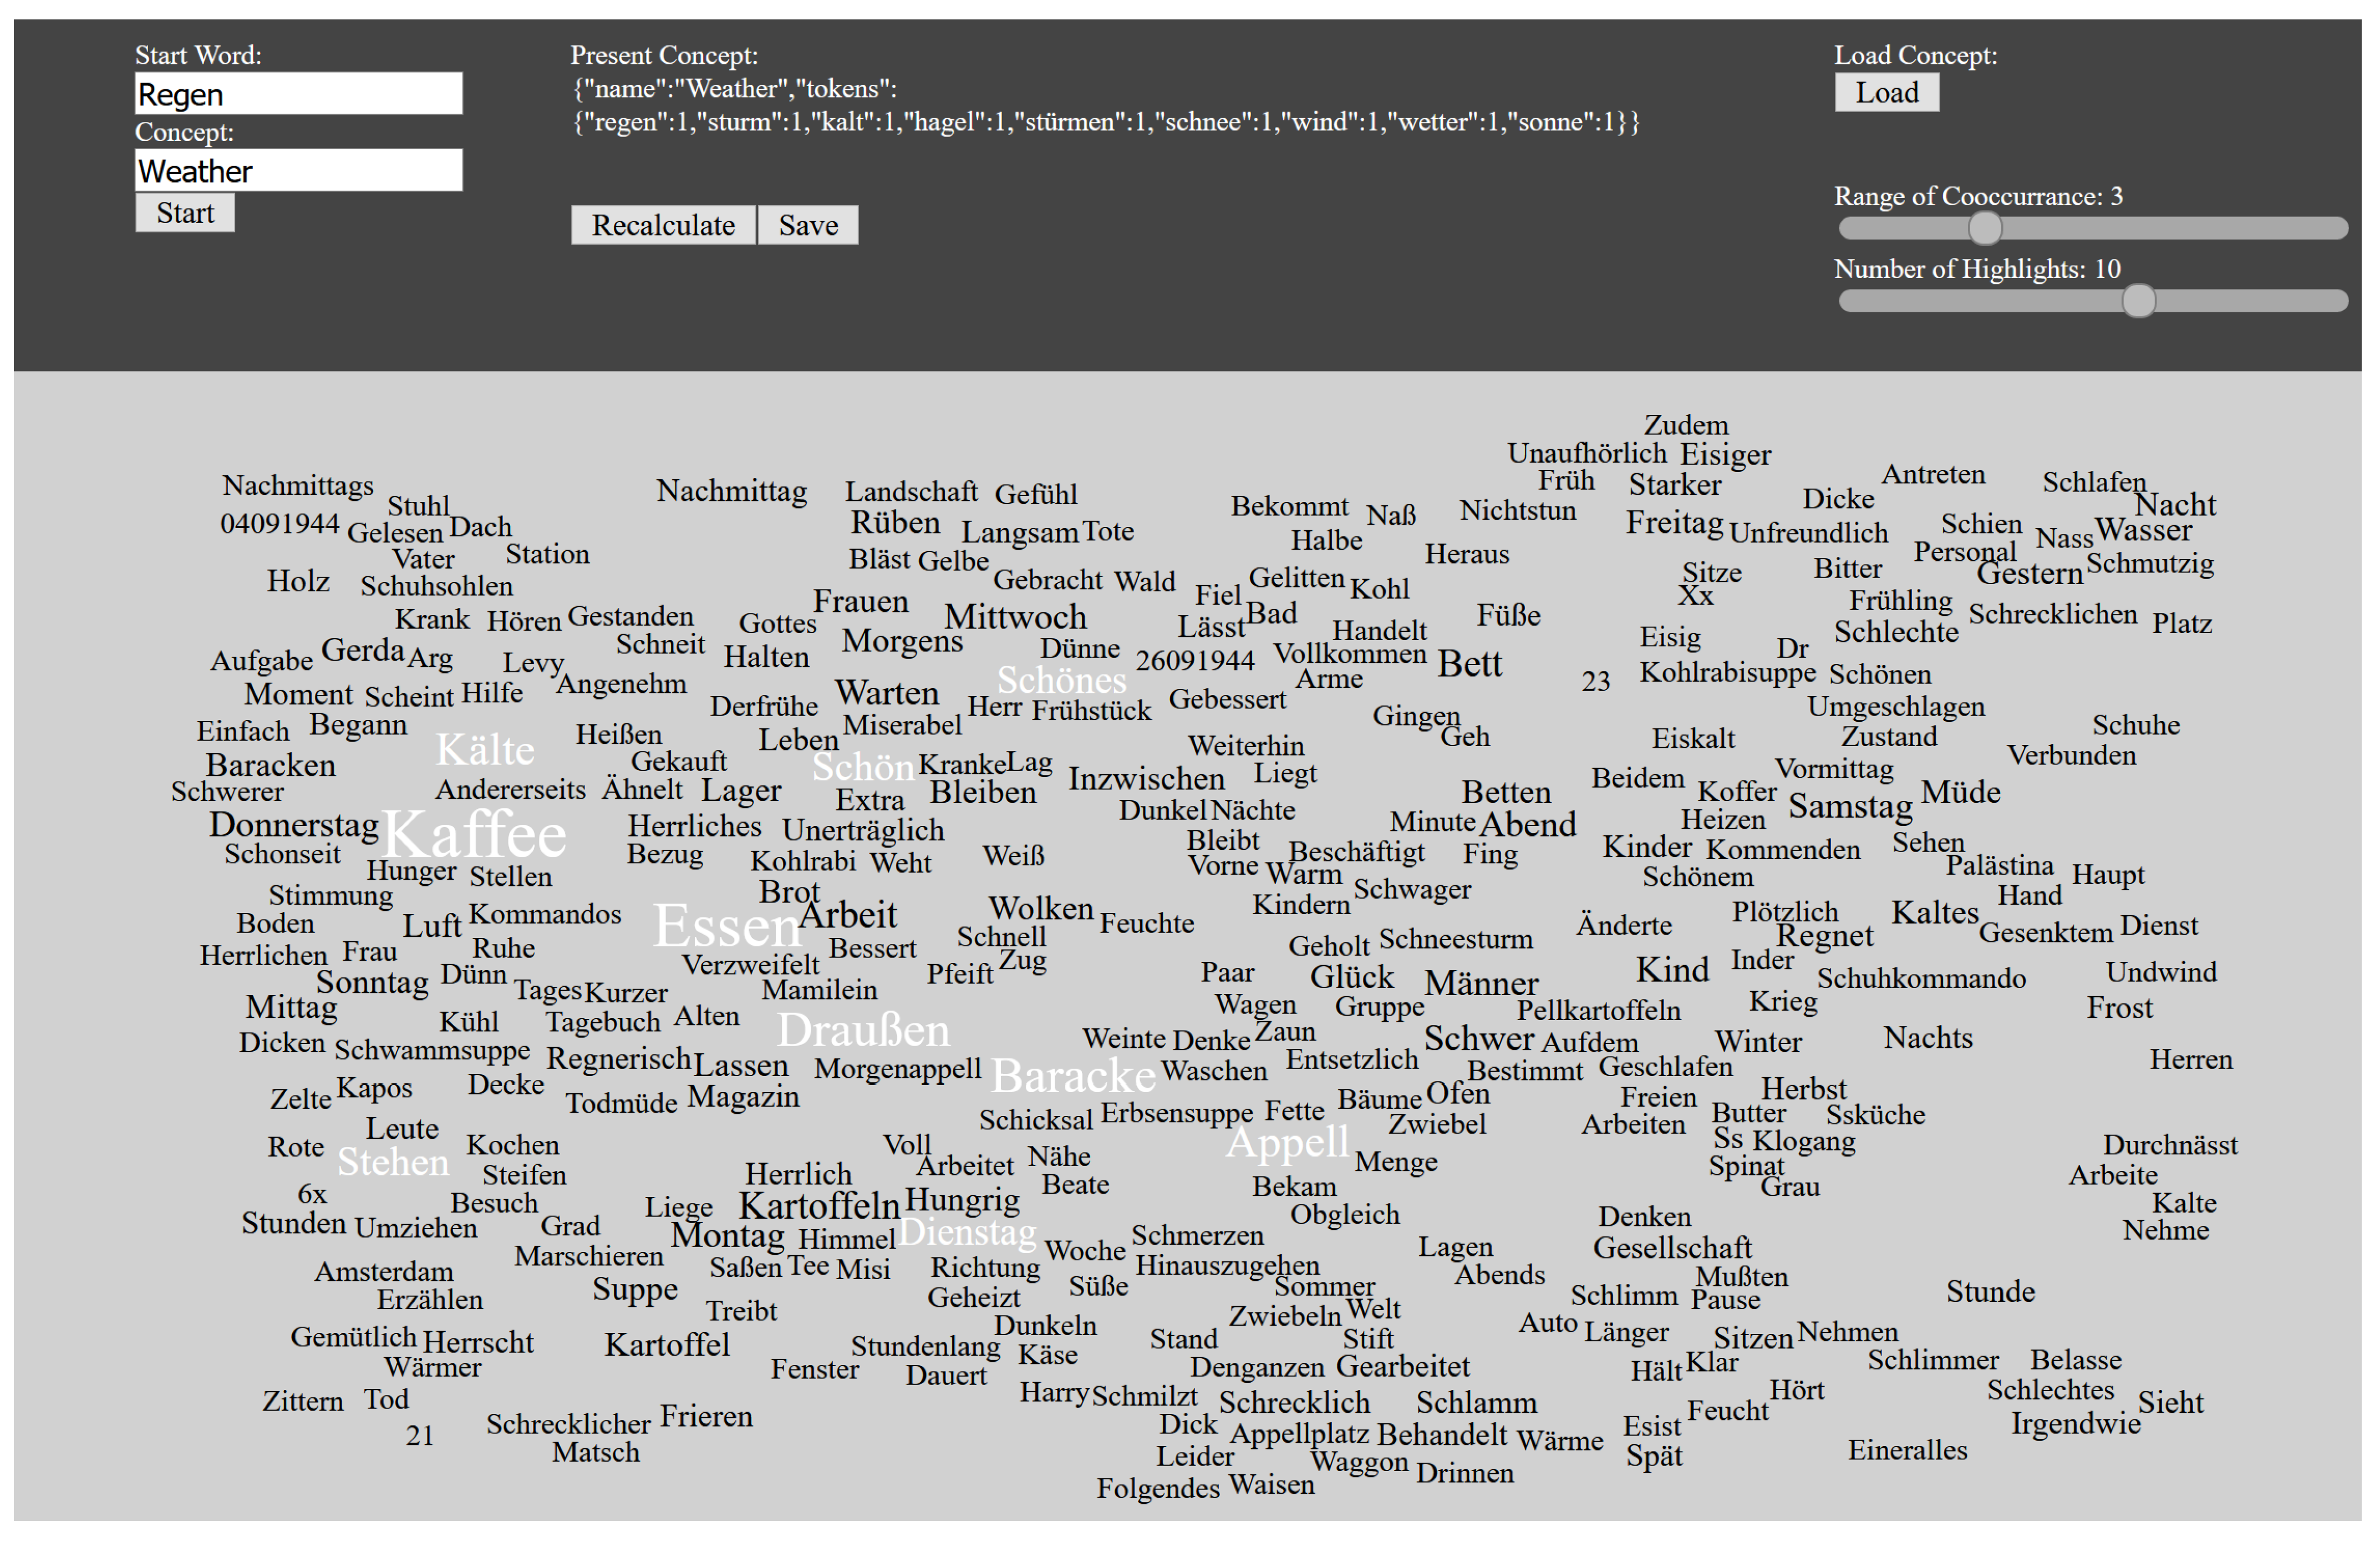
4.2.2. Concepts
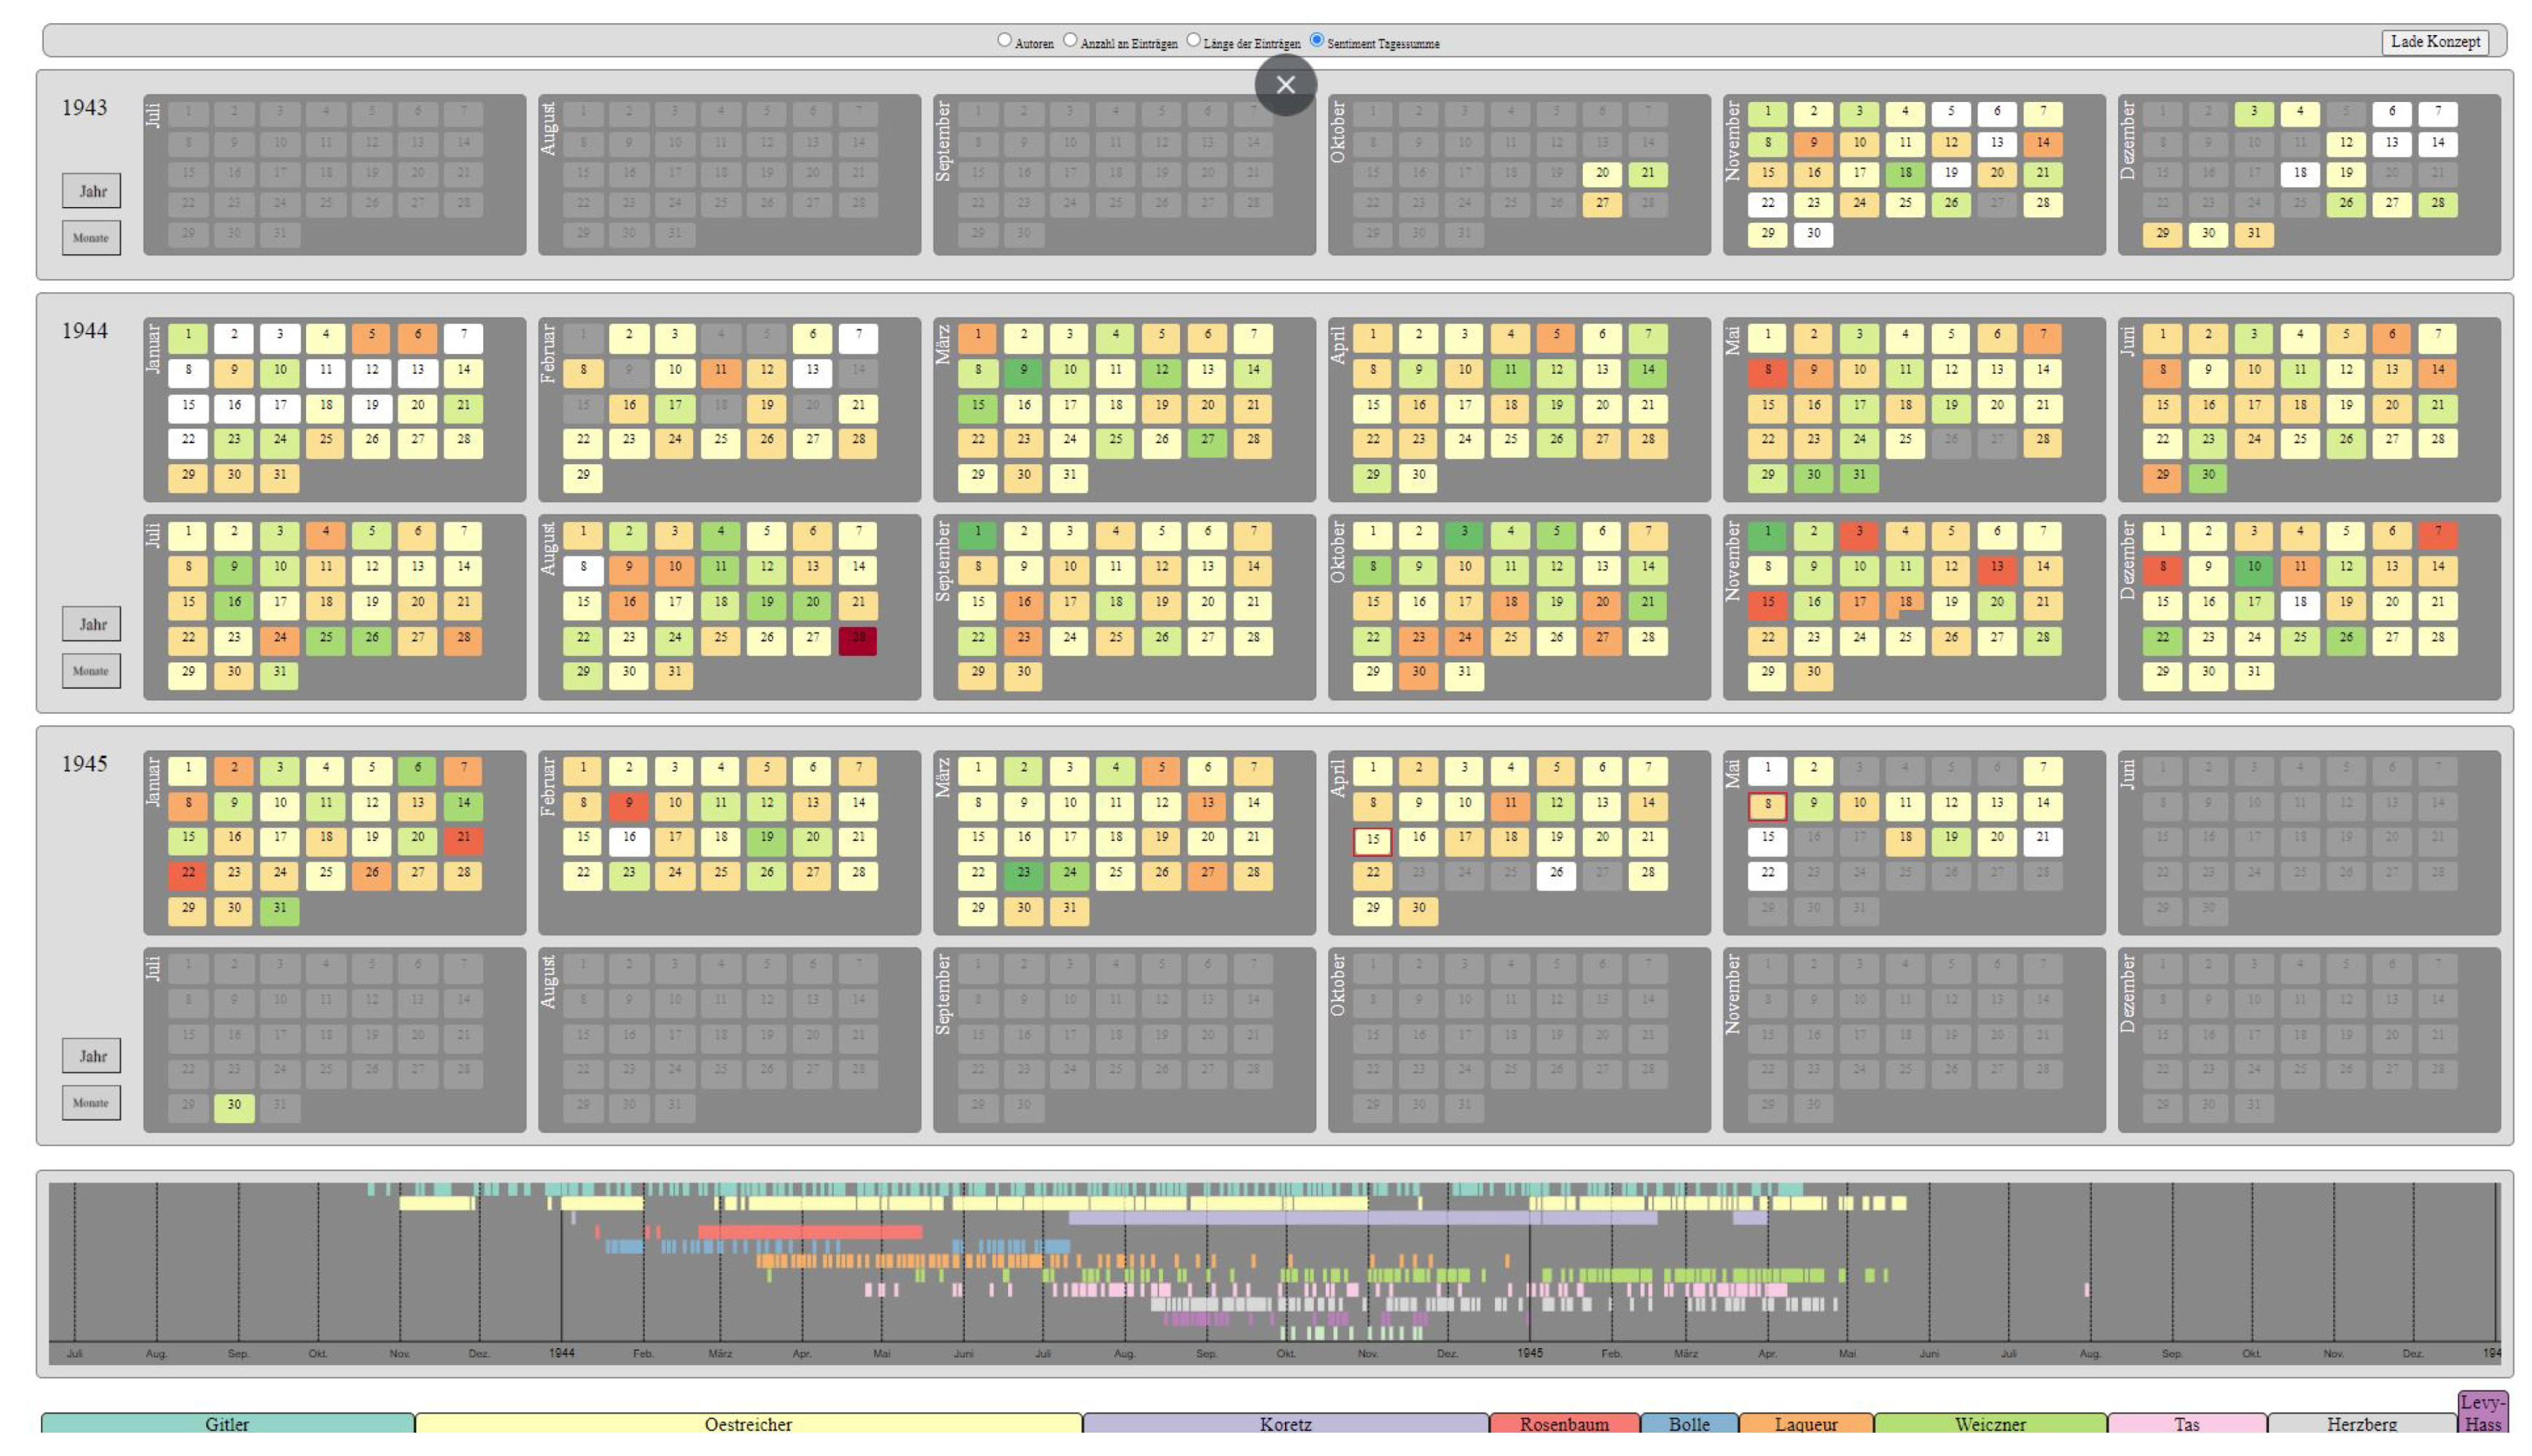
4.2.3. Sentiments
4.2.4. Text Volume
5. Use Cases
5.1. Lookup
5.2. Locate
5.3. Present
6. Discussion
6.1. Usage
Usability
6.2. Impact
6.2.1. CalendarView
“Under the impression of three freshly read diaries from the Stern camp, I would guess that the perceptions of the prisoners change from slightly negative to rather negative, but rather ’gently’ and not very steeply. I suspect this because most prisoners had previous prison experiences and associated a certain expectation with the Bergen-Belsen camp, which also had to do with ’exchange’. However, as the overall situation deteriorates over time, I believe at the same time that negative moods accumulate over time because the nervous strain on the prisoners increases significantly. According to my current knowledge of the prisoners’ reports, the liberation, which is perceived as so striking from today’s perspective, is not described as strongly and unambiguously positive as one would expect in retrospect, because it still takes place in parallel with many negative experiences in people’s situation. Therefore, I do not expect a strong or only a very moderate increase in positive sentiments for this period.”
6.2.2. Stopword List
6.2.3. ConceptTool
6.2.4. Visualizations
6.3. Limitations
6.4. Future Work
7. Conclusions
Author Contributions
Funding
Institutional Review Board Statement
Informed Consent Statement
Data Availability Statement
Acknowledgments
Conflicts of Interest
References
- Chen, J.; Shaw, S.L.; Yu, H.; Lu, F.; Chai, Y.; Jia, Q. Exploratory data analysis of activity diary data: A space–time GIS approach. J. Transp. Geogr. 2011, 19, 394–404. [Google Scholar] [CrossRef]
- Toledo, A.; Thawonmas, R.; Maeda, A.; Kimura, F. Interactive Visual Analysis of Personal Names in Japanese Historical Diary. Digit. Humanit. 2009, 2009, 278–280. [Google Scholar]
- Guo, Y.; Guo, S.; Jin, Z.; Kaul, S.; Gotz, D.; Cao, N. A survey on visual analysis of event sequence data. IEEE Trans. Vis. Comput. Graph. 2021. [Google Scholar] [CrossRef] [PubMed]
- Sedlmair, M.; Meyer, M.; Munzner, T. Design study methodology: Reflections from the trenches and the stacks. IEEE Trans. Vis. Comput. Graph. 2012, 18, 2431–2440. [Google Scholar] [CrossRef] [PubMed] [Green Version]
- Jänicke, S.; Franzini, G.; Cheema, M.F.; Scheuermann, G. On Close and Distant Reading in Digital Humanities: A Survey and Future Challenges. In Proceedings of the Eurographics Conference on Visualization (EuroVis)—STARs, Cagliari, Italy, 25–29 May 2015; Borgo, R., Ganovelli, F., Viola, I., Eds.; The Eurographics Association: Zurich, Switzerland, 2015. [Google Scholar] [CrossRef]
- Jänicke, S.; Franzini, G.; Cheema, M.F.; Scheuermann, G. Visual Text Analysis in Digital Humanities. Comput. Graph. Forum 2017, 36, 226–250. [Google Scholar] [CrossRef]
- Rosenberg, D.; Grafton, A. Cartographies of Time: A History of the Timeline; Princeton Architectural Press: New York, NY, USA, 2013. [Google Scholar]
- Brehmer, M.; Lee, B.; Bach, B.; Riche, N.H.; Munzner, T. Timelines revisited: A design space and considerations for expressive storytelling. IEEE Trans. Vis. Comput. Graph. 2016, 23, 2151–2164. [Google Scholar] [CrossRef] [PubMed]
- Priestley, J. A Chart of Biography; M. Carey: Warrington, UK, 1764. [Google Scholar]
- Khulusi, R.; Kusnick, J.; Focht, J.; Jänicke, S. An Interactive Chart of Biography. In Proceedings of the 2019 IEEE Pacific Visualization Symposium (PacificVis), Bangkok, Thailand, 23–26 April 2019; pp. 257–266. [Google Scholar] [CrossRef]
- Krstajic, M.; Bertini, E.; Keim, D. Cloudlines: Compact display of event episodes in multiple time-series. IEEE Trans. Vis. Comput. Graph. 2011, 17, 2432–2439. [Google Scholar] [CrossRef] [PubMed]
- Perin, C.; Vernier, F.; Fekete, J.D. Interactive horizon graphs: Improving the compact visualization of multiple time series. In Proceedings of the SIGCHI Conference on Human Factors in Computing Systems, Paris, France, 27 April–2 May 2013; pp. 3217–3226. [Google Scholar]
- Reijner, H. The Development of the Horizon Graph. In Proceedings of the Vis08 Workshop From Theory to Practice: Design, Vision and Visualization, Columbus, OH, USA, 20 October 2008. [Google Scholar]
- Havre, S.; Hetzler, B.; Nowell, L. ThemeRiver: Visualizing theme changes over time. In Proceedings of the IEEE Symposium on Information Visualization 2000, INFOVIS 2000, Salt Lake City, UT, USA, 8–13 October 2000; pp. 115–123. [Google Scholar]
- Byron, L.; Wattenberg, M. Stacked graphs–geometry & aesthetics. IEEE Trans. Vis. Comput. Graph. 2008, 14, 1245–1252. [Google Scholar] [PubMed]
- Brehmer, M.; Munzner, T. A Multi-Level Typology of Abstract Visualization Tasks. IEEE Trans. Vis. Comput. Graph. 2013, 19, 2376–2385. [Google Scholar] [CrossRef] [PubMed] [Green Version]
- Hartl, P.R. Visualization of Calendar Data. Ph.D. Thesis, Institute of Computer Graphics and Algorithms, Vienna University of Technoloy, Vienna, Austria, 2008. [Google Scholar]
- Weber, M.; Alexa, M.; Müller, W. Visualizing time-series on spirals. Infovis 2001, 1, 7–14. [Google Scholar]
- Carlis, J.V.; Konstan, J.A. Interactive visualization of serial periodic data. In Proceedings of the 11th Annual ACM Symposium on User Interface Software and Technology, San Francisco, CA, USA, 1–4 November 1998; pp. 29–38. [Google Scholar]
- Van Wijk, J.; Van Selow, E. Cluster and calendar based visualization of time series data. In Proceedings of the 1999 IEEE Symposium on Information Visualization (InfoVis’99), San Francisco, CA, USA, 24–29 October 1999; pp. 4–9. [Google Scholar]
- Liu, J.; Li, J.; Li, W. Temporal patterns in fine particulate matter time series in Beijing: A calendar view. Sci. Rep. 2016, 6, 32221. [Google Scholar] [CrossRef] [PubMed] [Green Version]
- Huang, D.; Tory, M.; Bartram, L. Data in everyday life: Visualizing time-varying data on a calendar. In Proceedings of thePoster Compendium IEEE VIS, Paris, France, 9–14 November 2014. [Google Scholar]
- Chankhihort, D.; Lim, B.M.; Lee, G.J.; Choi, S.; Kwon, S.O.; Lee, S.H.; Kang, J.T.; Nasridinov, A.; Yoo, K.H. A visualization scheme with a calendar heat map for abnormal pattern analysis in the manufacturing process. Int. J. Contents 2017, 13, 21–28. [Google Scholar]
- World Holocaust Remembrance Center Yad Vashem. Transports to Extinction. Holocaust (Shoah) Deportation Database. 2021. Available online: https://deportation.yadvashem.org/ (accessed on 24 June 2021).
- Musch, S.; Wolff, F.; Rass, C. Hermann Helfgott—Zvi Asaria Vom Kriegsgefangenen zum Landesrabbiner. 2021. Available online: https://www.arcgis.com/apps/Cascade/index.html?appid=62f3b4c27a3d4b419341f6064cba344c (accessed on 13 August 2021).
- Beorn, W.; Cole, T.; Gigliotti, S.; Giordano, A.; Holian, A.; Jaskot, P.B.; Knowles, A.K.; Masurovsky, M.; Steiner, E.B. Geographies of the Holocaust. Geogr. Rev. 2009, 99, 563–574. [Google Scholar] [CrossRef]
- Gilbert, M. Endlösung: Die Vertreibung und Vernichtung der Juden: Ein Atlas; Rororo Aktuell; Rowohlt: Hamburg, Germany, 1982. [Google Scholar]
- Raas, C. Mapping The Production of Death in Mittelbau Dora. 2019. Available online: https://nghm.hypotheses.org/459 (accessed on 24 June 2021).
- De Groot, M.; Yule, A.; Cuneo, J.; Steiner, E.; Knowles, A. The Evolution of the SS Concentration Camp System, 1933–1945. 2021. Available online: web.stanford.edu/group/spatialhistory/cgi-bin/site/viz.php?id=379projectid=0 (accessed on 24 June 2021).
- Stanford University. Arrests of Italian Jews, 1943–1945. 2021. Available online: web.stanford.edu/group/spatialhistory/cgi-bin/site/viz.php?id=383projectid=0 (accessed on 24 June 2021).
- Ehmel, F.; Brüggemann, V.; Dörk, M. Topography of Violence: Considerations for Ethical and Collaborative Visualization Design. Comput. Graph. Forum 2021, 40, 13–24. [Google Scholar] [CrossRef]
- Toledo, A.; Sookhanapibarn, K.; Thawonmas, R.; Rinaldo, F. Visual Recommendations from Japanese Historical Diary. In Proceedings of the 2011 Second International Conference on Culture and Computing, Kyoto, Japan, 20–22 October 2011; pp. 191–192. [Google Scholar]
- Vrotsou, K.; Ellegard, K.; Cooper, M. Everyday life discoveries: Mining and visualizing activity patterns in social science diary data. In Proceedings of the 2007 11th International Conference Information Visualization (IV’07), Zurich, Switzerland, 4–6 July 2007; pp. 130–138. [Google Scholar]
- Yu, H.; Shaw, S.L. Representing and visualizing travel diary data: A spatio-temporal gis approach. In Proceedings of the 2004 ESRI International User Conference, San Diego, CA, USA, 9 August 2004; pp. 1–13. [Google Scholar]
- Kolpashnikova, K.; Flood, S.; Sullivan, O.; Sayer, L.; Hertog, E.; Zhou, M.; Kan, M.Y.; Suh, J.; Gershuny, J. Exploring daily time-use patterns: ATUS-X data extractor and online diary visualization tool. PLoS ONE 2021, 16, e0252843. [Google Scholar]
- Bryan, C.; Ma, K.L.; Fu, Y.C. An interactive visualization interface for studying egocentric, categorical, contact diary datasets. In Proceedings of the 2013 IEEE/ACM International Conference on Advances in Social Networks Analysis and Mining, Niagara, ON, Canada, 25–28 August 2013; pp. 771–778. [Google Scholar]
- Levy-Hass, H. Vielleicht War das Alles Erst der Anfang. Tagebuch aus dem KZ Bergen-Belsen 1944–1945; Rotbuch: Zürich, Switzerland, 1979. [Google Scholar]
- Gitler, J. Leben am Seidenen Faden. Tagebuch aus dem Austauschlager Bergen-Belsen; Wallstein: Göttingen, Germany, 2015. [Google Scholar]
- Zielenziger, L. “Ich Möchte so Gerne Überdauern…“ Das Tagebuch der Lilly Zielenziger aus dem Konzentrationslager Bergen-Belsen; Stiftung Niedersächsische Gedenkstätten: Celle, Germany, 2017. [Google Scholar]
- Weiczner, J. “Ez Most a Sorsod, Kiüldözött Zsidó“. Napló, 1944–1945; Wesley János: Budapest, Hungary, 2016. [Google Scholar]
- Laqueur, R. Bergen-Belsen Tagebuch 1944/1945; Fackelträger: Obernhof, Germany, 1983. [Google Scholar]
- Oestreicher, F.H. Ein Jüdischer Arzt-Kalender; Hartung & Gorre: Wittingen, Germany, 1997. [Google Scholar]
- Koretz, A. Tagebuch Eines Jugendlichen 11.7.1944-30.3.1945; Wallstein: Göttingen, Germany, 2011. [Google Scholar]
- Herzberg, A.J. Zweistromland. Tagebuch aus Bergen-Belsen; Erev-Rav: Wittingen, Germany, 1997. [Google Scholar]
- Vogel, L. Tagebuch aus Einem Lager; Vandenhoek and Ruprecht: Göttingen, Germany, 2002. [Google Scholar]
- Shneiderman, B. The Eyes Have It: A Task by Data Type Taxonomy for Information Visualizations. In Proceedings of the IEEE Symposium on Visual Languages, Washington, DC, USA, 3–6 September 1996; pp. 336–343. [Google Scholar]
- Munzner, T. Visualization Analysis and Design; CRC Press: Boca Raton, FL, USA, 2014. [Google Scholar]
- Remus, R.; Quasthoff, U.; Heyer, G. SentiWS—A Publicly Available German-language Resource for Sentiment Analysis. In Proceedings of the 7th International Language Resources and Evaluation (LREC’10), Valletta, Malta, 19–21 May 2010. [Google Scholar]
- Loria, S. Textblob Documentation. Available online: textblob.readthedocs.io (accessed on 8 December 2021).
- Jänicke, S.; Kaur, P.; Kuzmicki, P.; Schmidt, J. Participatory Visualization Design as an Approach to Minimize the Gap between Research and Application. In Proceedings of the VisGap—The Gap between Visualization Research and Visualization Software, Norrköping, Sweden, 25 May 2020; Gillmann, C., Krone, M., Reina, G., Wischgoll, T., Eds.; The Eurographics Association: Norrköping, Sweden, 2020. [Google Scholar]


Publisher’s Note: MDPI stays neutral with regard to jurisdictional claims in published maps and institutional affiliations. |
© 2022 by the authors. Licensee MDPI, Basel, Switzerland. This article is an open access article distributed under the terms and conditions of the Creative Commons Attribution (CC BY) license (https://creativecommons.org/licenses/by/4.0/).
Share and Cite
Khulusi, R.; Billib, S.; Jänicke, S. Exploring Life in Concentration Camps through a Visual Analysis of Prisoners’ Diaries. Information 2022, 13, 54. https://doi.org/10.3390/info13020054
Khulusi R, Billib S, Jänicke S. Exploring Life in Concentration Camps through a Visual Analysis of Prisoners’ Diaries. Information. 2022; 13(2):54. https://doi.org/10.3390/info13020054
Chicago/Turabian StyleKhulusi, Richard, Stephanie Billib, and Stefan Jänicke. 2022. "Exploring Life in Concentration Camps through a Visual Analysis of Prisoners’ Diaries" Information 13, no. 2: 54. https://doi.org/10.3390/info13020054
APA StyleKhulusi, R., Billib, S., & Jänicke, S. (2022). Exploring Life in Concentration Camps through a Visual Analysis of Prisoners’ Diaries. Information, 13(2), 54. https://doi.org/10.3390/info13020054