Effects of Marking Automated Vehicles on Human Drivers on Highways


1
Chair of Ergonomics, Technical University of Munich, 85748 Garching, Germany
2
BMW Group, New Technologies, 85748 Garching, Germany
*
Author to whom correspondence should be addressed.
Information 2020, 11(6), 286; https://doi.org/10.3390/info11060286
Submission received: 4 May 2020
/
Revised: 22 May 2020
/
Accepted: 25 May 2020
/
Published: 28 May 2020
(This article belongs to the Special Issue Test and Evaluation Methods for Human-Machine Interfaces of Automated Vehicles)
Abstract
:Due to the short range of the sensor technology used in automated vehicles, we assume that the implemented driving strategies may initially differ from those of human drivers. Nevertheless, automated vehicles must be able to move safely through manual road traffic. Initially, they will behave as carefully as human learners do. In the same way that driving-school vehicles tend to be marked in Germany, markings for automated vehicles could also prove advantageous. To this end, a simulation study with 40 participants was conducted. All participants experienced three different highway scenarios, each with and without a marked automated vehicle. One scenario was based around some roadworks, the next scenario was a traffic jam, and the last scenario involved a lane change. Common to all scenarios was that the automated vehicles strictly adhered to German highway regulations, and therefore moved in road traffic somewhat differently to human drivers. After each trial, we asked participants to rate how appropriate and disturbing the automated vehicle’s driving behavior was. We also measured objective data, such as the time of a lane change and the time headway. The results show no differences for the subjective and objective data regarding the marking of an automated vehicle. Reasons for this might be that the driving behavior itself is sufficiently informative for humans to recognize an automated vehicle. In addition, participants experienced the automated vehicle’s driving behavior for the first time, and it is reasonable to assume that an adjustment of the humans’ driving behavior would take place in the event of repeated encounters.
1. Introduction
BMW has announced that the first highly automated vehicles (AVs) will be integrated into road traffic by 2021 [1]. It can be assumed that, initially, level 3 functions [2] will be available on highways. At the beginning, there will be several situations where the implemented driving strategy of an AV differs from that of a human driver. These include, in particular, situations where anticipatory driving is required, such as waiting for large gaps or reacting to missing traffic signs (e.g., changes in the speed limit). These atypical driving strategies could lead to confusion and distrust by other human road users (HRUs) [3]. One way of counteracting the confusion of HRUs is the clear identification of AVs, e.g., through special marking or additional light signals.
One argument for marking AVs, besides the positive marketing effect, is an increased understanding of larger gap sizes or ambiguous driving strategies [4]. One argument against marking is that the compliant behavior of AVs could lead to unwanted external interference [4]. For example, pedestrians could step onto the road, as they could be sure that the AV will brake [4].
Similar markings already exist for several types of vehicle, e.g., driving-school vehicles [5]. Those vehicles can be marked when they are being used for lessons to draw the attention of the surrounding traffic to the presence of the learner driver [5]. For example, in Austria and New Zealand, when driving at the age of 17, a clearly visible sign must be attached to the vehicle [6,7]. This allows other drivers to adjust their driving behavior to the learner driver and, if necessary, maintain a greater than usual distance from the vehicle, or overtake quickly.
In a study to evaluate the influence of marked AVs on human drivers, drivers encountered an AV that was either marked, not marked, or wrongly marked, in different highway scenarios [8]. The authors asked participants to rate the perceived safety, risk, and how pleasant it was to encounter the AV. Objective driving data were recorded during the simulator study. The results show that human drivers evaluate encounters with AVs independent of the marking [8].
Moreover, the critical gap acceptance and the perceived safety of participants crossing a road in front of an AV is not affected by the vehicle’s driving mode (manual vs. automated) [9]. A comparable result was found in the study by Rodríguez Palmeiro [10]: even if participants noticed that the vehicle had an automated-driving sign, and they were subjectively influenced by feeling less safe and more doubtful, the objective behavior of participants did not change [10]. In addition, Faas, Mathis and Baumann [11] recommended providing―as a minimum―information for the pedestrians on the vehicle’s status, so as to increase trust, perceived safety and to improve the road user experience.
Although few studies exist that have investigated the marking of AVs as such, there is currently increased research into visual external human-machine interfaces (eHMIs) for AVs, used to communicate explicitly with other HRUs [12]. Even though the focus of eHMIs is on other communication content, they result in additional marking of the AV. Light strips (e.g., [11,13,14]), displays (e.g., [9,15,16,17]) and projections (e.g., [18]) have primarily been used to communicate intentions to pedestrians (e.g., [13,14,15]) or human drivers (e.g., [16,19]). Cyan is recommended for eHMIs as it is a highly visible color and has no specific association in road traffic contexts [11,18,20,21]. Therefore, it seems to be well-suited to represent AVs [20].
The current results indicate that eHMIs improve the interaction between pedestrians and AVs [15,17] and increase the perceived safety and comfort of participants [22,23]. However, with regard to pedestrian–AV interaction, projections and eHMIs on wheels should be avoided, whereas eHMIs on roofs, windscreens or grilles work quite well [23]. In addition, it was found that eHMIs are useful for human driver–AV interaction, whereby displays are recommended rather than projections [16].
2. Objectives
When integrating AVs into traffic, communication might differ from situation to situation depending on the communication partner, such as pedestrians or human drivers [28]. As mentioned, there will be situations where the AV’s driving strategy differs from that of human drivers. It can be assumed that these driving strategies can only be adapted with improved technology and algorithms. For as long as better technology cannot be implemented, consideration should be given to mark AVs. Such markings can be used by drivers to identify AVs and adapt their driving behavior if necessary. The aim of the study is to investigate whether marking the vehicles with a cyan LED strip in the upper part of the rear window as AVs (Figure 1) results in differences in the drivers’ behavior and subjective evaluation in situations where it can be expected that an AV’s driving strategy will deviate from that of a human.
3. Method
3.1. Preliminary Study: Interview with Driving Instructors
In order to obtain an initial impression of the effects of vehicle marking, we posted a question in two Facebook online groups for German driving instructors. We asked for their experience of marking their driving schools’ vehicles. We received 53 responses sharing different impressions. Of the 53 responses, it was possible to analyze 40 answers, as the others did not discuss the topic of marking driving school’s vehicles. Altogether, 20% of the driving instructors mentioned that they do not experience differences in the behavior of surrounding traffic while driving a marked driving-school vehicle, compared to driving a vehicle without markings. In total, 27.5% are in favor of marking and 52.5% prefer not being identified as a driving-school vehicle. Reasons mentioned for preferring markings are the greater consideration demonstrated by other road users (10%), less honking (12%), and more acceptance from others (5%) (Figure 2). However, other driving instructors perceive less consideration from other road users when they see such markings, along with riskier behavior by the same (for example, not adhering to appropriate distances when cutting in and out during overtaking; 27%). In their opinion, others honk more (3%) if they recognize a driving-school vehicle. Therefore, from their perspective, it is more relaxing (23%) to drive without markings.
To evaluate whether marking AVs also leads to differing opinions, we conducted a driving simulation study. The ethics committee of the Technical University of Munich approved this study. The corresponding code is 448/19 S.
3.2. Procedure
After welcoming the participants, they had to sign a declaration of consent. They were then asked to fill out demographic questions on a tablet and take a seat in the driving simulator in order to adjust the driver’s seat and mirrors. Participants were introduced to the simulator, and experienced the driving simulation during a familiarization drive. All participants experienced six trials in random order. Each trial consisted of one of three different highway scenarios in which the driver encountered an AV (see Section 3.4.1). After each trial, participants were asked about the surrounding traffic (see Section 3.5.1). At the end of the study, we asked about the attitude towards marking AVs. With the exception of the demographic information, the experimenter gathered the information via oral questions and responses.
3.3. Apparatus
The basis of the static driving simulator (Figure 3) was a BMW 6 series mockup. A 6-channel projection system provided a realistic driving environment, with a refresh rate of 60 Hz. Three projectors were used for the 180° front view, and three projectors for the rear view (side and rear mirrors). We used the driving simulation software SILAB 6.5 of the Würzburg Institute for Traffic Sciences GmbH [29] and logged the driving data with 240 Hz. A 6-channel noise simulation completed the driving simulation. A freely programmable instrument cluster was used as human-machine interface. A tachometer and a speedometer were implemented for displaying driving-relevant information in this study. No additional advanced driver-assistance systems were used.
3.4. Independent Variables
We implemented a 3×2 within-subject design with three different scenarios on a three-lane highway (Figure 4), each with and without a marked AV. In all trials, participants started from a highway rest area and drove manually on a highway at a maximum speed of 130 km/h. The participants were instructed to adhere to the German highway regulations, in particular driving in the right lane, except when overtaking. To keep participants in the right lane, we implemented a high traffic density with a speed of 144 km/h in the middle lane at the beginning of all scenarios.
After a short time, an AV appeared in front of the participants in the right lane. The AV was either marked as such or looked like a manual vehicle. In all scenarios, the AV adhered strictly to the highway regulations and stayed in the right lane in front of participants. The appearance of the AV indicated the beginning of one of three different scenarios (Figure 4).
3.4.1. Scenarios
Roadworks
Participants drove through roadworks where a speed limit of 60 km/h was applicable. The scenario started at the end of the roadworks. There was no sign to inform drivers that the 60 km/h limit no longer applied. Therefore, the AV remained at 60 km/h, whilst all vehicles in the other lanes accelerated to 100 km/h (Figure 4a).
Traffic Jam
During the second scenario, a traffic jam occurred on the highway. The vehicles drove at a speed of 30 km/h in the left lane and in the middle lane. The vehicles in the middle lane used the large gaps to cut in front of the AV. The AV had a speed range of 15 to 40 km/h while maintaining a minimum gap of 5 seconds to the vehicles cutting in. Since the ego vehicle drove behind the AV, the participant had to brake in accordance with the AV (Figure 4b).
Lane Change
The AV used the indicator to signal to change lanes from the right to the middle lane in the third scenario. The vehicles on the middle lane were traveling at a speed of 130 km/h, and at 140 km/h in the left lane. However, the gaps between the vehicles on the target track were too small for the AV’s algorithm to conduct a lane change and the AV stayed in the right lane. As a result, the AV drove at a varying speed of between 110 and 120 km/h (Figure 4c).
3.4.2. Marking the AV
In every scenario, a different vehicle type was used, so that participants could not recognize the AV immediately (Figure 5). The vehicle size was kept as constant as possible and the vehicle colors were kept unobtrusive (Figure 5). The participants experienced all scenarios with and without a marked AV. We marked the AV with a cyan LED strip in the upper part of the rear window that was visible to the participant when they followed the AV (Figure 1 and Figure 5) [11,18,20,21]. We used an LED strip since it is less costly and easier to integrate into common commercial vehicles, compared to display or projection systems.
3.5. Dependent Variables
3.5.1. Subjective Data
The questionnaire was divided into three parts. In the first part, we surveyed demographic information such as age, sex, kilometers driven per year and the attitude towards the development of AVs on a five-point Likert scale (1 = very positive to 5 = very negative).
The second part of the questionnaire comprised five questions and was repeated after each trial. The first question asked about the surrounding traffic (Did you notice anything particularly positive or negative about the surrounding traffic?). With these questions, we aimed to find out whether participants recognized any different driving behavior in scenarios where the AV is not marked. The next questions enquired about conformity to the participants’ expectations (Did the vehicle in front behave as you would have expected? and How should the vehicle have behaved to meet your expectations?). In addition, two further items were rated on a five-point Likert scale to investigate the driving behavior of the vehicle in front. With the first item, we measured, with regard to rationality, the perceived appropriateness of the driving behavior (How appropriate was the driving behavior of the vehicle in front?; 1 = inappropriate to 5 = appropriate) [31]. With the second item, we measured, with regard to emotionality, the perceived disturbance caused by the vehicle in front (How disturbing was the driving behavior of the vehicle in front?; 1 = disturbing to 5 = not disturbing) [31].
After all trials―in order to compare the objective driving data with the subjective perception―we asked the participants how they reacted when the vehicle in front was marked as an AV. In addition, we wanted to find out how people would react in real traffic situations. Therefore, we asked participants how they would behave in real traffic if they were to encounter an AV (which behaved as experienced in the simulation). Finally, we evaluated whether and for what reasons human drivers would like AVs to be marked as such.
3.5.2. Objective Data
We counted the number of lane changes conducted by the participants in overtaking the AV. The time between the start of the scenario and the completion of the lane change was calculated, to assess whether the AV’s marking led to earlier overtaking. The lane change was considered to be completed when the vehicle’s center of gravity crossed the lane marking.
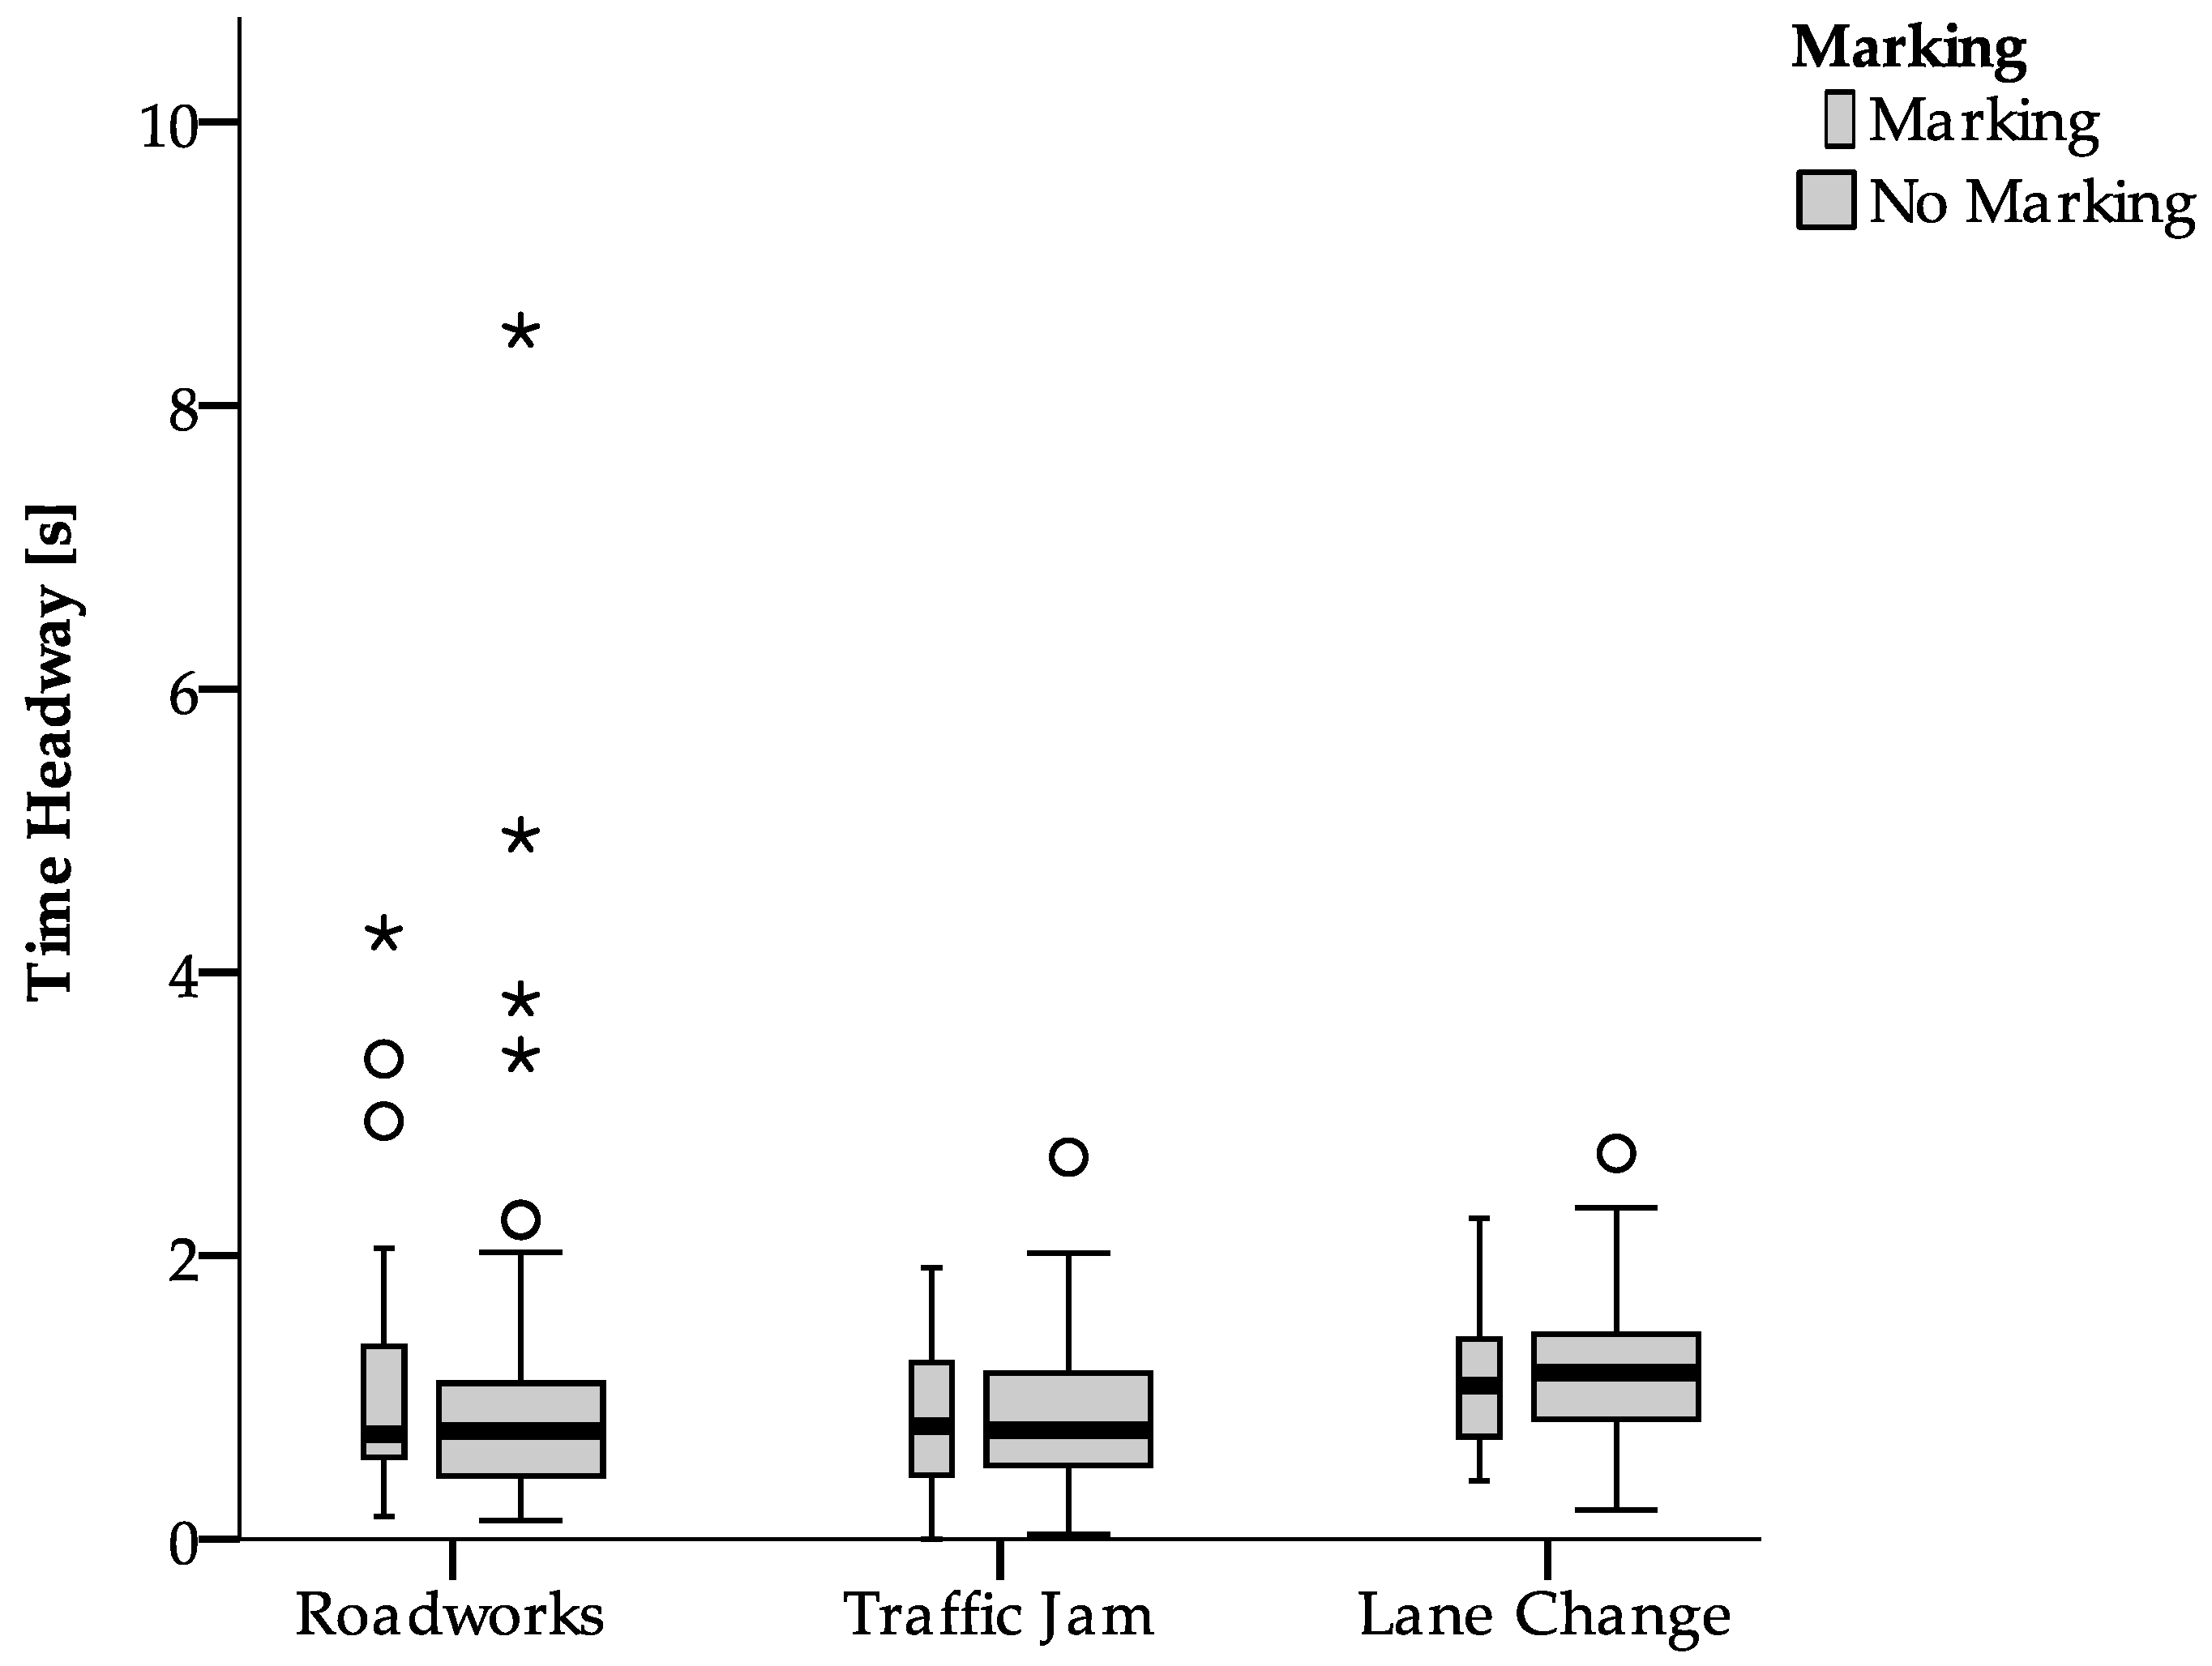
To evaluate whether participants kept a greater safety gap to the AV, the minimum time headway (THW) of each participant was calculated for the period that the participant followed the AV in the same lane. THW is calculated using the distance of the AV to the human driver (xAV-EGO) and the speed of the driver (vEGO) according to [32], see Equation (1).
3.6. Participants
Altogether, 40 participants were recruited via postings at the Technical University of Munich and received compensation. This sample did not consist of the driving instructors from the preliminary study. Due to simulation sickness, we had to exclude two participants. In total, we analyzed 38 participants (24 male, 14 female) with a mean age of 29.63 years (SD = 9.58 years). The participants had had their driver’s license for an average of 12.13 years (SD = 9.37 years) and drove on average 7997.37 km per year (SD = 7535.95 km per year). Their attitude towards AVs was rather positive (Mdn = 2). This attitude was based, among other things, on the expectation of increasing road safety, improved traffic flow, and more comfort, but also on personal enthusiasm for the topic (Figure 6).
3.7. Analysis
We had some lags in the simulation, especially in the Traffic Jam scenario. Due to the technical problems, we had to exclude 20 trials from the subjective data and 25 trials from the objective data. In total, 208 trials were analyzable. Data were analyzed using Matlab, SPSS, and Excel. The Bonferroni correction was used for all statistical tests and the p-values were compared with a corrected alpha of 0.017.
The subjective data were ordinal scaled variables. Hence, two non-parametric Wilcoxon tests were calculated for both dependent questionnaire items.
The time elapsed until participants changed lanes in the Roadworks scenario is not normally distributed (marking: W(27) = 0.91, p = 0.02, no marking: W(24) = 0.88, p ≤ 0.01). However, for the Traffic Jam scenario, the time elapsed until participants changed lanes is normally distributed (marking: W(14) = 0.88, p = 0.06, no marking: W(15) = 0.90, p = 0.08). In addition, the Shaphiro–Wilk test showed no significant departure from normality for the time elapsed until participants changed lanes in the Lane Change scenario (marking: W(16) = 0.95, p = 0.47, no marking: W(15) = 0.90, p = 0.09). As a result, we calculated one Wilcoxon test for the Roadworks scenario, and two t-tests for the other two scenarios.
The Shaphiro–Wilk test showed a significant departure from normality for the THW in the Roadworks scenario (marking: W(37) = 0.78, p ≤ 0.001, no marking: W(38) = 0.61, p ≤ 0.001). The THW for the Traffic Jam scenario (marking: W(29) = 0.94, p = 0.12, no marking: W(27) = 0.92, p = 0.05), and the THW for the Lane Change scenario are normally distributed (marking: W(36) = 0.97, p = 0.31, no marking: W(36) = 0.96, p = 0.13). Therefore, we calculated one Wilcoxon test for the Roadworks scenario, and two Wilcoxon tests for the other two scenarios.
The open questionnaire items were evaluated descriptively.
4. Results
4.1. Subjective Data
We wanted to find out, whether marking an AV influences drivers. However, we found no significant differences for the item How appropriate was the driving behavior of the vehicle in front? (Roadworks: z = −0.26, p = 0.79, n = 37; Traffic Jam: z = −1.00, p = 0.32, n = 25; Lane Change: z = −0.76, p = 0.45, n = 38; Figure 7), and for the item How disturbing was the driving behavior of the vehicle in front? (Roadworks: z = −0.94, p = 0.35, n = 37; Traffic Jam: z = −1.36, p = 0.17, n = 25; Lane Change: z = −0.34, p = 0.73, n = 38; Figure 8).
In addition, the open questions illustrated that marking the vehicle does not affect the perception of the surrounding vehicles. For the Roadworks scenario, participants expressed incomprehension that the vehicle in front drove with only 60 km/h even after the roadworks. The vehicle in the Traffic Jam scenario was criticized for letting other vehicles merge in front of it. For the last scenario, Lane Change, participants mentioned that the vehicle flashed but did not change lanes and that the vehicle lost speed trying to change lanes. For all scenarios, the aspects were named with and without a marking of the vehicle in front.
Moreover, no descriptive differences were found for the expected driving behavior between the scenarios where the AV is marked or not (Table 1). For the Roadworks scenario, participants expected the perceived AV’s driving behavior in 48% (marking: 46%, no marking: 50%) of all cases. Over 60% of all participants wished that the AV would have accelerated again after the Roadworks, regardless of the marking. One participant in the Roadworks scenario with the marked vehicle and two participants in the analogous scenario with the unmarked vehicle mentioned that the AV drove as expected because of the lack of the appropriate road sign. For the Traffic Jam scenario, nearly 76% of all participants (marking: 81%, no marking: 70%) expected the driving behavior. Those who had expected other driving behavior wished for a smoother driving style without letting as many vehicles merge. For the Lane Change scenario, only 26% (marking: 32%, no marking: 21%) of all participants expected the observed AV’s driving behavior. Regardless of the marking of the vehicle, 80% wanted the AV to change lane or to switch off the indicators (27%) and accelerate once again (18%).
However, even if the marking had no influence on subject’s ratings, 66% would prefer AVs to be marked (Figure 9). The other 34% do not want the vehicle to be directly identified as automated (Figure 9). Participants preferring AVs to be marked argued that it is easier to assess the AV’s driving behavior (41%) and to adapt their own behavior to the new road user (e.g., greater gaps, increased attention; 22%). Another 15% would like to have marking in order to increase acceptance, and 15% mentioned that the AV is a role model, because it complies with the German highway regulations. In addition, 7% would like markings only as additional information. Reasons mentioned against marking the AV include that it is a normal road user (20%) and should not attract attention (33%). Another 27% mentioned that the potential for abuse is too high due to the marking and 20% were afraid that the uncertainty in road traffic will become too great (Figure 9).
At the end of the study, we asked participants how they reacted when seeing an AV in the simulation. Altogether, 50% of all participants mentioned that they behaved as usual, whereas others raised their attention levels (10%), drove more carefully (8%), and/or kept a greater distance (5%). Another 8% had higher confidence in the vehicle, because it adheres to German highway regulations (Figure 10).
Nevertheless, in real traffic, only 18% of all participants said they would behave “normally”. Another 24% would drive more carefully, 16% would raise their attention level, and 14% would keep a greater distance and drive more defensively. Another 14% said they would follow the vehicle and orientate themselves to the driving behavior of the AV, because it adheres to German highway regulations. However, another 8% would overtake the AV quickly and 6% would behave in a more risky manner than usual, because the AV drives in an error-free way (Figure 10).
4.2. Objective Data
Altogether, participants changed lanes in 55% of all trials. The most lane changes happened in the scenario Roadworks (marking: 73%, no marking: 63%), followed by Traffic Jam (marking: 48%, no marking: 56%), and Lane Change (marking: 44%, no marking: 42%; Table 2). However, we found no tendency that marking the AV influences the frequency of lane changes on a descriptive level (Table 2). We also found no significant differences in the time elapsed until the lane change was conducted (Roadworks: z = −1.48, p = 0.14, n = 21; Traffic Jam: t(10) = −1.26, p = 0.24; Lane Change: t(8) = −0.21, p = 0.84; Figure 11). In addition, the presence of markings had no significant influence on the THW in any of the three scenarios (Roadworks: z = −0.52, p = 0.60, n = 37; Traffic Jam: t(24) = −0.16, p = 0.88; Lane Change: t(34) = −0.54, p = 0.59; Figure 12).
5. Discussion
The aim of the study was to determine the influence of marking AVs on human drivers in three scenarios, in order to deduce whether markings should be implemented for AVs.
The results illustrate that marking AVs does not influence the driving behavior of human drivers and their subjective rating. This confirms the results of Kühn, Stange and Vollrath [8]. It is possible that the driving behavior itself is sufficiently informative in order to be able to recognize an AV. This is also consistent with the statements of Kühn et al. [8], who mentioned that drivers have a fairly accurate idea of how AVs will behave in situations on highways where interaction with other HRUs is required. Another aspect could be that drivers can deal with ambiguous driving strategies of other drivers and have already learned to compensate for such behavior by, for example, increasing the gap to the vehicle in front or by overtaking. Rodríguez Palmeiro [10] already stated that the driving behavior of the AV is more important than external signs in pedestrians’ deciding whether or not to cross the road.
Although no significant differences were found in participants’ ratings, the majority of participants preferred the AV to be marked. Due to the marking, they could assess the AV’s driving behavior and adapt their own driving behavior accordingly. In addition, most participants mentioned that they behaved normally in the simulation, but when encountering an AV in real traffic, they would behave more carefully with increased attention levels. Therefore, it can be assumed that a study involving encounters with AVs in real traffic might lead to different results.
However, this study only examined the encounter with a single AV in three selected scenarios. The drivers experienced the AV’s driving behavior in every scenario for the first time. Therefore, it might be difficult to adapt their driving behavior to the AV without knowing what the AV is going to do next. It is reasonable to assume that an adjustment of human driving behavior would take place in the event of their repeated encounters with AVs. This also explains the participants’ preference for marked AVs, as it enables drivers to recognize the AV at an early stage, and adapt their driving behavior accordingly. Therefore, it might be useful to investigate long-term effects in a further study. In addition, the effects of age and gender should be evaluated.
Besides the result that the marking had no influence, we found descriptive differences―dependent on the given scenario―for the number of lane changes and the time participants needed until they changed lanes. The Roadworks scenario showed the highest number of lane changes in the shortest time passed. This may be due to the large speed difference of the AV compared to the vehicles in the middle lane (60 to 100 km/h) in relation to the other scenarios (Traffic Jam: 15–40 km/h to 30 km/h; Lane Change: 110–120 km/h to 130 km/h). Based on these results, more scenarios should be investigated in future studies.
Due to technical issues in the Traffic Jam scenario, the simulation did not run smoothly, therefore participants’ driving behavior might be influenced. As a result, absolute values can only be interpreted with caution. Nevertheless, the comparison between the scenarios with and without a marking is still possible.
6. Conclusions
As a general conclusion, it can be stated that the marking of an AV made no differences to human drivers in terms of their driving behavior and their subjective ratings. It seems that drivers can compensate for AVs’ driving behavior, whereby they do not require the AV to be identified as such. Nevertheless, the participants indicate that they prefer to be able to distinguish AVs from other vehicles. However, this study did not address the long-term effects, which may affect the results, and should be investigated in future studies.
Author Contributions
Conceptualization, T.F., A.F. and E.S.; methodology, T.F. and A.F.; software, A.F.; validation, T.F. and A.F.; formal analysis, T.F. and A.F.; investigation, T.F. and A.F.; resources, T.F., A.F. and K.B.; data curation, T.F.; writing—original draft preparation, T.F. and A.F.; writing—review and editing, T.F., A.F., E.S. and K.B.; visualization, T.F. and A.F.; supervision, K.B. All authors have read and agreed to the published version of the manuscript.
Funding
This research received no external funding.
Acknowledgments
The authors thank Franz Daisenberger for conducting the study.
Conflicts of Interest
The authors declare no conflict of interest.
References
- BMW Group. BMW Group’s Driver Assistance and Autonomous Driving Development Department under New Leadership. Alejandro Vukotich Takes Over at the Helm, Elmar Frickenstein to Retire after Handover Phase. Available online: https://www.press.bmwgroup.com/africa-dom-easteurope/article/detail/T0288264EN/bmw-group%E2%80%99s-driver-assistance-and-autonomous-driving-development-department-under-new-leadership-alejandro-vukotich-takes-over-at-the-helm-elmar-frickenstein-to-retire-after-handover-phase?language=en (accessed on 3 May 2019).
- SAE International. Taxonomy and Definitions for Terms Related to Driving Automation Systems for On-Road Motor Vehicles (J3016); SAE International: Warrendale, PA, USA, 2018. [Google Scholar]
- Schmidt, H.; Terwilliger, J.; AlAdawy, D.; Fridman, L. Hacking Nonverbal Communication between Pedestrians and Vehicles in Virtual Reality. arXiv 2019, arXiv:1904.01931. [Google Scholar]
- Färber, B. Communication and Communication Problems between Autonomous Vehicles and Human Drivers. In Autonomous Driving; Springer: Berlin/Heidelberg, Germany, 2016; pp. 125–144. [Google Scholar]
- Federal Ministry of Justice and Consumer Protection. Durchführungsverordnung zum Fahrlehrergesetz. Available online: https://www.gesetze-im-internet.de/fahrlg2018dv/BJNR000210018.html (accessed on 27 May 2020). (In German)
- Federal Ministry for Digital and Economic Affairs. L17—Ausstattung des Ausbildungsfahrzeugs. Available online: https://www.oesterreich.gv.at/themen/dokumente_und_recht/fuehrerschein/1/2/Seite.040112.html (accessed on 16 January 2020). (In German)
- NZ Transport Agency. Conditions of a Learner Licence. Available online: https://www.nzta.govt.nz/driver-licences/getting-a-licence/licences-by-vehicle-type/cars/learners-licence/conditions-of-a-learner-licence/ (accessed on 28 January 2020).
- Kühn, M.; Stange, V.; Vollrath, M. Menschliche Reaktion auf hochautomatisierte Fahrzeuge im Mischverkehr auf der Autobahn. In VDI Tagung Mensch-Maschine-Mobilität 2019—Der (Mit-) Fahrer im 21. Jahrhundert!? VDI Verlag: Düsseldorf, Germany, 2019; pp. 169–184. (In German) [Google Scholar]
- Joisten, P.; Alexandi, E.; Drews, R.; Klassen, L.; Petersohn, P.; Pick, A.; Schwindt, S.; Abendroth, B. Displaying Vehicle Driving Mode—Effects on Pedestrian Behavior and Perceived Safety. In Human Systems Engineering and Design II; Ahram, T., Karwowski, W., Pickl, S., Taiar, R., Eds.; Springer International Publishing: Cham, Switzerland, 2020; pp. 250–256. ISBN 978-3-030-27927-1. [Google Scholar]
- Rodríguez Palmeiro, A. Interaction between pedestrians and Wizard of Oz automated vehicles. Master’s Thesis, Delft University of Technology, Delft, The Netherlands, 2017. [Google Scholar]
- Faas, S.M.; Mathis, L.-A.; Baumann, M. External HMI for self-driving vehicles: Which information shall be displayed? Transp. Res. Part F Traffic Psychol. Behav. 2020, 68, 171–186. [Google Scholar] [CrossRef]
- Bengler, K.; Rettenmaier, M.; Fritz, N.; Feierle, A. From HMI to HMIs: Towards an HMI Framework for Automated Driving. Information 2020, 11, 61. [Google Scholar] [CrossRef] [Green Version]
- Weber, F.; Chadowitz, R.; Schmidt, K.; Messerschmidt, J.; Fuest, T. Crossing the Street across the Globe: A Study on the Effects of eHMI on Pedestrians in the US, Germany and China. In Human-Computer Interaction in Mobility, Transport, and Automotive Systems; Krömker, H., Ed.; Springer International Publishing: Cham, Switzerland, 2019; pp. 515–530. ISBN 978-3-030-22665-7. [Google Scholar]
- Hensch, A.-C.; Neumann, I.; Beggiato, M.; Halama, J.; Krems, J.F. How Should Automated Vehicles Communicate?—Effects of a Light-Based Communication Approach in a Wizard-of-Oz Study. In Advances in Human Factors of Transportation; Stanton, N., Ed.; Springer International Publishing: Cham, Switzerland, 2020; pp. 79–91. ISBN 978-3-030-20502-7. [Google Scholar]
- Song, Y.E.; Lehsing, C.; Fuest, T.; Bengler, K. External HMIs and Their Effect on the Interaction between Pedestrians and Automated Vehicles. In Intelligent Human Systems Integration; Karwowski, W., Ahram, T., Eds.; Springer International Publishing: Cham, Switzerland, 2018; pp. 13–18. ISBN 978-3-319-73887-1. [Google Scholar]
- Rettenmaier, M.; Pietsch, M.; Schmidtler, J.; Bengler, K. Passing through the Bottleneck—The Potential of External Human-Machine Interfaces. In Proceedings of the 2019 IEEE Intelligent Vehicles Symposium (IV), Paris, France, 9–12 June 2019; pp. 1687–1692, ISBN 978-1-7281-0560-4. [Google Scholar]
- De Clercq, K.; Dietrich, A.; Velasco, J.P.N.; De Winter, J.C.F.; Happee, R. External Human-Machine Interfaces on Automated Vehicles: Effects on Pedestrian Crossing Decisions. Hum. Factors 2019, 61, 1353–1370. [Google Scholar] [CrossRef] [PubMed] [Green Version]
- Dietrich, A.; Willrodt, J.-H.; Wagner, K.; Bengler, K. Projection-Based External Human Machine Interfaces–Enabling Interaction between Automated Vehicles and Pedestrians. In Proceedings of the DSC Europe 2018 VR. Driving Simulation & Virtual Reality Conference & Exhibition, Antibe, France, 5–7 September 2018; pp. 43–50, ISBN 978-2-85782-734-4. [Google Scholar]
- Rettenmaier, M.; Albers, D.; Bengler, K. After you?!—Use of external human-machine interfaces in road bottleneck scenarios. Transp. Res. Part F Traffic Psychol. Behav. 2020, 70, 175–190. [Google Scholar] [CrossRef]
- Werner, A. New Colours for Autonomous Driving: An Evaluation of Chromaticities for the External Lighting Equipment of Autonomous Vehicles. Colour Turn 2019. [Google Scholar] [CrossRef]
- SAE International. Automated Driving System (ADS) Marker Lamp; SAE International: Warrendale, PA, USA, 2019. [Google Scholar]
- Böckle, M.-P.; Brenden, A.P.; Klingegård, M.; Habibovic, A.; Bout, M. SAV2P—Exploring the Impact of an Interface for Shared Automated Vehicles on Pedestrians’ Experience. In Proceedings of the 9th International Conference on Automotive User Interfaces and Interactive Vehicular Applications Adjunct (Automotive UI ’17), Oldenburg, Germany, 24–27 September 2017; Löcken, A., Boll, S., Politis, I., Osswald, S., Schroeter, R., Large, D., Baumann, M., Alvarez, I., Chuang, L., Feuerstack, S., et al., Eds.; ACM Press: New York, NY, USA, 2017; pp. 136–140, ISBN 9781450351515. [Google Scholar]
- Eisma, Y.; Van Bergen, S.; Ter Brake, S.; Hensen, M.; Tempelaar, W.; De Winter, J.C.F. External human—Machine interfaces: The effect of display location on crossing intentions and eye movements. Information 2019, 11, 13. [Google Scholar] [CrossRef] [Green Version]
- Clamann, M.; Aubert, M.; Cummings, M.L. Evaluation of Vehicle-to-Pedestrian Communication Displays for Autonomous Vehicles. In Proceedings of the 96th Annual Transportation Research Board Meeting, Washington, DC, USA, 8–12 January 2017. [Google Scholar]
- Fuest, T.; Michalowski, L.; Traris, L.; Bellem, H.; Bengler, K. Using the Driving Behavior of an Automated Vehicle to Communicate Intentions—A Wizard of Oz Study. In Proceedings of the 2018 21st International Conference on Intelligent Transportation Systems (ITSC), Maui, HI, USA, 4–7 November 2018; pp. 3596–3601. [Google Scholar] [CrossRef]
- Fuest, T.; Maier, A.S.; Bellem, H.; Bengler, K. How Should an Automated Vehicle Communicate Its Intention to a Pedestrian?—A Virtual Reality Study. In Human Systems Engineering and Design II; Ahram, T., Karwowski, W., Pickl, S., Taiar, R., Eds.; Springer International Publishing: Cham, Switzerland, 2020; pp. 195–201. [Google Scholar] [CrossRef]
- Fuest, T.; Michalowski, L.; Schmidt, E.; Bengler, K. Reproducibility of Driving Profiles—Application of the Wizard of Oz Method for Vehicle Pedestrian Interaction. In Proceedings of the 2019 IEEE Intelligent Transportation Systems Conference (ITSC), Auckland, New Zealand, 27–30 October 2019; pp. 3954–3959. [Google Scholar] [CrossRef]
- Fuest, T.; Sorokin, L.; Bellem, H.; Bengler, K. Taxonomy of Traffic Situations for the Interaction between Automated Vehicles and Human Road Users. In Advances in Human Aspects of Transportation. AHFE 2017. Advances in Intelligent Systems and Computing; Stanton, N.A., Ed.; Springer International Publishing: Cham, Switzerland, 2018; Volume 597, pp. 708–719. [Google Scholar] [CrossRef]
- Würzburg Institute for Traffic Sciences GmbH. Driving Simulation and SILAB. Available online: https://wivw.de/en/silab (accessed on 14 April 2020).
- Technical University of Munich. Static Driving Simulator. Available online: https://www.mw.tum.de/en/lfe/research/labs/static-driving-simulator/ (accessed on 14 April 2020).
- Surges, F. Einfluss Hochautomatisiert Fahrender Fahrzeuge auf das Fahrverhalten und Die Einstellungen Manueller Fahrer im Mischverkehr; BASt (Bundesanstalt für Strassenwesen (Federal highway research institute))-Project: F1100.4318007. Available online: https://trid.trb.org/view/1576671 (accessed on 27 May 2020). (In German).
- Wachenfeld, W.; Winner, H. Do Autonomous Vehicles Learn. In Autonomous Driving; Maurer, M., Gerdes, J.C., Lenz, B., Winner, H., Eds.; Springer: Berlin/Heidelberg, Germany, 2016; pp. 451–471. [Google Scholar]
Figure 1.
Marked automated vehicle with a cyan LED strip in the upper part of the rear window in the driving simulation.
Figure 1.
Marked automated vehicle with a cyan LED strip in the upper part of the rear window in the driving simulation.

Figure 2.
Attitude towards the marking of driving school vehicles.

Figure 3.
Driving simulator of the Chair of Ergonomics at the Technical University of Munich [30].
Figure 3.
Driving simulator of the Chair of Ergonomics at the Technical University of Munich [30].
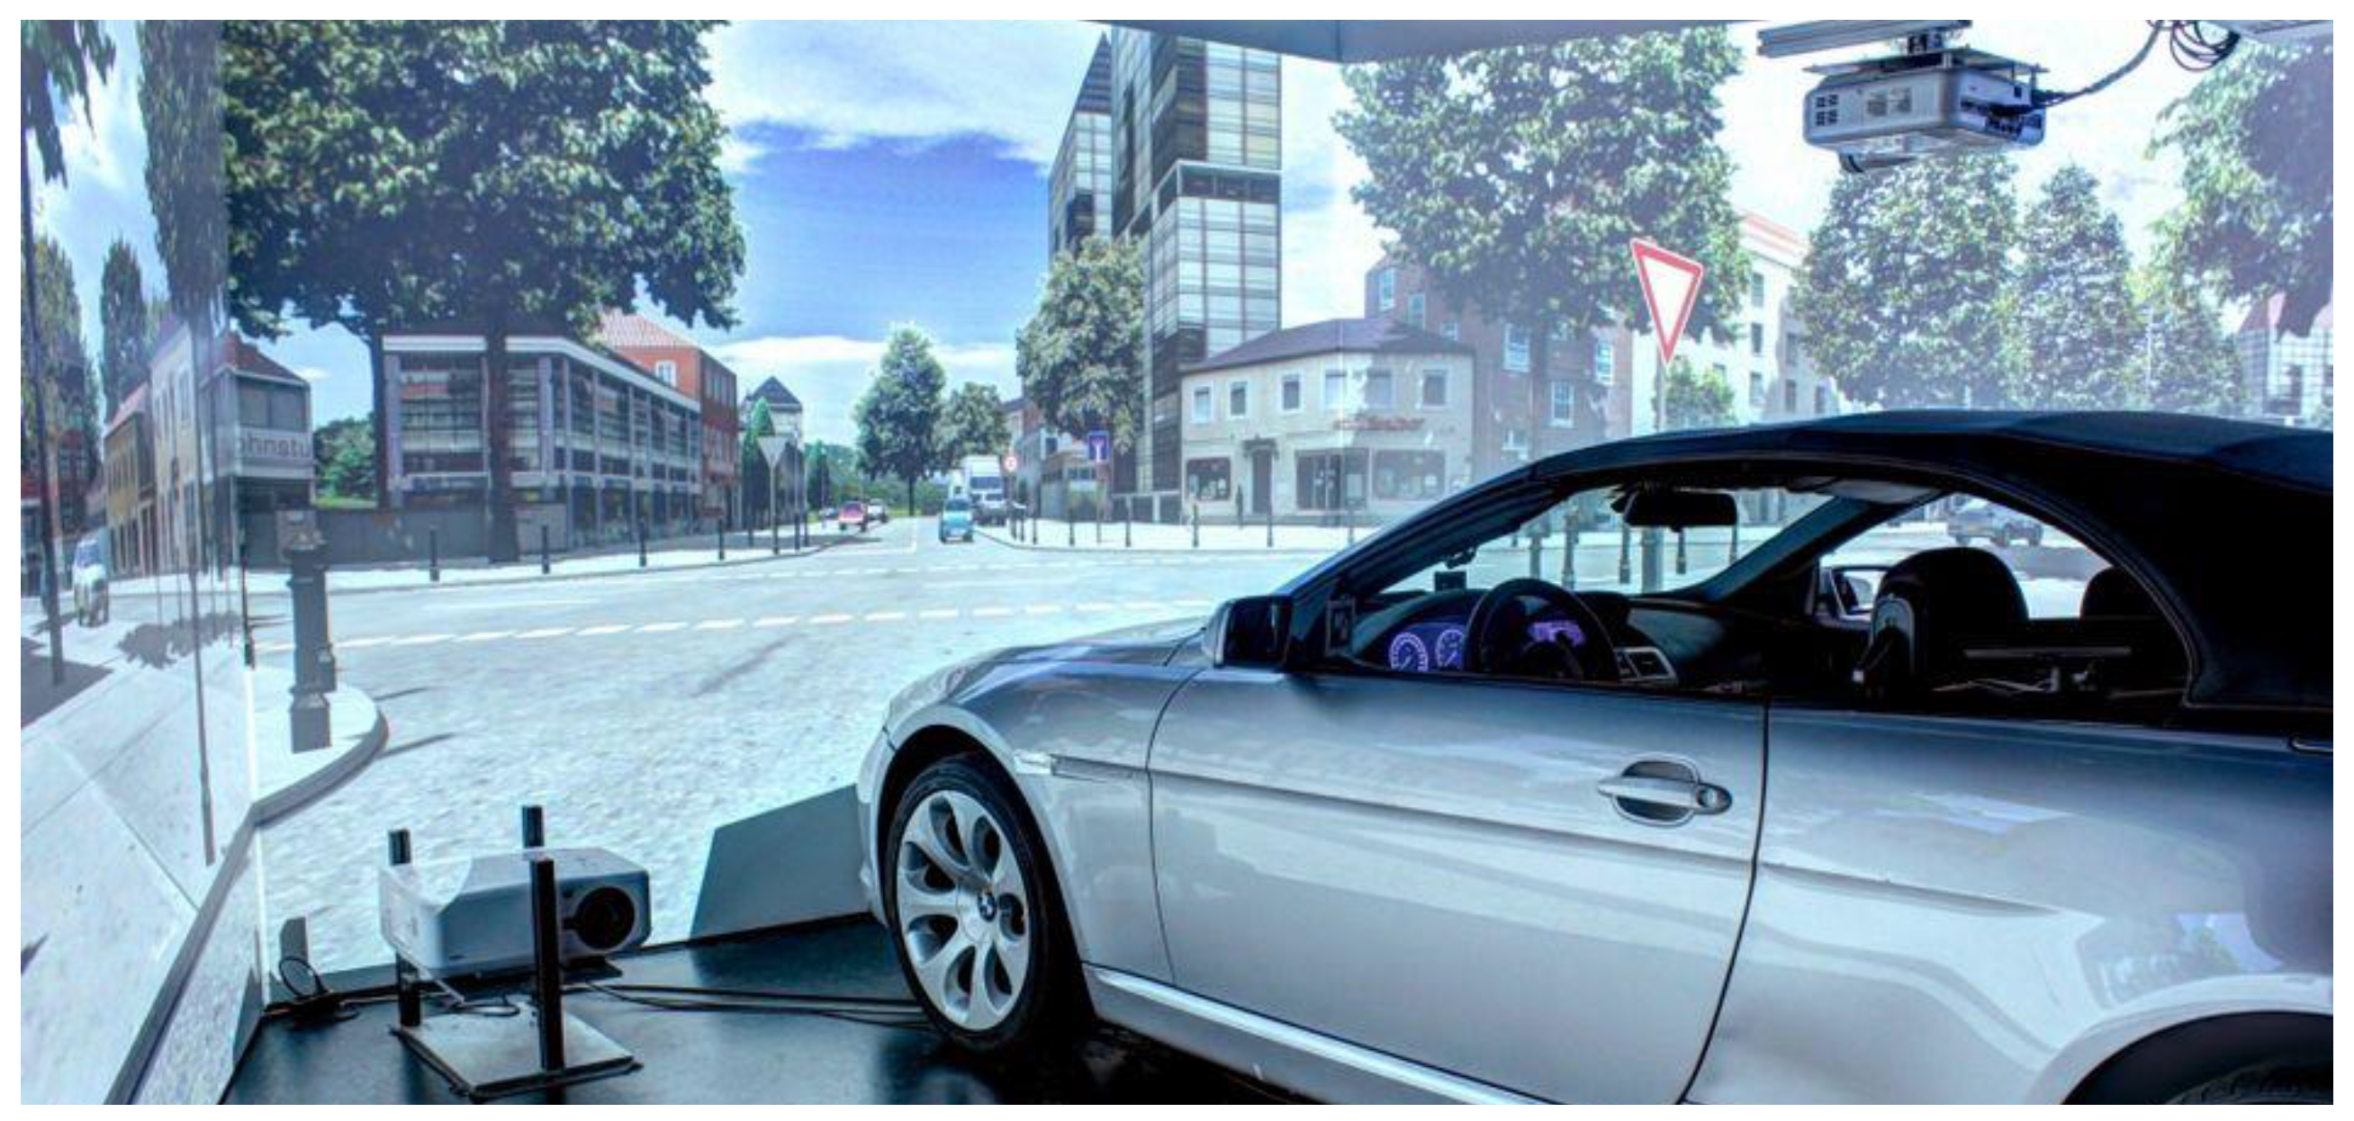
Figure 4.
Scenarios implemented in the driving simulation: (a) Roadworks, (b) Traffic Jam, (c) Lane Change.
Figure 4.
Scenarios implemented in the driving simulation: (a) Roadworks, (b) Traffic Jam, (c) Lane Change.

Figure 5.
Vehicle types and colors for the AV, with and without a marking.

Figure 6.
Attitude towards automated vehicles.
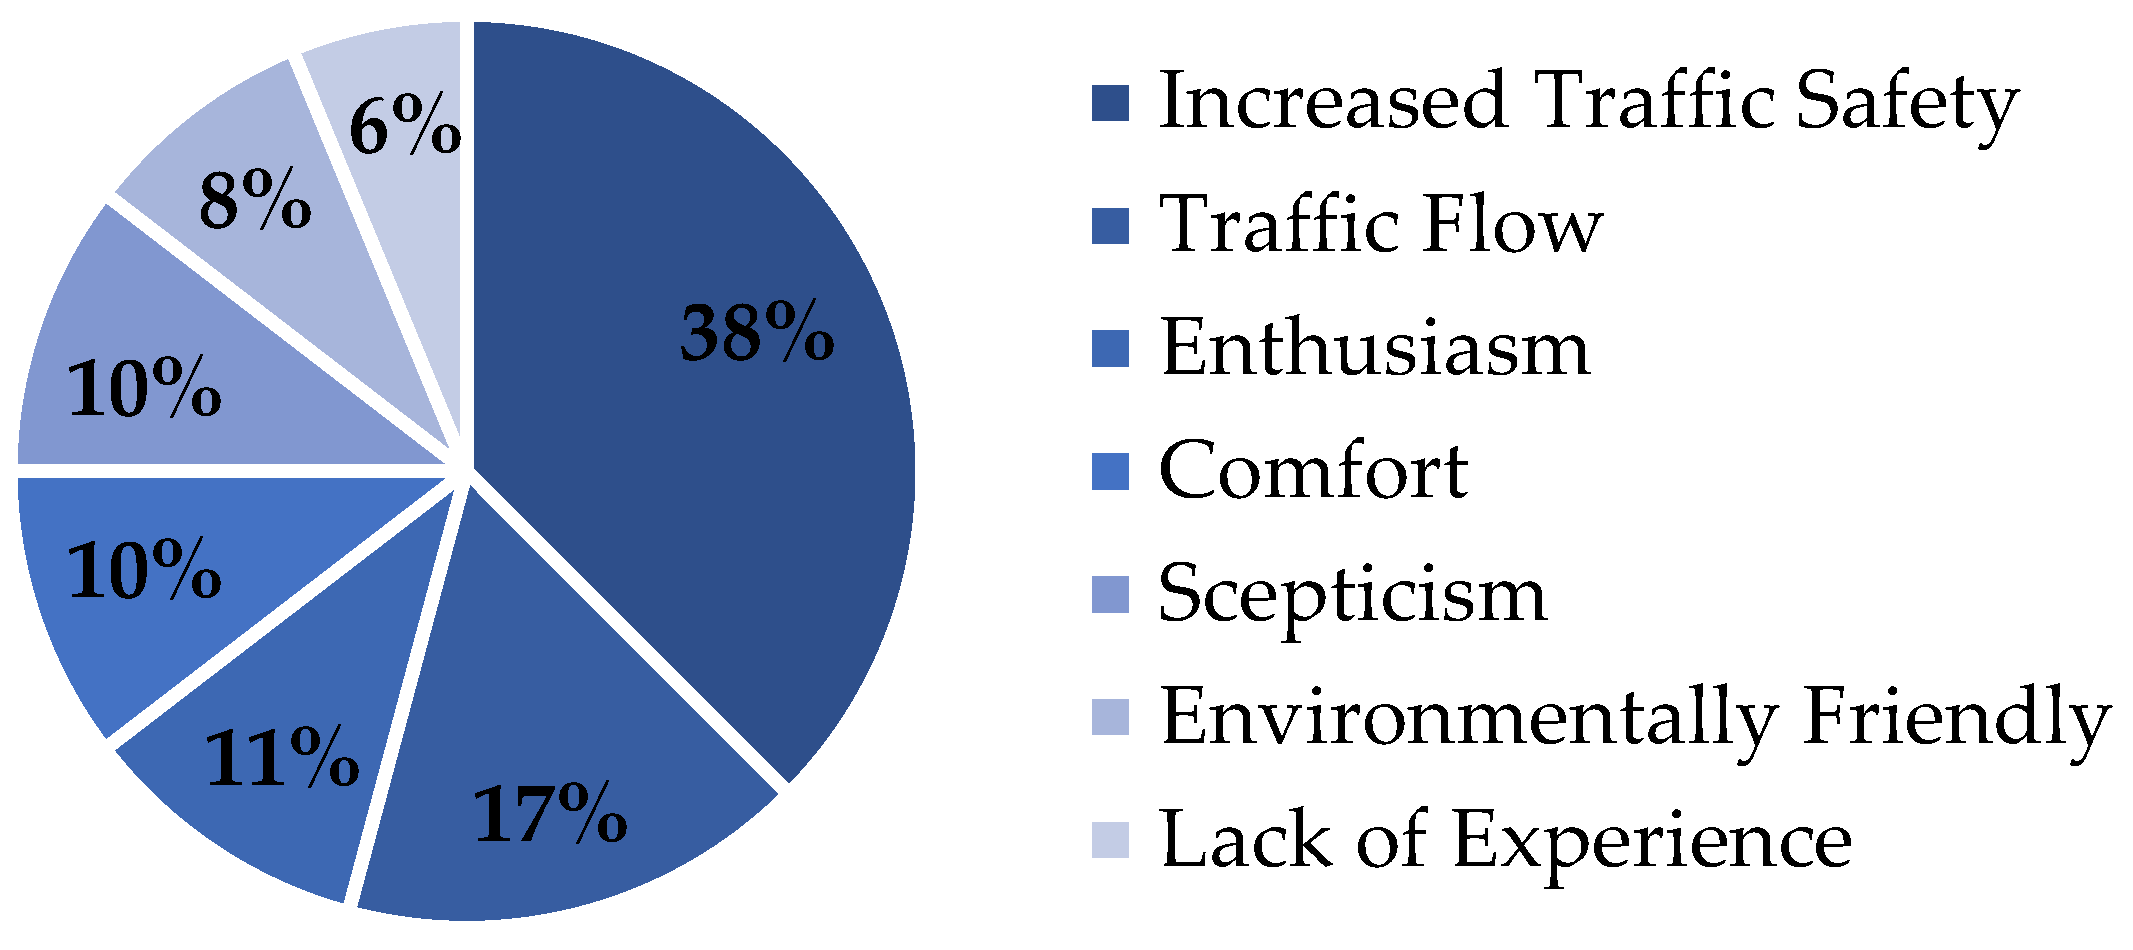
Figure 7.
Boxplot for the item How appropriate was the driving behavior of the vehicle in front?, segregated by situation and marking.
Figure 7.
Boxplot for the item How appropriate was the driving behavior of the vehicle in front?, segregated by situation and marking.
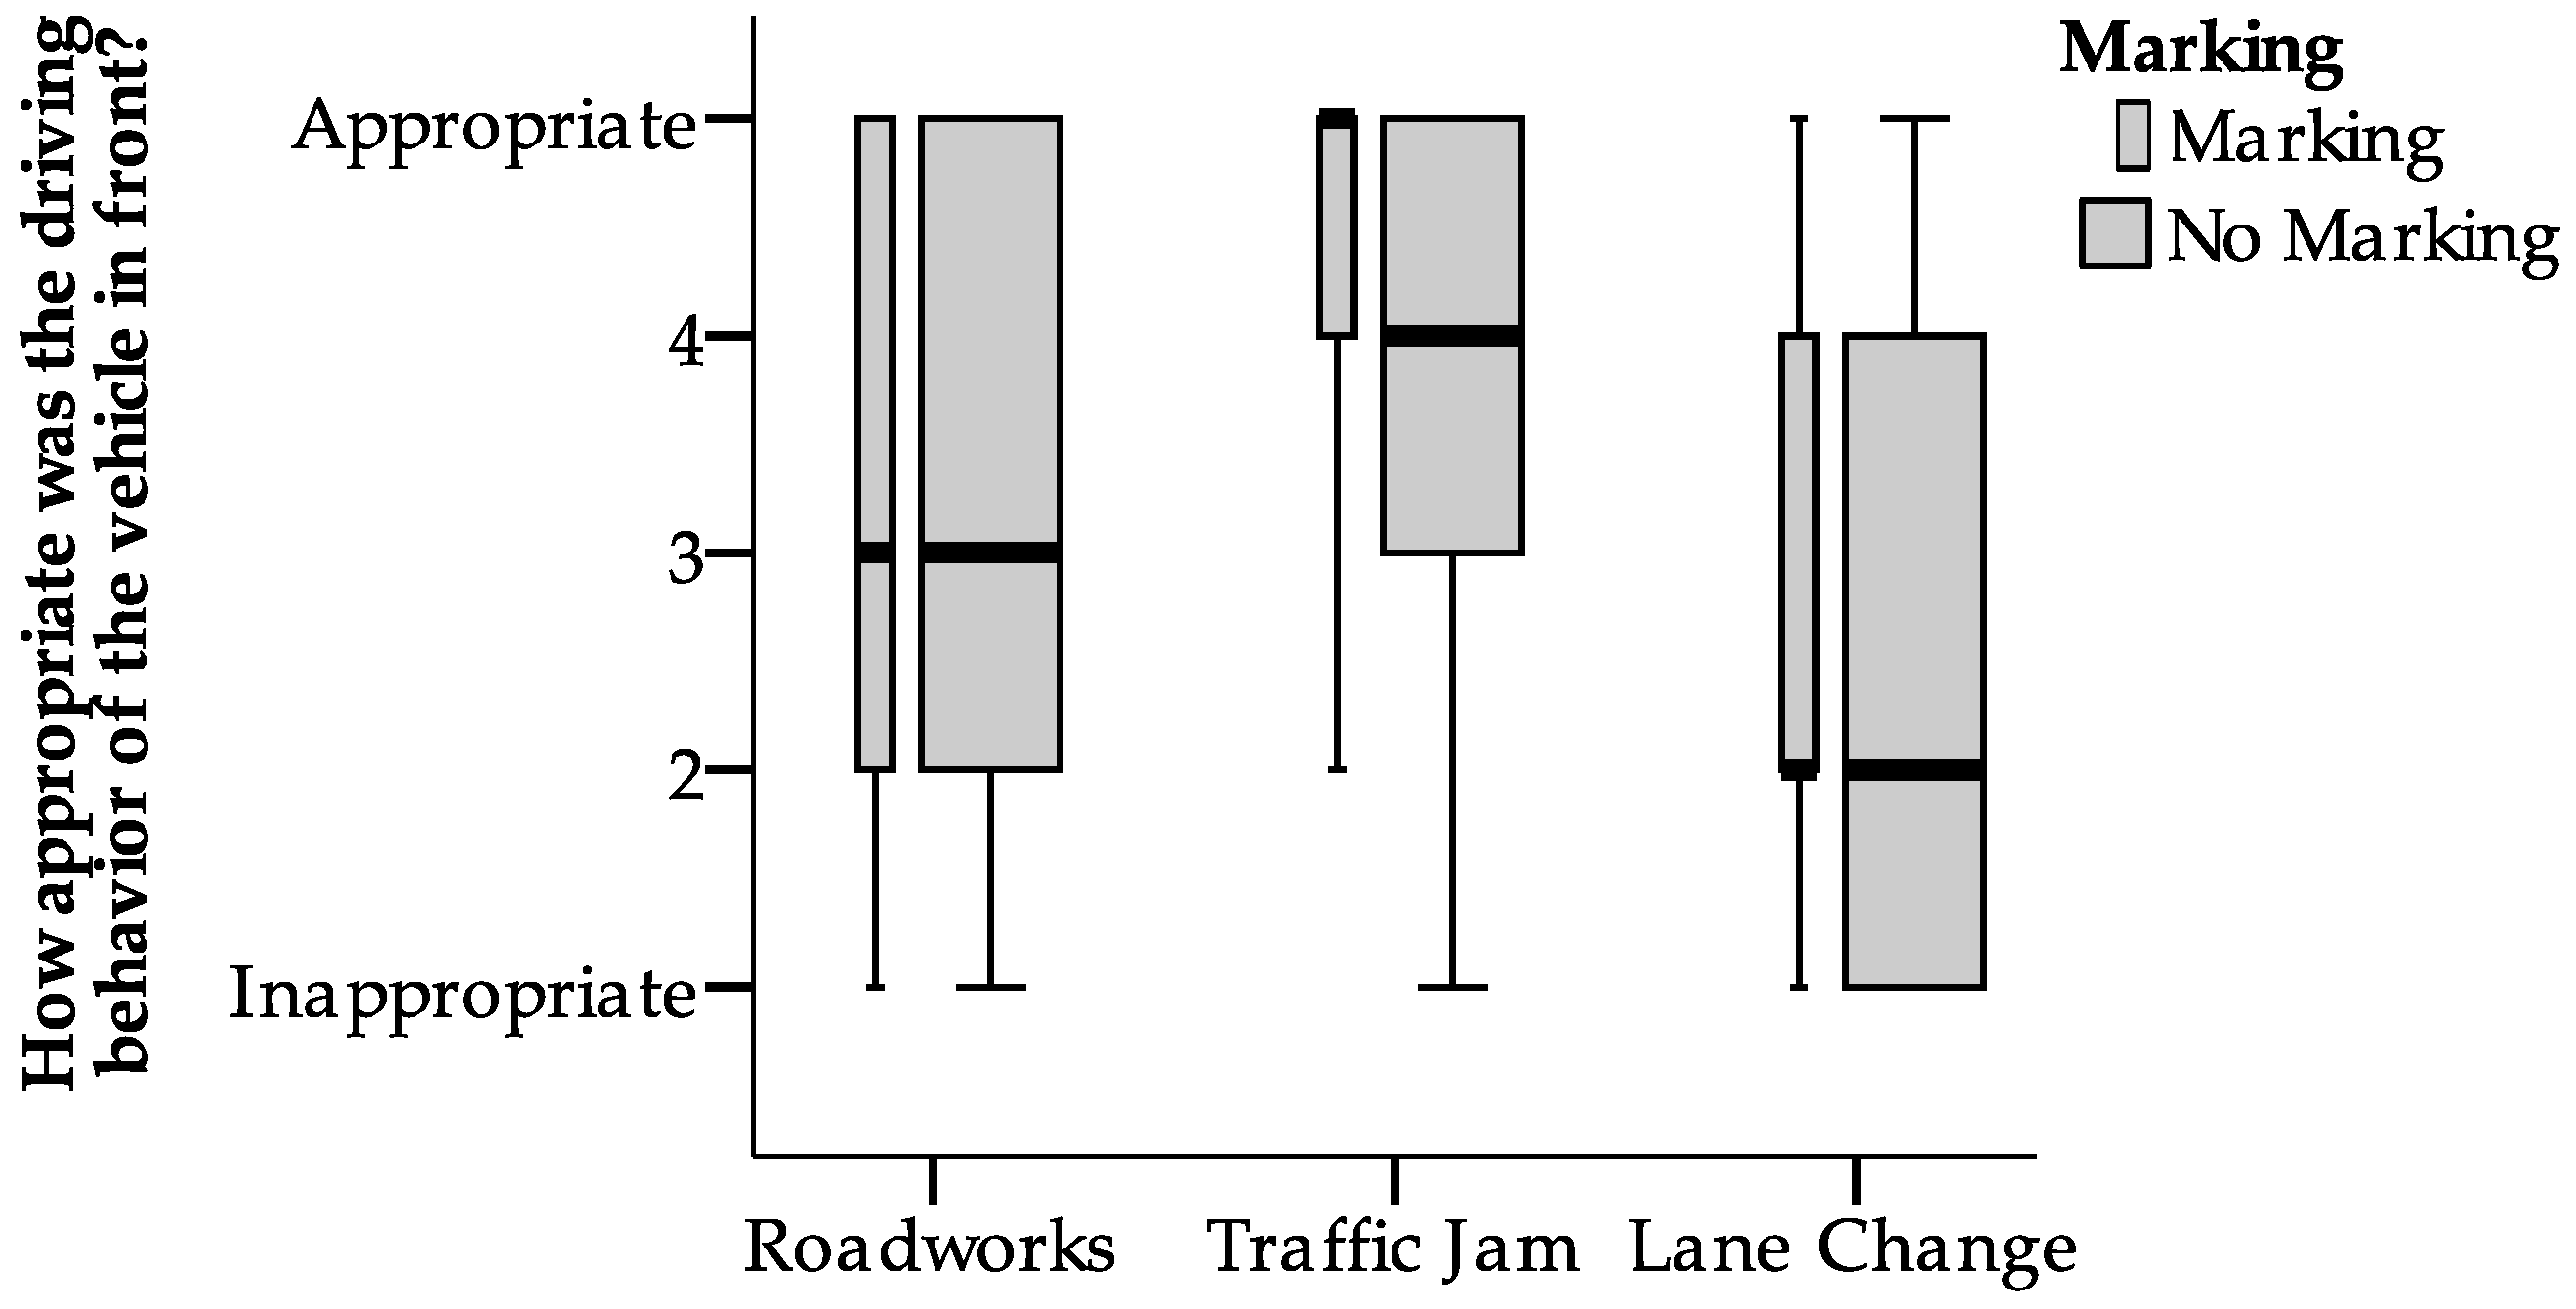
Figure 8.
Boxplot for the item How disturbing was the driving behavior of the vehicle in front?, segregated by situation and marking.
Figure 8.
Boxplot for the item How disturbing was the driving behavior of the vehicle in front?, segregated by situation and marking.

Figure 9.
Reasons for or against AV marking.
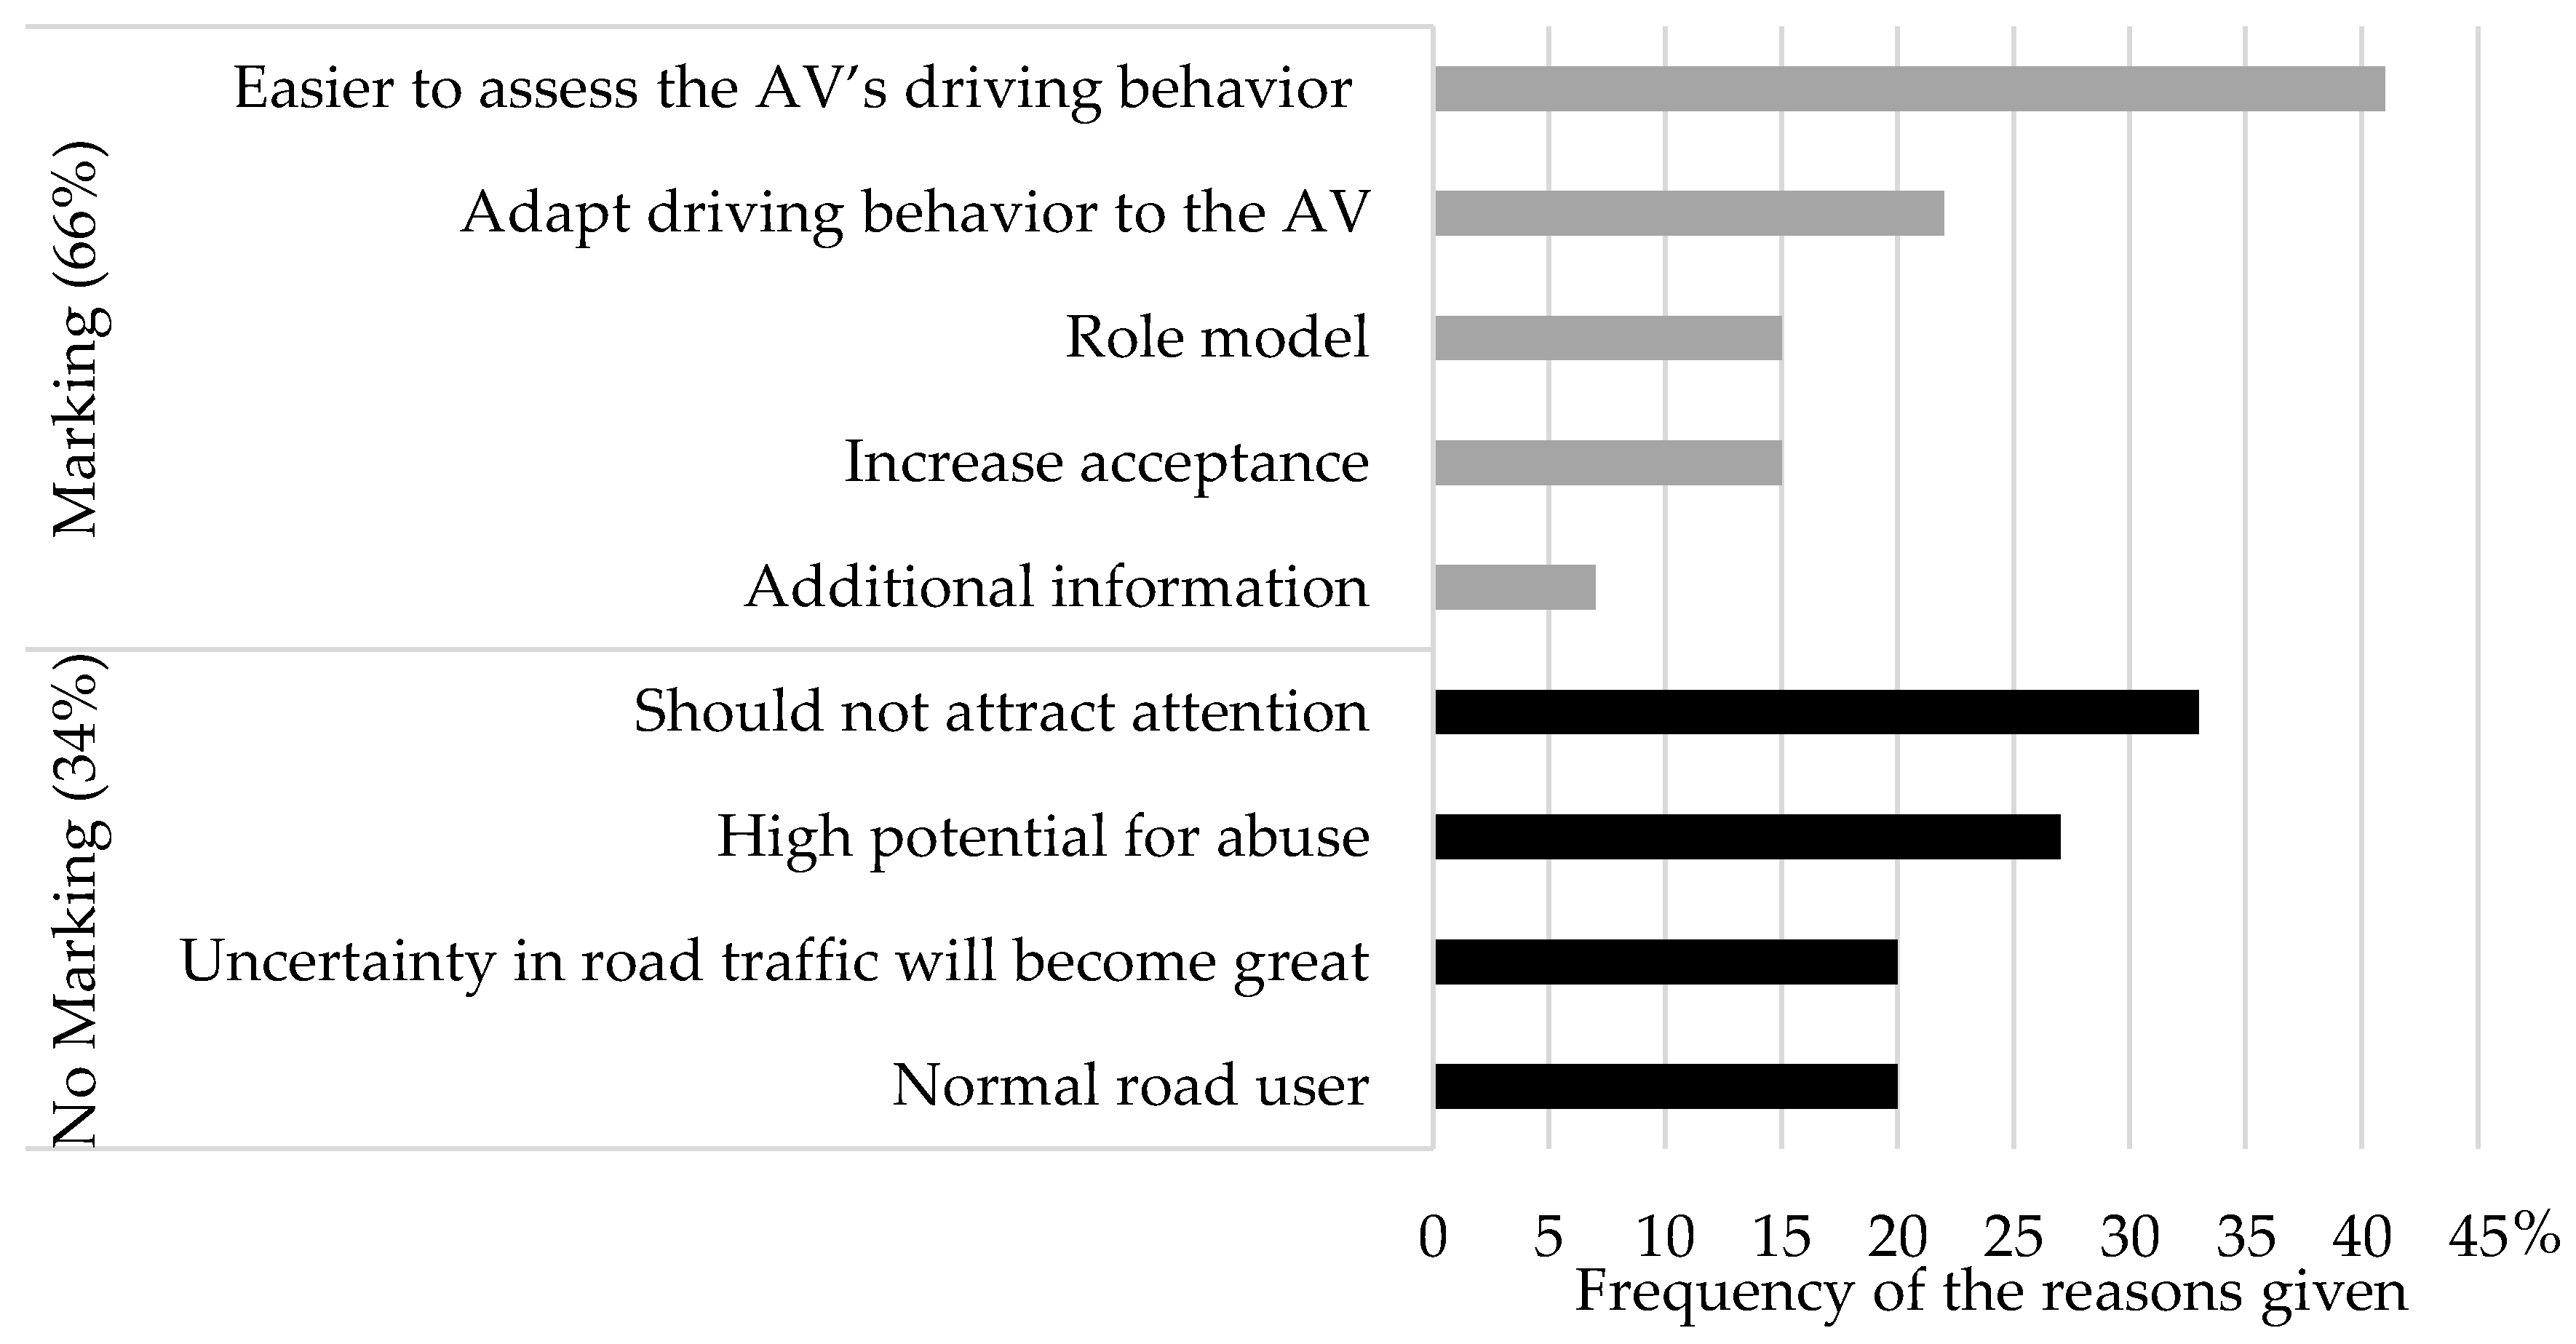
Figure 10.
Participants’ mentioned behavior in the driving simulation scenarios and assumed behavior in real-world scenarios.
Figure 10.
Participants’ mentioned behavior in the driving simulation scenarios and assumed behavior in real-world scenarios.
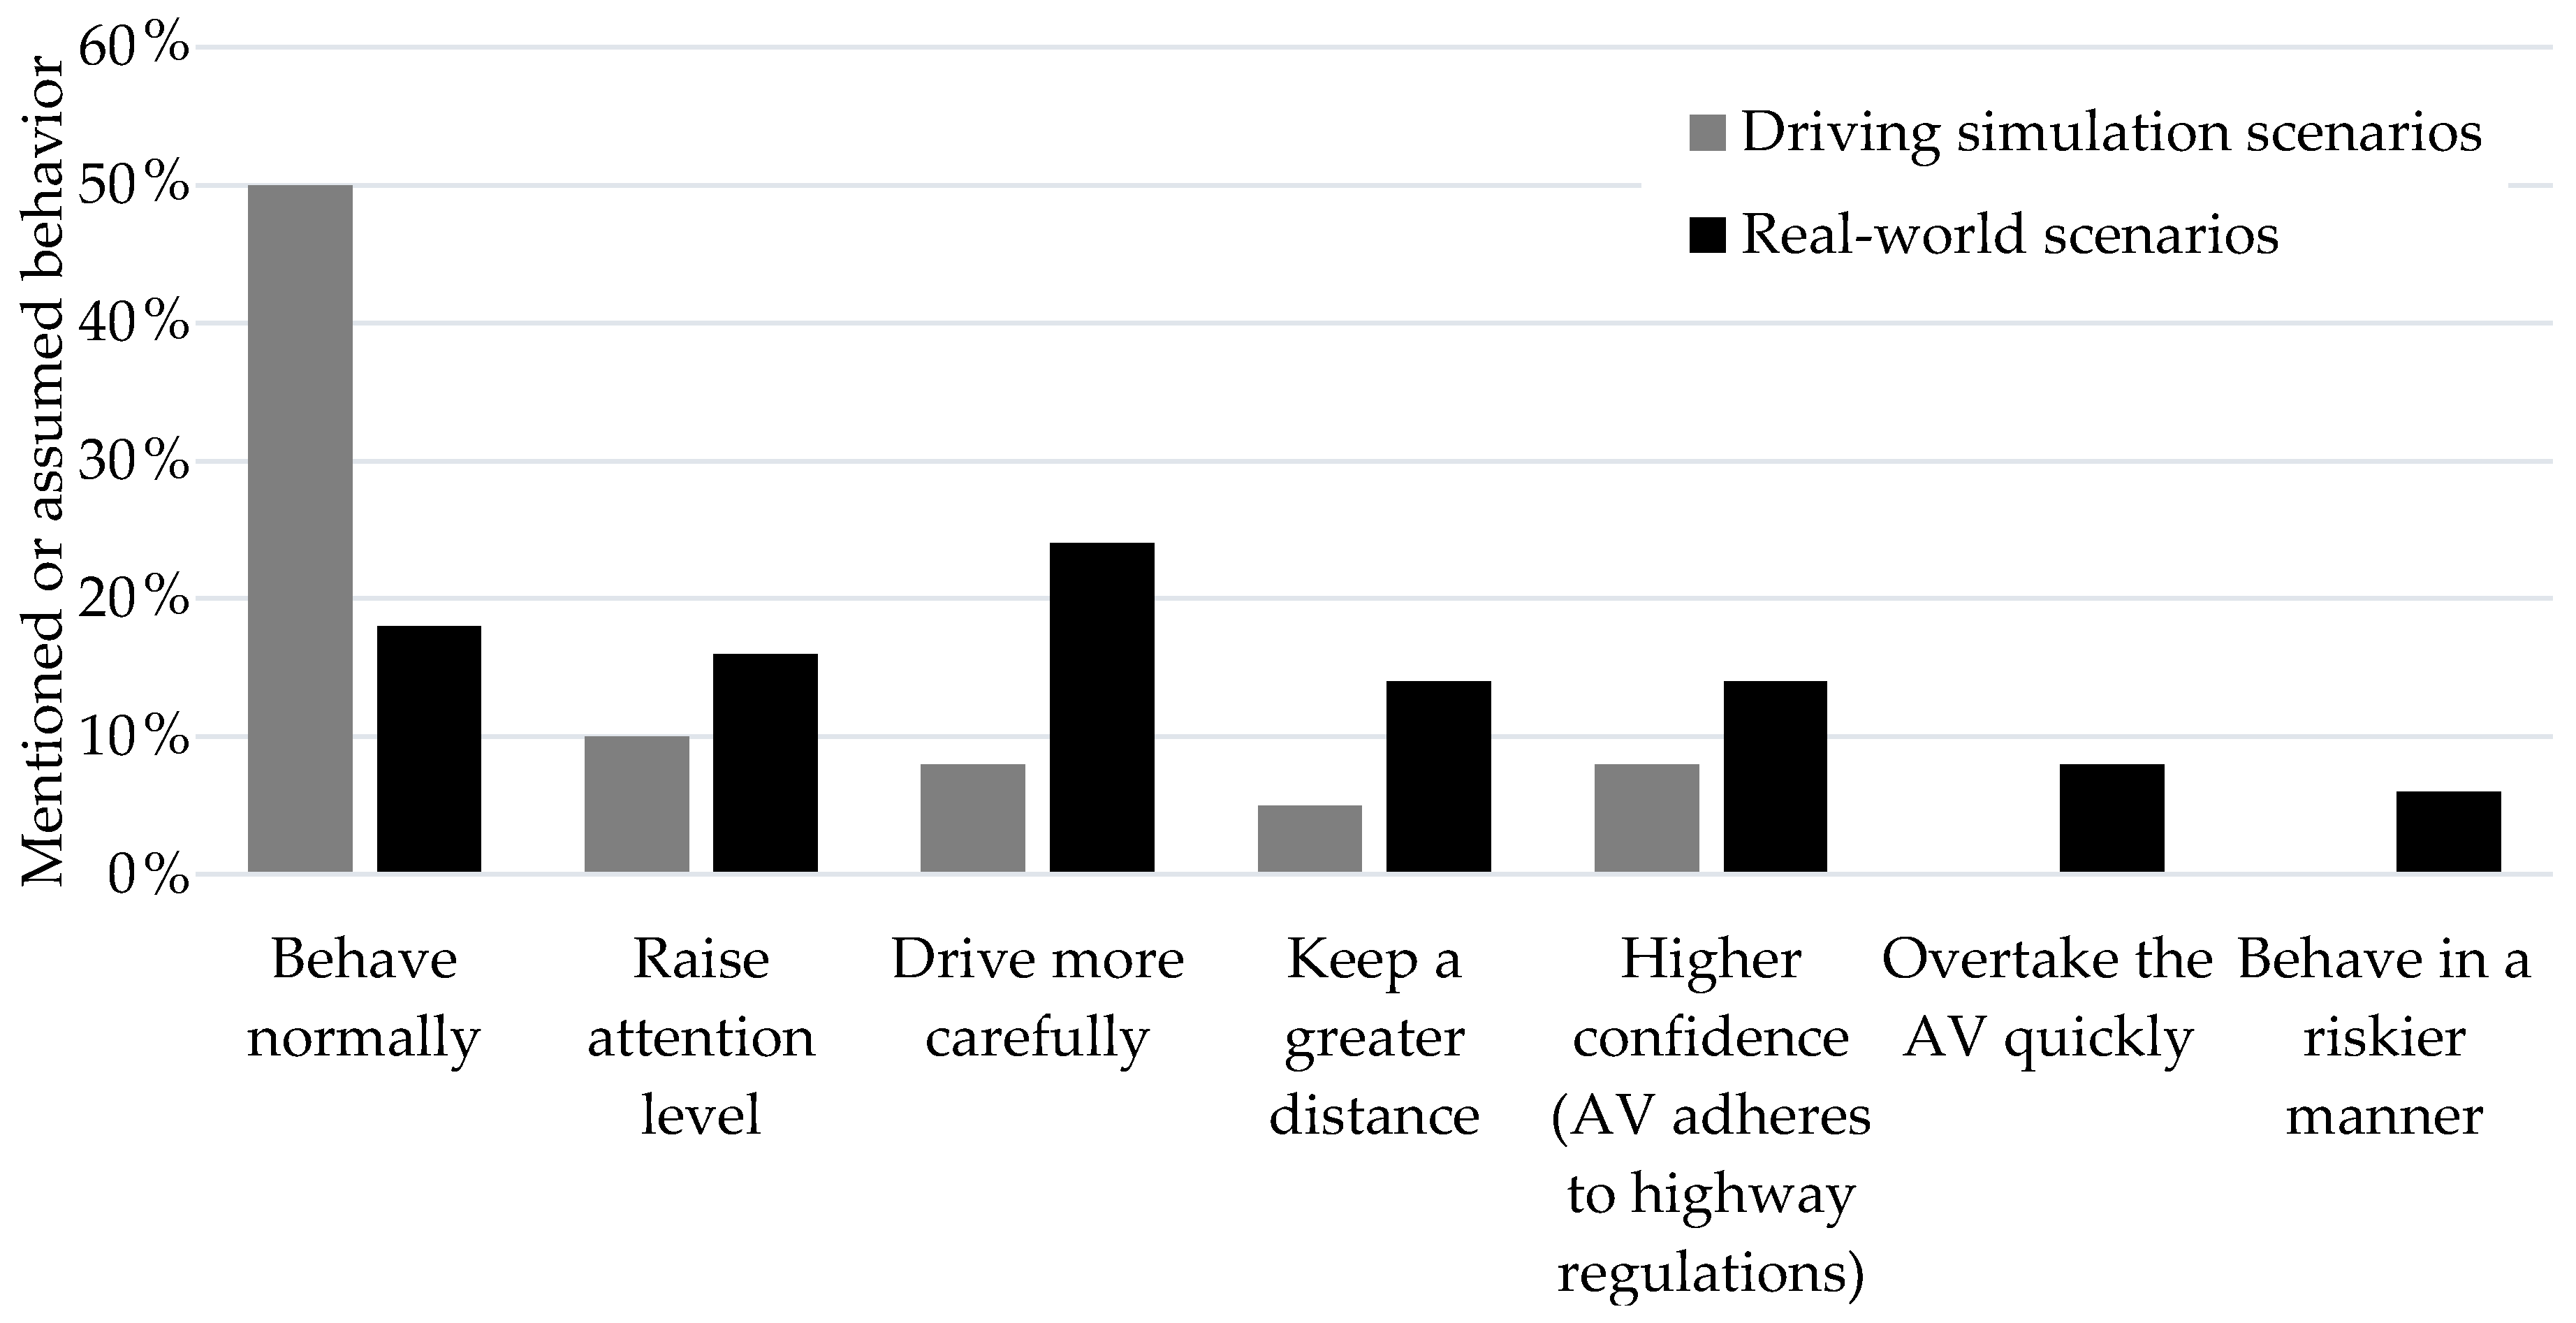
Figure 11.
Boxplot for the time until lane change, segregated by situation and marking.

Figure 12.
Boxplot for the minimum time headway, segregated by situation and marking.

Table 1.
Assessment of the expected driving behavior.
| Roadworks | Traffic Jam | Lane Change | ||||
|---|---|---|---|---|---|---|
| Marking | No Marking | Marking | No Marking | Marking | No Marking | |
| Behavior as Expected | 45.9% | 50.0% | 80.6% | 69.2% | 31.6% | 21.1% |
| Behavior not as Expected | 54.1% | 50.0% | 19.4% | 30.8% | 68.4% | 78.9% |
Table 2.
Number of lane changes over all trials.
| Roadworks | Traffic Jam | Lane Change | |
|---|---|---|---|
| Marking | 27 (73.0%) | 14 (48.3%) | 16 (44.4%) |
| No Marking | 24 (63.2%) | 15 (55.6%) | 15 (41.7%) |
© 2020 by the authors. Licensee MDPI, Basel, Switzerland. This article is an open access article distributed under the terms and conditions of the Creative Commons Attribution (CC BY) license (http://creativecommons.org/licenses/by/4.0/).
Share and Cite
MDPI and ACS Style
Fuest, T.; Feierle, A.; Schmidt, E.; Bengler, K. Effects of Marking Automated Vehicles on Human Drivers on Highways. Information 2020, 11, 286. https://doi.org/10.3390/info11060286
AMA Style
Fuest T, Feierle A, Schmidt E, Bengler K. Effects of Marking Automated Vehicles on Human Drivers on Highways. Information. 2020; 11(6):286. https://doi.org/10.3390/info11060286
Chicago/Turabian StyleFuest, Tanja, Alexander Feierle, Elisabeth Schmidt, and Klaus Bengler. 2020. "Effects of Marking Automated Vehicles on Human Drivers on Highways" Information 11, no. 6: 286. https://doi.org/10.3390/info11060286
Note that from the first issue of 2016, this journal uses article numbers instead of page numbers. See further details here.