Article

Collaborative Mapping and Digital Participation: A Tool for Local Empowerment in Developing Countries

1
Department of Development and Environmental Studies, Faculty of Science, Palacký University in Olomouc, 17. listopadu 12, 771 46 Olomouc, Czech Republic
2
Department of Geoinformatics, Faculty of Science, Palacký University in Olomouc, 17. listopadu 50, 771 46 Olomouc, Czech Republic
*
Author to whom correspondence should be addressed.
Information 2019, 10(8), 255; https://doi.org/10.3390/info10080255
Submission received: 16 July 2019 / Revised: 2 August 2019 / Accepted: 5 August 2019 / Published: 8 August 2019
(This article belongs to the Special Issue Digital Citizenship and Participation 2018)

Abstract

:
There has been an enormous technological boom that impacted all areas of geoscience in the past few decades. Part of the change was also the process of democratization of cartography as well as geographic information systems (GIS), together with new approaches that have emerged, bringing social dimension into cartography and GIS. These new approaches were variously labelled as critical cartography, collaborative mapping, digital citizenship, Bottom-up GIS and Participatory GIS. The paper describes the role of collaborative mapping and digital participation in the process of community building and community assets mapping. Secondly, we will use the examples of Kenya and Peru to support our findings of community development. Thirdly, we will discuss a possible further development within the use of OpenStreetMap (OSM) for remote communities. The analysis compares approaches and experiences in different countries on different continents.

1. Introduction

Collaborative mapping and community engagement became new trends in the development discourse that allow local communities to become part of the power structures and influence what is mapped and what/who is on the map. The involvement of geographic information systems (GIS) tools for collaborative mapping allows new ways of economic and societal development. The mapping of uncharted areas allows local communities to improve their economic situation in the region and literally put the communities on the map. Hernando de Soto [1] estimated the amount of “dead” capital at $9.3 trillion. This capital is based mainly in slums and the authors of this paper believe that unlocking the hidden potential in urban-slum areas can be achieved by acquiring the spatial information about these places in order to allow slum inhabitants to use their property and strengthen their community fully. Crowdsourcing mapping activities such as the Map Kibera project or Ramani Tandale show the possible extent of mapping slums and its development. Open-source and collaborative mapping projects such as OpenStreetMap (OSM) are designed to support community empowerment and to ensure that high-quality bias-free data are available to everyone regardless of their origin, social status, and position within the power structure. Goodchild [2] described the Google Earth phenomenon as the “democratization of GIS” because it opened some of the more straightforward capabilities of GIS to the general public. Similarly, Butler [3] commented: “Just as the PC democratized computing, so systems like Google Earth will democratize GIS.” This process follows the democratization of cartography once called “science of princess” [4]. The democratization continued via a local project of one student (Steve Coast) at UCL (University College London) that turned into the worldwide phenomenon currently known as OpenStreetMap.
It is hard to argue with the point that the democratization of gathering, sharing and owning the spatial information is for the greater good. Nevertheless, with the power of democracy comes huge responsibility. This responsibility is called participation. In 1968, during the student/worker uprisings in Paris, someone put up a wonderful wall painting: “How do you conjugate the verb ‘to participate’?”, the painting asked. The answer was: I participate, You participate, We participate, They decide [5]. It was only one year later when Sherry Arnstein presented her Ladder of Participation [6], that changed the way we understand public participation.
The paper is structured according to the following redline: Collaborative mapping section introduces the readers to the topic of participatory mapping, followed by the chapter dealing with the main issues of the participatory mapping projects. Furthermore, case studies presenting three examples of collaborative mapping with OpenStreetMap in two different countries create the main body of the paper. The authors also present arguments on the minimum requirements in order to succeed with a project, followed by the conclusion chapter. This research should bring some light into the current discussion on the advantages and disadvantages of community, participatory, and collaborative approaches in mapping and digital citizenship.

2. Collaborative Mapping

According to Sajja and Akerkar [7], “collaborative mapping is the aggregation of web maps and user-generated content, in order to provide application-specific information”. Collaborative processes (e.g., the world-renowned Wikipedia), provide high potential and scope for people to collaborate, to create and to improve content. In the case of a map, the map content is provided by users and other resources like websites [7]. Gartner [8] mentioned collaborative and participative research under Web Mapping 2.0. Similarly, there are the terms “crowdsourcing” and “volunteered geographic information”, used especially in the field of crisis management [9]. For consistency, the authors decided to only use the term “collaborative mapping” in this paper.
In the past few years, many new web services and other digital sources have emerged that can potentially provide rich, abundant, and timely flows of geographic and geo-referenced information. Collectively they might be termed as volunteered sources. They include geo-tagged entries in Wikipedia, sites such as OpenStreetMap or WikiMapia that support volunteer efforts to create public-domain geospatial data layers, the geo-tagged photographs of Flickr, Ushahidi platform or mash-ups with Google Maps platform [10]. Currently, it is possible to find an enormous amount of geographic domains from such sources that can be synthesized, verified, integrated and distributed [11].
Volunteered Geographic Information is the harnessing of tools to create, assemble, and disseminate geographic data provided voluntarily by individuals [2]. Some examples of this phenomenon are Wikimapia, OpenStreetMap, and Google MyMaps. These sites provide a general base map information and allow users to create their own content by marking locations where various events occurred, or certain features exist but are not yet shown on the map.
Advantages of collaborative web maps (extended according to [12] and [13])
  • Fast updates (real-time or near real-time)
  • Up-to-date content
  • Low cost
  • Data accuracy
  • The errors/bugs are quickly eliminated
  • Easy to integrate new technologies or services
  • Platform independency
  • Combination of distributed data sources (open standards and APIs (Application Programming Interface))
  • Data security
  • Support—forums, help, tutorials, etc.
Disadvantages and problematic issues
  • Quality assurance and reliability
  • Different map scale and quality of partial areas
  • Copyright and privacy issues

3. General Objectives of Collaborative Mapping

This chapter summarizes the general objectives and benefits of collaborative mapping for developing countries. Based on the experiences and requirements from the case studies (see below), most of the collaborative projects in developing countries are built on the principles of free and open-source software (FOSS). Typically, OpenStreetMap and QGIS (Quantum GIS) are used for mapping [14]. That is the reason why the described objectives are closely related to the general principles of FOSS (according to [9,12,13,15]).

3.1. Copyright

Generally, the issue of copyright is mainly discussed in the context of illegal copies. That does not occur in the field of open source solutions. Collaborative projects such as OpenStreetMap take advantage of open licenses. Based on that fact, a user can freely manage projects, including commercial use (according to the license). If necessary, specific tools could be created, or an API could be used. There is no threat of prosecution for copyright infringement. The OpenStreetMap data changed their licensing from the Creative Commons license to the Open Database License (ODbL) in September 2012 [16] in order to have more legal security and a more specific license for databases rather than creative works. The previous license allowed free access to all the map images and all the underlying map data, such as points, lines and polygons. The current license, on the other hand, is focused more on the ability to share, modify and use a database freely while maintaining the same freedom for others. The shift from map images to data (base) is clear in the licensing, and it is also the main difference between OpenStreetMap and Google Map Maker [14]. In reality, municipalities in developing countries do not take into account any copyrights because they have no idea about any legal rules. That is the first reason why it is easier to use collaborative mapping in those regions.

3.2. Cost Reduction

The collaborative process brings a significant reduction in financial cost. Lower costs are one of the major positives compared to commercial solutions. An increasing number of academic, government and commercial institutions are trying to reduce their costs. Therefore, a lot of institutions have to decide whether they would get involved in commercial or alternative projects. Nowadays, more and more of them prefer lower costs, but not at the expense of quality, of course.
However, it should be mentioned that the crucial role is the purpose. It is impossible to use collaborative mapping for all kinds of projects. The disadvantage of non-commercial solutions is generally the lack of support, except the users’ forums. On the other hand, commercial solutions provide telephone support and tutorials within the purchased license. However, the fact that the acquisition of an open-source program can save hundreds of euros is one of the key roles in real practice. Based on the purpose, the case of local area collaborative mapping could bring lower costs than the other way around. In the case of global projects, it is definitely cheaper to use OpenStreetMap than purchase a Google Maps commercial license.

3.3. Technological Independence

One of the basic objectives of the collaborative approach is the principle of platform and technology independence. It could be run regardless of the operating system, platform or web browser. The user is not limited by the chosen technology.

3.4. Open Access

The rule of open access for the public is the cornerstone of collaborative mapping. The user has the ability to view and modify the map content if it is wrong. There is almost no opportunity to edit map content in commercial solutions. A user can generate thousands of elements or edit only one depending on the user’s needs.

3.5. Availability

If the map is based on collaborative mapping, then it is fully available to the public. Anyone who is interested in collaboration can, therefore, use the program. License terms determine how data can be redistributed and used for personal, professional and commercial purposes.

3.6. Extensiveness and interoperability

Generally, most of the collaborative projects are based on open source solutions (Wikimapia, OpenStreetMap, Ushahidi, etc.). Compared to the proprietary model, a significant advantage is the possibility of customization. Programmers can adapt applications to the specific needs and specialized requirements by simple modifications or by adding required features. The interoperability feature provides a standardized interface. For example, commercial companies provide data in closed format, typically Esri shapefile (*.shp). On the other hand, standardized web services are supported by both commercial and non-commercial institutes. For example, in the case of OpenStreetMap data, everyone has access to the complete database. A user can render map outputs according to his requirements as well as edit content and functionality.

3.7. Data Security

It is quite important to make a distinction between data security and data accuracy (quality). There are two perspectives of data security. Due to the principle of an open community, it is much easier to remove possible errors and bugs in a short time. Internet technology provides opportunities to fix errors to everyone and everywhere. On the other hand, these benefits could be a disadvantage at the same time. Availability allows users to override security mechanisms. However, according to [15], “in the current paradigm of information security, it is generally considered safer when the information (data) are available to the public, even if there is the availability to hack it.”

3.8. Data Accuracy

The most discussed topic in collaborative mapping is data accuracy within the context of map data quality and correctness. Based on the principle of the collaborative process, there is always a hint of subjectivity. The key question is how high the level of subjectivity is. The coverage and accuracy of OpenStreetMap is often connected with the amount of volunteers mapping in a given area. As stated in Haklay [17], there is evidence to suggest that there are “areas where nobody wants to map”, e.g., Kibera in Kenya and Villa Rica in Peru, which are mentioned in the case studies. However, those areas are not covered in commercial products. If collaborative mapping is available in those areas, it is based on individual volunteers. In that case, the mapping process is more or less affected by subjectivity, and data accuracy could not be 100% precise. Furthermore, compared to the blank areas in commercial maps, it is much better to have an imperfect map than a blank paper.
A direct correlation could be applied. The more users that are involved, the higher the quality. Generally, in the case of highly-populated areas, there is no data accuracy problem because of a broad base of volunteers. A minimal quality check would have to be made by each contributor before the data goes public. The process of the individual creation of data is called Copyright Easter Egg—the original author almost always has knowledge of the real-world location, is able to identify it. Ground surveys are performed by volunteers on foot, on a bicycle or in a car, mapping urban areas by a GPS (Global Positioning System). The mapped data are then entered into the database. In addition to field surveys, a number of edits are made by other contributors to correct errors. Occasionally, the events called Mapping Parties, or Mapathons happen. It is a process organized directly by the OSM community with the aim to improve map accuracy or map new areas.

4. Case Study—Kenya

The first case study presented in the article is based in one of the biggest informal settlements in Africa—Kibera, part of Kenya´s capital—Nairobi [18].
There were attempts to estimate the population in Kibera by NGOs (Non-Governmental Organisation), agencies or researchers, while these estimated varied between 400,000 and 1 million [19,20,21,22]. Kibera covers an area of 225 ha and is placed close to the center of Nairobi, which helps the inhabitants to acquire labor in the industrial areas and the city center. Kibera suffers the typical issues of informal settlements—high density of unplanned and crowded houses, lack of infrastructure that has led to problems of drainage, sanitation and solid waste management [22]. The name of the informal settlement Kibera was derived from the Nubian word Kibra, that was used for forest or jungle [20,21]. This became a worldwide synonym for an African slum used mainly by western researchers in the past decades.
Although there has never been an official census in Kibera, so attempts, mainly organized by Western researchers, to count the population appeared. The results showed numbers much lower than previous estimates. The French Institute for Research in Africa (IFRA) estimated the population in Kibera to be 200,000 residents [23]. Based on research in Kinda, Stephano Marras, calculated one of the villages’ population to be 252,500 [24]. All of this helped to create the label for Kibera as “the biggest slum in Africa” that has become a slogan, something that sells the research, but it has been shown that that is not the reality of Kibera [23].
The inability to measure how many inhabitants live in Kibera has a much broader impact. Kibera used to be a village housing the Nubian soldiers from the demobilised armies of British East Africa at the end of the Second World War in 1947 [19]. With time, the original inhabitants gained various forms of rights to the land and began building mud-and-wattle structures for renting, which remained till today. When Kenya became an independent country on the British Empire in 1963, some forms of housing were made illegal by the government. This new law affected Kibera on the basis of land tenure, making it an unauthorised settlement. Since that time, Kibera was not visible on the maps and if shown, it was visualised only as a park [25] or a small formal settlement [26]. From the national cartographic service, it made no sense to put Kibera on the map, because what is not on the map does not exist, therefore, what does not exist needs no attention and funds/solutions by the government.

4.1. Mapping Kibera

Based on the historical notion in (not)mapping the area, the residents of Kibera realised that “being on the map” in the digital world of 21st century actually means “to exist”, at least digitally. This goes hand in hand with outcomes of the research of [27,28] who argued that maps have an empowering effect on the communities. Creating maps helps people to think spatially about their environment, whether it is urban or rural, and literally it puts their community on the map, and thereby pushing them to “exist” in the digital world.
The comparison of Figure 1 and Figure 2 shows Kibera on six main map services in two different scales [29]. Figure 1 shows an overview of Nairobi at scale 1:35,000 and most of the map providers show at least name Kibera, what is an enormous change since 2015, when only OpenStreetMap and Google Maps showed Kibera as a village or an area [30]. Zooming in to 1:4,000 (Figure 2) the area of the Kibera is shown only on OpenStreetMap and Google Maps, while the level of detail on OSM is much better than other maps. The difference is both in quantity of spatial information displayed as well as quality (detail).
The case study of Kibera was selected as an intensive mapping was organized in the settlement by two projects described in this paper; the Map Kibera and the Map Kibera project [31,32].
There is a large difference between the Google Maps and OpenStreetMap in the area of Kibera, and this difference is not just in the data coverage, but also in the data structure. While Google Maps uses only single style roads for the Kibera area and the differentiation is by the width of the road, there are at least three types of roads on the same zoom level for the OpenStreetMap. Regarding the accuracy of the OpenStreetMap, roads are mostly digitalized based on the Bing aerial images or the GeoEye imagery, while points are gathered by Map Kibera crew [33]. The points of interest (POI) mapping was done in more detail in four issue areas education, security, water/sanitation and health.

4.2. Map Kibera Project

The Map Kibera Project (MKP) aimed at producing reliable and clear spatial data and maps using GIS (mainly the free and open-source QGIS) and making them available on the Map Kibera Project’s official website.
The main motivation for the project was the lack of reliable spatial data about informal settlements as the existence of such settlements like Kibera is often, for political and economic reasons, only unofficially recognized by local authorities and national governments, as mentioned above in the text. Such political situation independent research projects appear to be crucial in order to achieve a deeper understanding of such realities. The Map Kibera Project set its aim to create reliable data and maps representing the up-to-date physical and socio-demographic features of the Kibera informal settlement, making them available through a digital geo-referenced database to anyone [34].
Currently, the Map Kibera Project [31] allows users to download data and maps only for the Kinda village, which is the most western part of Kibera, as the project only piloted in this area and never continued further in the settlement. These data include information about terrain, structures, the sewage system, water points, electricity supply, public toilets and lavatories, building materials, business distribution, rent, population, schools, and some demographics. For the whole of Kibera, only the terrain and buildings are available as PDF files. Unfortunately, one can only view the data in pdf, jpg or kmz. If desired in *.SHP format, one needs to contact the mapping team with a data access request complying with their “data access and dissemination policy”.

4.3. Map Kibera

The history of the activity called Map Kibera is different from the Map Kibera Project, as it is opposed to the above-mentioned one, bottom-up community-based initiative. As stated by the organizers, ‘Kibera in Nairobi, Kenya, was a blank spot on the map until November 2009, when young Kiberans created the first free and open digital map of their own community. Map Kibera has now grown into a complete interactive community information project. We worked in Kibera, Mathare and Mukuru, using tools of mapping, voice and video’ [32].
Map Kibera started in 2009 as a community-based project working with OpenStreetMap as a tool for community development. The mapping part of the initiative included combining various methods such as surveying with handheld GPS devices, the digitization of satellite imagery, as well as a paper-based annotation with Walking Papers in the field. Data consumers were consulted for their needs, to help add direction to the feature types collected, and they aided the project by immediately making use of the map data [24,32,35]. The project allows users to download shapefiles with information about transport, health, security, education, water and sanitation, religion, boundary, and polling places. Furthermore, the additional CSV (Comma-separated values) data about health and education are available, too. OSM extracts for various topics are available as well together with prepared maps regarding elections, education, education atlas, water/sanitation, WatSan atlas, Kenya water for health, water and sanitation for the urban poor, and security.
Map Kibera also became active in other informal settlements in Nairobi, such as Mathare (Figure 3) and Mukuru (Figure 4), as well in other digital citizenship topics as citizen media or citizen advocacy.

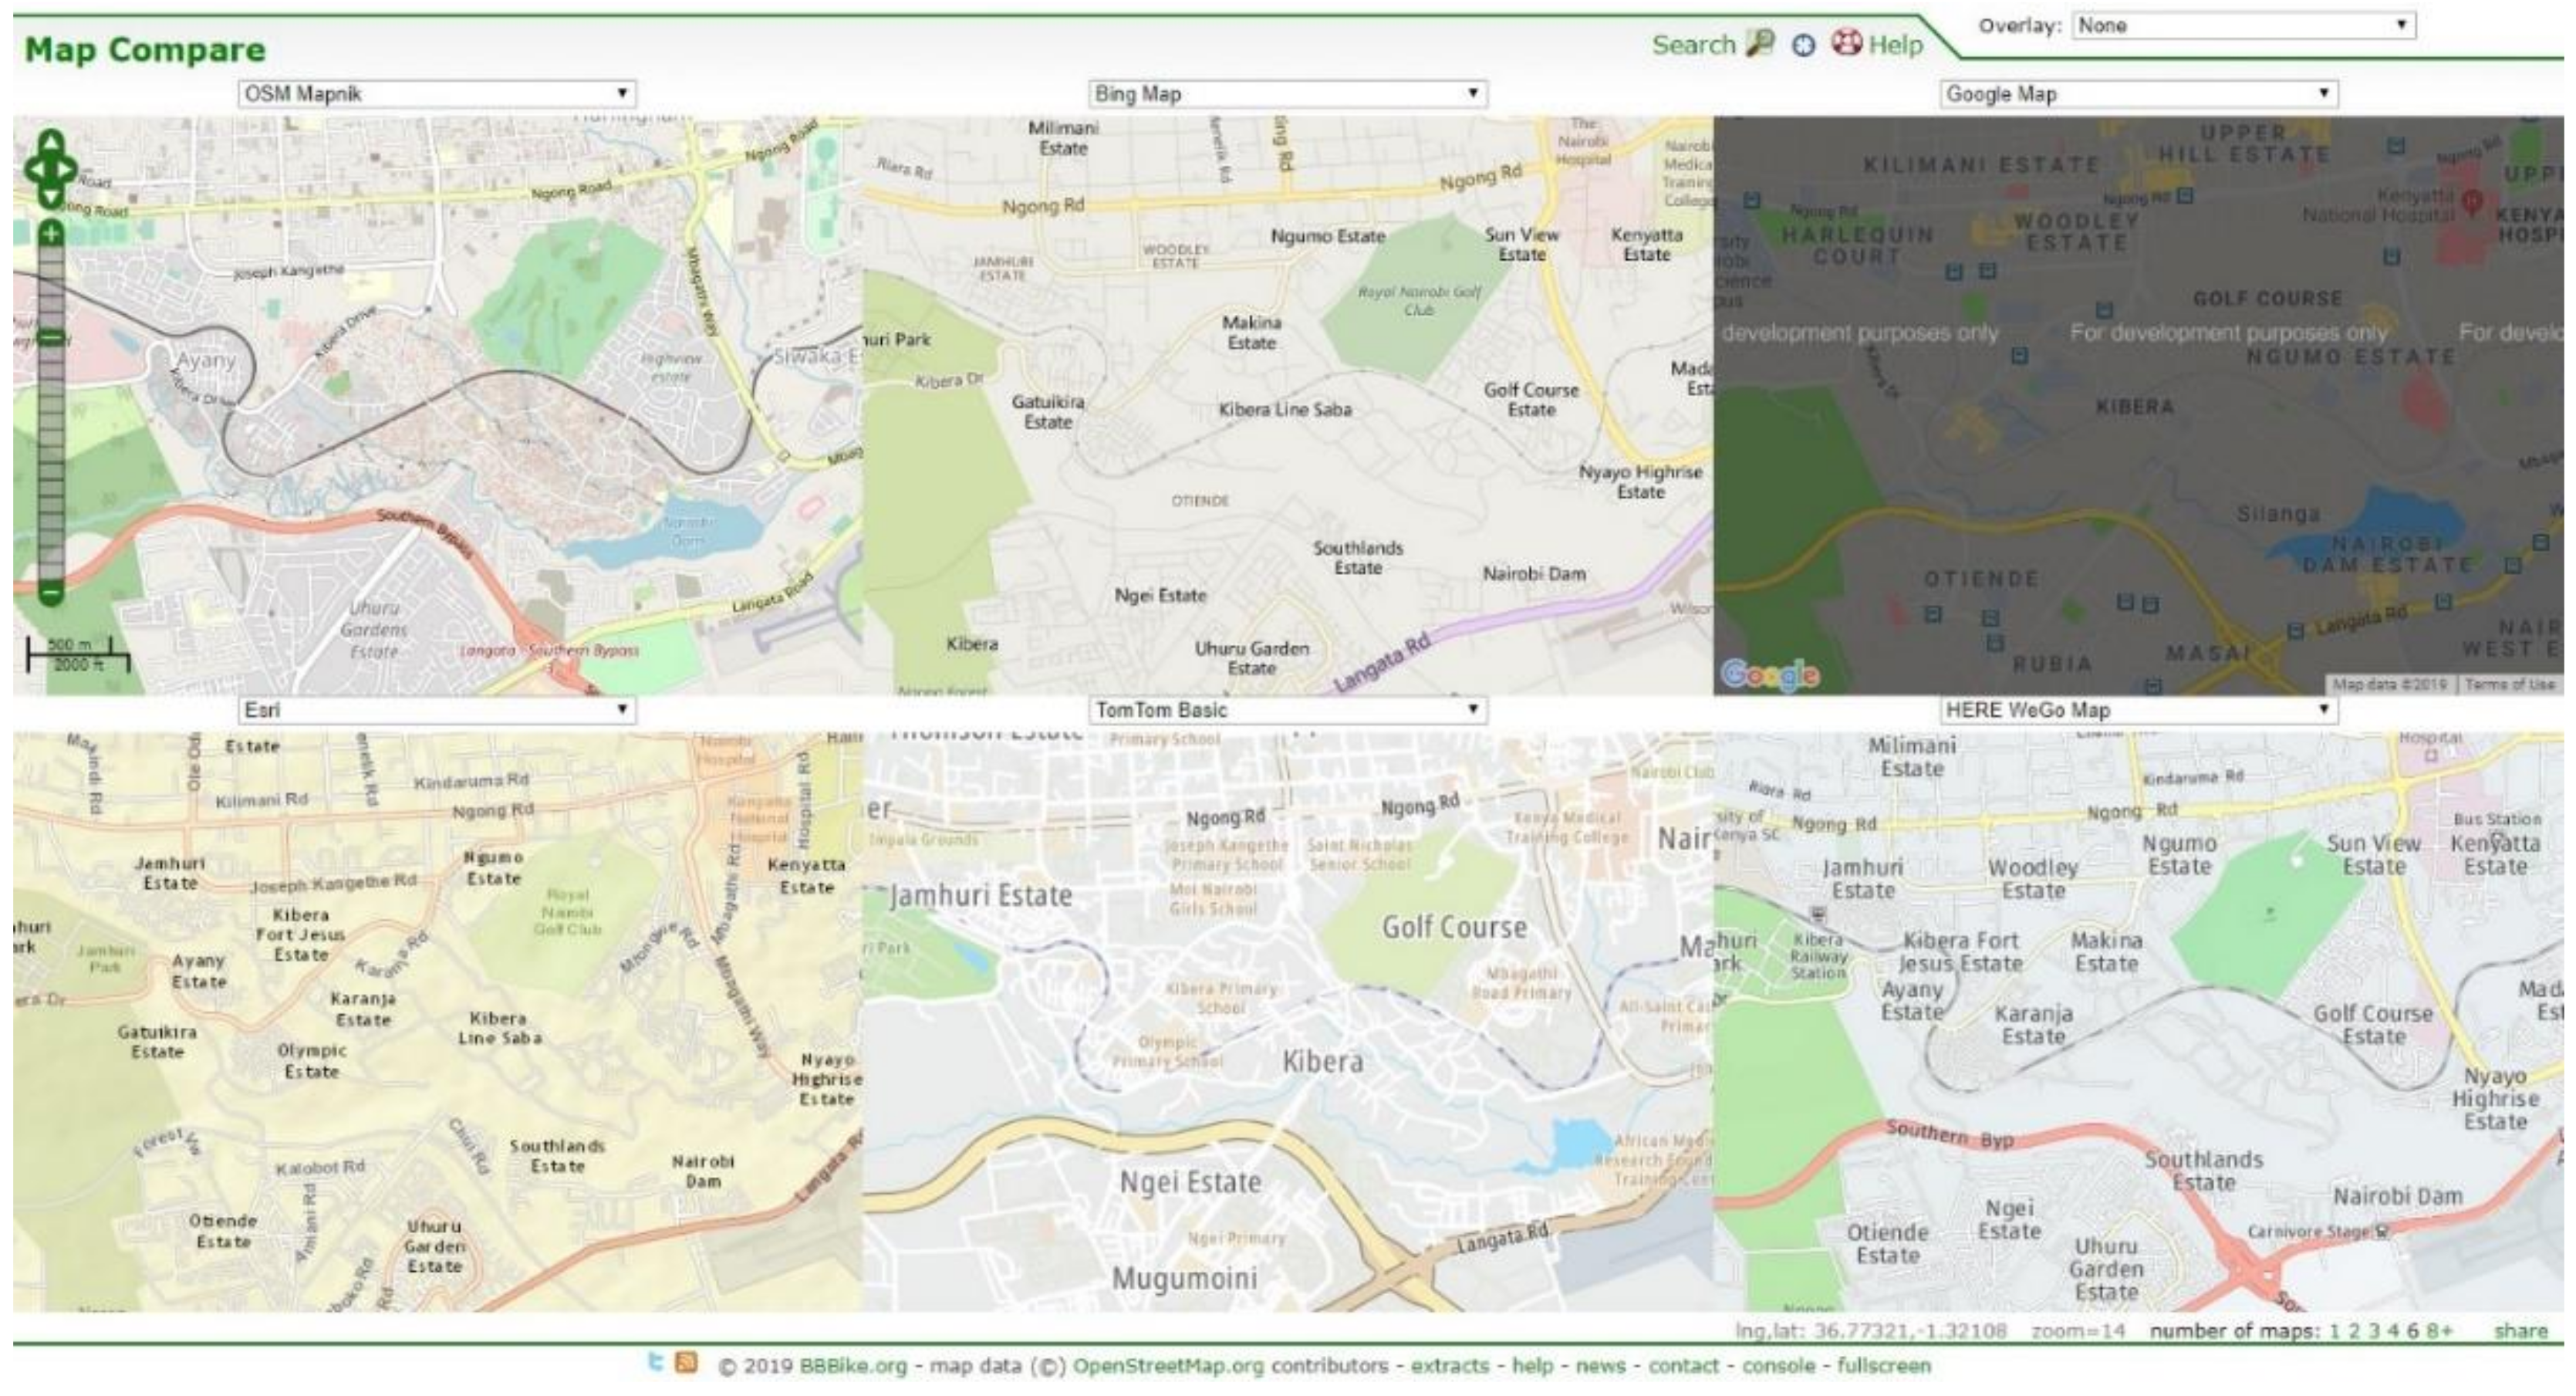
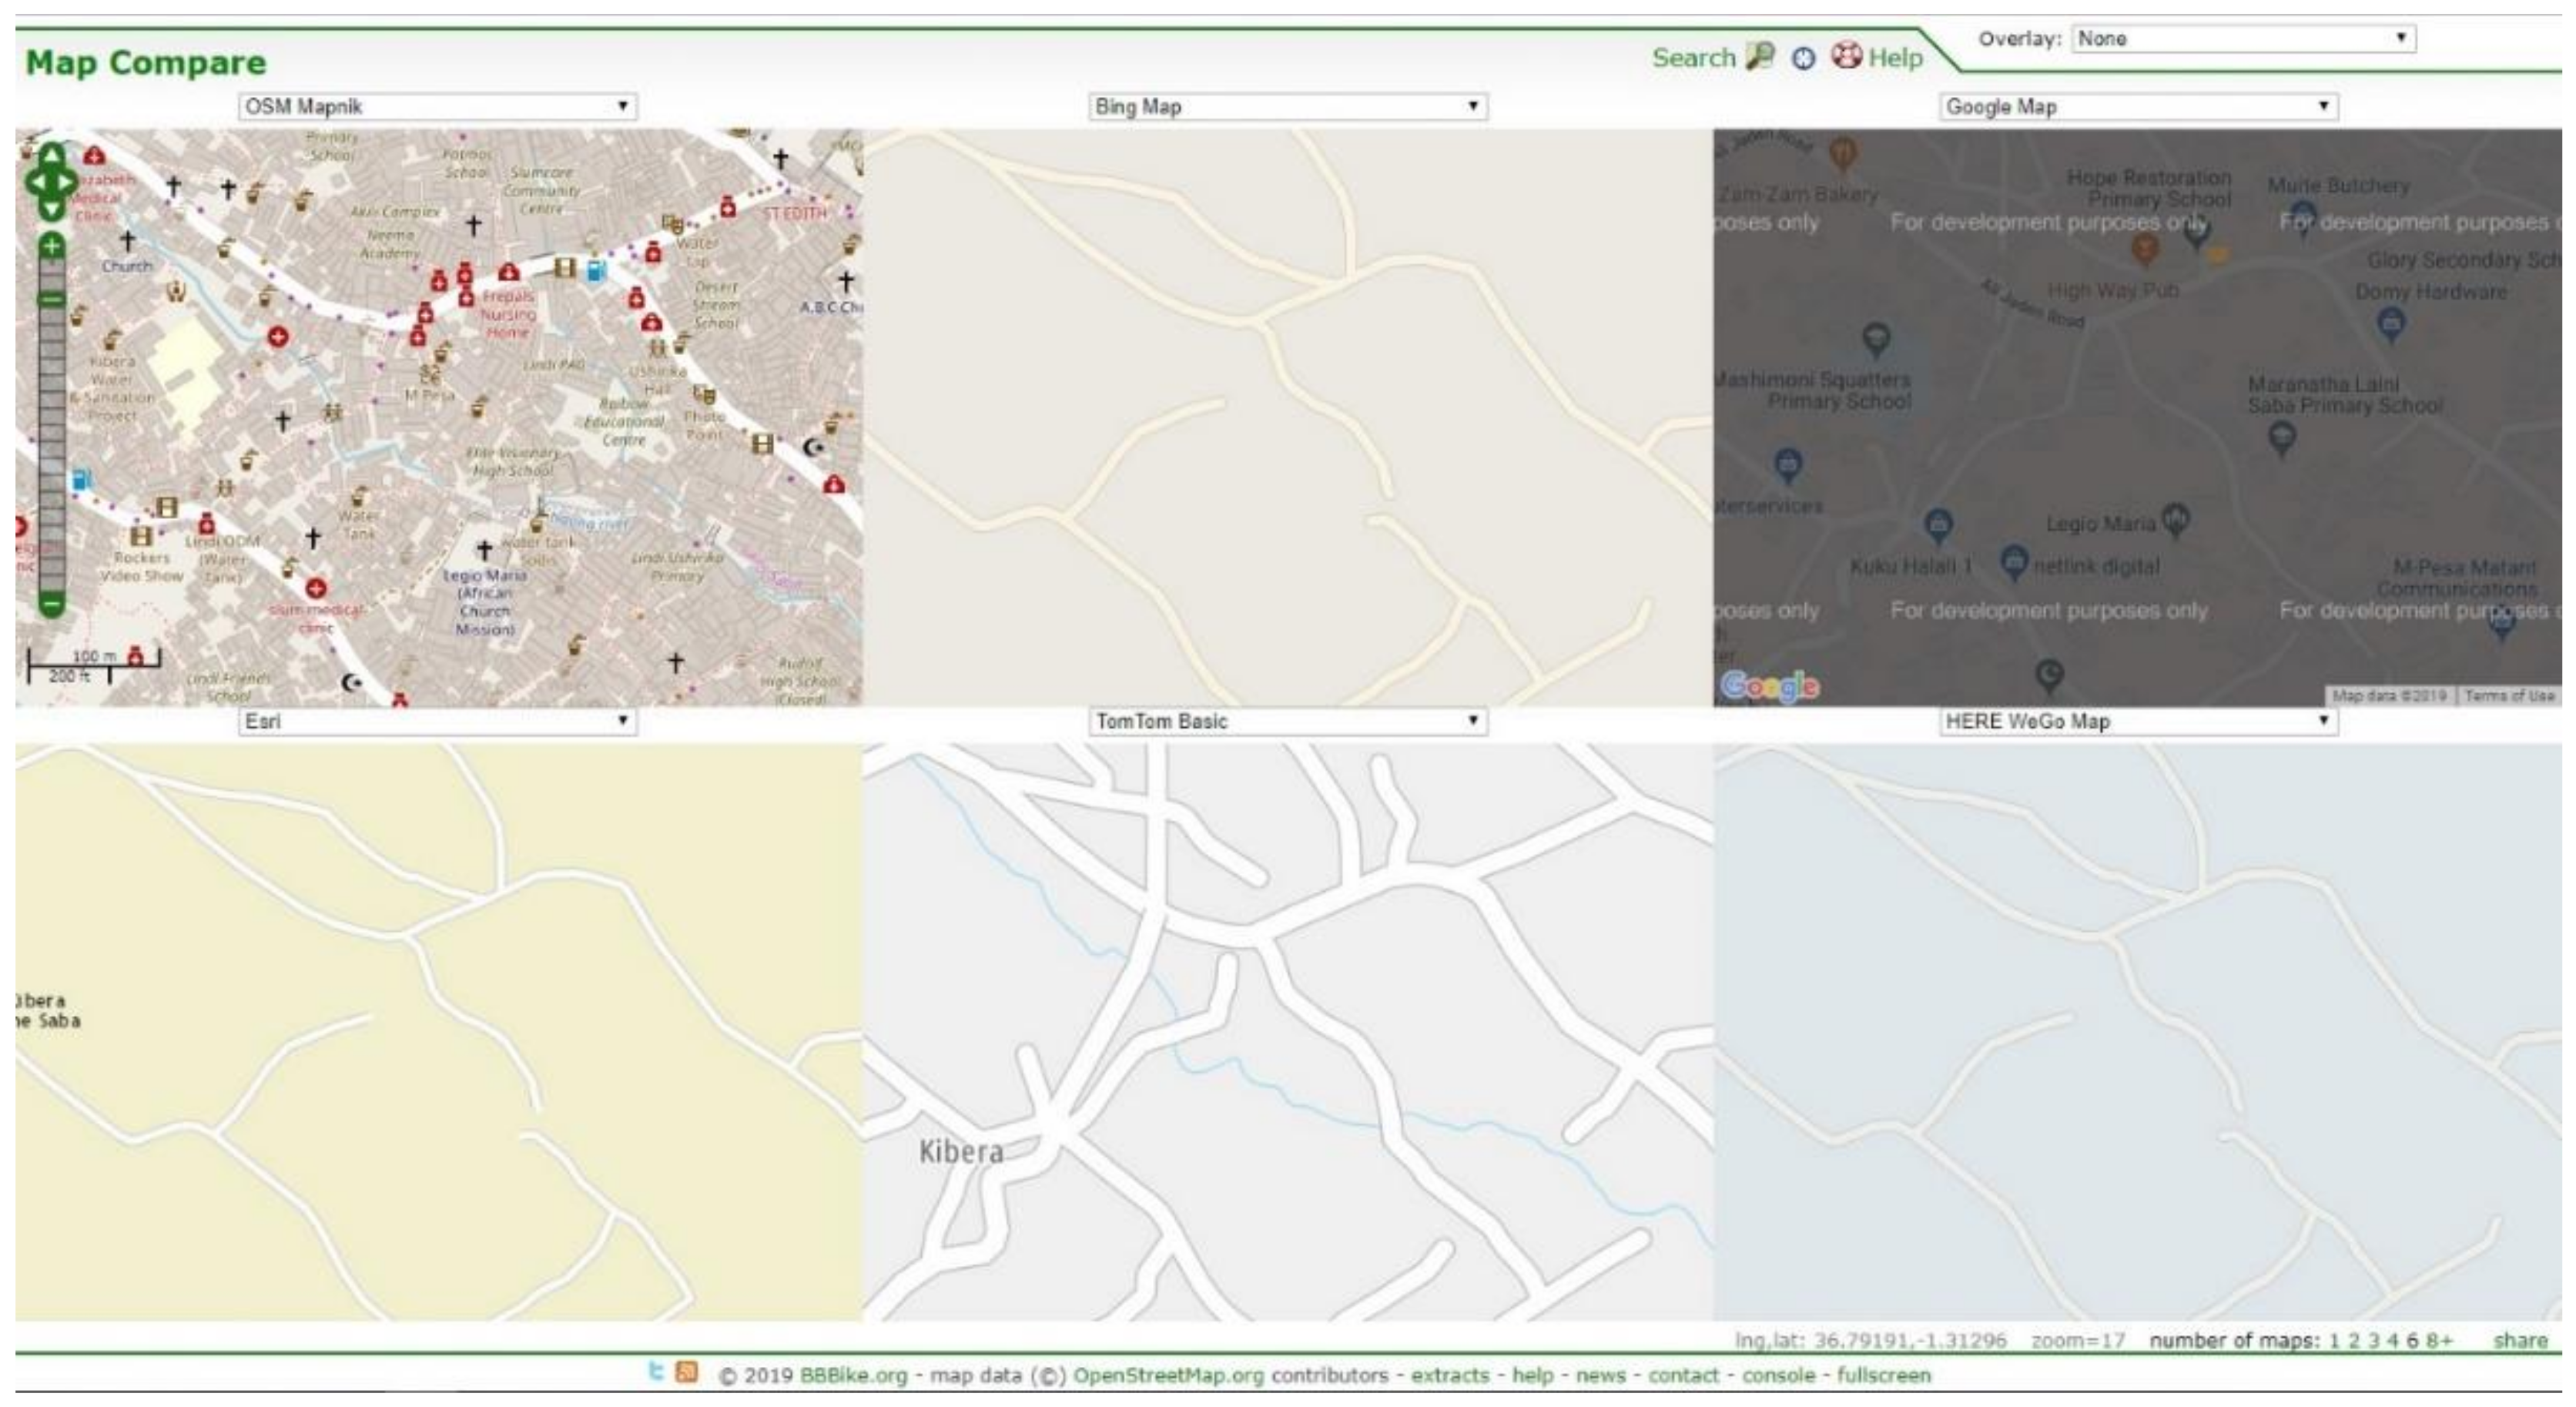
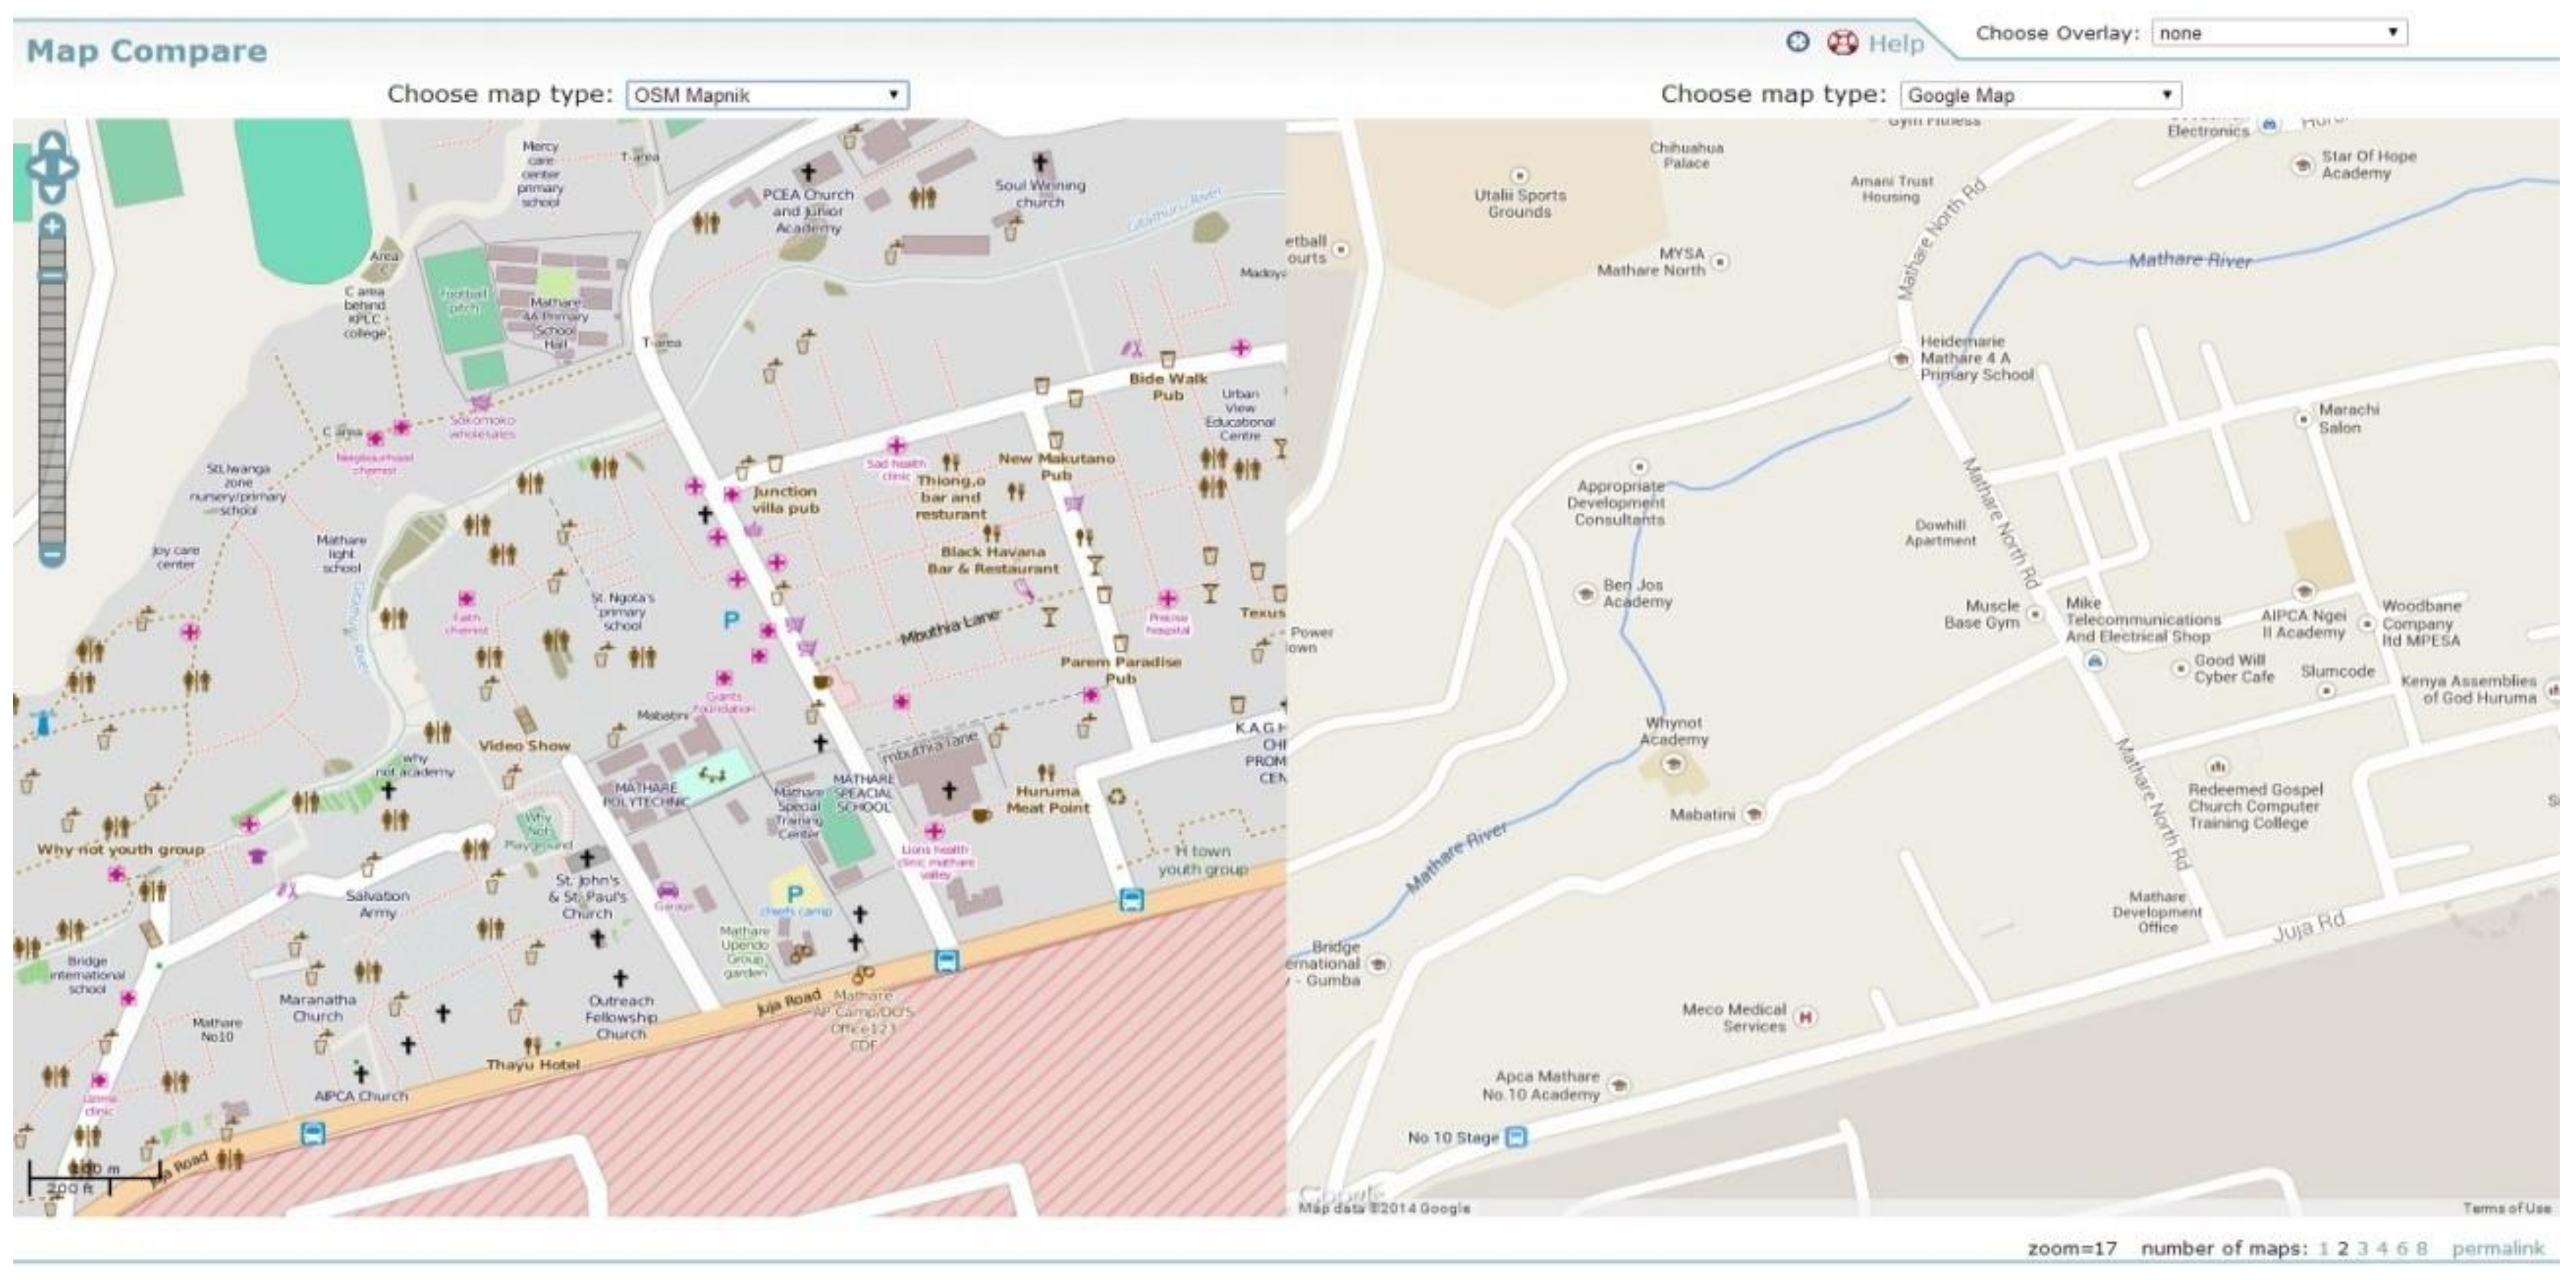
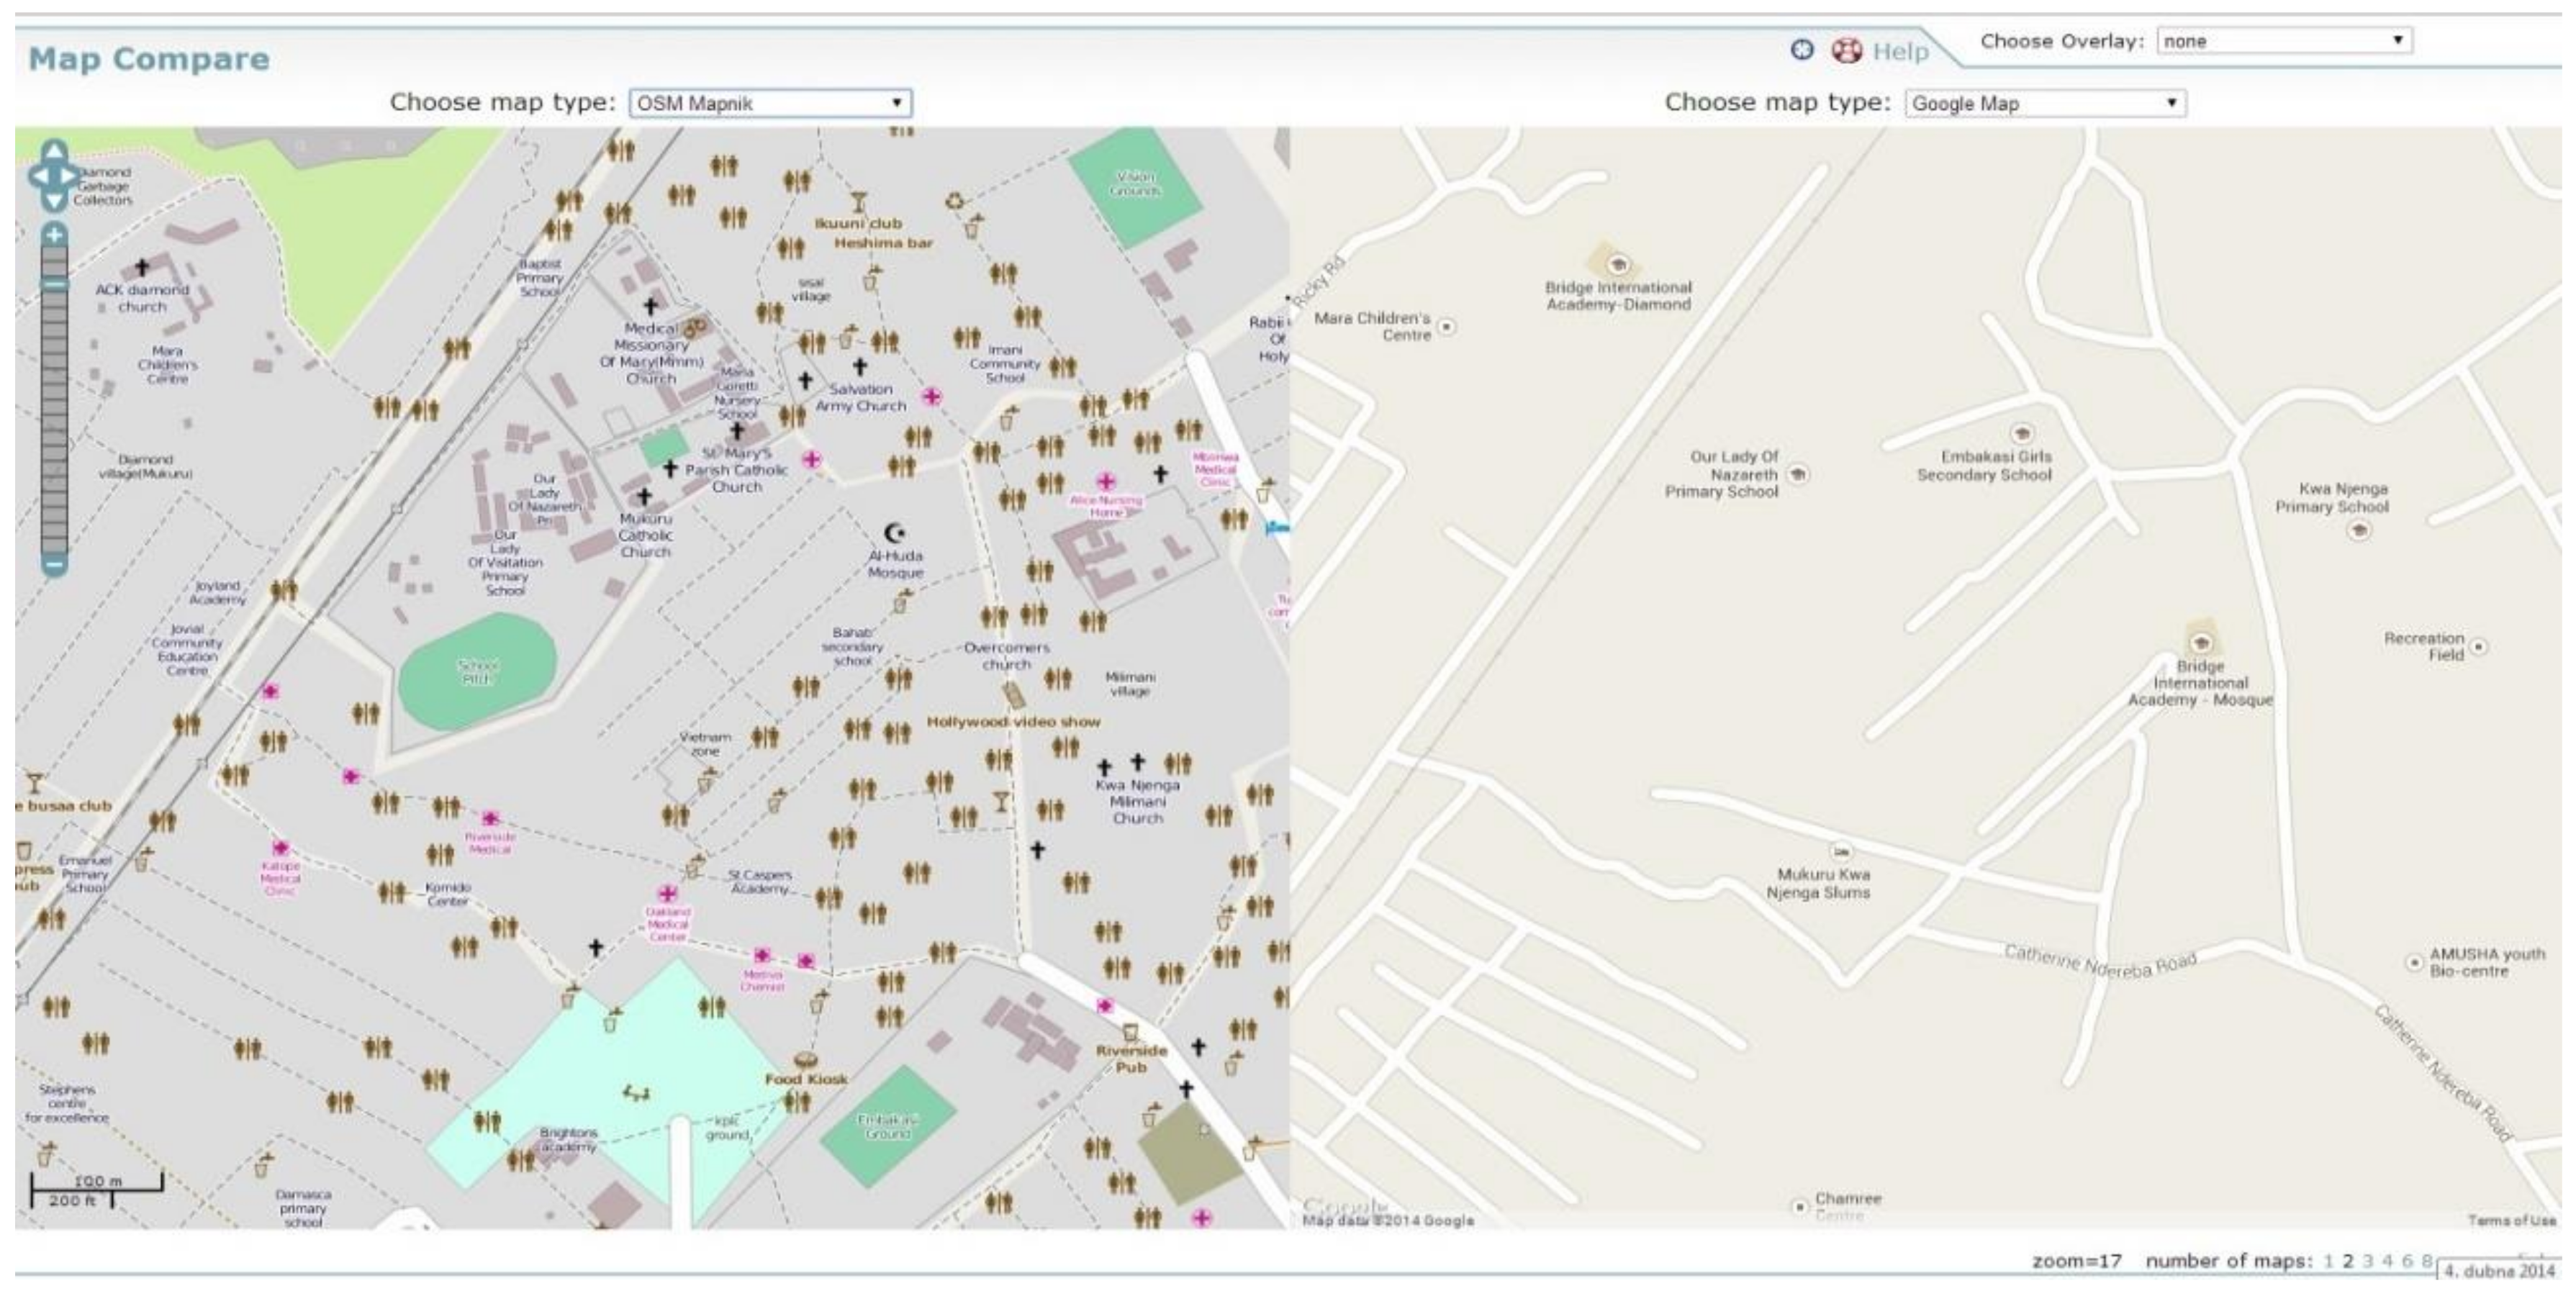
4.4. Comparing Mapping Initiatives in Kibera

Both of the above-mentioned projects Map Kibera Project and Map Kibera were initiated in the same time period and with similar goals—to create an open and free map of Kibera. Nevertheless their results and outcomes are different, mainly due to the methodology and target groups of these projects.
Map Kibera Project aimed at an in-depth field survey carried out door-to-door and the collection of spatial data for open data-base and outcomes. Another aim was to transmit know-how to local communities and involve Kenyan researchers, while ensuring financial independence from actors who might have interests in conflict with the MKP’s values and mission. It has all been done with the use of free and open-source GIS software (e.g., QGIS) [33].
On the other hand, The Map Kibera team decided to follow a different avenue. Their approach was driven by the Impact and Advocacy Engagement model, where five steps are specified.
  • Step One: Initial mobilization
  • Step Two: Using own tools. Collection and development of materials. Analysis
  • Step Three: Reporting back to the community and developing action plans
  • Step Four: Lobbying and advocacy
  • Step Five: Negotiation: between the consortium and government representatives [36]
Through these steps, more individuals were involved in the whole process and the activities were not just about “collecting spatial data”, but also about community development, starting from the bottom, leading to sustainability. Years after the initial mapping, Map Kibera is a growing project with an enormous number of followers and activities which have spread to other parts of Nairobi as well as other domains of digital citizenship and participation.

5. Case Study—Peru

The second case study describes a concept of mapping of coffee plantations in Villa Rica region, Peru. The case study is conducted within POPRAR (Support of Practical Competencies in Regional Development) project organized in cooperation with several Czech universities.

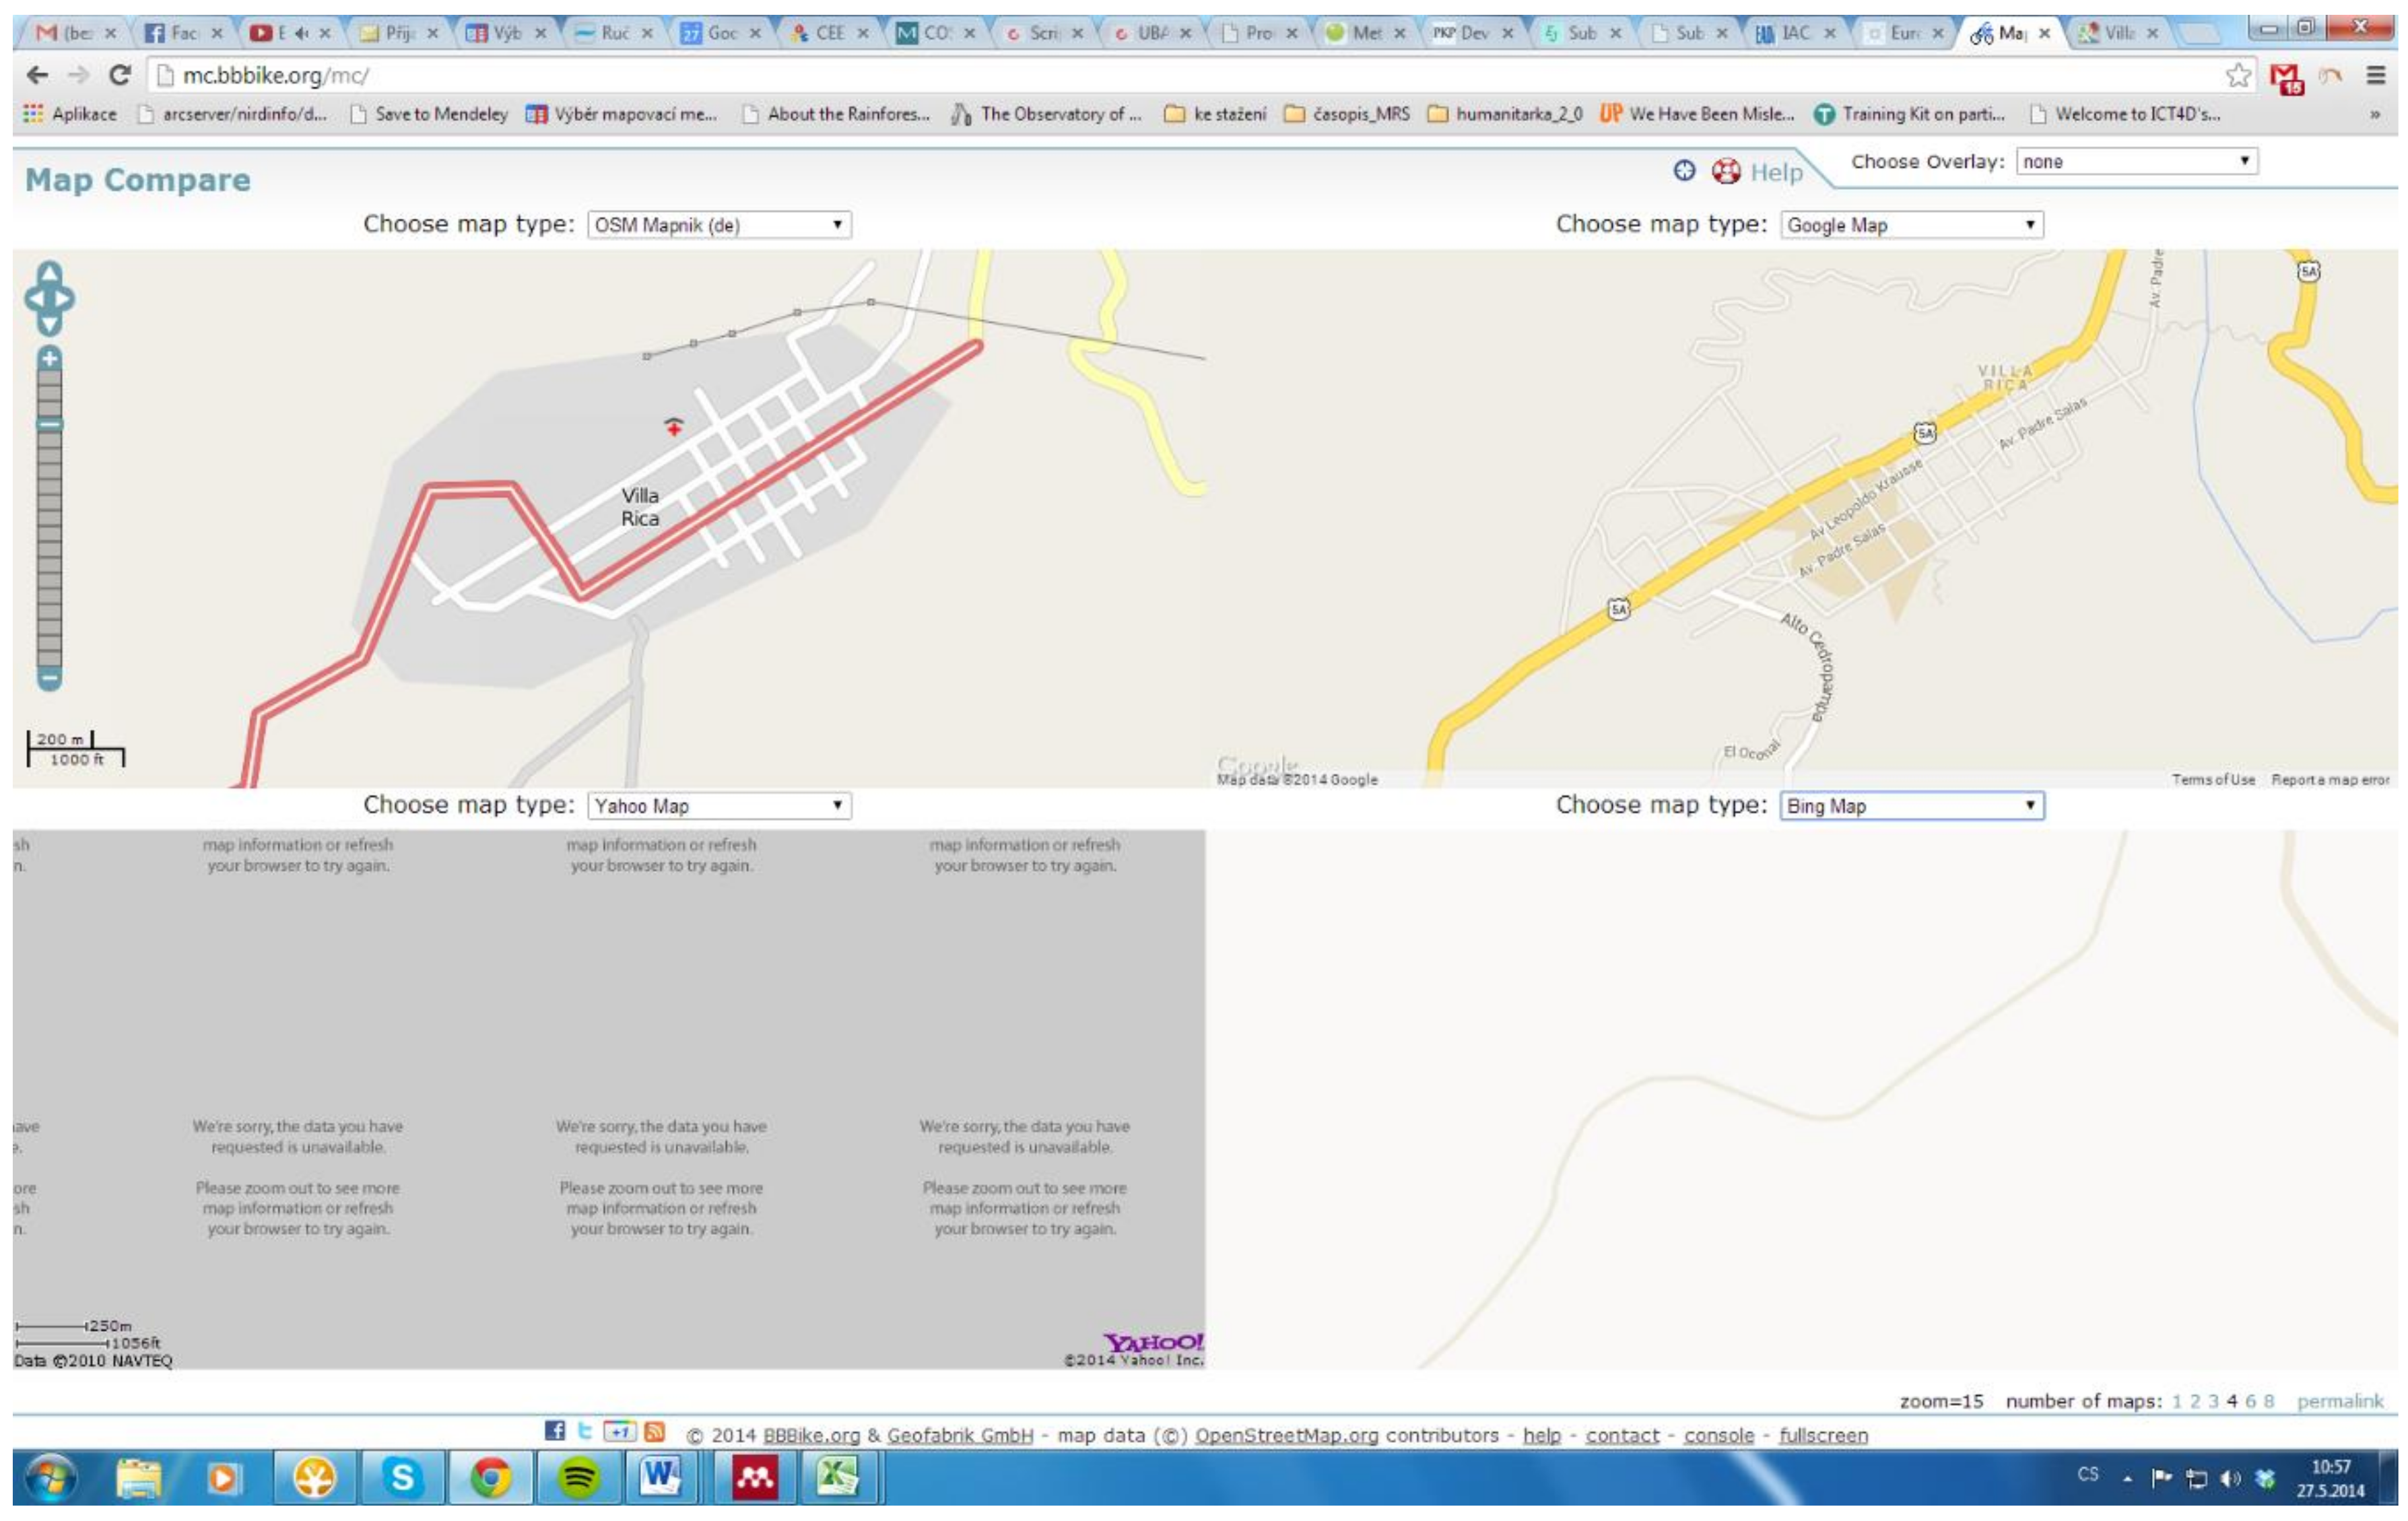
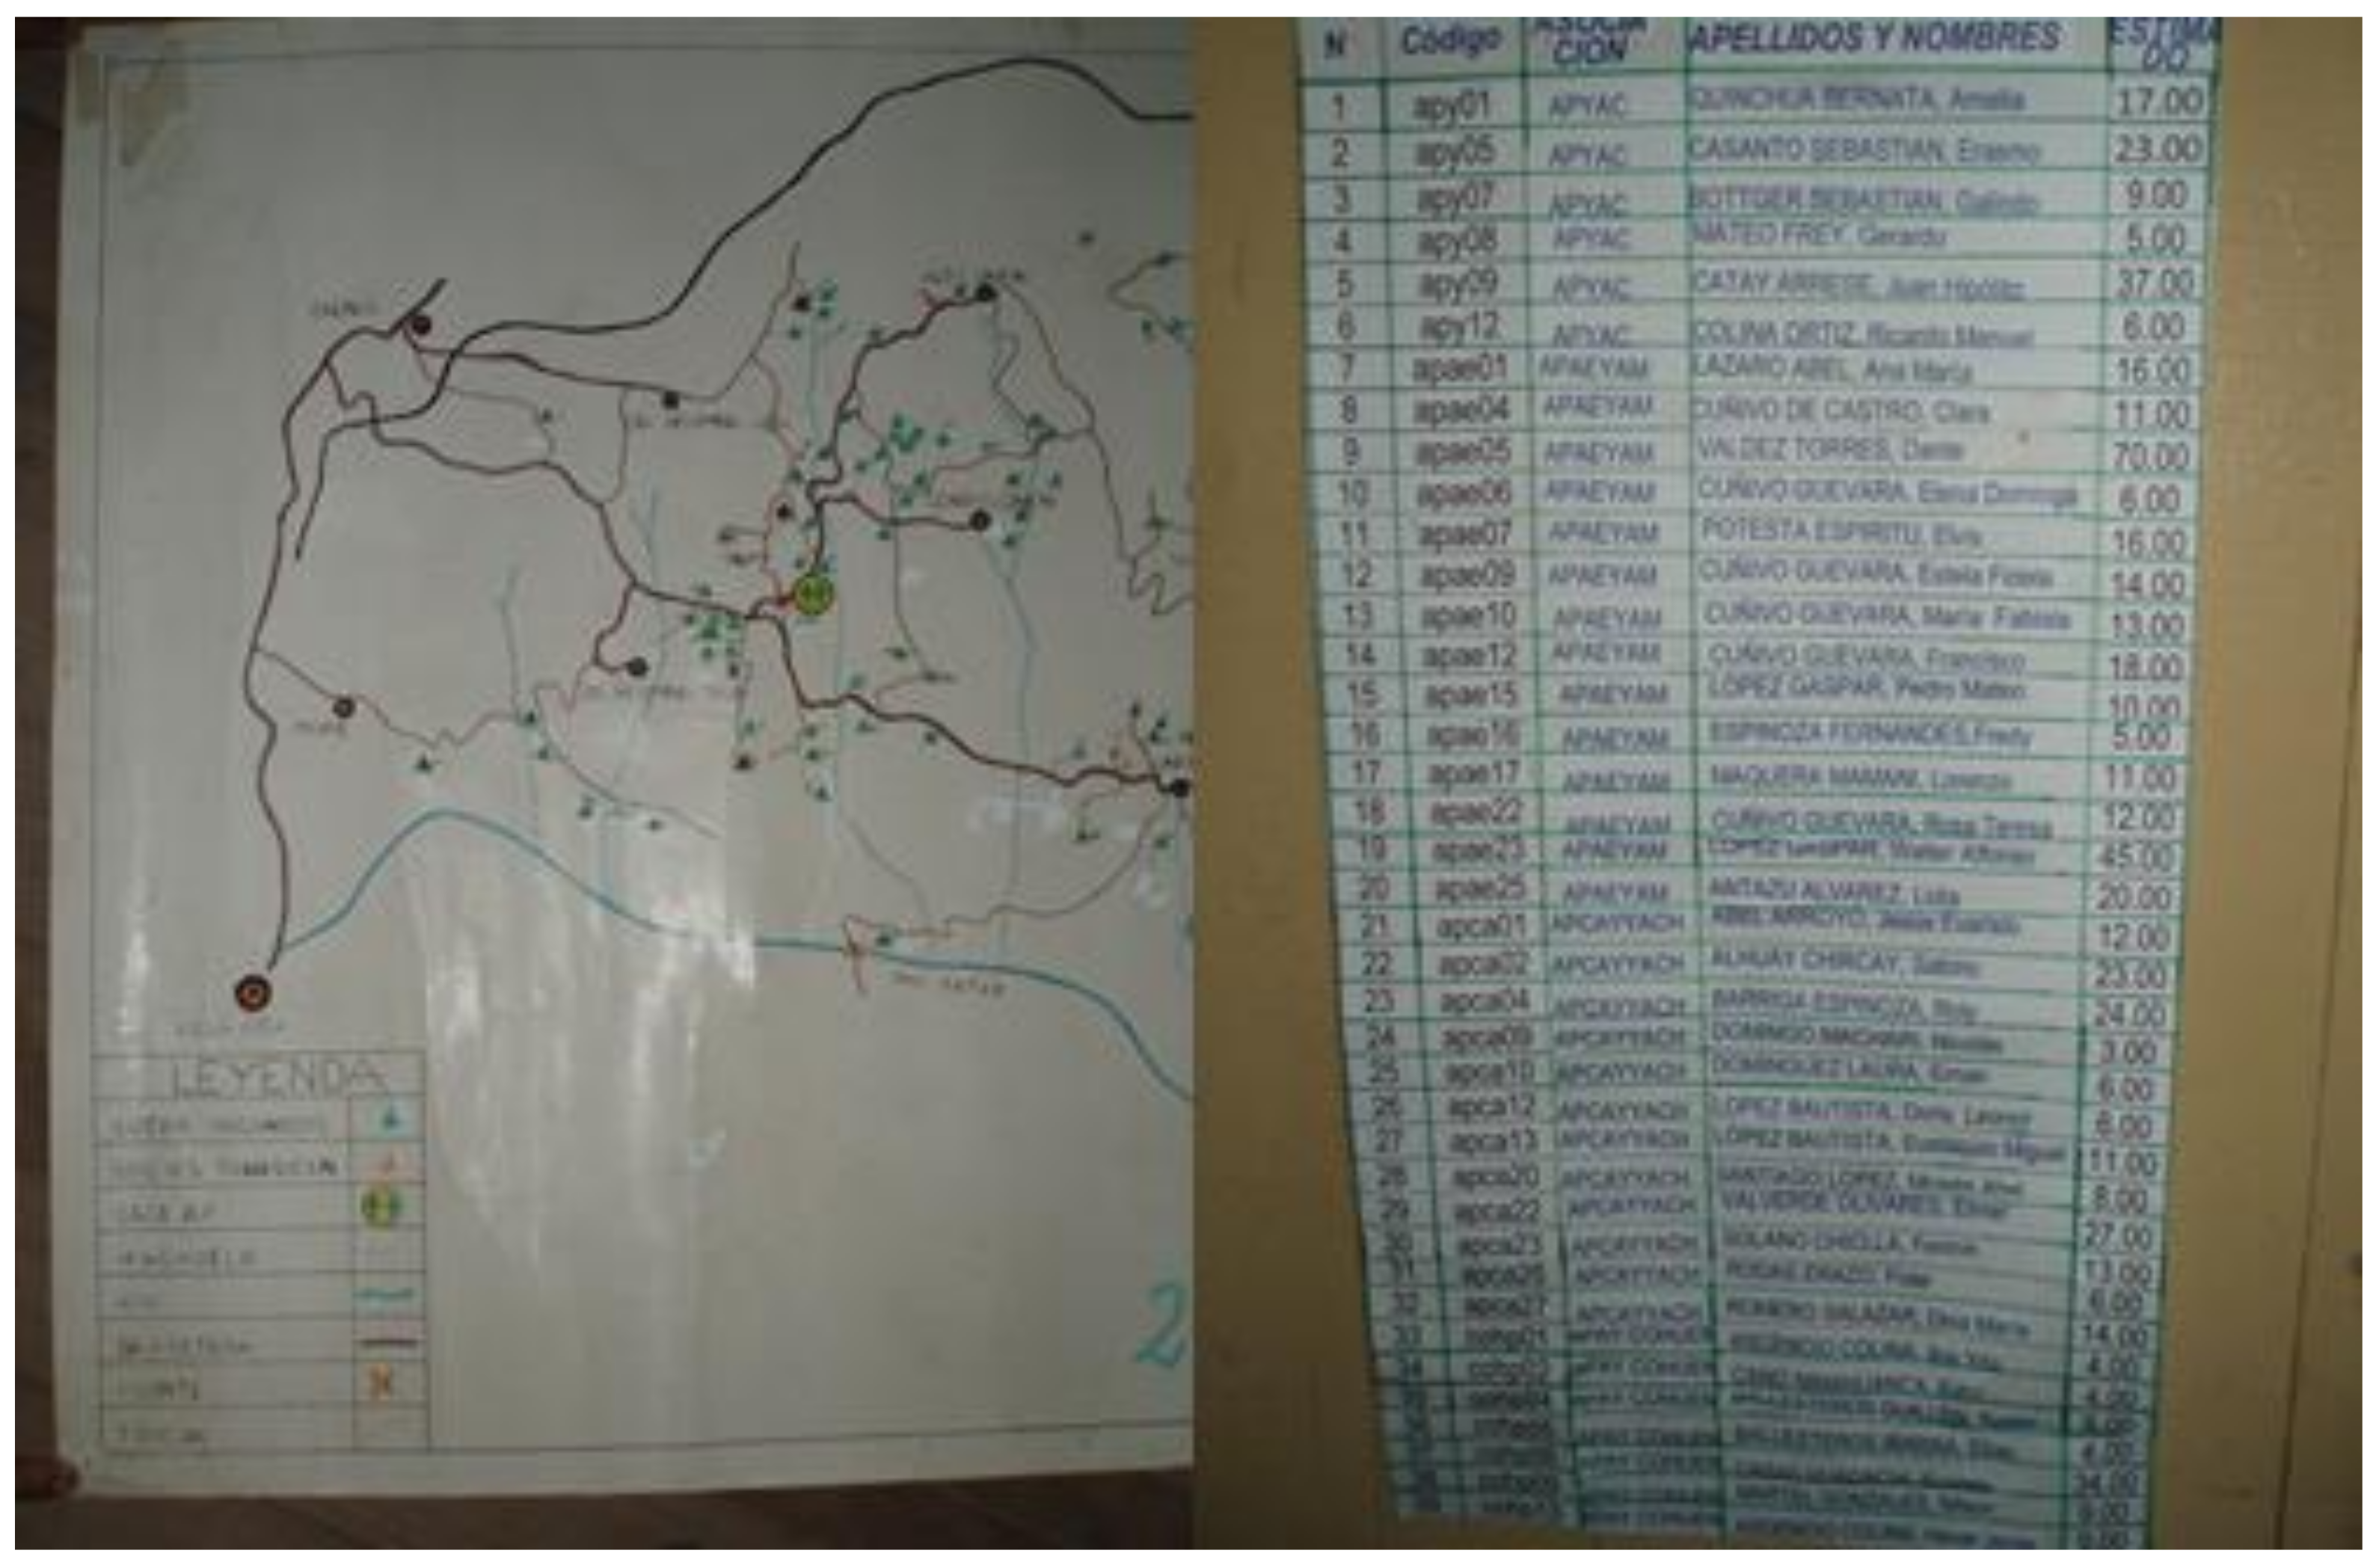
5.1. Mapping of Coffee Plantations in Villa Rica, Peru

The second case study described in this paper is focused on the collaborative mapping of coffee plantations around Villa Rica city, Peru. There were neither analogues nor digital maps of coffee plantations before the project started. Local people did not use any cadastral areas, exact borders of owners nor any information about the kind of coffee or the value of the harvest. Coffee is the major economic resource in the described area and it is attractive for eco-tourism too. Based on those facts, a complex spatial database was created. There was an idea to develop Geographical Information System (GIS) available through the Internet platform. Besides attribute and spatial information about coffee plantations, it will supply the web presentation for tourism support as well.
Villa Rica City is located in the north-central Peru, about ten hours by car from Lima. It has about 30,000 inhabitants. It is an administrative area of Villa Rica region. It is famous because of high quality coffee. Coffee from Villa Rica received the certificate “El mejor cafe del Mundo—The best coffee all over the world” two times in the last decade. The reason is because of the manual processing, now very popularly known by the term eco-cultivation. However, Villa Rica is a poor region, not in the main focus of Peru government. For instance, the main route from Lima to Villa Rica is unpaved (no asphalt). Before the POPRAR project began, the Google Maps as well as OpenStreetMap showed Villa Rica as only two streets (see Figure 5).

5.2. Aim of the Project

There are lots of opportunities for the implementation of GIS in the rural areas of Peru, due to missing basic infrastructure. GIS tools could be deployed for small-scale mapping of specific areas using GPS (nature reserve, forest nursery, etc.) or the creation of maps in remote areas. Generally, high-quality maps are not available and many of them are drawn by hand (see Figure 6).
Coffee plantations were spread out in the mountains without any central organization. There was no managing element at the municipality level before. Basic information about localization of plantations, its areas or land-use were missing. The POPRAR project established cooperation with the association Cooperative Forestal Yanesha, which is interested in the promotion of bio-cultivation. Cooperative Forestal Yanesha represents an encouraging new idea for indigenous communities struggling to control their traditional culture and land and to participate in wider economies. The Federation of Yanesha Native Communities struggled to participate in the planning process and assert official recognition of existing Yanesha communities [36]. In fact, Cooperative Forestal Yanesha had a general overview (knowledge) about local coffee plantation, but they did not have any tools and technology for managing it.
The project designed by POPRAR is focused on creating a comprehensive database accompanied by a marketing study and promotional materials, according to See-Think-Do concept. According to [37] See-Think-Do “is a framework originally used as an approach focused on a service and product marketing”, currently implemented in other fields such as collaborative mapping and crowdsourcing. The Cooperative Forestal Yanesha had a strong requirement for the development of such projects. Based on the fact that cooperation could be beneficial for both parties (see Table 1) an agreement between POPRAR and Cooperative Forestal Yanesha was signed (see Figure 7). The POPRAR project would fill the needs such as increasing students’ knowledge, practical experiences, development process, etc. Meanwhile, Cooperative Forestal Yanesha would receive complex web-based GIS tools for plantations management and tourism support based on cloud computing [38].
The mapping of coffee plantations was a fully geoinformatics project. The proposal aimed to record spatial areas of coffee plantations including attribute information (size, use, irrigation, method of growing coffee and other specifics). Moreover, it contained the current position of all Points of Interest (POI) and important places in Villa Rica City (hotels, restaurants, shops, etc.) with available information (opening hours, contacts, www, photo etc.).
There was a requirement for creating a public presentation as well. That is the reason why the obtained data was embedded in a free community project OpenStreetMap. It allowed both the recording of spatial data for plantations mapping and the visualization for the public. Based on the OpenStreetMap interface, an easy-to-deploy interactive web map application was created.
The mapping process was originally designed for a group of 6–8 students and it was divided into two main levels: terrain mapping in the field and map processing on the computer.
  • Field mapping by GPS
    Villa Rica City—Points of Interests
    Villa Rica surrounding—roads
    Coffee plantations
  • Map processing
    Data processing (from GPS into GIS)
    Database creating
    Recording into OpenStreetMap (by JOSM)
    Interactive map application development
Based on the experiences of real field mapping, the process of collaborative mapping played a crucial role. The primary idea was for students to map coffee plantations. This idea was repudiated soon. It was not possible to map coffee plantations without local guides. Firstly, there was a lack of knowledge of the area. Secondly, it was necessary to involve students with advanced knowledge of Spanish for information retrieval. Thirdly, some local volunteers joined us for mapping process. Students had to divide and then map with local guides. They did not map the area together as intended, but separately in different areas. In fact, students involved guides and volunteers created a team of individual collaborations. Moreover, during the data processing on the computer, local municipalities gave additional information based on satellite images. That shows that the POPRAR project is based on a multi-level collaborative process.

5.3. Technology, Data, Methods

First of all, there were almost no cadastral maps of the described area. The primary sources were own field mapping by GPS supported by hand-drawn maps of local guides. The satellite image of the Villa Rica region was of poor quality. It was not possible to use the satellite images for large-scale mapping. The satellite images served as a basis for retaining basemap only. They were used for the localization of points of interest and landmarks. It was not able to identify separate coffee plantations on satellite images because of the low spatial resolution. That was the main reason why field mapping was the primary source of mapping.
Students, guides and volunteers in the field adopted roles of field workers, GIS experts and cartographers together. They investigated extensive field mapping using GPS devices. Outdoor GPS devices (Garmin 60CSX and Trimble Juno) were used for plantations and POI mapping. The next step was analytical processing in GIS. Finally, they created comprehensive map outputs into OpenStreetMap interface (JOSM was preferred). Each involved person had to work individually in the field, but also had to be a team member during map processing (excluding local volunteers without IT knowledge).

6. What We Can Learn from the Case Studies

The case-studies described above are two different examples how collaborative mapping and using open platforms, such as OpenStreetMap, can be used and utilized in collaborative mapping and community development. In both examples, a community was needed to start the mapping process, and in both it was the ease of the OpenStreetMap that facilitated the whole process.
Nevertheless, there were always certain minimal criteria that need to be fulfilled. In our two case-studies it was the existence of the community itself and some technical knowledge and the equipment.
Regarding the community, one can divide the whole group into two subgroups—local community and the external stakeholders (academics, NGOs, development and community workers). The level of involvement within the process of collaborative mapping follows the logic of the theory of participation and participation ladders (for more see [6,39]).
These two case-studies are different in terms of who is the active community within the project. In the Kenyan examples, once it was the local community and once it was the Western academic group. In the Peruvian example, the two groups had to cooperate in order to deliver the output. Thus, one can see that the structure of the community is not as important as the active involvement.
Considering the technical knowledge and the equipment available, all three groups (two Kenyans and one Peruvian) had almost the same basic tools such as GPS devices, poor maps of the local area and personal computers with Internet access.
The specific problem of collaborative mapping is the process of collaboration itself. There can be some constraints in the work when some people work separately, but simultaneously on one element. From a technical point of view it has to be ensured that features being edited by one person are locked. This is to ensure that the same content cannot be edited by more users at the same time. In every collaborative process, the time and/or permissions management is one of the keys to a successful project.
The biggest assets you can acquire are time available for the activity and people willing to invest their energy into the process. Generally, collaborative mapping made by volunteers brings profitable outputs. Maps made by these two projects will serve the general public. At minimum costs, increases in economic, tourism and production indicators can be achieved.

7. Conclusions

The paper describes the role of collaborative mapping. The authors focused on the role of the collaboration process in developing countries, especially in Kenya and Peru. The general objectives of collaborative mapping such as cost reduction, open access and data accuracy were discussed from the perspective of benefits to local communities and municipalities. The real experiences and knowledge were presented in two case studies. The first case study was focused on mapping the biggest informal settlement in Africa called Kibera, located in Kenya´s capital Nairobi. The second case study was focused on mapping coffee plantations in the Villa Rica region, Peru.
Several insights were gained from both case studies. First, collaborative mapping and digital participation provide an alternative approach on how to obtain spatial information. It could also be a new trend for developing countries because it brings more benefits compared to the commercial approach. The involvement of GIS tools for collaborative mapping such as OpenStreetMap provides new strategies to promote and attain economic development. The mapping of uncharted areas allows local communities to improve their economic situation in the region. Lastly, it increases the awareness and attractiveness of communities, which could result in greater tourist interest.

Author Contributions

J.P. is the main contributor. He is responsible for a general concept and case study in Kenya. R.N. is a correspondence author. He is responsible for a case study in Peru.

Funding

This research received no external funding.

Conflicts of Interest

The authors declare no conflict of interest.

References

  1. De Soto, H. Mystery of Capital: Why Capitalism Triumphs in the West and Fails Everywhere Else; Basic Books: New York, NY, USA, 2003. [Google Scholar]
  2. Goodchild, M.F. Citizens as sensors: The world of volunteered geography. GeoJournal 2007, 1–15, 211–221. [Google Scholar] [CrossRef]
  3. Butler, D. Virtual globes: The web-wide world. Nature 2006, 439, 776–778. [Google Scholar] [CrossRef] [PubMed]
  4. Rød, J.K.; Ormeling, F.; Van Elzakker, C. An agenda for democratising cartographic visualisation. Nor. Geogr. Tidsskr. 2001, 55, 38–41. [Google Scholar] [CrossRef]
  5. Alperovitz, G. A National Federation of Democratic Workplaces Can Lay the Foundation for Historic Change. Available online: http://www.geo.coop/archives/gar604.htm (accessed on 27 May 2014).
  6. Arnstein, S. A ladder of citizen participation. J. Am. Plan. Assoc. 1969, 35, 216–224. [Google Scholar] [CrossRef]
  7. Srinivas Sajja, P.; Akerkar, R. Intelligent Technologies for Web Applications; Chapman and Hall/CRC: New York, NY, USA, 2016; ISBN 9780429065965. [Google Scholar]
  8. Gartner, G. Applying Web Mapping 2.0 to Cartographic Heritage. E-Parimetron 2009, 4, 234–239. [Google Scholar]
  9. Zook, M.; Graham, M.; Shelton, T.; Gorman, S. Volunteered Geographic Information and Crowdsourcing Disaster Relief: A Case Study of the Haitian Earthquake. World Med. Health Policy 2010, 2, 6–32. [Google Scholar] [CrossRef] [Green Version]
  10. Neis, P.; Singler, P.; Zipf, A. Collaborative mapping and Emergency Routing for Disaster Logistics-Case studies from the Haiti earthquake and the UN portal for Afrika. Geoinform. Forum Salzbg 2010, 239–248. [Google Scholar]
  11. Heipke, C. Crowdsourcing geospatial data. ISPRS J. Photogramm. Remote Sens. 2010, 65, 550–557. [Google Scholar] [CrossRef]
  12. Rouse, J.; Bergeron, S.; Harris, T. Participating in the Geospatial Web: Collaborative Mapping, Social Networks and Participatory GIS. In The Geospatial Web; Scharl, A., Tochtermann, K., Eds.; Springer: London, UK, 2007; pp. 153–158. ISBN 978-1-84628-826-5. [Google Scholar]
  13. Balram, S.; Dragicevic, S. Collaborative Geographic Information Systems. In E-Learning Methodologies and Computer Applications in Archaeology; IGI Global: Hershey, PA, USA, 2008; pp. 325–341. [Google Scholar]
  14. Pánek, J. How participatory mapping can drive community empowerment—A case study of Koffiekraal, South Africa. S. Afr. Geogr. J. 2015, 97, 18–30. [Google Scholar] [CrossRef]
  15. Ramm, F.; Topf, J.; Chilton, S. OpenStreetMap: Using and Enhancing the Free Map of the World; UIT Cambridge Ltd.: Cambridge, UK, 2010; ISBN 1906860114. [Google Scholar]
  16. OpenStreetMap Foundation OpenStreetMap Data License Is ODbL. Available online: http://blog.osmfoundation.org/2012/09/12/openstreetmap-data-license-is-odbl/ (accessed on 12 February 2013).
  17. Haklay, M. How good is volunteered geographical information? A comparative study of OpenStreetMap and Ordnance Survey datasets. Environ. Plan. B. Plan. Des. 2010, 37, 682. [Google Scholar] [CrossRef]
  18. Affordable Housing Institute Kibera: Africa’s Largest Slum. Available online: http://affordablehousinginstitute.org/blogs/us/2005/07/kibera_africas.html (accessed on 28 March 2014).
  19. Ndeti, Y. Slums Have a History too. Available online: http://archive.oneworld.net/article/view/71289 (accessed on 28 March 2014).
  20. Davis, M. Planet of Slums; Verso: New York, NY, USA, 2006. [Google Scholar]
  21. Kibera UK Facts and Information about Kibera Kibera. Available online: http://www.kibera.org.uk/Facts.html (accessed on 28 March 2014).
  22. UN-Habitat Sanitation. Available online: http://www.unhabitat.org/content.asp?typeid=19&catid=548&cid=4962 (accessed on 28 March 2014).
  23. Desgroppes, A.; Taupin, S. KIBERA: The biggest slum in Africa? Les Cah. L’Afrique L’Est 2005, 44, 23–34. [Google Scholar]
  24. Marras, S. Mapping the Unmapped. Available online: http://www.afronline.org/wp-content/uploads/2009/06/kibera_mapping_the_unmapped.pdf (accessed on 23 May 2019).
  25. Kenya Government Nairobi Environs 1970. Available online: https://nairobiarch638.files.wordpress.com/2011/10/afr_kenaee2.jpg (accessed on 23 May 2019).
  26. Kenya Government City of Nairobi 1995. Available online: https://nairobiarch638.files.wordpress.com/2011/10/afr_kecn.jpg (accessed on 23 May 2019).
  27. Vlok, C.; Pánek, J. CAMP for change in the Bojanala Region of North West Province. In Proceedings of the GISSA Ukubuzana 2012 Conference Proceedings, Johannesburg, South Africa, 2–4 October 2012. [Google Scholar]
  28. Pánek, J. Participatory and Public Participation GIS: A Phenomenon of Neocartography with a High Potential in Developing Countries? In Proceedings of the Scale of Globalisation, Ostrava, Czech Republic, 8–9 September 2011; pp. 235–243. [Google Scholar]
  29. BBBike.org Map Compare. Available online: http://mc.bbbike.org/mc/ (accessed on 25 June 2013).
  30. Pánek, J.; Sobotova, L. Community Mapping in Urban Informal Settlements: Examples from Nairobi, Kenya. Electron. J. Inf. Syst. Dev. Ctries. 2015, 68, 1–13. [Google Scholar] [CrossRef] [Green Version]
  31. Map Kibera Project Map Kibera Project. Available online: http://mapkiberaproject.yolasite.com/ (accessed on 12 February 2013).
  32. Map Kibera Map Kibera. Available online: http://mapkibera.org/ (accessed on 12 February 2013).
  33. Map Kibera Some Notes on Map Kibera Mapping. Available online: http://www.mapkibera.org/blog/2010/01/12/some-notes-on-map-kibera-mapping/ (accessed on 29 April 2013).
  34. Map Kibera Project Map Kibera Project Mission. Available online: http://mapkiberaproject.yolasite.com/mission.php (accessed on 4 April 2014).
  35. Hagen, E. Mapping Change: Community Information Empowerment in Kibera (Innovations Case Narrative: Map Kibera). Innov. Technol. Gov. Glob. 2011, 6, 69–94. [Google Scholar] [CrossRef]
  36. Simeone, R.; Pariona, M.; Lazaro, M.A. Natural Harvest | Cultural Survival. Available online: https://www.culturalsurvival.org/publications/cultural-survival-quarterly/natural-harvest (accessed on 15 July 2019).
  37. Netek, R.; Panek, J. Framework See-Think-Do as a tool for crowdsourcing support—Case study on crisis management. Int. Arch. Photogramm. Remote Sens. Spatial Inf. Sci.—ISPRS Arch. 2016, XLI-B6, 13–16. [Google Scholar] [CrossRef]
  38. Netek, R. Interconnection of Rich Internet Application and Cloud Computing for Web Map Solutions. In Proceedings of the 13th SGEM GeoConference on Informatics, Geoinformatics and Remote Sensing, Albena, Bulgaria, 16–22 June 2013; Volume 1, pp. 753–760. [Google Scholar]
  39. Connor, D.M. A new ladder of citizen participation. Natl. Civ. Rev. 2007, 77, 249–257. [Google Scholar] [CrossRef]
Figure 1. Nairobi and surrounding area on six map services at scale 1:35,000.
Information 10 00255 g001
Figure 2. Part of the Kibera area on six map services at scale 1:4000.
Information 10 00255 g002
Figure 3. Part of the Mathare area on OpenStreetMap and Google Maps at scale 1:4000.
Information 10 00255 g003
Figure 4. Part of the Mukuru area on OpenStreetMap and Google Maps at scale 1:4000.
Information 10 00255 g004
Figure 5. Villa Rica city on 4 map services at scale 1:20,000, retrieved in April 2014.
Information 10 00255 g005
Figure 6. State before starting mapping project—hand-drawn maps and tables of coffee plantations.
Information 10 00255 g006
Figure 7. Signing of the contract between POPRAR and Cooperativa Yanesha, Peru.5.3. Content of the Project
Information 10 00255 g007
Table 1. Offers and request of POPRAR (Support of Practical Competencies in Regional Development) project.
Offer of POPRAR:Offer of Cooperative Forestal Yanesha:
Request of POPRAR project:---Local knowledge, connection on municipality, local support
Request of Cooperative Forestal Yanesha:Technology, tools, equipment, students---

