Multi-Regional Online Car-Hailing Order Quantity Forecasting Based on the Convolutional Neural Network
by
Zihao Huang
1,2, 
Gang Huang
3,
Zhijun Chen
1,2,*,
Chaozhong Wu
1,2,
Xiaofeng Ma
1,2 and
Haobo Wang
1,2 1
School of Energy and Power Engineering, Wuhan University of Technology, Wuhan 430063, China
2
Intelligent Transportation System Research Center, Wuhan University of Technology, Wuhan 430063, China
3
Traffic Management Research Institute of the Ministry of Public Security, Wuhan 430063, China
*
Author to whom correspondence should be addressed.
Information 2019, 10(6), 193; https://doi.org/10.3390/info10060193
Submission received: 23 April 2019
/
Revised: 19 May 2019
/
Accepted: 28 May 2019
/
Published: 4 June 2019
(This article belongs to the Special Issue Machine Learning on Scientific Data and Information)
Abstract
:With the development of online cars, the demand for travel prediction is increasing in order to reduce the information asymmetry between passengers and drivers of online car-hailing. This paper proposes a travel demand forecasting model named OC-CNN based on the convolutional neural network to forecast the travel demand. In order to make full use of the spatial characteristics of the travel demand distribution, this paper meshes the prediction area and creates a travel demand data set of the graphical structure to preserve its spatial properties. Taking advantage of the convolutional neural network in image feature extraction, the historical demand data of the first twenty-five minutes of the entire region are used as a model input to predict the travel demand for the next five minutes. In order to verify the performance of the proposed method, one-month data from online car-hailing of the Chengdu Fourth Ring Road are used. The results show that the model successfully extracts the spatiotemporal features of the data, and the prediction accuracies of the proposed method are superior to those of the representative methods, including the Bayesian Ridge Model, Linear Regression, Support Vector Regression, and Long Short-Term Memory networks.
1. Introduction
In recent years, the growing urban population has given rise to the problem of serious traffic congestion. Due to the asymmetry of information, it is very difficult to take a taxi in some areas of big cities, and people sometimes cannot take a taxi, even after a long waiting time. Currently, with the increasing popularity of taxi requesting services such as Uber and Didi Chuxing, there are a large number of online car-hailing users and a massive amount of travel data has been accumulated, which provides a new idea for solving the above problems. By using the online car-hailing data to accurately predict the travelling demand, the hot areas with high demand in cities can be fully explored, helping drivers and passengers to make the right decisions. Online car-hailing demand forecasting is based on a large amount of historical travelling data, and the future state is estimated through learning from the experience and knowledge of the data. These data, as a key part of the overall demand forecast, have a great impact on the forecast results. The travelling data of online car-hailing with the features of a large data volume, wide coverage, and high precision, having been recorded, collected, stored, and managed by the taxi platform, bring new opportunities for an accurate prediction of the online car demand.
In past research, in order to predict traffic conditions at different times, researchers have initially used average historical data as a forecast, and then focused on time series prediction methods, including the autoregressive integrated moving average (ARIMA) model and its variants [1,2,3]. Many excellent neural network models have recently emerged, for example, the Long Short-Term Memory (LSTM) model [4], which is capable of modeling complex sequential interactions and exhibits a superior performance compared to traditional prediction methods of time series. In subsequent research, the accuracy of the forecast has continued to be improved by enriching the characteristics of the data, such as weather, accident, holiday, and historical data. Most of them, however, ignore the spatial relationship of data.
When the factors of spatial properties are considered, the distribution of the demand is very complicated, especially in big cities, which can be proved by the fact that there is a high demand for online car-hailing in some areas, while a low demand in other areas. In addition, the demand law is different in various regions with time. In terms of predicting the travel demand, the traditional forecasting model can generally achieve better results in single areas than in the multiple regions of big cities because of its relatively monotonous spatial property. This is because it is not easy to present the completely different demand patterns of hundreds of regions with a single model. Therefore, we propose a prediction model based on convolutional neural networks which focuses on the spatial relationship of data.
In this paper, we learn the spatial distribution of data by constructing a convolutional neural network, and the latitude and longitude coded data maps are employed as the input of the model. Our approach is validated by the large-scale real-world data of Didi Chuxing, which contains online car-hailing requests for service centers in Chengdu, China. We have conducted extensive experiments to compare our research with the most advanced methods and have proved that our method has a superior performance. In summary, our contributions are summarized below:
- We propose a convolutional neural network model to capture the local spatial distribution features of a global map;
- The automatic extraction of the demand map from a large amount of request data has been achieved with only a few manual operations;
- We convert continuous time periods into a combination of multiple maps to improve the accuracy of the forecast.
The remainder of this paper is structured as follows. After a review of related work in Section 2, we introduce the model in Section 3 in detail. The preprocessing work of the data set and the experimental setup of the evaluation model are introduced in Section 4. Finally, we describe and analyze the results of the experiment in detail. The experimental research process is shown in Figure 1.
2. Related Work
In this section, backgrounds related to traffic demand forecasting, convolutional neural networks, and big data-driven deep neural networks are provided.
2.1. Travel Demand Forecast
In the transportation field, traffic forecasting in terms of short-term traffic flow, travelling Origin to Destination (OD), traffic demand, travelling time, and travelling mode has been much addressed by researchers. Accurate forecasting, which provides effective data for traffic planning and management, is key improving the traffic efficiency. As early as the 1980s, researchers began to study the prediction of various traffic volumes [5,6]. There are many types of prediction methods, which are mainly divided into parameterization methods and non-parameterization methods. Typical parameterization methods are the Kalman filter model [7,8], Autoregressive Integrated Moving Average Model [1,2,3,9], K-nearest neighbor model [10], etc. Additionally, non-parametric methods include Support Vector Machine models [11], Bayesian network models [12], the Backpropagation neural network model [13], Long Short-Term Memory models [4,14], and some combined neural network models [15]. Among these prediction methods, neural networks have become the priority of many experts and scholars because of their large parallel structure and distributed storage.
2.2. Convolutional Neural Network
Deep learning is making an even greater contribution in the field of artificial intelligence research, especially in speech recognition and image recognition. In addition, researchers have used the deep learning method to achieve good results in other fields, including Go artificial intelligence Alpha Go [16]. Deep learning algorithms can be divided into four categories: deep neural networks, convolutional neural networks, recurrent neural networks, and reinforcement learning [17]. Nonlinear and random problems can be solved through the artificial neural network (ANN) [18]; when the data type is time series data, the recurrent neural network (RNN) can be employed to predict the time series. Surprising results have been obtained in image recognition by using convolutional neural networks. Through taking advantage of the powerful feature extraction capabilities of convolution kernels, the primary and advanced features of images are combined to classify and identify images.
In the field of intelligent transportation, data often have complex spatial characteristics, such as the traffic volume and traffic demand in regional space. Shahsavari [19] attempted to apply convolutional neural networks to the traffic field to capture spatial features with their powerful feature recognition capabilities. On the other hand, with its strong nonlinear ability, the convolutional neural network can approximate any nonlinear function and show great potential in prediction, if the amount of data is sufficient. That is why some scholars have used convolutional neural networks to deal with traffic problems. Wu used the convolutional neural network to extract the spatial characteristics of highway traffic flow data [20]. In order to solve the traffic problem with the background of big data, using the deep learning method to reasonably make predictions is a hot trend.
2.3. Big Data Driven Deep Neural Network
At present, with the development of various high-tech technologies and the upgrading of sensor devices, the amount of data generated in the traffic field has reached the terabyte level. A variety of complex data features and behavior patterns are unavailable in the context of big data, posing a great challenge to the processing of big data [21]. Unlike shallow learning, deep learning has massive parameters, complex network structures, and excellent functional forcing capabilities. After training the neural network, it is possible to deal with very complex nonlinear problems and to make patterns available in big data. Many big data driven deep networks are used in the transportation sector. When using auto-encoders as building blocks, a deep architecture model [22] is applied to represent traffic flow features for the prediction in the context of big data. Y Chen used time series functions to analyze large amounts of data and constructed a deep learning network to extract traffic flow characteristics [23]. Additionally, Wibisono used a method called Fast Incremental Model Trees-Drift Detection (FIMT-DD) to analyze and predict a very large traffic data set [24].
3. Materials and Methods
In this section, a multi-region travelling demand forecasting method based on deep learning is described. In the process of visualization, we project all order data onto the map according to latitude and longitude. As is shown in Figure 2, the demand for online car-hailing in different regions and times presents a regular change. By analyzing the results of data visualization, we found several interesting phenomena:
- Spatial characteristics. The travelling demand in different areas of the city varies greatly, and the different social characteristics of areas directly determine the level of travelling demand. Therefore, some areas have been in a high demand state and some have been in a low demand state. When making predictions, it is necessary to fully consider the global position of the area to improve the accuracy of prediction;
- Temporal characteristics. Although the travelling demand levels in different regions vary greatly, the changes of demand in all regions will be affected by a person’s daily schedule, being active at noon but slack in the early morning;
- Periodic variation characteristics. The data present daily and weekly periodic changes.
In summary, a good demand forecast model for multiple regions should have a certain ability to sense the location of the region and also have some memory capabilities in terms of the time series. In this way, when inputting the historical data of a certain area, the model can accurately predict the subsequent demand.
Considering the characteristics of the online car-hailing travelling data, we finally decided to use the convolution neural network (CNN) for prediction after a series of studies and attempts. The CNN preserves the geometric features of the picture during the convolution operation, which means that by taking the demand map as a picture, the CNN can also preserve the spatial characteristics of the demand map. The author proposes the online car-hailing convolutional neural network (OC-CNN) model, and the specific structure of the model is shown in Figure 3.
To learn the spatial features of the travelling data, the OC-CNN uses the travelling demand maps in the entire Chengdu area as the input. The OC-CNN model has one input layer, two convolution layers, one dropout layer, one flatten layer, and one full connection layer, and it does not use the pooling layer and is without nonlinear activation before the last layer of the output. This is the difference between the traditional convolutional neural network and OC-CNN. For the 16*16 demand map, the data for each square represent the travel demand for an area in the city; every square is important and does not need to be pooled.
Apart from considering the spatial characteristics of the travel demand data, its variation in time series also needs to be taken into account. The OC-CNN model takes the three-dimensional matrix as the input, input = [16,16,p], where the first and second dimensions are the divisions of the region, the entire prediction area is divided into 256 areas according to latitude and longitude, and the third is used as the time dimension. We employ the number of online car-hailing orders per five minutes in the whole region as the travelling demand map, and then use consecutive p travelling demand maps as the input, as is shown in Figure 4. The x-axis and y-axis indicate that the entire area is meshed, and the t-axis represents time, with a scale of five minutes. Each demand map in the figure indicates the number of travel needs for each small area within five minutes.
The travelling demand map data are entered into two-dimensional convolution and a non-linear activation operation is added after each convolutional layer. In order to balance the convergence speed of the model and the complex nonlinear characteristics of the data, ReLU is used as the nonlinear activation function because it has been proven that it can eliminate the phenomenon of “gradient disappearance” in the model solution process [25]. In the process of training neural networks, the dropout layer is very useful as it can solve the over-fitting problem [26]. Finally, the flat layer and the fully connected layer are used to transform the output into the one in the real region.
In this study, the traditional two-dimensional CNN is employed to capture spatial features in the prediction of the travelling demand for different areas in big cities. Suppose we need to predict the demand of all regions, we should divide the historical demand matrix into a three-dimensional matrix Sd by space and time, considering the regular changes of the historical demand over time.
The 1, 2, 3, and p accordingly represent 0~5 min, 5~10 min, 10~15 min..., and 5(p − 1)~5p min of the historical demand matrix. represents the travel demand of the online car-hailing in the area of (m, n) in a certain time period. A convolution operation is performed in the historical region demand matrix of different time periods to extract its spatial features, wherein the nth feature matrix generated by the convolution operation is expressed as follows:
where is the weight vector, is the deviation, * indicates the convolution, and indicates nonlinear activation. In this study, the ReLU function is chosen as the nonlinear activation function.
The final proposed OC-CNN model for travel demand prediction based on deep learning is trained in an end-to-end manner. Specifically, the Adamax optimizer used in this paper is a special stochastic gradient descent (SGD) method for training models. The OC-CNN model uses the mean square error as the objective function, so that the predicted value constantly approaches the real value and reaches the prediction accuracy.
4. Results
4.1. Data Preprocessing
Derived from the Didi Chuxing GAIA Initiative, the data used in this study include a total of 30 days of about 7.5 million online car-hailing travel records from 1 November to 30 November 2016 in Chengdu. Among these records, the latitude and longitude of the starting place, the GPS track of the car, and the time stamp are involved in each order, as is shown in Figure 5.
To improve the quality of the data, the data have been preprocessed in this study. According to the results of data visualization, the Chengdu Fourth Ring Region, longitude between (103.930362, 104.216382) and latitude between (30.565334, 30.792188), which contains 97% of records, is selected as the scope of the study with the order data outside the specified area deleted, as is shown in Figure 6. At the same time, the selected area is meshed into small areas of 16*16 according to the latitude and longitude. The experimental data are updated at a frequency of five minutes to ensure that the prediction results have a better timeliness. The quantity of the order in each area is counted every five minutes, and the original data set is transformed into the urban area demand matrix. To construct the data set for the experiment, there is a need to take the travel demand matrix of 5p min before the current time period as the input sample and the travel demand in the next 5 min as a label.
4.2. Experimental Setup
In this experiment, p = 5, which means the historical data of the first 25 min is used to forecast the travel demand for the next 5 min in all four-ring areas of Chengdu. For example, suppose it is 12:30 now, the historical travel demand matrix of five time periods (12:05~12:10, 12:10~12:15, 12:15~12:20, 12:20~12:25, and 12:25~12:30) is used to predict the travel demand in various regions in the next 5 min (12:30~12:35). The travel demand data set before 8 November 2016 will be used to train the forecasting model, and the rest of the data from November 29th to 30th will be used for the evaluation.
In this study, the OC-CNN model is trained by the Adamax optimizer in batches of 128, using 10% training data as a validation set to avoid overfitting. Two 2D convolutional layers are activated by the ReLU function. As the relation between the number of feature maps and the time of training the model is positive, after many experiments, the number of feature maps is fixed at 15 to balance the computational cost and prediction accuracy. To determine the size of the convolution kernel in the OC-CNN model, 15 given convolution kernels are tested. Referring to related research, it is found that the final prediction accuracy is higher when using a smaller convolution kernel, and its size is finally identified as 3*3. The coefficient in the dropout layer is designed as 0.2 to prevent overfitting of the model. The number of training samples is 8000, and the predictive model is trained to predict the travel demand at these 256 locations.
4.3. Discussion
4.3.1. Spatial Perception of the Model
The forecast results in Figure 7 show the demand for online car-hailing in all 256 regions at different time periods. We can see that the model has successfully learned reasonable spatial characteristics. For example, there is a low demand heat in the early morning and when it is the morning peak hour (8:00), the demand rises to a higher value. The model can also reveal the high demand areas of the city, which can demonstrate that central demand areas remain at a relatively high level in different time spans.
Compared with the actual hot regions, we find that the prediction results are basically consistent with the actual results, as is shown in Figure 8.
4.3.2. Temporal Perception of the Model
In this part, we select the small areas numbered 24, 56, 87, and 104 and focus on the performance of the model for the accurate prediction of individual areas. The continuous prediction of a single region shows that the model has a perception of the temporal characteristics of the data and obtains the trends of the future demand from the input historical data, as is shown in Figure 9. By comparing No. 24 with No. 104, we find that the prediction accuracy of the model in the low-demand area is significantly higher than that in high-demand areas. The possible reason for this phenomenon is that the relatively higher number of low-demand areas helps the model learn richer features, and vice versa.
4.3.3. Comparison of Prediction Accuracy
The proposed OC-CNN model is compared with several other regression prediction methods, including:
- Bayesian Ridge Model: Bayesian Ridge Regression is a ridge regression model solved by Bayesian inference in statistics. We chose the Bayesian network model [12];
- Linear Regression: we chose ordinary least squares regression (OLSR);
- Support Vector Regression (SVR): SVR is an important application branch of the Support Vector Machine (SVM) for solving regression problems [11];
There is a need to use the models in the sklearn library in terms of building the Bayesian Ridge, Linear Regression, and Support Vector Machine Regression. Unlike the proposed OC-CNN model, twenty different areas are selected to construct a travel demand data set for a certain area, and P = 12, which means that the data results of the five different regions are averaged to obtain the final prediction effect of the model by using the historical travel data one hour before to train the models. The LSTM neural network sets the number of input nodes to 1, hidden layers to 2, hidden layer nodes h to 68, and truncation length to 2, and all models use 8000 sets of data as the training set and the remaining samples serve as test sets.
In order to compare the accuracy of different prediction methods, the mean absolute error (MAE) and root mean square error (RMSE) are taken as the main indicators. At the same time, variance analysis is carried out to compare the performance of different prediction schemes. The evaluation indicators are defined as follows:
Among them, indicates the total number of predicted points, indicates the predicted value, and indicates the true value. Table 1 gives the error indices predicted by different methods at future time points.
By comparing the mean absolute error with the mean square error, it is surprising to find that the error value of the OC-CNN model is significantly smaller than the other methods. We found that it may be affected by the number of selected regions. The comparison algorithm can only predict the travel demand of a single region or part of a region in Chengdu, while the OC-CNN model can be used to predict all 256 regions at the same time. As the model can make a relatively accurate prediction for most of the regions with low demand, the final error value can be greatly reduced after the travel demand, very small or even 0, is averaged in most regions. Overall, the model displays a strong power for the fitting of demand in large-scale regions and the predictive capability of the model is proved by the experiment, as is shown in Table 1.
According to the above analysis, we found that the model performs well for low-demand regions in all regions, while the prediction results in high-demand regions are less than ideal, which results in lower R2 values. However, it is undeniable that the model can accurately identify high-demand areas and low-demand areas. Based on this, in order to prove the overall performance of the model, we separate the high-demand areas from the low-demand areas to train the high-demand areas independently. Combined with the above results, we define Sh as the high-demand areas and divide the definition of the areas according to the previous grid. Sh is defined as follows:
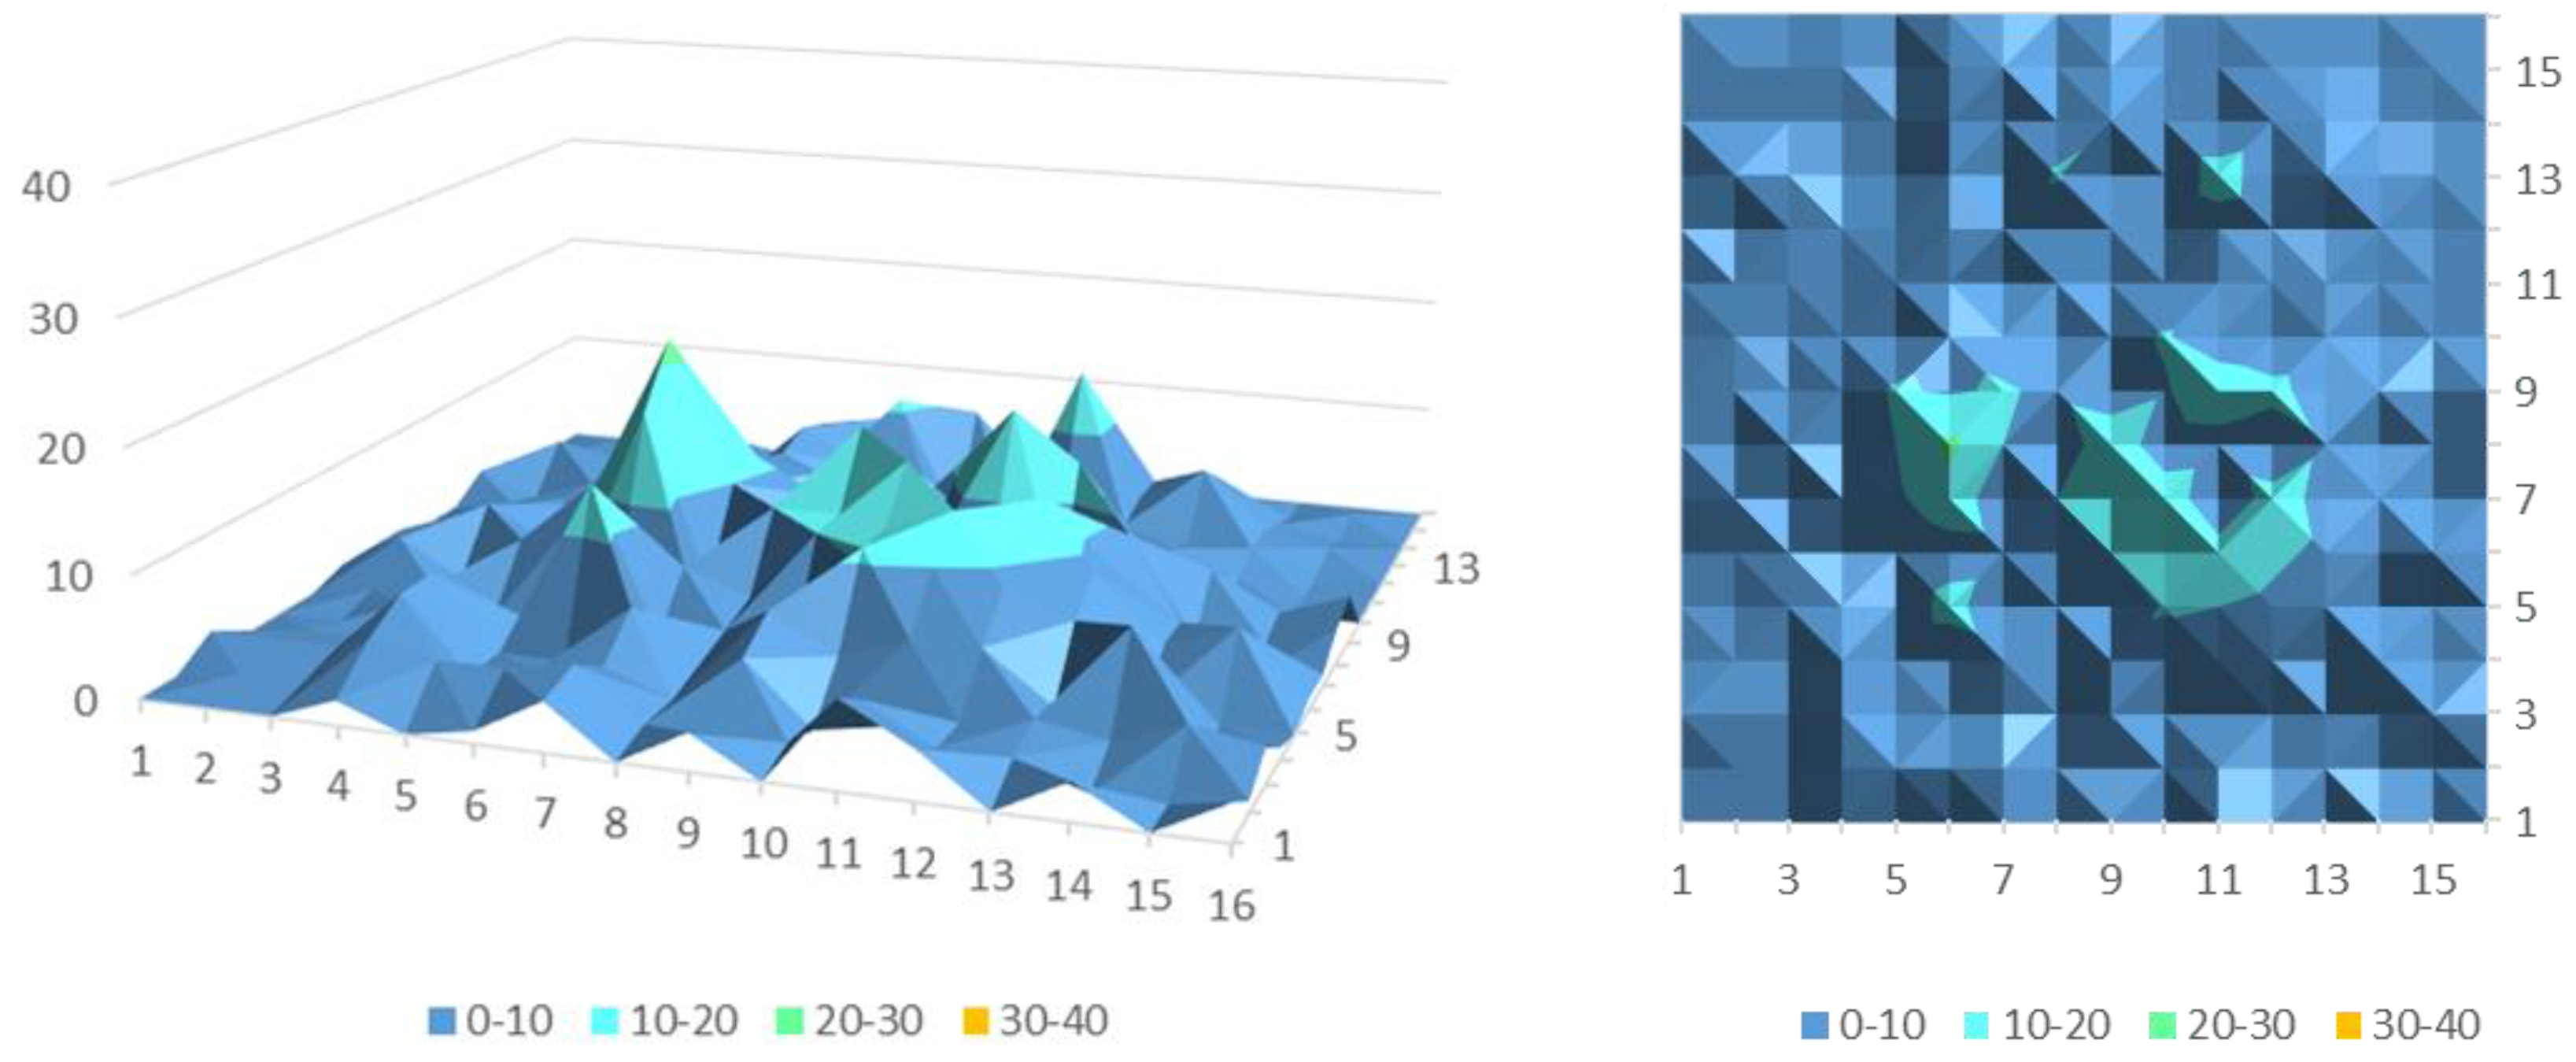
After a simple linear calculation, it can be concluded that the longitude is between (104.001867, 104.144877) and its latitude is between (30.6220475, 30.7354745). When obtaining a separate high-hotspot area, we have meshed the area into smaller grids, which can help obtain more refined prediction results and give a stronger guidance to drivers. We have divided the hotspot area into 256 smaller areas and recreated the travel demand map datasets of high-demand areas at different times by using historical travel records. We have also used the OC-CNN model for training and finally obtained the following training results, as is shown in Figure 10 and Figure 11.
The performance of the model after remodeling the central area is shown in Table 2. By comparing the results of the two experiments, we found that the value of MAE has increased. This is because after the exclusion of large areas of low-value areas, only the high-heat areas with a higher average demand are left, and the fluctuation range of prediction results becomes larger. This does not mean that the accuracy of the model has deteriorated. On the contrary, we can see that the RMSE value and the R2 value of the model are improved, which means that the complexity of the feature has been lowered after the exclusion of the low-value regions. As a result, the model can easily produce a better prediction effect. On the other hand, in the prediction of the high-demand areas, we can find that the model has learned a more detailed distribution of demand. After we subdivide the grid, the high-demand distribution is no longer simply stacked together. Instead, it becomes more dispersed and more in line with the laws of the real geographical distribution. This fully demonstrates that it is feasible and promising to use the OC_CNN model for travel demand forecasting.
5. Conclusions
This study mainly proposes a method based on the convolutional neural network to predict the travel demand of different regions. This method has the following advantages:
- The graphical processing of traffic data is applied. The urban traffic based on a complex road network is interconnected and has spatial attributes. The graphical processing for the urban travel demand data can retain the spatial attributes while presenting the characteristics of traffic data, and reduce the loss of hidden attribute resources in the data;
- The travel demand matrix of the whole urban area is taken as the input of the model. By using this method, the spatial distribution of travel demand can be learned to the greatest extent, and global planning can be carried out to improve the transportation efficiency of online car-hailing. At the same time, other elements can be easily added to the travel demand map, which intensifies the universality and robustness of the method;
- Timing issues are taken into account when making data sets. Then, adding the time dimension to the model and more accurate predictions are obtained. The size of the meshing can be adjusted when making the dataset, and the size of the prediction area can also be easily adjusted.
The results prove that the OC-CNN model based on the convolutional neural network is feasible to predict the urban travel demand. The model can easily and accurately distinguish the areas with a high and low travel demand, and exhibits an excellent performance for obtaining the prediction results of large-scale low-demand areas. The training results of the high-traffic demand area show that the model can learn rich graphical features to reach the goal of predicting the travel demand. Although the model can learn the global characteristics of the hotspot distribution, the prediction accuracy of some areas still needs to be improved. The impact of overall factors (such as weather, holidays etc.) on forecasting results will be considered and the effects of different neural network combinations will be explored in future work. In addition, we will try to make smaller meshes and enrich the spatial features of the map.
Author Contributions
Conceptualization, Z.C.; data curation, Z.H. and G.H.; formal analysis, Z.H. and G.H.; methodology, Z.H.; resources, C.W.; software, X.M.; supervision, C.W.; visualization, H.W.; writing—review & editing, Z.C.
Funding
This work is supported in part by the National Natural Science Foundation of China under Grants 61703319, U1764262, and 51775396, and in part by the National Key R&D Program of China under Grant 2017YFB0102500.
Acknowledgments
The authors would like to thank Didi Chuxing for its support in data provision. Data were retrieved from Didi Chuxing through https://gaia.didichuxing.com.
Conflicts of Interest
The authors declare no conflict of interest.
References
- Li, X.; Pan, G.; Wu, Z.; Qi, G.; Li, S.; Zhang, D.; Zhang, W.; Wang, Z. Prediction of urban human mobility using large-scale taxi traces and its applications. Front. Comput. Sci. 2012, 6, 111–121. [Google Scholar]
- Moreira-Matias, L.; Gama, J.; Ferreira, M.; Mendes-Moreira, J.; Damas, L. Predicting taxi–passenger demand using streaming data. IEEE Trans. Intell. Transp. Syst. 2013, 14, 1393–1402. [Google Scholar] [CrossRef]
- Shekhar, S.; Williams, B. Adaptive seasonal time series models for forecasting short-term traffic flow. Transp. Res. Rec. 2008, 2024, 116–125. [Google Scholar] [CrossRef]
- Yu, R.; Li, Y.; Demiryurek, U.; Shahabi, C.; Liu, Y. Deep learning: A generic approach for extreme condition traffic forecasting. In Proceedings of the SIAM International Conference on Data Mining, Houston, TX, USA, 27–29 April 2017. [Google Scholar]
- Levin, M.; Tsao, Y.D. On forecasting freeway occupancies and volumes. Transp. Res. Rec. 1980, 773, 47–49. [Google Scholar]
- Okutani, I.; Stephanedes, Y.J. Dynamic prediction of traffic volume through kalman filtering theory. Transp. Res. Part B 1984, 18, 1–11. [Google Scholar] [CrossRef]
- Ait-El-Fquih, B.; Hoteit, I. Fast kalman-like filtering for large-dimensional linear and gaussian state-space models. Trans. Signal Process. 2015, 63, 5853–5867. [Google Scholar] [CrossRef]
- Guo, J.; Huang, W.; Williams, B.M. Adaptive kalman filter approach for stochastic short-term traffic flow rate prediction and uncertainty quantification. Transp. Res. Part C 2014, 43, 50–64. [Google Scholar] [CrossRef]
- Guin, A. Travel Time Prediction Using a Seasonal Autoregressive Integrated Moving Average Time Series Model. In Proceedings of the Intelligent Transportation Systems Conference, Toronto, ON, Canada, 17–20 September 2006; Volume 6, pp. 493–498. [Google Scholar]
- Habtemichael, F.G.; Cetin, M. Short-term traffic flow rate forecasting based on identifying similar traffic patterns. Transp. Res. Part C 2016, 66, 61–78. [Google Scholar] [CrossRef]
- Wang, J.; Shi, Q. Short-term traffic speed forecasting hybrid model based on chaos–wavelet analysis-support vector machine theory. Transp. Res. Part C 2013, 27, 219–232. [Google Scholar] [CrossRef]
- Gui, M.; Pahwa, A.; Das, S. Bayesian network model with monte carlo simulations for analysis of animal-related outages in overhead distribution systems. Trans. Power Syst. 2011, 26, 1618–1624. [Google Scholar] [CrossRef]
- Li, C.; Ying, X.; Zhang, H.; Yan, X. Dynamic Division about Traffic Control Subarea Based on Back Propagation Neural Network. In Proceedings of the 2010 Second International Conference on Intelligent Human-Machine Systems & Cybernetics, Nanjing, China, 26–28 August 2010; Volume 2, pp. 22–25. [Google Scholar]
- Ma, X.; Tao, Z.; Wang, Y.; Yu, H.; Wang, Y. Long short-term memory neural network for traffic speed prediction using remote microwave sensor data. Transp. Res. Part C 2015, 54, 187–197. [Google Scholar] [CrossRef]
- Hong, W.C.; Dong, Y.; Zheng, F.; Wei, S.Y. Hybrid evolutionary algorithms in a SVR traffic flow forecasting model. Appl. Math. Comput. 2011, 217, 6733–6747. [Google Scholar] [CrossRef]
- Silver, D.; Huang, A.; Maddison, C.J.; Guez, A.; Sifre, L.; Driessche, G.V.D. Mastering the game of go with deep neural networks and tree search. Nature 2016, 529, 484–489. [Google Scholar] [CrossRef] [PubMed]
- Yi, H.; Jung, H.J.; Bae, S. Deep Neural Networks for traffic flow prediction. In Proceedings of the International Conference on Big Data and Smart Computing, Jeju, Korea, 13–16 February 2017; pp. 328–331. [Google Scholar]
- Gao, F. Network Traffic Prediction Based on Neural Network. In Proceedings of the International Conference on Intelligent Transportation, Big Data and Smart City, Halong Bay, Vietnam, 19–20 December 2016; pp. 527–530. [Google Scholar]
- Shahsavari, B.; Abbeel, P. Short-Term Traffic Forecasting: Modeling and Learning Spatio-Temporal Relations in Transportation Networks Using Graph Neural Networks; EECS Department: Berkeley, CA, USA, 2015. [Google Scholar] [CrossRef]
- Wu, Y.; Tan, H.; Qin, L.; Ran, B.; Jiang, Z. A hybrid deep learning based traffic flow prediction method and its understanding. Transp. Res. Part C Emerg. Technol. 2018, 90, 166–180. [Google Scholar] [CrossRef]
- Vlahogianni, E.I.; Karlaftis, M.G.; Golias, J.C. Short-term traffic forecasting: Where we are and where we’re going. Transp. Res. Part C Emerg. Technol. 2014, 43, 3–19. [Google Scholar] [CrossRef]
- Lv, Y.; Duan, Y.; Kang, W.; Li, Z.; Wang, F.Y. Traffic flow prediction with big data: A deep learning approach. Trans. Intell. Transp. Syst. 2015, 16, 865–873. [Google Scholar] [CrossRef]
- Chen, Y.; Shu, L.; Wang, L. Poster abstract: Traffic flow prediction with big data: A deep learning based time series model. In Proceedings of the 2017 IEEE Conference on Computer Communications Workshops, Atlanta, GA, USA, 1–4 May 2017; pp. 1010–1011. [Google Scholar]
- Wibisono, A.; Jatmiko, W.; Wisesa, H.A.; Hardjono, B.; Mursanto, P. Traffic big data prediction and visualization using fast incremental model trees-drift detection (fimt-dd). Knowl.-Based Syst. 2016, 93, 33–46. [Google Scholar] [CrossRef]
- Nair, V.; Hinton, G.E. Rectified linear units improve restricted boltzmann machines. In Proceedings of the International Conference on International Conference on Machine Learning, Haifa, Israel, 21–24 June 2010; pp. 807–814. [Google Scholar]
- Hinton, G.E.; Srivastava, N.; Krizhevsky, A.; Sutskever, I.; Salakhutdinov, R.R. Improving neural networks by preventing coadaptation of feature detectors. Comput. Sci. 2012, 3, 212–223. [Google Scholar]
Figure 1.
The experimental research process.
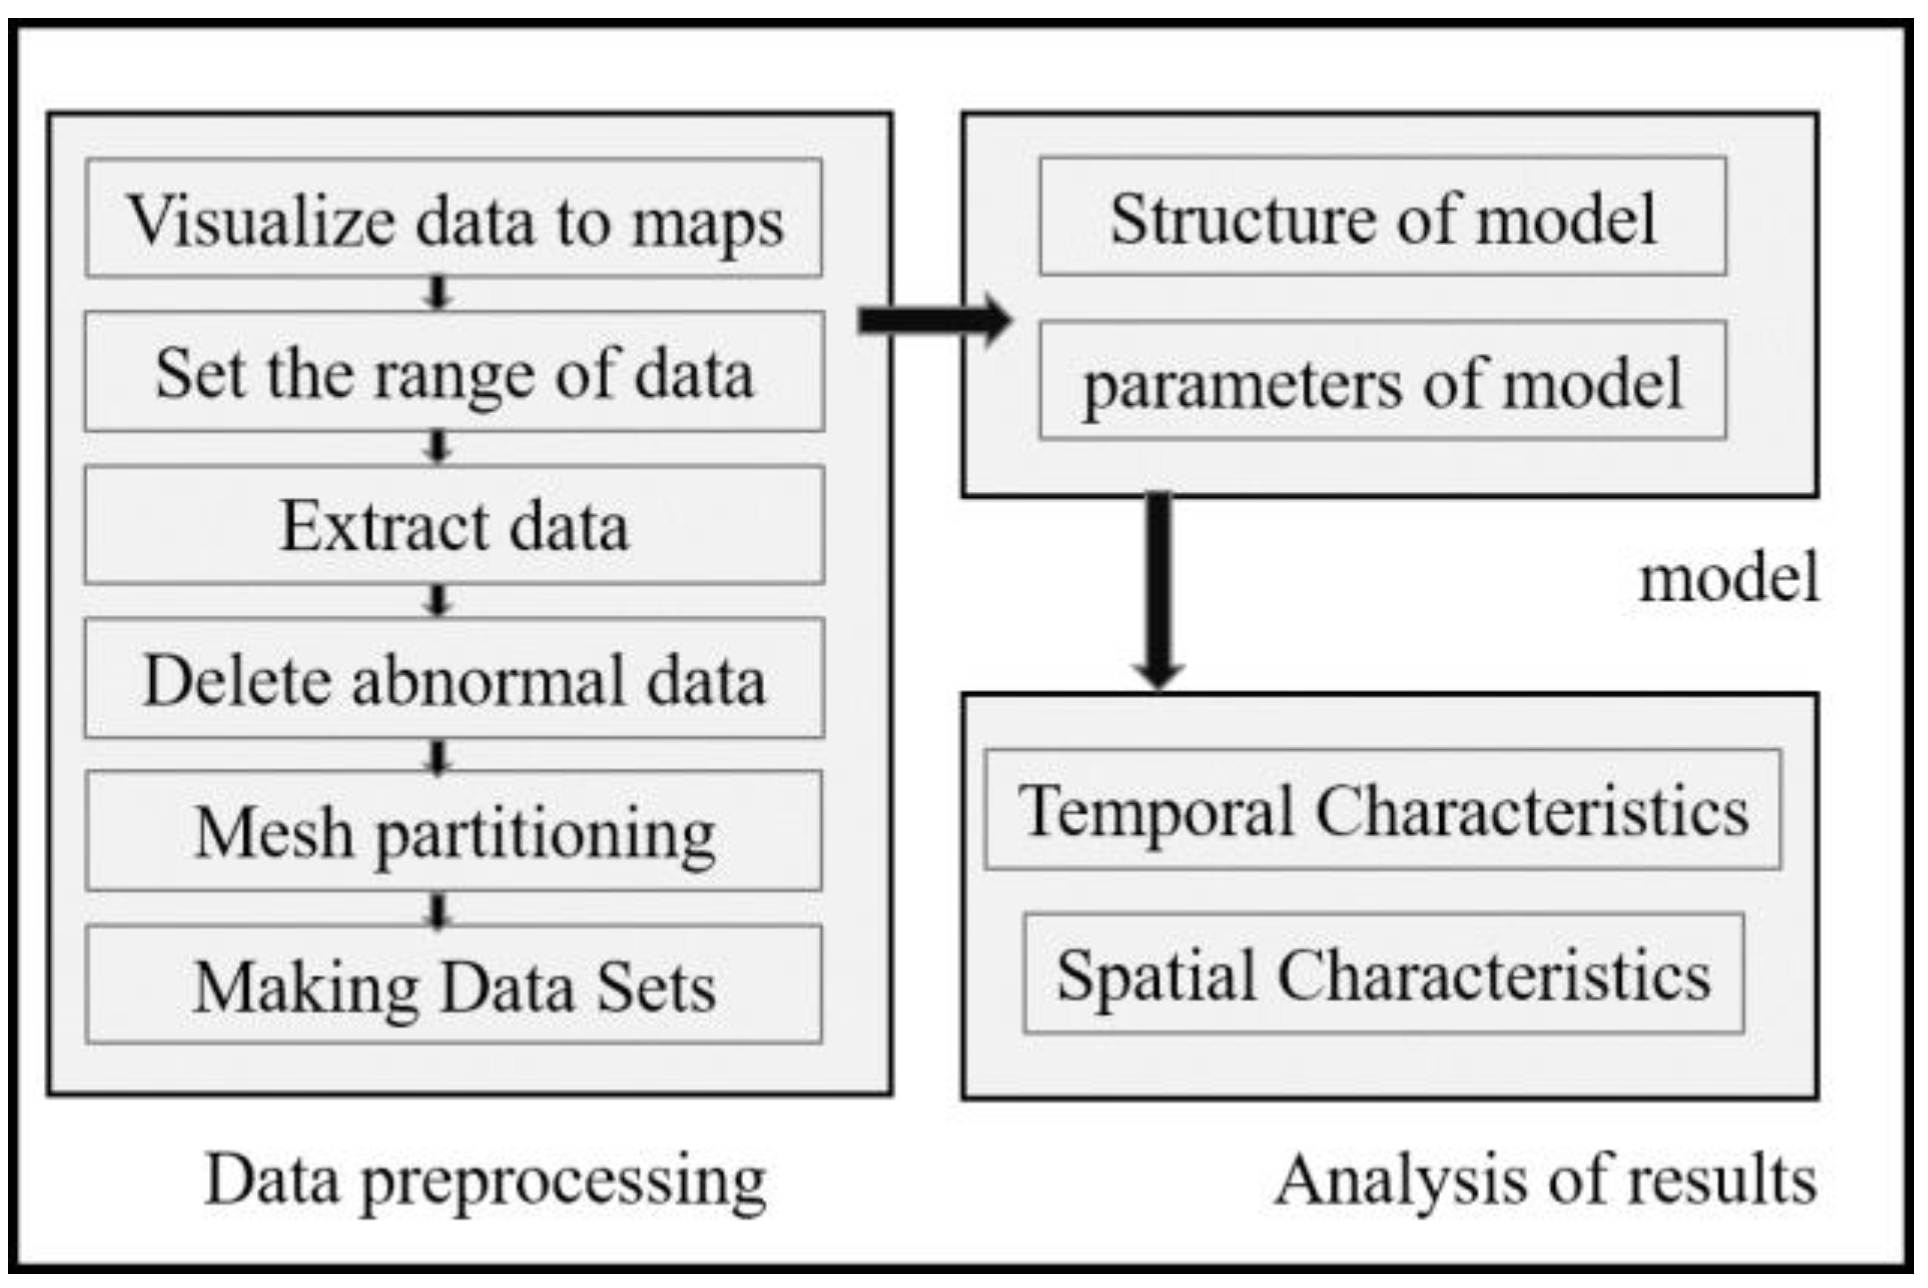
Figure 2.
Demand heat map at different time periods in one day.

Figure 3.
The structure of the neural network.
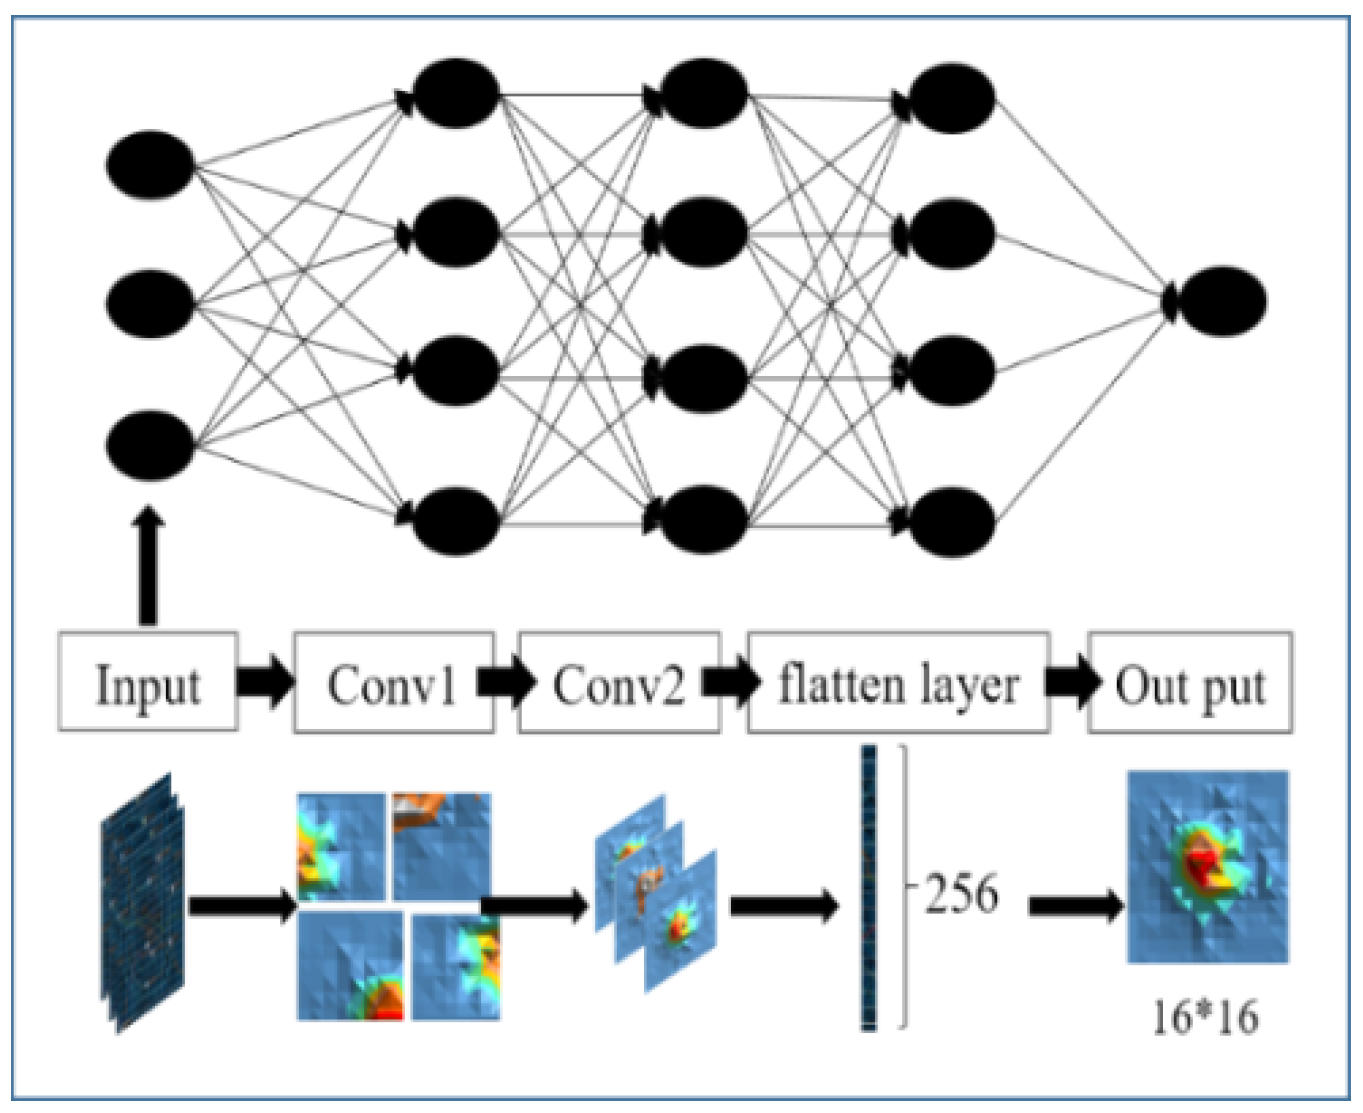
Figure 4.
The structure of the data set.
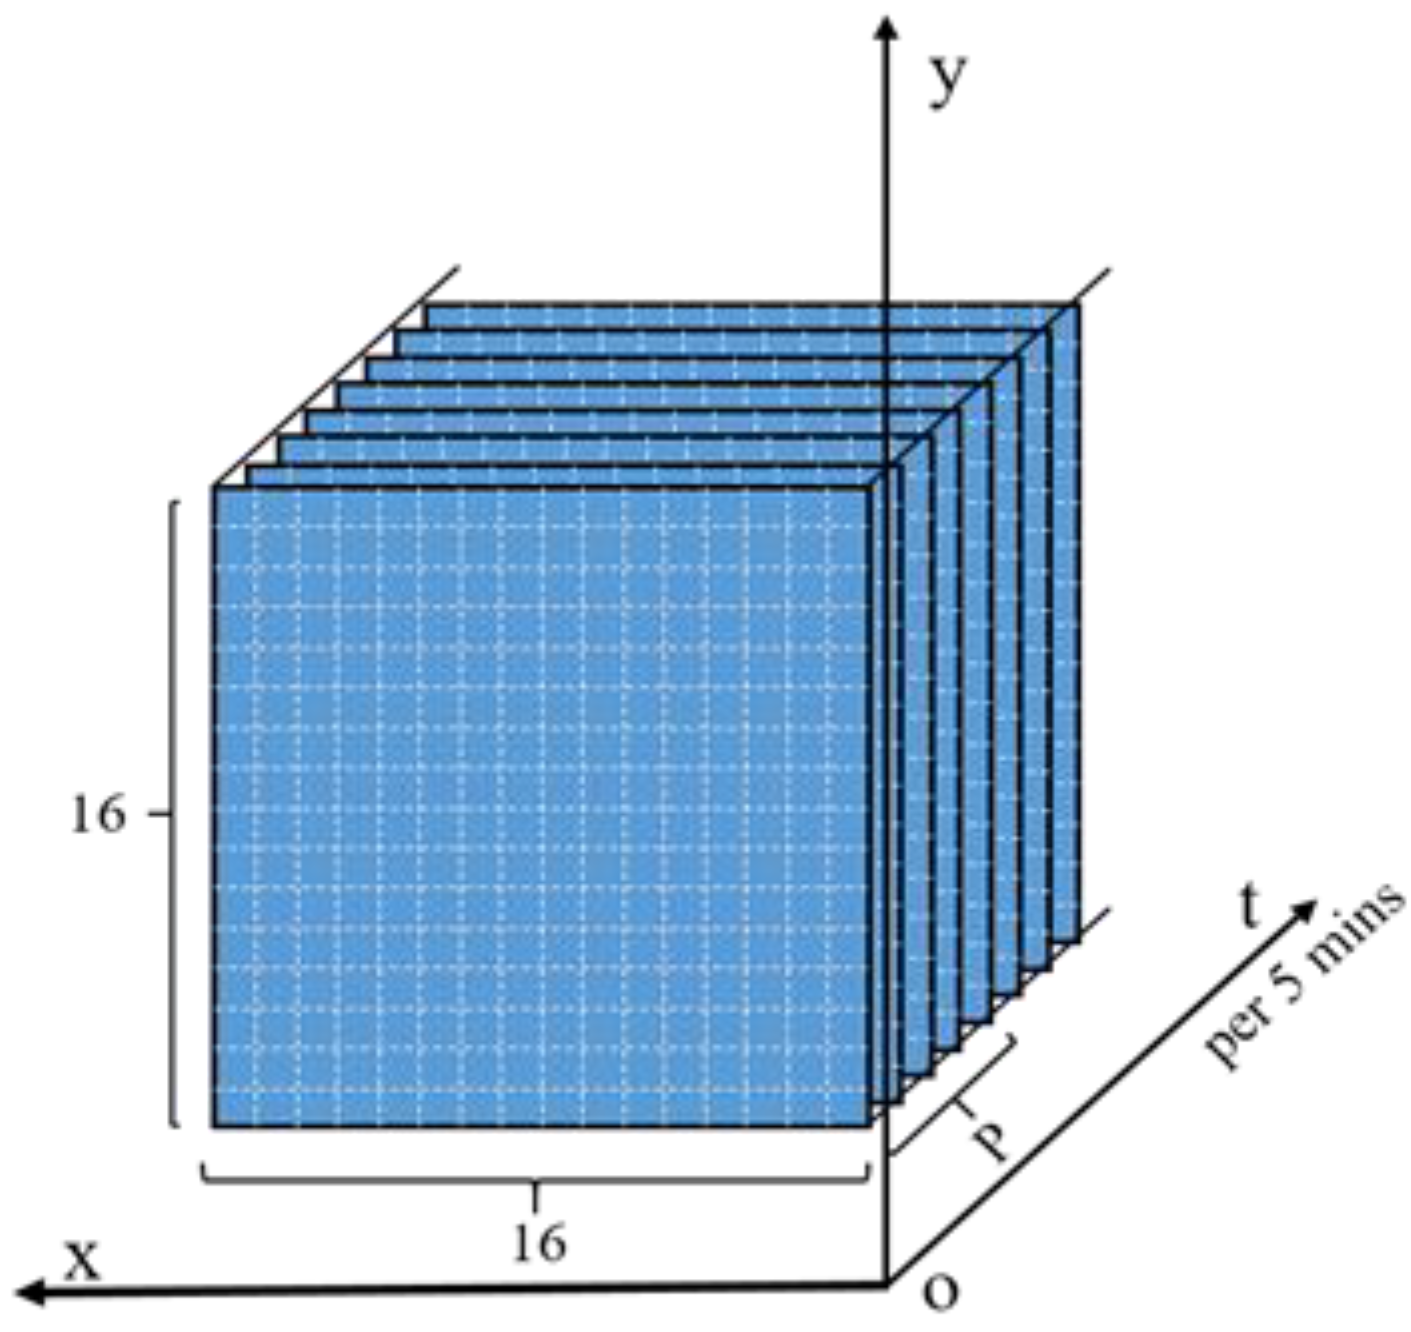
Figure 5.
The different GPS tracking of vehicles in Chengdu.
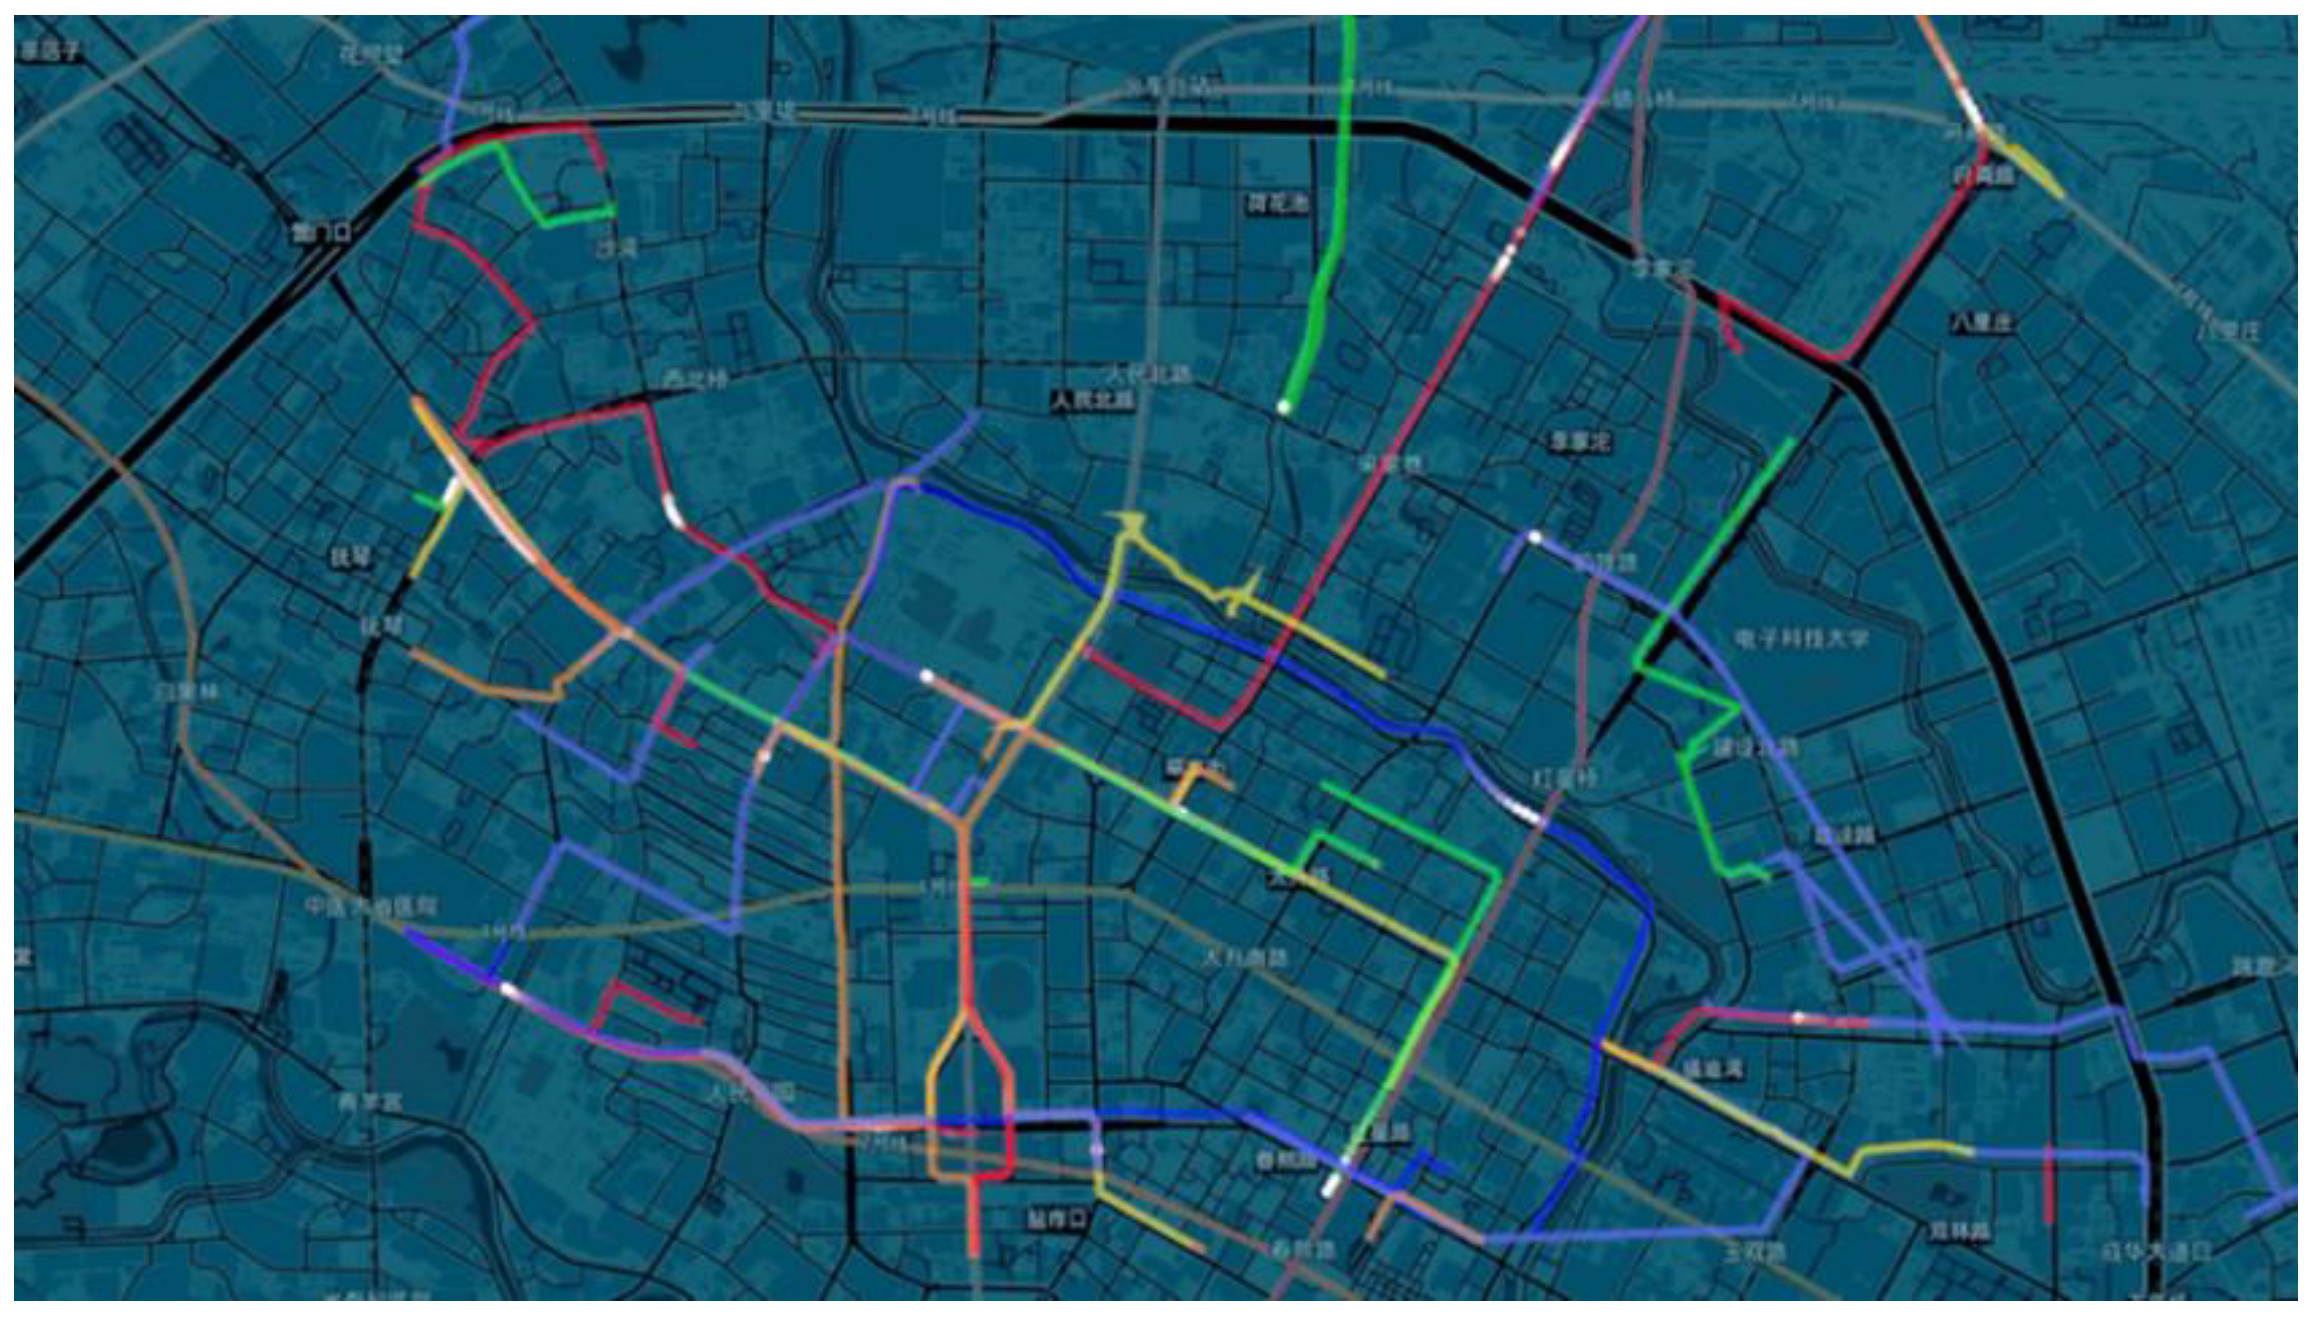
Figure 6.
The Chengdu Fourth Ring Region is divided into 256 areas.
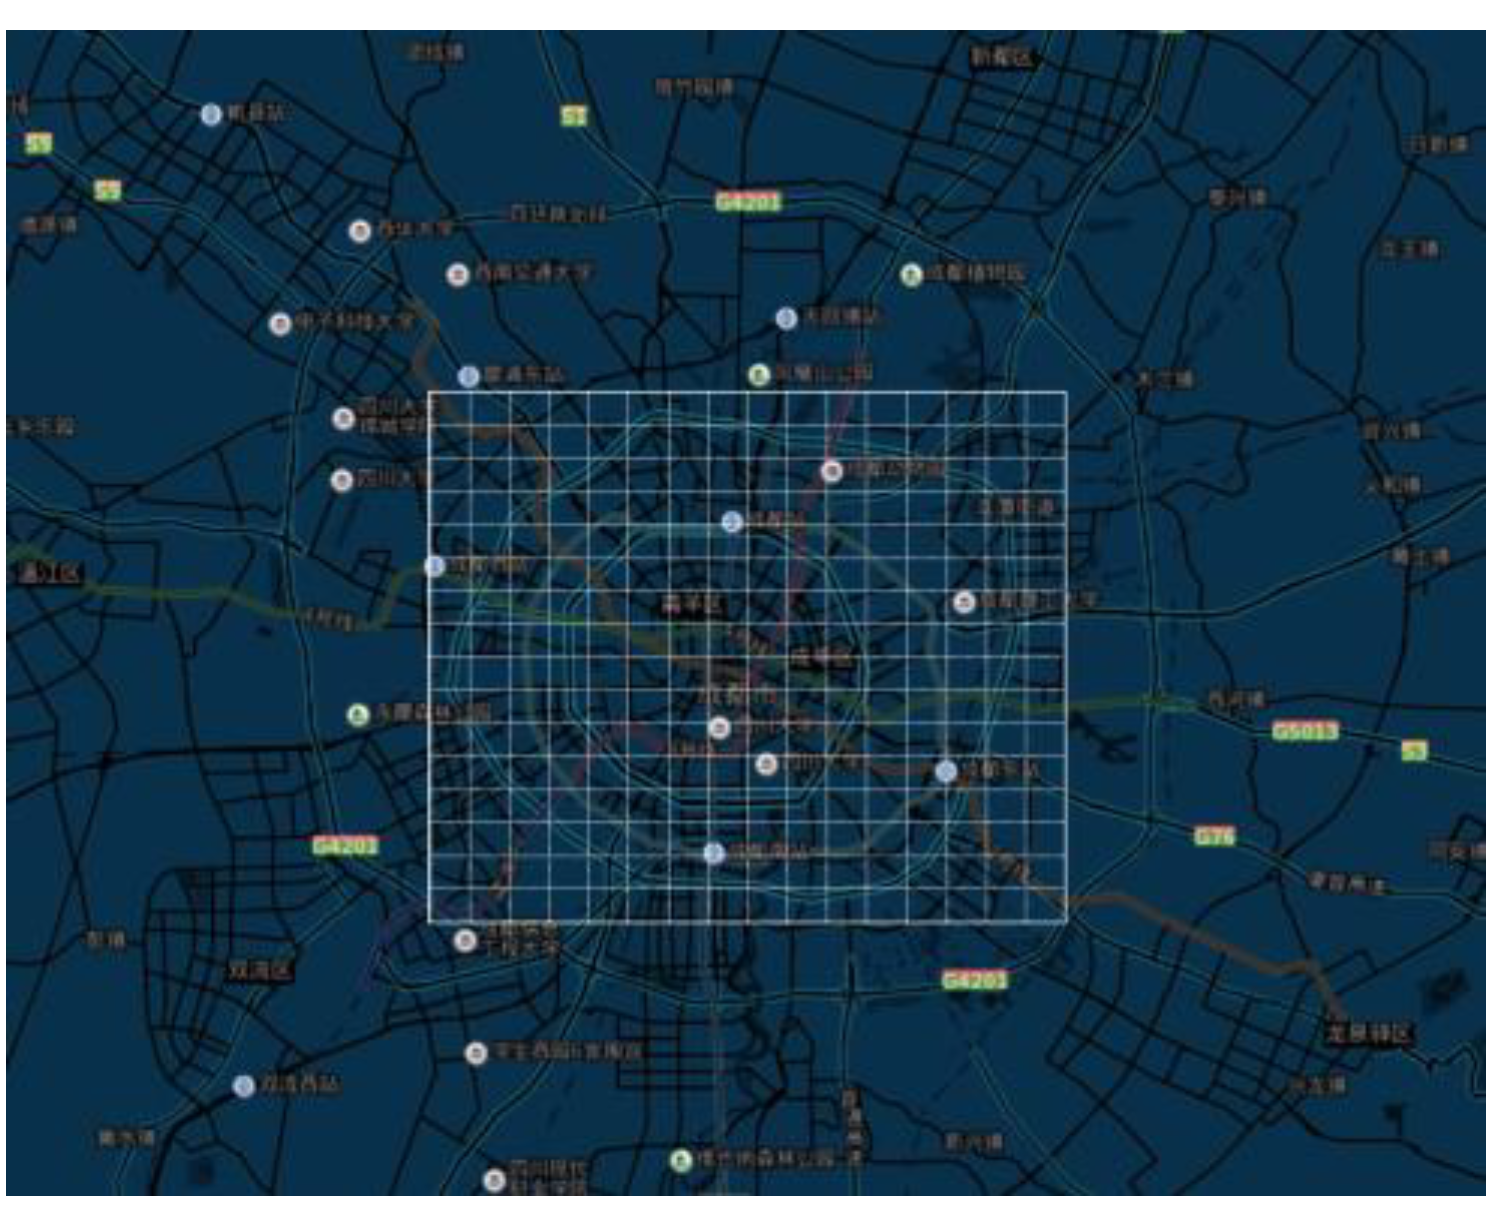
Figure 7.
Thermal map of the prediction results at different time periods.
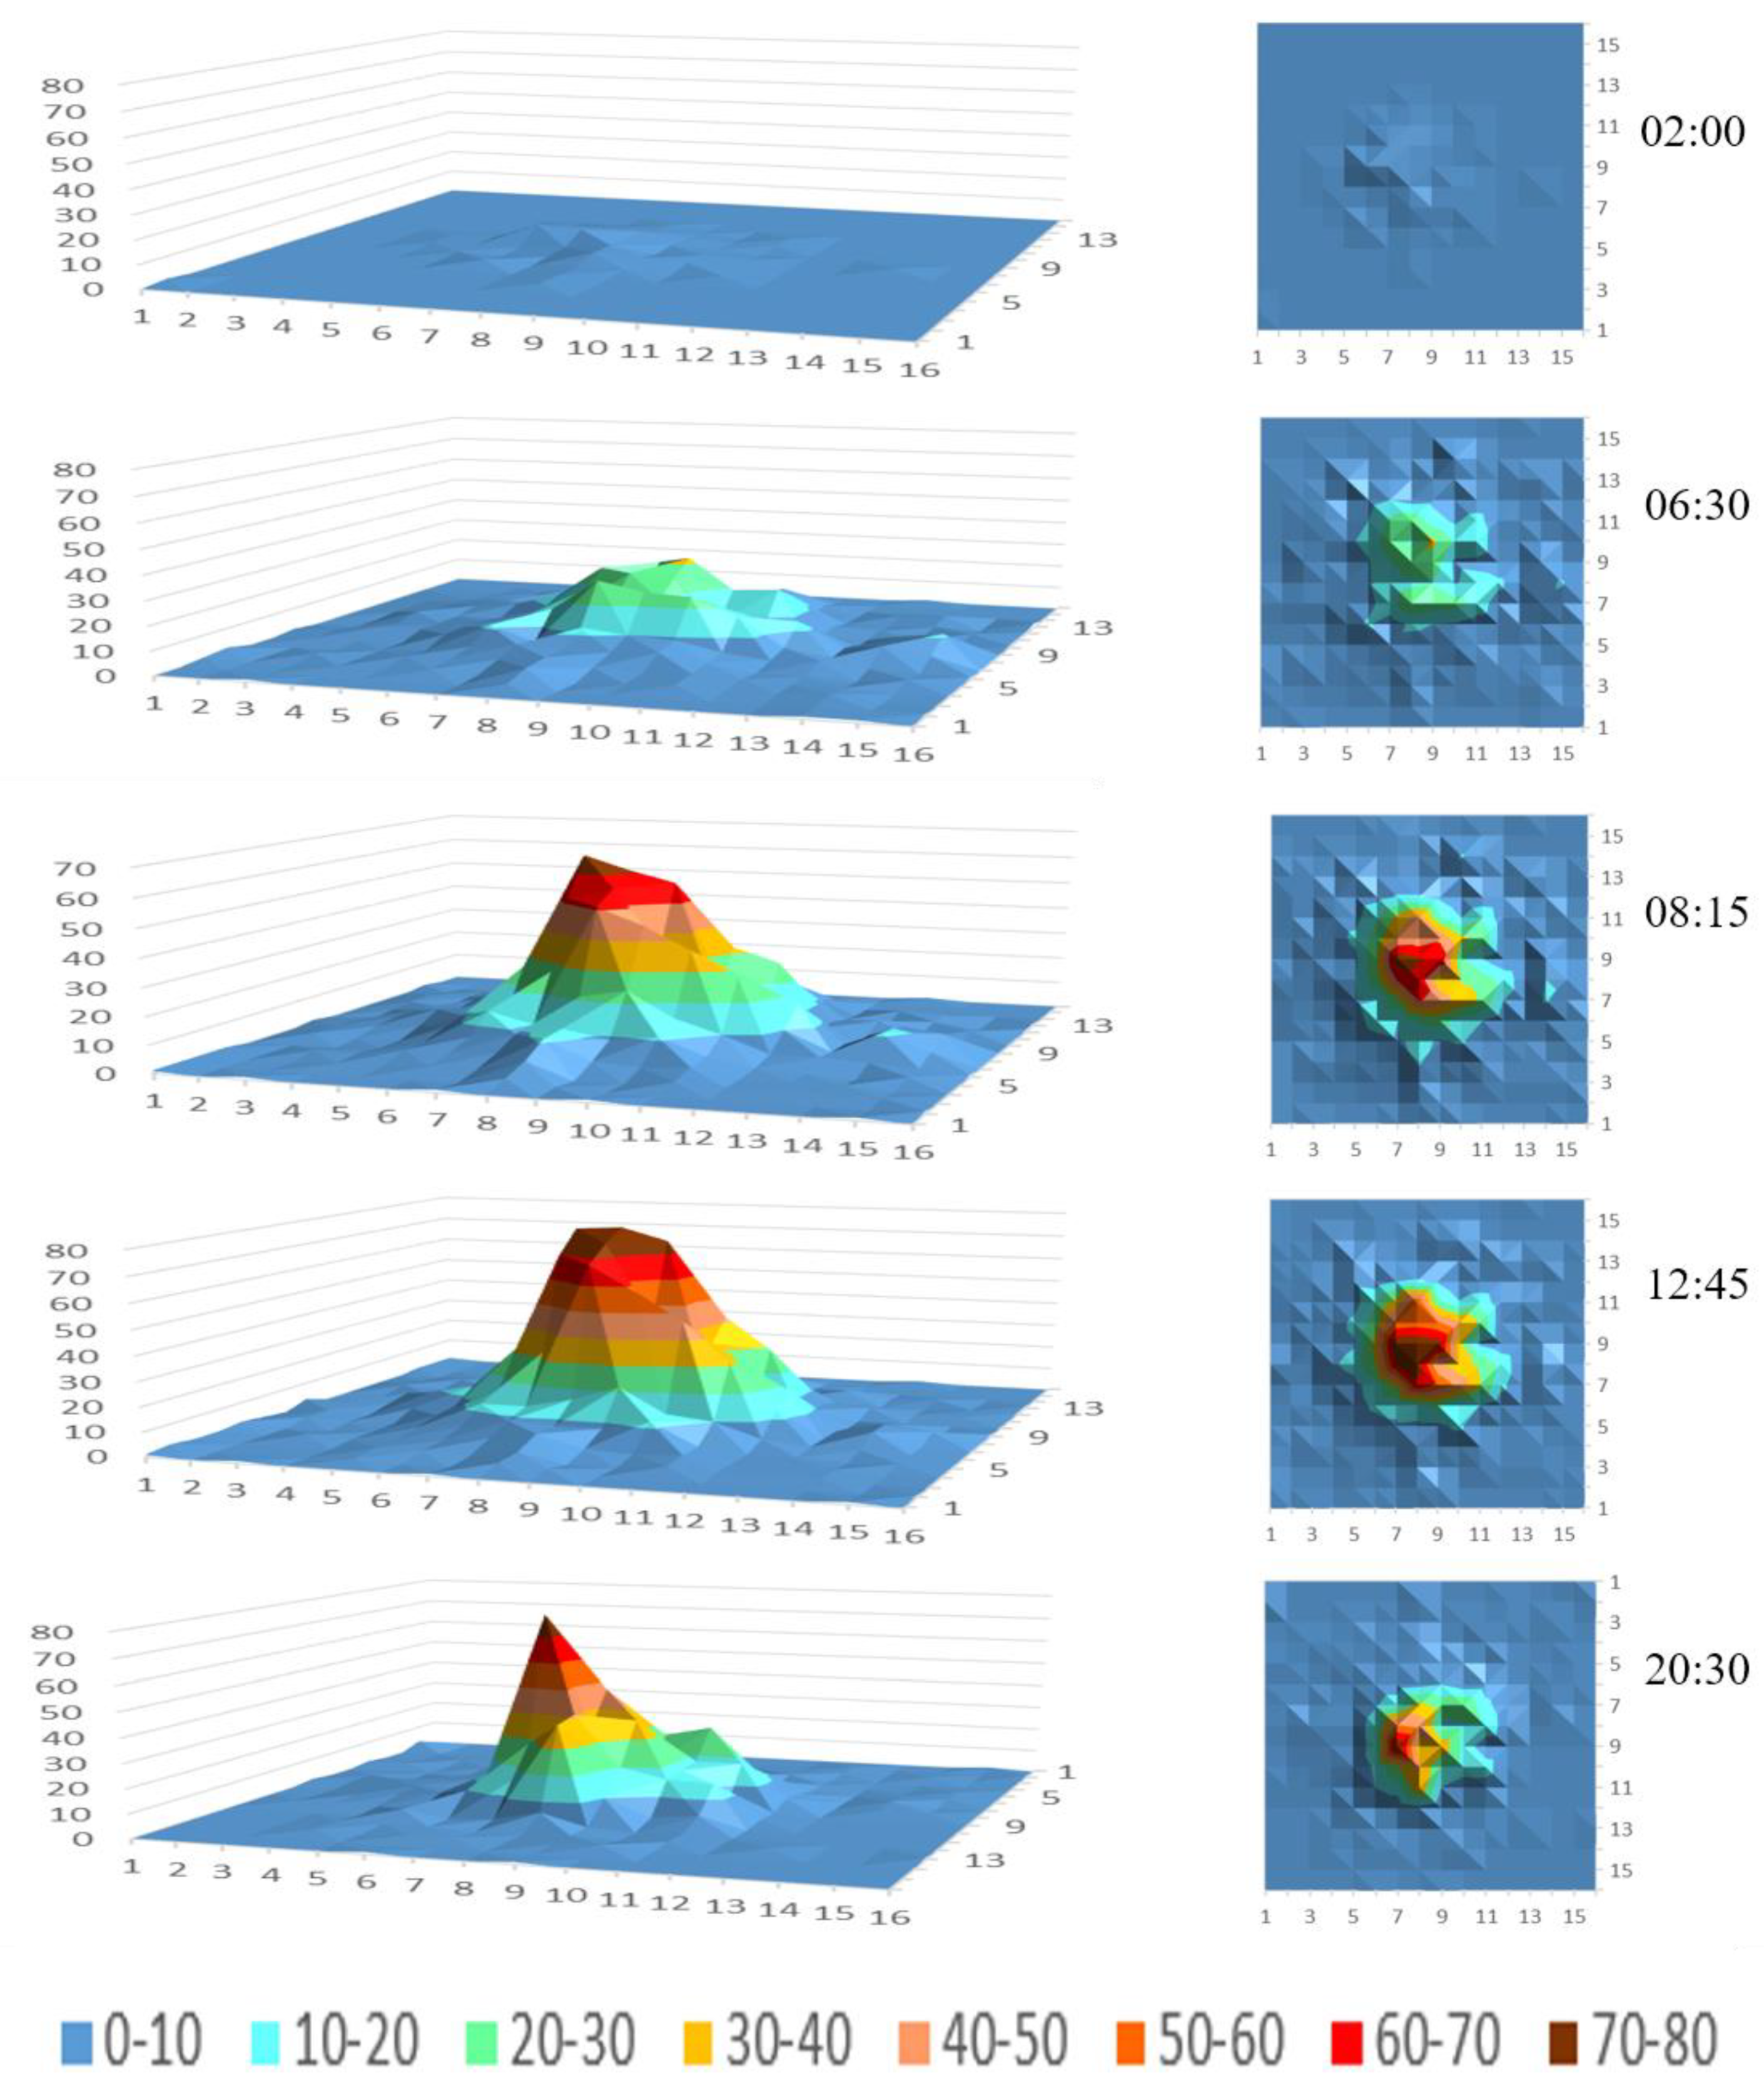
Figure 8.
Comparison of the travel demand forecast (a) and true (b) value.
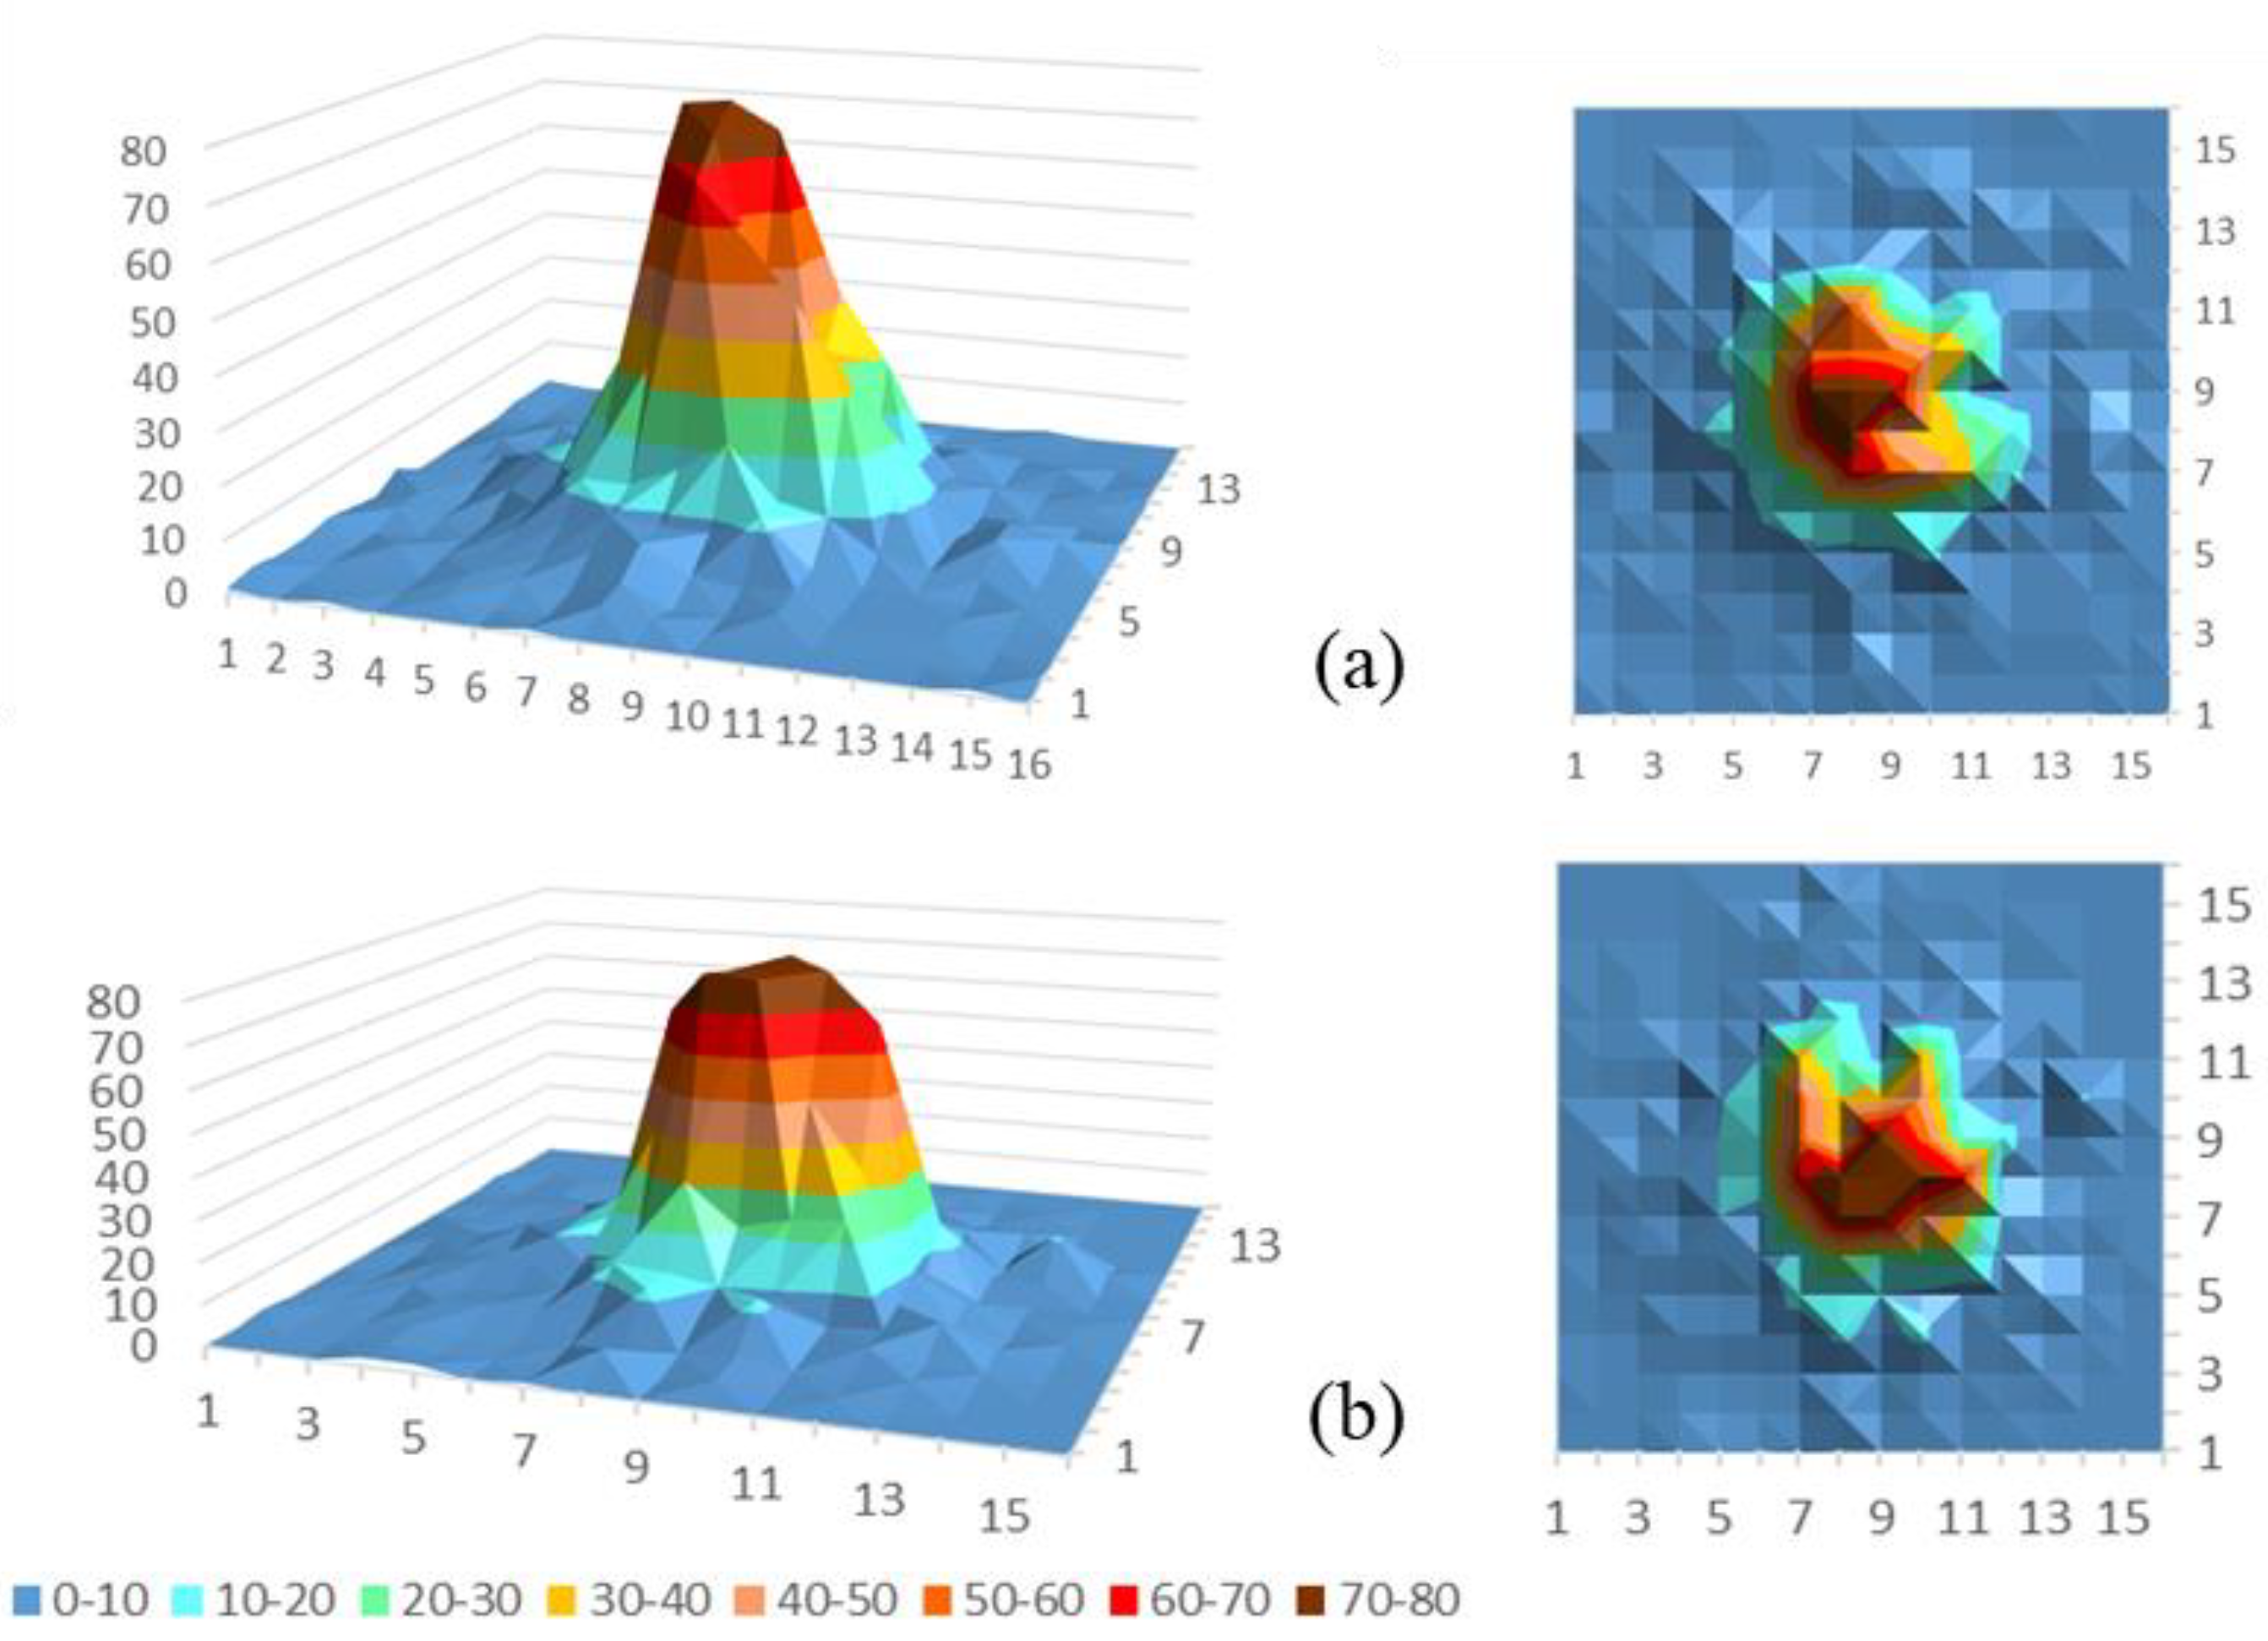
Figure 9.
Comparison of continuous prediction results for single region number 24, 56, 87, and 104; (a) shows the predicted and actual values of the travel demand for four different types of areas (number 24, 56, 87, and 104) in 40 h; and in (b), the predicted and actual results of the four areas are summarized.
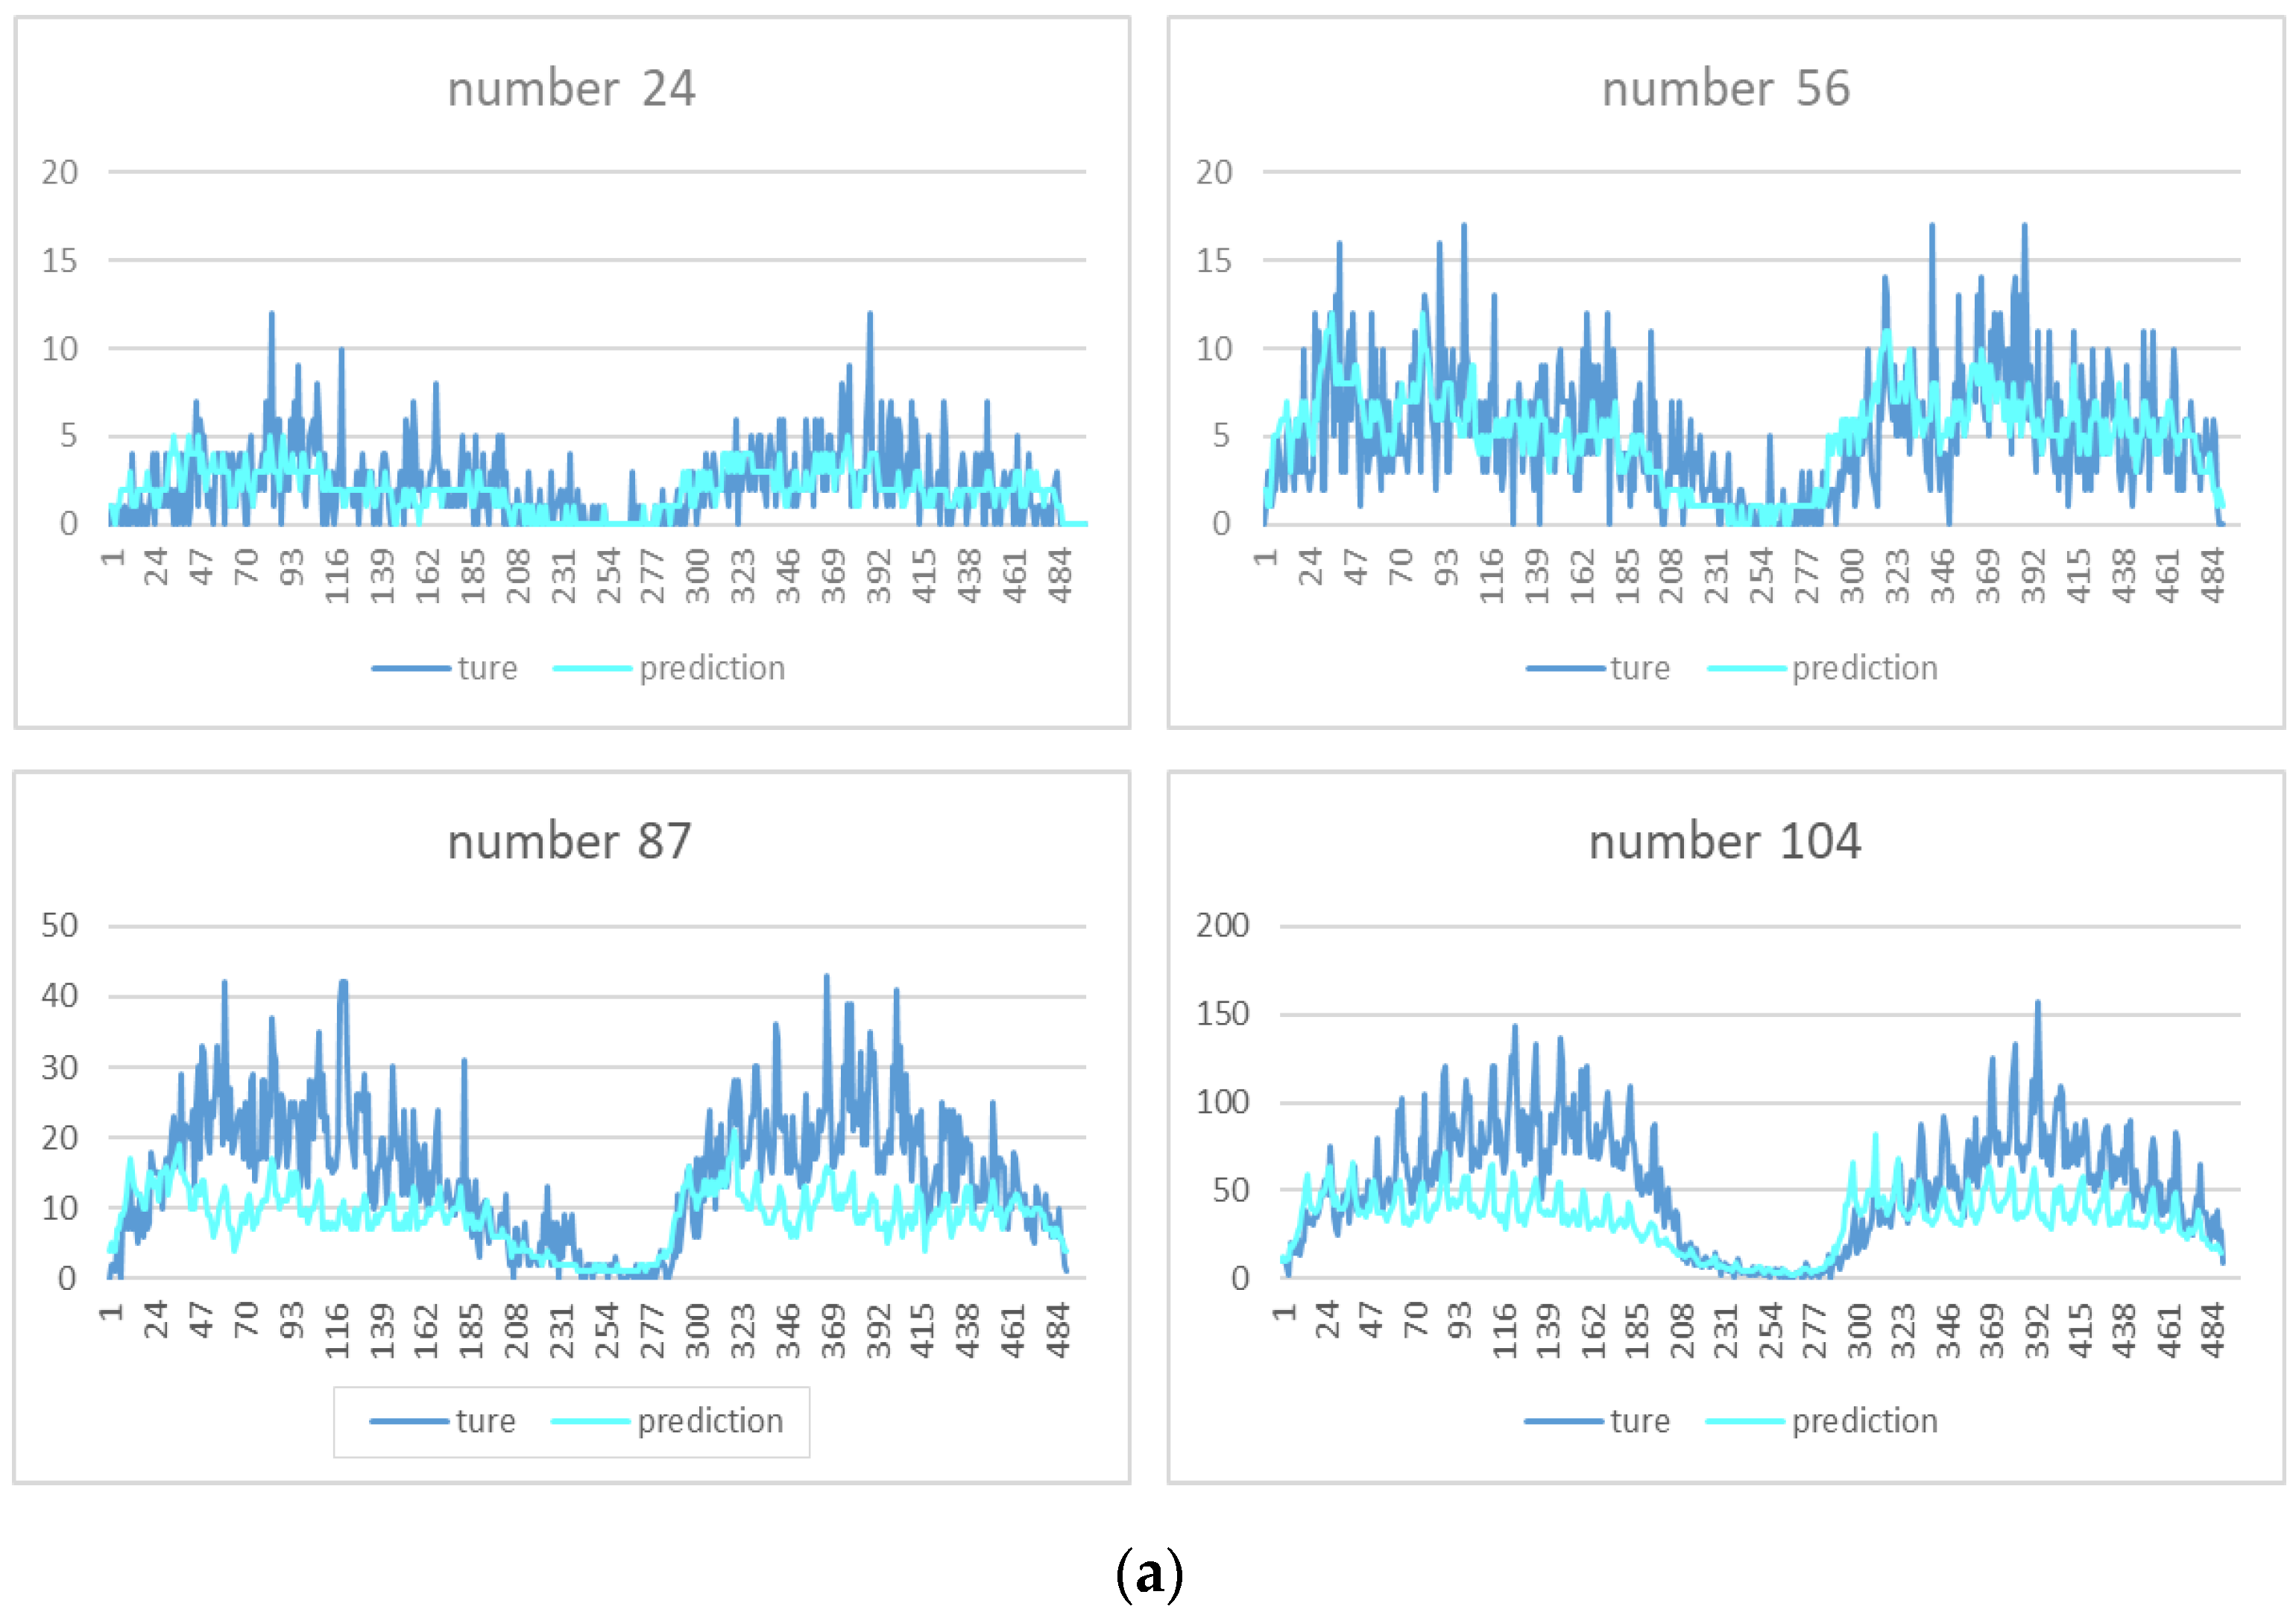
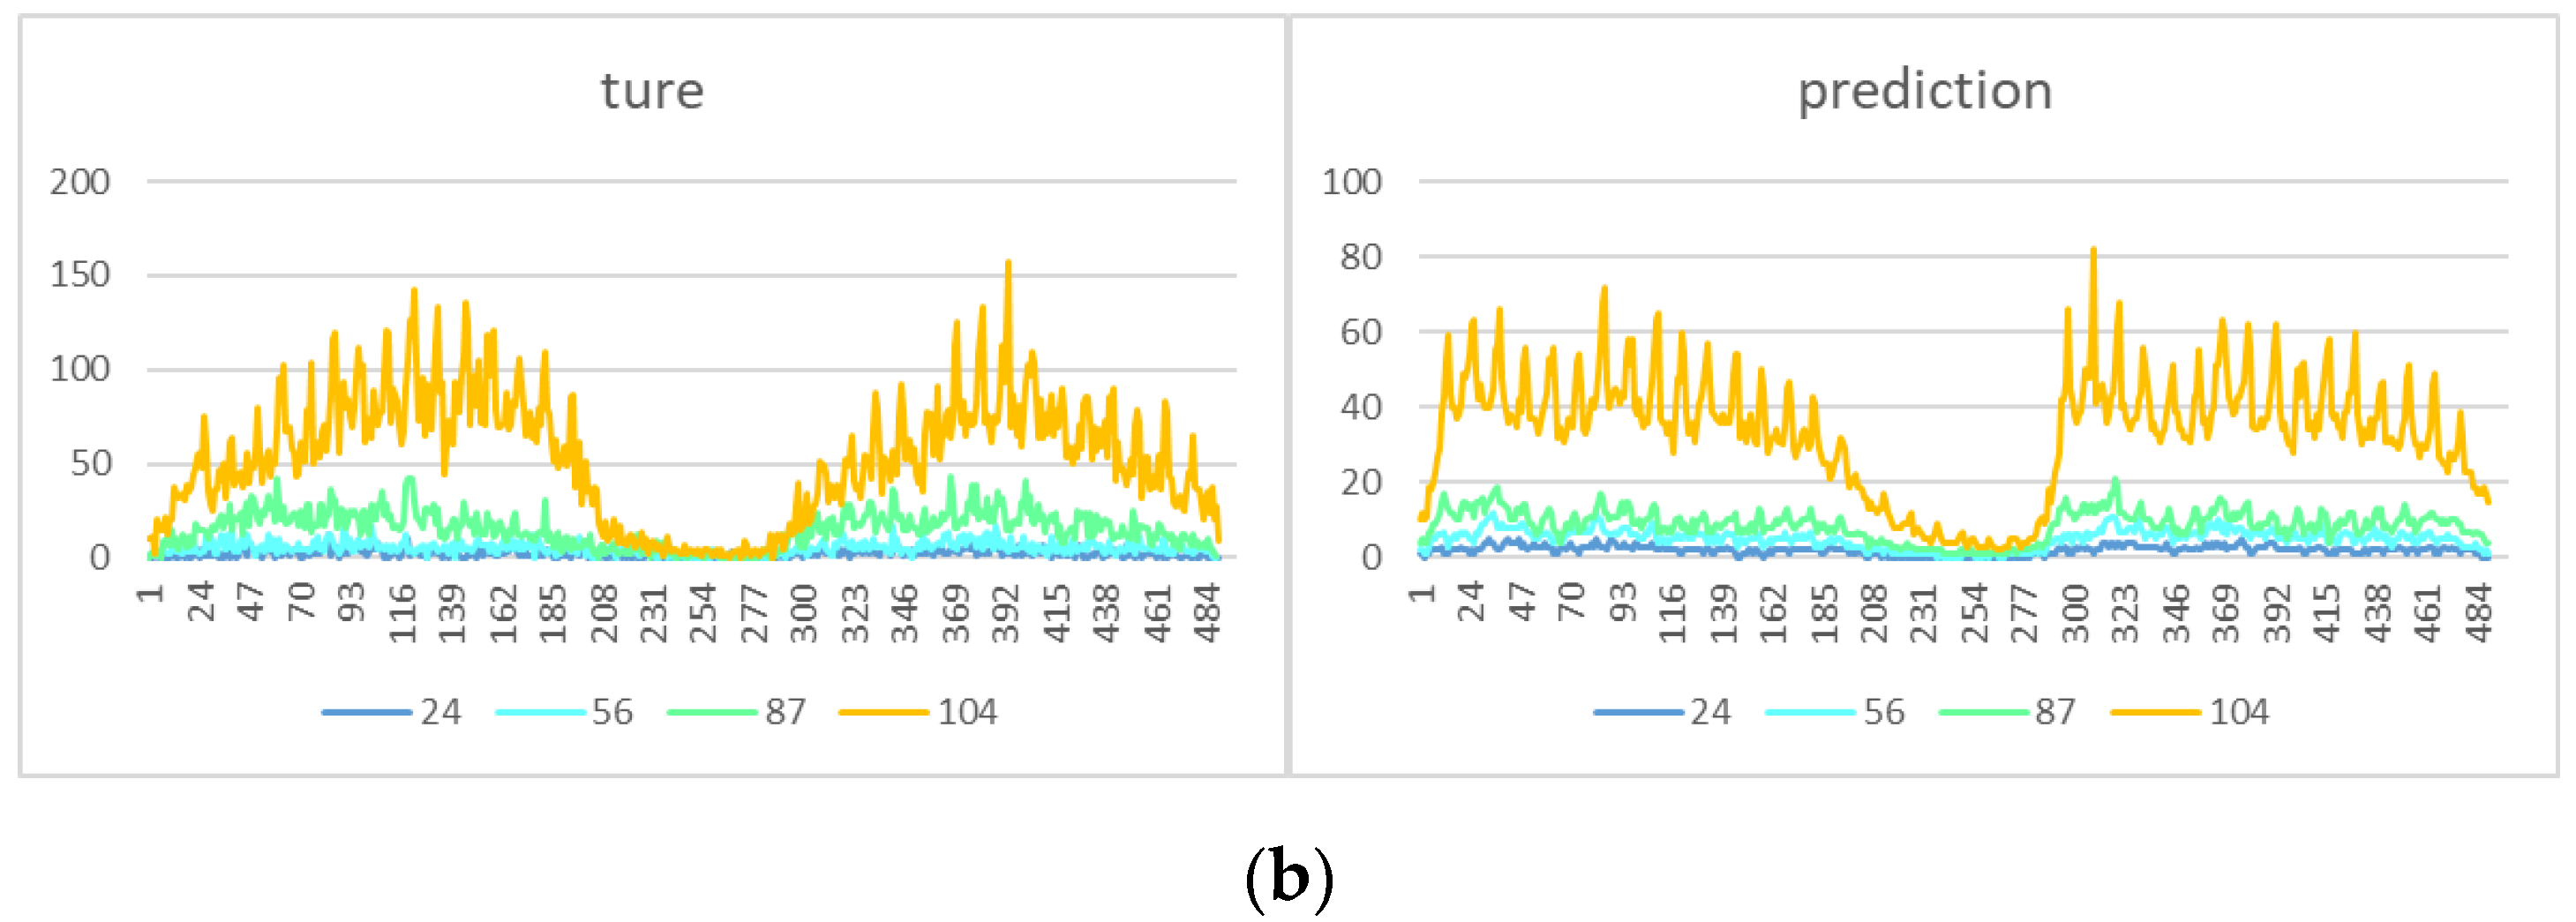
Figure 10.
Actual travel demand distribution map in the hotspot area.
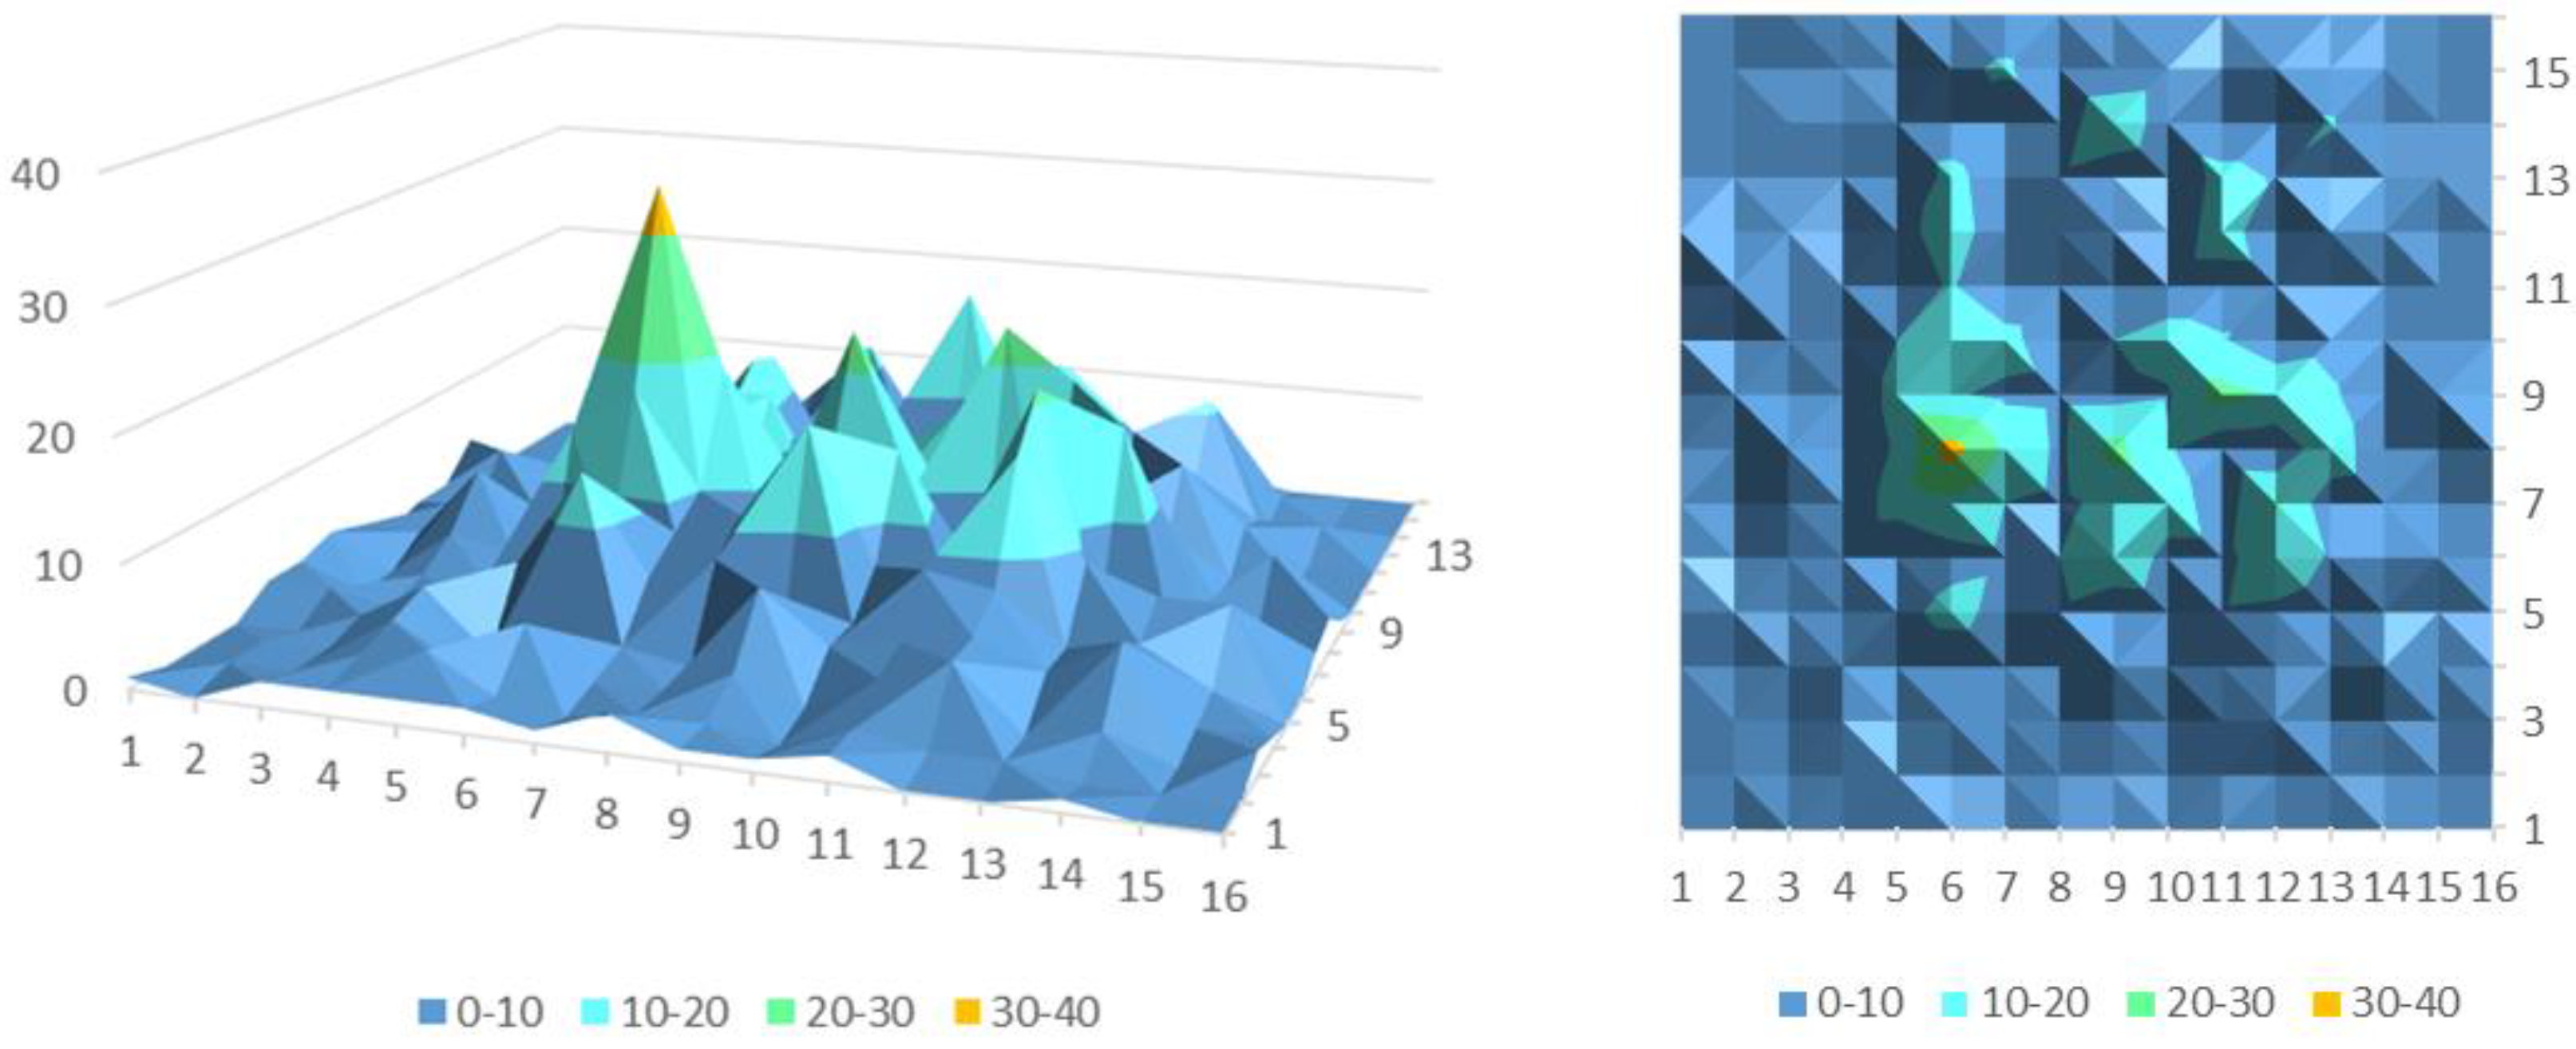
Figure 11.
Travel demand prediction in hotspot areas.

Table 1.
The MAEs, MREs, and R2 of different models.
| MAE | RMSE | R2 | |
|---|---|---|---|
| Bayesian Ridge | 9.0791 | 158.841 | 0.875 |
| Linear Regression | 9.0792 | 158.839 | 0.874 |
| LSTM | 8.7364 | 124.754 | 0.905 |
| OC-CNN | 1.0105 | 8.9375 | 0.732 |
Table 2.
The MAEs, MREs, and R2 of OC-CNN in hotspot areas.
| MAE | RMSE | R2 | |
|---|---|---|---|
| OC-CNN | 2.0664 | 3.0917 | 0.853 |
© 2019 by the authors. Licensee MDPI, Basel, Switzerland. This article is an open access article distributed under the terms and conditions of the Creative Commons Attribution (CC BY) license (http://creativecommons.org/licenses/by/4.0/).
Share and Cite
MDPI and ACS Style
Huang, Z.; Huang, G.; Chen, Z.; Wu, C.; Ma, X.; Wang, H. Multi-Regional Online Car-Hailing Order Quantity Forecasting Based on the Convolutional Neural Network. Information 2019, 10, 193. https://doi.org/10.3390/info10060193
AMA Style
Huang Z, Huang G, Chen Z, Wu C, Ma X, Wang H. Multi-Regional Online Car-Hailing Order Quantity Forecasting Based on the Convolutional Neural Network. Information. 2019; 10(6):193. https://doi.org/10.3390/info10060193
Chicago/Turabian StyleHuang, Zihao, Gang Huang, Zhijun Chen, Chaozhong Wu, Xiaofeng Ma, and Haobo Wang. 2019. "Multi-Regional Online Car-Hailing Order Quantity Forecasting Based on the Convolutional Neural Network" Information 10, no. 6: 193. https://doi.org/10.3390/info10060193
Note that from the first issue of 2016, this journal uses article numbers instead of page numbers. See further details here.