1. Introduction
Recommender Systems (RSs) are software tools capable of suggesting items to users according to their preferences [
1]. A popular recommendation technique, called Collaborative Filtering (CF), consists of learning users’ preferences by only relying on their interactions with the items available in a catalog. For example, using a nearest-neighbor search (memory-based CF) or a machine learning model (model-based CF), it is possible to select the most relevant items for each user who has interacted enough with the system [
2]. An alternative approach to this problem is represented by content-based RSs, which can generate suggestions by matching users’ profiles with the features of the items [
3,
4]. Another family of recommendation methods proposed in the literature is represented by hybrid algorithms, capable of combining both collaborative and content-based filtering for mitigating the individual weaknesses of the previous techniques [
5].
While these recommendation approaches usually guarantee interesting results in traditional domains, such as movie recommendation, they are not capable of capturing the temporal evolution of users’ preferences [
6]. For example, different authors [
7,
8,
9] argue that movies watched recently provide more useful information about a certain user than those she consumed in a distant past. It is, in fact, reasonable to assume that a recent item may have a high influence on the choice of the next one.
Therefore, a RS that exploits sequential data for predicting the sole next item that will be consumed by a user can be defined as
sequential recommender [
10]. Several works related to sequential recommenders are available in the literature. For example, Zhou et al. [
11] exploited a sequential pattern mining algorithm for recommending which page to visit next in a website, while Rendle et al. [
8] relied on Markov chains for suggesting products considering previous purchases. Recently, He et al. [
9] designed a recommender system capable of modeling how users’ interests evolve over time. While all these methods usually consider user preferences observed during the training phase as sequences, no temporal ordering is available at recommendation time, as only one item, or a list of items ranked by relevance, is suggested to users. Because of the popularity of CF techniques, most of sequential recommenders are based on such approaches [
12], but in principle it is also possible to design systems capable of analyzing sequences according to content-based methods.
In general, even if the problem of creating a sequence of words starting from an initial one is a well-known task inside the natural language processing community [
13], the idea of creating personalized sequences of items is less widespread in the context of RSs [
14]. For this reason, it would be interesting to be able to exploit the temporal ordering not only during the training phase but also for generating sequences of recommended items, such as in the task of language modeling. Some solutions to this problem have already been proposed in industry, and also few researchers have discussed how to automatically construct music playlists [
15] or suggest sequences of points-of-interest to tourists [
16] starting from seed items.
However, early studies conducted in this field lack of a common definition of the problem that they are trying to address. For example,
session-based RSs only consider the last session of the current user [
17], while
sequence-aware recommenders also exploit the history of past sessions [
12] and they can be considered equivalent to sequential recommenders. Furthermore, it is not clear if item repetitions are allowed in the suggestions or not.
In this work, we argue that it is possible to consider RSs capable of creating personalized sequences of an arbitrary length as a generalization of a sequential recommender because the latter is only able of creating sequences of length one. In contrast to traditional RSs that usually create lists of items ranked by relevance, in the following we will define a recommender that exploits a temporal dimension both in the training and in the generation phase as a sequence-based recommender, as it observes and suggests sequences of items meant be consumed in a particular order.
On the other side, several evaluation protocols and metrics for analyzing novel RSs via offline experiments are available, to capture the different aspects of the recommendation algorithm [
18]. However, the lack of a standardized way of performing such
in vitro experiments leads to results that are often incomparable [
19]. To the best of our knowledge, no evaluation framework for sequence-based RSs has already been proposed. The motivating hypothesis of this study is that in the context of sequence-based RSs, traditional evaluation metrics need to be computed at the level of sequences instead of the level of users.
In our view, an evaluation framework consists of a methodology for performing an experimental comparison, a set of metrics, and a software tool that implements them. Therefore, the main aim of this work is to address the following research questions and to introduce an offline evaluation framework for sequence-based RSs that we called Sequeval.
- RQ1
What is the formal definition of a sequence-based recommender system?
- RQ2
How already established metrics can be extended and adapted for evaluating a sequence-based recommender system?
- RQ3
Against which baselines a sequence-based recommender system can be compared?
Because our evaluation approach is agnostic with respect to the implementation details of the algorithms under analysis, it can be successfully exploited to also assess the performance of systems based on alternative recommendation methods [
20] or dealing with unconventional categories of items, for example 3D movies [
21] or cultural digital contents [
22], especially if they are supposed to be consumed by users in a sequential order.
Besides, by openly releasing a Python implementation of Sequeval, we aim to encourage the use of the proposed framework as an attempt to standardize the evaluation of sequence-based RSs, mitigating the comparability problem in RSs research.
The remainder of this paper is organized as follows: in
Section 2 we review related works; in
Section 3 we present the mathematical definition of a sequence-based recommender system; in
Section 4 we introduce Sequeval by describing its evaluation protocol, metrics, and implementation details; in
Section 5 we perform an empirical analysis of the framework with two different datasets. Finally, in
Section 6, we formulate our conclusions and we outline future works.
3. Sequence-Based Recommender Systems
Before analyzing the evaluation framework, we introduce the problem of recommending sequences and we provide an answer to RQ1. In a traditional recommender system, users express positive or negative preferences about a certain item. An item may be, for example, a product, a song, or a place. In contrast, we assume that when a user consumes or interacts with an item, she expresses an implicit rating about it. This assumption in the literature goes under the name of
implicit feedback [
14]. Because we are also considering the temporal dimension to build the sequences, each rating is associated with a timestamp that represents the point in time when it was recorded.
Definition 1. Given the space of items , the space of users , the space of timestamps , a rating is a tuple , where is the item for which the user expressed a positive preference at the timestamp .
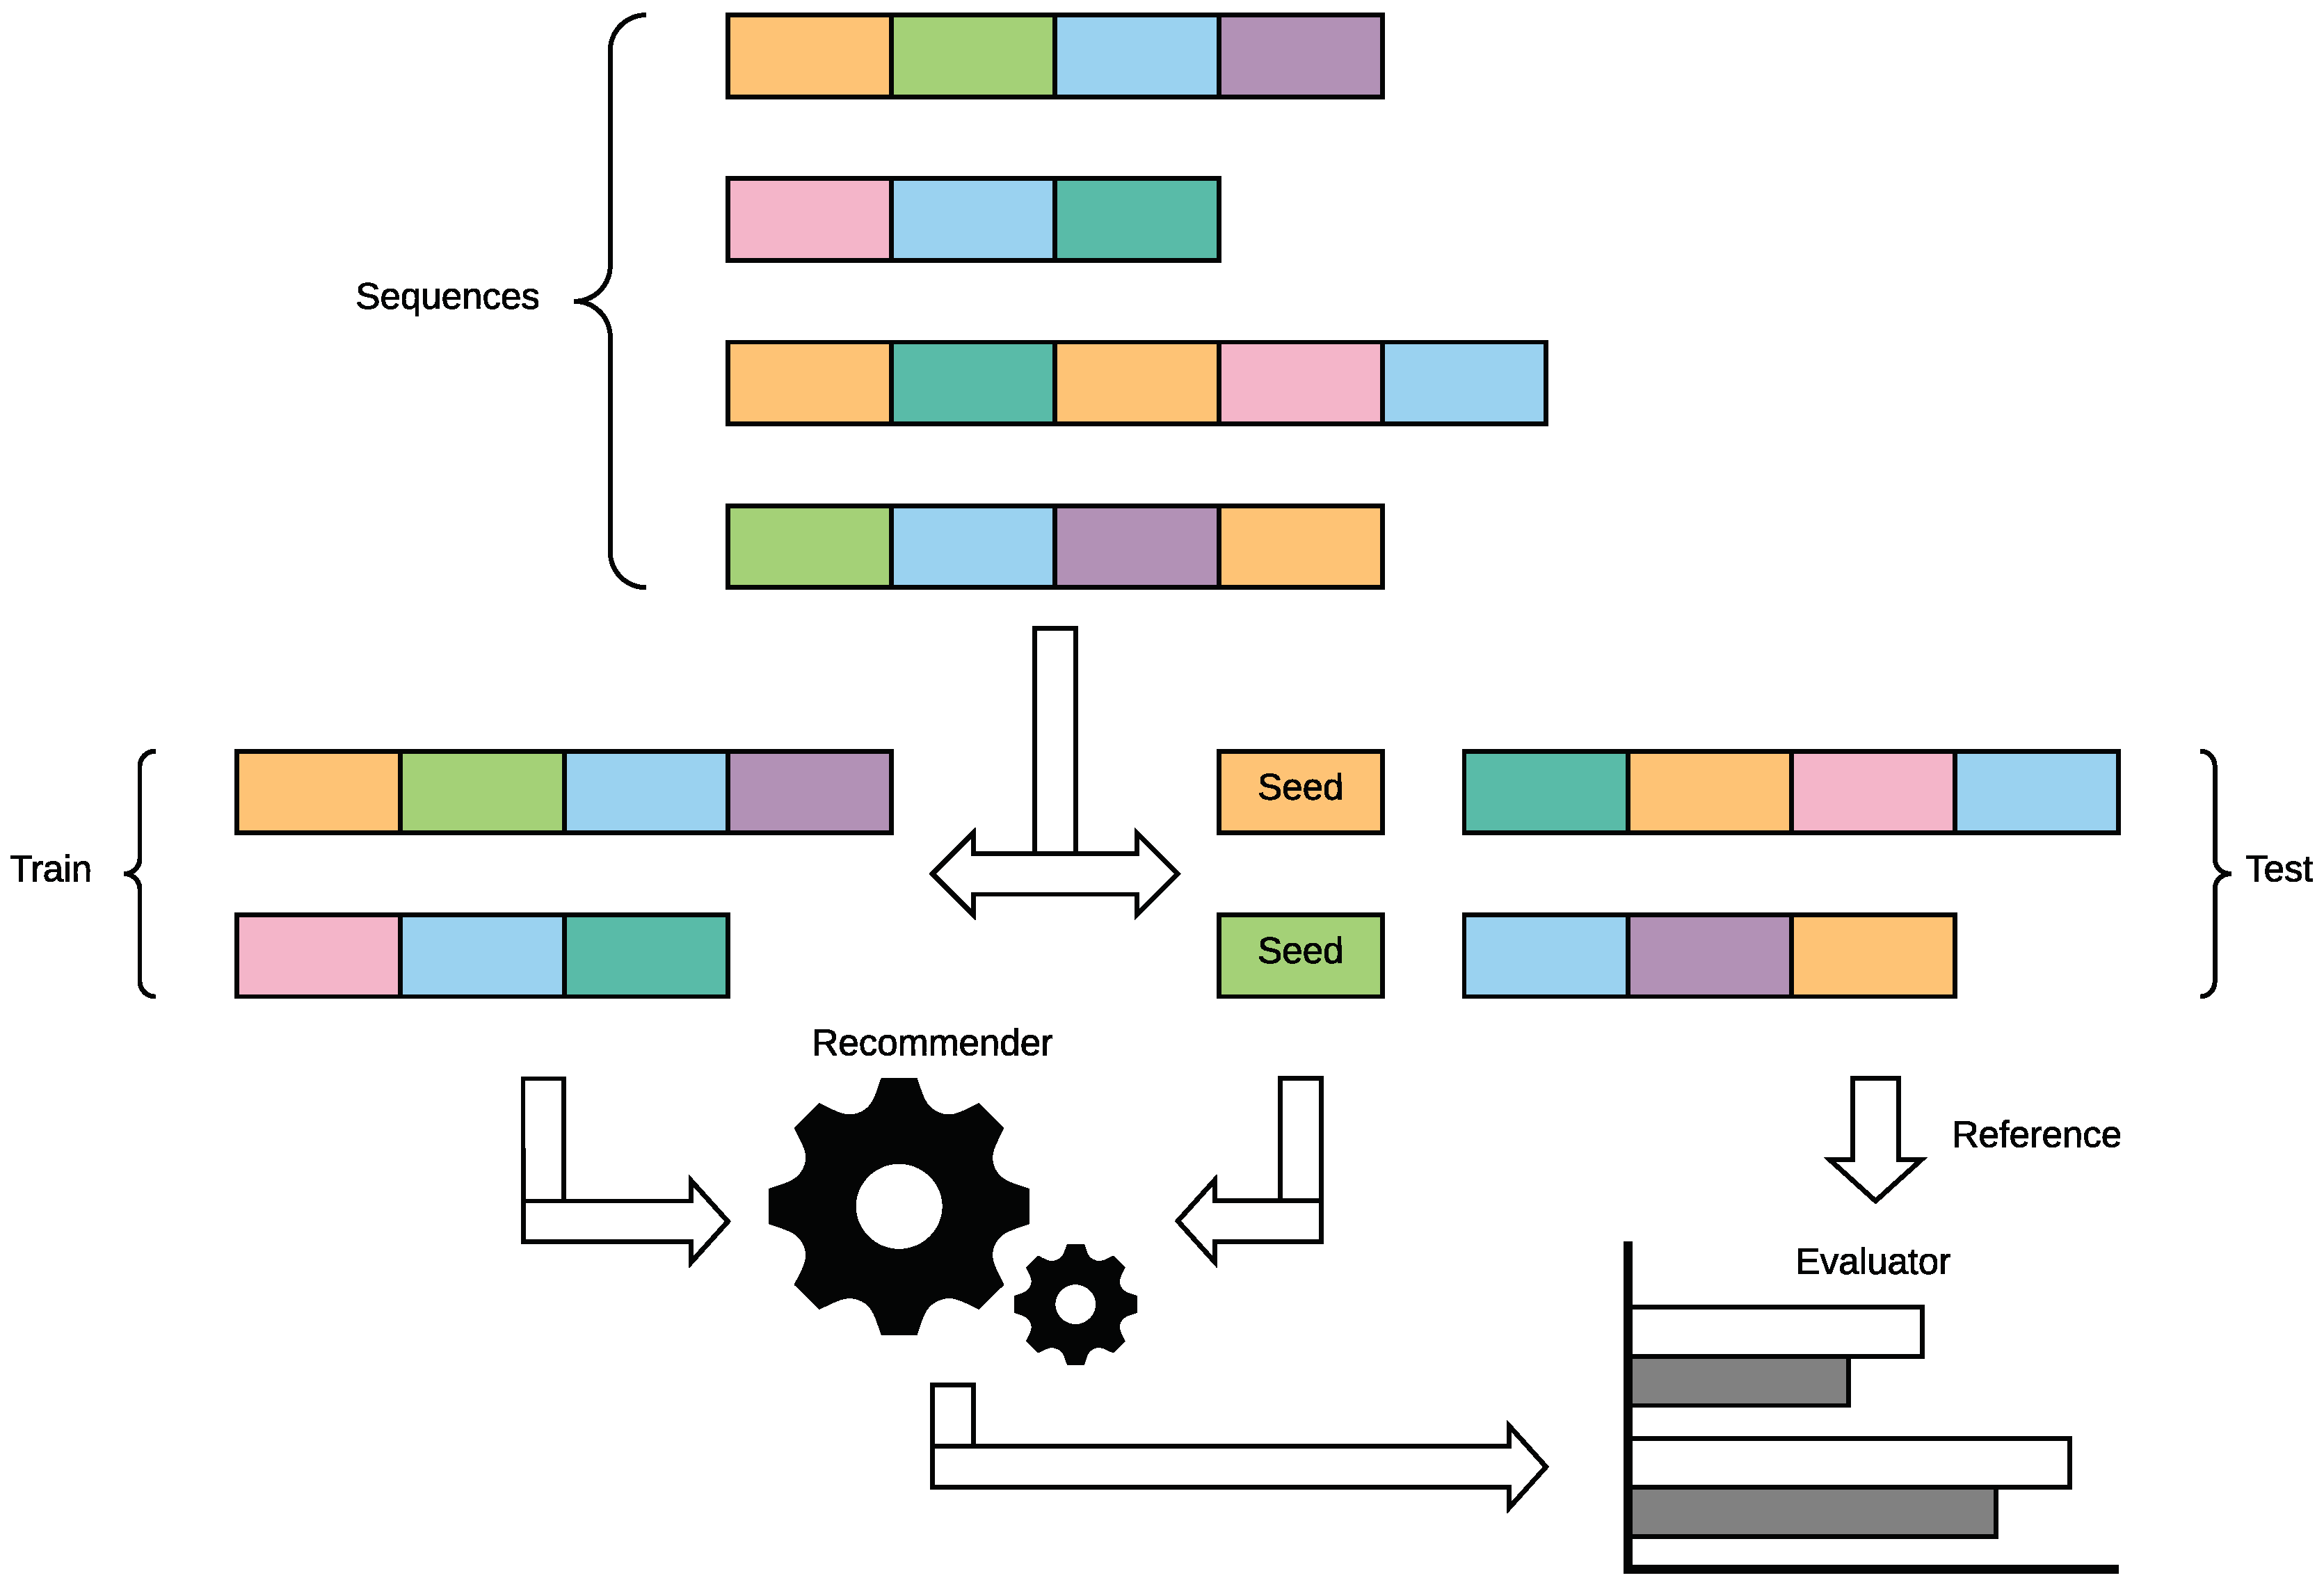
By relying on the set of ratings available in the system, it is possible to construct the sequences that will be used to train and to evaluate the recommender. Each sequence only includes the ratings expressed by a single user. On the other hand, each user may produce several sequences.
The concept of
sequence is similar to the concept of
session in a traditional web interaction: if two ratings are distant in time more than an interval
, then they belong to different sequences. Some ratings may be isolated and, for this reason, not part of any sequence. The most appropriate value for
depends on the domain: for example, in the POI recommendation scenario, it could be considered of a few hours as reported in [
16].
Definition 2. A sequence is a temporally ordered list of ratings created by a particular user , i.e., for each i, and .
In Algorithm 1, we list the procedure for creating the set , given the set of users , the set of ratings , and a time interval . Please note that we do not allow the creation of sequences of length one because they do not encode a meaningful temporal order.
| Algorithm 1 Generation of the set , given , , and . |
Require:- 1:
- 2:
for alldo - 3:
- 4:
for all do - 5:
if then - 6:
if is ⌀ then - 7:
- 8:
end if - 9:
- 10:
else - 11:
if then - 12:
- 13:
- 14:
end if - 15:
end if - 16:
end for - 17:
end for - 18:
return
|
A sequence-based recommender is an RS capable of suggesting a personalized sequence that is built starting from a seed rating
, considering the example sequences already available in the system and the specific behavior of a certain user. The seed rating is characterized by a seed item
, a target user
, and an initial timestamp
. The seed item can be represented by any item that belongs to the catalog, but, more in general, it is a point in the space of items
. For example, in the music domain, it could identify not only a particular song, but also an artist, a genre, or a mood. The target user is the user to whom the sequence is recommended, while the initial timestamp represents the point in time in which the recommendation is created. The generated sequence is of a fixed length and it contains exactly
k ratings. Please note that if
, we are dealing with a sequential RS as defined in [
10].
Definition 3. Given a seed rating , and a length , a sequence-based recommender is the function , i.e., .
Most sequence-based recommenders are based on probability models, and therefore they can be interpreted as a sampling function
applied to the conditional probability
:
Using the chain rule, the sequence probability
can be written as:
For example, in the case of a Markov chain, each rating depends on the previous one, i.e.,
:
Thus, a sequence-based recommender system typically works by learning from a set of sequences
the conditional probability of the next rating
to the sequence of previous ones
, i.e., the factors of the right-hand side of Equation (
2). Sampling sequences directly from Equation (
2) would require computing the probabilities of all the
possible sequences, where
is the size of the vocabulary of items and
k is the length of the sequences. Since this becomes easily computationally unfeasible, we opt for a greedy approach, in which at each step we sample the next most likely item. A sampling function
is defined to select a particular next rating from the previous ones at each step:
A trivial example of is the function, which simply selects the most probable next rating. In the following, we will assume that is implemented by a weighted random sampling function.
Algorithm 2 formalizes the procedure for generating a personalized sequence, given a seed rating , and a length k, i.e., it describes the sampling function . For k times, the next rating of the recommended sequence is generated using the function . The function implements the sampling function and it returns the most probable next rating for the current input sequence. In practice, the sequence-based recommender system can estimate the probability that the next rating of the current sequence will include a particular item at a certain timestamp.
Please note that the greedy procedure described in Algorithm 2 is not the only way to create samples of sequences, and thus, the user of the evaluation framework or the designer of the recommendation method are free to define other ways and strategies for that end.
| Algorithm 2 Recommendation of a sequence of length k. |
Require:- 1:
- 2:
fortokdo - 3:
- 4:
- 5:
end for - 6:
return
|
To compute some metrics that are part of the evaluation framework, it is necessary to know the number of items that are associated with a certain sequence. For this reason, we define the set as the set of items that are part of the sequence , and the set as the set of ratings that are part of the sequence . Therefore, is the number of distinct items available in , while represents the length of , i.e., the number of ratings available in .
For instance, we can suppose that the set of ratings is equal to . Then, if we assume that the only pair of timestamps that violates the constraint is , we can create two sequences: , and . The rating is not part of any sequence because it was created at some point in time later than and we do not have any subsequent rating expressed by . We also observe that and . We would like to recommend a sequence of length two to user starting from item at timestamp . In fact, it is not required that the item already appeared in the sequences related to user . A possible solution to this problem is to define and then to recommend , where and may be used to suggest when consuming the items.
6. Conclusions
In this paper, we have discussed the problem of recommending sequences of items tailored to the needs of a certain user. We have introduced an offline evaluation framework, called Sequeval, capable of handling this novel family of RSs in an offline scenario and we have developed an implementation of it that is publicly available on GitHub. We have included in such a framework an evaluation protocol and eight different metrics, to better capture the characteristics of the algorithms considered.
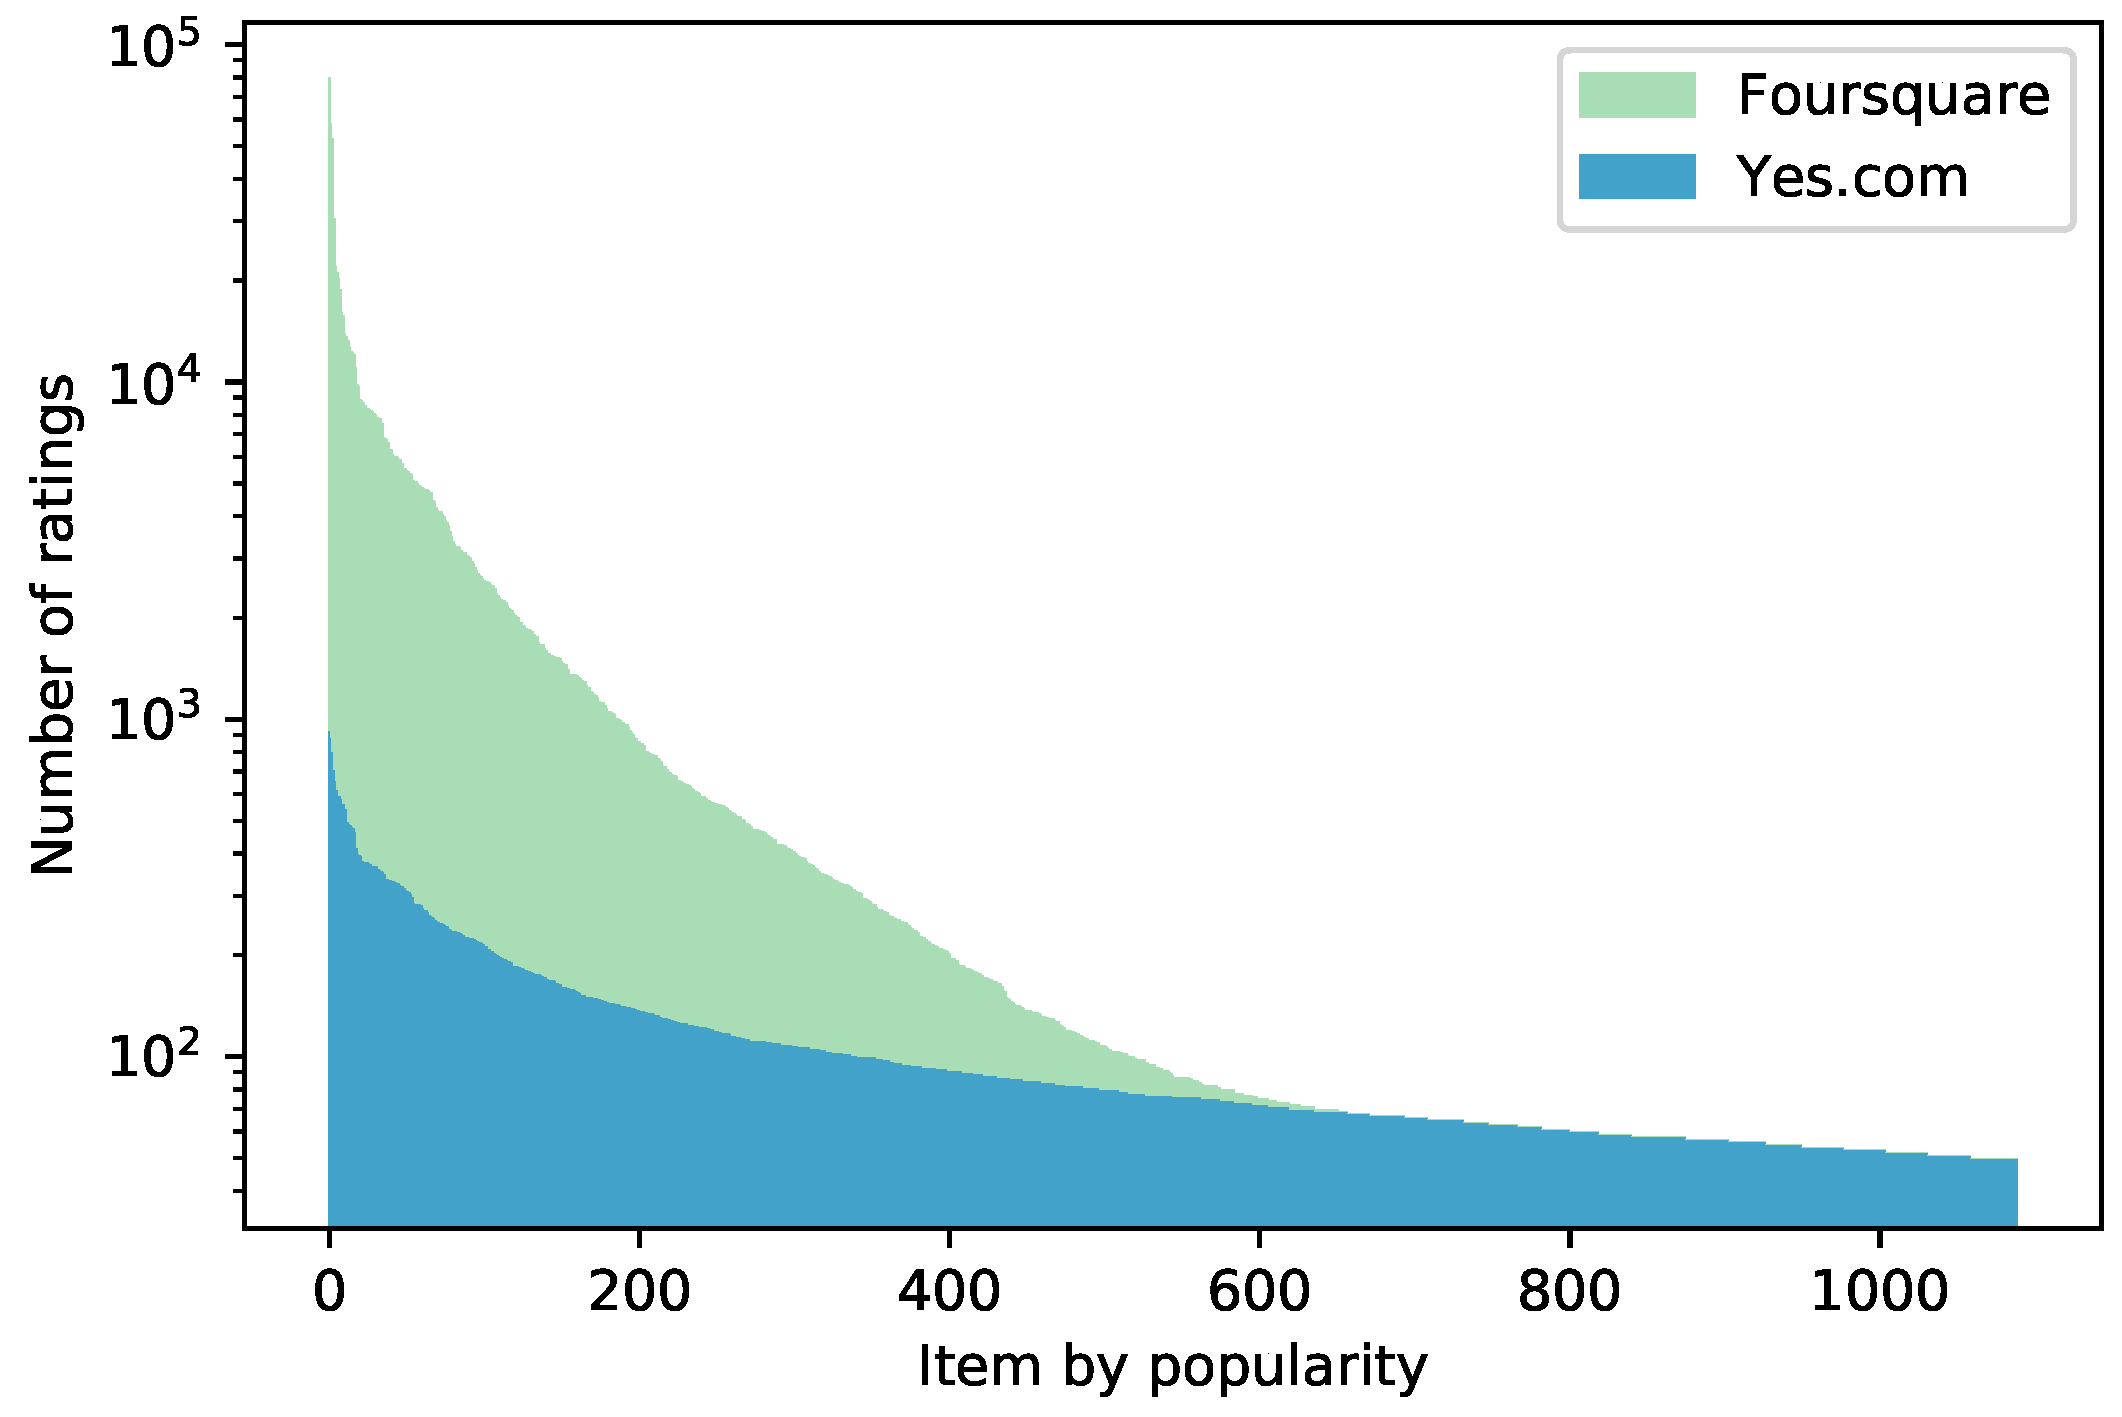
We have performed an empirical analysis of Sequeval by relying on it for conducting a comparison among four baselines, a CRF recommender, and an RNN-based one. The results have highlighted the fact that this framework is flexible, as it can be successfully applied in non-standard recommendation scenarios, such as with Yes.com, and complete, because of the different metrics included that consider several dimensions of the recommended sequences. In addition, we have observed that the RNN recommender system can effectively adapt itself to the characteristics of the training dataset. This conclusion supports the validity of Sequeval as a tool for conducting an offline experimentation.
Nevertheless, it is important being aware of the limitations of such a framework. The availability of many metrics may produce results which are difficult to interpret, especially if we are uncertain of what are the most relevant dimensions in our recommendation scenario. More in general, this is a common limitation of offline experiments, and it needs to be addressed by comparing the most promising algorithms in a subsequent online trail.
The formal definitions provided in
Section 3 have been conceived as an extension of the seminal works on RSs capable of recommending sequences. For this reason, it is possible to set the length of the recommended sequences to 1 if we are interested in obtaining a single item. In a similar way, the item included in the seed rating can be exploited in order to set the context of the recommendation, but it can also be ignored if we want a sequence only based on the target user.
As future work, we plan to study in more depth what are the relationships among the different metrics included in the framework, with the purpose of integrating them in a final value that expresses the overall quality of the recommender. Such global score should be related to the recommendation scenario: for example, diversity may be important when recommending POIs to a tourist, but less useful in the musical domain.
Furthermore, it would be desirable to be able to create an evaluation framework that is adopted by a community of researcher when testing their algorithms, harmonizing the evaluation protocols and the interpretation of the performance of sequence-based RSs. For this reason, it is necessary to identify and to include in it some meaningful datasets, related to different domains that could be exploited during the evaluation phase, as well as other baselines and new RSs. The strategic choice of publicly releasing sequeval fosters further reuse and extension.
Finally, we would like to expand our evaluation framework to also support the online experimentation that should be performed after the offline analysis. The final goal of this work is, in fact, to enable researchers to spend more time in realizing the recommendation algorithm as they can rely on an evaluation framework that has already been designed and validated.


