Communication

Life Cycle Assessment of a Virtual Reality Device

by
Anders S. G. Andrae
Huawei Technologies Sweden AB, Skalholtsgatan 9, 16494 Kista, Sweden
Challenges 2017, 8(2), 15; https://doi.org/10.3390/challe8020015
Submission received: 25 May 2017 / Revised: 4 July 2017 / Accepted: 6 July 2017 / Published: 8 July 2017

Abstract

:
Virtual reality (VR) is one of the strongest trends for future communication systems. Considering the amounts of VR devices expected to be produced in the coming years, it is relevant to estimate their potential environmental impacts under certain conditions. For the first time, screening life cycle assessment (LCA) single score results are presented for a contemporary VR headset. The weighted results are dependent much on the source of the gold and the electric power used in production. Theoretically, using recycled gold for the VR subparts would be very beneficial seen from an environmental damage cost standpoint. Using low environmental impact electric power in the final assembly of the VR headset, in the final assembly of integrated circuits, and in the preceding wafer processing would also be worthwhile. Distribution of the final product is more pronounced than for other consumer electronics.

1. Introduction

The amount of new kinds of Information & Communication Technology (ICT) devices is expected to escalate in the next decade. This surge is driven by new types of services based on virtual reality (VR) and augmented reality (AR) gaming expected to create a build-up in data communication. Moreover, the current power usage of ICT is expected to increase substantially as a result of the increased data traffic [1]. Despite tremendous power saving efforts, data centers are and will be a particularly egregious contributor to the electricity use of the ICT sector [1]. The production of ICT infrastructure and devices is currently around 20% of the sector’s electricity use in which the share of mobile devices is expected to increase [1]. According to the World Input-Output Database (WIOD), in 2014 the economic value of “manufacture of electrical equipment” and “manufacture of computer, electronic, and optical products” was 4% (≈6.4 trillion United States Dollars (USD)) of the total global value of all economic activities (≈161 trillion USD) [2]. Furthermore, the economic value of China’s share of these two types of manufacturing was ≈41% [2]. So-called global sustainability accounting shows how much emissions and resources are associated with economic sectors such as electronics [3,4]. In any case, new devices, such as VR headsets produced in China and elsewhere, are expected to make up an increasing part of the energy and resource footprints associated with these two kinds of electronics manufacturing. A short review of prior knowledge of consumer electronics Life Cycle Assessments (LCA) is found in Section 1.1. Partial disclosure of methods, data and other relevant information is given in Section 2. The main results are found in Section 3 and then discussed in Section 4. The conclusions provided in Section 5 are consistent with the evidence.

1.1. Review of Prior Knowledge Observations

Life cycle assessments (LCA) of consumer electronic devices are common [5]. Most LCAs report Global Warming Potential indicator scores and other mid-point indicators, while weighted single score results are rare. Subramanian and Yung [5] summarized 134 LCA studies and observed that the final transport distribution is generally not a dominant life cycle stage, but rather the use and production stages. In many cases, differences in LCA reports of consumer electronics can be explained by the differences in assumptions [6]. LCA studies of smartphones are widespread, so the major hot spots for Global Warming Potential Indicators (GWPI) are well known as integrated circuit (IC) production, screen production, use, and distribution. Andrae [7] used the Life Cycle Impact Assessment Method based on Endpoint modeling (LIME1) [8,9] to estimate the environmental damage cost of producing one smartphone from 2012, ≈1800 Japanese Yen (JPY). However, more recent devices such as VR headsets are not yet covered by the academic literature. Furthermore, to the authors’ knowledge, neither Environmental Priority Strategies (EPS2015) [10] nor LIME2 [11] results for consumer electronics device have yet been published.

1.2. Objectives

The main aim of the present research is to briefly, for the first time, show (on a micro-level) the absolute and relative environmental impact distribution of a VR headset device. This VR consists of different plastic, mechanical, and electronic parts as well as packaging materials. The environmental impact is reported as weighed single scores for three end-point indicators and four different scenarios. However, the research does not attempt to introduce any new methodological advances in LCA of consumer electronics. Instead, a streamlined attributional LCA is performed in order to identify unforeseen hotspots and avoid burden shifting. In particular, the initial effect of using entirely recycled metals (gold, silver, and copper), instead of obtaining those metals from ore mining, is explored. The choice of attributional LCA modeling instead of consequential modeling is motivated by the limited objective of this research, which is not the long-term environmental consequences of adding one more VR headset.
The hypothesis, regardless of scenario and single score end-point environmental impact indicator, is that, similar to smartphones, the silicon wafer processing and final assembly of integrated circuits (ICs) have the highest relevance for the overall environmental impact of VR headsets.

2. Materials and Methods—Screening Life Cycle Assessment Using Single Weighted Scores

The present short communication is restricted regarding the availability of materials or information due to confidentiality reasons. However, the description is aimed at being as transparent as possible regarding main assumptions.

2.1. Methodology

The screening LCA is performed with the LCA tool Simapro 8.2.3.0; its associated life cycle inventory (LCI) databases are combined with available primary data from the VR headset life cycle. These primary data consist of the masses and material types of sub-parts and packaging materials, whereas the rest of the data (e.g., use scenario, transportation distances, emission profiles, and characterization indices) are well-founded assumptions and secondary data. Still, an inspiring principle is to follow the Environmental Footprint Guidance by the European Commission [12] as closely as possible. The characterization, damage, and weighting factors of EPS2015 and LIME2 do not come with the present version of Simapro, so they are imported manually.
Table 1 shows the baseline Scenario 1 (S1) as well as three others testing the effectiveness of some innovations in the supply chain. Scenario 2 (S2) assumes that the metals gold, silver, and copper used to produce the VR headset come from secondary sources, i.e., the recycled content is 100%. Scenario 3 (S3) assumes that 5% of the VR headsets are reused for two years, and Scenario 4 (S4) assumes that four different unit processes in the upstream can use electric power with a very low inherited environmental impact. The low impact electric power (LIEP) used in the present analysis has >95% lower environmental impact per kWh than the high impact electric power (HIEP). Simapro’s parameter feature is conveniently used for modeling of the VR headset S1–S4.

2.2. Description of the VR Device Product and Life Cycle

VR headsets are used to provide VR to the user, e.g., for computer games and simulation of driving behavior [13]. The present VR headset is designed for use with large smartphones. The VR headset uses a casing that the smartphone clips into. However, smartphones are outside the studied product system.
Data shown for electric power production and other unit processes are weighted results for the environmental impact evaluation method called International Reference Life Cycle Data System 2011 Midpoint+ version 1.08 (ILCD) [14]. The weighted ILCD results are given in “points” (Pt).

2.2.1. Functional Unit

The functional unit (f.u.) chosen here is rather simplistic: “To enable gaming, video viewing, 3D video viewing, and picture viewing without interruption for a period of one hour per day during one year.” The reference lifetime is three years. This simplicity fits the objective of screening attributional LCA of one VR headset. Multi-allocation of the VR functions which smartphones, tablets, or game consoles can provide is not attempted.

2.2.2 System Boundaries

The studied product system only considers the VR headset share of the hardware needed to provide achieve the functions expressed in Section 2.2.1.

Pre-Final Assembly—Raw Material Acquisition, Part Production, and Final Assembly

The pre-final assembly considers mechanical parts (plastics and screws, etc.) and electronics seen from a cradle-to-gate viewpoint. For screening LCAs and the purpose of this research, secondary LCI data from the eco-invent database are enough. The scenarios are set up by e.g., replacing particular original electric power mixes and sources of metals used in eco-invent by other electric power mixes and metal sources in turn found in the same database. This technique is well-known in LCA for the purpose of sensitivity analyses. Nevertheless, the masses and material contents of each part are identified from bill-of-materials lists. The total mass of the VR headset and its packaging materials are ≈450 g and ≈400 g, respectively. The values used for HIEP and LIEP are ≈90 µPt/kWh and ≈4 µPt/kWh, respectively.

Final Assembly (FA)

FA of electronics and mechanical parts occurs after 1000 km truck of transportation from the part assembly factories. Estimated electric power used per VR headset is ≈2 kWh. The value used for truck transportation is ≈10 µPt/[ton × km]. No support activities such as product development are included.

Distribution

For S1–S4, the distribution assumes 1000 km of transportation by truck from FA to the airport, and then 9500 km by air from China to Europe. The values used for truck transportation and air transportation are ≈10 µPt/[ton × km] and ≈70 µPt/[ton × km], respectively.

Use

The electricity consumption of a VR headset is generally related to the power use of different viewing modes. This implies that the range for the power consumption could be wide. The present device is powered by connecting to a smartphone. Here it is assumed that a fraction of a fully charged smartphone battery (3000 mAh) is used during one hour of VR gaming per day during three years. The charging efficiency is ≈78%. By this simplified method, the electricity usage per reference lifetime is obtained (≈1.8 kWh). EAIEP is used to approximate the environmental impacts from electricity use. The value used for EAIEP is ≈88 µPt/kWh. No maintenance is included.

End-of-Life Treatment (EoLT)
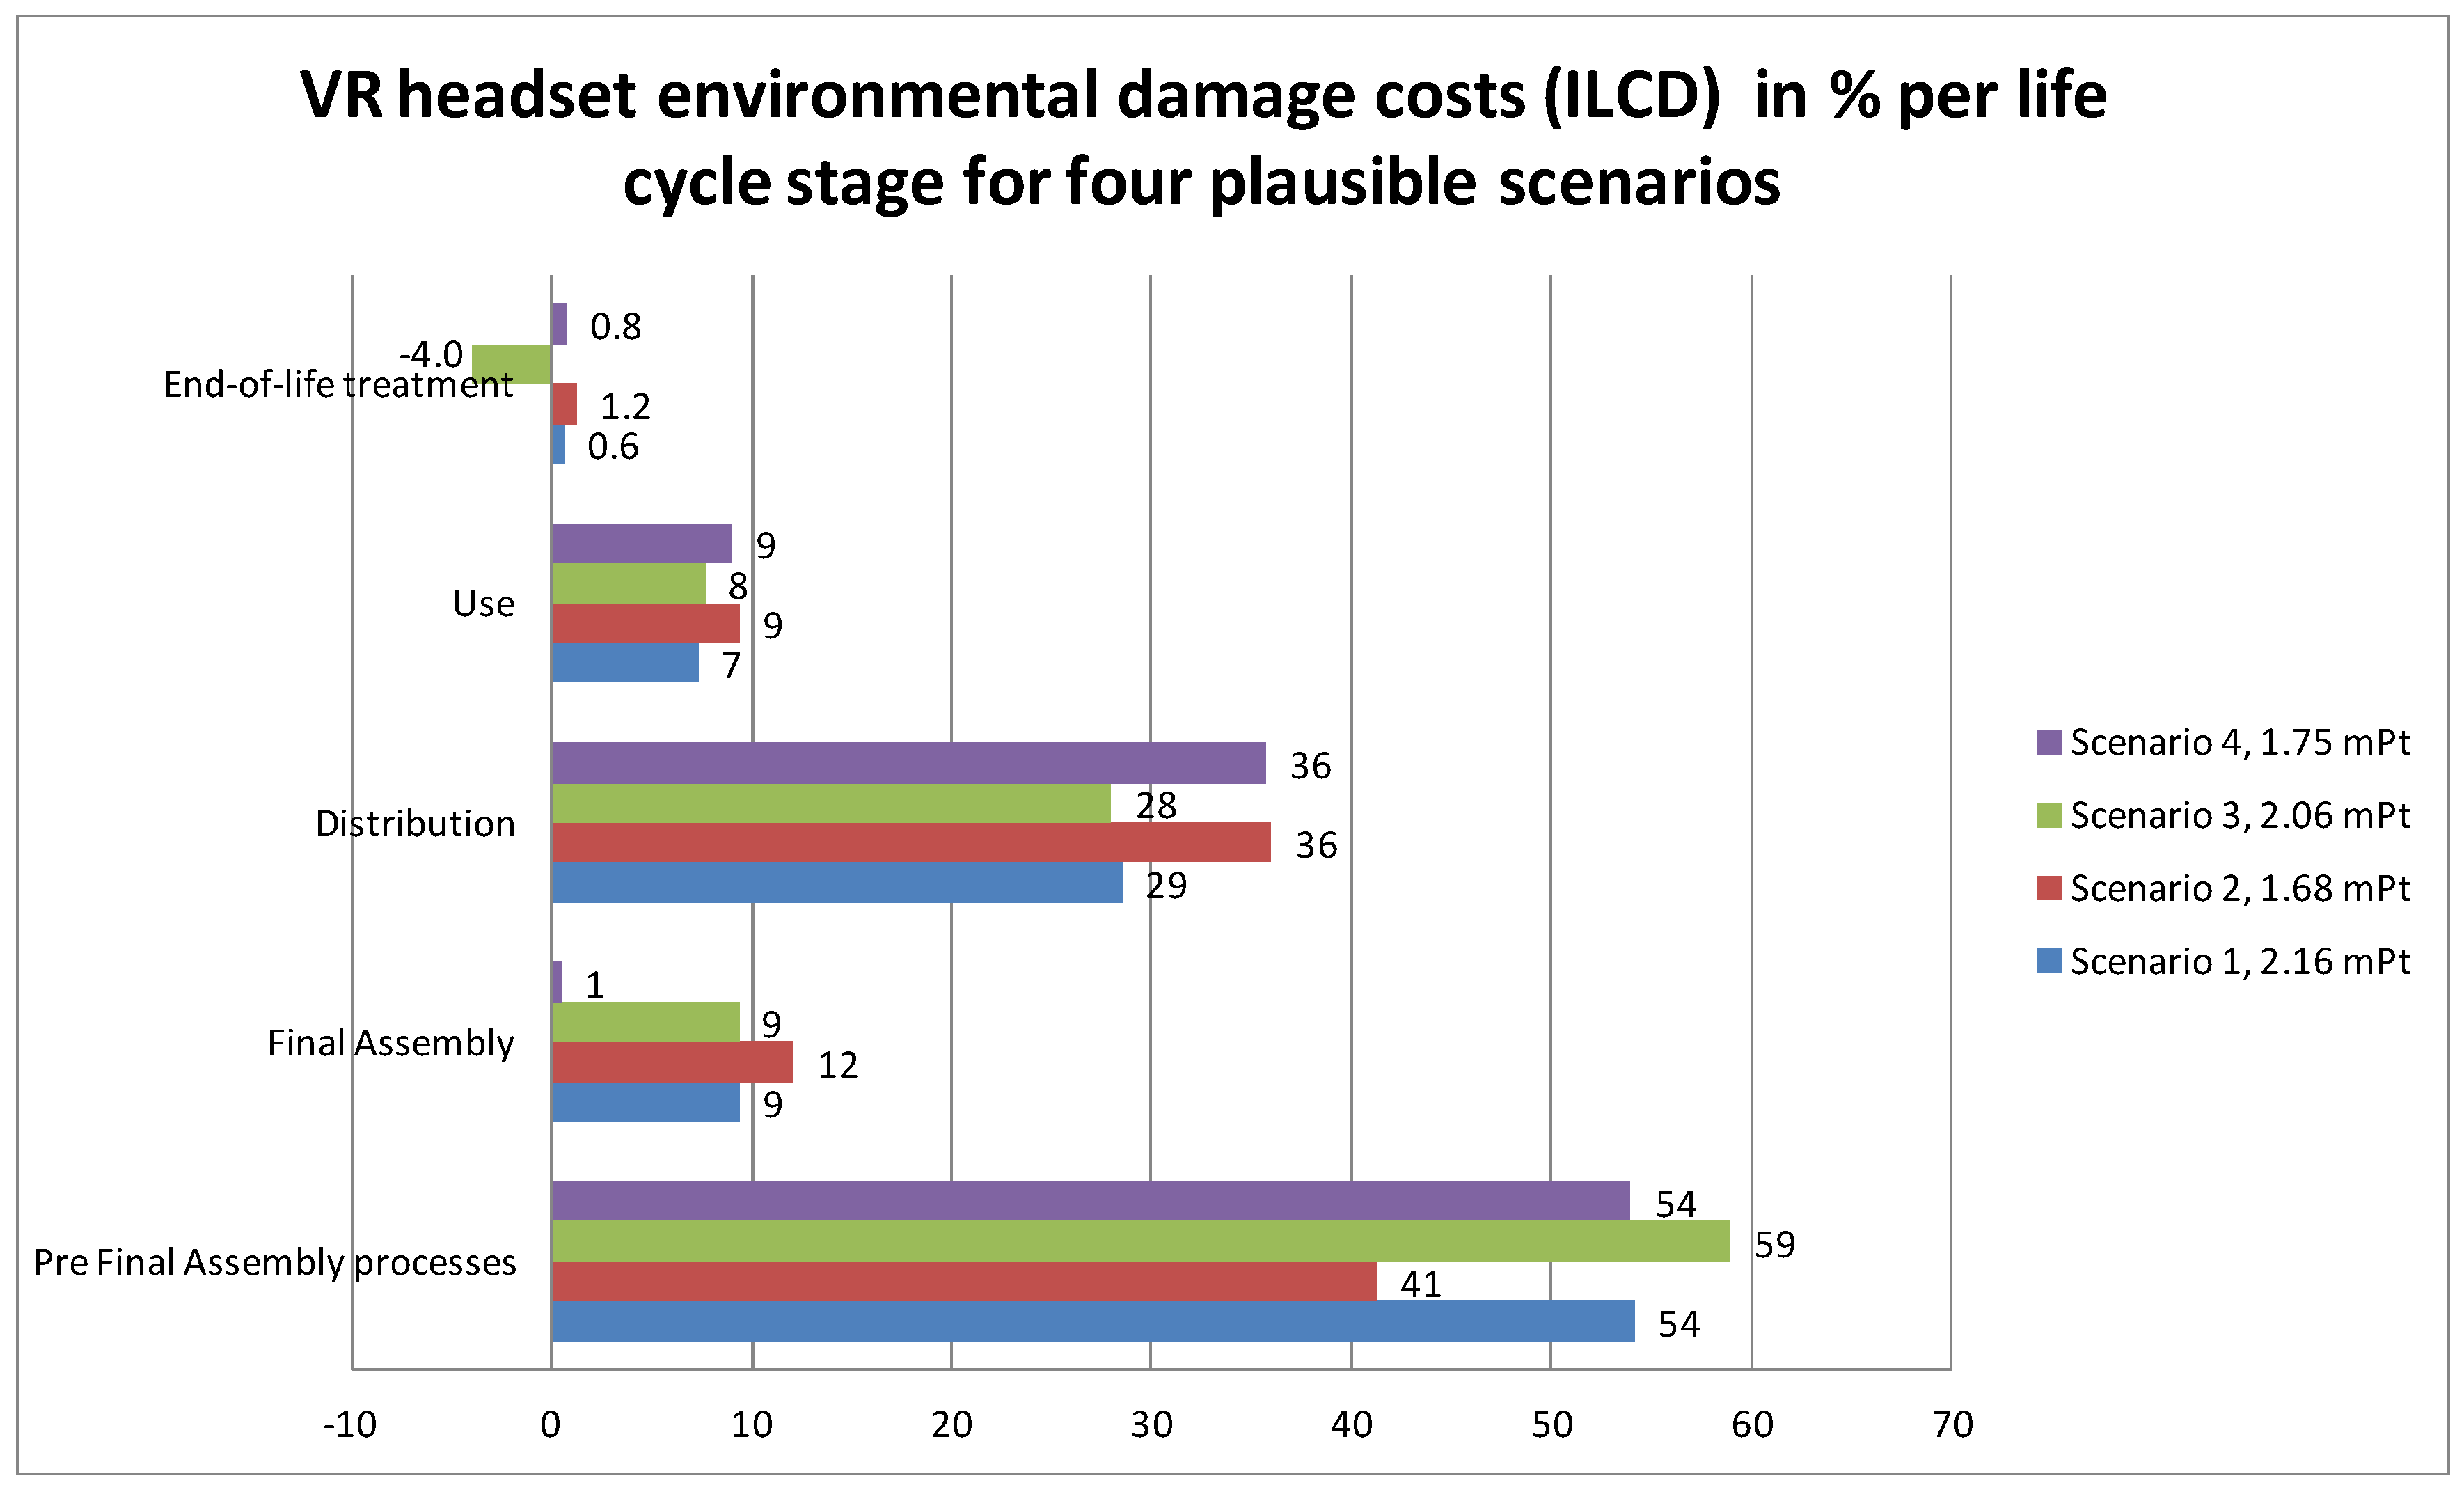
For EoLT, a simplified disposal scenario is set up in SimaPro featuring shares for a waste scenario and reuse, respectively. After three years of use, neither the reuse of sub-parts nor of the VR headset itself are assumed for baseline S1, i.e., 100% of the VR headset goes to the waste in this scenario. Instead, the entire product is transported 1000 km by truck to metal recovery and/or incineration. For all scenarios, the plastic parts of the VR headset are incinerated, as well as the packaging materials. EAIEP is assumed to be avoided as electric power could be recovered as a by-product of plastics waste incineration [12]. For S3, a two-year use is assumed for 5% of the entire VR headset again using EAIEP.

3. Results

Here follow the weighted results for the VR headset for ILCD [14], EPS2015, and LIME2. In ILCD, an equal weight (1/12) of the twelve non-toxicity related impact categories is used and the toxicity-related impact categories are set to zero (Figure 1). Moreover, the normalization factors for the four toxicity impact categories (e.g., freshwater ecotoxicity) are set to zero. Elsewhere, the normalization factors are used as in the given ILCD, e.g., 9.9 for “Minerals and fossil resource depletion.” Figure 1 shows the values used in SimaPro for ILCD.
In fact, the non-equal weights for each impact category, shown in the weighting column in Figure 1, are currently pending a decision to be based on the judgment of a life cycle impact assessment expert panel. In an attempt to expand the sensitivity analysis and improve the trend finding, two other weighting methods, EPS2015 [10] and the Life Cycle Impact Assessment Method based on Endpoint modeling (LIME2) [11], are also applied to S1–S4.
In Figure 2, Figure 3, Figure 4 and Figure 5, the main results of the present investigation are shown.
Figure 2 shows that S2 helps reduce the share of the pre-final assembly processes by 20%.
Figure 3 shows that S2 helps reduce the share of the pre-final assembly processes by 36%.
Figure 4 shows that S4 helps reduce the share of the final assembly processes by 94%.
Figure 5 shows that EPS2015 and LIME2 make totally different evaluations of the supply chain strategies proposed in S2 and S4. For S2 with EPS2015, the reduction of the environmental cost is remarkable. Likewise, using power with low environmental damage cost is very beneficial for S4 with LIME2.

4. Discussion

This study shows that the choices of scenario, system boundary, and evaluation method to some extent decide the eco-design drivers for the present VR headset. As a further matter, the study suggests that it could become awkward to agree on product category rules (PCR) to satisfy all settings which are seemingly reasonable. PCR will only be valid for a specific region, such as the one represented by the European Union.

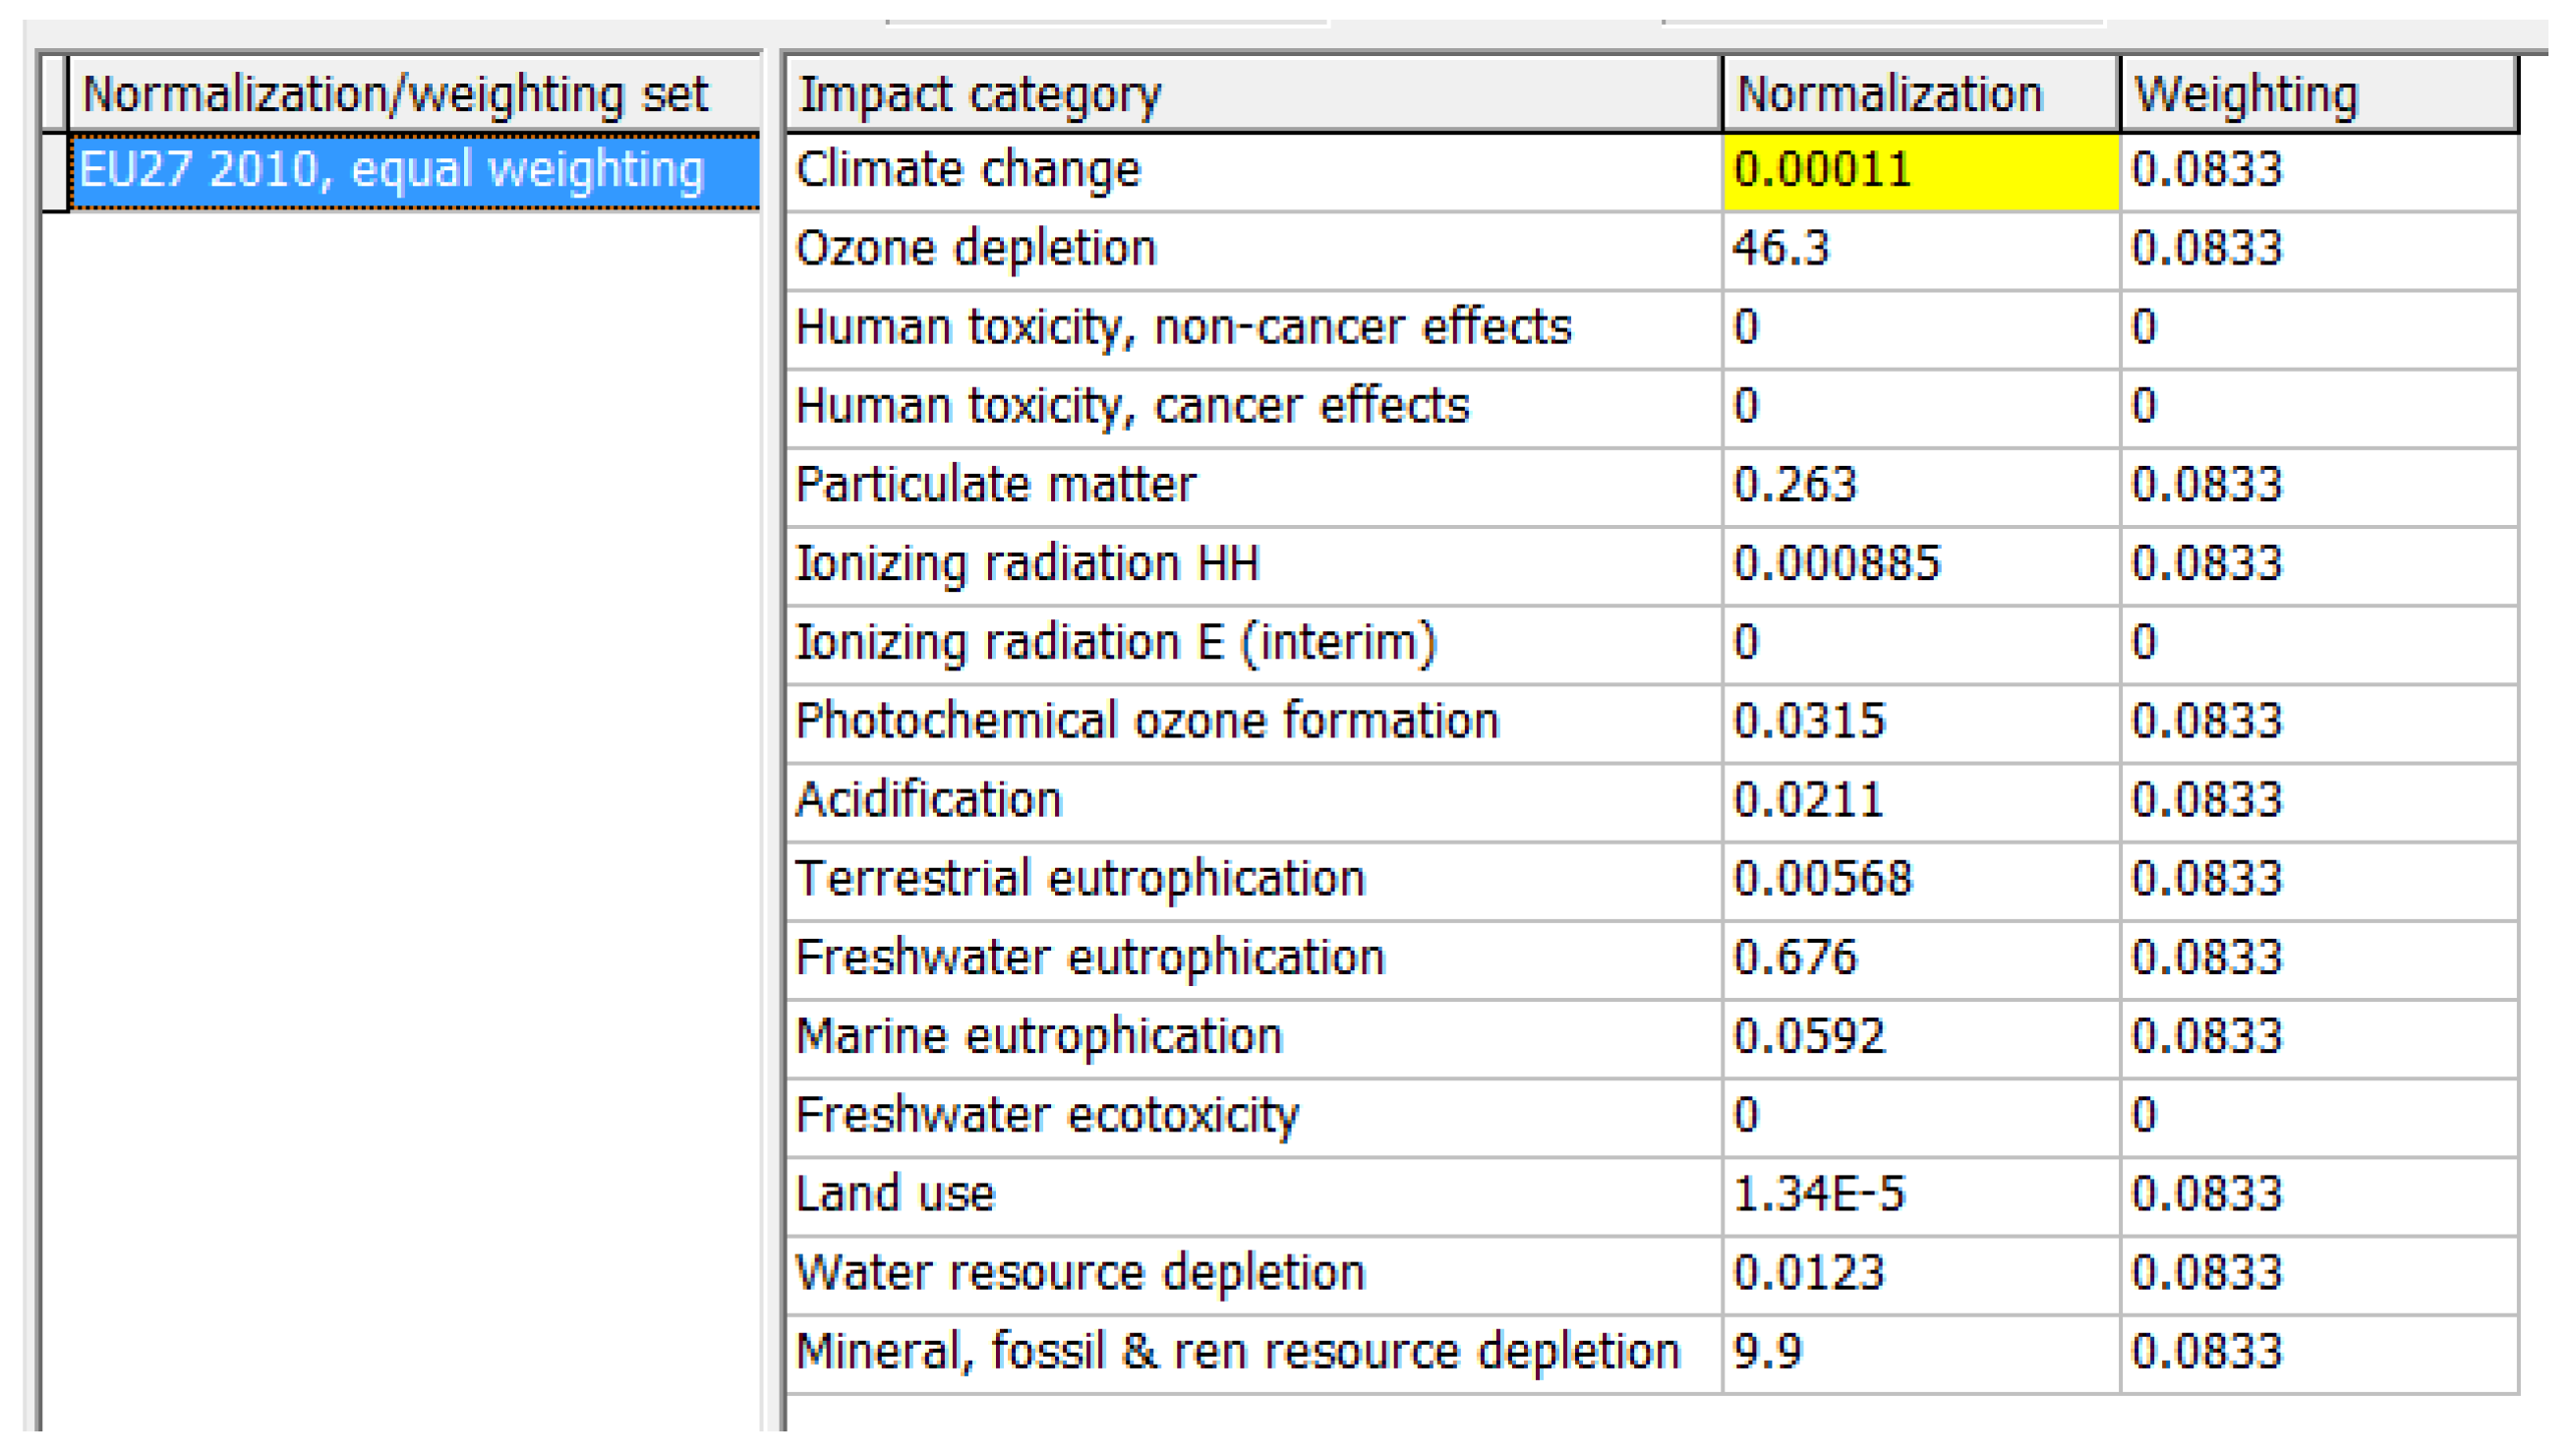
4.1. ILCD Evaluations

For S1 in Figure 2, it is surprising that the distribution of the VR headset (≈29% of the total score) is more important than the use stage (≈7%). The share of the production of the electronics at ≈36% is rather high, as expected for consumer electronics [6,7,15,16], and all other parts such as plastic and screws are ≈17%. The ICs (including 13% gold production and 12.5% Wafer Processing (WP) and final IC assembly) are 26% of the total score, which make them important but not dominant as hypothesized. Primary gold production is 18% of the total score. In comparable ILCD scores for smartphones and tablets, the electronics (especially ICs and screens) are ≈90% and distribution is ≈2%.
For S2, the metals gold, silver, and copper are assumed to originate from metal scrap. For the present VR headset, ensuring the recycled content will in theory be an effective strategy for reducing the environmental damage cost by ≈20%.
Choosing S3, in which 5% of the products are reused, reduces the total score less than 5%. One of the reasons for this is the increasing use stage power consumption.
For S4, using LIEP could reduce the environmental impacts to the same degree as S2. The explanation is that LIEP has ≈20 times lower environmental impact than HIEP per kWh. This difference magnitude might not be the case for all sources of low impact electric power compared to all sources of higher impact electricity.

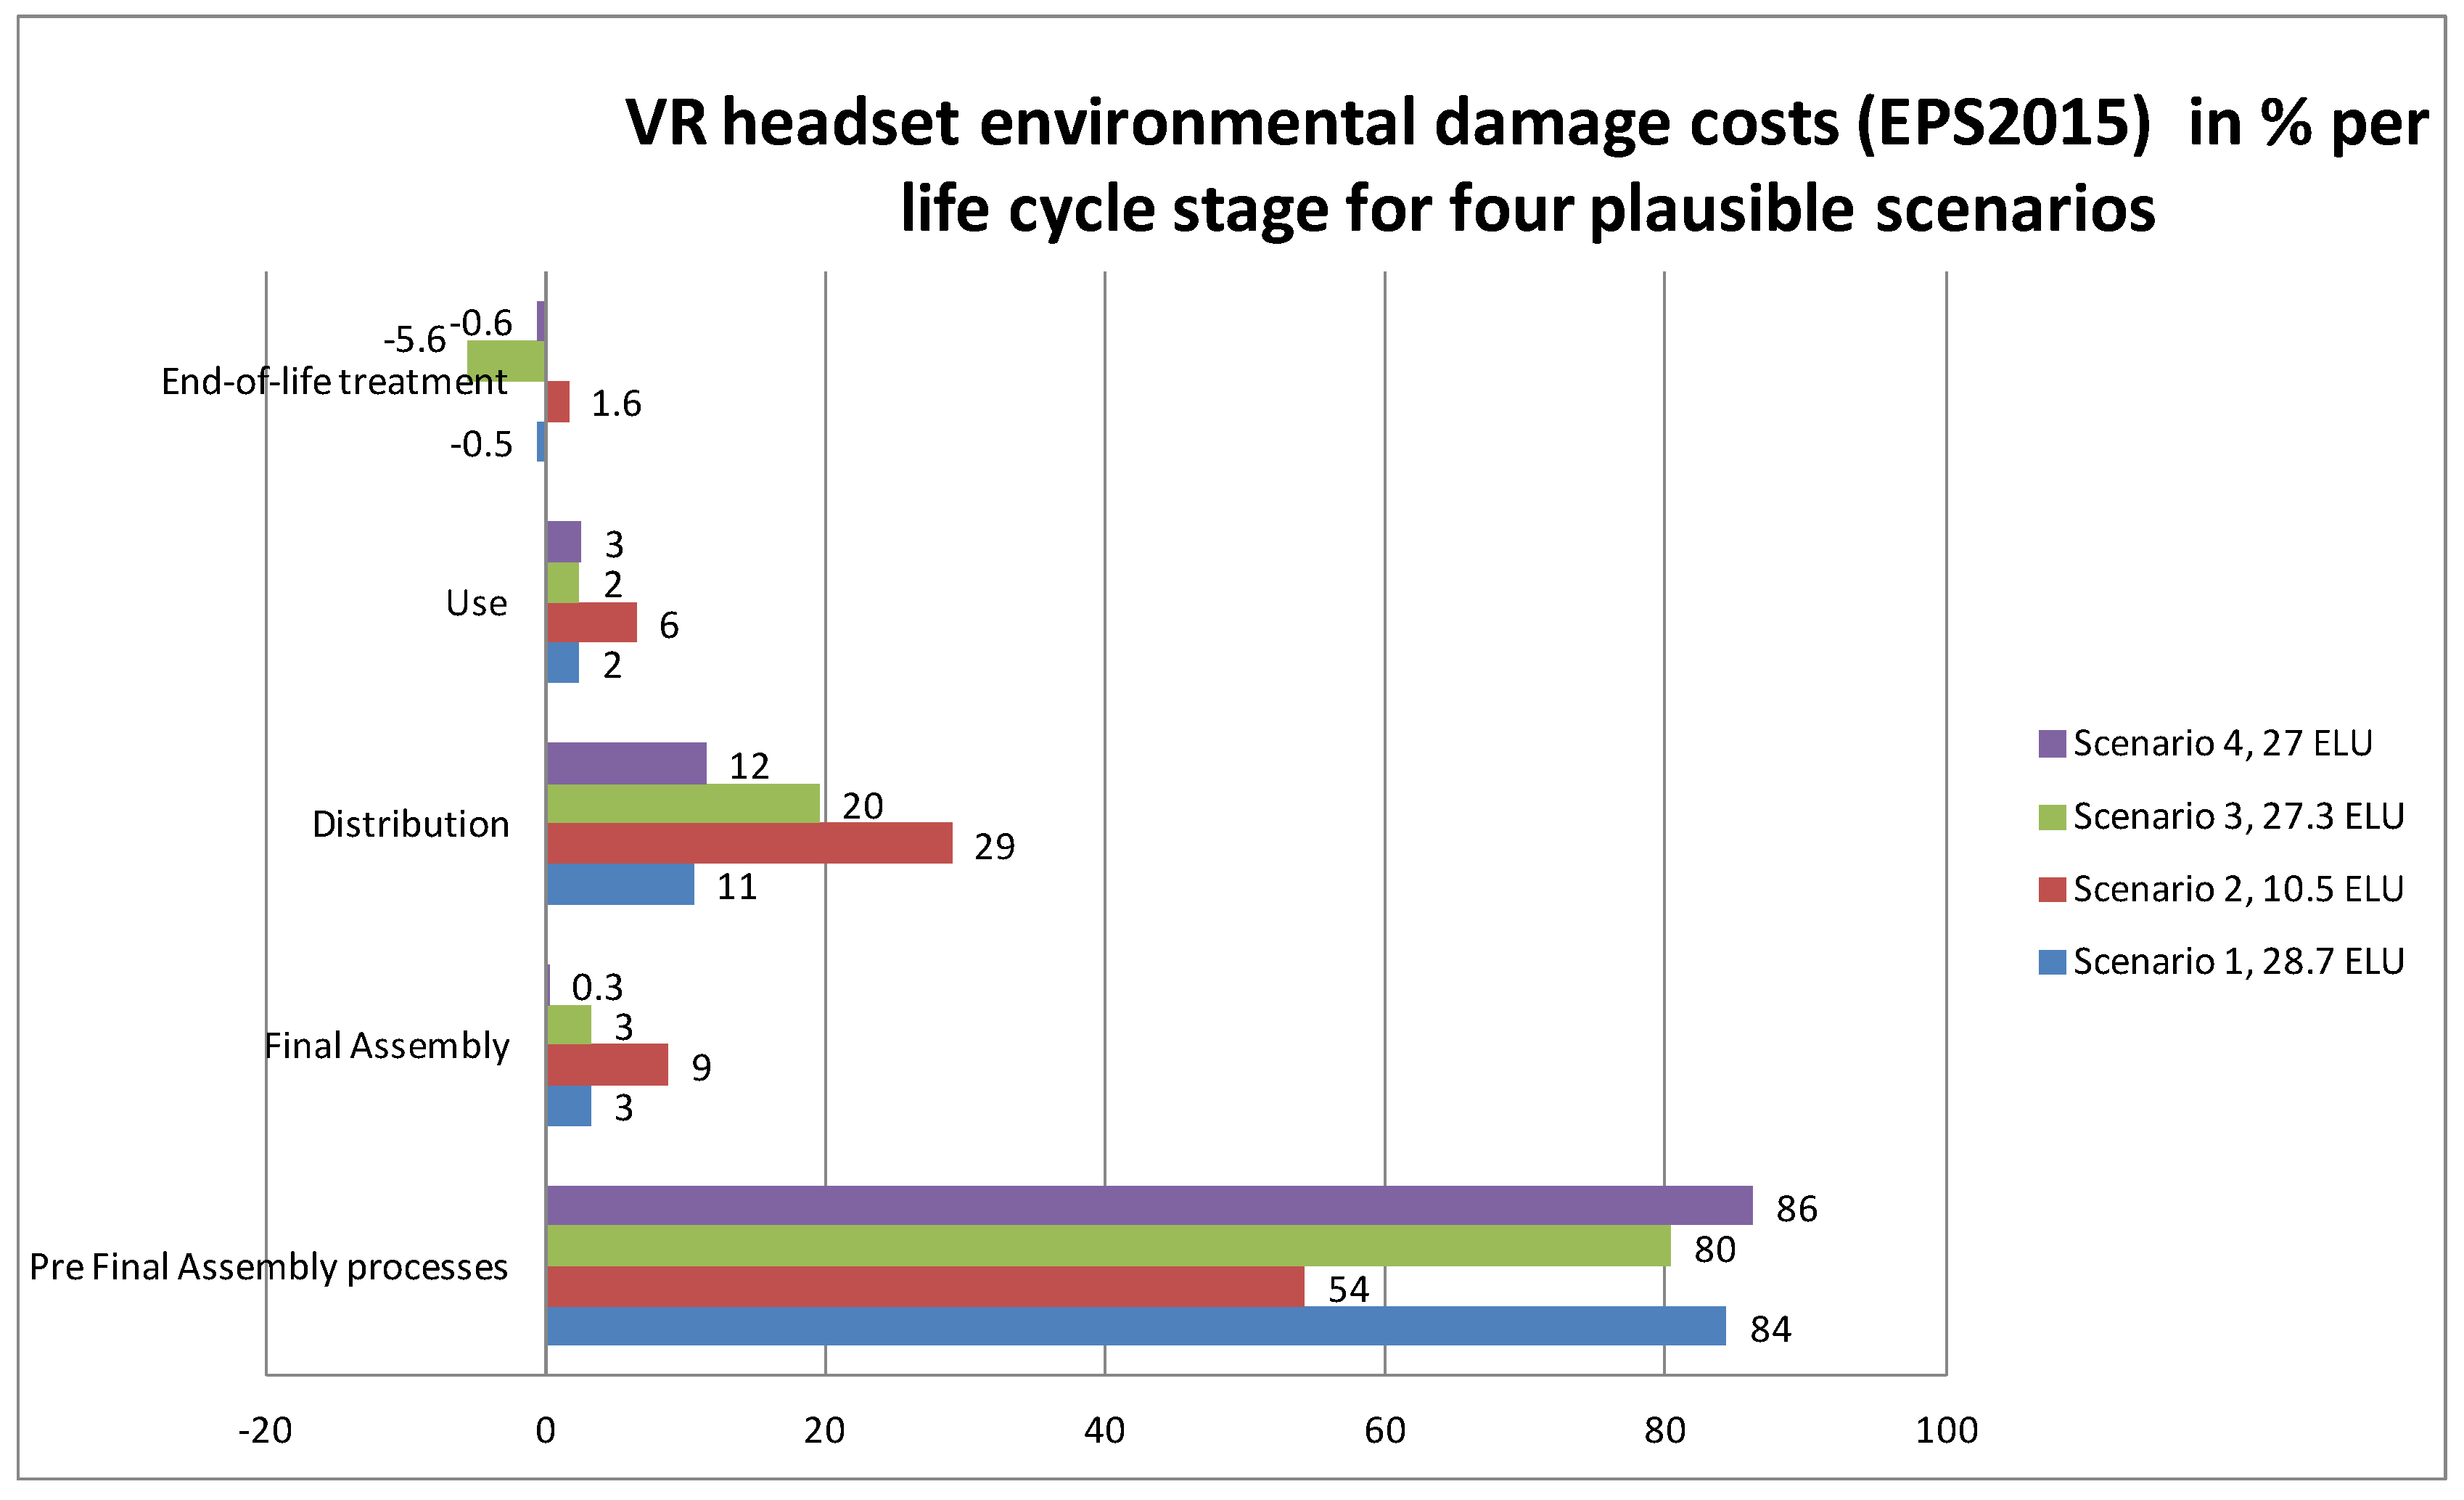
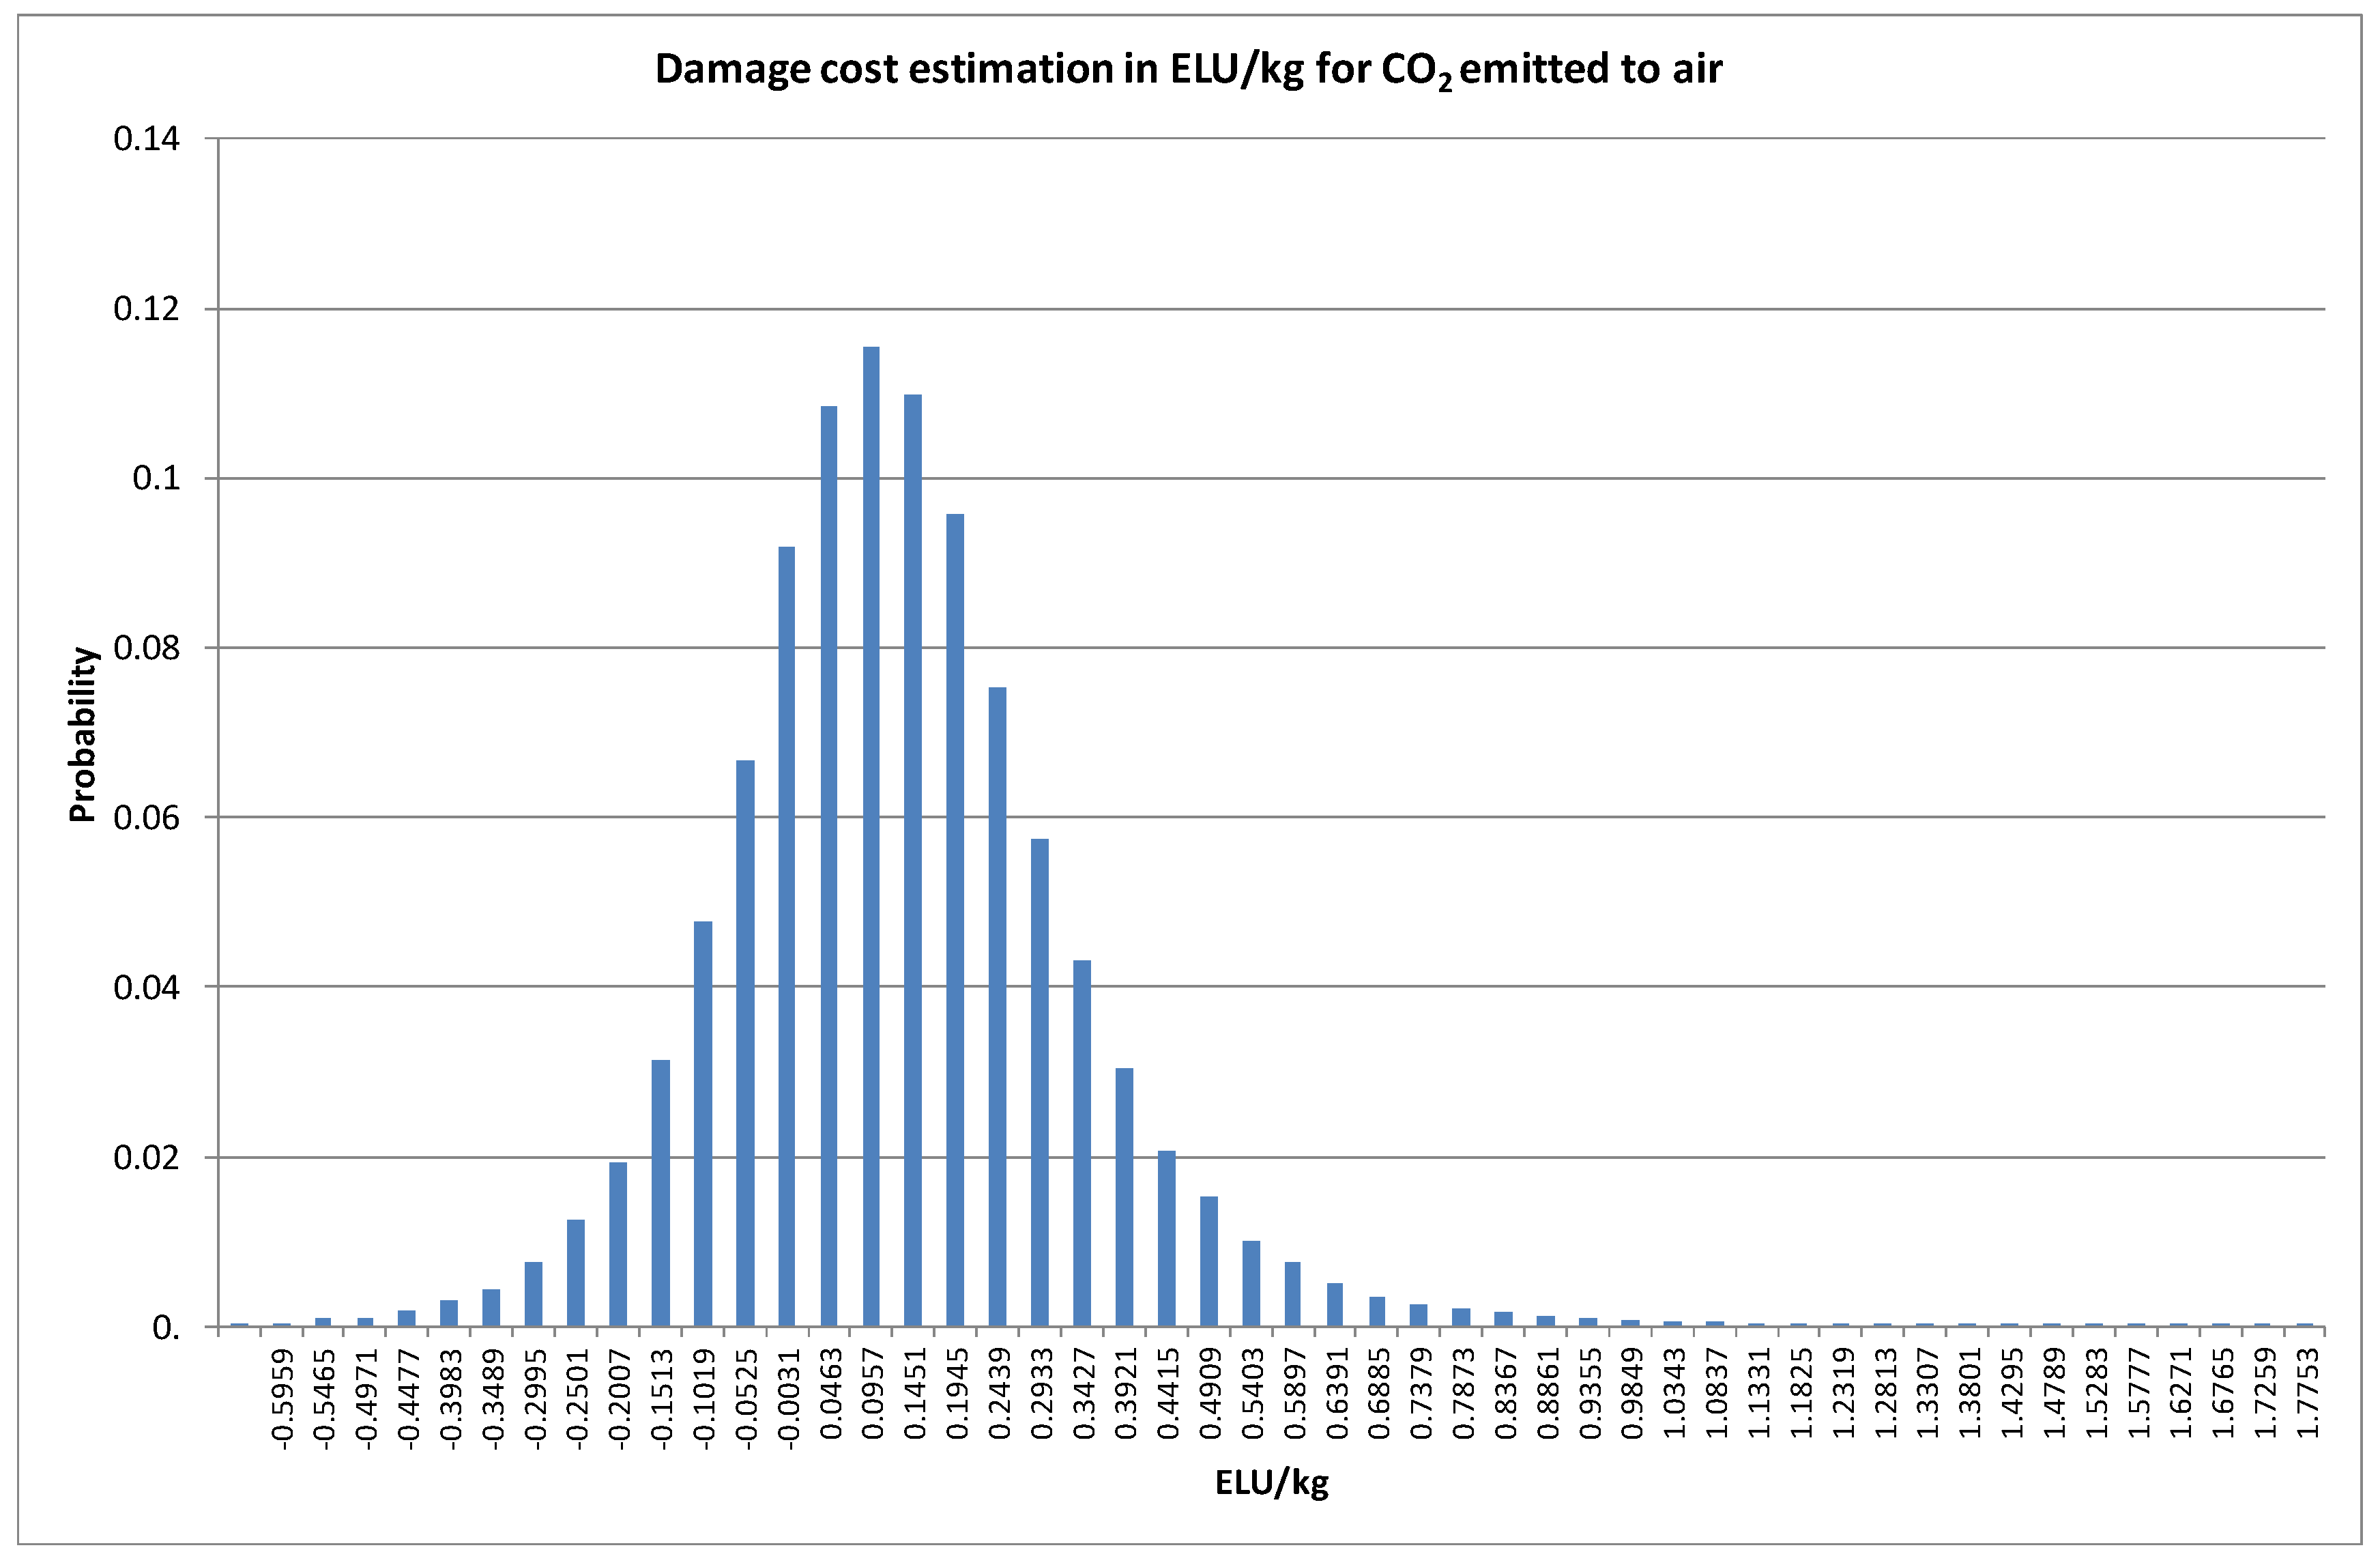
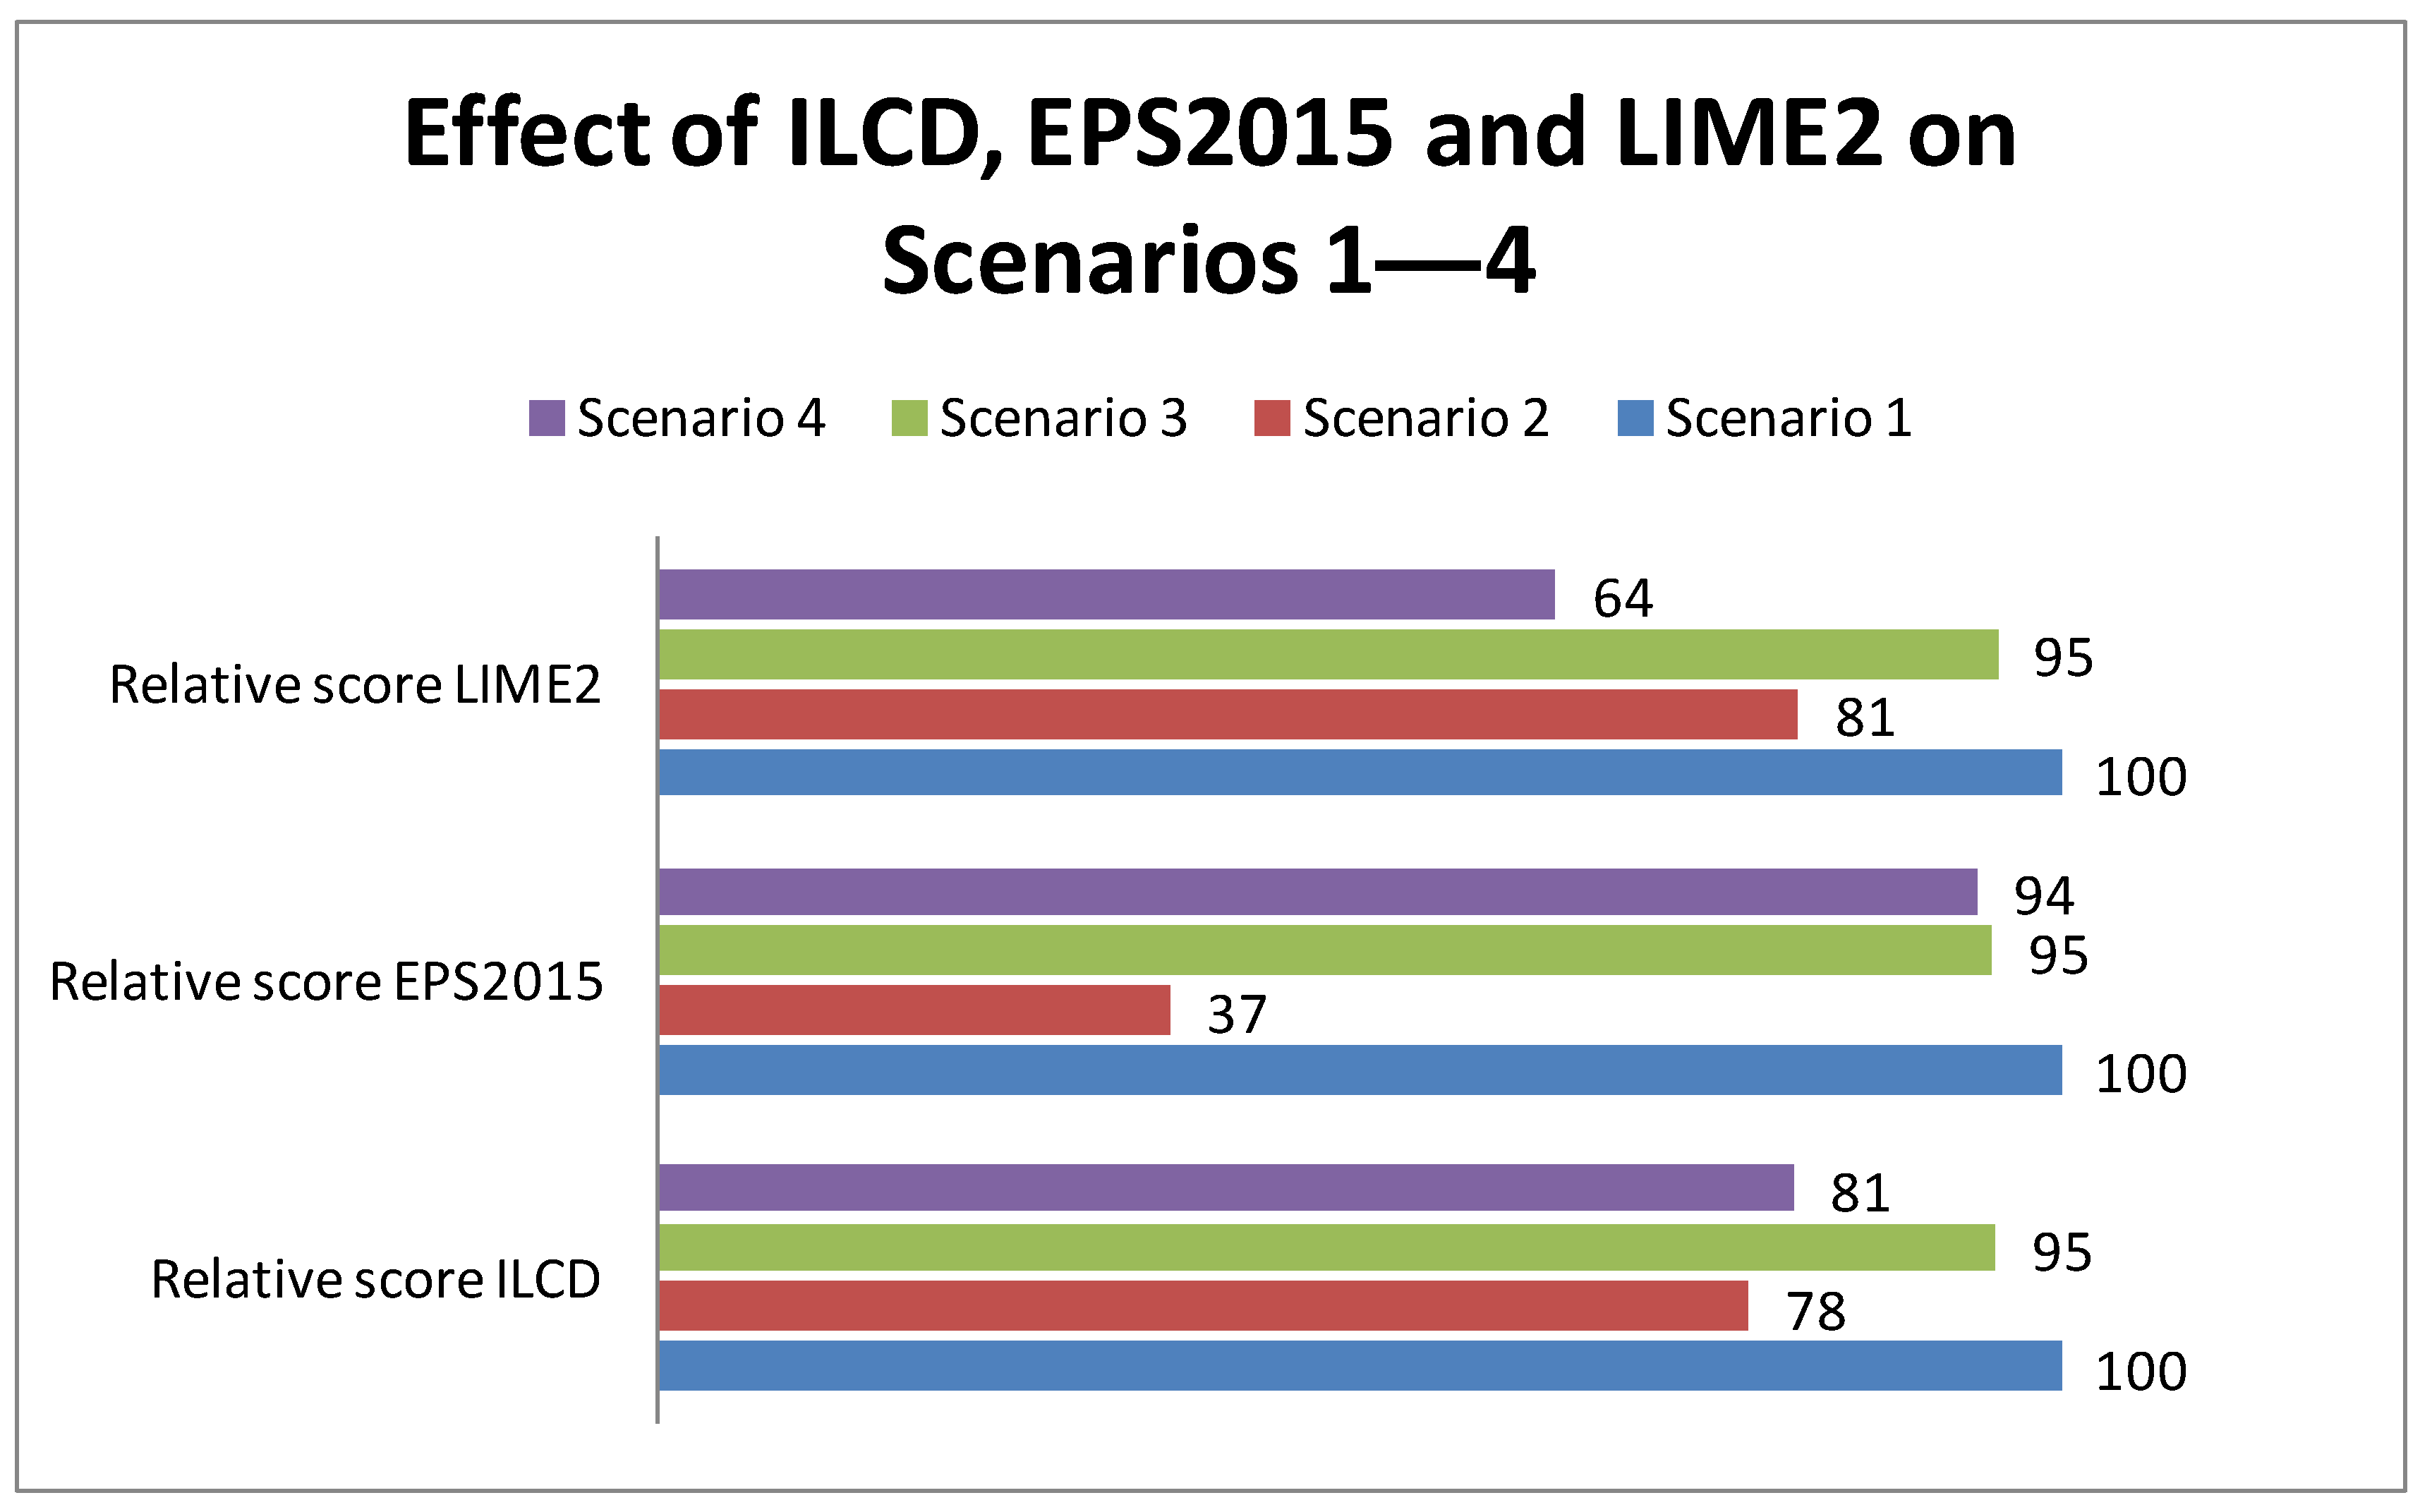
4.2. Applying the Weighting Methods EPS2015 and LIME2 as a Sensitivity Check of ILCD

Two of the most relevant weighting methods for so-called monetized environmental damage costs are EPS2015 (Euros) [10] and LIME2 (Japanese Yen, JPY) [11]. Putting a price on environmental impact is useful for understanding the risk of decisions. It is worthwhile to compare the relative results and trends from these weighting methods to the ILCD single score method. The absolute scores obtained with ILCD, EPS2015, and LIME2 cannot be compared directly as they are based on many different assumptions and, moreover, the weighted ILCD scores do not represent environmental costs. However, the trends and drivers proposed by each method can be compared cautiously.

4.3. EPS2015 Evaluations

EPS is a long-lasting weighting method for LCA that was introduced in 1999 [17,18]. EPS2015 is a complete evaluation system for the pathways of many LCI flows, including mid-point categories (e.g., crop growth capacity and Years of Life Lost (YOLL) both called “state indicators”), damage categories (e.g., human health and ecosystem services, both called “safeguard subjects”), and weighting factors for each mid-point category. The mid-point indicator for one YOLL pathway (heat stress) for the LCI flow CO2 emission to air is 1.35 × 10⁻⁷ person-years/kg, whereas the GWPI for CO2 is 1 kg CO2-eq./kg [10]. The bearing idea of EPS2015 [10] is the cost per LCI flow of reaching sustainability in 2100. As such, EPS2015 addresses long-term costs, but not the long-term market effect which is the goal of consequential LCA. The cost is the one for protecting so-called safeguard subjects of which abiotic resources is one example and ecosystem services is another.
For S1 in Figure 3 and Figure 5, the electronics are 59%, ICs are 49% (43% primary gold production, 7% WP and IC), and primary gold production is 58% of the total EPS2015 score. Hence, the significance of ICs is here due to their gold content and not so much caused by WP and IC. EPS2015 favors S2 because primary gold production stands for a much larger share of the total EPS2015 score than that of corresponding ILCD and LIME2 scores, and naturally the potential is larger when using secondary/recycled gold.
S1, S3, and S4 have similar total scores for EPS2015, implying that reuse (S3) and LIEP (S4) will not lead to a significant difference compared to S1. This trend is similar to the one derived from ILCD for S1 and S3.
The use of secondary metals instead of ore metals, especially gold, is highlighted as S2 shows a 60% reduction compared to S1 (Figure 5). According to EPS2015, it seems more effective to use secondary metals (especially gold) than reuse the VR headset or use LIEP in the upstream. Primary gold here has ≈9800 times higher environmental damage cost than secondary gold (2.28 × 10⁶ versus 230 Environmental Load Units {ELU}/kg).

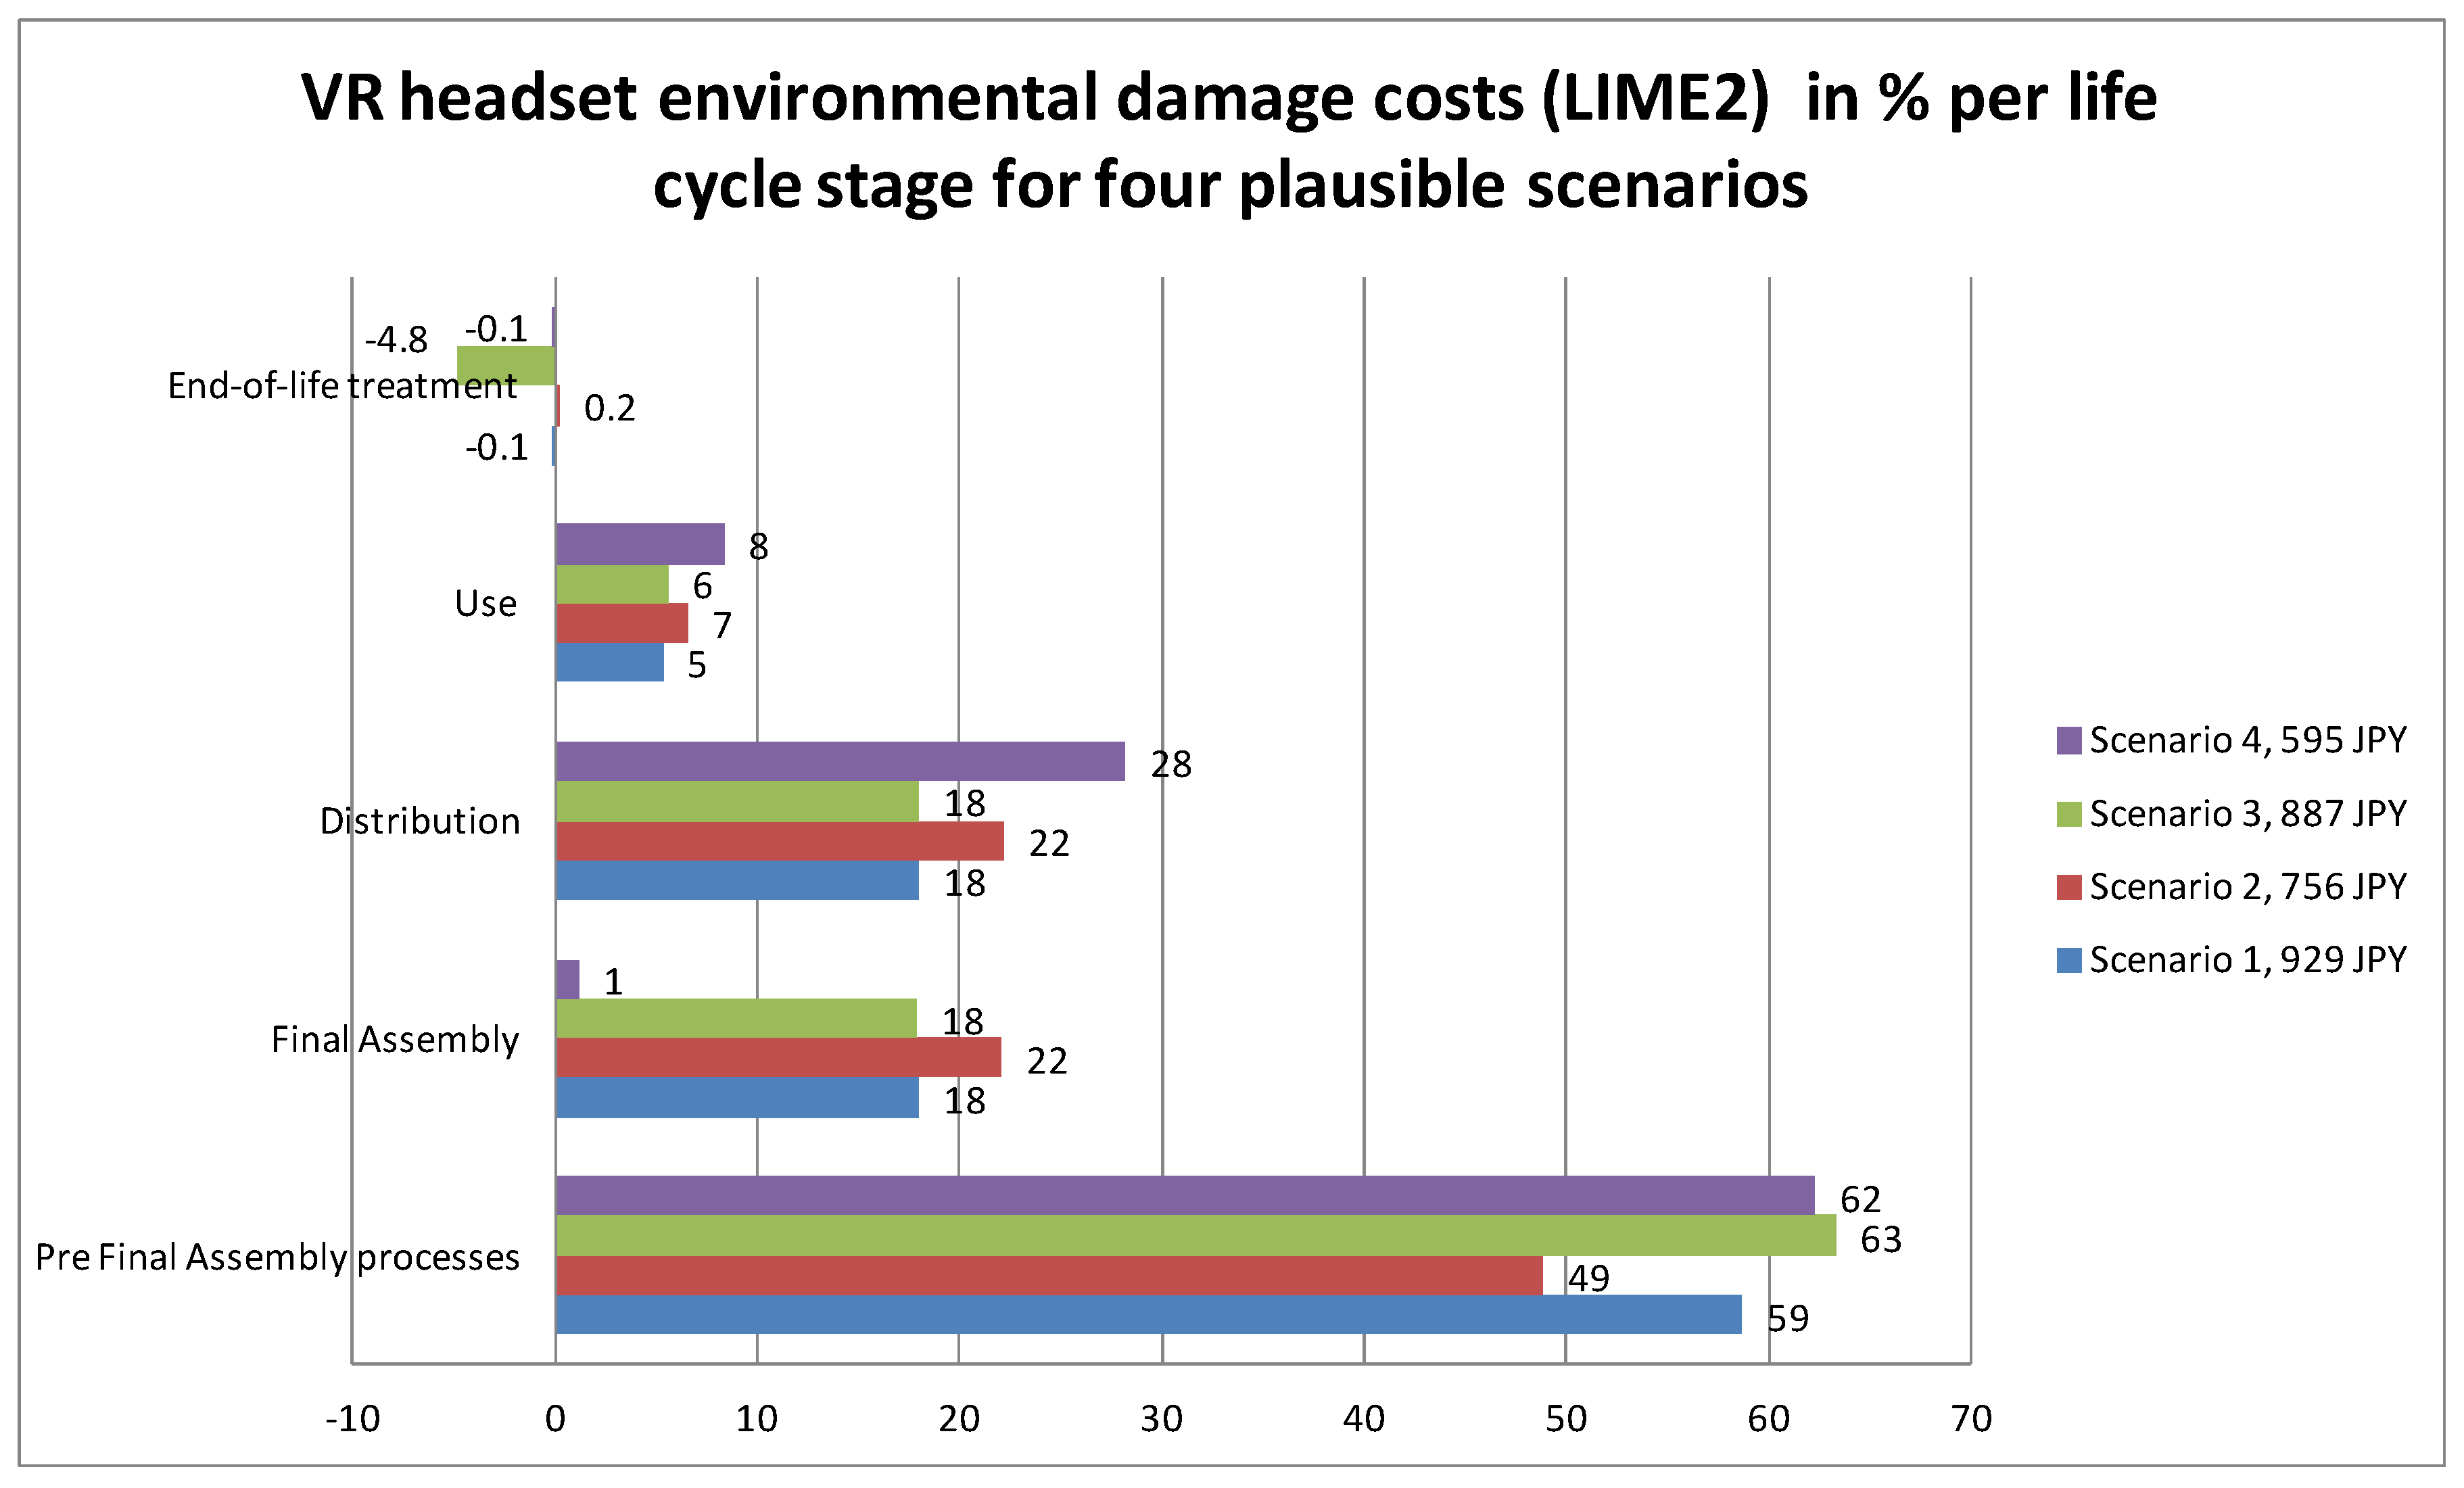
4.4. LIME2 Evaluations

LIME was developed in Japan between 1998 and 2003 [8,9]. LIME is a complete evaluation system for many LCI flows including mid-point categories (e.g., air pollution and resource consumption), damage categories (e.g., human health and biodiversity), normalization factors for each damage category, and weighting factors for each damage category based on conjoint analyses. The first edition (LIME1) laid the foundation of a damage-oriented life cycle impact assessment method for Japanese industry. LIME1 was updated to LIME2 in 2012 [11]. LIME2 uses weighting factors for four different areas of protection (human health, social assets, primary productivity and biodiversity) that reflect environmental awareness among the Japanese public [11]. Here, the weighting factors for G20 nations are used from Table 5 in Reference [11].
LCAs using LIME2 are often driven by human health costs that people want to avoid, such as those related to particulate matter. Therefore, it mostly emphasizes the benefits of LIEP and consequently S4 is 36% lower than S1 (Figure 5).
For S1 (Figure 4 and Figure 5), the electronics are 44%, ICs are 28% (9% primary gold production, 19% WP and IC), and primary gold production is 12% of the total LIME2 score. Here, the share of WP and IC is relatively large as LIME2 puts a larger emphasis on electric power production than e.g., EPS2015.
Unlike the ILCD and EPS2015 evaluations, the total scores for S1–S3 are more alike than S4.
VR headsets show a somewhat different pattern for emissions and energy footprints than e.g., smartphones, in which the manufacturing of electronic parts (using gold) usually dominates more at the expense of final assembly and distribution [6,7,15,16]. The present VR headset e.g., has no touchscreen, which makes it different from smartphones and tablets as seen from emission and energy footprints perspectives. A smartphone is necessary for the present VR headset to work. Moreover, smartphones and tablets have larger environmental damage costs per piece than VR headsets (Figure 6). Game consoles, which also could be used together with VR headsets, use around 32–500 kWh/piece/year [19]. This suggests that the system boundaries for VR headset LCAs should be set larger than in the present study, as the indirect environmental impacts are higher than for just one headset. One could argue that extended system boundaries for the studied product system would lead to different insights and conclusions.
The End-of-Life Treatment modeling is not particularly precise; however, reuse is still probably a measure which could avoid more life cycle impacts than material and energy recovery strategies. Theoretically, it would be more effective to actually use recycled metals in product design than to use ore metals and then recycle them. The issue of the actual benefits obtained by material recycling in LCA is still somewhat equivocal. However, hopefully the Product Environmental Footprint (PEF) Guidance [12,20] can streamline the process for LCA practitioners.
The alternate weighting methods in EPS2015 and LIME2 show the core of the challenge of sustainability evaluations. Clearly, several methods should be used to obtain a comprehensive understanding of the system at hand. The weighting methods (especially EPS2015) are moreover highly sensitive to the precision of the material content of sub-parts and matching of the LCI flows with the weighting indices in the LCA tools.
For most devices, a new LCA is necessary for each market condition. Here just one market condition is investigated with four different scenarios. The VR headset, however, demonstrates totally different emission footprints, and thereby LCA scores, depending on the production place and the final market in which it is used. The number of combinations and scenarios for the production and use of VR devices are huge, but optimum conditions might be found. Despite the weighing of environmental impacts, a universal eco-design strategy occasionally cannot be derived for specific products due to the large number of possible scenarios.
Moreover, the absolute uncertainty ranges of end-point weighed scores are likely very large. Based on the appendices of EPS2015 [10], the uncertainty for the environmental cost (0.13 Environmental Load Unit (ELU) ≈ Euro) of emitting 1 kg CO2 to air could be around 169% (coefficient of variance), i.e., −0.255 to 0.6 ELU/kg CO2 in a 95% confidence interval, (mean value = 0.13 ELU/kg CO2; standard deviation = 0.219 ELU/kg CO2). The probability density function for this interval is shown graphically in Figure 7.
CO2 is just one of many inventory flows contributing to the total score in LCAs of VR headsets; gold resources is another. Still, end-point weighed scores give more interesting indications of directions for eco-design than would just one mid-point indicator such as “Minerals and fossil resource depletion.”

5. Conclusions

The distribution of the final product to customers is relatively more important for VR headsets than for smartphones and tablets. The IC wafer processing and final IC assembly do not, as hypothesized, generally dominate the environmental impact of the present VR headset product system. In spite of this, the ICs are still significant due to their content of gold. The conclusion based on ILCD and EPS2015 is that sourcing gold from secondary sources, and ensuring that it is used in the product, is in theory the most effective measure to reduce the environmental damage costs associated with VR headsets. As found by LIME2, using low environmental impact electric power in the final assembly, IC wafer processing, and final IC assembly is also worthwhile.

6. Next Steps

The challenges of developing product category rules for consumer electronics are worth analyzing in today’s globalized market. Another avenue is the exploration of “smart” ICT, to which VR headsets could belong occasionally, by developing new EPS2015 environmental cost indicators including positive externalities. An extensive uncertainty analysis of the EPS2015 and LIME2 scores would also be worthwhile.

Acknowledgments

Huawei Device was used for product discussions. Anonymous reviewers are greatly appreciated for comments, which improved this paper.

Conflicts of Interest

The author declares no conflict of interest. Any views expressed in this paper are the authors own and not those of the company.

References

  1. Andrae, A.S.G.; Edler, T. On electricity usage of communication technology: Trends to 2030. Challenges 2015, 6, 117–157. [Google Scholar] [CrossRef]
  2. World Input-Output Database. World Input-Output Tables for 2014. Available online: http://www.wiod.org/protected3/data16/wiot_ROW/WIOT2014_Nov16_ROW.xlsb (accessed on 17 May 2017).
  3. Wood, R.; Stadler, K.; Bulavskaya, T.; Lutter, S.; Giljum, S.; de Koning, A.; Kuenen, J.; Schütz, H.; Acosta-Fernández, J.; Usubiaga, A.; et al. Global sustainability accounting—Developing EXIOBASE for multi-regional footprint analysis. Sustainability 2014, 7, 138–163. [Google Scholar] [CrossRef]
  4. Pascual-González, J.; Guillén-Gosálbez, G.; Mateo-Sanz, J.M.; Jiménez-Esteller, L. Statistical analysis of global environmental impact patterns using a world multi-regional input-output database. J. Clean. Prod. 2015, 90, 360–369. [Google Scholar] [CrossRef]
  5. Subramanian, K.; Yung, W.K.C. Review of life cycle assessment on consumer electronic products: Developments and the way ahead. Crit. Rev. Environ. Sci. Technol. 2016, 46, 1441–1497. [Google Scholar] [CrossRef]
  6. Andrae, A.S.G.; Andersen, O. Life cycle assessments of consumer electronics—Are they consistent? Int. J. Life Cycle Assess. 2010, 15, 827–836. [Google Scholar] [CrossRef]
  7. Andrae, A.S.G. A review of methodological approaches for life cycle assessment (LCA) of consumer electronics. IEEE Consum. Electron. Mag. 2016, 5, 51–60. [Google Scholar] [CrossRef]
  8. Itsubo, N.; Inaba, A. A new LCIA method: LIME has been completed. Int. J. Life Cycle Assess. 2003, 8, 305. [Google Scholar] [CrossRef]
  9. Itsubo, N.; Sakagami, M.; Washida, T.; Kokubu, K.; Inaba, A. Weighting across safeguard subjects for LCIA through the application of conjoint analysis. Int. J. Life Cycle Assess. 2004, 9, 196–205. [Google Scholar] [CrossRef]
  10. Steen, B. Calculation of monetary values of environmental impacts from emissions and resource use—The case of using the EPS 2015d impact assessment method. J. Sustain. Dev. 2016, 9, 15–33. [Google Scholar] [CrossRef]
  11. Itsubo, N.; Murakami, K.; Kuriyama, K.; Yoshida, K.; Tokimatsu, K.; Inaba, A. Development of weighting factors for G20 countries—Explore the difference in environmental awareness between developed and emerging countries. Int. J. Life Cycle Assess. 2015. Available online: https://link.springer.com/content/pdf/10.1007%2Fs11367-015-0881-z.pdf (accessed on 17 May 2017). [CrossRef]
  12. European Commission. Product Environmental Footprint Pilot Guidance—Guidance for the Development of Product Environmental Footprint Category Rules (PEFCRs). Available online: http://ec.europa.eu/environment/eussd/smgp/pdf/Guidance_products.pdf (accessed on 23 May 2017).
  13. Taheri, S.M.; Matsushita, K.; Sasaki, M. Virtual reality driving simulation for measuring driver behavior and characteristics. J. Transport. Technol. 2017, 7, 123–132. [Google Scholar] [CrossRef]
  14. European Commission-Joint Research Centre. Recommendations Based on Existing Environmental Impact Assessment Models and Factors for Life Cycle Assessment in European Context. Available online: eplca.jrc.ec.europa.eu/uploads/ILCD-Recommendation-of-methods-for-LCIA-def.pdf (accessed on 17 May 2017).
  15. Andrae, A.S.G.; Vaija, M.S. To which degree does sector specific standardization make life cycle assessments comparable?—The case of global warming potential of smartphones. Challenges 2014, 5, 409–429. [Google Scholar] [CrossRef]
  16. Andrae, A.S.G.; Vaija, M.S. Life cycle assessments of an optical network terminal and a tablet: Experiences of the product environmental footprint methodology. In Advances in Environmental Research; Daniels, J.A., Ed.; Nova Science Publishers: Hauppauge, NY, USA, 2017; Volume 55, pp. 31–46. [Google Scholar]
  17. Steen, B. A systematic approach to environmental priority strategies in product development (EPS). In Version 2000—General System Characteristics Report 1999:4; Swedish Life Cycle Center: Gothenburg, Sweden, 1999; Available online: http://lifecyclecenter.se/publications/ (accessed on 4 July 2017).
  18. Steen, B. A systematic approach to environmental priority strategies in product development (EPS). In Version 2000—Models and Data of the Default Method Report 1999:5; Swedish Life Cycle Center: Gothenburg, Sweden, 1999; Available online: http://lifecyclecenter.se/publications/ (accessed on 4 July 2017).
  19. Webb, A.; Mayers, K.; France, C.; Koomey, J. Estimating the energy use of high definition games consoles. Energy Policy 2013, 61, 1412–1421. [Google Scholar] [CrossRef]
  20. Allacker, K.; Mathieux, F.; Pennington, D.; Pant, R. The search for an appropriate end-of-life formula for the purpose of the European Commission Environmental Footprint initiative. Int. J. Life Cycle Assess. 2017. [Google Scholar] [CrossRef]
Figure 1. International Reference Life Cycle Data System (ILCD) normalization and weighting factors used.
Challenges 08 00015 g001
Figure 2. Screening Life Cycle Assessment (LCA) results (ILCD) for the VR headset for Scenarios 1–4.
Challenges 08 00015 g002
Figure 3. Screening LCA results (EPS2015) for the VR headset for Scenarios 1–4.
Challenges 08 00015 g003
Figure 4. Screening LCA results (LIME2) for the VR headset for Scenarios 1–4.
Challenges 08 00015 g004
Figure 5. Relative screening LCA results for the VR headset for Scenarios 1–4 for ILCD, EPS2015, and LIME2.
Challenges 08 00015 g005
Figure 6. Relative screening LCA results for the VR headset for Scenario 1 for ILCD, EPS2015, and LIME2.
Challenges 08 00015 g006
Figure 7. Probability density function in EPS2015 for the environmental damage cost of emitting 1 kg CO2 in air.
Challenges 08 00015 g007
Table 1. Scenarios for the Virtual Reality (VR) headset lifecycle.
Scenario 1—BaselineScenario 2Scenario 3Scenario 4
Only use ore mining of metalsOnly use secondary metals (Au, Ag, Cu)Ore mining of metalsOre mining of metals
High Impact Electric Power (HIEP) for wafer processing (WP), Integrated Circuit (IC) assembly and Printed Circuit Board (PCB) assembly (WP and IC and PCB)HIEP for WP and IC and PCBHIEP for WP and IC and PCBLow Impact Electric Power (LIEP) for WP and IC and PCB
HIEP for final assembly (FA)HIEP for FAHIEP for FALIEP for FA
Airplane distributionAirplane distributionAirplane distributionAirplane distribution
European average impact electric power (EAIEP) for UseEAIEP for UseEAIEP for UseEAIEP for Use
No reuseNo reuse5% reuse of entire productNo reuse

