Article

Hybrid Life Cycle Assessment of Low, Mid and High-Rise Multi-Family Dwellings

1
New York State Pollution Prevention Institute, Rochester Institute of Technology, 111 Lomb Memorial Drive, Rochester, NY 14623, USA
2
Golisano Institute for Sustainability, Rochester Institute of Technology, 111 Lomb Memorial Drive, Sustainability Hall, Rochester, NY 14623, USA
*
Author to whom correspondence should be addressed.
Challenges 2015, 6(1), 98-116; https://doi.org/10.3390/challe6010098
Submission received: 4 January 2015 / Revised: 22 April 2015 / Accepted: 22 April 2015 / Published: 30 April 2015

Abstract

:
We undertake Life Cycle Assessment (LCA) of the cumulative energy demand (CED) and global warming potential (GWP) for a portfolio of 10 multi-family residences in the U.S. We argue that prior LCA studies of buildings use an inconsistent boundary for processes to be included in the supply chain: The operational phase includes all energy use in a building, but supply chains for the production of appliances, equipment and consumables associated with activities done in the building are neglected. We correct this by starting the analysis with an explicit definition of a functional unit, providing climate controlled space, and including processes associated with this functional unit. Using a hybrid LCA approach, the CED for low, mid and high-rise multi-family residences is found to increase from 30, 34, to 39 GJ/m2, respectively. This increase is due to the need for energy-intensive structural materials such as concrete and steel in taller buildings. With our approach, the share of materials and construction of total life cycle energy doubles to 26%, compared with a 13% share that would be obtained with inconsistent system boundaries used in prior studies. We thus argue that explicit definition of functional unit leads to an increase in the contribution of supply chains to building energy life cycles.

1. Introduction

The environmental impacts of urban structure have been a focus of research for many years. In 2007, the United Nations reported that cities were responsible for 75% of global energy consumption and 80% of all greenhouse gases (GHG). In 2013, however, the United Nations Environmental Program reported that buildings alone were responsible for about 40% of global energy and resource consumption, and approximately 33% of global GHG emissions [1,2]. Because buildings are a fundamental aspect of urban structure, it is important to understand their associated environmental impacts so that building design and use decisions can be made or incentivized in order to minimize these impacts.
Life cycle assessment (LCA) has become a common tool to examine the environmental impacts of industrial systems, including buildings. LCA is a “cradle to grave” approach that assesses the environmental impacts, such as the total energy consumed or GHG emissions produced, through its entire life cycle, or, as a result of raw material extraction, through the end-of-life of an industrial product or system. Life cycle assessment provides a picture of the environmental trade-offs often made in product or process selection and can help avoid shifting problems from one life cycle phase to another [3].
In the context of building LCA, the environmental impacts associated with the following life cycle phases are typically assessed: materials extraction and production (materials), building construction, building operation, and sometimes, renovation and deconstruction/disposal. One common finding from prior building LCA studies is the relative impacts from each of the life cycle phases: The operation phase consistently dominates the share of the total life cycle energy in conventional buildings, ranging from about 80%–95%, followed by materials production, ranging from about 5%–20% [4,5,6,7,8,9]. However, for highly efficient or passive buildings, the materials production phase ranges from 25%–77% of the total [6,10,11]. The significance of the materials production phase in total life cycle energy remains an area of focus [12,13].
LCA has often been used to compare the environmental impacts of buildings similar in function but varying in attributes such as construction materials or energy efficiency. Cole and Kernan [5] conduct an LCA comparing the total life cycle energy of three office buildings of similar size but varying in commonly used framing materials (wood, steel, concrete). They find that for all framing materials, the operation life cycle phase dominates the total life cycle energy and suggest that building designs should focus on strategies that reduce operation energy [5]. Adalberth [4] completes an LCA comparing the total life cycle energy of three single-family, detached wood-framed residences and find that the residence with a second floor consumed the least amount of operation life cycle energy due to lower transmission losses. Keoleian et al. [6] compare the total life cycle energy, GHG emissions and total life cycle costs of two U.S. single-family residences; one ‘standard’ and one energy efficient. The authors find that while the energy efficient home resulted in an approximately 60% reduction in life cycle energy and emissions, consistent with other findings, life cycle economic costs can be higher due to the increased costs of energy efficient materials [6,14,15]. Gong et al. [16] compare the total life cycle energy and GHG emissions of three multi-family residences of similar size but varying in commonly used framing materials (wood, steel, concrete). The authors find that the wood-framed residence resulted in the lowest environmental impacts while the concrete and steel-framed residences resulted in higher, yet comparable environmental impacts over the total life cycle [16]. Frijia et al. [17] assess the life cycle of a portfolio of single-family residences, the result being the construction of a family of parametric models describing the results as a function of size and construction type. Stephan et al. [11] examine the total life cycle energy through parametric analysis varying different aspects of the same representative Belgian passive home. The authors find that the embodied energy of passive homes can be as high as 77% of the total life cycle energy and suggest that more comprehensive system boundaries are required for building energy efficiency certifications to ensure net energy savings occur over the life span of the building [11].
We aim for three contributions with this manuscript. First, we clarify how explicit choice of functional unit is critical in defining what processes should be included in the boundary of LCA analysis. There is previous work highlighting the system boundary and the need for a more comprehensive framework [18,19]. We contribute to this debate by integrating functional unit into boundary choice. The fundamental issue is that many prior studies do not explicitly define functional unit, leading to inconsistent system boundaries [4,5,6,7,16,20]. In these and other studies, the operation phase is chosen to include all building energy use, suggesting that the functional unit encompasses all energy-using activities in the building. However, the ensuing LCA analysis excludes supply chains associated with many household activities such as production of appliances and consumer electronics. While exclusion of processes is a normal part of LCA, our point is that the lack of explicit choice of functional unit led to excluded processes not being identified as such. Taking the operation energy as total building energy use but only including supply chains for materials and construction overstates the contribution of operation in the life cycle. In contrast, this study starts with an explicit definition of functional unit: space conditioning (heating and cooling). This leads to corresponding supply chains accounting for building materials, construction and HVAC equipment.
Second, we examine the total life cycle energy, or cumulative energy demand (CED), and global warming potential (GWP) for a portfolio of 10 low, mid and high-rise multi-family residences. Examination of a portfolio enables exploration of how the changing structural requirements of taller buildings, which require more energy intensive construction materials (concrete and steel vs. wood), affect life cycle energy. Treloar et al. [21] studied the embodied energy in different types of existing office buildings varying in height, finding increasing embodied material energy with increased height. We pose a similar question regarding building height, though for residential buildings, and, with a broader scope of included processes (construction, operation, HVAC equipment manufacturing).
Third, we explore how household income changes the gap in energy use between single and multi-family homes. Previous LCA work finds that high (urban) density housing uses around half the energy of low (suburban) density counterpart [22]. While energy use per area is found to be similar between high and low-density housing, the much smaller size of a typical high-density residence resulted in lower total energy use per capita. In the context of urban planning and form, there is general agreement that single-family, or low-density housing, uses much more energy than multi-family, or high-density housing [23,24,25,26]. This assertion is primarily a function of two factors. The first factor is housing size: Single-family detached homes are generally larger than multi-family homes. The second factor is the surface area/volume (S/V) ratio; a single-family home has a higher S/V ratio, transferring heat more readily and consequently, consuming more energy [24]. However, in some cases, single-family homes consume similar energy as multi-family, partly due to relatively rapid improvements in energy efficiency of single-family homes over the last three decades [23]. Moreover, Heinonen and Junnila [27] find a higher relative net energy consumption in multi-family homes than single-family when the system boundary is expanded to include the consumption of goods and services.
While on average single-family homes use much more energy than multi-family ones, home size is highly heterogeneous. This heterogeneity correlates with demographics, e.g., wealthier families tend to live in larger homes. The gap in home size, and thus energy use, between single and multi-family homes could change as a function of income and other demographics. We thus analyze the impact of income and housing type on total energy consumed, or CED, by examining six different income levels while bounding the total CED to expected minimum and maximum values. While prior work has examined relationships between demographics, house size and energy use, e.g. [25], our analysis will clarify how income affects the gap in energy use for single-family and multi-family homes. This is important because urban planning efforts aimed to transition families from single to multi-family homes should account for how energy benefits vary depending on who is moving.

2. Methods

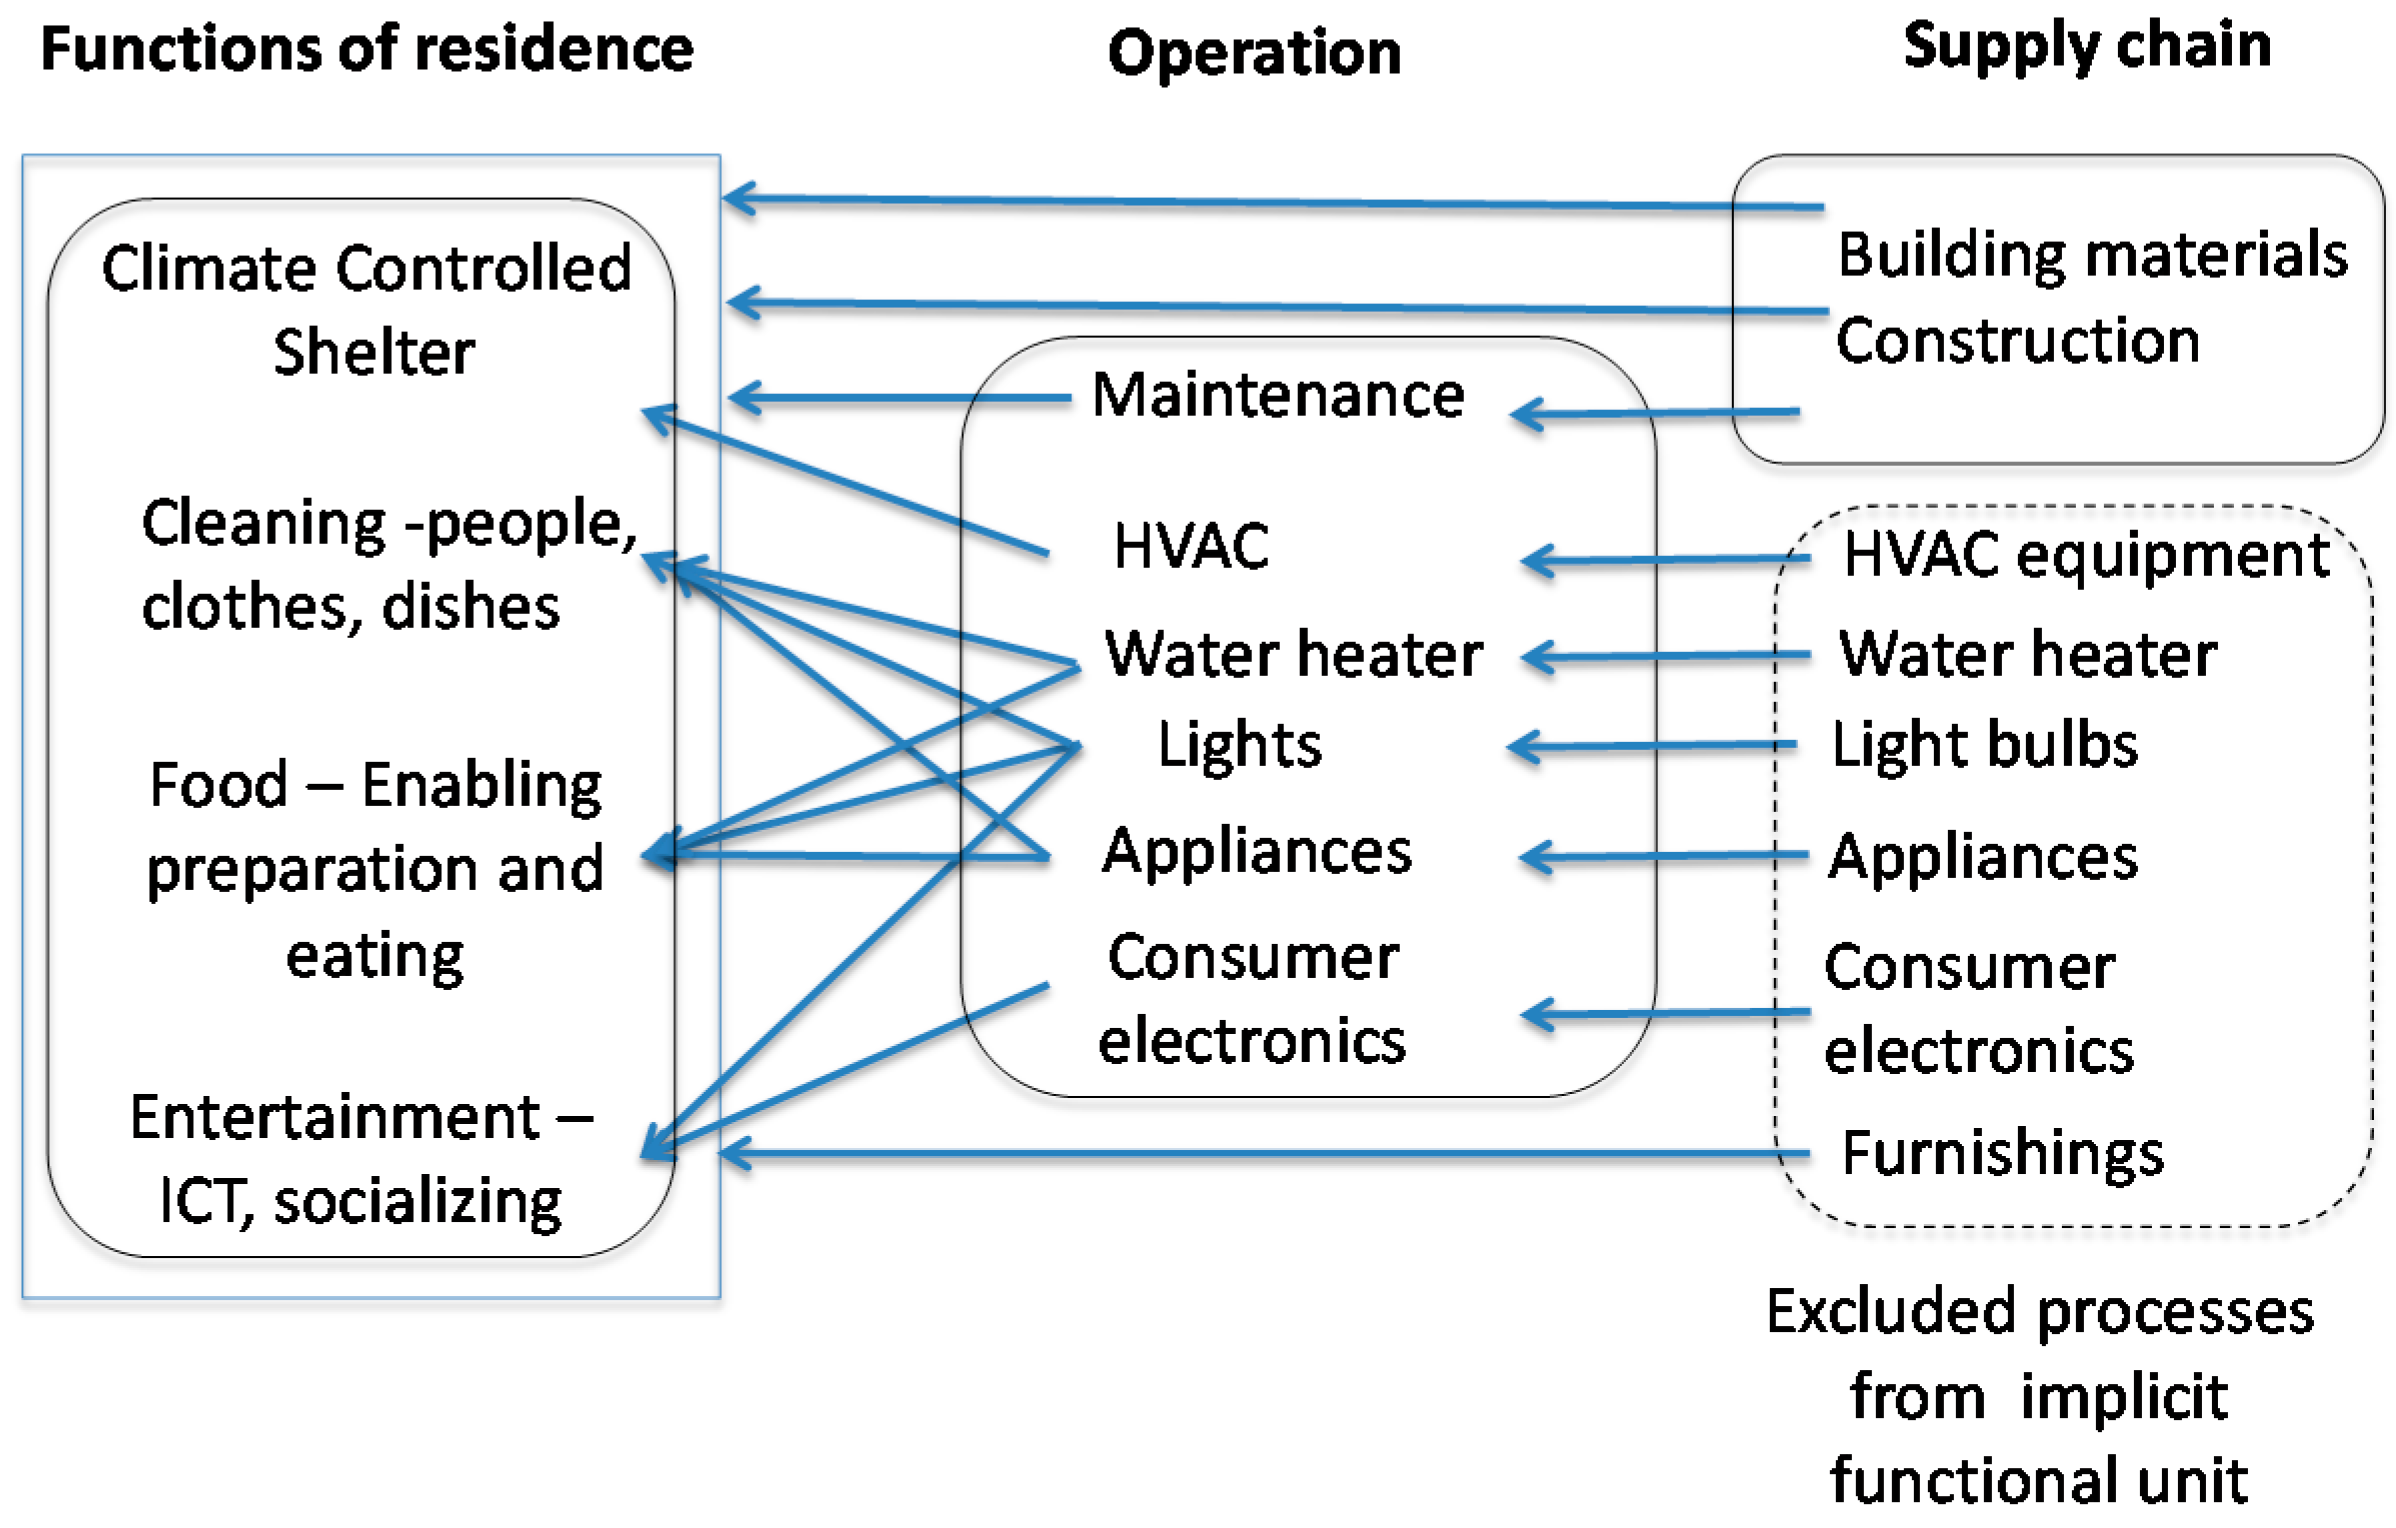
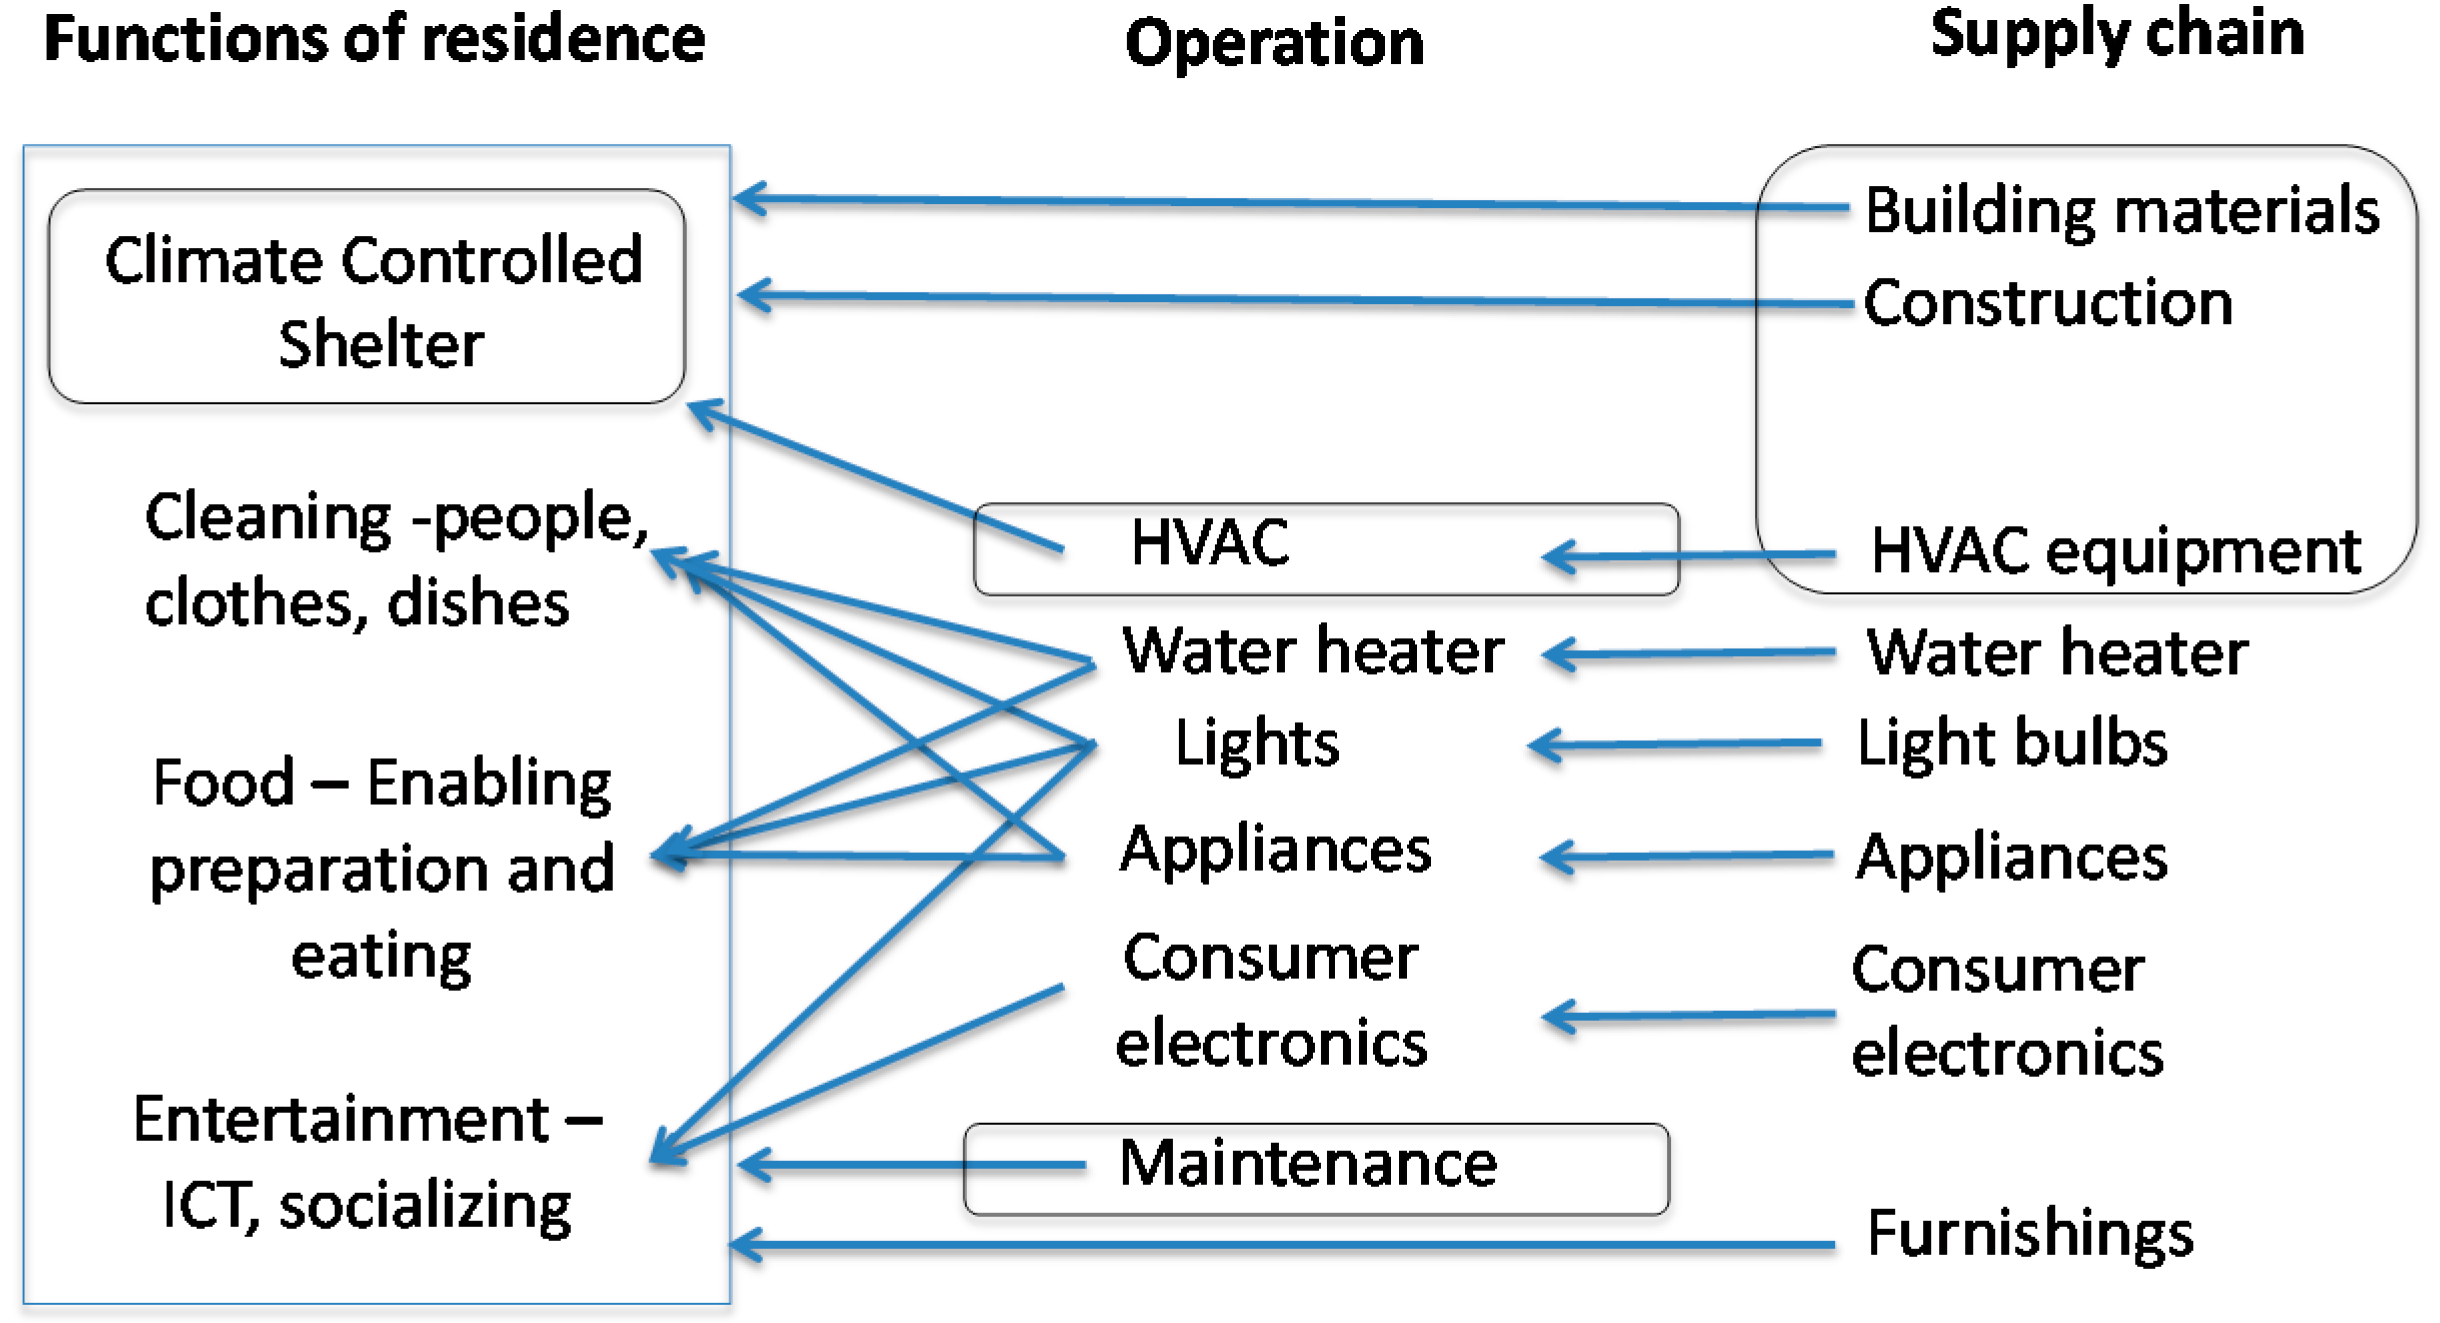
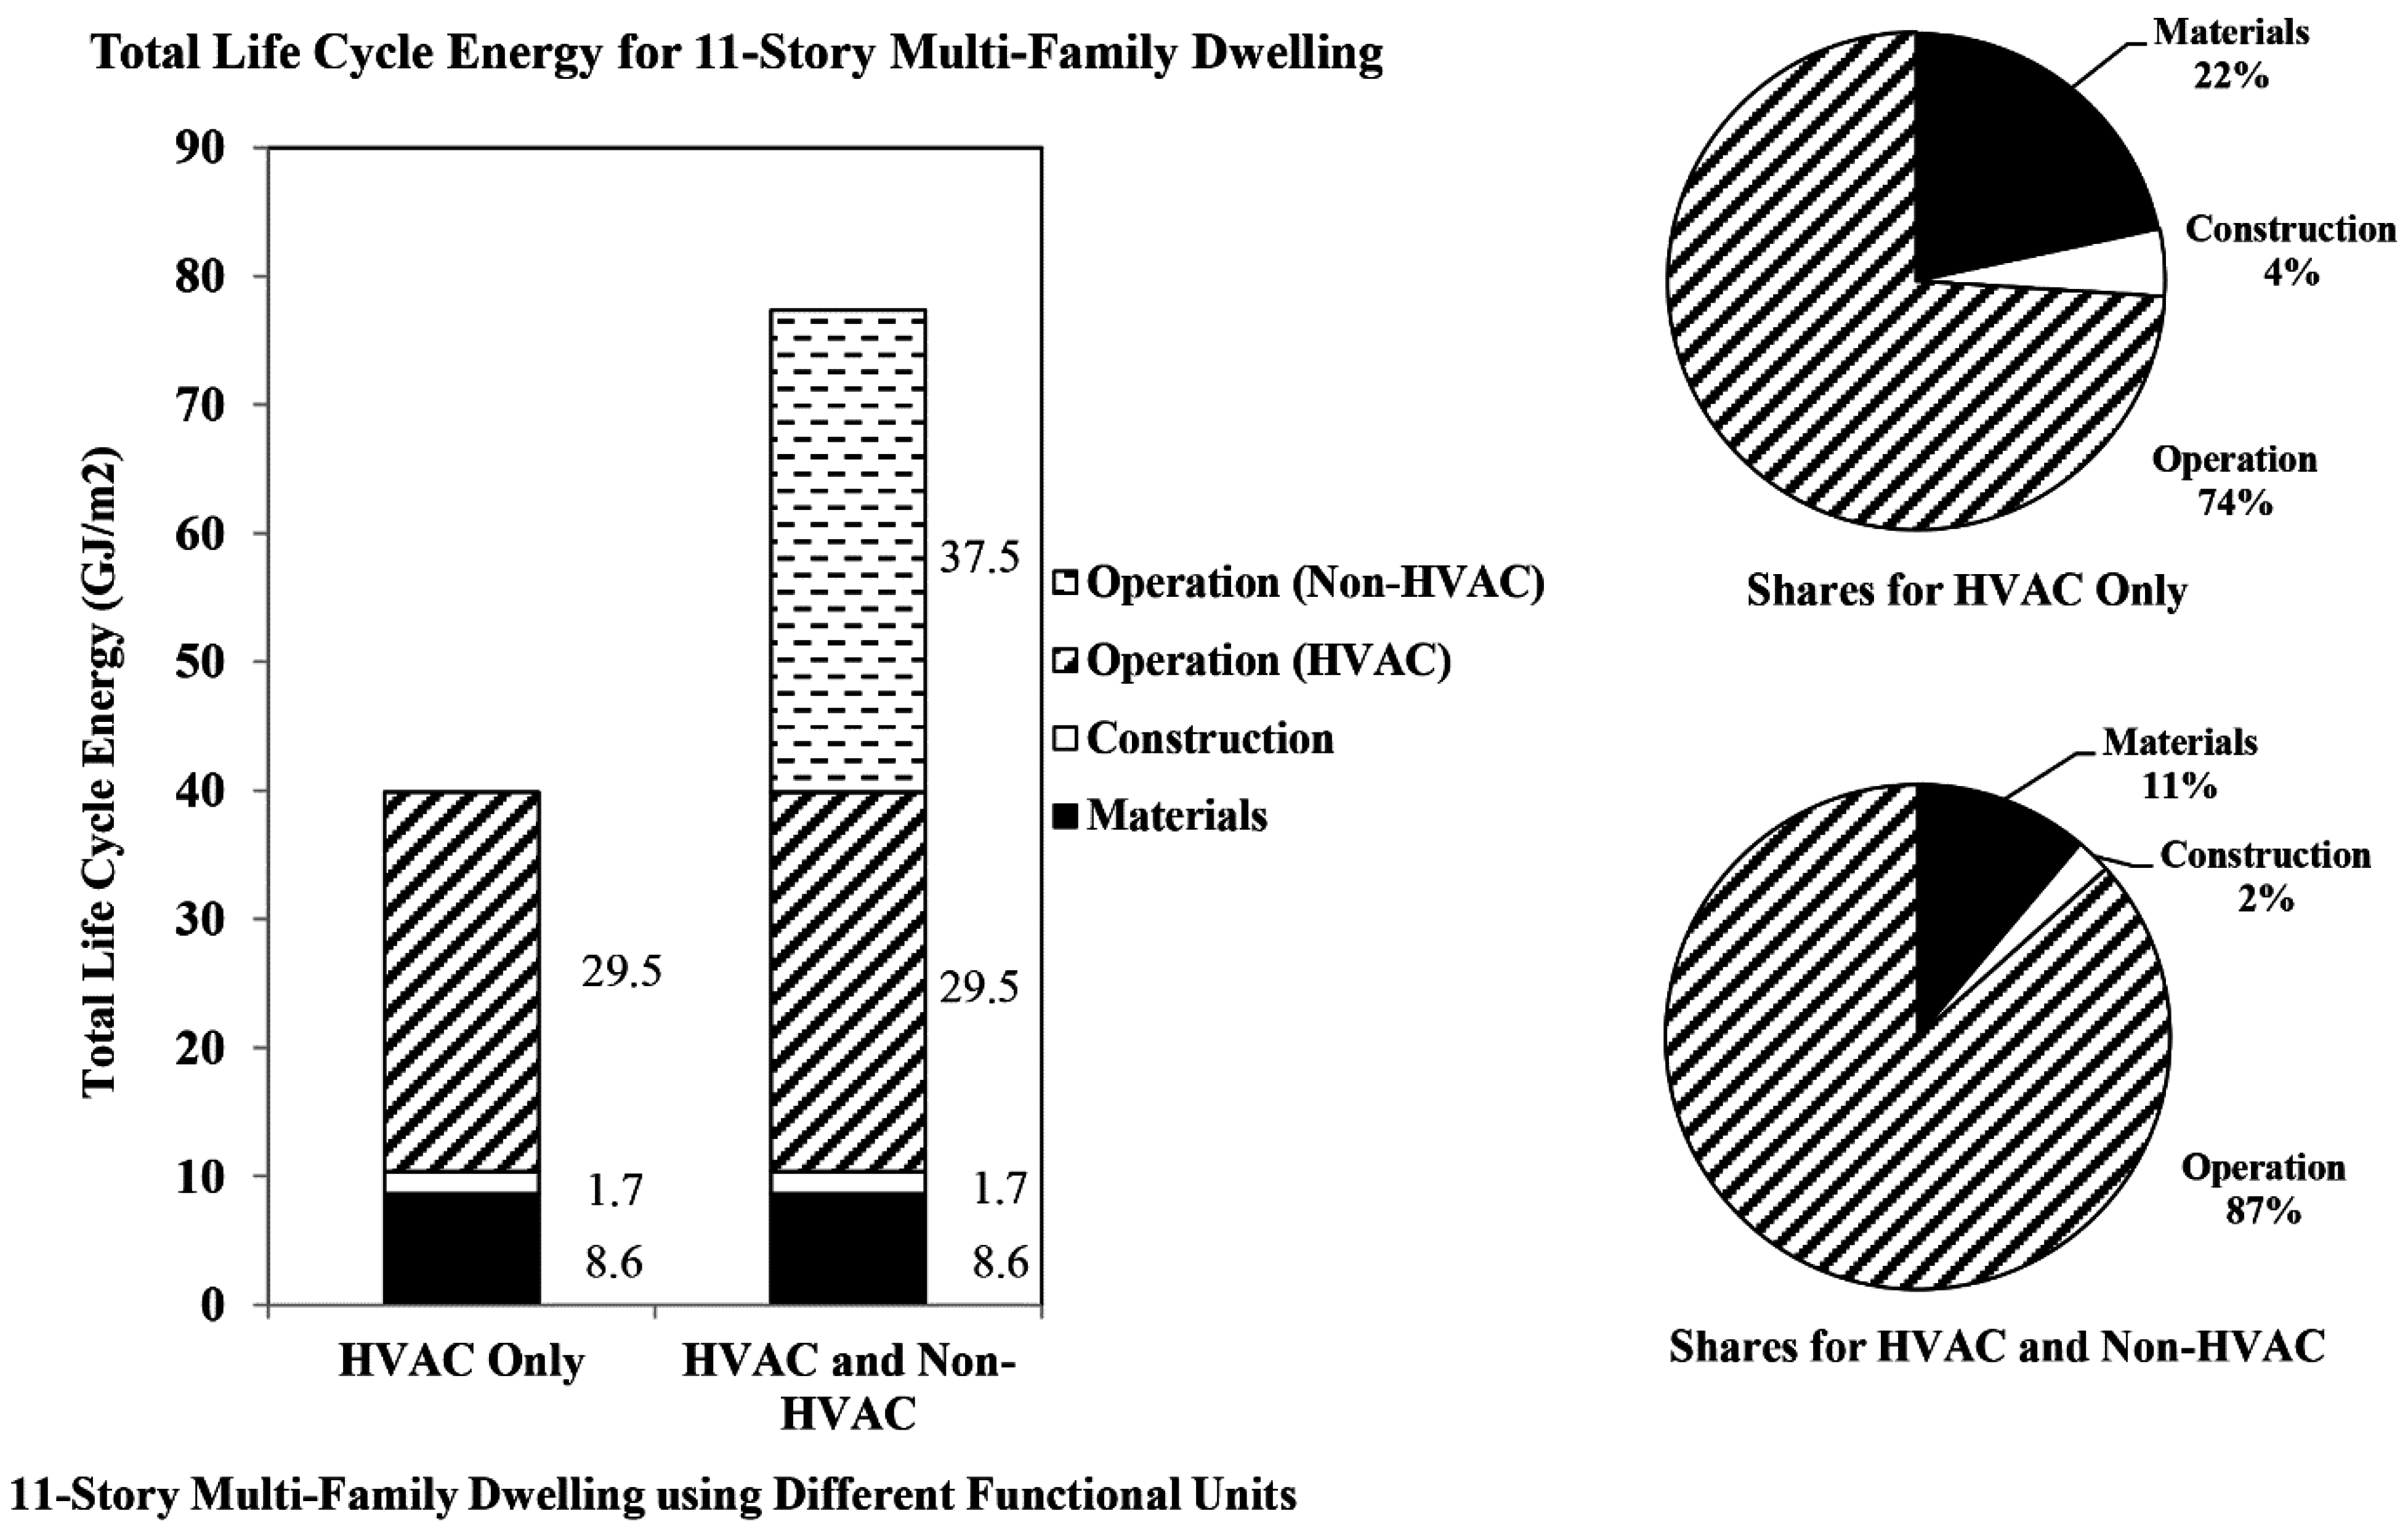
2.1. Functional Unit Choice and System Boundary

The definition of functional unit is fundamental in life cycle assessment. The functional unit is the unit of functionality associated with a product or service being studied [3]. To illustrate the idea, a functional unit to compare light bulb technologies could be defined as providing 10,000 h of 1800 lumens light. The reference flow is the associated product/service systems needed to deliver the functional unit, e.g., one 23-Watt compact fluorescent light bulb plus the electricity needed to power bulb. From the reference flow, one defines the supply chains to be included in the system boundary of the analysis (here production of bulbs and electricity).
The complication with buildings is their multi-functionality, with many different activities done inside them engaging a variety of other products. This multi-functionality has presumably been behind the functional unit not being explicitly defined in prior LCA building studies [4,5,6,7,16,20]. Not defining a functional unit has led to inconsistent system boundaries. To elaborate, Figure 1 outlines the logical flow of most prior energy LCA studies. The scope of the operational phase is chosen to include all energy used in a building. The implicit functional unit thus includes all activities undertaken in the building, which include preparing food, cleaning dishes and clothes, watching television and others. Supply chain processes included in the LCA typically cover structural materials and construction, sometimes including maintenance [18]. Many supply chain processes are excluded from the analysis such as manufacturing appliances, HVAC equipment, electronics, and consumable items. These missing processes are not identified as excluded processes. Core to LCA is the idea of clearly defining what supply chains relate to the functional unit, including as many processes as is feasible in the analysis, and clarifying what processes have been excluded. Not defining the functional unit in building LCAs has obscured the question of what processes have been excluded.
The solution to this problem is to start a building LCA with explicit definition of the functional unit to be considered. Figure 2 illustrates one example of this, beginning with the choice of functional unit as providing climate-controlled space. This leads to a reference flow of the building itself plus HVAC equipment. The boundary of the analysis is chosen to include operational energy for heating and cooling, materials and construction processes for the buildings, and manufacturing of HVAC equipment. There are still excluded processes (maintenance, demolition, landfill), but these are based on data availability. There are many other choices of functional unit that could include additional or different functions. Notably, Treloar and collaborators considered a functional unit of the lifestyle of residents, including building construction, operation, production of durable and consumable goods, services, and mobility [28]. In this larger lifestyle context, construction, maintenance and operation of the home accounted for 34% of total energy consumption of the occupants.
Figure 1. Typical inconsistent construction of system boundaries and implied functional unit for building energy Life cycle assessment (LCA). The operational energy is the total for the entire building, implying a functional unit that covers all activities done inside the building. Processes inside dashed box are excluded from analysis but not identified as excluded processes. Supply chains for consumables such as food could also be considered as excluded.
Challenges 06 00098 g001
Figure 2. Example of consistent choice of functional unit (Climate Controlled Shelter) and included processes in building Life cycle assessment (LCA). While maintenance is in the list of processes that should be included, in this case study maintenance is excluded due to lack of available data.
Challenges 06 00098 g002
This usual flow of a building LCA shown in Figure 1 leads to results that exaggerate the contribution of the operation phase the life cycle energy use and carbon emissions. The reason is that the operational phase includes all possible forms of energy use but many supply chains have been excluded. The procedure shown in Figure 2 will lead to an increase in the share of energy used in building manufacturing relative to operation.

2.2. Life Cycle Inventory

Three methods are generally used in practice to compile life cycle inventories: process-sum, economic input-output (EIO) and hybrid [29]. The most commonly used method is the bottom-up, process-sum approach that physically quantifies the energy and materials flows and the resulting environmental impacts for a product or system within the system boundary. The advantage of the process-sum approach is the potential to do a detailed analysis of a specific product or system. The challenges with using the process-sum approach include completeness, representativeness and accuracy of process and bill-of-materials data [29].
Alternatively, the top-down EIO approach is based on economic transactions between sectors of the economy [30]. In contrast to using physical quantities of energy and materials flows as in the process-sum approach, EIO uses financial transactions from sectoral input-output (IO) tables to estimate the supply chain materials use and associated environmental impacts [31,32]. The most detailed tables divide an economy into 400–500 sectors. As with the process-sum approach there are advantages and disadvantages to an EIO approach. Advantages of EIO include reduced time and resource requirements to complete an analysis compared to process-sum, and, as all supply chain activities are included as part of an EIO-LCA, truncation error is negligible. Since EIO-LCA includes activities such as services that a process-sum LCA generally does not, other factors kept equal, using EIO-LCA tends to increase net impacts accounted for due to the expanded boundary. However, EIO tables aggregate many processes or products into one sector, which can introduce significant aggregation error [29].
In order to capitalize on the strengths and minimize the weaknesses of each approach, a variety of hybrid LCA approaches have been proposed combining both methodologies [33,34]. The question how to achieve the most accurate combination of process-sum and EIOLCA methods is an open one [29].
We use a hybrid approach to compile life cycle inventories. We base our method choice on using best available data to address the questions posed. Our objective calls for bill-of-materials data for a variety for representative U.S. buildings of different heights and construction types. We found no source of physical requirements for a portfolio of buildings but did identify a well-known construction cost model that details bill-of-materials in economic terms [35]. The most detailed and standard source of residential building operational energy in the U.S. is the Residential Energy Consumption Energy Survey [36]. Given this data situation, we use EIO-LCA for the manufacturing of buildings and process-sum for operation.
Our hybrid approach follows in the family of additive approaches, in which some parts of the supply chain are analyzed using the process-sum method and others using EIO [17,34,37,38]. In particular, the method is based on the fundamental equation:
ETotal = Ematerials + Econstruction + Eoperation
ETotal, the total energy of the building life cycle, is normalized by area. Ematerials is determined using additive EIO-LCA using an economic bill of materials. Let j be an index denoting items for material price, then
Ematerials = (ΣPj·ESCj)/total area of residence
Pj is the price, ESCj is the energy intensity of the relevant supply chain sector in MJ/$ [39]. Econstruction is the construction energy determined by an economic allocation method according to the value of business done in the multi-family construction sector, and, the price and energy intensity of the fuel consumed during construction. Let j be an index denoting type of fuel, then
Econstruction = (BV·ΣPj·EFj)/total area of residence
BV is the business value of a multi-family residence, Pj is the price and EFj is the energy intensity of the relevant fuel per dollar. Eoperation is the operation energy determined by the process-sum method according to the total primary energy and intensity of each fuel consumed for space conditioning (heating and cooling) divided by the total area of the residences conditioned.
Eoperation = primary energy of fuels consumed/total area of residence
Consumption of fossil fuels and electricity is converted to Cumulative Energy Demand (CED) (gigajoules) and Global Warming Potential (kg CO2 equivalent) reported in [40], e.g., 3.36 GJ/kWh and 759 grams CO2eq/kWh for electricity. These factors reflect a process-sum life cycle model of average fuel production in the continental U.S. [40].

2.3. Exploring Effects of Income on Life Cycle Energy of Multi- and Single-Family Homes

On average, multi-family homes are smaller and use less energy than single family homes. The average square footage of a multi-family home (apartments in 5 or more unit buildings) in the U.S. is 78.9 m2 (849 ft2) [41], which corresponds to a total life cycle energy of around 2370–3160 GJ. The average square footage of a single-family detached home is 230.7 m2 (2483 ft2) [41], which when using results from [17] corresponds to a total life cycle energy of around 4620–5540 GJ. Similar to results found for [11,22,42], a single family home uses about double the energy per capita of a multi-family home, primarily due to the size difference.
As discussed in the introduction, home size, and thus energy use, varies considerably by family. Urban planning efforts to encourage people to move from single to multi-family homes in general do not target an average homeowner, but rather specific groups that may be different from the average. It is therefore important to find patterns in homeowner groups that correlate with variability in home size. Income is obviously one important factor, thus we analyze how the size of single and multi-family homes changes with income and then map this to life cycle energy use.
Average square footage by income level and housing type data (single-family detached and apartments in five or more unit buildings) comes from the Energy Information Administration [36]. Ranges of CED per area (GJ/m2) for multi-family housing are found by bounding the results of the current multi-family LCA (minimum and maximum values from all building types studied). Similarly, ranges for CED (GJ/m2) for single-family detached housing are established by bounding the life cycle materials and construction energy values from [17].

3. Analysis

3.1. Object of Analysis

Two impact categories are analyzed: cumulative energy demand (CED) (GJ/m2) and global warming potential (GWP) (CO2eq/m2), as defined in [43]. As previously discussed, the inventory flows for each life cycle within the system boundary are quantified as follows: the life cycle inventory of materials are quantified through an EIO-LCA approach, the construction life cycle flows are quantified through an economic allocation approach, and, the operation life cycle flows are quantified through a process-sum approach (Figure S1 in the supplementary documentation illustrates the system boundary diagram). The functional unit is the delivery of a controlled climate space to a multi-family residence for 50 years, consequently including energy and GWP contributions solely from heating and cooling during the operation life cycle phase. The reference flow includes 10 different multi-family residences and their associated heating ventilation and cooling (HVAC) systems. Table 1 details the parameters for the 10 multi-family residences which are used to generate representative bills of materials (BOMs) for the multi-family residences [35].
Table 1. Parameters used to develop ten multi-family dwelling bills of materials for the Economic Input-Output portion of the hybrid life cycle assessment (LCA).
Number of StoriesRiseSquare FeetSquare MetersExterior WallFramePerimeter (meters)
3Low30,5002837Wood sidingWood Frame56
3Low30,5002837Stucco on Concrete BlockWood Joists56
4Mid65,0006045Precast Concrete PanelsSteel Frame74
4Mid65,0006045Precast Concrete PanelsReinforced Concrete Frame74
7Mid60,0005580Precast Concrete PanelsSteel Frame47
7Mid60,0005580Precast Concrete PanelsReinforced Concrete Frame47
11High80,7507510Ribbed Precast ConcreteSteel Frame37
11High80,7507510Ribbed Precast ConcreteReinforced Concrete Frame37
21High216,50020,135Ribbed Precast ConcreteSteel Frame51
21High216,50020,135Ribbed Precast ConcreteReinforced Concrete Frame51

3.2. Materials Contribution: Economic Input-Output Life Cycle Assessment (LCA)

The EIO approach is economic-based, using the environmental impact intensities of the associated U.S. economic sectors used in the production of a product or process. For this study, energy and GWP intensities for U.S. economic sectors are obtained from the Carnegie Mellon University Green Design Institute (CMU GDI) input-output model [39]. This publicly available model includes the 2002 input-output tables that contain 428 U.S. industry sectors based on the North American Industry Classification System (NAICS) [39,44]. In conjunction with environmental impact intensities, the EIO approach often uses producer prices (PP) to determine environmental impacts. Producer prices can be thought of as the price “at the gate” of a producer, thus differing from consumer price by prices of transport, wholesale and retail distribution. Typically, prices for each line item on a bill of materials are provided in terms of an end user’s purchasing price, including prices associated with overhead and profit (O&P). In order to appropriately reflect producer price, material line item prices are adjusted using producer/purchaser ratios (PPR) that are part of the input-output model [45]. In addition, producer price indices (PPI) are used to adjust material line item prices to reflect the desired time frame of the study [46]. Let j be an index denoting items with material price from a BOM of a multi-family dwelling, then
PPj = (Pj)·(PPRj) (PPI2002j/PPI2010j)
PPj is the producer price, Pj is the extended material price in USD (O&P removed), PPRj is the producer/purchaser ratio for the relevant economic sector, and, PPI2002j/PPI2010j is the producer price index ratio associated with the economic sector in 2002 and 2010. Tables S1 and S2 in the supplementary documentation contain a sample BOM used in this study, as well as the PPI, PPR CED and GWP intensity values for the economic sectors used in this study. Table 2 demonstrates how a line item from a BOM connects to its associated economic sector, PPR, PPI and CED intensity.
Table 2. Example of how a bill of material line item connects to an economic sector and the total contribution of a line item to life cycle CED during the materials life cycle phase.
Line #Line Item Description aExtended Material Price a ($)EIO Sector dPPR b × PPI cCED Intensity d (MJ/$)CED (MJ)
8Structural concrete, ready mix, normal weight, 3000 psi, includes local aggregate, sand, Portland cement and water, delivered, excludes all additives and treatments510237320 Ready mix concrete manufacturing0.4923.55882
EIO: Economic input-output; PPR: Producer/purchaser ratio; PPI: Producer price index; CED: Cumulative energy demand; MJ: Megajoules; $: Dollar; All values detailed in Tables S1 and S2 in the supplementary documentation. a Source [35]; b Source: [45]; c Source: [46]; d Source: [39].
Contributions to CED/GWP from each material line item, denoted by the index j, is calculated using the following equations:
CEDj = (PPj)(ESCj)
GWPj = (PPj)(GWPSCj)
CEDj and GWPj are the materials life cycle energy and GWP, respectively, PCj is the producer price calculated previously in Equation (5), and, ESCj and GWPSCj are the energy and GWP intensities of the relevant supply chain sector, respectively. Table 2 contains the contribution to CED for a line item of a bill of material used in this study (5882 Megajoules).
Finally, the contributions to CED and GWP as a result of the materials life cycle phase is calculated by summing the CED/GWP for individual line items and then normalizing by area:
E m a t e r i a l s = n = 1 n C E D j / t o t a l   a r e a   o f   m u l t i f a m i l y   r e s i d e n c e
G W P m a t e r i a l s = n = 1 n G W P j / t o t a l   a r e a   o f   m u l t i f a m i l y   r e s i d e n c e
Ematerials and GWPmaterials are the life cycle energy and GWP for the materials life cycle, respectively, and CEDj and GWPj are the materials life cycle energy and GWP calculated previously using Equations (6) and (7), respectively. Data and calculations for each building is detailed in the Microsoft Excel file posted online as part of the supplementary documentation for this article.

3.3. Construction: Economic Allocation Approach

The economic allocation approach is used to quantify the input and output flows contributed by the construction life cycle phase, or, those flows that occur as a result of the erection of the multi-family residence such as fuels consumed during transportation, electricity production and equipment use. The contributions to CED and GWP during the construction life cycle phase are based on the value of business done and energy purchases made in 2002 by the associated NAICS sector, 236116, New Multifamily Housing Construction [47]. This approach is taken in order to focus on one type of construction process, multi-family residences, to mitigate aggregation error. According to the 2002 Economic Census, the New Multifamily Housing Construction sector reported a business value of $17 billion and spent $1.2 million in energy purchases [47]. As a result, 20 PJ of energy were consumed in 2002, which is equivalent to 1.2 × 10⁻³ GJ of primary energy consumed and 7.8 × 10⁻⁵ tCO2eq emissions produced per dollar of business done. Table S3 in the supplementary documentation details the energy and GWP values used in the calculations.
The business value (BV) of a multi-family residence is calculated using the total extended material, labor and equipment prices from the multi-family BOM (see Table S1 in the supplementary documentation for a sample), plus O&P adjusted to reflect 2002 values. According to industry standards, the O&P for material, labor and equipment are 10%, 68%, and 10%, respectively [35]. Further, the PPI was obtained using historical construction price indexes [35]. The following equation is therefore used to calculate the BV for a multi-family residence:
BV = (1.1·MCtotal + 1.68·LCtotal + 1.1·ECtotal) (0.7)
BV is the business value of a multi-family residence, MCtotal is the total extended material price, LCtotal is the total extended labor price, ECtotal is the total extended equipment price from a multi-family BOM, and 0.7 is the historical price index for construction between 2002 and 2010 [35]. Therefore, the contributions to CED and GWP as a result of the construction life cycle phase are calculated using the BV per multi-family residence (10) and the energy and GWP intensities per dollar spent calculated previously, and then normalized by area, or:
Econstruction = (1.2 × 10⁻³)BV/total area of multi-family residence
GWPconstruction = (7.8 × 10⁻⁵)BV/total area of multi-family residence
Econstruction and GWPconstruction are the energy and GWP for the construction life cycle phase, respectively.

3.4. Operation: Process Approach

This study quantifies the primary input and output flows, or inventory, contributed by the heating and cooling processes during the operation life cycle phase. The life cycle inventory (LCI) for the operation life cycle phase is obtained from microdata from the 2009 Residential Energy Consumption Survey (RECS) conducted by the U.S. Energy Information Administration [36]. The microdata is grouped into multi-family dwelling rise (low, mid and high, Table 1) based on the number of floors in an apartment building with five or more units [48]. An apartment/multi-family residential building with one to three floors is considered low-rise, with four to seven floors is considered mid-rise, and, with more than seven floors is considered high-rise. The primary consumption of electricity, natural gas and fuel oil for the purpose of space conditioning (heating and cooling) as well as for all activities, is examined. These fuels represent approximately 99% of the share of energy consumed in these particular apartment buildings [48]. Tables S4 and S5 in the supplementary documentation contain details of the LCI for this phase. The contribution to CED as a result of the operation life cycle phase (50 years) for low-, mid- and high-rise multi-family residences is 25, 26.5 and 29.5 GJ/m2, respectively. Similarly, the contribution to GWP as a result of the operation life cycle phase (50 years) for low-, mid- and high-rise multi-family residences is 1.45, 1.60, and 1.70 tCO2eq/m2, respectively.
Finally, the contributions to CED and GWP from each life cycle phase are added together. For example, the total life cycle energy, or CED, for a low-rise multi-family dwelling is determined by following Equation (1):
ETotal(low-rise) = Ematerials(low-rise) (8) + Econstruction(low-rise) (11) + Eoperation (25GJ/m2)
Similarly, the total life cycle GWP for a low-rise multi-family dwelling is determined using the following equation:
GWPTotal(low-rise) = GWPmaterials(low-rise) (9) + GWPconstruction(low-rise) (12) + GWPoperation (1.25tCO2eq/m2)

4. Results

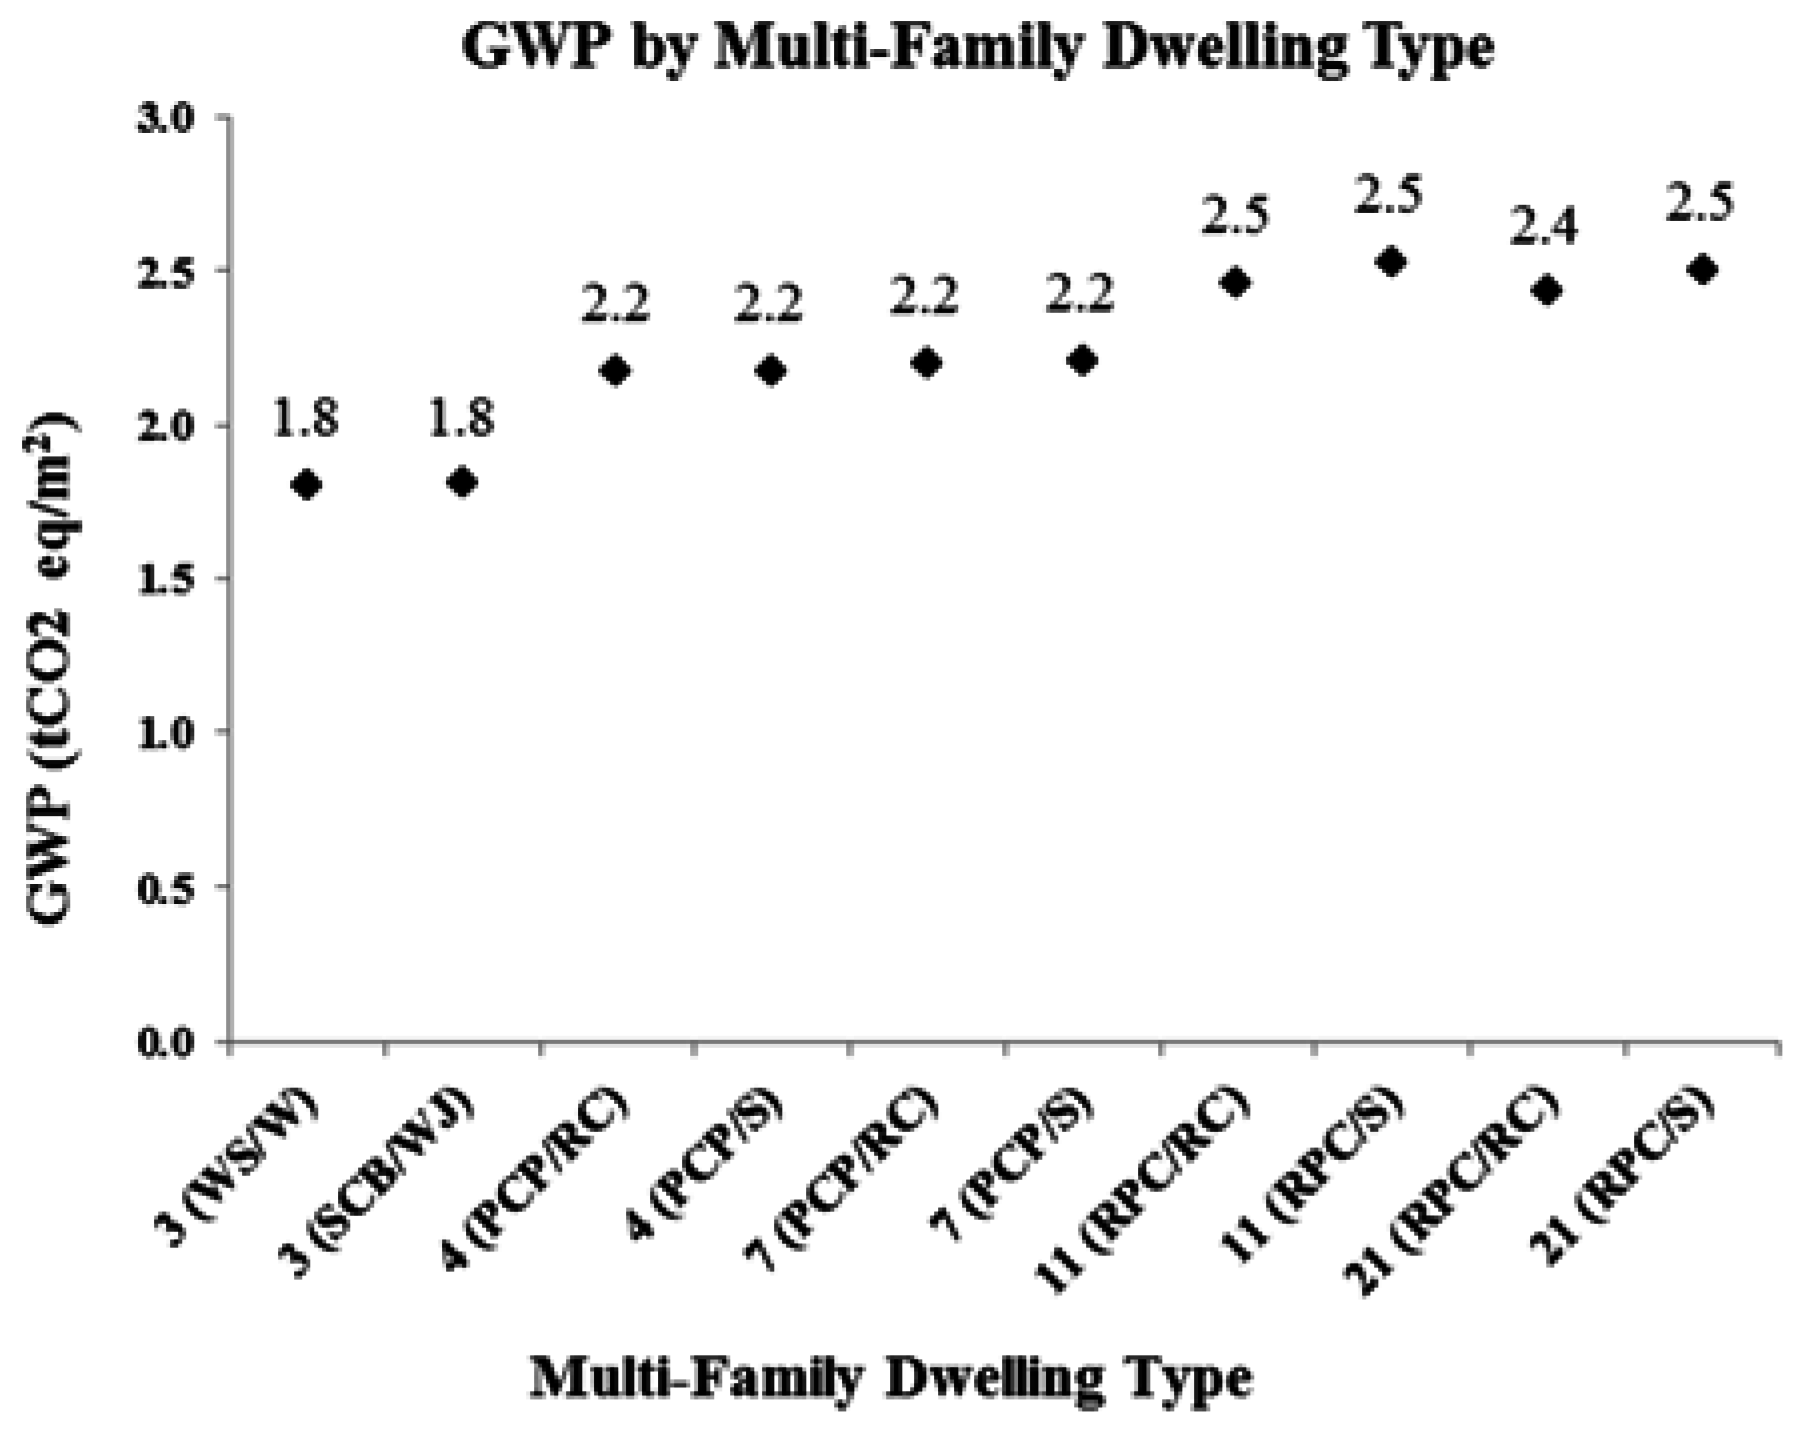
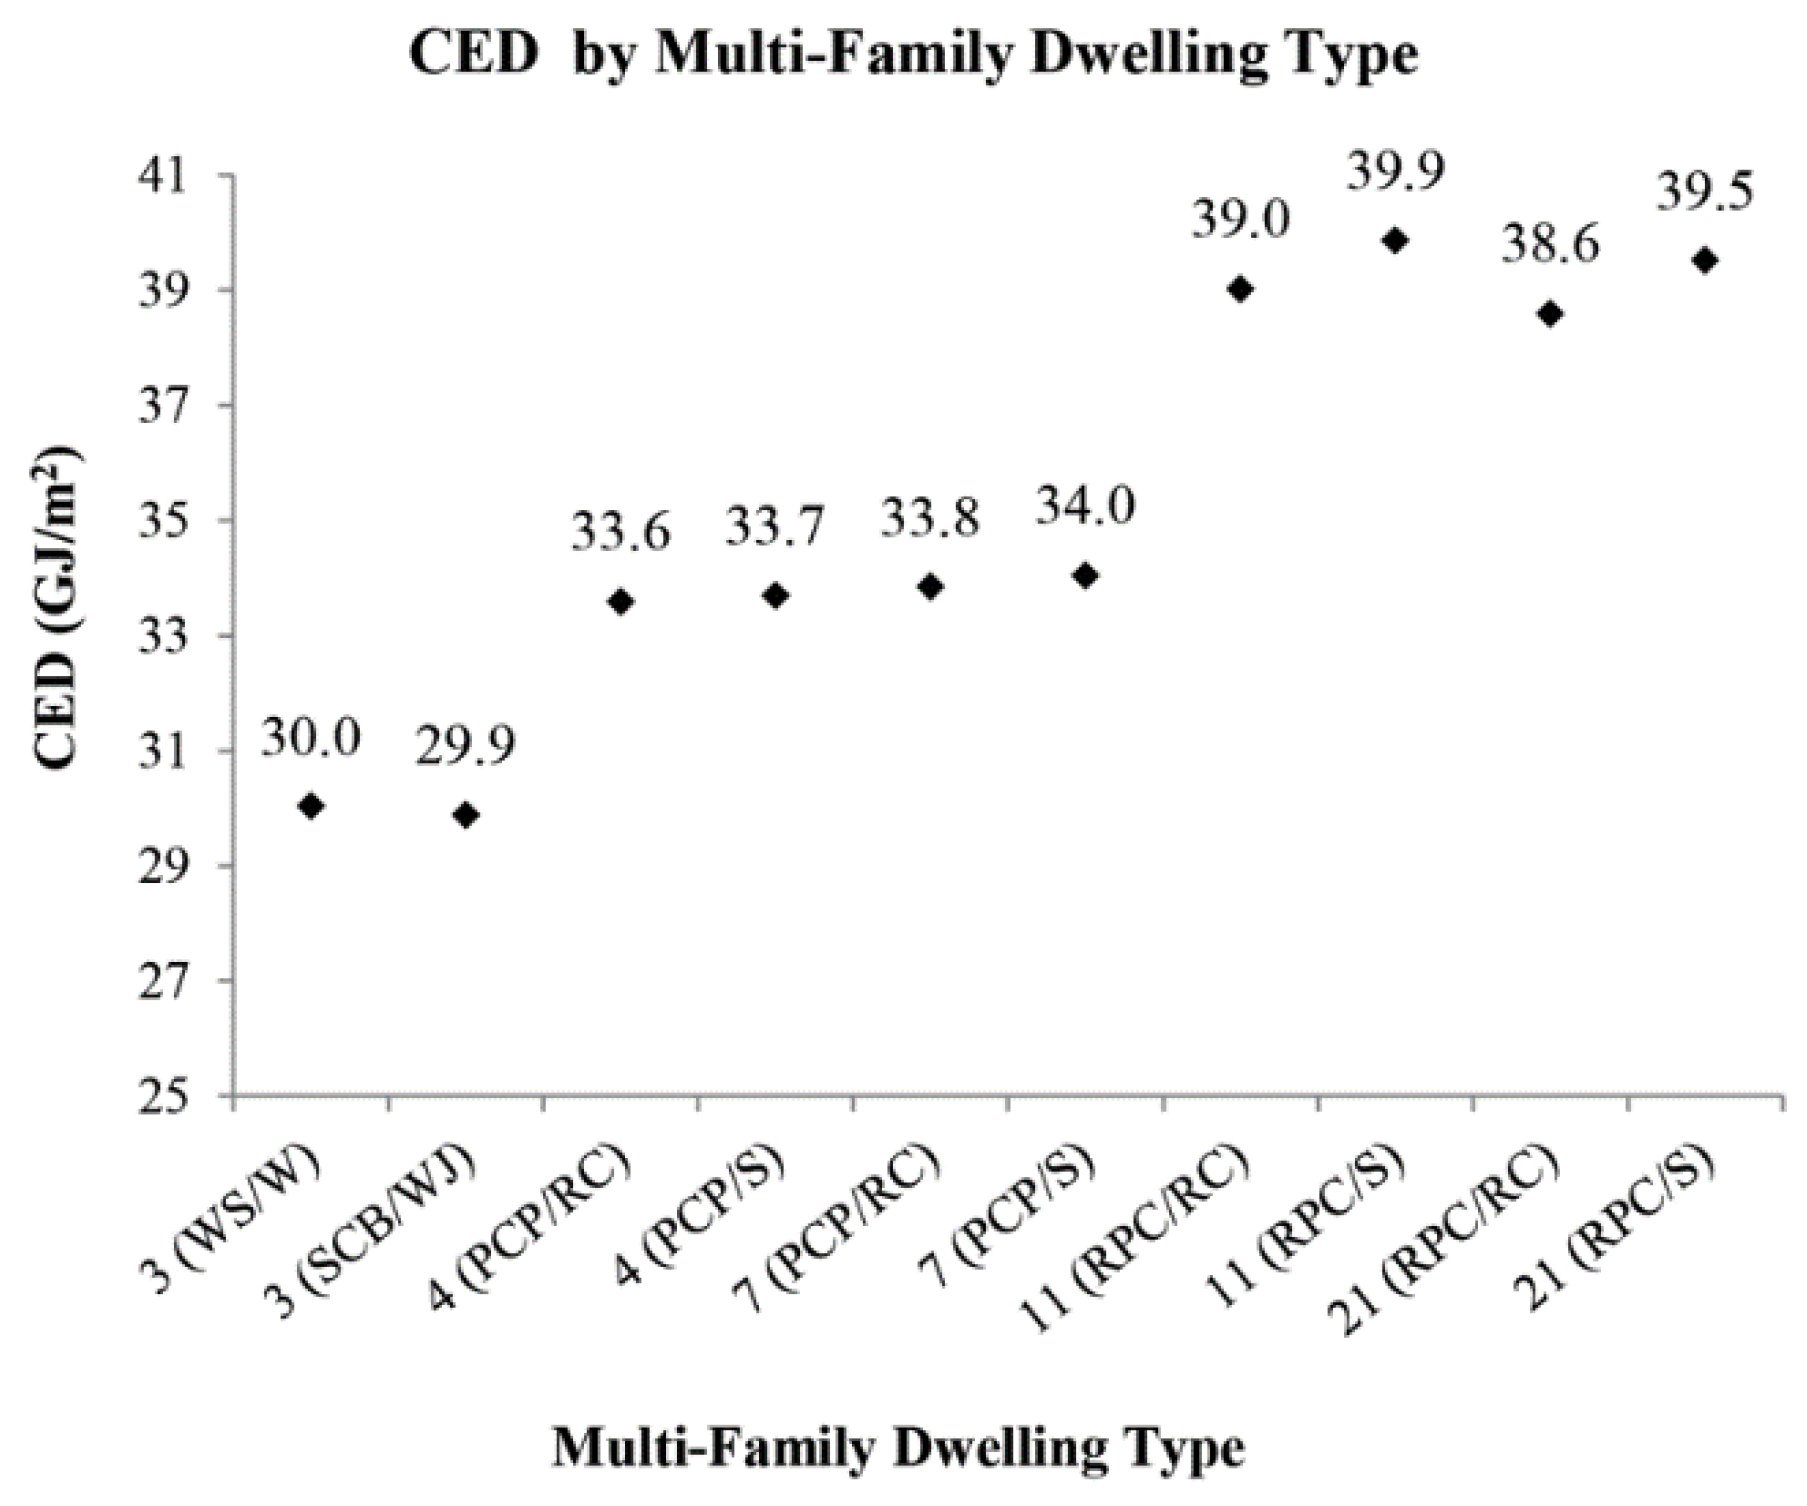
4.1. Multi-Family Life Cycle Impact Assessment

Results shown in Figure 3 and Figure 4 indicate that CED/GWP increase from low to mid to high-rise. This finding may be attributed to two factors. First, there are increased structural requirements that occur when going from low-to mid- to high-rise dwellings. For example, in a low-rise multi-family dwelling, wood framing can be used. Wood has a comparatively lower overall CED/GWP, when considering total mass and energy intensity, than steel or concrete which are alternative framing materials required for higher-rise multi-family dwellings. The second reason that the study suggests a direct correlation between increases in CED/GWP and building rise is due to the increasing operation energy. While this study uses survey data to complete the analysis for operation energy, the findings are corroborated by empirical work completed in Vancouver, BC on mid and high-rise residential buildings [49]. Values for CED/GWP for each life cycle phase are found in Table S6 in the supplementary documentation.
Figure 3. Cumulative Energy Demand (CED) for multi-family dwellings of different construction and number of stories. CED: Cumulative energy demand; GJ/m2: Gigajoules per square meter; WS/W: Wood siding/wood frame; SCB/WJ: Stucco on concrete block/wood joists; PCP/RC: Precast concrete panels/reinforced concrete: PCP/S: Precast concrete panels/steel; RPC/RC: Ribbed precast concrete/reinforced concrete; RPC/S: Ribbed precast concrete/steel.
Challenges 06 00098 g003
Figure 4. Global Warming Potential (GWP) for multi-family dwellings of different construction and number of stories. GWP: Global warming potential; WS/W: Wood siding/wood frame; SCB/WJ: Stucco on concrete block/wood joists; PCP/RC: Precast concrete panels/reinforced concrete: PCP/S: Precast concrete panels/steel; RPC/RC: Ribbed precast concrete/reinforced concrete; RPC/S: Ribbed precast concrete/steel.
Challenges 06 00098 g004
The results shown in Figure 5 show that for the 11-story multi-family dwelling, total life cycle energy, or CED, is approximately halved when defining a functional unit only including HVAC activities compared to the same dwelling when all operational energy is included. The share of materials and construction correspondingly increases from 13%–26% when restricting operational energy to HVAC. This change in perspective does not overturn the conventional wisdom that operation phase dominates (for a conventional, not energy efficient, building), but now at ~1/4 of total energy, materials and construction are much more important contributors to life cycle energy.
Figure 5. Life cycle shares of CED for an 11-story multi-family dwelling for a functional unit including heating and cooling (HVAC) only and all energy (HVAC and Non-HVAC), the latter reflecting inconsistent boundaries used in prior studies (see Section 2.1). CED: Cumulative energy demand; GJ/m2: Gigajoules per square meter; HVAC: Heating, ventilation and air conditioning.
Challenges 06 00098 g005

4.2. Comparing Multi-Family and Single-Family Detached Residences for Different Incomes

The results shown in Figure 6 indicate that total life cycle energy increases with income for both housing types. In all cases the total life cycle energy of single-family detached housing is greater than multi-family housing. Moreover, total life cycle energy of single-family detached homes increases with income more quickly than for multi-family homes (greater than four times). In the lowest income range, the gap in CED between single-family detached to multi-family housing is in the range of 26%–100%. In contrast, in the highest income range, the difference in CED is in the range of 58%–153%. The results suggest socioeconomic influences on total life cycle energy. It is important to point out that this analysis only includes building materials, construction and energy to operate HVAC. According to the Energy Information Administration (EIA), the share of energy consumed for heating and cooling has decreased from 53% in 1993 to 48% in 2009, while the share of energy consumed for appliances, electronics and lighting has increased from 24%–35% during the same time frame [50]. A broader view including the impacts of the consumption of goods and services has been shown to be greater in higher density (multi-family) residences [23,27].
Figure 6. Total life cycle CED by Income and Housing Type. CED: Cumulative energy demand; MF: Multi-Family Residence; SF: Single-Family Residence; k: Thousand US$; GJ: Gigajoules; Ave: Average; m2: Square meters. a Sources: Materials and construction life cycle data on single-family detached homes is from [17]. Operation life cycle data for single-family detached homes was determined using [48] for primary heating and cooling consumption data, and, [51] for total number of single-family detached homes and total square footage. An average U.S. site to source factor of 3.365 for electricity is used [40]. Data on multi-family homes is from the current study. Average square footage by income level and housing type (apartment in building with 5 or more units and single-family detached homes) comes from [36].
Challenges 06 00098 g006

5. Discussion

5.1. Main Results

Regarding the definition of functional unit, we illustrated for one choice (climate controlled shelter) that explicit definition significantly alters the balance of energy use between supply chains and operation. We argue that all subsequent building LCA studies should start by defining the functional unit. This choice could be different from ours, e.g. include more or different activities within a residence or other type of building. Since prior studies have excluded many supply chain processes, in general we expect that defining the functional unit will in general lead to a lower share of the operation phase compared with previous practice.
In our exploration of life cycle energy as a function of building height, qualitatively we see a similar trend as [21] of increasing energy use per area with increasing height. Including operational and construction energy, there is a 30% increase in GJ/m2 from three to 11–21 storey buildings. This increase is due to use of more energy-intensive construction materials such as steel and concrete as compared to wood construction with higher building height. We expected to see operational energy per area decreasing with increasing building height (due to more shared floors/ceilings), but the U.S. Residential Energy Consumption Survey [36] (see Section 3.4) showed the opposite trend. Further work is needed to clarify this point.
The socioeconomic analysis is relevant for urban planners. It is widely assumed that compact urban form, a big component of which is multi-family housing, will result in large energy savings [22]. The degree of savings is, however, highly dependent on what types of consumers are moving from single to multi-family homes. Depending on who is moving from single to multi-family homes, the energy savings can be much smaller or much larger than “average”. The assessment of energy savings from a compact urban development needs to account for the demographics and prior lifestyles of residents moving to the development. While there are certainly prior regression results that show how energy use changes with income and multi vs. single family [25], our results show a transparent trend that accounts for the life cycle.

5.2. Uncertainty

As with any modeling exercise, there are many limitations to the analysis. To first recap the factors not included in our model, maintenance of the building, replacement of equipment, variability in building lifespan, and the variability of GHG emission factors over the 50-year time scale were excluded. The first three factors we neglected due to lack of available data, the last due to lack of methodological standard. Still, these are all important issues to be addressed in the future, e.g. previous work has found that the impacts from maintenance, or refurbishment of building materials, can be significant [19]. Accounting for these factors will probably not affect the qualitative trend found here.
Turning next to accuracy of the factors that were included in the analysis, one question is the error associated with using EIO-LCA. Using EIO-LCA almost always introduces more aggregation error than a process-sum analysis. However, the relative accuracy of EIO-LCA and process-sum remains an open question [29]. One issue complicating a comparison is that LCA studies, like this one, often aim to answer general questions about a class of products (i.e. single versus multi-family buildings). There is an enormous degree of variability between individual products, asserting a characteristic of the class requires knowledge of the average. In principle, variability can be handled with process-sum analysis. In practice, however, process-sum analysis often proceeds with a small sample of a product or process, sometimes only one. The representativeness of such a limited sample for the general class is unclear. More work is needed to clarify aggregation error in EIO-LCA and representativeness and truncation error in process-sum analysis to enable a proper comparison of the two approaches. In addition, EIO and process-sum LCA have differing degrees of temporal and geographical uncertainty, also important to consider [28].
Another area of uncertainty involves the BOMs for multi-family residences. The detailed BOM’s are price estimates primarily used to assist contractors in developing quotes for the construction of buildings [35]. While providing a detailed list of line items, the BOMs are estimates only, introducing parameter uncertainty due to potentially inaccurate or missing data. Treloar et al. 2001 [21] used data from existing buildings rather than estimates of representative buildings and found higher relative embodied energy. There is also parameter uncertainty in the operation life cycle phase. Low-, mid- and high-rise operation data for U.S. multi-family dwellings is obtained from the Residential Energy Consumption Survey [50]. This data is weighted based on the number of households estimated to have similar characteristics including consumption characteristics [52]. Despite potential parameter uncertainty in the operation data, the trend found that operation energy increases with building rise is corroborated in previous empirical work [49]. When comparing the overall findings to the results of previous studies, no inconsistencies of concern arise (See Table S7 in the supplementary documentation for more on comparison with prior results).
To conclude, we draw the reader’s attention back to the functional unit issue. There is decades of history of LCA studies of buildings. The typical flow of analysis is (1) To not define the functional unit, (2) Take the operation phase as all energy use in the building, and (3) Exclude supply chains associated with many activities done in the building. This practice exaggerates the contribution of building operation to life cycle impacts. There is a need to reexamine LCA practice for buildings for different explicit definitions of a functional unit.

Acknowledgments

This study was supported by the Civil Infrastructure Systems program at the National Science Foundation (CMMI grant # 1031690). The authors thank the reviewers for many helpful comments.

Author Contributions

Kimberly Bawden collected the data, performed the analysis and wrote most of the paper. Eric William’s contributions were guiding the direction of the research, writing some sections, and editing.

Conflict of Interest

The authors declare no conflict of interest.

References

  1. United Nations, General Assembly. City Planning will Determine Pace of Global Warming. Available online: http://www.un.org/press/en/2007/gaef3190.doc.htm (accessed on 4 September 2013).
  2. United Nations Environment Programme (UNEP). Sustainable Buildings and Climate Initiative, Why Buildings. Available online: http://www.unep.org/sbci/AboutSBCI/Background.asp (accessed on 16 February 2013).
  3. U.S. Environmental Protection Agency. Life Cycle Assessment: Principles and Practice; Scientific Applications International Corporation (SAIC): Reston, VA, USA, 2006.
  4. Adalberth, K. Energy use during the life cycle of single-unit dwellings: Examples. Build. Environ. 1997, 32, 321–329. [Google Scholar] [CrossRef]
  5. Cole, R.J.; Kernan, P.C. Life-cycle energy use in office buildings. Build. Environ. 1996, 31, 307–317. [Google Scholar] [CrossRef]
  6. Keoleian, G.A.; Blanchard, S.; Reppe, P. Life-cycle energy, costs, and strategies for improving a single-family house. J. Ind. Ecol. 2001, 4, 135–156. [Google Scholar] [CrossRef]
  7. Junnila, S.; Horvath, A.; Guggemos, A.A. Life-cycle assessment of office buildings in Europe and the United States. J. Infrastruct. Syst. 2006, 12, 10–17. [Google Scholar] [CrossRef]
  8. Ramesh, T.; Prakash, R.; Shukla, K.K. Life cycle energy analysis of buildings: An overview. Energy Build. 2010, 42, 1592–1600. [Google Scholar] [CrossRef]
  9. Sharma, A.; Saxena, A.; Sethi, M.; Shree, V.; Varun. Life cycle assessment of buildings: A review. Renew. Sustain. Energy Rev. 2011, 15, 871–875. [Google Scholar]
  10. Thormark, C. A low energy building in a life cycle—Its embodied energy, energy need for operation and recycling potential. Build. Environ. 2002, 37, 429–435. [Google Scholar] [CrossRef]
  11. Stephan, A.; Crawford, R.H.; de Myttenaere, K. A comprehensive assessment of the life cycle energy demand of passive houses. Appl. Energy 2013, 112, 23–34. [Google Scholar] [CrossRef]
  12. Crawford, R.H.; Stephan, A. The significance of embodied energy in certified passive houses. World Acad. Sci. Eng. Technol. 2013, 78. [Google Scholar] [CrossRef]
  13. Stephan, A.; Stephan, L. Reducing the total life cycle energy demand of recent residential buildings in Lebanon. Energy 2014, 74, 618–637. [Google Scholar] [CrossRef]
  14. Sartori, I.; Hestnes, A.G. Energy use in the life cycle of conventional and low-energy buildings: A review article. Energy Build. 2007, 39, 249–257. [Google Scholar] [CrossRef]
  15. Cabeza, L.F.; Rincón, L.; Vilariño, V.; Pérez, G.; Castell, A. Life cycle assessment (LCA) and life cycle energy analysis (LCEA) of buildings and the building sector: A review. Renew. Sustain. Energy Rev. 2014, 29, 394–416. [Google Scholar] [CrossRef]
  16. Gong, X.; Nie, Z.; Wang, Z.; Cui, S.; Gao, F.; Zuo, T. Life cycle energy consumption and carbon dioxide emission of residential building designs in Beijing. J. Ind. Ecol. 2012, 16, 576–587. [Google Scholar] [CrossRef]
  17. Frijia, S.; Guhathakurta, S.; Williams, E.D. Functional unit, technological dynamics and scaling properties for the life cycle energy of residences. Environ. Sci. Technol. 2011, 46, 1782–1788. [Google Scholar] [CrossRef]
  18. Stephan, A.; Crawford, R.H.; de Myttenaere, K. Towards a comprehensive life cycle energy analysis framework for residential buildings. Energy Build. 2012, 55, 592–600. [Google Scholar] [CrossRef]
  19. Dixit, M.K.; Culp, C.H.; Fernández-Solís, J.L. System boundary for embodied energy in buildings: A conceptual model for definition. Renew. Sustain. Energy Rev. 2013, 21, 153–164. [Google Scholar] [CrossRef]
  20. Scheuer, C.; Keoleian, G.A.; Reppe, P. Life cycle energy and environmental performance of a new university building: modeling challenges and design implications. Energy Build. 2003, 35, 1049–1064. [Google Scholar] [CrossRef]
  21. Treloar, G.J.; Fay, R.; Ilozor, B.; Love, P.E.D. An analysis of the embodied energy of office buildings by height. Facilities 2001, 19, 204–214. [Google Scholar] [CrossRef]
  22. Norman, J.; MacLean, H.L.; Kennedy, C.A. Comparing high and low residential density: Life-cycle analysis of energy use and greenhouse gas emissions. J. Urban Plan. Dev. 2006, 132. [Google Scholar] [CrossRef]
  23. Holden, E.; Norland, I.T. Three challenges for the compact city as a sustainable urban form: household consumption of energy and transport in eight residential areas in the greater Oslo region. Urban Stud. 2005, 42, 2145–2166. [Google Scholar] [CrossRef]
  24. Ko, Y. Urban form and residential energy use a review of design principles and research findings. J. Plan. Lit. 2013, 28, 327–351. [Google Scholar] [CrossRef]
  25. Ewing, R.; Rong, F. The impact of urban form on US residential energy use. Hous. Policy Debate 2008, 19, 1–30. [Google Scholar] [CrossRef]
  26. Stephan, A.; Crawford, R. H.; de Myttenaere, K. Multi-scale life cycle energy analysis of a low-density suburban neighbourhood in Melbourne, Australia. Build. Environ. 2013, 68, 35–49. [Google Scholar] [CrossRef]
  27. Heinonen, J.; Junnila, S. Implications of urban structure on carbon consumption in metropolitan areas. Environ. Res. Lett. 2011, 6. [Google Scholar] [CrossRef]
  28. Treloar, G.J.; Fay, R.; Love, P.E.D.; Iyer-Raniga, U. Analysing the life-cycle energy of an Australian residential building and its householders. Build. Res. Inf. 2000, 28, 184–195. [Google Scholar] [CrossRef]
  29. Williams, E.D.; Weber, C.L.; Hawkins, T.R. (2009) Hybrid framework for managing uncertainty in life cycle inventories. J. Ind. Ecol. 2009, 13, 928–944. [Google Scholar] [CrossRef]
  30. Leontief, W. Environmental repercussions and the economic structure: an input-output approach. Rev. Econ. Stat. 1970, 52, 262–271. [Google Scholar] [CrossRef]
  31. Bullard, C.W.; Herendeen, R.A. The energy cost of goods and services. Energy Policy 1975, 3, 268–278. [Google Scholar] [CrossRef]
  32. Chris, H.; Horvath, A.; Joshi, S.; Lave, L. Peer reviewed: Economic input-output models for environmental life-cycle assessment. Environ. Sci. Technol. 1998, 32, 184A–191A. [Google Scholar] [CrossRef]
  33. Bullard, C.W.; Penner, P.S.; Pilati, D.A. Net energy analysis: Handbook for combining process and input-output analysis. Resour. Energy 1978, 1, 267–313. [Google Scholar] [CrossRef]
  34. Williams, E. Energy intensity of computer manufacturing: Hybrid assessment combining process and economic input-output methods. Environ. Sci. Technol. 2004, 38, 6166–6174. [Google Scholar] [CrossRef] [PubMed]
  35. Reed Construction Data Inc. RS MeansOn-line; Reed Construction Data Inc.: Norcross, GA, USA, 2012. [Google Scholar]
  36. Residential Energy Consumption Survey (RECS), RECS 2009 Survey Data, Microdata. Available online: http://www.eia.gov/consumption/residential/data/2009/index.cfm?view=microdata (accessed on 1 December 2013).
  37. Van Engelenburg, B.; van Rossum, T.; Blok, K.; Vringer, K. Calculating the energy requirments of household purchases: A practical step by step method. Energy Policy 1994, 22, 648–656. [Google Scholar] [CrossRef]
  38. Zhai, P.; Williams, E.D. Dynamic hybrid life cycle assessment of energy and carbon of multicrystalline silicon photovoltaic systems. Environ. Sci. Technol. 2010, 44, 7950–7955. [Google Scholar] [CrossRef] [PubMed]
  39. Carnegie Mellon University Green Design Institute. Economic Input-Output Life Cycle Assessment (EIO-LCA) US 2002 (428) Model [Internet]. Available online: http://www.eiolca.net/ (accessed on 10 July 2012).
  40. Source Energy and Emission Factors for Energy Use in Buildings. Available online: http://www.nrel.gov/docs/fy07osti/38617.pdf (accessed on 10 July 2012).
  41. Residential Energy Consumption Survey (RECS), Housing Characteristics. Available online: http://www.eia.gov/consumption/residential/data/2009/index.cfm?view=characteristics#undefined (accessed day 10 February 2014).
  42. Fuller, R.J.; Crawford, R.H. Impact of past and future residential housing development patterns on energy demand and related emissions. J. Hous. Built Environ. 2011, 26, 165–183. [Google Scholar] [CrossRef]
  43. Intergovernmental Panel on Climate Change (IPCC). Fourth Assessment Report. Available online: http://www.ipcc.ch/publications_and_data/ar4/wg1/en/ch2s2-10-2.html#table-2-14 (accessed on 4 June 2012).
  44. U.S. Census Bureau. North American Industry Classification System. Available online: http://www.census.gov/prod/ec02/ec0223i236116.pdf (accessed on 2 July 2013).
  45. U.S. Bureau of Economic Analysis. Benchmark Input-Output Data. Available online: http://www.bea.gov/industry/io_benchmark.htm (Accessed 21 June 2012).
  46. U.S. Bureau of Labor Statistics. Producer Price Indexes. Available online: http://www.bls.gov/ppi/ (accessed on 21 June 2012).
  47. U.S. Census Bureau. Economic Census, Industry Series Reports, Construction, New Multifamily Housing Construction (Except Operative Builders). Available online: http://www.census.gov/prod/ec02/ec0223i236116.pdf (accessed on 17 September 2012).
  48. Residential Energy Consumption Survey (RECS), RECS 2009 Survey Data. Consumption and Expenditures. Available online: http://www.eia.gov/consumption/residential/data/2009/index.cfm?view=consumption (accessed on 1 December 2013).
  49. RDH Building Engineering Ltd. Energy Consumption and Conservation in Mid- and High-Rise Residential Buildings in British Columbia; RDH Building Engineering Ltd.: Vancouver, BC, Canada, 2012. [Google Scholar]
  50. Residential Energy Consumption Survey (RECS). Available online: http://www.eia.gov/consumption/residential/data/2009/index.cfm (accessed on 10 February 2014).
  51. Residential Energy Consumption Survey RECS, Housing Characteristics, Table HC10.1 Total Square Footage of U.S. Homes, by Housing Characteristics. Available online: http://www.eia.gov/consumption/residential/data/2009/index.cfm?view=characteristics#undefined (accessed on 1 December 2013).
  52. Residential Energy Consumption Survey (RECS), 2009 Technical Documentation Summary. Available online: http://www.eia.gov/consumption/residential/methodology/2009/pdf/techdoc-summary010413.pdf (accessed on 9 January 2014).

