Article

Changes in Carbon Cycling during Development of Successional Agroforestry

by
Tomas Selecky
1,
Sonoko D. Bellingrath-Kimura
1,2,*,
Yuji Kobata
3,
Masaaki Yamada
3,
Iraê A. Guerrini
3,4,
Helio M. Umemura
3 and
Dinaldo A. Dos Santos
5
1
Leibniz Centre for Agricultural Landscape Research, Müncheberg 15374, Germany
2
Faculty of Life Science, Humboldt University of Berlin, Berlin 14195, Germany
3
Department of International Environmental and Agricultural Science, Tokyo University of Agriculture and Technology, Fuchu 183-8509, Japan
4
Department of Soil and Environmental Ressources, Sao Paulo State University, Sao Paulo 01049-010, Brazil
5
Cooperativa Agrícola Mista de Tomé-açu (CAMTA), Tome Acu 68.682-000, Brazil
*
Author to whom correspondence should be addressed.
Agriculture 2017, 7(3), 25; https://doi.org/10.3390/agriculture7030025
Submission received: 20 December 2016 / Revised: 28 February 2017 / Accepted: 6 March 2017 / Published: 11 March 2017
(This article belongs to the Special Issue C and N Cycling and Greenhouse Gas Emissions in Agroecosystem)

Abstract

:
Successional agroforestry systems (SAFS) mimic the structure of natural forests while providing economical outputs. This study clarifies how carbon cycling and carbon sequestration change during successional development of SAFS. In Brazil, three successional stages of SAFS, 6, 12, and 34 years old, were compared in terms of carbon balance. Aboveground biomass, fruit harvest, litterfall, soil respiration, and soil organic carbon were measured for two years and analyzed. Carbon sequestration expressed by net primary productivity increased with age of SAFS from 9.8 Mg·C·ha−1·year−1 in 6-year-old system to 13.5 Mg·C·ha−1·year−1 in 34-year-old system. Accumulation of plant biomass and increased internal carbon cycling in SAFS led to an intensive sequestration of carbon. SAFS can be a sustainable way of agricultural production on vulnerable tropical soils.

1. Introduction

Tropical soils are often highly weathered and tend to have low fertility [1]. However, if climate conditions are favorable, dense vegetation of rainforests can develop on those soils. Transformation of forests into farmlands leads to exposure of the vulnerable soil, making it prone to erosion that can lead up to desertification [2]. Agricultural systems that protect the soil and prevent its degradation are highly required, especially for tropical soils.
Successional agroforestry systems (SAFS) are a promising strategy for more sustainable food production in the tropics [3]. SAFS seek to mimic the diverse structure of natural forests and at the same time produce marketable products. In comparison with other agroforestry systems, SAFS strive to create food producing systems in advanced stages of succession, managing subclimax or climax plant communities where high niche variability results in high biodiversity and efficient use of resources [4]. Utilizing native as well as introduced plant species, a forest is created that is structurally analogous to a natural forest of the local area, providing the same ecosystems services, restoring the environment and sustaining local communities. SAFS are designed to follow natural succession, leading to increased complexity and structural diversity in time. Pioneer species, apart from producing marketable goods, create conditions for the successful establishment of climax species. This way, potential productivity of every particular site can be maximally reached.
In agroforestry, carbon (C) is sequestered through incorporation of carbon dioxide (CO2) into plant biomass by photosynthesis. C is thus stored in pools of aboveground biomass, like timber, branches, and belowground biomass like roots, soil microorganisms, and organic C in soil [5]. Trees have greater capacity to store C than annual crops and grasses on pastures. Agroforestry systems will therefore present better option for C sequestration [6,7].
Apart from the importance of C sequestration for mitigating climate change, soil organic carbon (SOC) is an important indicator of soil health and fertility [8,9]. The decrease or increase of SOC can reveal if the land-use system degrades, maintains, or improves the fertility and health of the soil [10,11]. SOC, present in the soil as soil organic matter, helps to promote soil fertility directly and indirectly. Its direct effect is connected with the process of mineralization. Through decomposition, organic matter provides a source of nutrients for vegetative and microbial communities. Indirectly, SOC improves physical properties of the soil, leading to improved soil aggregation that in turn positively influences water and air infiltration and root penetration [10]. Land use can have a profound influence on SOC concentrations [8,12]. Removal of vegetation cover during slash and burn agriculture, tillage, or grazing is connected with decreases in SOC concentrations [13]. Without plant residues, there is no source left on the field that could replenish a decrease in SOC concentration.
Agroforestry, with its tree component, is capable of producing large amounts of biomass. By mimicking forest, SAFS are expected to be especially suitable for SOC replenishment [14]. However, the possibility of SAFS to replenish SOC depends on the original condition of the soil and environment. Some studies report a gain in SOC under agroforestry, while others do not [15,16], and there is no consensus as to whether SAFS can increase SOC.
SAFS are dynamic agricultural systems, and as they mature their features—such as the dominant plant species, structure, and height of the canopy—change dramatically [4]. Young SAFS stages therefore display attributes more similar to monoculture plantations, while mature systems resemble forests with undisturbed soil covered with litters from trees. Jacobi et al. [16] proved that SAFS can be more efficient land-use systems than monoculture cultivations in terms of C sequestration, mainly due to C storage in the above ground biomass. However, changes in C sequestration during successional development of SAFS remain poorly investigated.
There are several studies on SAFS from economic and social viewpoints [16,17,18,19]. However, little is known about their effect on C cycling, soil fertility, and C sequestration, even though farmers are convinced of their resource-use efficiency and ability to conserve soil [4,20].
This study therefore aims to clarify changes in C cycling and C sequestration during SAFS development. Filling up these knowledge gaps could help to provide scientific background for the possibility of using SAFS for C sequestration.

2. Materials and Methods

2.1. Study Site

The study site is Tomé-Açu in Brazilian state Pará (2°24′53″ S, 48°8′60″ W). The climate is humid tropical with a mean annual temperature of 26.4 °C, and local soils are highly weathered acid Oxisols [3]. The annual precipitation of 2663 mm is unevenly distributed during two main seasons. The rainy season starts in November and continues to June, while the dry season starts in July and ends in October. During the dry season, monthly precipitation can reach values below 50 mm which can cause water shortages [21].
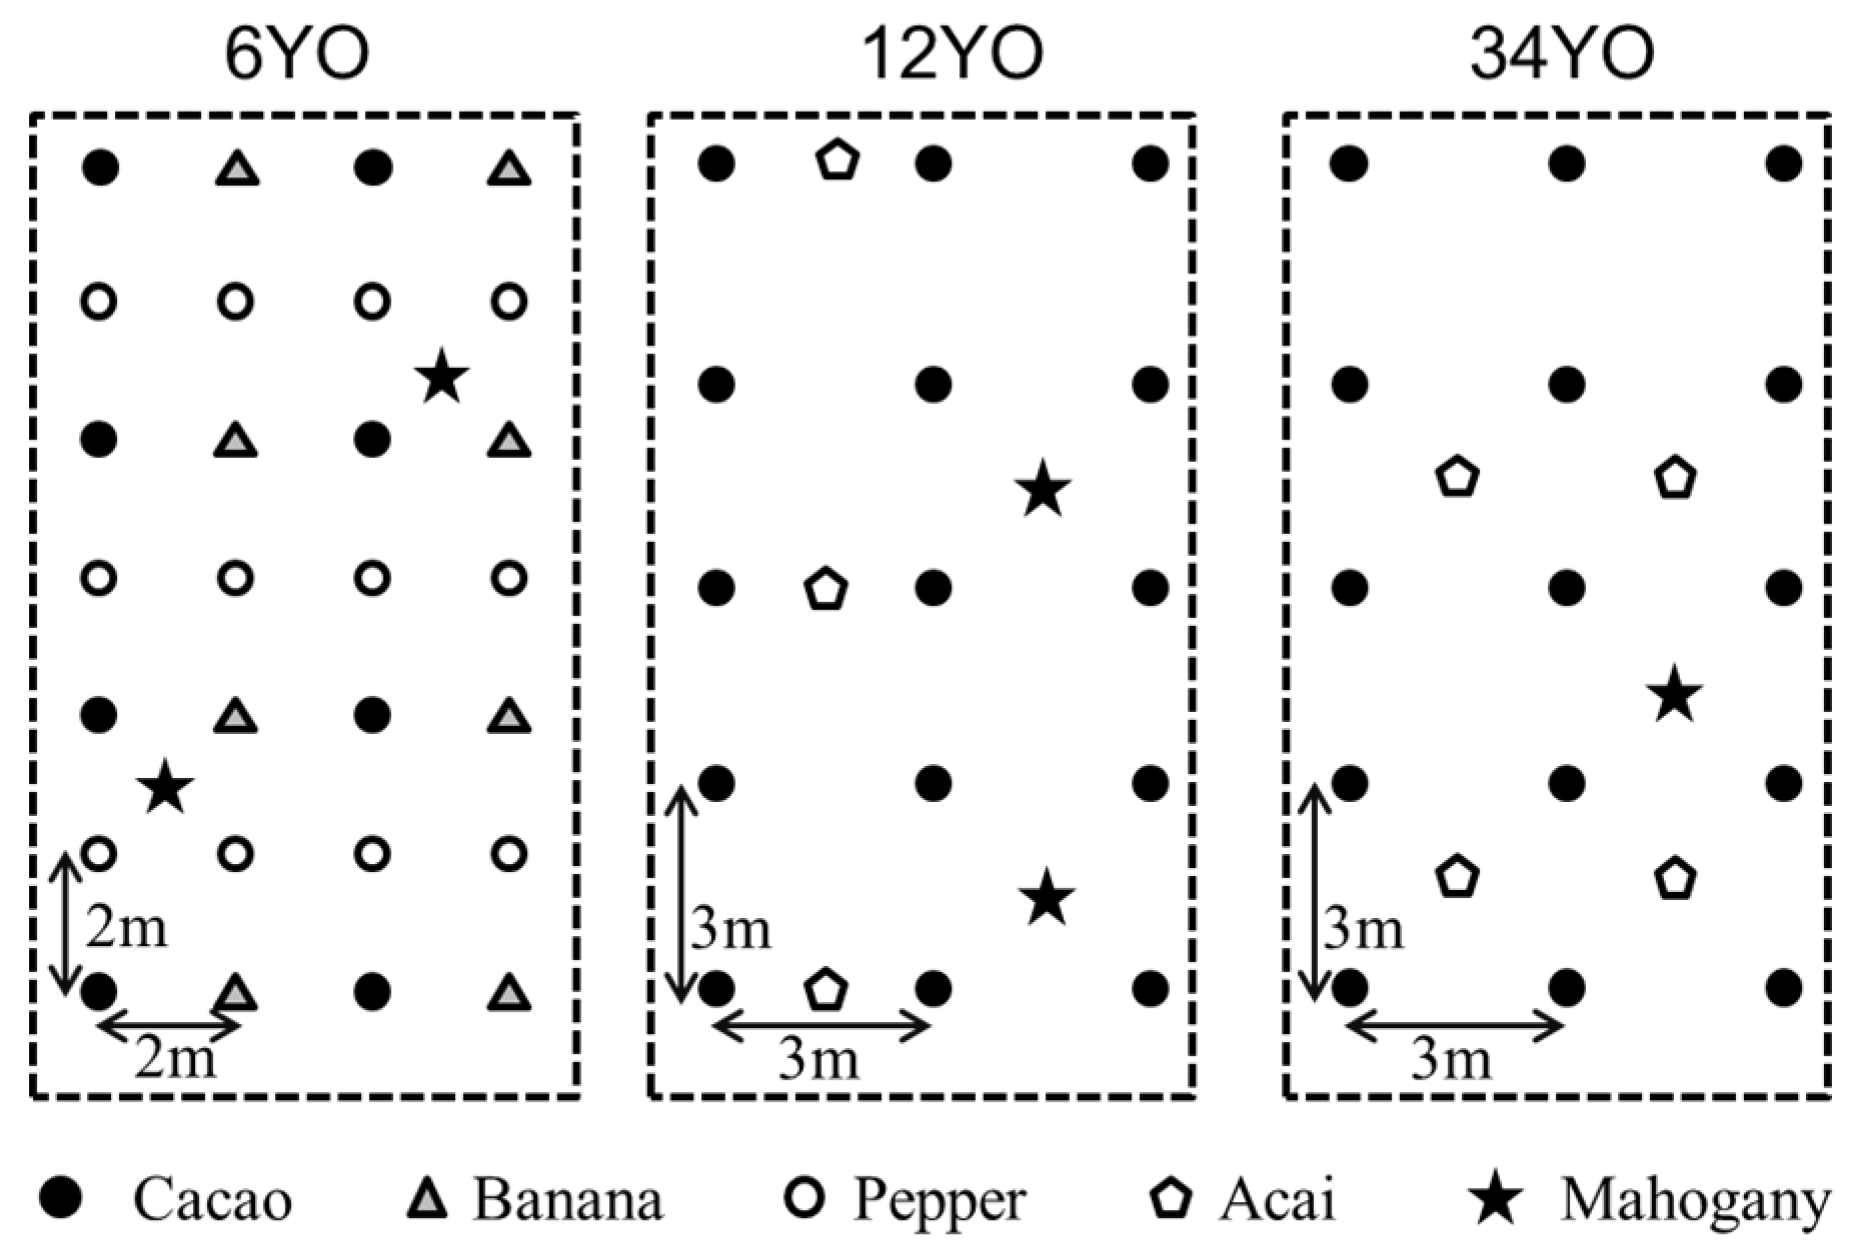
The study was conducted from September 2012 to July 2014 at Konagano farm, a pioneer of SAFS in Brazil. Its vicinity to secondary rainforest and presence of SAFS established in different years makes it an optimal site for comparative research. For our study, three different successional stages of SAFS were selected: SAFS established in 2008 (six-years-old at the time of the study; 6YO), in 2002 (12YO), and in 1980 (34YO). For each SAFS stage, three plots were chosen as replicates. Each SAFS stage covers an area of greater than 4 ha, allocated within 3 km distance. The trees were planted in a square pattern based on a different design for each stage (Figure 1). Plant species and densities grown on the SAFS stages are listed in Table 1. As a reference, neighboring secondary forest was also monitored with also three replications. Nitrogen fertilizer was added at a rate of 40, 20, and 0 kg·N·ha−1·year−1 to the 6YO, 12YO, and 34YO, respectively. Before the establishment of SAFS, all the plots were used as monoculture pepper plantations.

2.2. Net Biome Productivity

Schulze and Heimann [22] introduced the term net biome productivity (NBP) to analyze long-term and large-scale changes in C cycle induced by land use. NBP is the amount of C that remains in the system after subtracting respiration and losses like harvest or fires. The C budget of different SAFS stages was analyzed and compared using the following formulas:
NBP = NPP − (EF + SR)
NPP = AGBI + EF + FR + LF
where NBP = net biome productivity, NPP = net primary productivity, EF = exported fruit, SR = soil respiration, AGBI = aboveground biomass increase from 2013 to 2014, FR = fruit residue, LF = litterfall.

2.3. Aboveground Biomass Increase

Aboveground biomass was calculated twice, in 2013 and 2014, according to a suitable formula for each tree species on a separate basis (Table 2). In the case of banana, the plants were cut down in 2013 and 2014 and dried and weighted for their biomass directly in an area of 5 m by 5 m from each plot. Since not all plant species existed in all SAFS stages (Table 1), the presence of the species in each of the SAFS stages, 20 cacao, 10 mahogany, 20 acai, and 3 banana trees were randomly selected for analysis from each plot. Pepper plants were neglected from the balance because of their small contribution to overall biomass. For the other calculations, we measured tree diameter at breast height and tree height using a clinometer. To count annual aboveground biomass increase, we subtracted aboveground biomass measured in 2013 from that measured in 2014. Carbon contents were determined by analysis of representative samples obtained from each plant by CHN-analyzer (Yanako MT-6).

2.4. Exported Fruit and Fruit Residue

In order to analyze the biomass of exported fruit and fruit residue, 20 cacao, 10 pepper, and 20 acai trees were randomly selected for analysis from each plot and analyzed for C content as previously described. Subsamples from plant organs were dried in an oven at 75 °C for two days to determine dry weight. Cacao was harvested in June/July and in February, acai continuously from June to November, and pepper from July to September. Cacao fruits were separately weighted for husks (fruit residue) and beans (exported fruit). Husks were left on the ground as mulch while beans were removed from the field. Acai fruit-bunches were separated into strings (fruit residue) and fruits (exported fruit). Strings were left on the ground as mulch while fruits were removed from the field. Pepper was removed from the field without leaving residue. Bananas were not harvested. Banana trees were cut down after a few years and left on the field as mulch.

2.5. Litterfall

Litterfall from trees was measured continuously from November 2012 to July 2014 in all stages of SAFS, as well as in the secondary forest, and analyzed for C content, as previously described. In each plot, we used three 1000 mm by 1000 mm square nets for debris catchment. Every month, the contents of the nets were weighted and a selected sample was dried in an oven at 75 °C for two days to determine dry weight.

2.6. Soil Respiration

Soil respiration was measured by using the closed chamber method. Carbon dioxide (CO2) concentration was measured continually from April 2013 to July 2014 in 6-min intervals by a CO2 sensor (Testo 535). For every plot, three replications were conducted for soil with litter and three replications for soil without litter. The CO2 flux from soil without litter was referred to as soil respiration, while the difference between the CO2 flux with litter and that without litter was defined as litter respiration.
Soil respiration is composed of heterotrophic respiration (soil organisms) and autotrophic respiration (roots). Autotrophic respiration can represent 20% to 80% of soil respiration [26]. However, to estimate NBP, only heterotrophic respiration is used. The values of soil respiration were therefore adjusted accordingly to omit root respiration. This provided a range of possible values for heterotrophic respiration.

2.7. Soil Organic Carbon

Soil sampling was performed by digging a 30-cm deep profile in 6YO, 12YO, 34YO, and secondary forest plots, as well as in the road in the secondary forest. The road was attached to the 34YO plot and was created at the same time as that the pot. It was added to the analysis of SOC as a reference value. At each plot, four soil core sample replications (100 cm3) were taken for analysis of soil bulk density and C content as previously described.
Different land use systems lead to different soil bulk densities and thus comparing C contents to the same soil depth will lead to errors because soil layers of the same depth can contain different masses of soil. Therefore, SOC contents were compared using equivalent soil masses. Using this method, soil layers are not defined by depth in cm, but rather by specific mass in Mg·ha1. This method allows for the comparison of soil masses even if their soil bulk densities are different. As recommended by Wendt and Hauser [27], an excel spreadsheet [28] was used to calculate SOC concentration in equivalent soil masses, using data of bulk density, depth, and SOC concentration collected by soil sampling. In this study, soil mass of 5000 Mg·ha1 was used.

2.8. Statistics

Statistical analysis was made in IBM SPSS Software version 22 (Armonk, NY, USA). To explore differences in soil respiration, Welch’s ANOVA was performed followed by Games-Howell post-hoc test at level of significance p < 0.05.
Analysis of litterfall was conducted using one-way ANOVA (F(3,80) = 6.539, p = 0.001) followed by Tukey’s post-hoc test. Litterfall data were sqrt-transformed in order to comply with Shapiro-Wilk test of normal distribution.
Differences in soil organic C content were analyzed by one-way ANOVA (F(4,15) = 122.907, p = 0.000) followed by Tukey’s post-hoc test.

3. Results

Exported fruit and residue from Cacao was significantly highest in 12YO with 3.7 ± 0.8 Mg·C·ha−1·year−1, followed by 34YO and 6YO (Table 3). Exported fruit and residue from Acai was almost the same for 12YO and 34YO, ranging from 1.5 to 1.6 Mg·C·ha−1·year−1. Pepper was harvested only in 6YO, resulting in 1.0 ± 0.2 Mg·C·ha−1·year−1. The sum of all the exported fruit and fruit residue was highest for 12YO with 5.2 ± 1.0 Mg·C·ha−1·year−1, followed by 34YO with 4.5 ± 0.9 Mg·C·ha−1·year−1. The lowest value was measured in 6YO with 2.7 ± 0.5 Mg·C·ha−1·year−1. Similarly, the sum of all the exported fruit without fruit residue was highest in 12YO with 4.1 ± 0.8 Mg·C·ha−1·year−1, followed by 34YO with 3.5 ± 0.7 Mg·C·ha−1·year−1. The lowest value was measured in 6YO with 2.3 ± 0.4 Mg·C·ha−1·year−1.
The biomass increase of cacao tree was comparable in 6YO and 34YO reaching 0.9 Mg·C·ha−1·year−1 (Table 4). 12YO showed a lower increase with 0.7 ± 0.3 Mg·C·ha−1·year−1. Mahogany growth was the most intensive in 6YO with 0.9 ± 0.2 Mg·C·ha−1·year−1, followed by 12YO and 34YO with 0.8 ± 0.4 and 0.2 ± 0.1 Mg·C·ha−1·year−1, respectively. Acai palm growth was higher in 12YO than in 34YO with 0.8 ± 0.3 and 0.5 ± 0.2 Mg·C·ha−1·year−1, respectively. Banana was grown only in 6YO with a yearly biomass increase of 0.5 ± 0.1 Mg·C·ha−1·year−1. When comparing total biomass increases, then 6YO and 12YO, both with 2.3 Mg·C·ha−1·year−1, were more productive than 34YO with 1.6 Mg·C·ha−1·year−1.
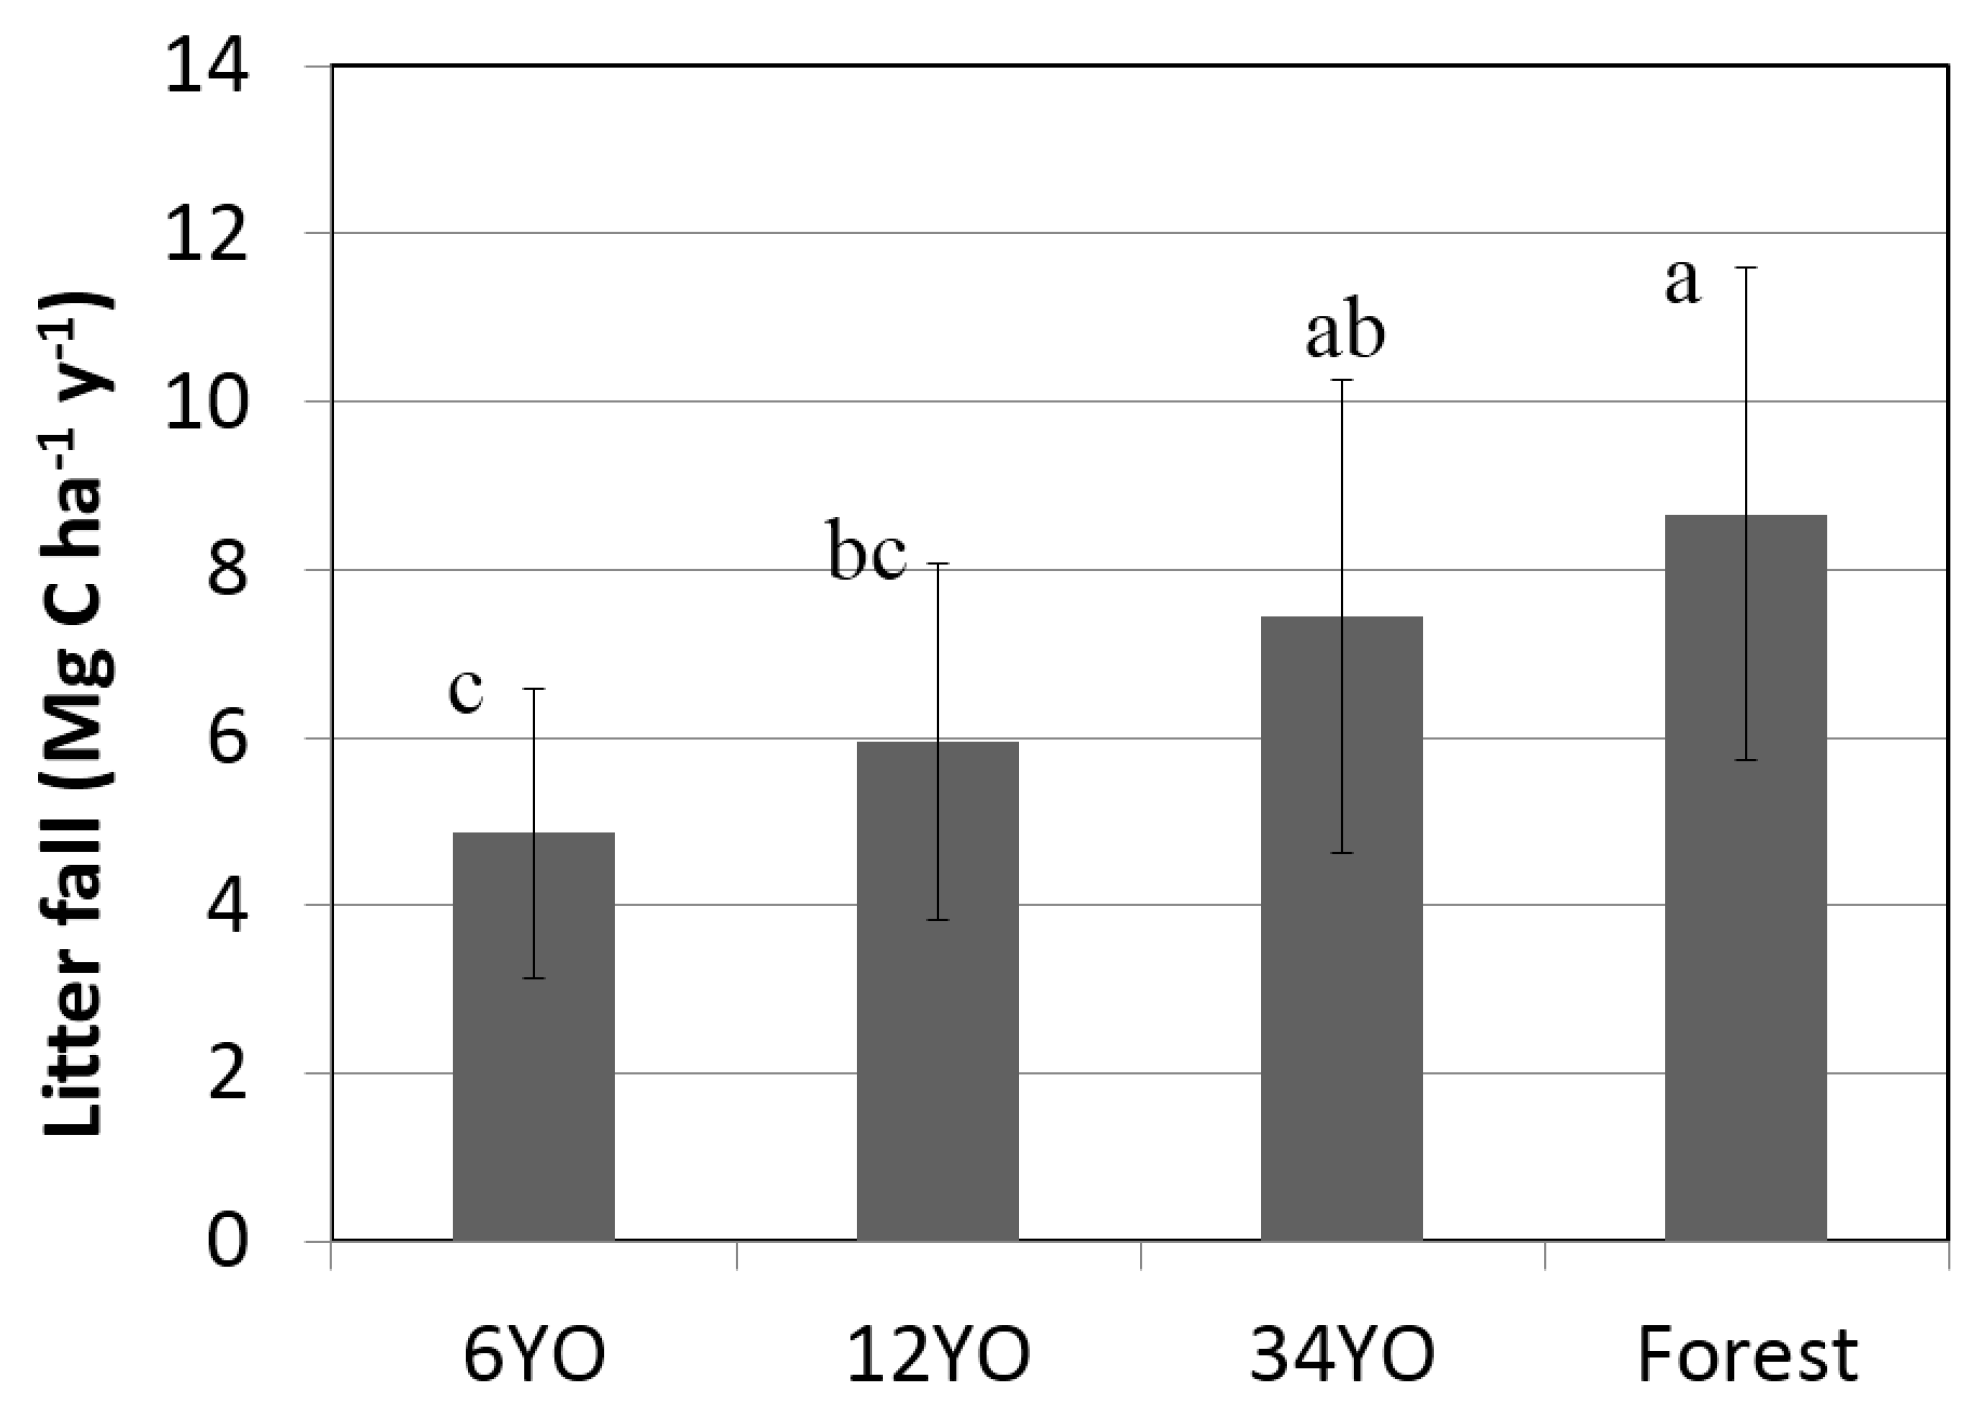
Annual litterfall increased with age of SAFS (Figure 2). Secondary forest and 34YO reached the highest values with 8.7 ± 2.9 and 7.4 ± 2.8 Mg·C·ha−1·year−1, respectively. A lower value was found in 12YO with 5.9 ± 2.1 Mg·C·ha−1·year−1. Litterfall was lowest in 6YO with 4.9 ± 1.7 Mg·C·ha−1·year−1.
Net primary productivity increased with age of SAFS. Highest values were recorded for Forest, 13.7–18.7 and lowest for 6YO, 9.8 ± 1.8 Mg·C·ha−1·year−1 (Table 5).
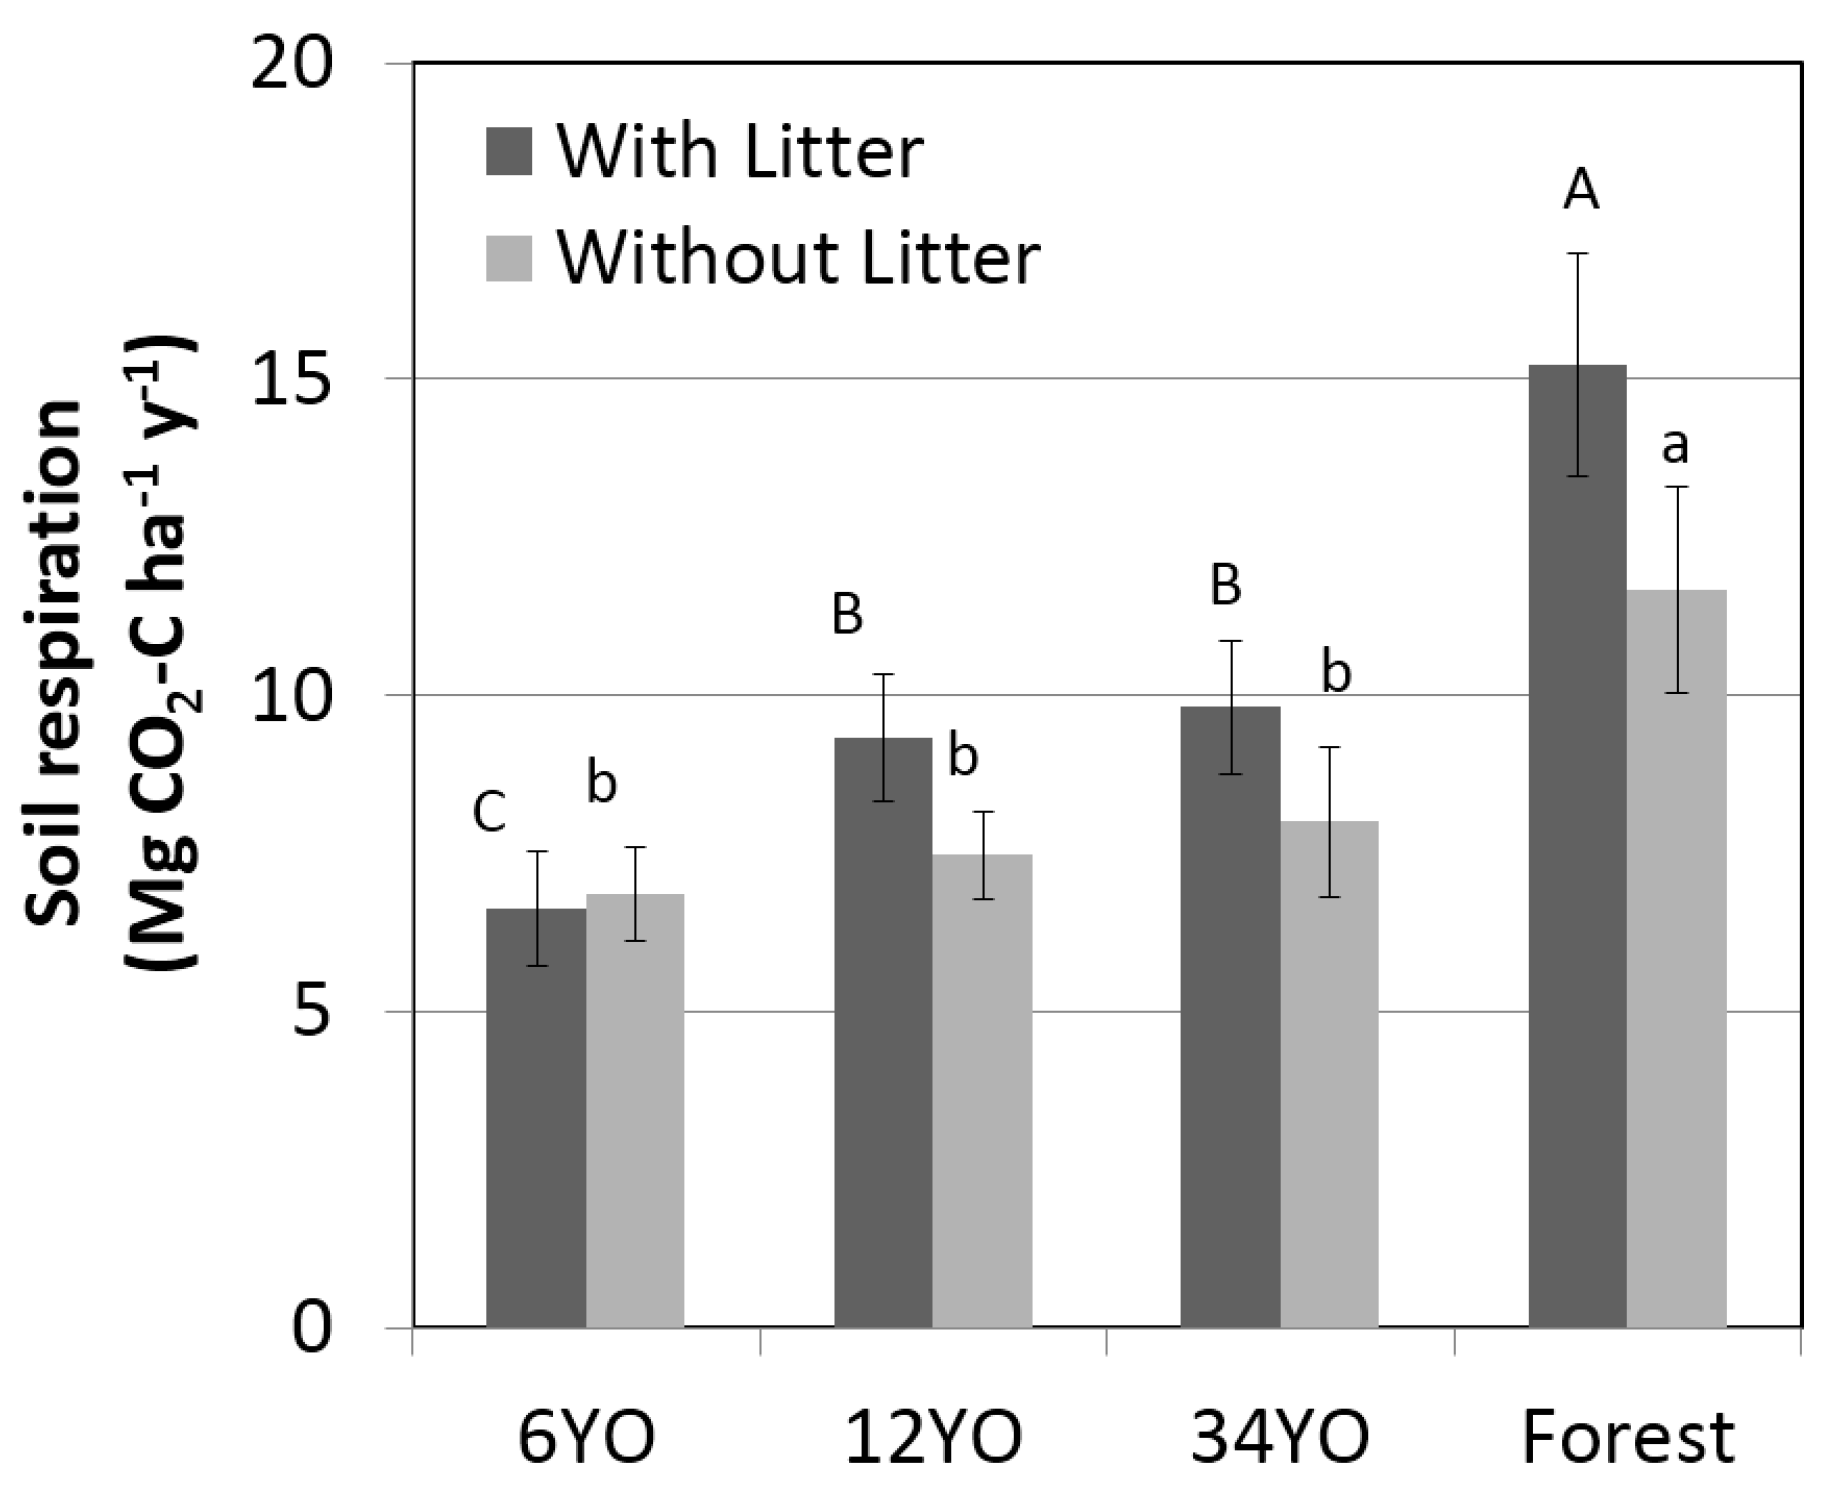
Soil respiration with litter increased with age of SAFS and was highest in the secondary forest with 15.2 ± 1.8 Mg·C·ha−1·year−1, followed by 34YO with 9.8 ± 1.0 Mg·C·ha−1·year−1 (Figure 3). 12YO and 6YO had lower values of 9.3 ± 1.0 and 6.6 ± 0.9 Mg·C·ha−1·year−1, respectively. Soil respiration without litter showed the same tendency and increased with age of SAFS, ranging from 6.9 ± 0.7 Mg·C·ha−1·year−1 in 6YO to 11.7 ± 1.6 Mg·C·ha−1·year−1 in the secondary forest. The difference between soil respiration with and without litter corresponds to soil litter respiration. While this was negligible in 6YO, it was similar in 12YO and 34YO, reaching 1.9 and 1.8 Mg·C·ha−1·year−1, respectively. The highest litter respiration was measured in the secondary forest, with 3.6 Mg·C·ha−1·year−1.
Net biome productivity based on Equation (1), using the measured values above, was highest in the secondary forest and ranged from 0.8 up to 12.8 Mg·C·ha−1·year−1 (Table 5). For 34YO, the value ranged from 1.8 to 8.2 Mg·C·ha−1·year−1. The lowest values were measured in 12YO and 6YO, ranging from 1.6 to 6.1 and 2.2 to 6.3 Mg·C·ha−1·year−1, respectively.
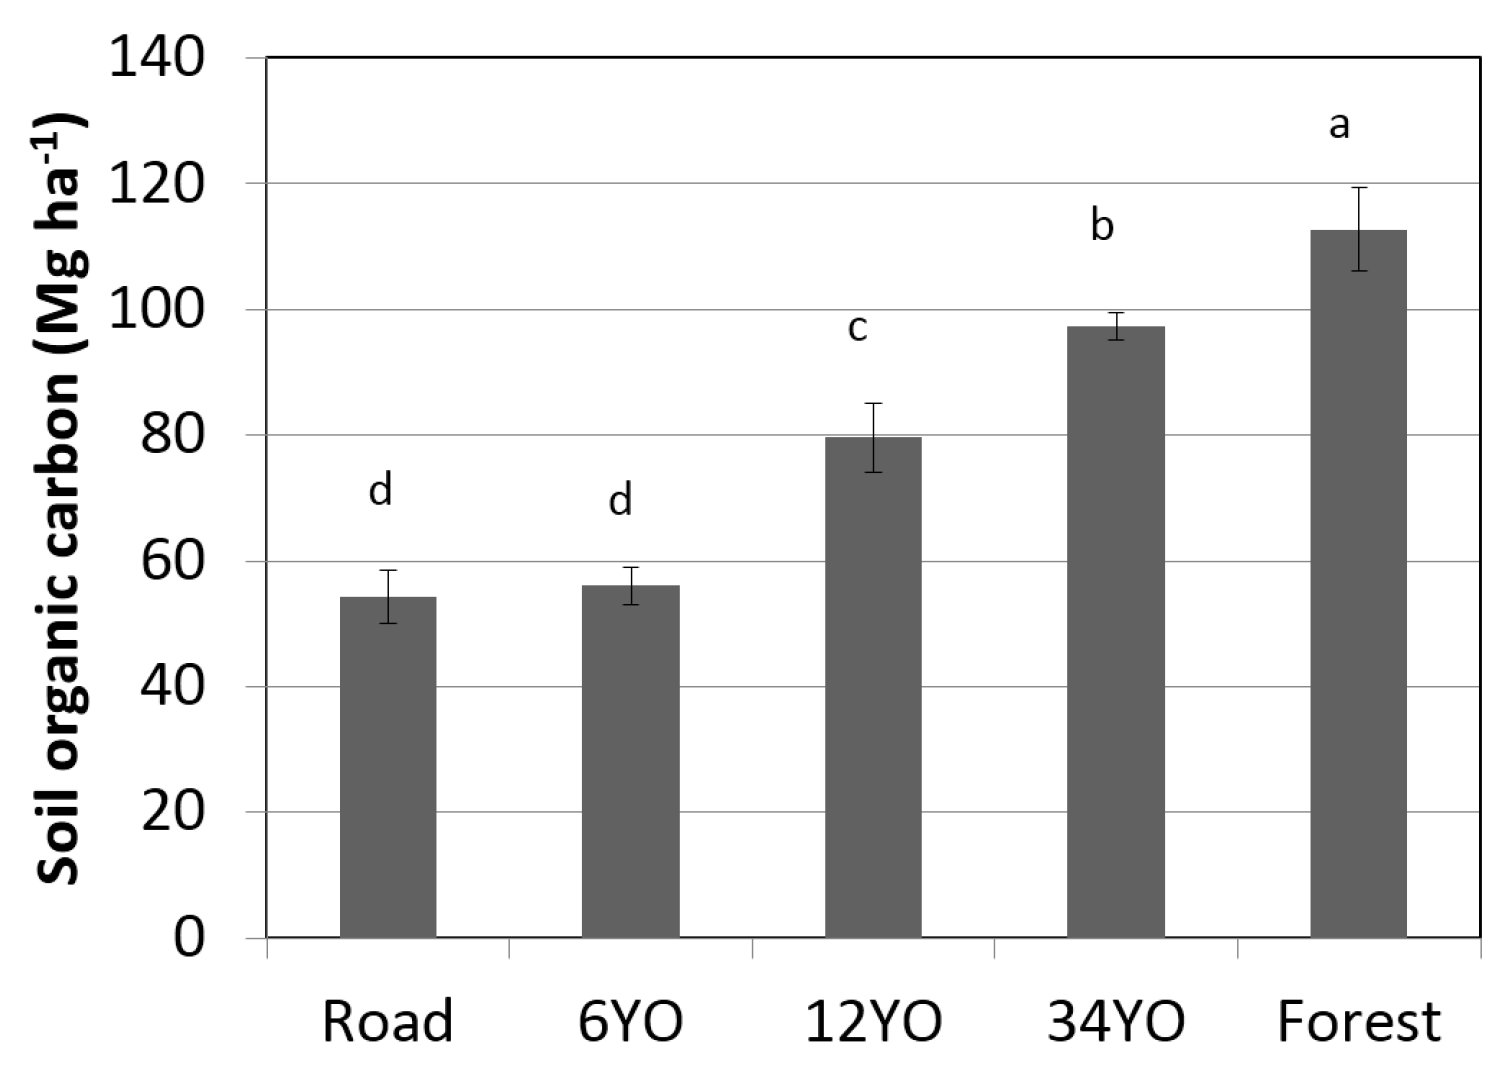
Soil organic carbon at equivalent soil mass 0–5000 Mg ha−1 significantly increased with age of SAFS and was highest in secondary forest with 112.7 ± 6.6 Mg·C·ha−1·year−1, followed by 34YO with 97.4 ± 2.2 Mg·C·ha−1·year−1 (Figure 4). 12YO reached 79.6 ± 5.5 Mg·C·ha−1·year−1. The lowest values were measured in 6YO and in the road with 56.0 ± 3.1 and 54.3 ± 4.2 Mg·C·ha−1·year−1, respectively.

4. Discussion

4.1. Changes in C Cycling during SAFS Development

In this study, we found that C cycling increased in SAFS with age because of two main reasons. Firstly, more plant biomass is produced every year in older systems (Table 5). This is in accordance with processes during successional regrowth of forest after deforestation where leaf area gradually develops and C accumulates in plant biomass, litter, and soil [29]. Secondly, soil respiration increases (Figure 2). This can be explained by the gradual development of microorganisms in the soil that feed on litterfall and exudates from tree roots [30,31]. As soil microorganisms decompose organic material, they make the nutrients available to roots again. Therefore, the amount of C above and below ground as well as the C mineralization increase in SAFS during their development, leading to increased C cycling.
The rate of aboveground C accumulation is greatest at the beginning of the reforestation and slowly declines with time, following an asymptotic curve [32]. Intensive accumulation of C in a re-establishing forest was also verified by Richter et al. [33]. It is therefore not surprising that in comparison with common agroforestry systems that combine only a few plant species, SAFS with numerous plant species and diverse canopy layers mimic forest ecosystem more successfully, utilize the available space more efficiently, and display higher yearly increases in both carbon stocks and biomass [16].

4.2. Changes in Soil Organic Carbon during SAFS Development

Soil organic carbon is an important indicator of soil quality and fertility [8,9]. In contrast to this research, Jacobi et al. [16] did not find significant differences in SOC between monoculture, simple agroforestry, SAFS, and fallow plots in Bolivia. This may be due to the different land use types before the establishment of SAFS and the lack of baseline data regarding the SOC contents in the plots before the SAFS. In our research, this problem is not an issue, as all plots were used for monoculture pepper cultivation before they were transformed into SAFS. In addition, the values of the road can be seen as the baseline data. Our results are further supported by studies done by Brown and Lugo [13] and DeGryze et al. [34] that confirm that SOC increases during succession.
The 6YO had no significant differences with the road, indicating that C accumulation had not progressed at this stage (Figure 4). On the other hand, the 34YO still had lower SOC compared to the forest. Soil carbon sink is the strongest soon after the enhanced land management system has been implemented and decreases with time as the saturation of the sink increases [35]. Time for saturation of soil carbon sink can vary dramatically according to climate conditions. In general, SOC is supposed to stabilize after 20 years [36]. However, the soil C sink under 34YO may not be saturated yet, as both the amount of litterfall and SOC were lower in comparison to that of the secondary forest (Figure 3 and Figure 4). Fertilizer was added at a rate of 40, 20, and 0 kg·N·ha−1·year−1 to the 6YO, 12YO, and 34YO, respectively. Despite this, NPP increased with age of the plots (Table 5), indicating that soil fertility improved under SAFS.

4.3. Changes in C Sequestration during SAFS Development

Agroforestry can be a sink or source of C, depending on the sink-source relationship that is influenced by present tree and crop species, silvopastoral or silvoarable characteristics of the system, or abiotic factors such as climate, soil properties, land cultivation history, and management practices [5]. Silvoarable systems are usually C sinks, while ruminant-based silvopastoral systems can be sources of C, particularly due to emission of greenhouse gases like CH4 [37].
In terms of global C sequestration, soil plays a key role because the amount of C stored in soils is greater than the amount of C stored in living plant biomass and the atmosphere combined [38]. Carbon in soils is also much more stable and can persist there for more than 1000 years [39]. In our study, we found that SAFS increase SOC with time (Figure 4). There are studies that found decreased values in SOC after afforestation [40,41,42], while there are also studies that show an increase in SOC connected with afforestation [43,44,45]. In their meta-analysis, Laganière et al. [46] concluded that the rate of SOC increase during afforestation depends on numerous factors. Previous land use, tree species, soil clay content, pre-planting disturbance, and climatic zone all affect the rate of recovery of SOC. The most important of these factors is land use history before afforestation. According to Laganière et al. [46], afforestation after cropland accumulates SOC better than after pastures or grasslands and broadleaf trees accumulate SOC better than coniferous trees. These claims are in accordance with our results that show an increase in SOC during afforestation with SAFS. Before establishment of SAFS, all the parcels were used as pepper monoculture cropland and all the trees in SAFS were broadleaf species.
Not only is SOC important in terms of C sequestration, increases in both NPP and NBP with SAFS stages (Table 5) is also important in evaluating the ability to sequester C of different SAFS stages. Forests are capable of storing large amounts of C [7]. The positive NPP and NBP in SAFS in this study can be explained by the fact that SAFS is a tree-based agricultural system, similar in its structure and function to forest. As the trees grow, their photosynthetic surface increases and they are able to sequester C more intensively [29]. Accumulated C and other nutrients are then transported into the soil through litterfall, root turnover, and root exudates [31,47]. The big range of value in the calculated NBP exhibits a high uncertainty, however, even with this uncertainty, the positive NBP value shows that SAFS has a high ability for C sequestration. Similar conclusions were made by Lorenz and Lal [29] when they described gradual accumulation of soil and plant C in forests during secondary succession by asymptotic curve.

5. Conclusions

This study compared different successional stages of SAFS, mapped their C flows, and assessed their ability to improve soil fertility and sequester C. Results indicated that with increasing age of SAFS, their ability to sequester, accumulate, and recycle C and nutrients increases. Raised pools of nutrients coupled with their more dynamic turnover lead to reduced reliance on external fertilizer inputs. In time, SAFS are able to produce more biomass with less fertilizer, implying high resource use efficiency.
Soils under mature SAFS had significantly higher concentrations of SOC, resulting in higher quality soils. SAFS therefore were shown to be an innovative agricultural system, capable of improving vulnerable tropical soils, and at the same time sequestering C. In terms of preventing soil degradation in tropical regions, SAFS are a promising land use system.

Author Contributions

Yuji Kobata prepared the monitoring materials and supervised the monitoring work conducted by Dinaldo A. dos Santos. Helio M. Umemura collected the farm related management data. Masaaki Yamada contributed to the setup of the study and supported the study’s implementation. All sample materials were analyzed by Iraê A. Guerrini in UNESP. Tomas Selecky wrote the paper and analyzed the data under the supervision of Sonoko D. Bellingrath-Kimura, who coordinated the whole study from beginning to end.

Conflicts of Interest

The authors declare no conflict of interest.

Abbreviations

The following abbreviations are used in this manuscript:
6YO6-year-old system
12YO12-year-old system
34YO34-year-old system
AGBabove ground biomass (kg)
AGBI (2014–2013)aboveground biomass increase from 2013 to 2014
Aveaverage
CCarbon
CO2carbon dioxide
Dbdiameter of the first biggest branch (cm)
DBHdiameter at breast height (cm)
Dsstem diameter at 50 cm height (cm)
EFexported fruit
FRfruit residue
Htree height (m)
LFlitterfall
NBPnet biome productivity
NPPnet primary productivity
SAFSSuccessional agroforestry systems
SDstandard deviation
SOCSoil organic carbon
SRsoil respiration

References

  1. Glaser, B.; Haumaier, L.; Guggenberger, G.; Zech, W. The “Terra Preta” phenomenon: A model for sustainable agriculture in the humid tropics. Naturwissenschaften 2014, 88, 37–41. [Google Scholar] [CrossRef]
  2. Darkoh, M.B.K. The nature, causes and consequences of desertification in the drylands of Africa. Land Degrad. Dev. 1998, 9, 1–20. [Google Scholar] [CrossRef]
  3. Yamada, M.; Gholz, H.L. An evaluation of agroforestry systems as a rural development option for the Brazilian Amazon. Agrofor. Syst. 2002, 55, 81–87. [Google Scholar] [CrossRef]
  4. Vieira, D.L.; Holl, K.D.; Peneireiro, F.M. Agro-Successional Restoration as a Strategy to Facilitate Tropical Forest Recovery. Restor. Ecol. 2009, 17, 451–459. [Google Scholar] [CrossRef]
  5. Atangana, A.; Khasa, D.; Chang, S.; Degrande, A. Carbon Sequestration in Agroforestry Systems. In Tropical Agroforestry; Springer: Dordrecht, The Netherlands, 2014; pp. 217–225. [Google Scholar]
  6. Palm, C.; Tomich, T.; van Noordwijk, M.; Vosti, S.; Gockowski, J.; Alegre, J.; Verchot, L. Mitigating GHG emissions in the humid tropics: Case studies from the Alternatives to Slash-and-Burn Program (ASB). Environ. Dev. Sustain. 2004, 6, 145–162. [Google Scholar] [CrossRef]
  7. Kirby, K.R.; Potvin, C. Variation in carbon storage among tree species: Implications for the management of a small-scale carbon sink project. For. Ecol. Manag. 2007, 246, 208–221. [Google Scholar] [CrossRef]
  8. Reeves, D.W. The role of soil organic matter in maintaining soil quality in continuous cropping systems. Soil Tillage Res. 1997, 43, 131–167. [Google Scholar] [CrossRef]
  9. Brock, C.; Fließbach, A.; Oberholzer, H.-R.; Schulz, F.; Wiesinger, K.; Reinicke, F.; Koch, W.; Pallutt, B.; Dittman, B.; Zimmer, J.; et al. Relation between soil organic matter and yield levels of nonlegume crops in organic and conventional farming systems. J. Plant Nutr. Soil Sci. 2011, 174, 568–575. [Google Scholar] [CrossRef]
  10. Campbell, C.A. Soil organic carbon, nitrogen and fertility. Dev. Soil Sci. 1978, 8, 173–271. [Google Scholar]
  11. Karlen, D.L.; Mausbach, M.J.; Doran, J.W.; Cline, R.G.; Harris, R.F.; Schuman, G.E. Soil quality: A concept, definition, and framework for evaluation (a guest editorial). Soil Sci. Soc. Am. J. 1997, 61, 4–10. [Google Scholar] [CrossRef]
  12. Mills, A.J.; Fey, M.V. Declining soil quality in South Africa: Effects of land use on soil organic matter and surface crusting. S. Afr. J. Plant Soil 2004, 21, 388–398. [Google Scholar] [CrossRef]
  13. Brown, S.; Lugo, A.E. Effects of forest clearing and succession on the carbon and nitrogen content of soils in Puerto Rico and US Virgin Islands. Plant Soil 1990, 124, 53–64. [Google Scholar] [CrossRef]
  14. Mosquera-Losada, M.R.; Freese, D.; Rigueiro-Rodríguez, A. Carbon Sequestration in European Agroforestry Systems. In Carbon Sequestration Potential of Agroforestry Systems; Kumar, B.M., Nair, P.K.R., Eds.; Springer: Dordrecht, The Netherlands, 2011; Volume 8, pp. 43–59. [Google Scholar]
  15. Gupta, N.; Kukal, S.S.; Bawa, S.S.; Dhaliwal, G.S. Soil organic carbon and aggregation under poplar based agroforestry system in relation to tree age and soil type. Agrofor. Syst. 2009, 76, 27–35. [Google Scholar] [CrossRef]
  16. Jacobi, J.; Andres, C.; Schneider, M.; Pillco, M.; Calizaya, P.; Rist, S. Carbon stocks, tree diversity, and the role of organic certification in different cocoa production systems in Alto Beni, Bolivia. Agrofor. Syst. 2014, 88, 1117–1132. [Google Scholar] [CrossRef]
  17. Schulz, B.; Becker, B.; Götsch, E. Indigenous knowledge in a “modern” sustainable agroforestry system—A case study from eastern Brazil. Agrofor. Syst. 1994, 25, 59–69. [Google Scholar] [CrossRef]
  18. Peneireiro, F.M. Sistemas Agroflorestais Dirigidos Pela Sucessão Natural: Um Estudo de Caso; Universidade de São Paulo: Sao Paulo, Brazil, 1999. [Google Scholar]
  19. Quelca, A.S.; Gama, M.B.; Pastrana, A.; Ochoa, R. Percepciones y Valoración del Sistema Sucesional Multiestrato de los Productores Cacaoteros del Alto Beni, Bolivia. Agrofor. en las Am. 2005, 43–44, 77–80. [Google Scholar]
  20. Nair, P.K.R.; Mohan Kumar, B.; Nair, V.D. Agroforestry as a strategy for carbon sequestration. J. Plant Nutr. Soil Sci. 2009, 172, 10–23. [Google Scholar] [CrossRef]
  21. Baena, A.R.C.; Falesi, I.C. Avaliação do Potencial Químico e Físico dos Solos sob Diversos Sistemas de uso da Terra na Colônia Agrícola de Tomé-Açu, Estado do Pará; Embrapa Amazônia Oriental: Belém, Brazil, 1999; p. 23. [Google Scholar]
  22. Schulze, E.D.; Heimann, M. Carbon and water exchange of terrestrial ecosystems. In Asian Change in the Context of Global Climate Change: Impact of Natural and Anthropogenic Changes in Asia on Global Biogeochemical Cycles; Galloway, J., Melillo, J., Eds.; Cambridge University Press: Cambridge, UK, 1998; pp. 145–161. [Google Scholar]
  23. Subler, S. Allometric equations for estimating the above ground biosmass of cacao stands in the eastern Amazon Basin. Agrotrópica 1994, 6, 65–72. [Google Scholar]
  24. Brown, S.; Gillespie, A.J.R.; Lugo, A.E. Biomass estimation methods for tropical forests with applications to forest inventory data. For. Sci. 1989, 35, 881–902. [Google Scholar]
  25. Brown, S. Estimating biomass and biomass change of tropical forest: A primer; Food and Agriculture Organization of the United Nations (FAO): Rome, Italy; pp. 1–55.
  26. Hanson, P.J.; Edwards, N.T.; Garten, C.T.; Andrews, J.A. Separating root and soil microbial contributions to soil respiration: A review of methods and observations. Biogeochemistry 2000, 48, 115–146. [Google Scholar] [CrossRef]
  27. Wendt, J.W.; Hauser, S. An equivalent soil mass procedure for monitoring soil organic carbon in multiple soil layers. Eur. J. Soil Sci. 2013, 64, 58–65. [Google Scholar] [CrossRef]
  28. Wendt, J.W. ESM Sample Spreadsheets. Xlsm. Available online: https://drive.google.com/file/d/0BzxNFfzLbFxjSG9RWlpwQ0FXc0k/view (accessed on 30 August 2016).
  29. Lorenz, K.; Lal, R. Carbon Sequestration in Forest Ecosystems; Springer: Dordrecht, The Netherlands, 2010. [Google Scholar]
  30. Lemieux, G. The Hidden World that feeds us: The living soil. Coord. Group Ramial Wood Laval Univ. Can. Publ. 1996, 46, 1–38. [Google Scholar]
  31. Grayston, S.J.; Vaughan, D.; Jones, D. Rhizosphere carbon flow in trees, in comparison with annual plants: The importance of root exudation and its impact on microbial activity and nutrient availability. Appl. Soil Ecol. 1997, 5, 29–56. [Google Scholar] [CrossRef]
  32. Silver, W.L.; Ostertag, R.; Lugo, A.E. The Potential for Carbon Sequestration through Reforestation of Abandoned Tropical Agricultural and Pasture Lands. Restor. Ecol. 2000, 8, 394–407. [Google Scholar] [CrossRef]
  33. Richter, D.D.; Markewitz, D.; Trumbore, S.E.; Wells, C.G. Rapid accumulation and turnover of soil carbon in a re-establishing forest. Nature 1999, 400, 56–58. [Google Scholar] [CrossRef]
  34. De Gryze, S.; Six, J.; Paustian, K.; Morris, S.J.; Paul, E.A.; Merckx, R. Soil organic carbon pool changes following land-use conversions. Glob. Chang. Biol. 2004, 10, 1120–1132. [Google Scholar] [CrossRef]
  35. Braimoh, A.K.; Vlek, P. Land Use and Soil Resources; Springer: Berlin/Heidelberg, Germany, 2008. [Google Scholar]
  36. IPCC. IPCC Guidelines for National Greenhouse Gas Inventories (3 Volumes); IPCC: Geneva, Switzerland, 1997. [Google Scholar]
  37. Dixon, R.K. Agroforestry systems: Sources or sinks of greenhouse gases? Agrofor. Syst. 1995, 31, 99–116. [Google Scholar] [CrossRef]
  38. Jobbagy, E.G.; Jackson, R.B. The Vertical Distribution of Soil Organic Carbon and Its Relation to Climate and Vegetation. Ecol. Appl. 2000, 10, 423. [Google Scholar] [CrossRef]
  39. Lutzow, M.V.; Kogel-Knabner, I.; Ekschmitt, K.; Matzner, E.; Guggenberger, G.; Marschner, B.; Flessa, H. Stabilization of organic matter in temperate soils: Mechanisms and their relevance under different soil conditions—A review. Eur. J. Soil Sci. 2006, 57, 426–445. [Google Scholar] [CrossRef]
  40. Perrott, K.W.; Ghani, A.; O’connor, M.B.; Waller, J.E.; Hawke, M.F. Tree stocking effects on soil chemical and microbial properties at the Tikitere Agroforestry Research Area. N. Z. J. For. Sci. 1999, 29, 116–130. [Google Scholar]
  41. Farley, K.A.; Kelly, E.F.; Hofstede, R.G.M. Soil Organic Carbon and Water Retention after Conversion of Grasslands to Pine Plantations in the Ecuadorian Andes. Ecosystems 2004, 7, 729–739. [Google Scholar] [CrossRef]
  42. Parfitt, R.L.; Percival, H.J.; Dahlgren, R.A.; Hill, L.F. Soil and solution chemistry under pasture and radiata pine in New Zealand. Plant Soil 1999, 191, 279–290. [Google Scholar] [CrossRef]
  43. Del Galdo, I.; Six, J.; Peressotti, A.; Francesca Cotrufo, M. Assessing the impact of land-use change on soil C sequestration in agricultural soils by means of organic matter fractionation and stable C isotopes. Glob. Chang. Biol. 2003, 9, 1204–1213. [Google Scholar] [CrossRef]
  44. Lemma, B.; Kleja, D.B.; Nilsson, I.; Olsson, M. Soil carbon sequestration under different exotic tree species in the southwestern highlands of Ethiopia. Geoderma 2006, 136, 886–898. [Google Scholar] [CrossRef]
  45. Grünzweig, J.M.; Gelfand, I.; Fried, Y.; Yakir, D. Biogeochemical factors contributing to enhanced carbon storage following afforestation of a semi-arid shrubland. Biogeosciences 2007, 4, 891–904. [Google Scholar] [CrossRef]
  46. Laganière, J.; Angers, D.A.; Paré, D. Carbon accumulation in agricultural soils after afforestation: A meta-analysis. Glob. Chang. Biol. 2010, 16, 439–453. [Google Scholar] [CrossRef]
  47. Edwards, N.T.; Harris, W.F. Carbon Cycling in a Mixed Deciduous Forest Floor. Ecology 1977, 58, 431–437. [Google Scholar] [CrossRef]
Figure 1. Layout of the plants of the different SAFS stages. (the planting density of Mahogany at 34YO was 9 m by 9 m). 6YO, 6-year-old system; 12YO, 12-year-old system; 34YO, 34-year-old system.
Agriculture 07 00025 g001
Figure 2. Litterfall measured in different SAFS stages. No significant difference for bars sharing the same letter by one-way ANOVA (F(3,80) = 6.539, p = 0.001) followed by Tukey’s post-hoc test.
Agriculture 07 00025 g002
Figure 3. Soil respiration measured in different SAFS stages. Different letters indicate significant differences among the age groups (p < 0.05, Welch’s ANOVA followed by Games-Howell post-hoc test), where capital letters stand for treatments with litter, and small letters stand for treatments without litter.
Agriculture 07 00025 g003
Figure 4. Soil organic carbon content in different SAFS stages at equivalent soil mass 0–5000 Mg·ha−1 (approx. 30 cm depth). No significant difference for bars sharing the same letter by one-way ANOVA (F(4,15) = 122.907, p = 0.000) followed by Tukey’s post-hoc test.
Agriculture 07 00025 g004
Table 1. Planting densities of main crops in agroforestry systems of different ages (trees·ha−1).
Species6YO12YO34YO
Theobroma cacao (Cacao)625.01111.11111.1
Swietenia macrophylla (Mahogany)208.3277.8123.5 *
Euterpe oleracea (Acai) 277.8277.8
Musa acuminata (Banana)625.0
Piper nigrum (Pepper)1250.0
* The planting density of Mahogany at 34YO was 9 m by 9 m; 6YO, 6-year-old system; 12YO, 12-year-old system; 34YO, 34-year-old system.
Table 2. Allometric formulas used to calculate aboveground biomass increase.
SpeciesFormulaSource
CacaoLog(Biomass) = −1.81 + 2.13log(Db + Ds)[23]
MahoganyAGB = exp(−3.1141 + 0.9719 × ln(DBH2 × H))[24]
AcaiAGB = 10 + 6.4 × H[25]
AGB, above ground biomass (kg); DBH, diameter at breast height (cm); H, tree height (m); Db, diameter of the first biggest branch (cm); Ds, stem diameter at 50 cm height (cm).
Table 3. Carbon in exported fruit and residue from different SAFS stages (Mg·C·ha−1·year−1).
6YO12YO34YO
Ave SDAve SDAve SD
Exported fruit and fruit residueCacao1.7±0.43.7±0.82.9±0.7
Acai 1.5±0.61.6±0.6
Pepper1.0±0.2
Sum 2.7±0.55.2±1.04.5±0.9
Exported fruitCacao1.3±0.42.9±0.62.3±0.6
Acai 1.1±0.41.2±0.4
Pepper1.0±0.2
Sum 2.3±0.44.1±0.83.5±0.7
Ave, average; SD, standard deviation.
Table 4. Biomass increase from different tree species in different SAFS stages (Mg·C·ha−1·year−1).
6YO12YO34YO
Ave SDAve SDAve SD
Cacao0.9±0.30.7±0.30.9±0.5
Mahogany0.9±0.20.8±0.40.2±0.1
Acai 0.8±0.30.5±0.2
Banana0.5±0.1
Sum2.3±0.42.3±0.61.6±0.5
Table 5. Net primary productivity (NPP) and net biome productivity (NBP) of different SAFS stages and secondary forest (Mg·C·ha−1·year−1).
6YO12YO34YOForest
Ave SDAve SDAve SDAve SD
Above ground biomass increase (1)2.3±0.42.3±0.61.6±0.55.0~10.0
Exported fruit and fruit residue2.7±0.55.2±1.04.5±0.9
Litterfall4.9±1.75.9±2.17.4±2.88.7±2.9
NPP9.8±1.813.5±2.413.5±3.013.7~18.7
Exported fruit2.3±0.44.1±0.83.5±0.7
Litter respiration−0.2±1.21.9±1.21.8±1.63.6±2.4
Soil heterotrophic respiration (2)1.45.51.56.01.66.42.39.3
Total C output3.57.67.411.95.311.75.912.9
NBP2.26.31.66.11.88.20.812.8
NPP, net primary productivity; NBP, net biome productivity; Ave, average; SD, standard deviation. (1) Since above ground biomass increase was not determined for the forest, a wide range of 5–10 Mg·C·ha−1·year−1 was adopted; (2) 20%–80% of soil respiration can be attributed to autotrophic (root) respiration [26]. Only heterotrophic respiration is used to count NBP. Symbol “~” is thus used to designate the range of its possible values.

