Side Effects of Curcumin: Epigenetic and Antiproliferative Implications for Normal Dermal Fibroblast and Breast Cancer Cells

 , and
, and 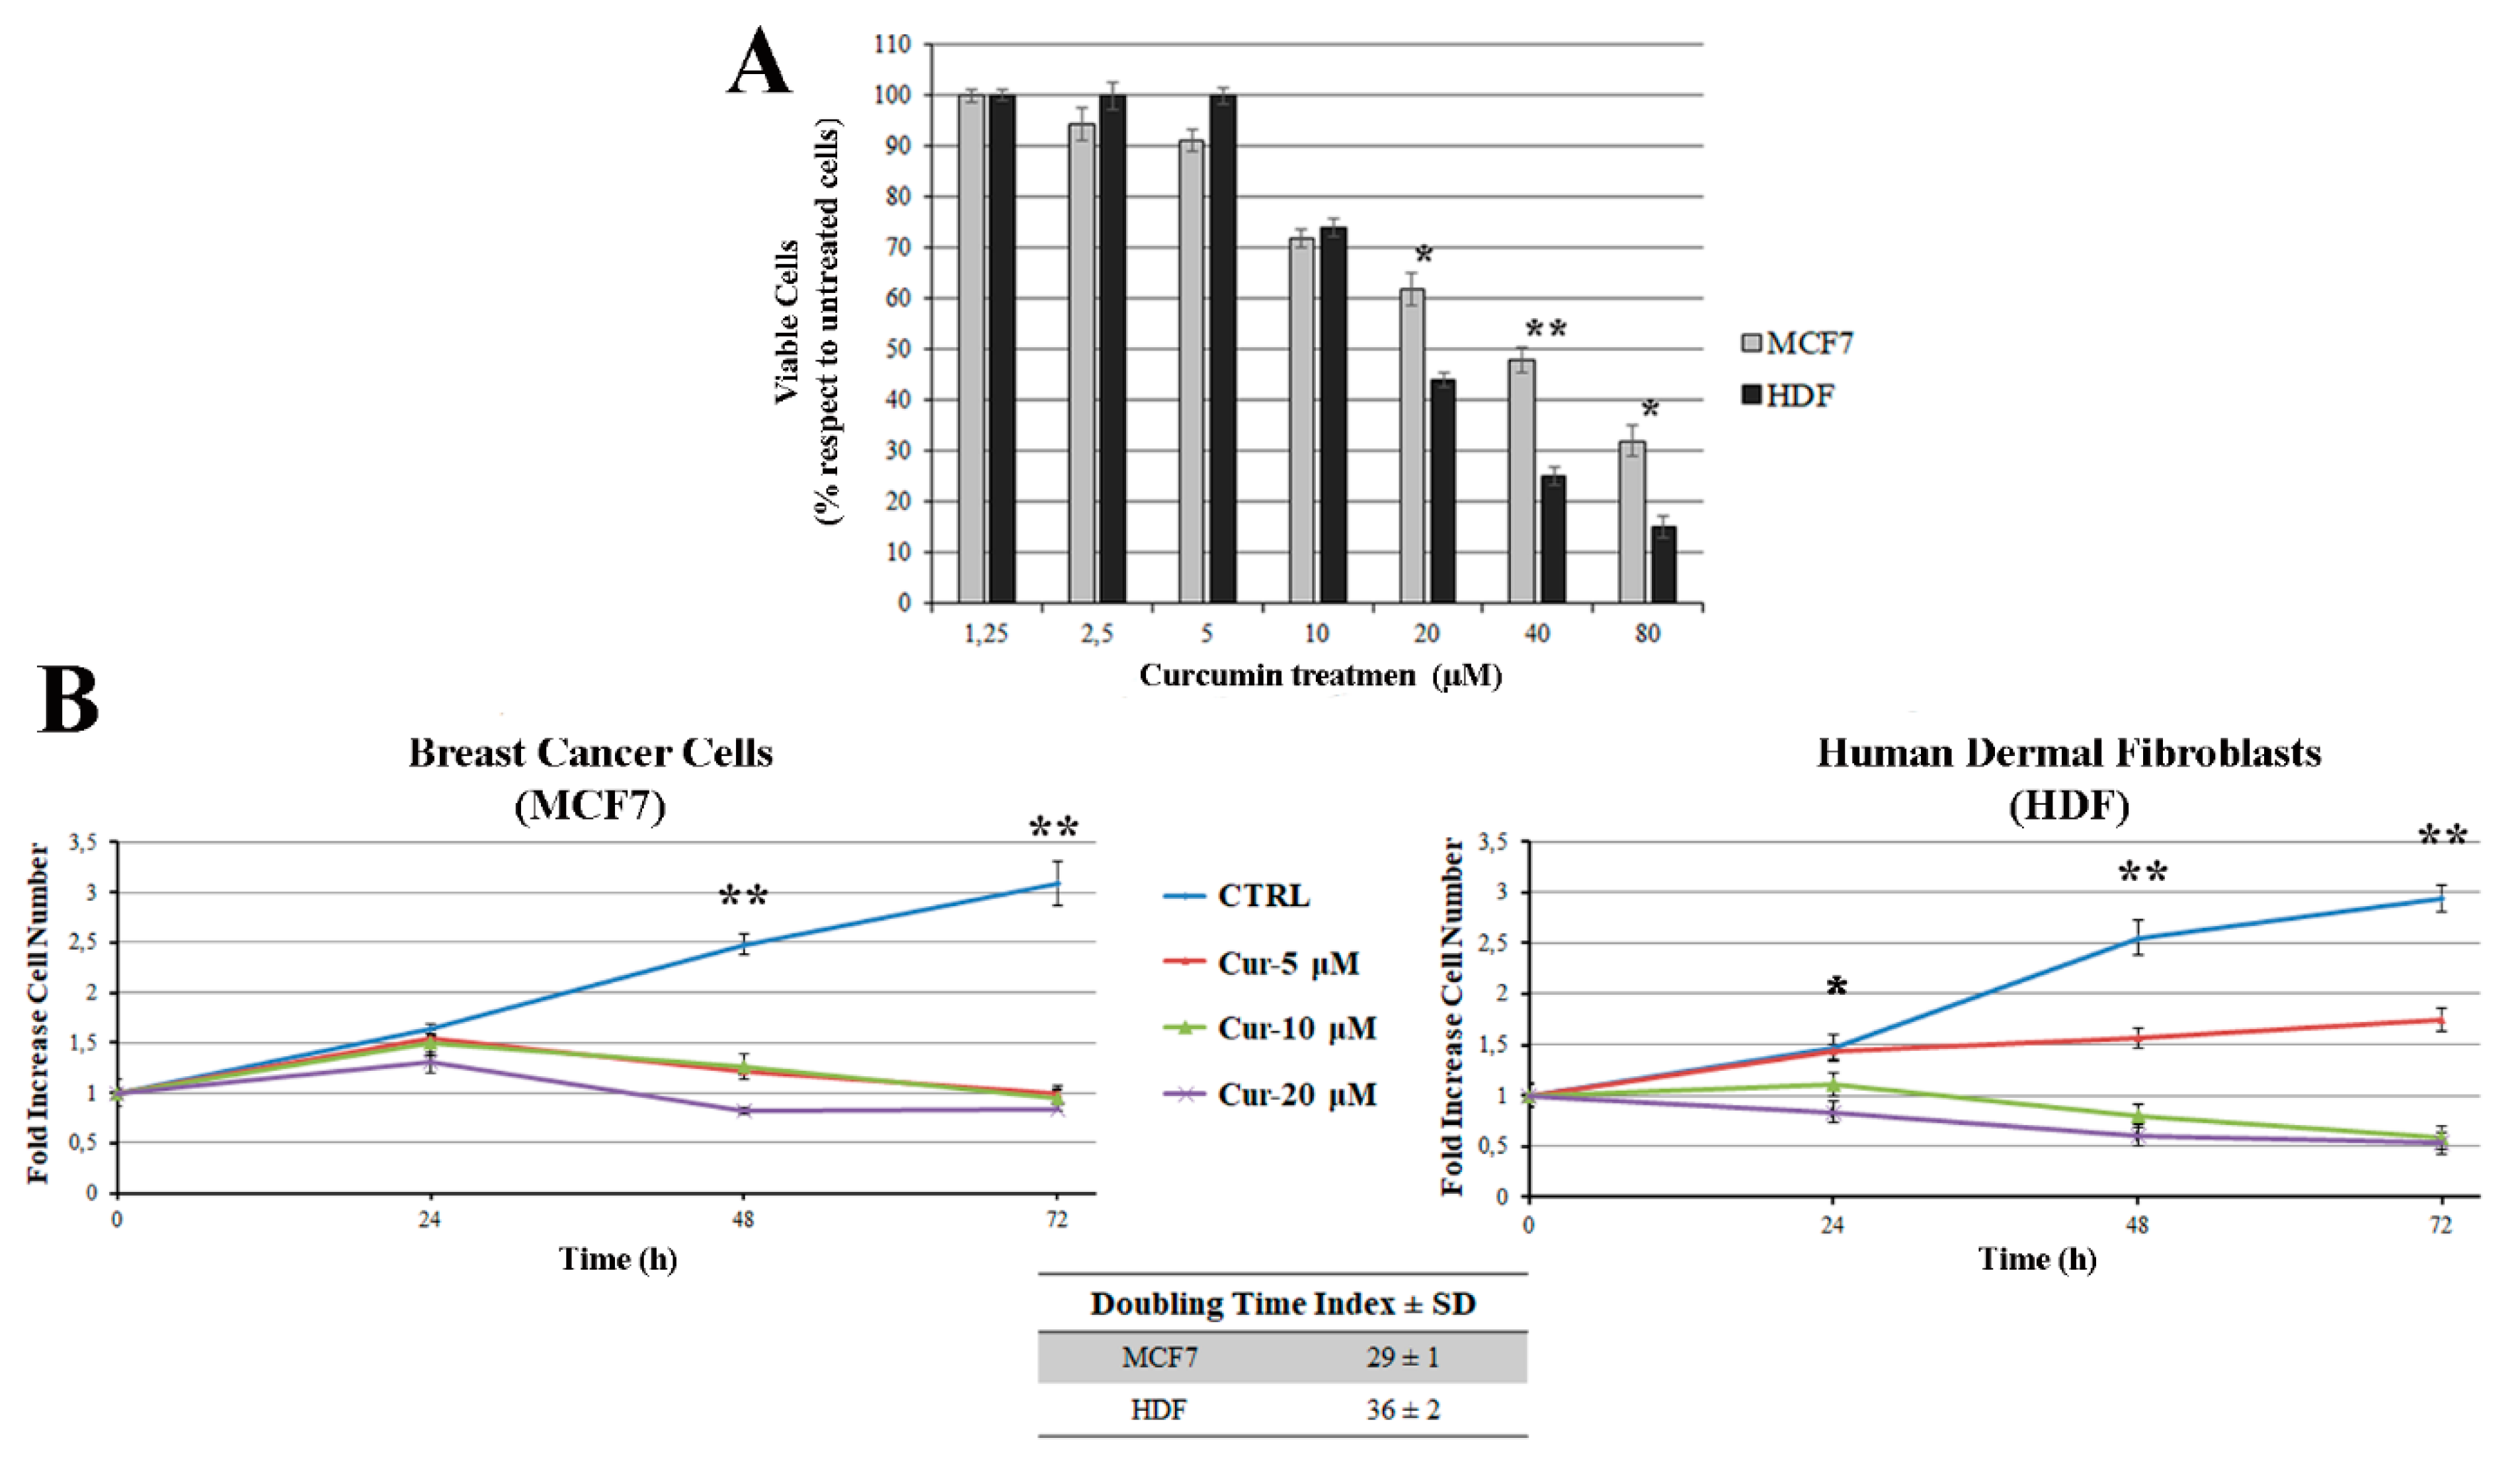
Abstract
:1. Introduction
2. Materials and Methods
2.1. Reagents
2.2. Cell Culture and Curcumin Treatment
2.3. Cell Growth and Viability (MTT Assay)
2.4. Cell Cycle Analysis
2.5. Apoptosis Analysis
2.6. Histone Acetylation
2.7. Immunoblotting
2.8. Glutathione Assay
2.9. Statistical Analyses
3. Results and Discussion
3.1. Curcumin Inhibits Cell Viability and Cell Growth
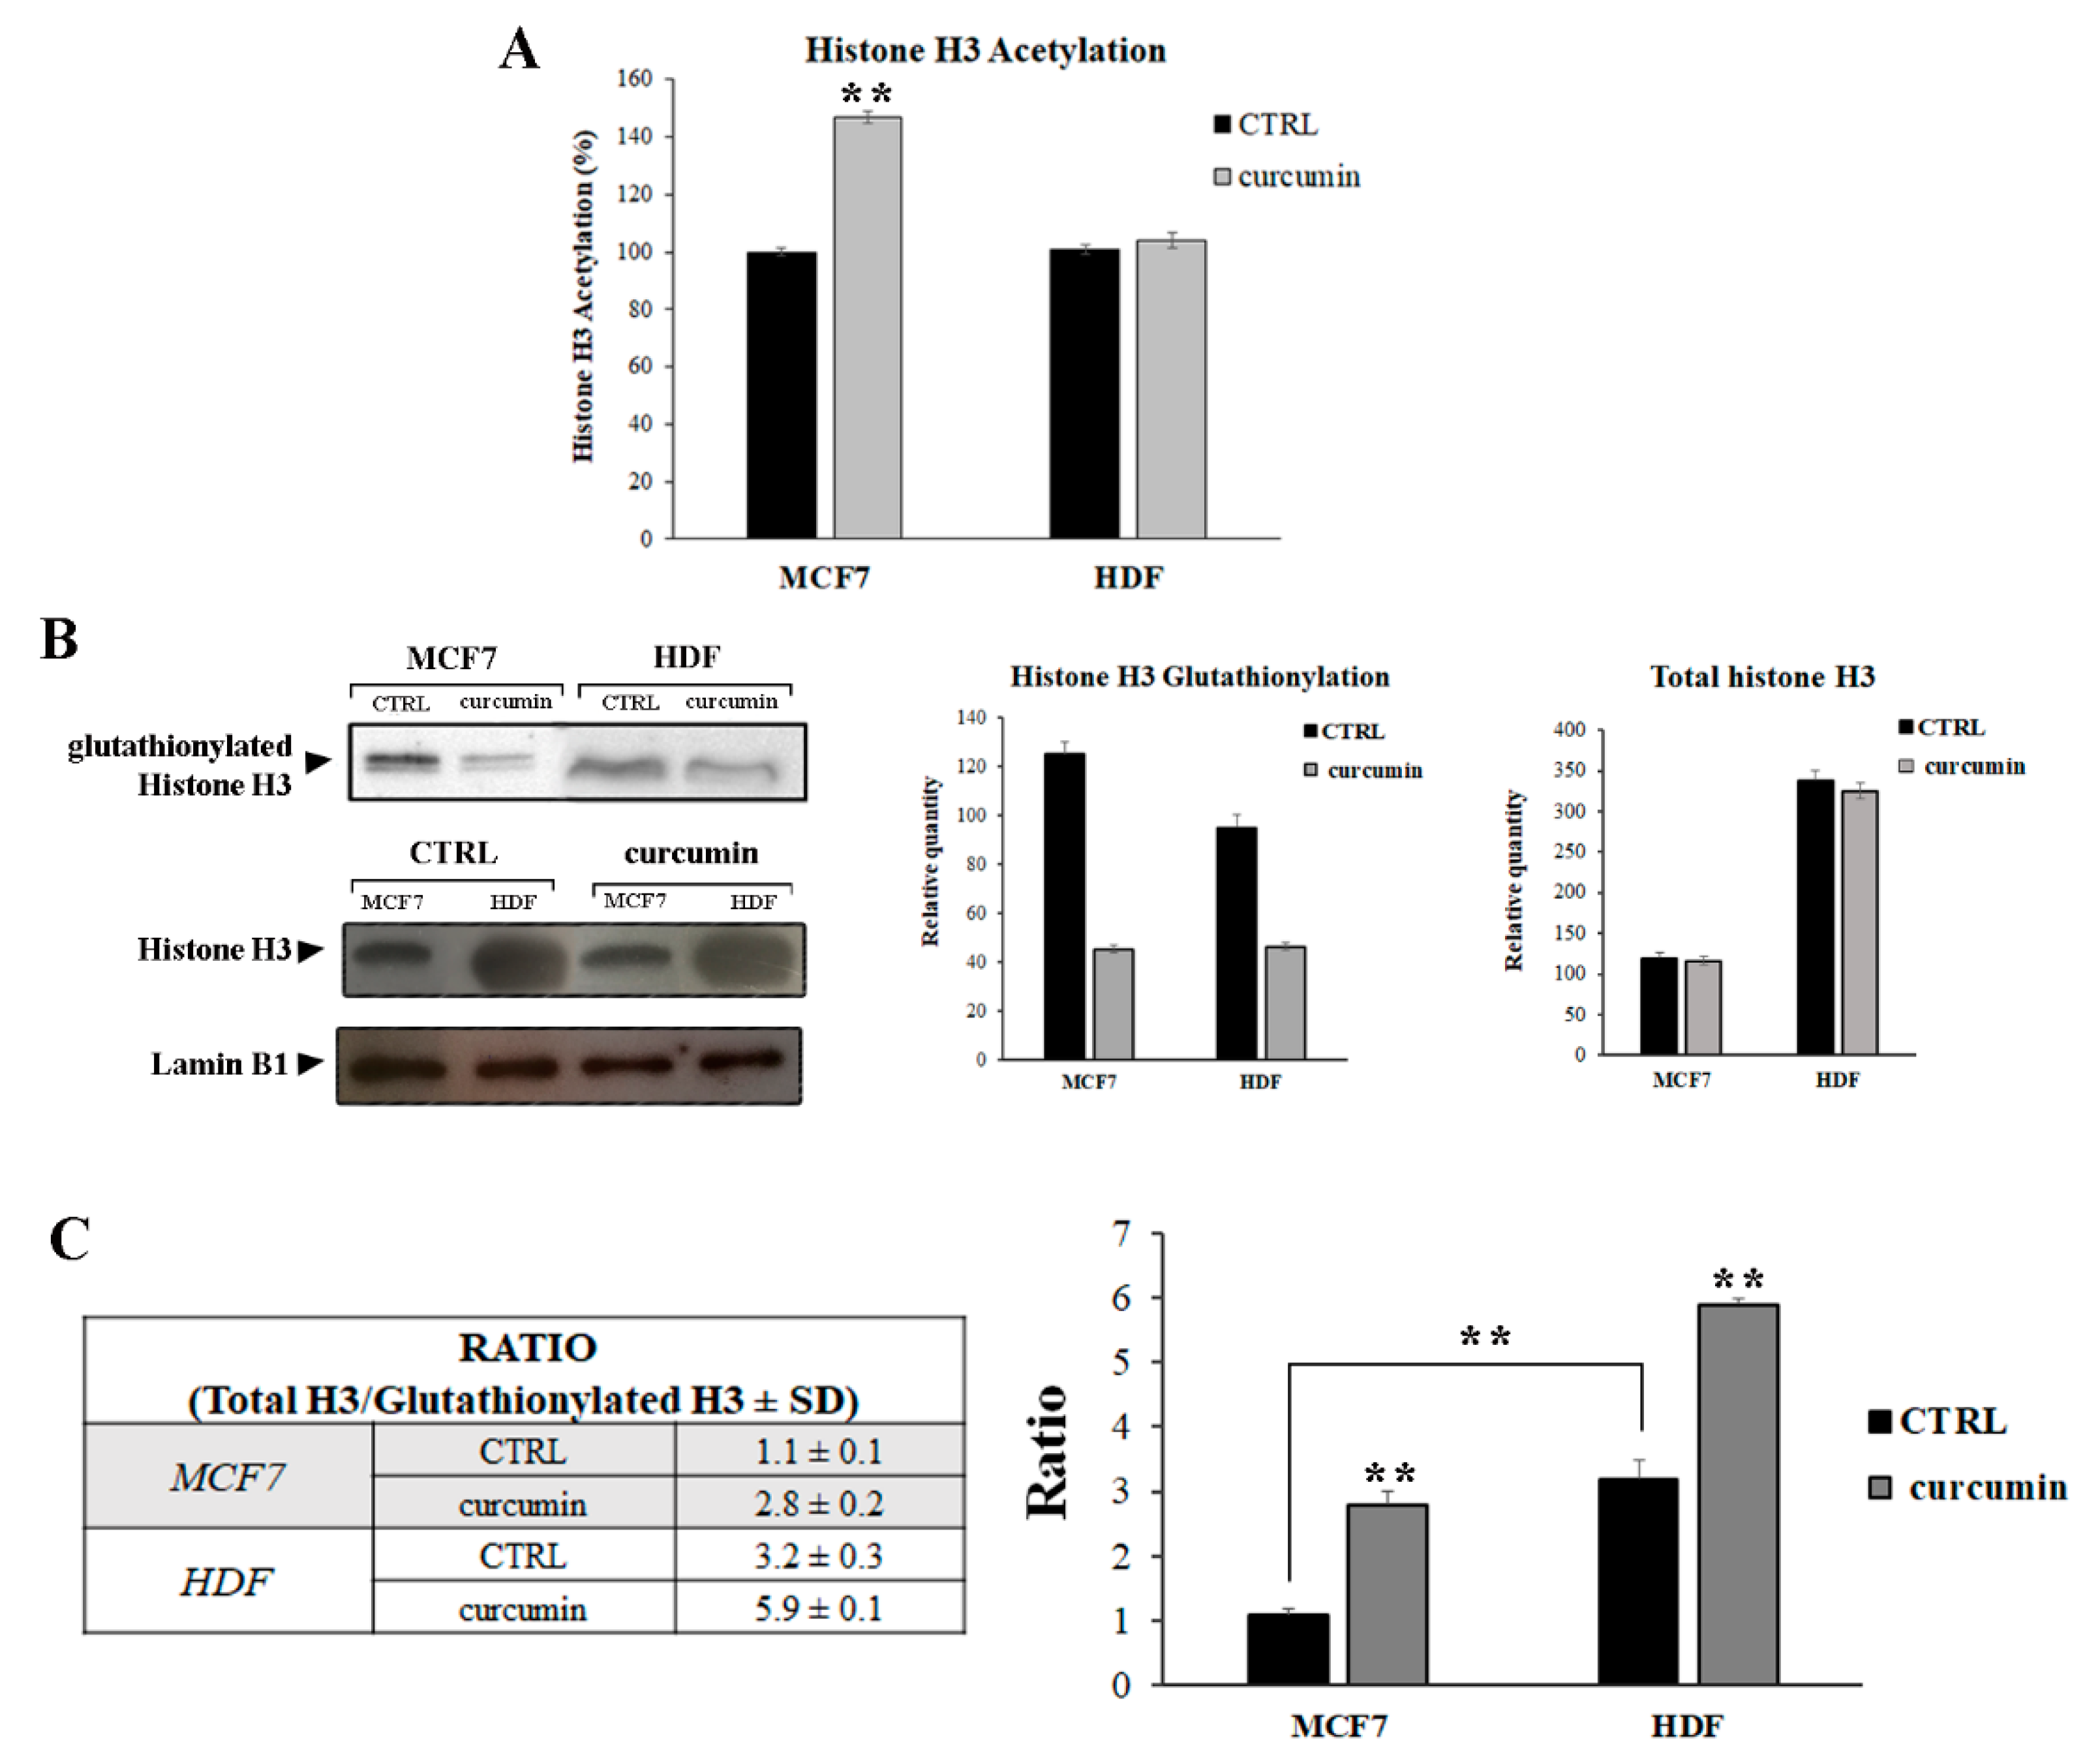
3.2. Curcumin Induces H3 Histone Acetylation and Glutathionylation
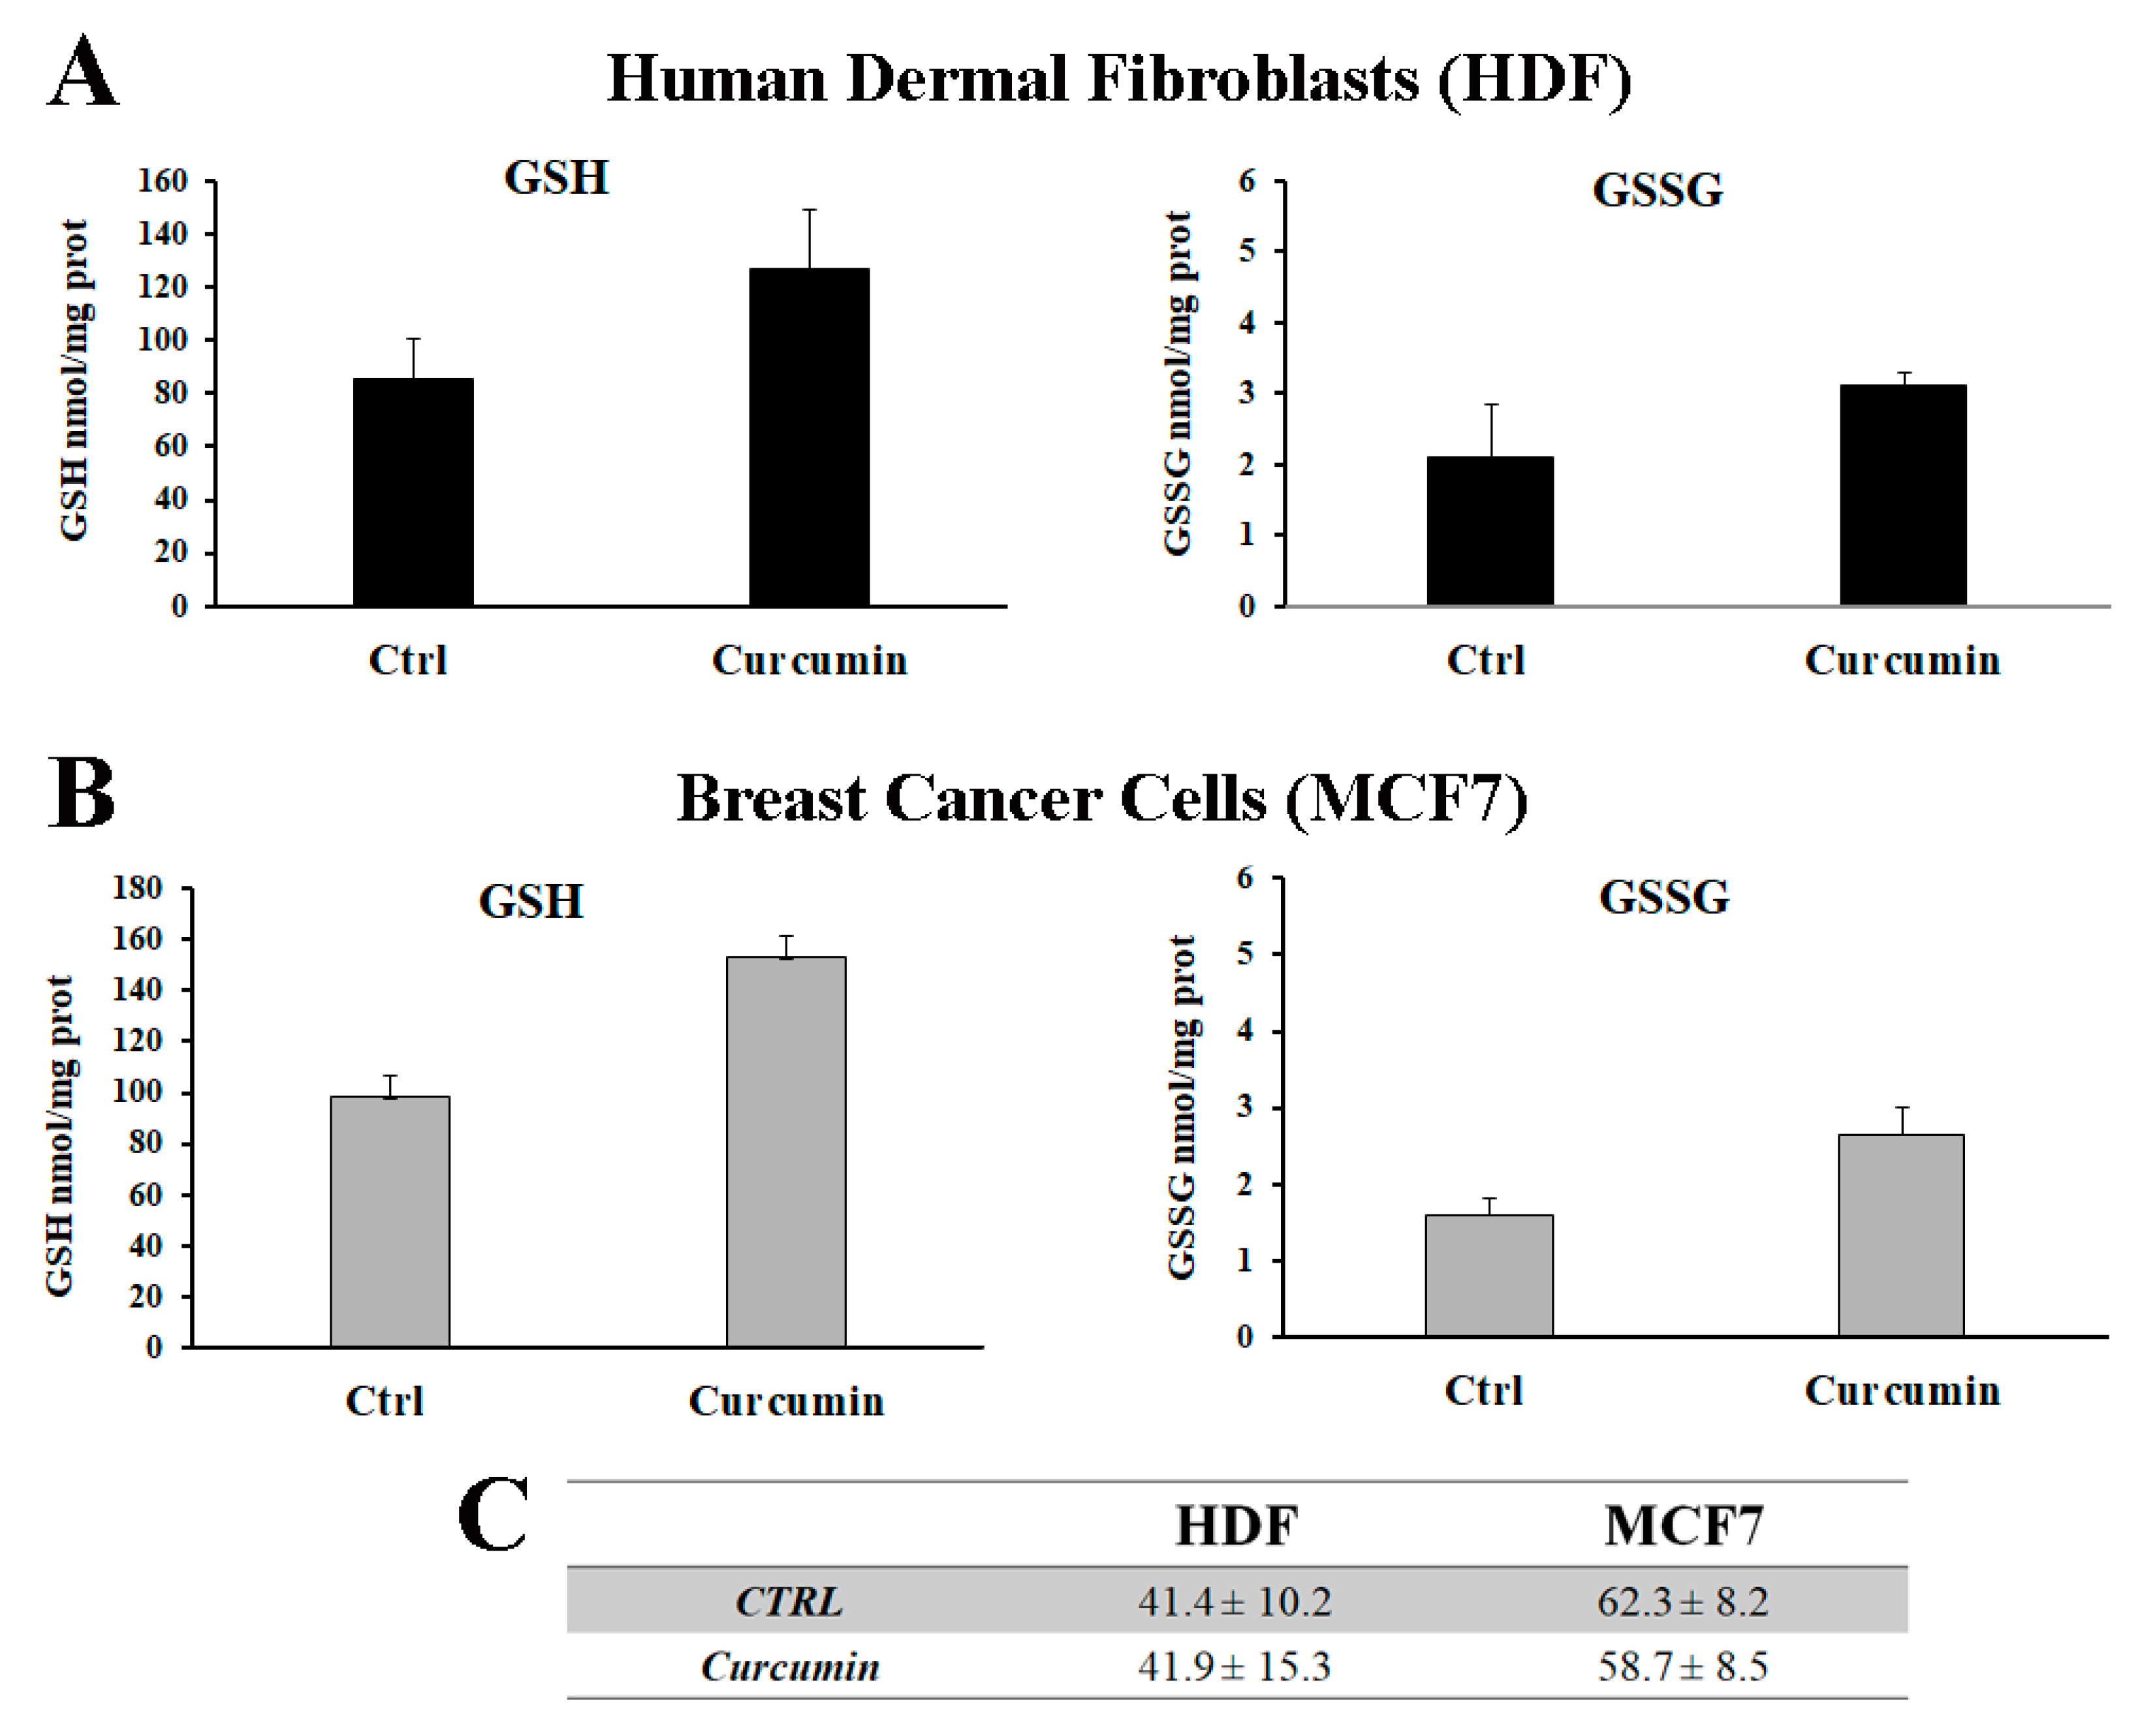
3.3. Curcumin Increases the Total Glutathione Level
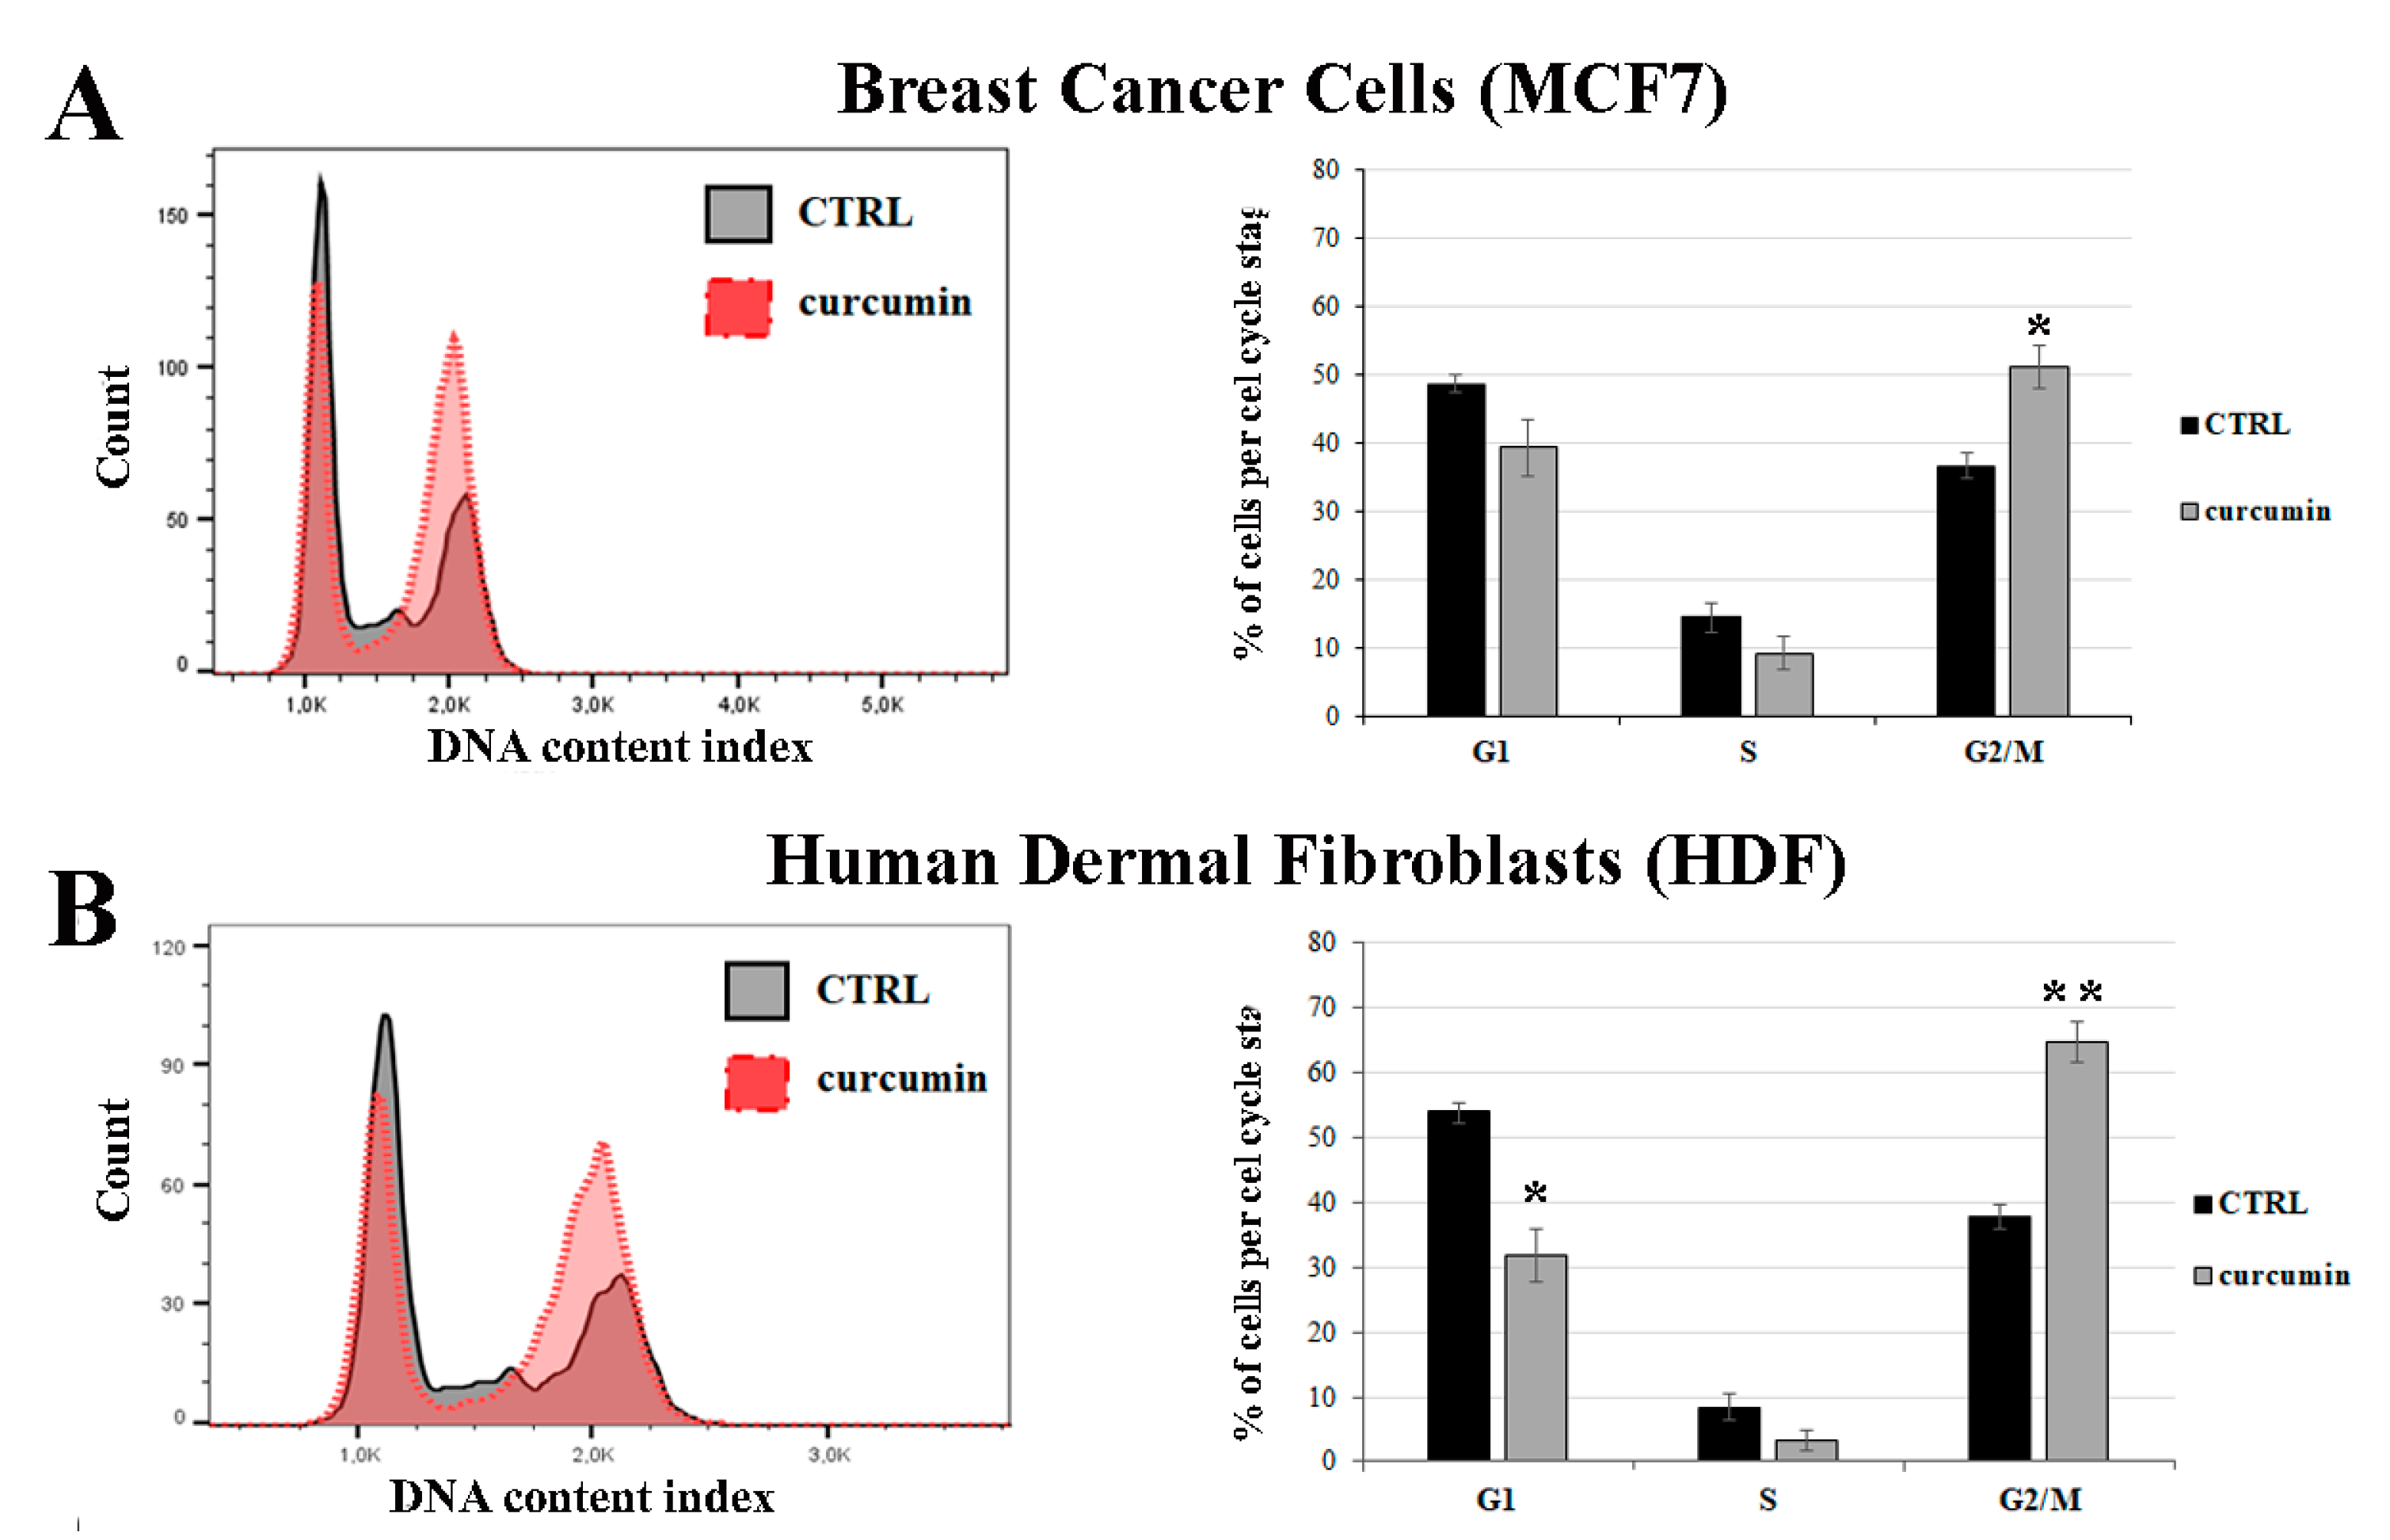
3.4. Curcumin Induces G2/M Cell Cycle Arrest
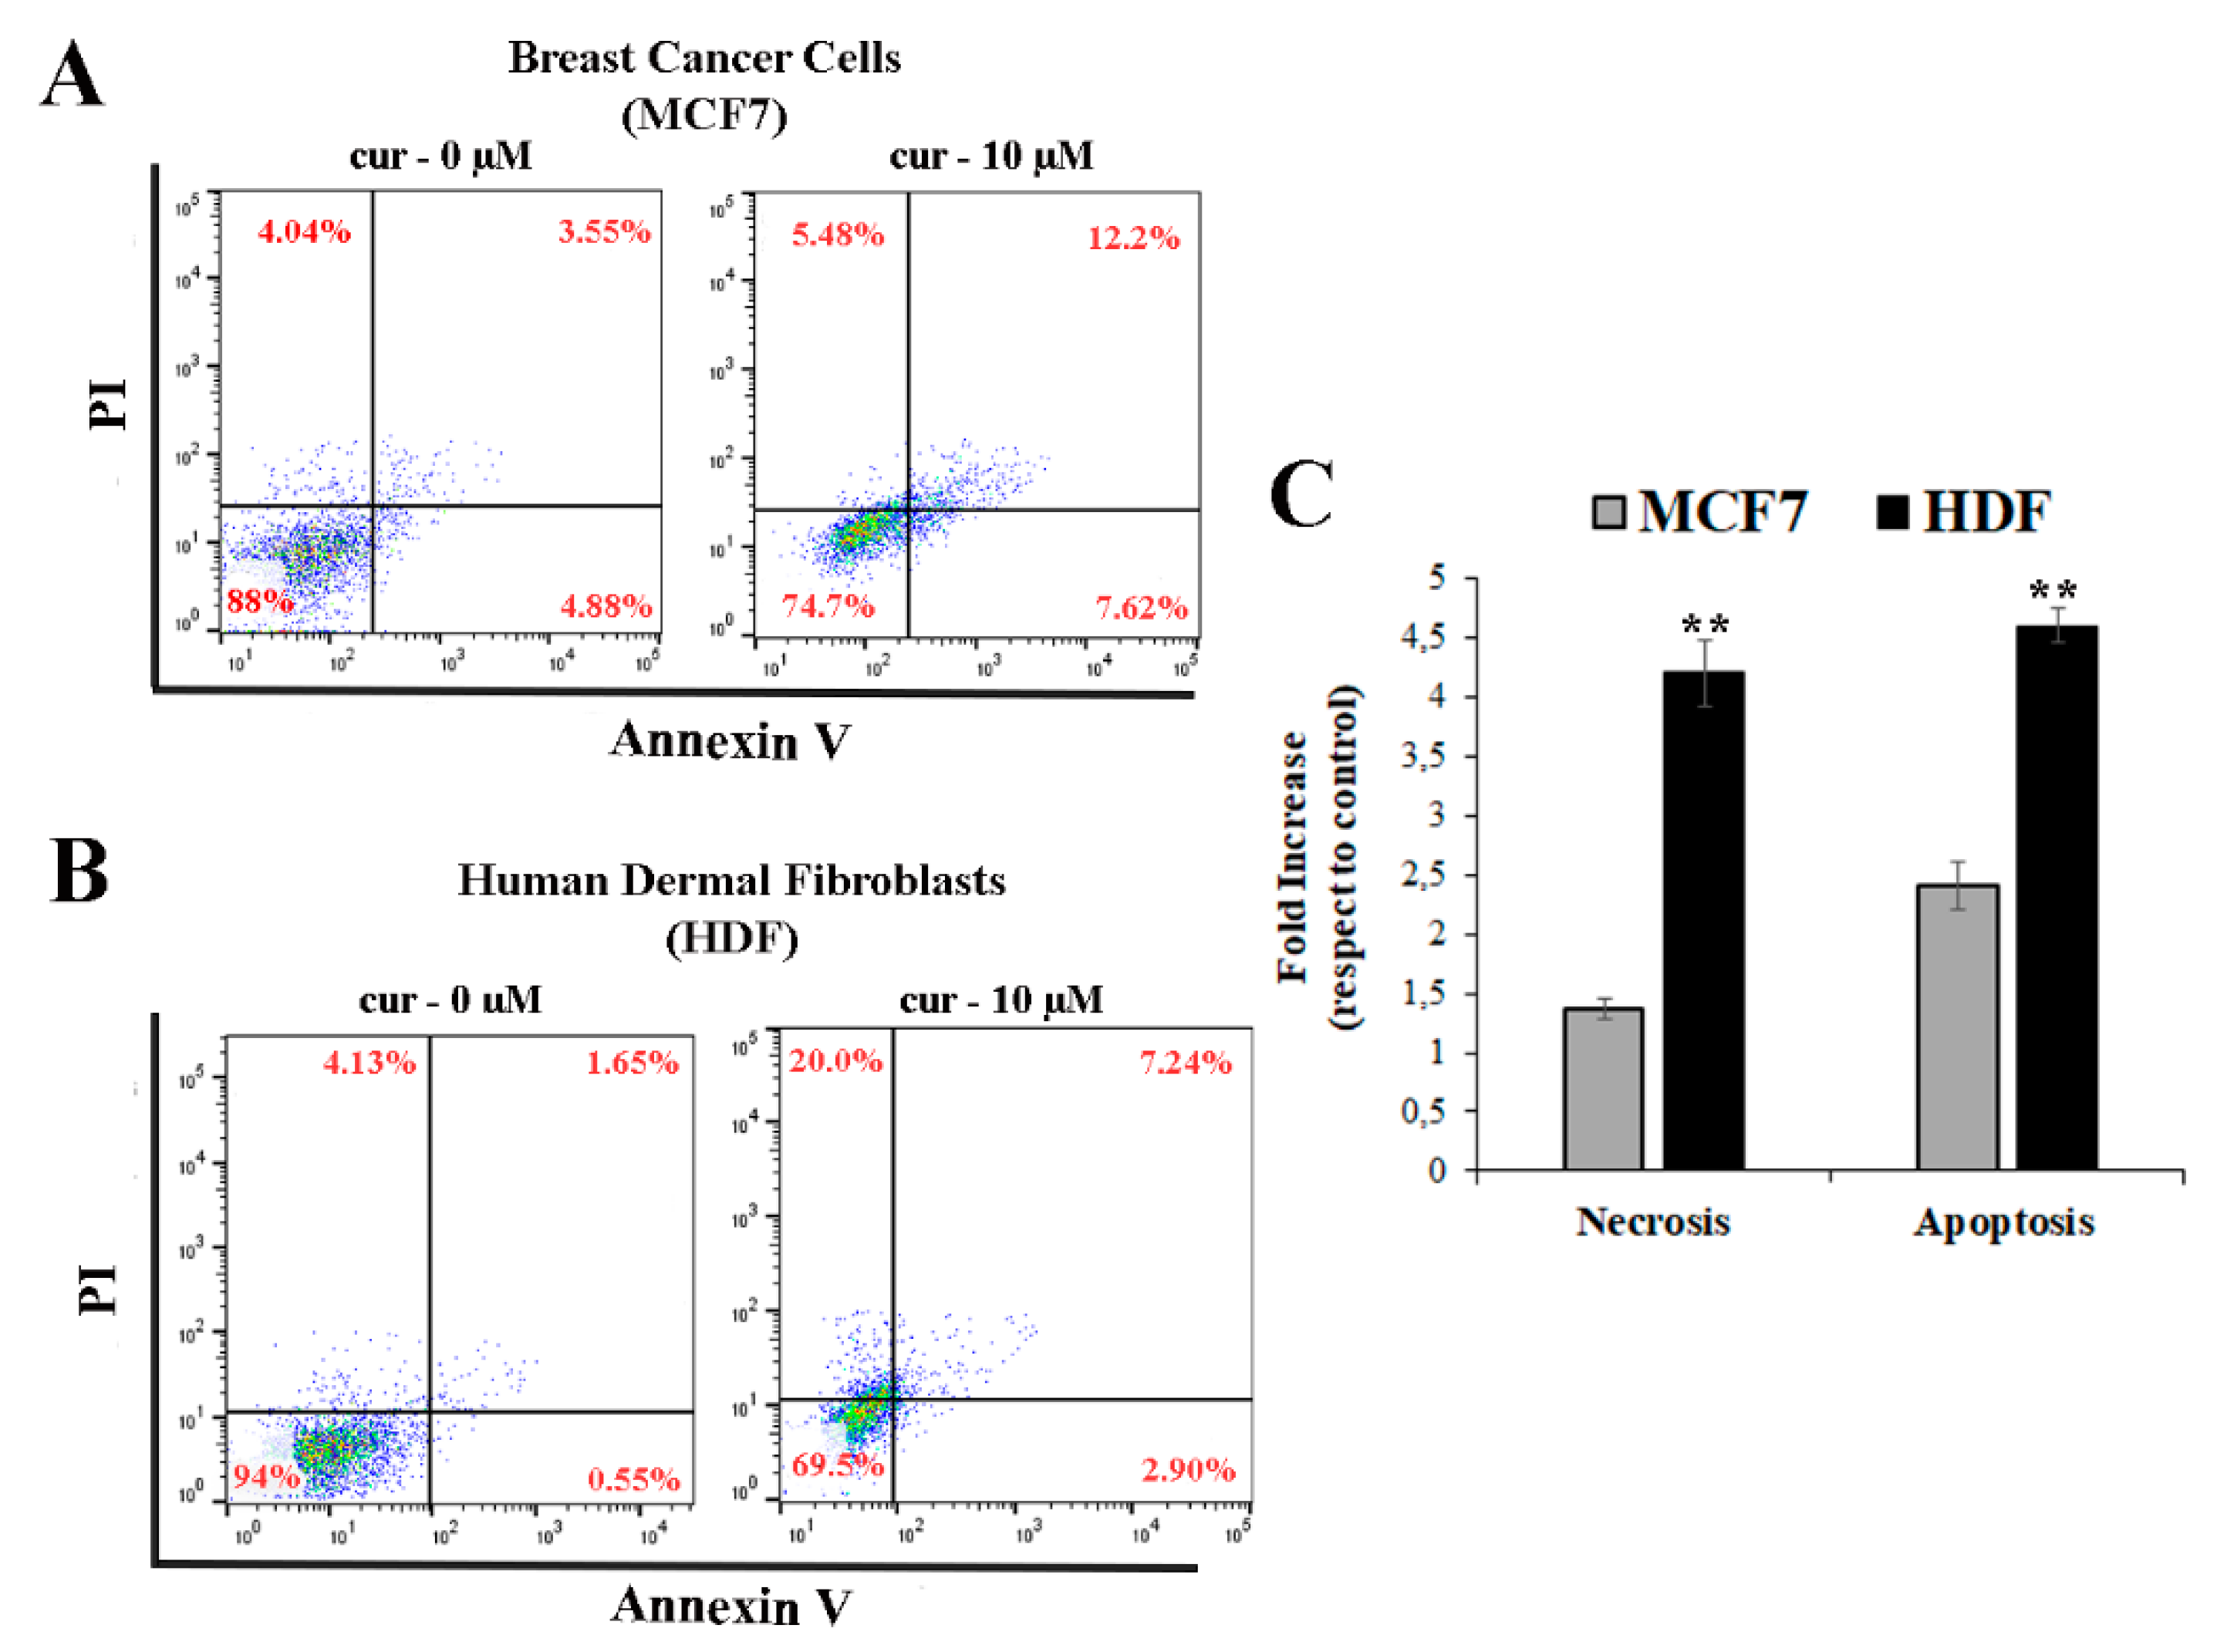
3.5. Curcumin Induces Necrosis and/or Apoptosis
4. Conclusions
Author Contributions
Funding
Conflicts of Interest
References
- Amalraj, A.; Pius, A.; Gopi, S.; Gopi, S. Biological activities of curcuminoids, other biomolecules from turmeric and their derivatives-A review. J. Altern. Complement. Med. 2017, 7, 205–233. [Google Scholar] [CrossRef] [PubMed]
- Gupta, S.C.; Patchva, S.; Koh, W.; Aggarwal, B.B. Discovery of curcumin, a component of golden spice, and its miraculous biological activities. Clin. Exp. Pharmacol. Physiol. 2012, 39, 283–299. [Google Scholar] [CrossRef] [PubMed]
- Maheshwari, R.K.; Singh, A.K.; Gaddipati, J.; Srimal, R.C. Multiple biological activities of curcumin: A short review. Life Sci. 2006, 78, 2081–2087. [Google Scholar] [CrossRef] [PubMed]
- Ravindran, J.; Prasad, S.; Aggarwal, B.B. Curcumin and cancer cells: How many ways can curry kill tumor cells selectively? AAPS J. 2009, 11, 495–510. [Google Scholar] [CrossRef] [PubMed]
- Bhattacharyya, S.; Mandal, D.; Sen, G.S.; Pal, S.; Banerjee, S.; Lahiry, L.; Finke, J.H.; Tannenbaum, C.S.; Das, T.; Sa, G. Tumor-induced oxidative stress perturbs nuclear factor-kappaB activity-augmenting tumor necrosis factor-alpha-mediated T-cell death: protection by curcumin. Cancer Res. 2007, 67, 362–370. [Google Scholar] [CrossRef]
- Campbell, F.C.; Collett, G.P. Chemopreventive properties of curcumin. Future Oncol. 2005, 1, 405–414. [Google Scholar] [CrossRef]
- Choudhuri, T.; Pal, S.; Das, T.; Sa, G. Curcumin selectively induces apoptosis in deregulated cyclin D1-expressed cells at G2 phase of cell cycle in a p53-dependent manner. J. Biol. Chem. 2005, 280, 20059–20068. [Google Scholar] [CrossRef] [PubMed]
- Sharma, R.A.; Gescher, A.J.; Steward, W.P. Curcumin: The story so far. Eur. J. Cancer 2005, 41, 1955–1968. [Google Scholar] [CrossRef]
- Lopez-Lazaro, M. Anticancer and carcinogenic properties of curcumin: Considerations for its clinical development as a cancer chemopreventive and chemotherapeutic agent. Mol. Nutr. Food Res. 2008, 52, S103–S127. [Google Scholar] [CrossRef]
- Giri, A.K.; Das, S.K.; Talukder, G.; Sharma, A. Sister chromatid exchange and chromosome aberrations induced by curcumin and tartrazine on mammalian cells in vivo. Cytobios 1990, 62, 111–117. [Google Scholar]
- Goodpasture, C.E.; Arrighi, F.E. Effects of food seasonings on the cell cycle and chromosome morphology of mammalian cells in vitro with special reference to turmeric. Food Cosmet. Toxicol. 1976, 14, 9–14. [Google Scholar] [CrossRef]
- Blasiak, J.; Trzeciak, A.; Kowalik, J. Curcumin damages DNA in human gastric mucosa cells and lymphocytes. J. Environ. Pathol. Toxicol. Oncol. 1999, 18, 271–276. [Google Scholar] [PubMed]
- Hu, S.; Xu, Y.; Meng, L.; Huang, L.; Sun, H. Curcumin inhibits proliferation and promotes apoptosis of breast cancer cells. Exp. Ther. Med. 2018, 16, 1266–1272. [Google Scholar] [CrossRef] [PubMed]
- Santel, T.; Pflug, G.; Hemdan, N.Y.; Schafer, A.; Hollenbach, M.; Buchold, M.; Hintersdorf, A.; Lindner, I.; Otto, A.; Bigl, M.; et al. Curcumin inhibits glyoxalase 1: A possible link to its anti-inflammatory and anti-tumor activity. PLoS ONE 2008, 3, e3508. [Google Scholar] [CrossRef] [PubMed]
- Dance-Barnes, S.T.; Kock, N.D.; Moore, J.E.; Lin, E.Y.; Mosley, L.J.; D’Agostino, R.B., Jr.; McCoy, T.P.; Townsend, A.J.; Miller, M.S. Lung tumor promotion by curcumin. Carcinogenesis 2009, 30, 1016–1023. [Google Scholar] [CrossRef] [PubMed] [Green Version]
- Mukhopadhyay, M.J.; Saha, A.; Mukherjee, A. Studies on the anticlastogenic effect of turmeric and curcumin on cyclophosphamide and mitomycin C in vivo. Food Chem. Toxicol. 1998, 36, 73–76. [Google Scholar] [CrossRef]
- El Mackawy, A.; Sharaf, H.A. Cytogenetical and histochemical studies on curcumin in male rats. In WIT Transactions on Biomedicine and Health; WIT Press: Ashurst, New Forest, UK, 2006; Volume 10, pp. 169–180. [Google Scholar]
- Bielak-Zmijewska, A.; Sikora-Polaczek, M.; Nieznanski, K.; Mosieniak, G.; Kolano, A.; Maleszewski, M.; Styrna, J.; Sikora, E. Curcumin disrupts meiotic and mitotic divisions via spindle impairment and inhibition of CDK1 activity. Cell Prolif. 2010, 43, 354–364. [Google Scholar] [CrossRef]
- Korwek, Z.; Bielak-Zmijewska, A.; Mosieniak, G.; Alster, O.; Moreno-Villanueva, M.; Burkle, A.; Sikora, E. DNA damage-independent apoptosis induced by curcumin in normal resting human T cells and leukaemic Jurkat cells. Mutagenesis 2013, 28, 411–416. [Google Scholar] [CrossRef] [Green Version]
- Mangalathillam, S.; Rejinold, N.S.; Nair, A.; Lakshmanan, V.K.; Nair, S.V.; Jayakumar, R. Curcumin loaded chitin nanogels for skin cancer treatment via the transdermal route. Nanoscale 2012, 4, 239–250. [Google Scholar] [CrossRef]
- Kianvash, N.; Bahador, A.; Pourhajibagher, M.; Ghafari, H.; Nikoui, V.; Rezayat, S.M.; Dehpour, A.R.; Partoazar, A. Evaluation of propylene glycol nanoliposomes containing curcumin on burn wound model in rat: biocompatibility, wound healing, and anti-bacterial effects. Drug Deliv. Transl. Res. 2017, 7, 654–663. [Google Scholar] [CrossRef]
- Damiani, E.; Bruge, F.; Cirilli, I.; Marcheggiani, F.; Olivieri, F.; Armeni, T.; Cianfruglia, L.; Giuliani, A.; Orlando, P.; Tiano, L. Modulation of Oxidative Status by Normoxia and Hypoxia on Cultures of Human Dermal Fibroblasts: How Does It Affect Cell Aging? Oxid. Med. Cell Longev. 2018, 2018, 5469159. [Google Scholar] [CrossRef] [PubMed]
- Mosmann, T. Rapid colorimetric assay for cellular growth and survival: Application to proliferation and cytotoxicity assays. J. Immunol. Methods 1983, 65, 55–63. [Google Scholar] [CrossRef]
- Bradford, M.M. A rapid and sensitive method for the quantitation of microgram quantities of protein utilizing the principle of protein-dye binding. Anal. Biochem. 1976, 72, 248–254. [Google Scholar] [CrossRef]
- Brigelius, R.; Muckel, C.; Akerboom, T.P.; Sies, H. Identification and quantitation of glutathione in hepatic protein mixed disulfides and its relationship to glutathione disulfide. Biochem. Pharmacol. 1983, 32, 2529–2534. [Google Scholar] [CrossRef]
- Cianfruglia, L.; Perrelli, A.; Fornelli, C.; Magini, A.; Gorbi, S.; Salzano, A.M.; Antognelli, C.; Retta, F.; Benedetti, V.; Cassoni, P.; et al. KRIT1 Loss-Of-Function Associated with Cerebral Cavernous Malformation Disease Leads to Enhanced S-Glutathionylation of Distinct Structural and Regulatory Proteins. Antioxidants 2019, 8, 27. [Google Scholar] [CrossRef] [PubMed]
- Syng-Ai, C.; Kumari, A.L.; Khar, A. Effect of curcumin on normal and tumor cells: Role of glutathione and bcl-2. Mol. Cancer Ther. 2004, 3, 1101–1108. [Google Scholar] [PubMed]
- Chang, P.Y.; Peng, S.F.; Lee, C.Y.; Lu, C.C.; Tsai, S.C.; Shieh, T.M.; Wu, T.S.; Tu, M.G.; Chen, M.Y.; Yang, J.S. Curcumin-loaded nanoparticles induce apoptotic cell death through regulation of the function of MDR1 and reactive oxygen species in cisplatin-resistant CAR human oral cancer cells. Int. J. Oncol. 2013, 43, 1141–1150. [Google Scholar] [CrossRef]
- Shankar, S.; Srivastava, R.K. Bax and Bak genes are essential for maximum apoptotic response by curcumin, a polyphenolic compound and cancer chemopreventive agent derived from turmeric, Curcuma longa. Carcinogenesis 2007, 28, 1277–1286. [Google Scholar] [CrossRef] [Green Version]
- Ahmadi, F.; Ghasemi-Kasman, M.; Ghasemi, S.; Gholamitabar Tabari, M.; Pourbagher, R.; Kazemi, S.; Alinejad-Mir, A. Induction of apoptosis in HeLa cancer cells by an ultrasonic-mediated synthesis of curcumin-loaded chitosan-alginate-STPP nanoparticles. Int. J. Nanomed. 2017, 12, 8545–8556. [Google Scholar] [CrossRef]
- Novak Kujundzic, R.; Grbesa, I.; Ivkic, M.; Katdare, M.; Gall-Troselj, K. Curcumin downregulates H19 gene transcription in tumor cells. J. Cell Biochem. 2008, 104, 1781–1792. [Google Scholar] [CrossRef]
- Strahl, B.D.; Allis, C.D. The language of covalent histone modifications. Nature 2000, 403, 41–45. [Google Scholar] [CrossRef] [PubMed]
- Hassan, F.U.; Rehman, M.S.; Khan, M.S.; Ali, M.A.; Javed, A.; Nawaz, A.; Yang, C. Curcumin as an Alternative Epigenetic Modulator: Mechanism of Action and Potential Effects. Front. Genet. 2019, 10, 514. [Google Scholar] [CrossRef] [PubMed] [Green Version]
- Balasubramanyam, K.; Varier, R.A.; Altaf, M.; Swaminathan, V.; Siddappa, N.B.; Ranga, U.; Kundu, T.K. Curcumin, a novel p300/CREB-binding protein-specific inhibitor of acetyltransferase, represses the acetylation of histone/nonhistone proteins and histone acetyltransferase-dependent chromatin transcription. J. Biol. Chem. 2004, 279, 51163–51171. [Google Scholar] [CrossRef] [PubMed]
- Lee, S.J.; Krauthauser, C.; Maduskuie, V.; Fawcett, P.T.; Olson, J.M.; Rajasekaran, S.A. Curcumin-induced HDAC inhibition and attenuation of medulloblastoma growth in vitro and in vivo. BMC Cancer 2011, 11, 144. [Google Scholar] [CrossRef] [PubMed]
- Liu, H.L.; Chen, Y.; Cui, G.H.; Zhou, J.F. Curcumin, a potent anti-tumor reagent, is a novel histone deacetylase inhibitor regulating B-NHL cell line Raji proliferation. Acta. Pharmacol. Sin. 2005, 26, 603–609. [Google Scholar] [CrossRef] [PubMed] [Green Version]
- Mukherjee, S.; Sarkar, R.; Biswas, J.; Roy, M. Curcumin Inhibits Histone Deacetylase Leading to Cell Cycle Arrest and Apoptosis via Upregulation of p21 in Breast Cancer Cell Lines. Int. J. Green Nanotechnol. 2012, 4, 183–197. [Google Scholar] [CrossRef]
- Garcia-Gimenez, J.L.; Olaso, G.; Hake, S.B.; Bonisch, C.; Wiedemann, S.M.; Markovic, J.; Dasi, F.; Gimeno, A.; Perez-Quilis, C.; Palacios, O.; et al. Histone h3 glutathionylation in proliferating mammalian cells destabilizes nucleosomal structure. Antioxid. Redox. Signal 2013, 19, 1305–1320. [Google Scholar] [CrossRef] [PubMed]
- Scire, A.; Cianfruglia, L.; Minnelli, C.; Bartolini, D.; Torquato, P.; Principato, G.; Galli, F.; Armeni, T. Glutathione compartmentalization and its role in glutathionylation and other regulatory processes of cellular pathways. Biofactors 2019, 45, 152–168. [Google Scholar] [CrossRef]
- Piwocka, K.; Jaruga, E.; Skierski, J.; Gradzka, I.; Sikora, E. Effect of glutathione depletion on caspase-3 independent apoptosis pathway induced by curcumin in Jurkat cells. Free Radic. Biol. Med. 2001, 31, 670–678. [Google Scholar] [CrossRef]
- Barzegar, A.; Moosavi-Movahedi, A.A. Intracellular ROS protection efficiency and free radical-scavenging activity of curcumin. PLoS ONE 2011, 6, e26012. [Google Scholar] [CrossRef]
- Reddy, A.C.; Lokesh, B.R. Studies on the inhibitory effects of curcumin and eugenol on the formation of reactive oxygen species and the oxidation of ferrous iron. Mol. Cell Biochem. 1994, 137, 1–8. [Google Scholar] [CrossRef] [PubMed]
- Sreejayan; Rao, M.N. Nitric oxide scavenging by curcuminoids. J. Pharm. Pharmacol. 1997, 49, 105–107. [Google Scholar]
- Atsumi, T.; Tonosaki, K.; Fujisawa, S. Induction of early apoptosis and ROS-generation activity in human gingival fibroblasts (HGF) and human submandibular gland carcinoma (HSG) cells treated with curcumin. Arch. Oral. Biol. 2006, 51, 913–921. [Google Scholar] [CrossRef] [PubMed]
- Silva, M.T. Secondary necrosis: The natural outcome of the complete apoptotic program. FEBS Lett. 2010, 584, 4491–4499. [Google Scholar] [CrossRef] [PubMed] [Green Version]
- Jinesh, G.G.; Molina, J.R.; Huang, L.; Laing, N.M.; Mills, G.B.; Bar-Eli, M.; Kamat, A.M. Mitochondrial oligomers boost glycolysis in cancer stem cells to facilitate blebbishield-mediated transformation after apoptosis. Cell Death. Discov. 2016, 2, 16003. [Google Scholar] [CrossRef] [PubMed] [Green Version]
- Bouayed, J.; Bohn, T. Exogenous antioxidants-Double-edged swords in cellular redox state: Health beneficial effects at physiologic doses versus deleterious effects at high doses. Oxid. Med. Cell Longev. 2010, 3, 228–237. [Google Scholar] [CrossRef] [PubMed]
- Burgos-Moron, E.; Calderon-Montano, J.M.; Salvador, J.; Robles, A.; Lopez-Lazaro, M. The dark side of curcumin. Int. J. Cancer 2010, 126, 1771–1775. [Google Scholar] [CrossRef] [PubMed]
- Chan, W.H.; Wu, H.Y.; Chang, W.H. Dosage effects of curcumin on cell death types in a human osteoblast cell line. Food Chem. Toxicol. 2006, 44, 1362–1371. [Google Scholar] [CrossRef] [PubMed]
- Minnelli, C.; Moretti, P.; Fulgenzi, G.; Mariani, P.; Laudadio, E.; Armeni, T.; Galeazzi, R.; Mobbili, G. A Poloxamer-407 modified liposome encapsulating epigallocatechin-3-gallate in the presence of magnesium: Characterization and protective effect against oxidative damage. Int. J. Pharm. 2018, 552, 225–234. [Google Scholar] [CrossRef]
- Laudadio, E.; Minnelli, C.; Amici, A.; Massaccesi, L.; Mobbili, G.; Galeazzi, R. Liposomal Formulations for an Efficient Encapsulation of Epigallocatechin-3-gallate: An in- Silico/Experimental Approach. Molecules 2018, 23, 441. [Google Scholar] [CrossRef]
- Morresi, C.; Cianfruglia, L.; Armeni, T.; Mancini, F.; Tenore, G.C.; D’Urso, E.; Micheletti, A.; Ferretti, G.; Bacchetti, T. Polyphenolic compounds and nutraceutical properties of old and new apple cultivars. J. Food Biochem. 2018, 42, e12641. [Google Scholar] [CrossRef]
© 2019 by the authors. Licensee MDPI, Basel, Switzerland. This article is an open access article distributed under the terms and conditions of the Creative Commons Attribution (CC BY) license (http://creativecommons.org/licenses/by/4.0/).
Share and Cite
Cianfruglia, L.; Minnelli, C.; Laudadio, E.; Scirè, A.; Armeni, T. Side Effects of Curcumin: Epigenetic and Antiproliferative Implications for Normal Dermal Fibroblast and Breast Cancer Cells. Antioxidants 2019, 8, 382. https://doi.org/10.3390/antiox8090382
Cianfruglia L, Minnelli C, Laudadio E, Scirè A, Armeni T. Side Effects of Curcumin: Epigenetic and Antiproliferative Implications for Normal Dermal Fibroblast and Breast Cancer Cells. Antioxidants. 2019; 8(9):382. https://doi.org/10.3390/antiox8090382
Chicago/Turabian StyleCianfruglia, Laura, Cristina Minnelli, Emiliano Laudadio, Andrea Scirè, and Tatiana Armeni. 2019. "Side Effects of Curcumin: Epigenetic and Antiproliferative Implications for Normal Dermal Fibroblast and Breast Cancer Cells" Antioxidants 8, no. 9: 382. https://doi.org/10.3390/antiox8090382