
Vulnerability of Triple-Negative Breast Cancer to Saponin Formosanin C-Induced Ferroptosis

 ,
, 
Abstract
:1. Introduction
2. Materials and Methods
2.1. Reagents
2.2. Cell Culture
2.3. Cell Population Growth Determination
2.4. Flow Cytometry
2.5. Determination of Glutathione Peroxidase 4 (GPX4) Levels
2.6. Western Blot Analysis
2.7. Transmission Electron Microscopy
2.8. Immunoprecipitation
2.9. RNA Sequencing
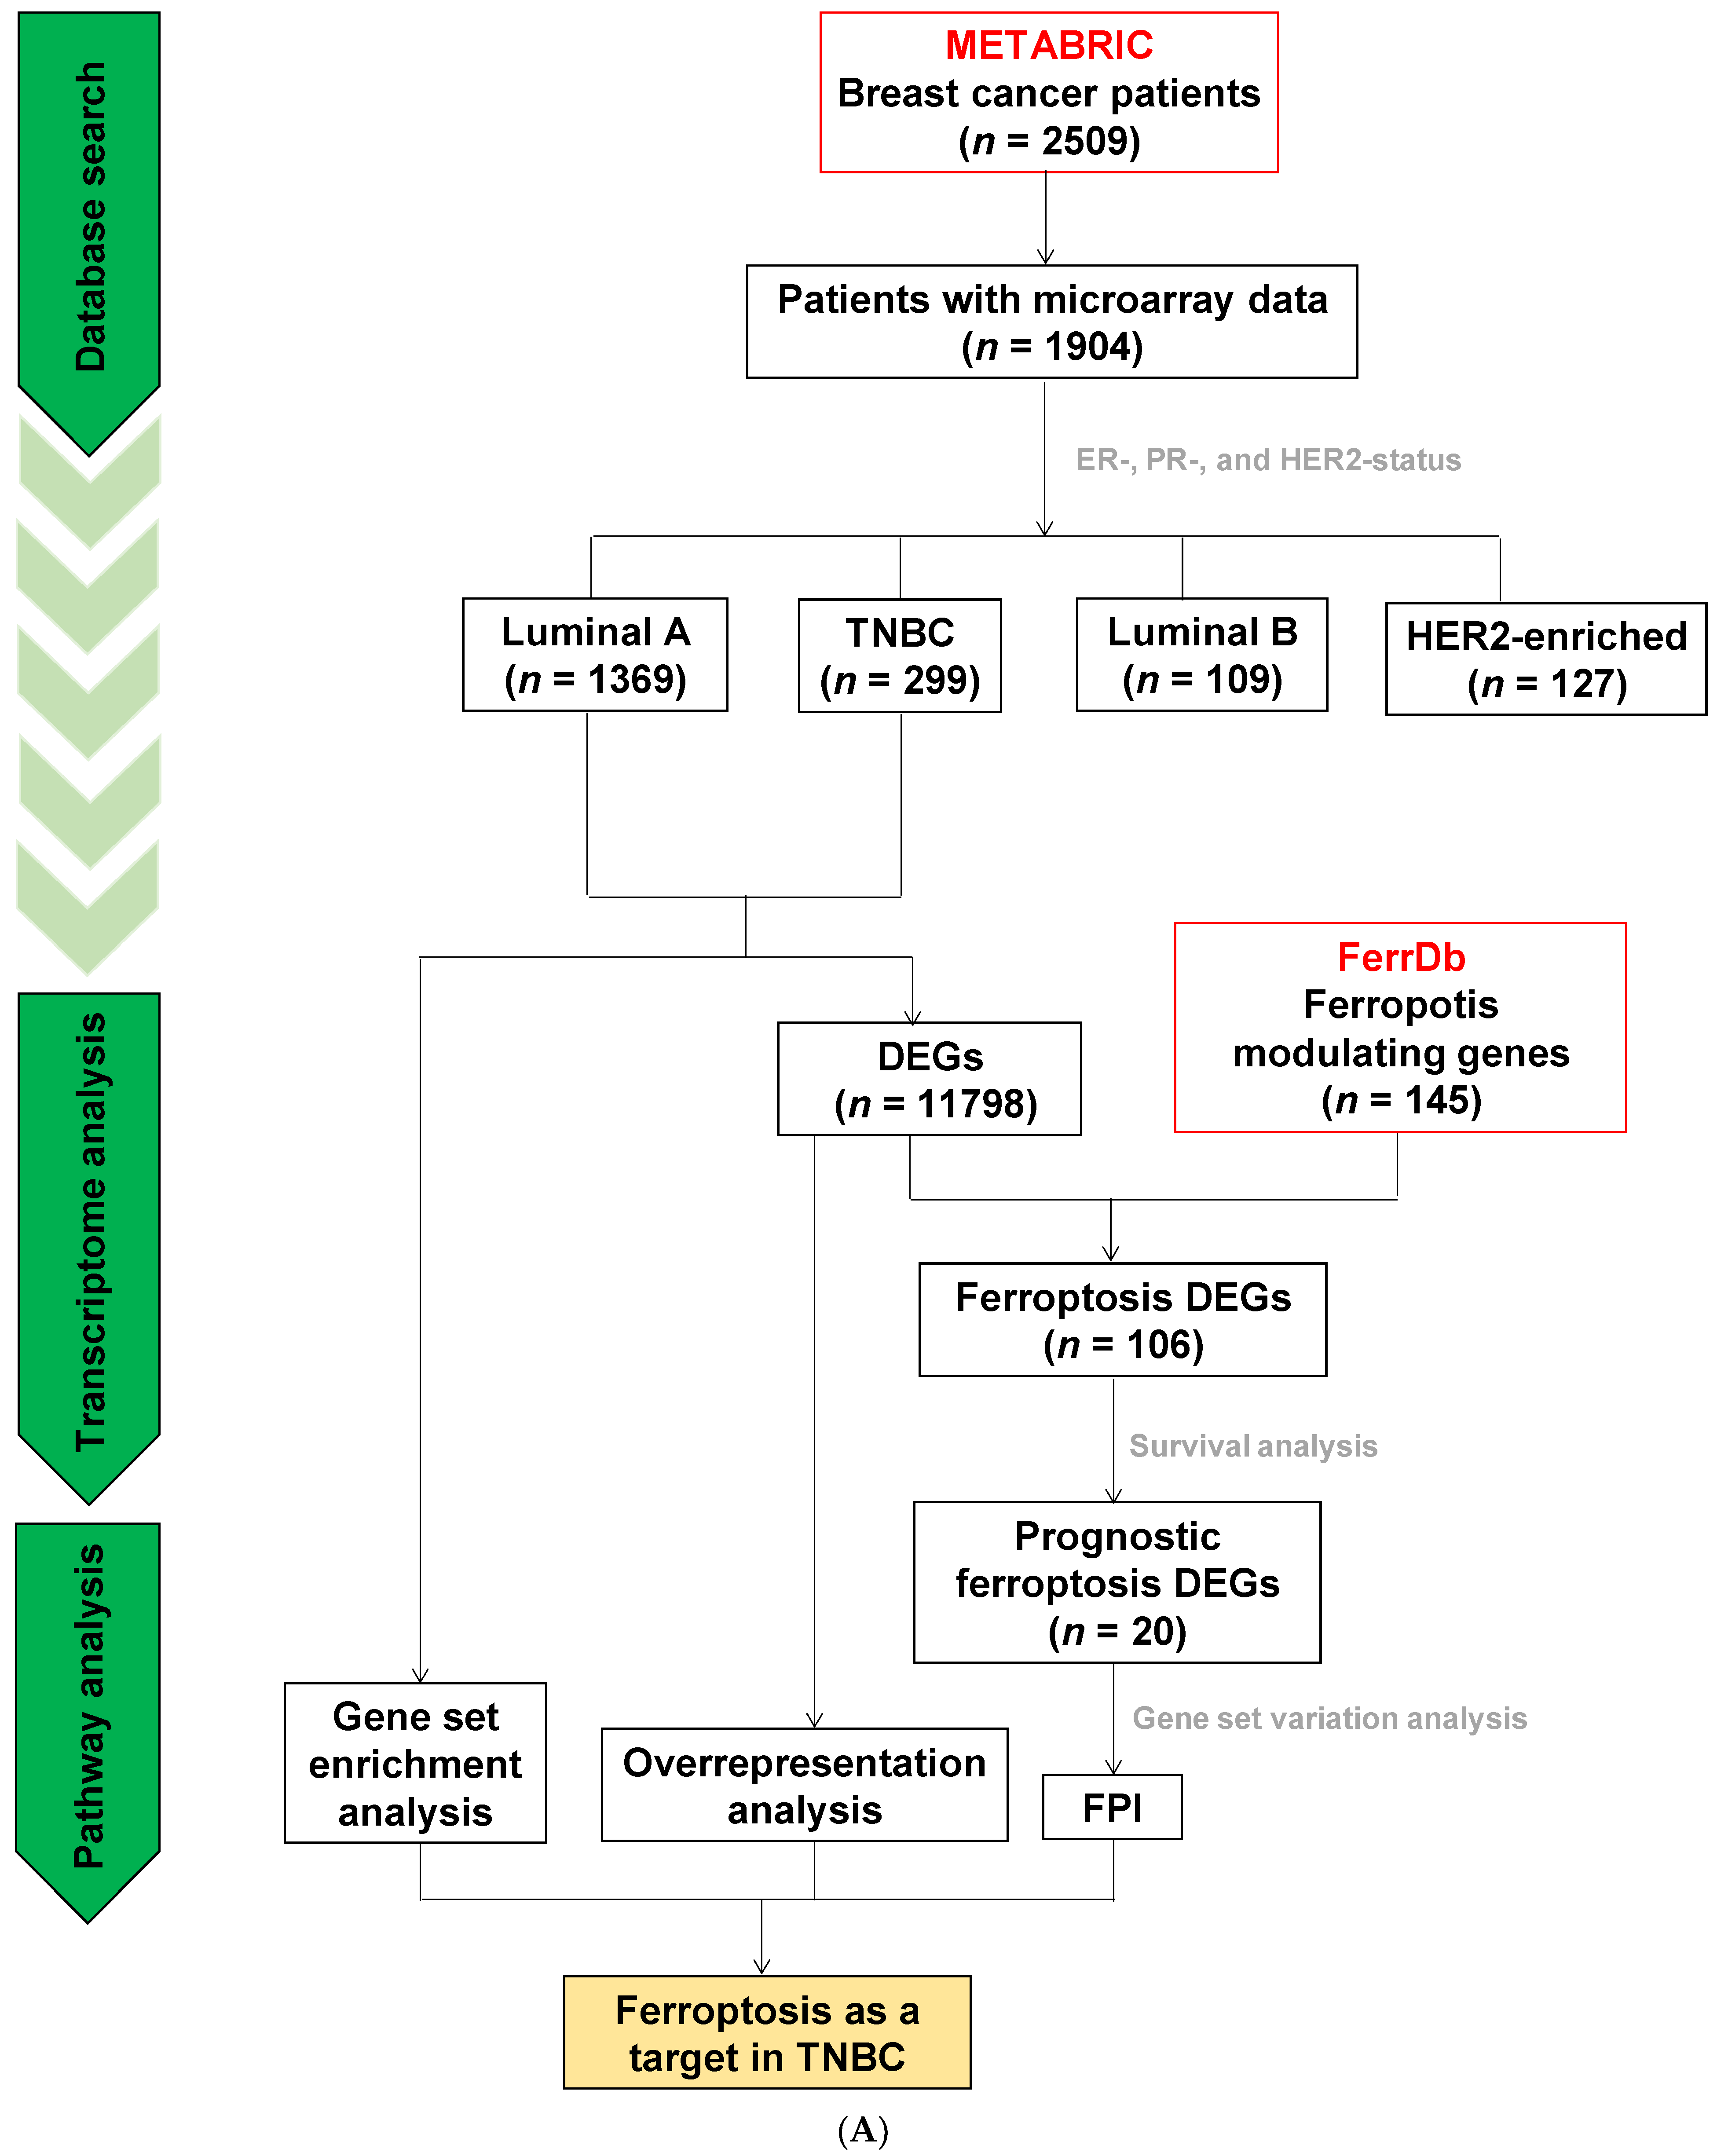
2.10. METABRIC
2.11. Over-Represented Pathway Analysis and Gene Set Enrichment Analysis (GSEA)
2.12. Prognostic Ferroptosis DEGs
2.13. Ferroptosis Potential Index (FPI)
2.14. Statistical Analysis
3. Results
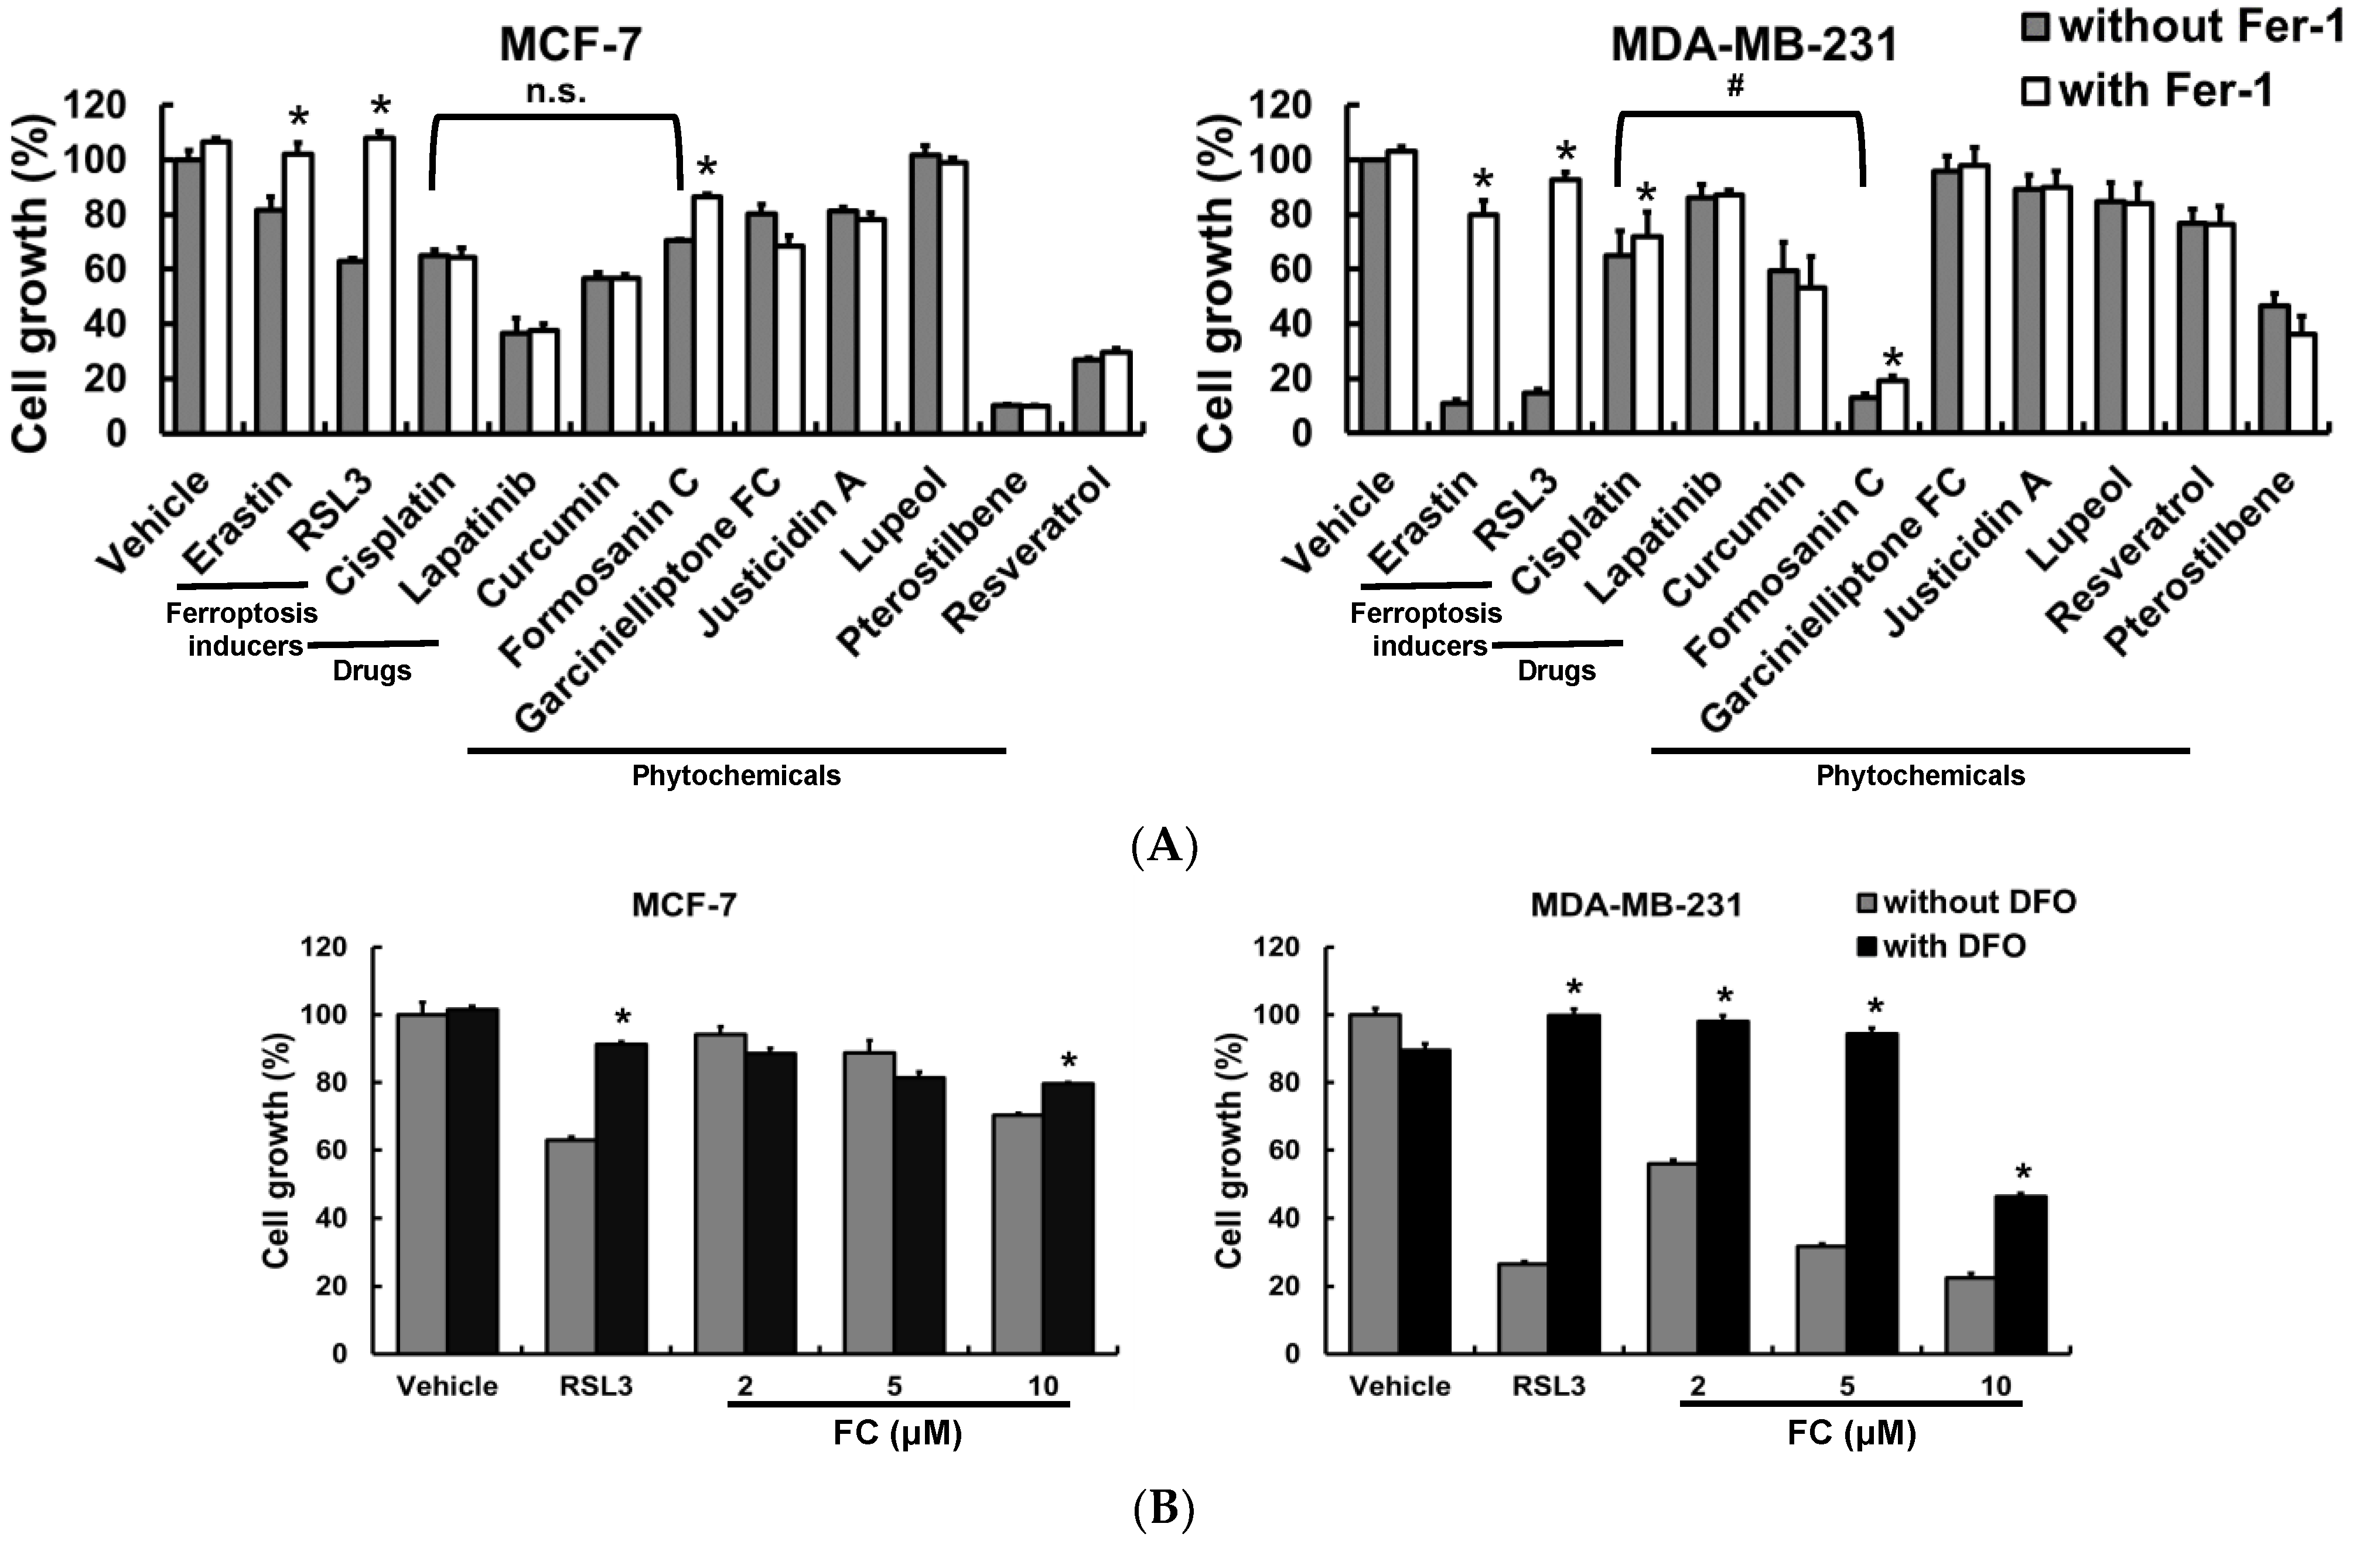
3.1. The TNBC MDA-MB-231 Cells Are More Sensitive to Ferroptosis Than the Luminal A MCF-7 Cells, and FC Is Identified as a Potent Ferroptosis Inducer
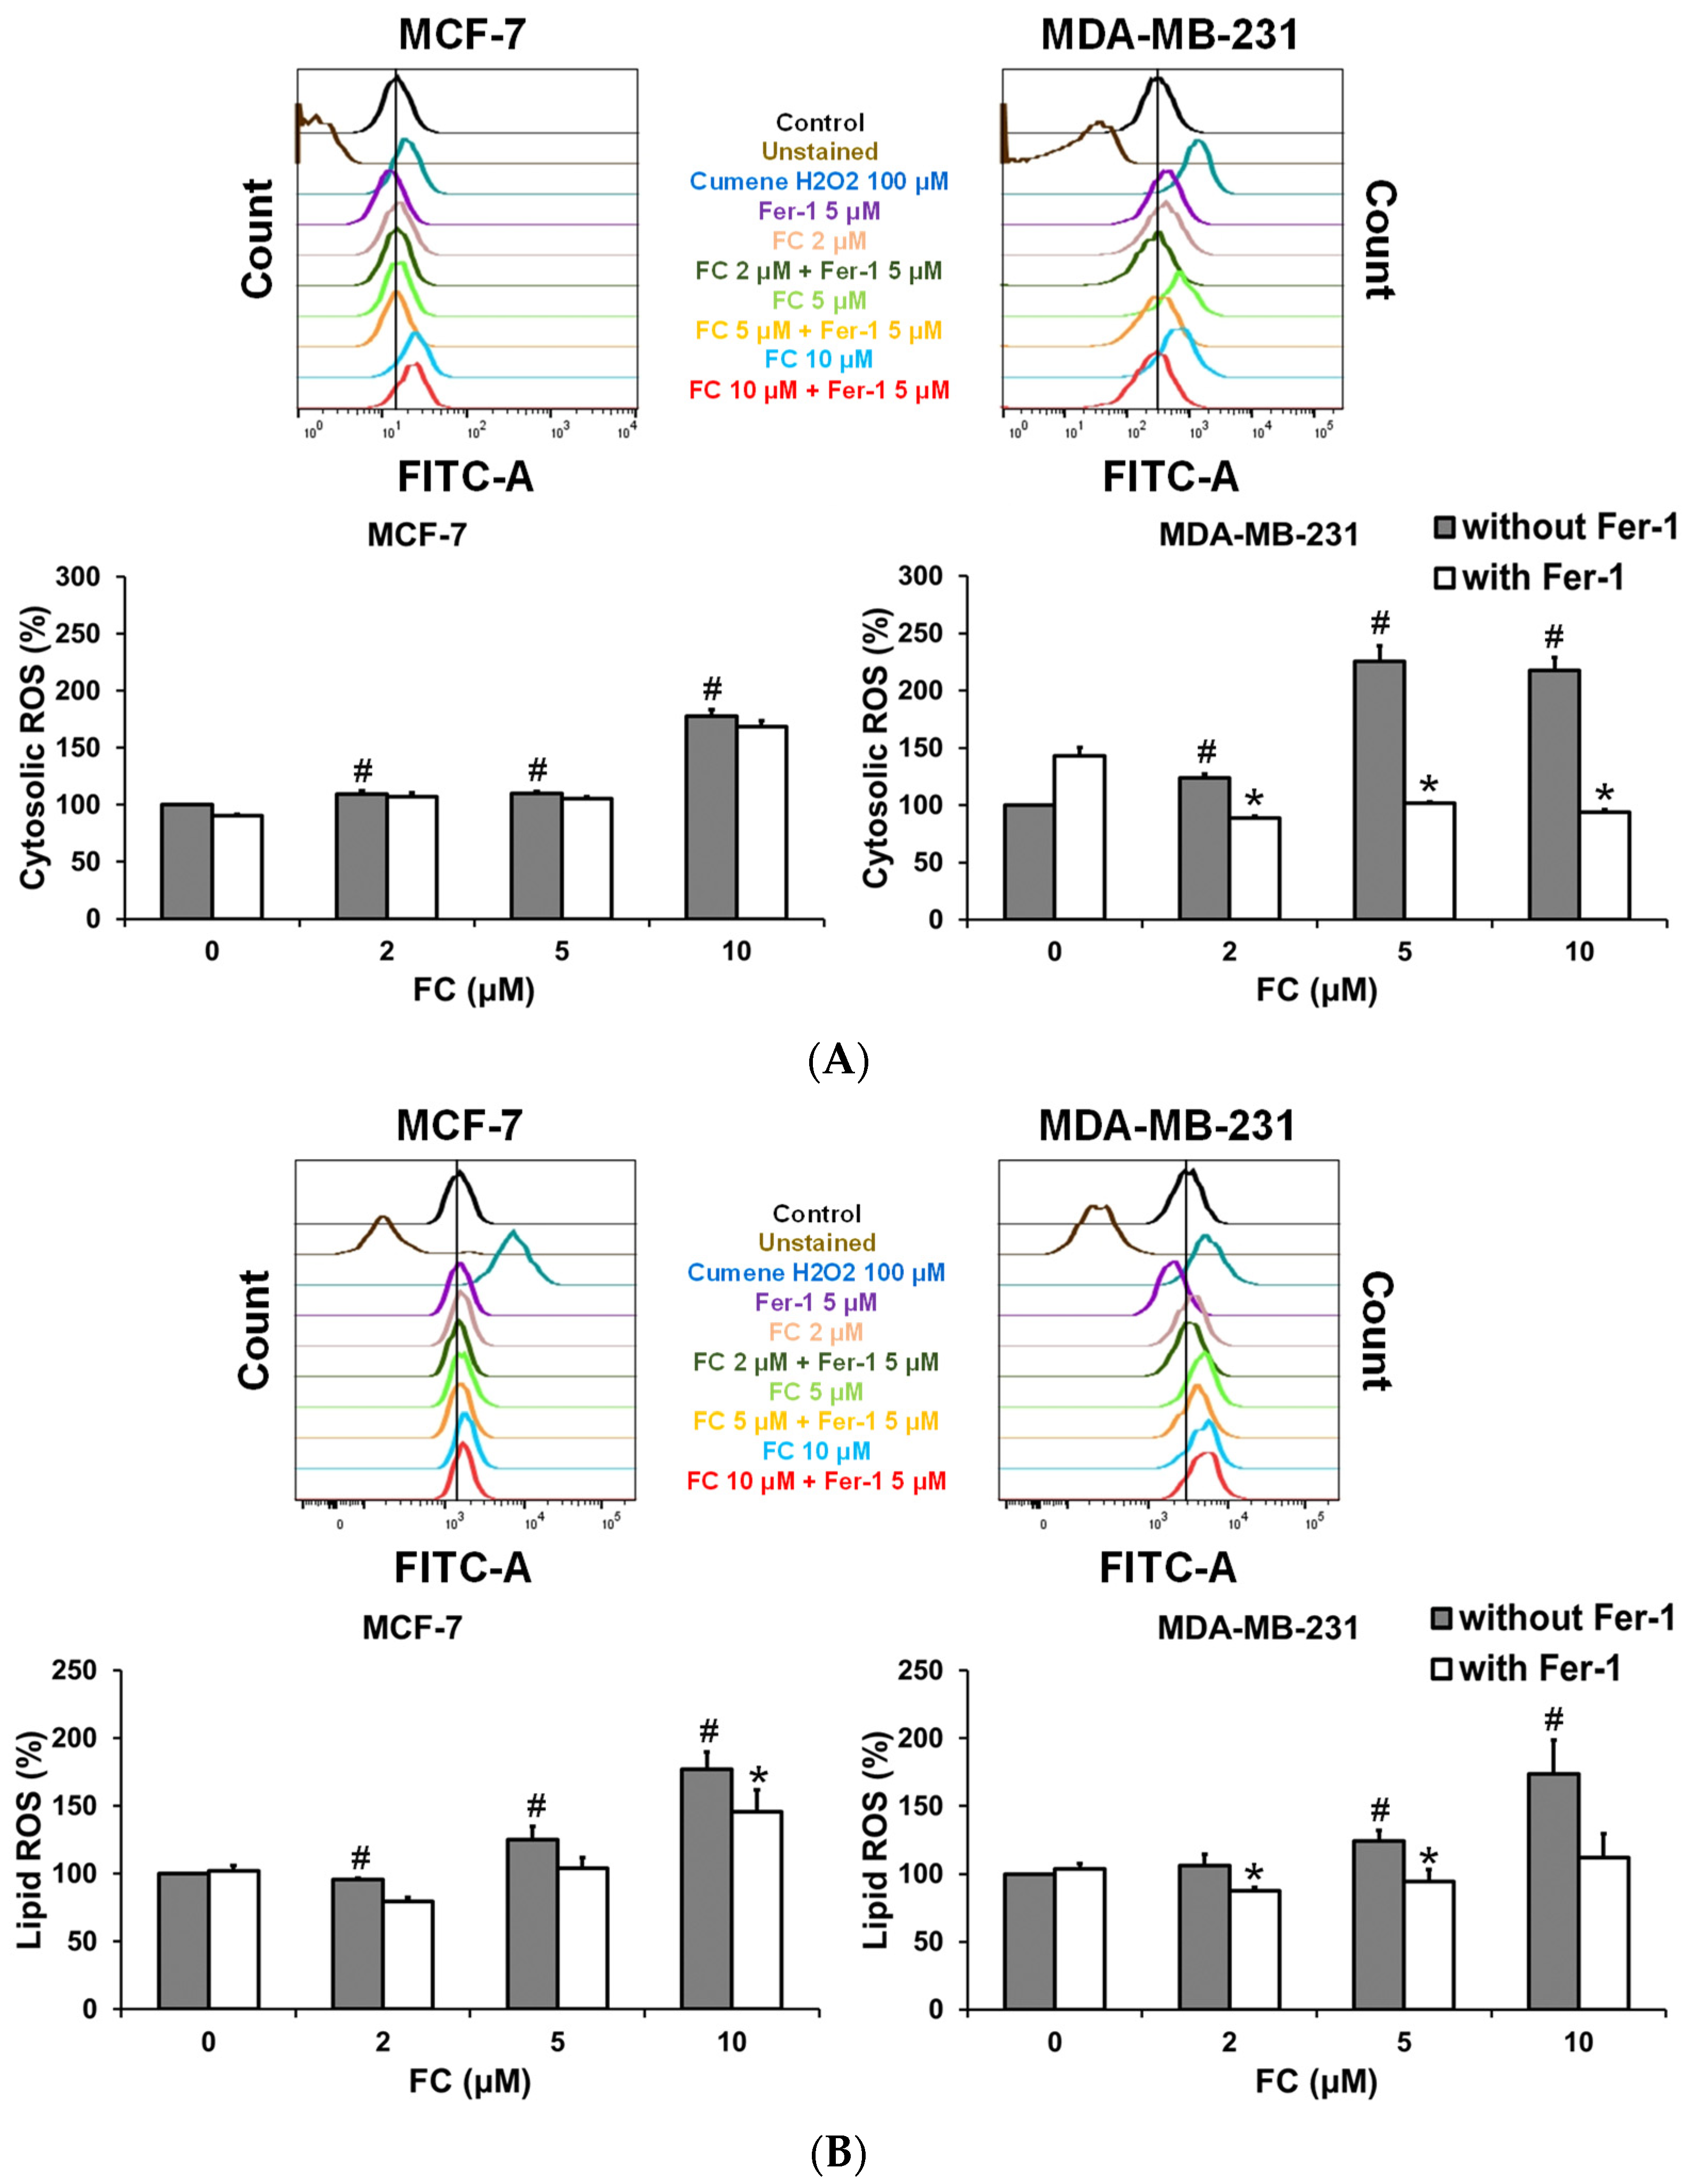
3.2. MDA-MB-231 Cells Are More Effective Than MCF-7 Cells to FC-Induced Cytosolic and Lipid ROS Production and GPX4 Depletion
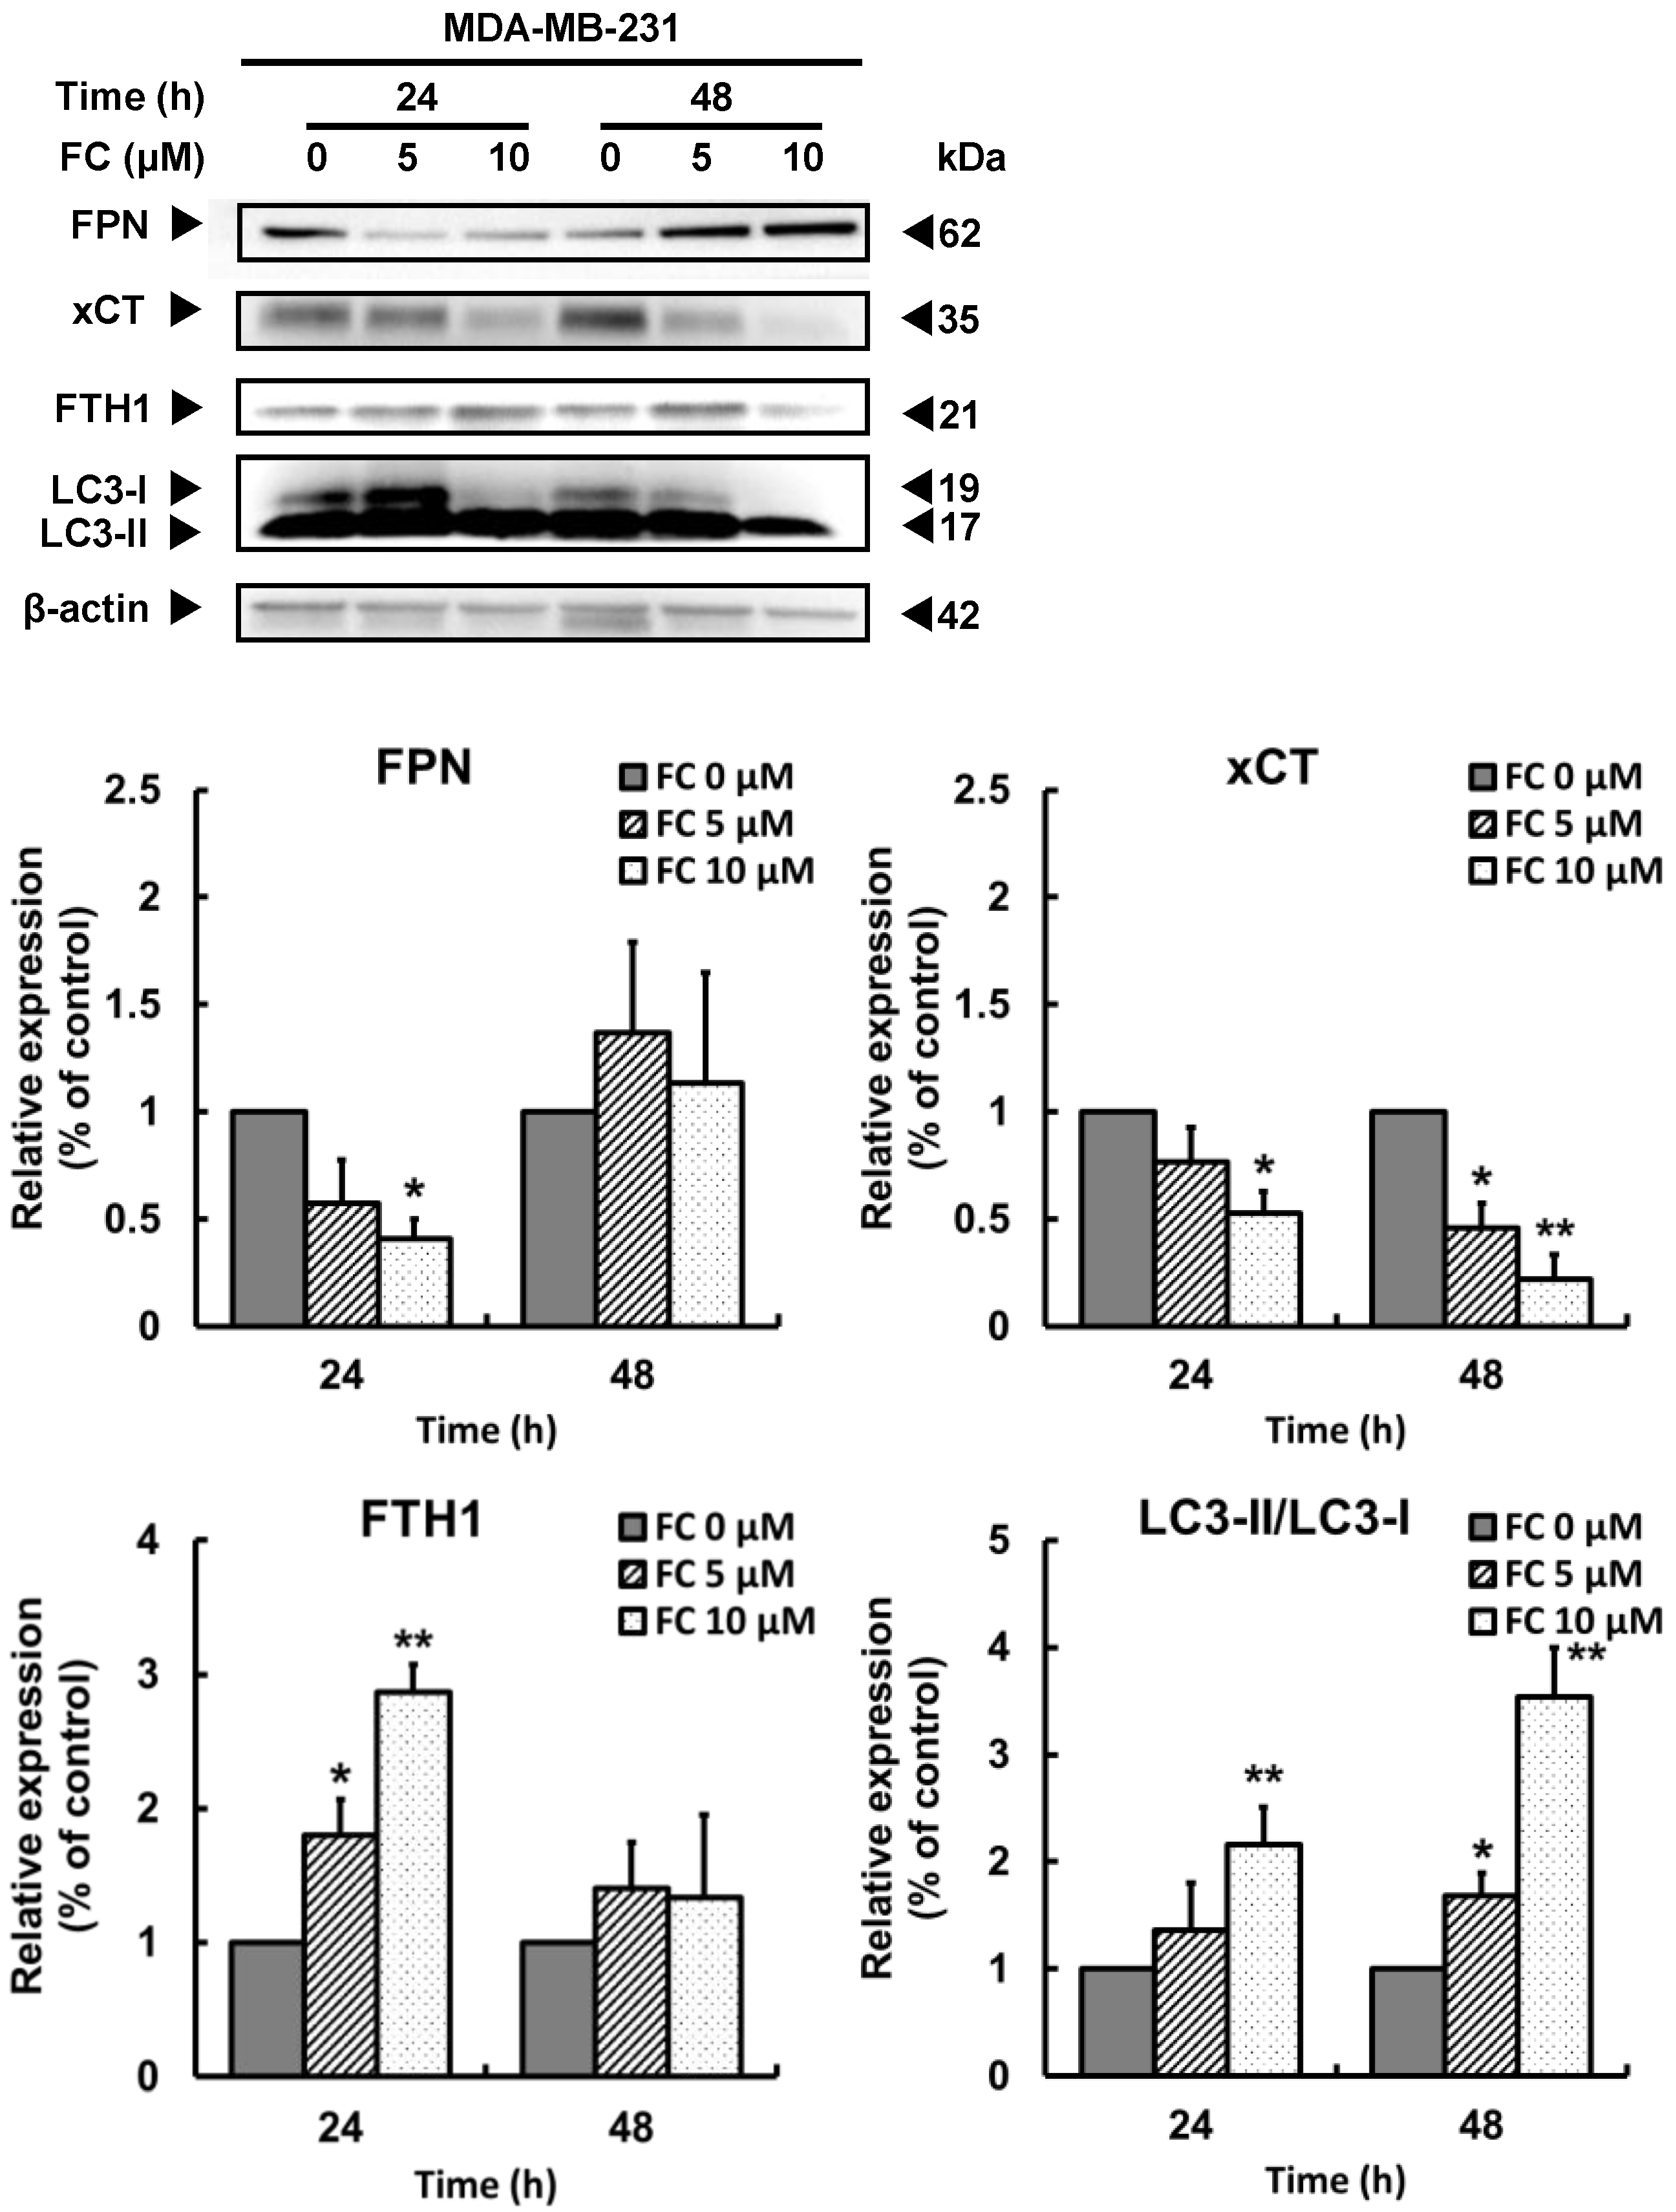
3.3. FC-Induced Ferroptosis Parallels Downregulation of Ferroportin and xCT Expressions and Upregulation of LC3 Expression in TNBC MDA-MB-231 Cells
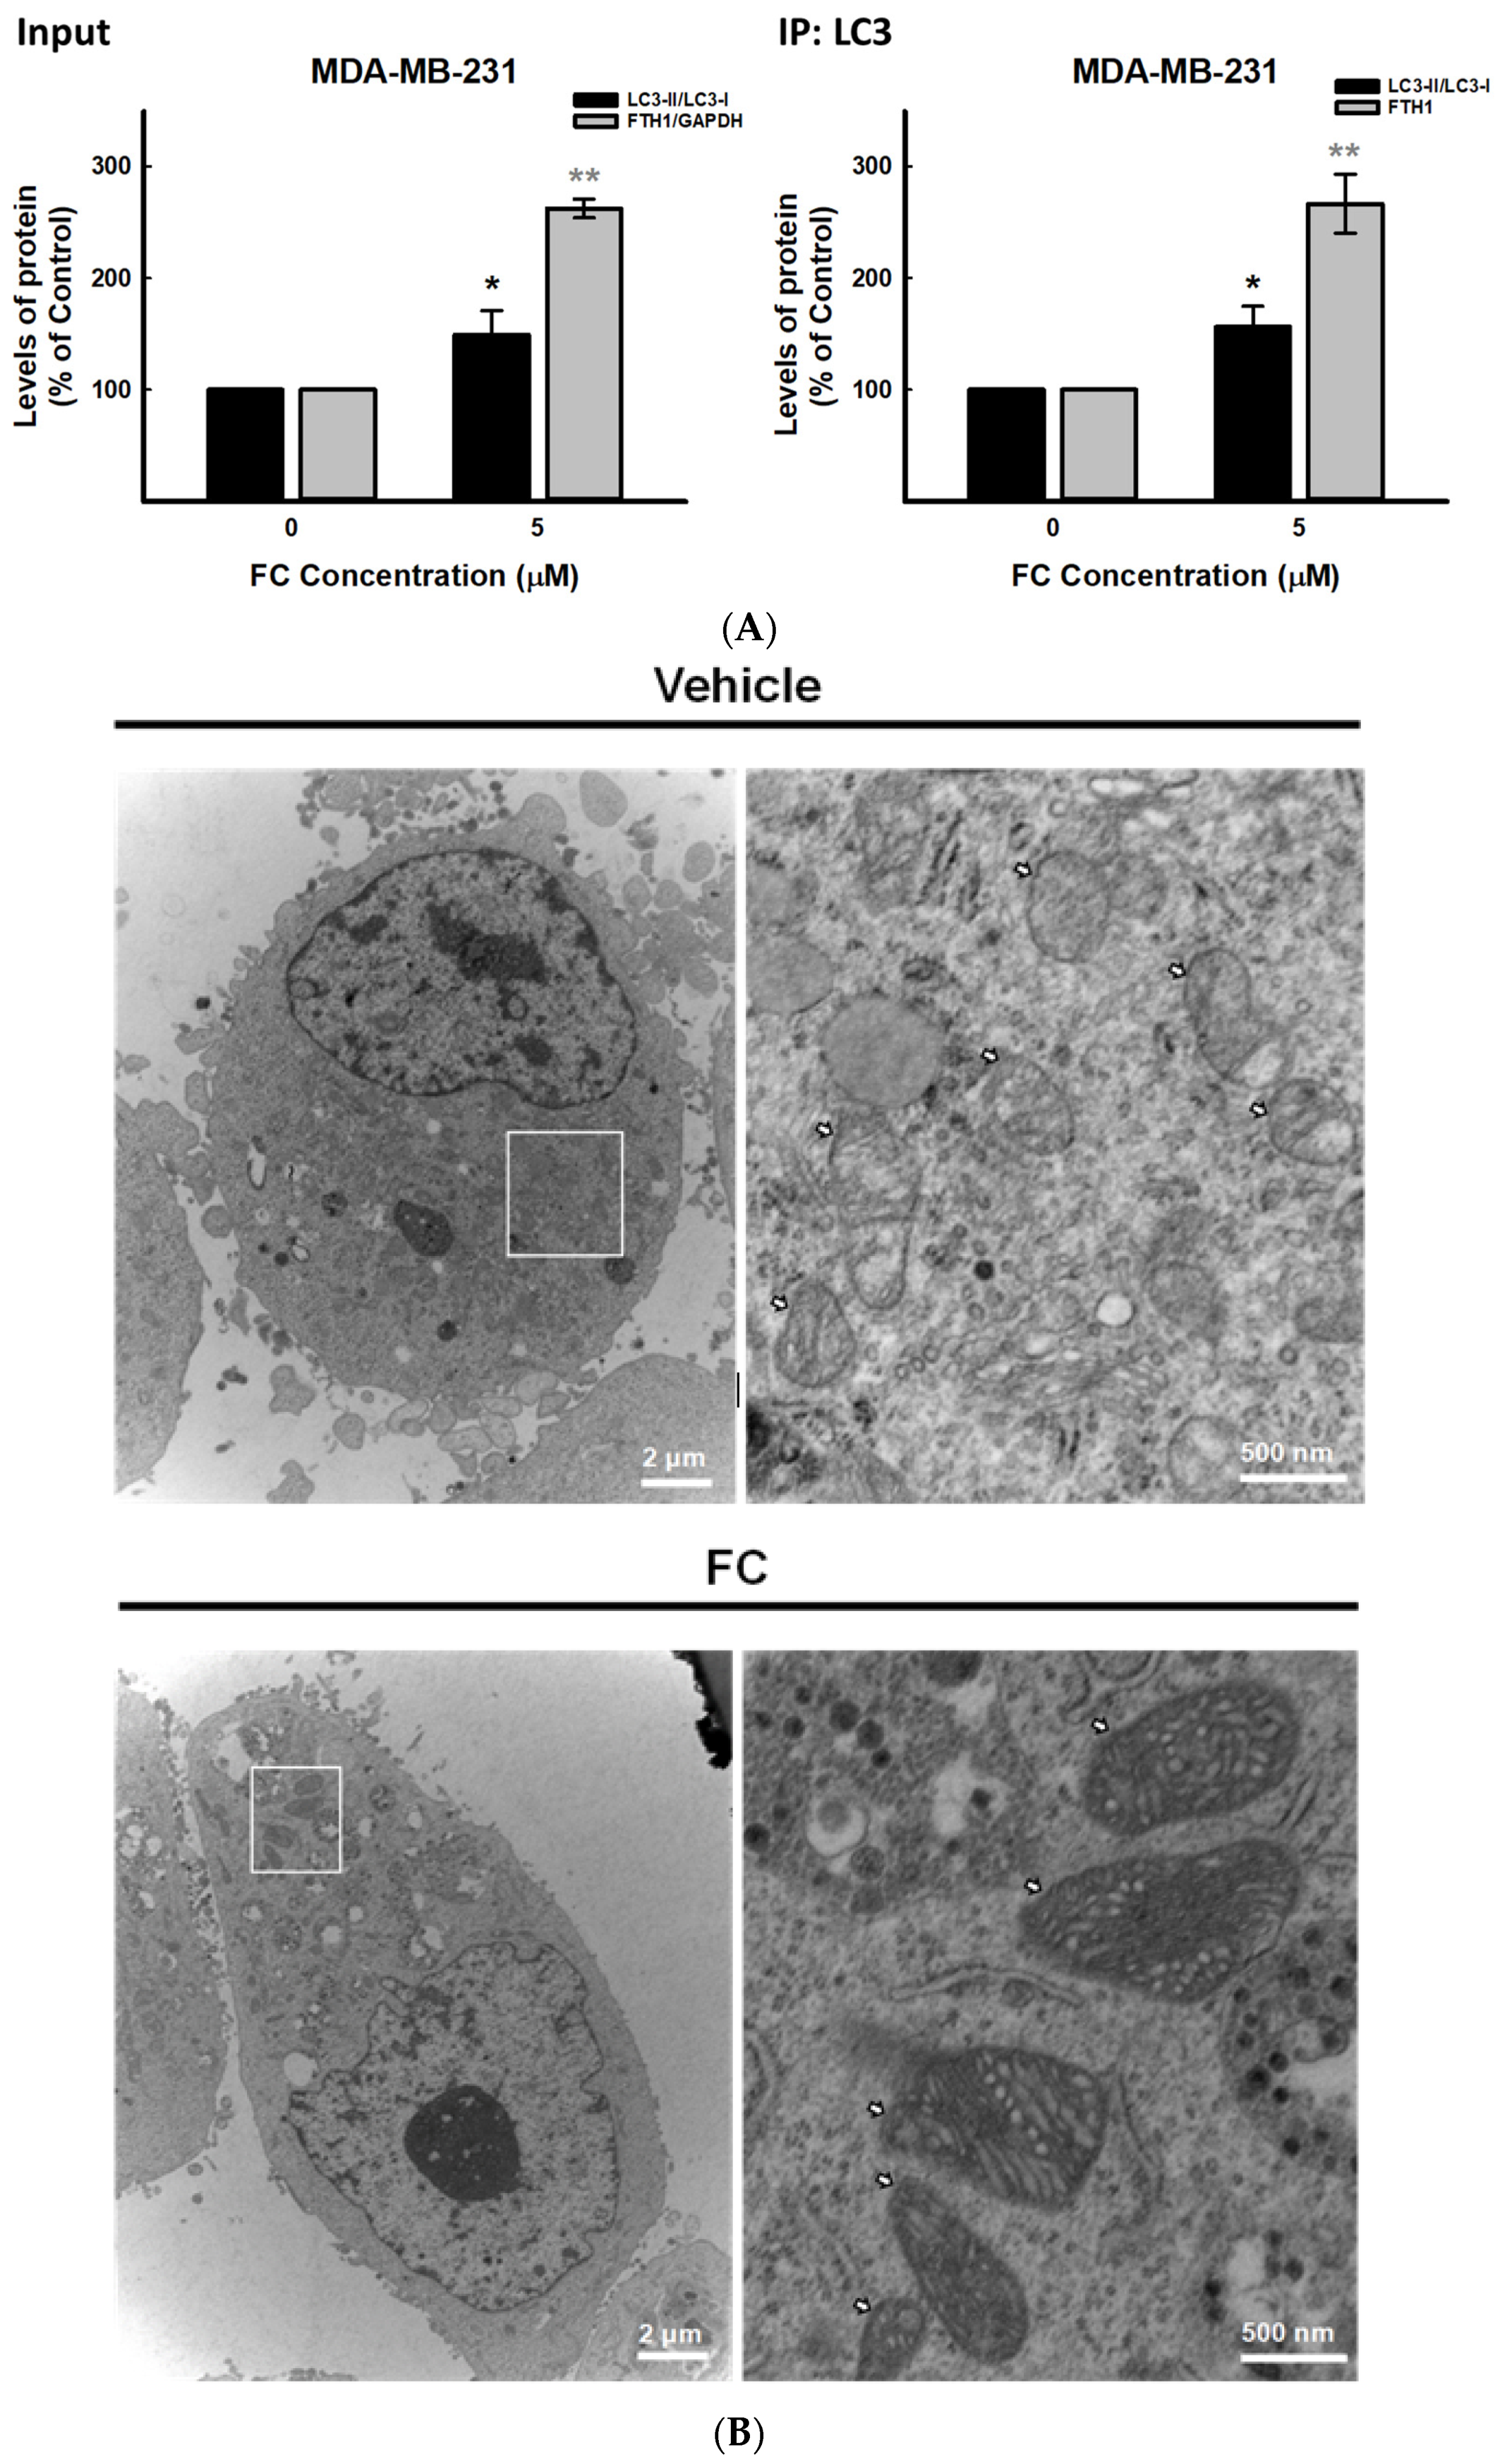
3.4. Confirmation of FC-Induced Ferritinophagy and Ferroptosis in TNBC MDA-MB-231 Cells
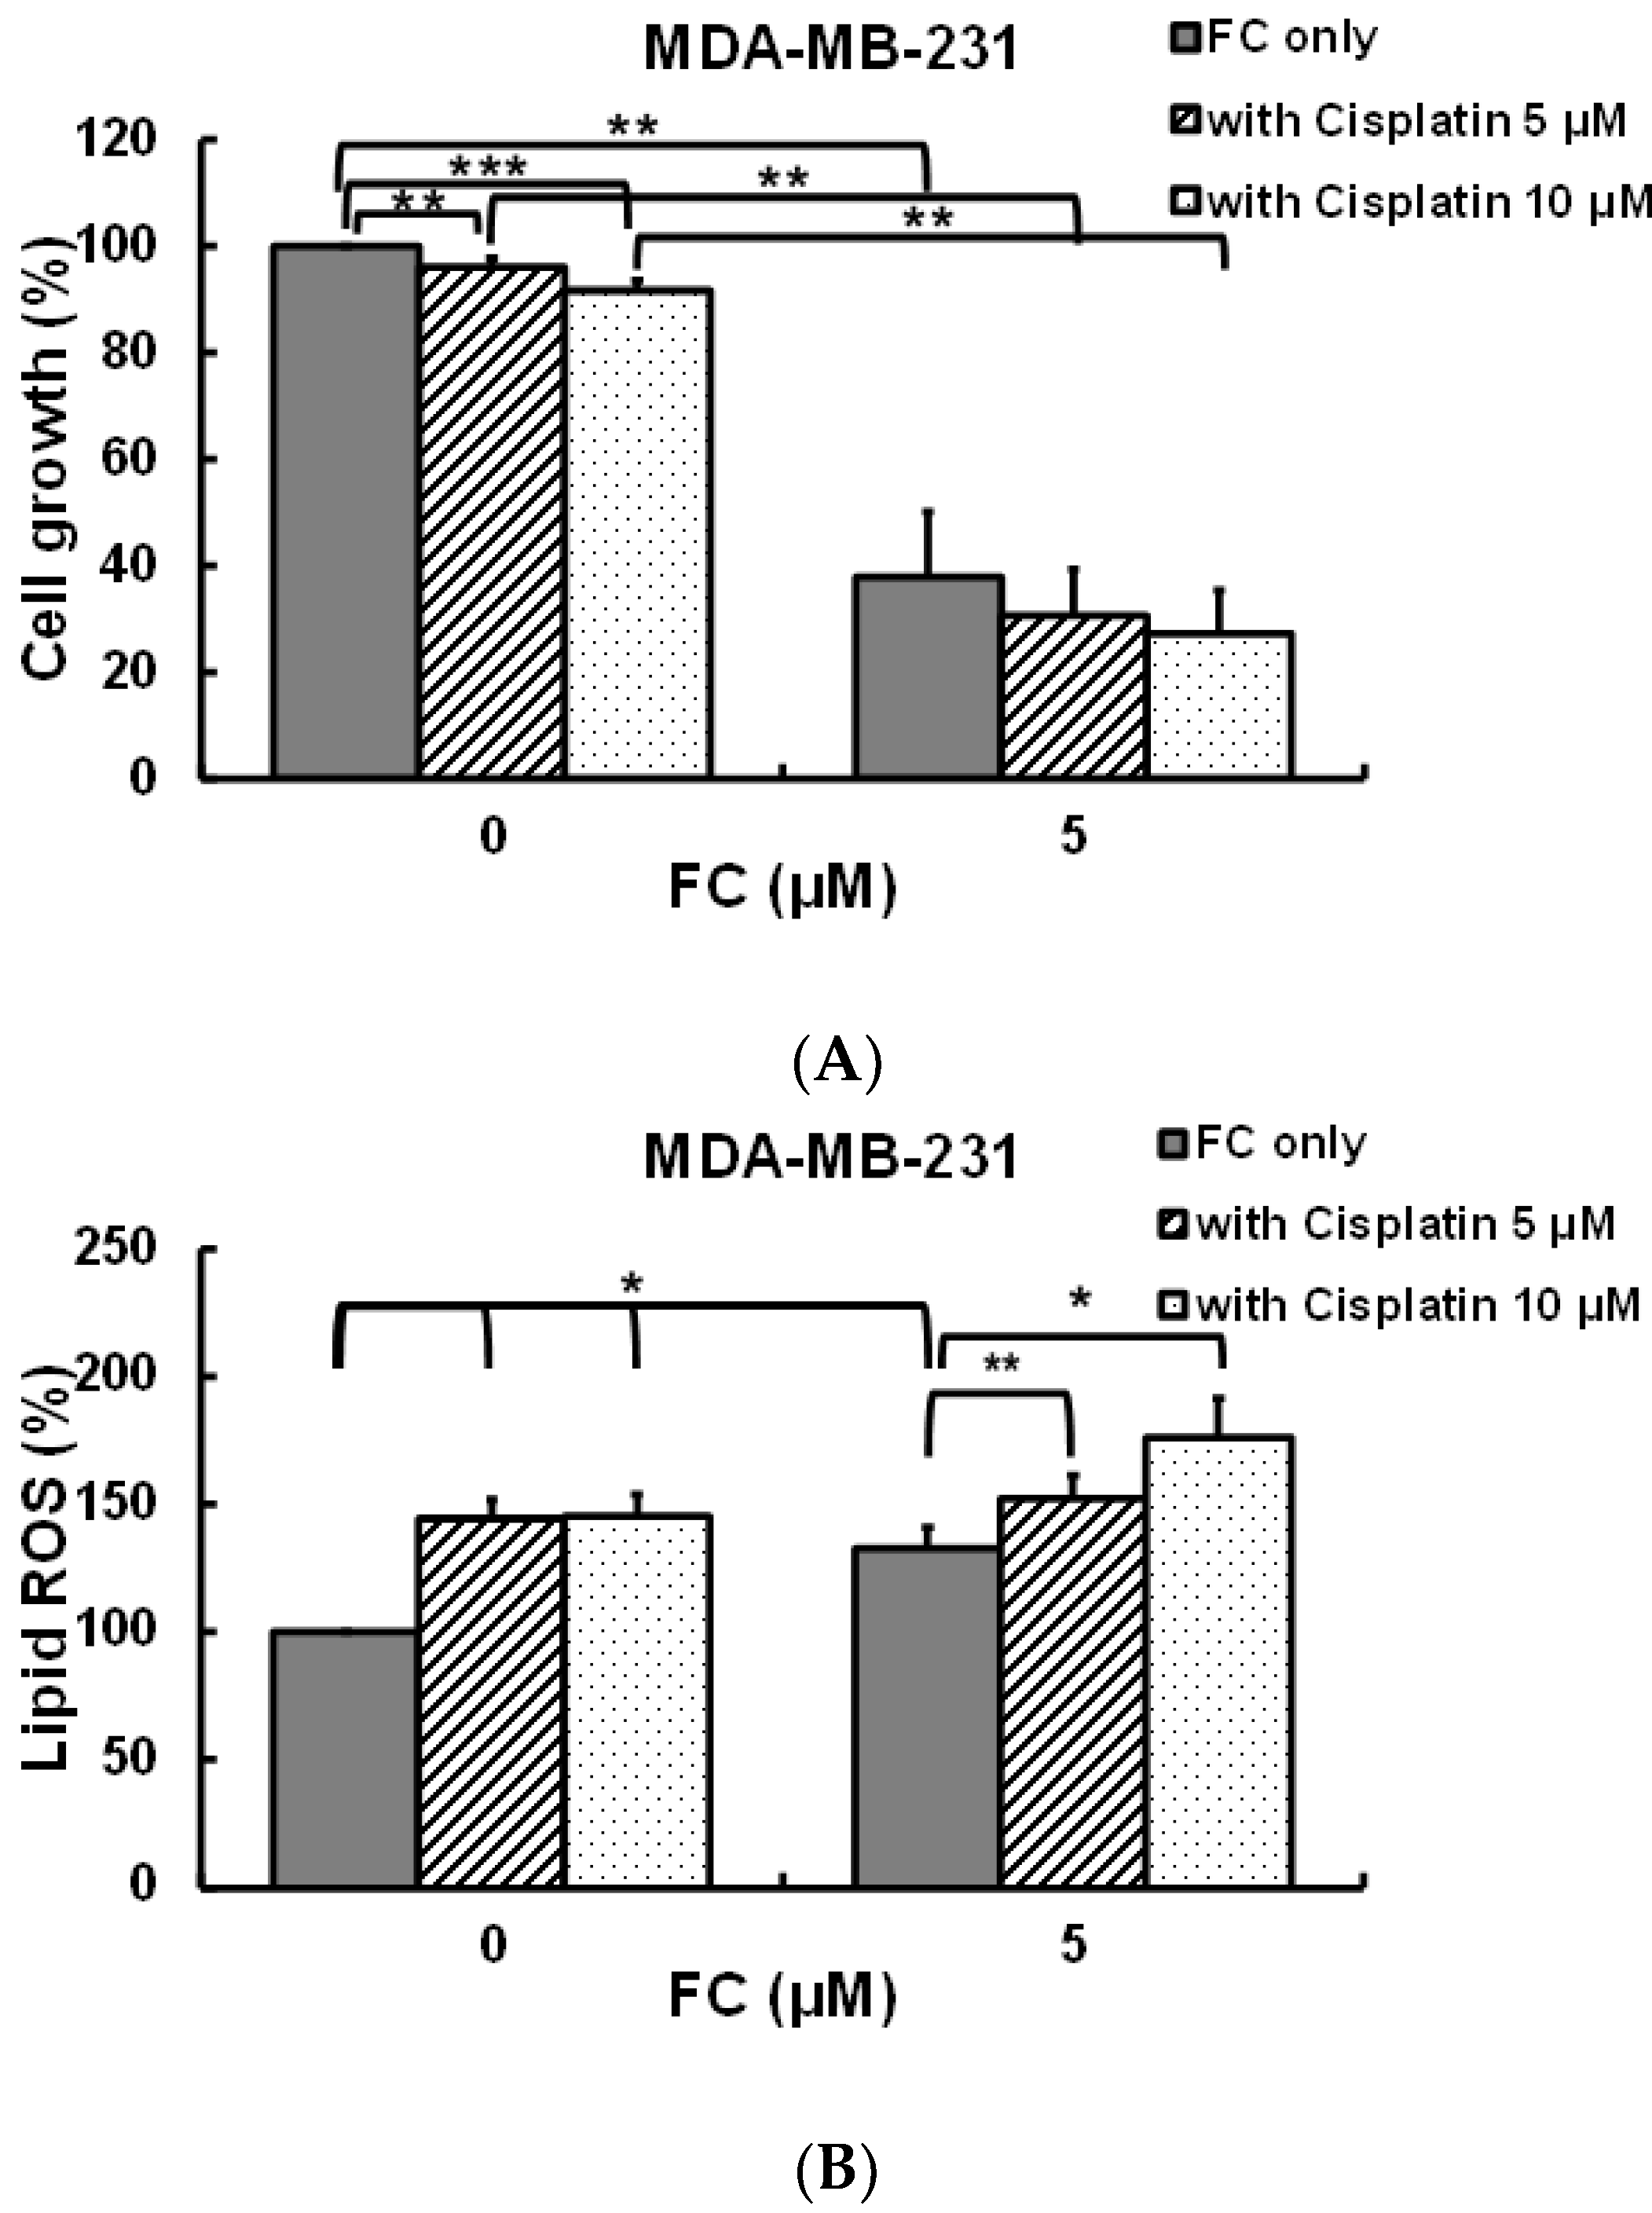
3.5. FC Increases Cisplatin Sensitivity of MDA-MB-231 Cells
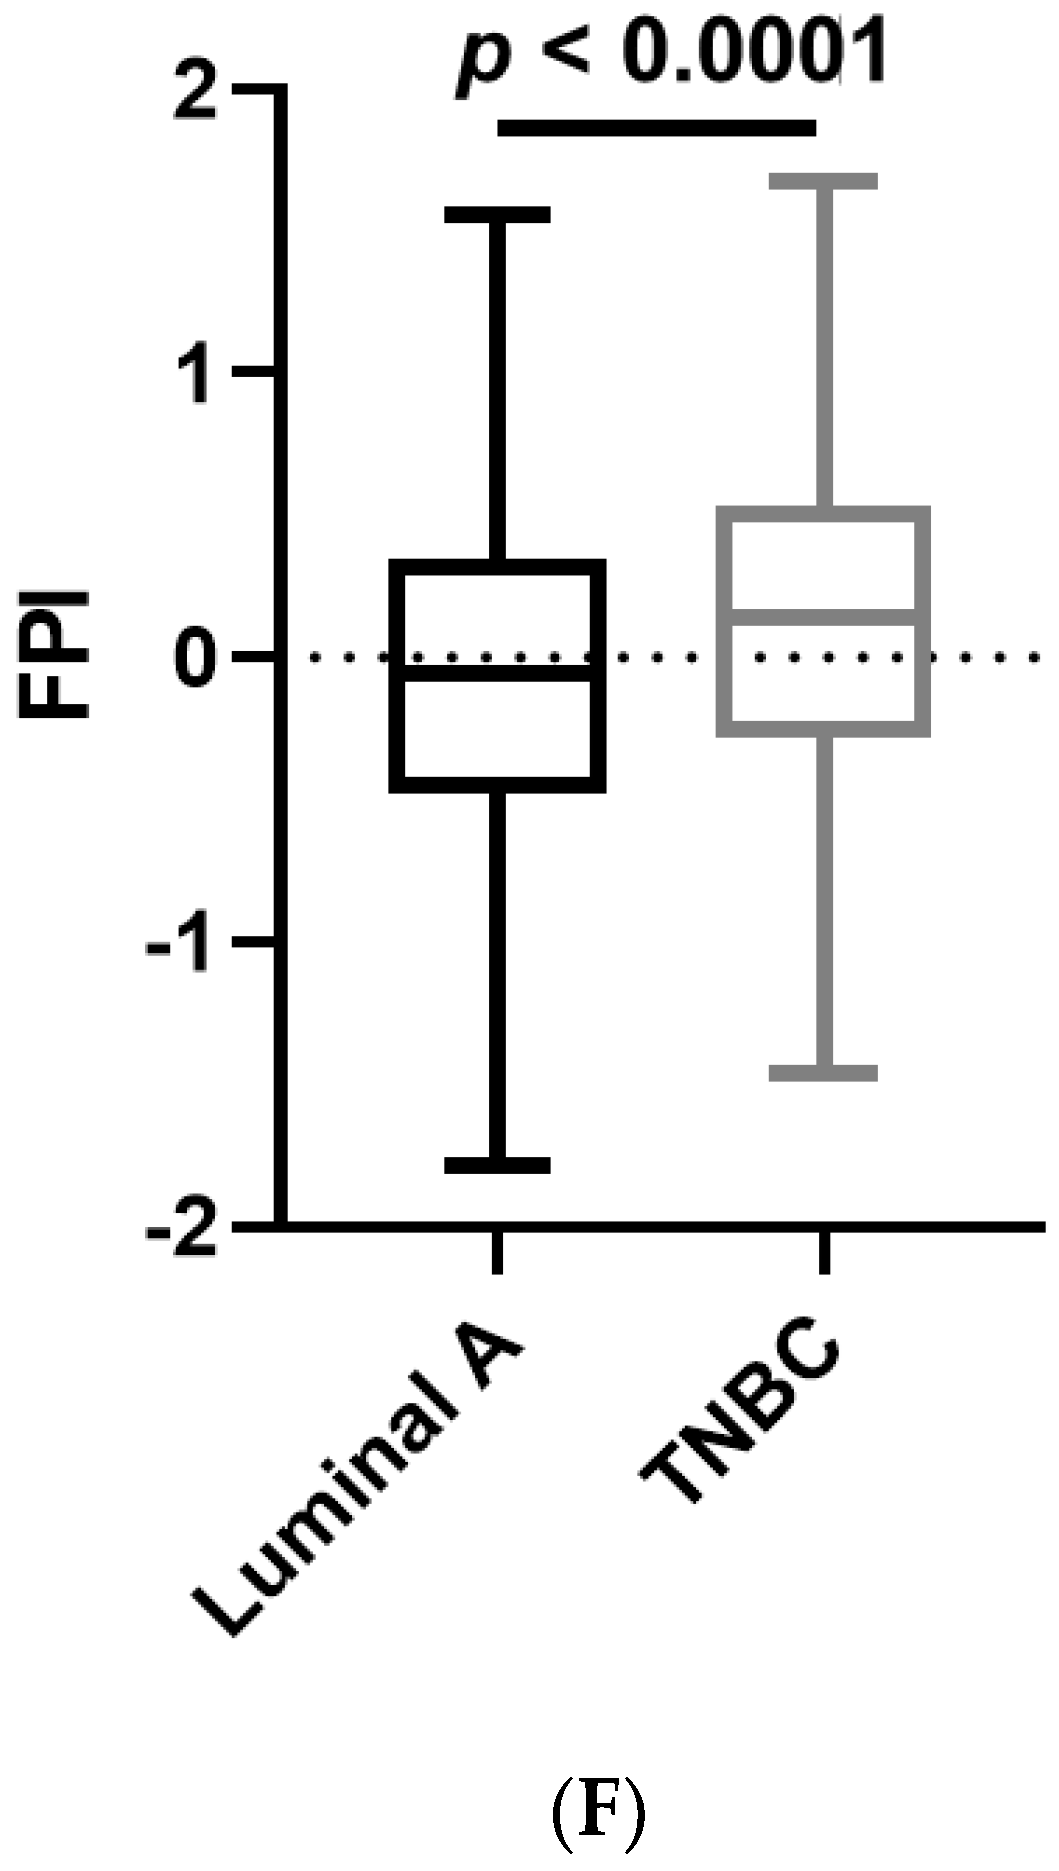
3.6. Analyses of Data Repositories Strengthen the Observed Discrepancy between TNBC and Luminal A on Ferroptosis and Autophagy as well as Hypersensitivity to Ferroptosis in TNBC
4. Discussion
5. Conclusions
Supplementary Materials
Author Contributions
Funding
Institutional Review Board Statement
Informed Consent Statement
Data Availability Statement
Conflicts of Interest
Abbreviations
References
- Sioshansi, S.; Huber, K.E.; Wazer, D.E. The implications of breast cancer molecular phenotype for radiation oncology. Front. Oncol. 2011, 1, 12. [Google Scholar] [CrossRef] [PubMed] [Green Version]
- Szymiczek, A.; Lone, A.; Akbari, M.R. Molecular intrinsic versus clinical subtyping in breast cancer: A comprehensive review. Clin. Genet. 2021, 99, 613–637. [Google Scholar] [CrossRef] [PubMed]
- Nunez Abad, M.; Calabuig-Farinas, S.; Lobo de Mena, M.; Jose Godes Sanz de Bremond, M.; Garcia Gonzalez, C.; Torres Martinez, S.; Garcia-Garcia, J.A.; Iranzo Gonzalez-Cruz, V.; Camps Herrero, C. Update on systemic treatment in early triple negative breast cancer. Ther. Adv. Med. Oncol. 2021, 13, 1758835920986749. [Google Scholar] [CrossRef] [PubMed]
- Dwivedi, S.; Purohit, P.; Misra, R.; Lingeswaran, M.; Vishnoi, J.R.; Pareek, P.; Misra, S.; Sharma, P. Single Cell Omics of Breast Cancer: An Update on Characterization and Diagnosis. Indian J. Clin. Biochem. 2019, 34, 3–18. [Google Scholar] [CrossRef] [PubMed]
- Eiger, D.; Agostinetto, E.; Saude-Conde, R.; de Azambuja, E. The Exciting New Field of HER2-Low Breast Cancer Treatment. Cancers 2021, 13, 1015. [Google Scholar] [CrossRef]
- Dixon, S.J.; Lemberg, K.M.; Lamprecht, M.R.; Skouta, R.; Zaitsev, E.M.; Gleason, C.E.; Patel, D.N.; Bauer, A.J.; Cantley, A.M.; Yang, W.S.; et al. Ferroptosis: An iron-dependent form of nonapoptotic cell death. Cell 2012, 149, 1060–1072. [Google Scholar] [CrossRef] [PubMed] [Green Version]
- Hou, W.; Xie, Y.; Song, X.; Sun, X.; Lotze, M.T.; Zeh, H.J., 3rd; Kang, R.; Tang, D. Autophagy promotes ferroptosis by degradation of ferritin. Autophagy 2016, 12, 1425–1428. [Google Scholar] [CrossRef]
- Ishii, T.; Sugita, Y.; Bannai, S. Regulation of glutathione levels in mouse spleen lymphocytes by transport of cysteine. J. Cell. Physiol. 1987, 133, 330–336. [Google Scholar] [CrossRef]
- Doll, S.; Proneth, B.; Tyurina, Y.Y.; Panzilius, E.; Kobayashi, S.; Ingold, I.; Irmler, M.; Beckers, J.; Aichler, M.; Walch, A.; et al. ACSL4 dictates ferroptosis sensitivity by shaping cellular lipid composition. Nat. Chem. Biol. 2017, 13, 91–98. [Google Scholar] [CrossRef]
- Lachaier, E.; Louandre, C.; Godin, C.; Saidak, Z.; Baert, M.; Diouf, M.; Chauffert, B.; Galmiche, A. Sorafenib induces ferroptosis in human cancer cell lines originating from different solid tumors. Anticancer Res. 2014, 34, 6417–6422. [Google Scholar]
- Dixon, S.J.; Patel, D.N.; Welsch, M.; Skouta, R.; Lee, E.D.; Hayano, M.; Thomas, A.G.; Gleason, C.E.; Tatonetti, N.P.; Slusher, B.S.; et al. Pharmacological inhibition of cystine-glutamate exchange induces endoplasmic reticulum stress and ferroptosis. Elife 2014, 3, e02523. [Google Scholar] [CrossRef] [PubMed]
- Louandre, C.; Ezzoukhry, Z.; Godin, C.; Barbare, J.C.; Maziere, J.C.; Chauffert, B.; Galmiche, A. Iron-dependent cell death of hepatocellular carcinoma cells exposed to sorafenib. Int. J. Cancer 2013, 133, 1732–1742. [Google Scholar] [CrossRef] [PubMed]
- Yang, W.S.; SriRamaratnam, R.; Welsch, M.E.; Shimada, K.; Skouta, R.; Viswanathan, V.S.; Cheah, J.H.; Clemons, P.A.; Shamji, A.F.; Clish, C.B.; et al. Regulation of ferroptotic cancer cell death by GPX4. Cell 2014, 156, 317–331. [Google Scholar] [CrossRef] [PubMed] [Green Version]
- Yagoda, N.; von Rechenberg, M.; Zaganjor, E.; Bauer, A.J.; Yang, W.S.; Fridman, D.J.; Wolpaw, A.J.; Smukste, I.; Peltier, J.M.; Boniface, J.J.; et al. RAS-RAF-MEK-dependent oxidative cell death involving voltage-dependent anion channels. Nature 2007, 447, 864–868. [Google Scholar] [CrossRef] [Green Version]
- Dolma, S.; Lessnick, S.L.; Hahn, W.C.; Stockwell, B.R. Identification of genotype-selective antitumor agents using synthetic lethal chemical screening in engineered human tumor cells. Cancer cell 2003, 3, 285–296. [Google Scholar] [CrossRef] [Green Version]
- Jiang, L.; Kon, N.; Li, T.; Wang, S.J.; Su, T.; Hibshoosh, H.; Baer, R.; Gu, W. Ferroptosis as a p53-mediated activity during tumour suppression. Nature 2015, 520, 57–62. [Google Scholar] [CrossRef] [Green Version]
- Sun, X.; Ou, Z.; Xie, M.; Kang, R.; Fan, Y.; Niu, X.; Wang, H.; Cao, L.; Tang, D. HSPB1 as a novel regulator of ferroptotic cancer cell death. Oncogene 2015, 34, 5617–5625. [Google Scholar] [CrossRef] [Green Version]
- Yu, Y.; Xie, Y.; Cao, L.; Yang, L.; Yang, M.; Lotze, M.T.; Zeh, H.J.; Kang, R.; Tang, D. The ferroptosis inducer erastin enhances sensitivity of acute myeloid leukemia cells to chemotherapeutic agents. Mol. Cell. Oncol. 2015, 2, e1054549. [Google Scholar] [CrossRef] [Green Version]
- Yamaguchi, H.; Hsu, J.L.; Chen, C.T.; Wang, Y.N.; Hsu, M.C.; Chang, S.S.; Du, Y.; Ko, H.W.; Herbst, R.; Hung, M.C. Caspase-independent cell death is involved in the negative effect of EGF receptor inhibitors on cisplatin in non-small cell lung cancer cells. Clin. Cancer Res. 2013, 19, 845–854. [Google Scholar] [CrossRef] [Green Version]
- Chen, L.; Li, X.; Liu, L.; Yu, B.; Xue, Y.; Liu, Y. Erastin sensitizes glioblastoma cells to temozolomide by restraining xCT and cystathionine-gamma-lyase function. Oncol. Rep. 2015, 33, 1465–1474. [Google Scholar] [CrossRef] [Green Version]
- Ooko, E.; Saeed, M.E.; Kadioglu, O.; Sarvi, S.; Colak, M.; Elmasaoudi, K.; Janah, R.; Greten, H.J.; Efferth, T. Artemisinin derivatives induce iron-dependent cell death (ferroptosis) in tumor cells. Phytomedicine 2015, 22, 1045–1054. [Google Scholar] [CrossRef] [PubMed]
- Eling, N.; Reuter, L.; Hazin, J.; Hamacher-Brady, A.; Brady, N.R. Identification of artesunate as a specific activator of ferroptosis in pancreatic cancer cells. Oncoscience 2015, 2, 517–532. [Google Scholar] [CrossRef] [PubMed] [Green Version]
- Tang, D.; Chen, X.; Kang, R.; Kroemer, G. Ferroptosis: Molecular mechanisms and health implications. Cell Res. 2021, 31, 107–125. [Google Scholar] [CrossRef] [PubMed]
- Cipriano, E.; Mesquita, A. Emerging Therapeutic Drugs in Metastatic Triple-Negative Breast Cancer. Breast Cancer 2021, 15, 11782234211002491. [Google Scholar] [CrossRef] [PubMed]
- Lee, J.C.; Su, C.L.; Chen, L.L.; Won, S.J. Formosanin C-induced apoptosis requires activation of caspase-2 and change of mitochondrial membrane potential. Cancer Sci. 2009, 100, 503–513. [Google Scholar] [CrossRef]
- Wu, C.C.; Lu, Y.H.; Wei, B.L.; Yang, S.C.; Won, S.J.; Lin, C.N. Phloroglucinols with prooxidant activity from Garcinia subelliptica. J. Nat. Prod. 2008, 71, 246–250. [Google Scholar] [CrossRef]
- Day, S.H.; Lin, Y.C.; Tsai, M.L.; Tsao, L.T.; Ko, H.H.; Chung, M.I.; Lee, J.C.; Wang, J.P.; Won, S.J.; Lin, C.N. Potent cytotoxic lignans from Justicia procumbens and their effects on nitric oxide and tumor necrosis factor-alpha production in mouse macrophages. J. Nat. Prod. 2002, 65, 379–381. [Google Scholar] [CrossRef]
- Skehan, P.; Storeng, R.; Scudiero, D.; Monks, A.; McMahon, J.; Vistica, D.; Warren, J.T.; Bokesch, H.; Kenney, S.; Boyd, M.R. New colorimetric cytotoxicity assay for anticancer-drug screening. J. Natl. Cancer Inst. 1990, 82, 1107–1112. [Google Scholar] [CrossRef]
- Kim, S.E.; Zhang, L.; Ma, K.; Riegman, M.; Chen, F.; Ingold, I.; Conrad, M.; Turker, M.Z.; Gao, M.; Jiang, X.; et al. Ultrasmall nanoparticles induce ferroptosis in nutrient-deprived cancer cells and suppress tumour growth. Nat. Nanotechnol. 2016, 11, 977–985. [Google Scholar] [CrossRef] [Green Version]
- Pap, E.H.; Drummen, G.P.; Winter, V.J.; Kooij, T.W.; Rijken, P.; Wirtz, K.W.; Op den Kamp, J.A.; Hage, W.J.; Post, J.A. Ratio-fluorescence microscopy of lipid oxidation in living cells using C11-BODIPY(581/591). FEBS Lett. 1999, 453, 278–282. [Google Scholar] [CrossRef] [Green Version]
- Du, J.; Wagner, B.A.; Buettner, G.R.; Cullen, J.J. Role of labile iron in the toxicity of pharmacological ascorbate. Free Radic. Biol. Med. 2015, 84, 289–295. [Google Scholar] [CrossRef] [PubMed] [Green Version]
- Chen, Y.T.; Huang, Z.Y.; Tang, H.H.; Kuo, W.T.; Wu, S.Y.; Lan, S.H.; Chang, K.H.; Lin, P.L.; Lee, M.F.; Cheng, H.C.; et al. Pterostilbene Sensitizes Cisplatin-Resistant Human Bladder Cancer Cells with Oncogenic HRAS. Cancers 2020, 12, 2869. [Google Scholar] [CrossRef] [PubMed]
- Wang, L.; Feng, Z.; Wang, X.; Wang, X.; Zhang, X. DEGseq: An R package for identifying differentially expressed genes from RNA-seq data. Bioinformatics 2010, 26, 136–138. [Google Scholar] [CrossRef]
- Love, M.I.; Huber, W.; Anders, S. Moderated estimation of fold change and dispersion for RNA-seq data with DESeq2. Genome Biol. 2014, 15, 550. [Google Scholar] [CrossRef] [PubMed] [Green Version]
- Schurch, N.J.; Schofield, P.; Gierlinski, M.; Cole, C.; Sherstnev, A.; Singh, V.; Wrobel, N.; Gharbi, K.; Simpson, G.G.; Owen-Hughes, T.; et al. How many biological replicates are needed in an RNA-seq experiment and which differential expression tool should you use? RNA 2016, 22, 839–851. [Google Scholar] [CrossRef] [Green Version]
- Anders, S.; McCarthy, D.J.; Chen, Y.; Okoniewski, M.; Smyth, G.K.; Huber, W.; Robinson, M.D. Count-based differential expression analysis of RNA sequencing data using R and Bioconductor. Nat. Protoc. 2013, 8, 1765–1786. [Google Scholar] [CrossRef]
- Li, B.; Dong, C.; Li, P.; Ren, Z.; Wang, H.; Yu, F.; Ning, C.; Liu, K.; Wei, W.; Huang, R.; et al. Identification of candidate genes associated with porcine meat color traits by genome-wide transcriptome analysis. Sci. Rep. 2016, 6, 35224. [Google Scholar] [CrossRef] [Green Version]
- Maza, E. In Papyro Comparison of TMM (edgeR), RLE (DESeq2), and MRN Normalization Methods for a Simple Two-Conditions-Without-Replicates RNA-Seq Experimental Design. Front. Genet. 2016, 7, 164. [Google Scholar] [CrossRef] [Green Version]
- Curtis, C.; Shah, S.P.; Chin, S.F.; Turashvili, G.; Rueda, O.M.; Dunning, M.J.; Speed, D.; Lynch, A.G.; Samarajiwa, S.; Yuan, Y.; et al. The genomic and transcriptomic architecture of 2,000 breast tumours reveals novel subgroups. Nature 2012, 486, 346–352. [Google Scholar] [CrossRef]
- Pereira, B.; Chin, S.F.; Rueda, O.M.; Vollan, H.K.; Provenzano, E.; Bardwell, H.A.; Pugh, M.; Jones, L.; Russell, R.; Sammut, S.J.; et al. The somatic mutation profiles of 2,433 breast cancers refines their genomic and transcriptomic landscapes. Nat. Commun. 2016, 7, 11479. [Google Scholar] [CrossRef] [Green Version]
- Cerami, E.; Gao, J.; Dogrusoz, U.; Gross, B.E.; Sumer, S.O.; Aksoy, B.A.; Jacobsen, A.; Byrne, C.J.; Heuer, M.L.; Larsson, E.; et al. The cBio cancer genomics portal: An open platform for exploring multidimensional cancer genomics data. Cancer Discov. 2012, 2, 401–404. [Google Scholar] [CrossRef] [Green Version]
- Gao, J.; Aksoy, B.A.; Dogrusoz, U.; Dresdner, G.; Gross, B.; Sumer, S.O.; Sun, Y.; Jacobsen, A.; Sinha, R.; Larsson, E.; et al. Integrative analysis of complex cancer genomics and clinical profiles using the cBioPortal. Sci. Signal. 2013, 6, pl1. [Google Scholar] [CrossRef] [PubMed] [Green Version]
- Kamburov, A.; Stelzl, U.; Lehrach, H.; Herwig, R. The ConsensusPathDB interaction database: 2013 update. Nucleic Acids Res. 2013, 41, D793–D800. [Google Scholar] [CrossRef] [PubMed]
- Martens, M.; Ammar, A.; Riutta, A.; Waagmeester, A.; Slenter, D.N.; Hanspers, K.R.A.M.; Digles, D.; Lopes, E.N.; Ehrhart, F.; Dupuis, L.J.; et al. WikiPathways: Connecting communities. Nucleic Acids Res. 2021, 49, D613–D621. [Google Scholar] [CrossRef] [PubMed]
- Subramanian, A.; Tamayo, P.; Mootha, V.K.; Mukherjee, S.; Ebert, B.L.; Gillette, M.A.; Paulovich, A.; Pomeroy, S.L.; Golub, T.R.; Lander, E.S.; et al. Gene set enrichment analysis: A knowledge-based approach for interpreting genome-wide expression profiles. Proc. Natl. Acad. Sci. USA 2005, 102, 15545–15550. [Google Scholar] [CrossRef] [PubMed] [Green Version]
- Zhou, N.; Bao, J. FerrDb: A manually curated resource for regulators and markers of ferroptosis and ferroptosis-disease associations. Database 2020, 2020. [Google Scholar] [CrossRef]
- Oliveros, J.C. VENNY. An Interactive Tool for Comparing Lists with Venn Diagrams. Available online: http://bioinfogp.cnb.csic.es/tools/venny/index.html (accessed on 28 April 2021).
- Liu, Z.; Zhao, Q.; Zuo, Z.X.; Yuan, S.Q.; Yu, K.; Zhang, Q.; Zhang, X.; Sheng, H.; Ju, H.Q.; Cheng, H.; et al. Systematic Analysis of the Aberrances and Functional Implications of Ferroptosis in Cancer. iScience 2020, 23, 101302. [Google Scholar] [CrossRef]
- Hanzelmann, S.; Castelo, R.; Guinney, J. GSVA: Gene set variation analysis for microarray and RNA-seq data. BMC Bioinformatics 2013, 14, 7. [Google Scholar] [CrossRef] [Green Version]
- Fahad Ullah, M. Breast Cancer: Current Perspectives on the Disease Status. Adv. Exp. Med. Biol. 2019, 1152, 51–64. [Google Scholar] [CrossRef]
- Lin, P.L.; Tang, H.H.; Wu, S.Y.; Shaw, N.S.; Su, C.L. Saponin Formosanin C-induced Ferritinophagy and Ferroptosis in Human Hepatocellular Carcinoma Cells. Antioxidants 2020, 9, 682. [Google Scholar] [CrossRef]
- Li, Y.; Yan, H.; Xu, X.; Liu, H.; Wu, C.; Zhao, L. Erastin/sorafenib induces cisplatin-resistant non-small cell lung cancer cell ferroptosis through inhibition of the Nrf2/xCT pathway. Oncol. Lett. 2020, 19, 323–333. [Google Scholar] [CrossRef] [PubMed] [Green Version]
- Fu, D.; Wang, C.; Yu, L.; Yu, R. Induction of ferroptosis by ATF3 elevation alleviates cisplatin resistance in gastric cancer by restraining Nrf2/Keap1/xCT signaling. Cell. Mol. Biol. Lett. 2021, 26, 26. [Google Scholar] [CrossRef] [PubMed]
- Roh, J.L.; Kim, E.H.; Jang, H.J.; Park, J.Y.; Shin, D. Induction of ferroptotic cell death for overcoming cisplatin resistance of head and neck cancer. Cancer Lett. 2016, 381, 96–103. [Google Scholar] [CrossRef] [PubMed]
- Yang, M.; Zou, J.; Zhu, H.; Liu, S.; Wang, H.; Bai, P.; Xiao, X. Paris saponin II inhibits human ovarian cancer cell-induced angiogenesis by modulating NF-kappaB signaling. Oncol. Rep. 2015, 33, 2190–2198. [Google Scholar] [CrossRef] [PubMed] [Green Version]
- Wu, R.T.; Chiang, H.C.; Fu, W.C.; Chien, K.Y.; Chung, Y.M.; Horng, L.Y. Formosanin-C, an immunomodulator with antitumor activity. Int. J. Immunopharmacol. 1990, 12, 777–786. [Google Scholar] [CrossRef]
- Chiang, H.C.; Wang, J.J.; Wu, R.T. Immunomodulating effects of the hydrolysis products of formosanin C and beta-ecdysone from Paris formosana Hayata. Anticancer Res. 1992, 12, 1475–1478. [Google Scholar]
- Wei, G.; Sun, J.; Hou, Z.; Luan, W.; Wang, S.; Cui, S.; Cheng, M.; Liu, Y. Novel antitumor compound optimized from natural saponin Albiziabioside A induced caspase-dependent apoptosis and ferroptosis as a p53 activator through the mitochondrial pathway. Eur. J. Med. Chem. 2018, 157, 759–772. [Google Scholar] [CrossRef]
- Liu, J.; Man, S.; Liu, Z.; Ma, L.; Gao, W. A synergistic antitumor effect of polyphyllin I and formosanin C on hepatocarcinoma cells. Bioorg. Med. Chem. Lett. 2016, 26, 4970–4975. [Google Scholar] [CrossRef]
- Li, Y.; Man, S.; Li, J.; Chai, H.; Fan, W.; Liu, Z.; Gao, W. The antitumor effect of formosanin C on HepG2 cell as revealed by 1H-NMR based metabolic profiling. Chem. Biol. Interact. 2014, 220, 193–199. [Google Scholar] [CrossRef]
- Chen, M.; Ye, K.; Zhang, B.; Xin, Q.; Li, P.; Kong, A.N.; Wen, X.; Yang, J. Paris Saponin II inhibits colorectal carcinogenesis by regulating mitochondrial fission and NF-kappaB pathway. Pharmacol. Res. 2019, 139, 273–285. [Google Scholar] [CrossRef]
- Man, S.; Lv, P.; Cui, J.; Liu, F.; Peng, L.; Ma, L.; Liu, C.; Gao, W. Paris saponin II-induced paraptosis-associated cell death increased the sensitivity of cisplatin. Toxicol. Appl. Pharmacol. 2020, 406, 115206. [Google Scholar] [CrossRef] [PubMed]
- Cui, J.; Man, S.; Cui, N.; Yang, L.; Guo, Q.; Ma, L.; Gao, W. The synergistic anticancer effect of formosanin C and polyphyllin VII based on caspase-mediated cleavage of Beclin1 inhibiting autophagy and promoting apoptosis. Cell Prolif. 2019, 52, e12520. [Google Scholar] [CrossRef] [PubMed] [Green Version]
- Gao, M.; Yi, J.; Zhu, J.; Minikes, A.M.; Monian, P.; Thompson, C.B.; Jiang, X. Role of Mitochondria in Ferroptosis. Mol. Cell 2019, 73, 354–363.e353. [Google Scholar] [CrossRef] [PubMed] [Green Version]
- Gao, M.; Monian, P.; Quadri, N.; Ramasamy, R.; Jiang, X. Glutaminolysis and Transferrin Regulate Ferroptosis. Mol. Cell 2015, 59, 298–308. [Google Scholar] [CrossRef] [Green Version]
- Cao, J.Y.; Dixon, S.J. Mechanisms of ferroptosis. Cell. Mol. Life Sci. 2016, 73, 2195–2209. [Google Scholar] [CrossRef] [Green Version]
- Kryukov, G.V.; Castellano, S.; Novoselov, S.V.; Lobanov, A.V.; Zehtab, O.; Guigo, R.; Gladyshev, V.N. Characterization of mammalian selenoproteomes. Science 2003, 300, 1439–1443. [Google Scholar] [CrossRef] [Green Version]
- Zoidis, E.; Seremelis, I.; Kontopoulos, N.; Danezis, G.P. Selenium-Dependent Antioxidant Enzymes: Actions and Properties of Selenoproteins. Antioxidants 2018, 7, 66. [Google Scholar] [CrossRef] [Green Version]
- Ingold, I.; Berndt, C.; Schmitt, S.; Doll, S.; Poschmann, G.; Buday, K.; Roveri, A.; Peng, X.; Porto Freitas, F.; Seibt, T.; et al. Selenium Utilization by GPX4 Is Required to Prevent Hydroperoxide-Induced Ferroptosis. Cell 2018, 172, 409–422.e421. [Google Scholar] [CrossRef] [Green Version]
- Reeves, M.A.; Hoffmann, P.R. The human selenoproteome: Recent insights into functions and regulation. Cell. Mol. Life Sci. 2009, 66, 2457–2478. [Google Scholar] [CrossRef] [Green Version]
- Burk, R.F.; Hill, K.E. Regulation of Selenium Metabolism and Transport. Annu. Rev. Nutr. 2015, 35, 109–134. [Google Scholar] [CrossRef]
- Lei, X.G.; Evenson, J.K.; Thompson, K.M.; Sunde, R.A. Glutathione peroxidase and phospholipid hydroperoxide glutathione peroxidase are differentially regulated in rats by dietary selenium. J. Nutr. 1995, 125, 1438–1446. [Google Scholar] [CrossRef]
- Yang, W.S.; Stockwell, B.R. Synthetic lethal screening identifies compounds activating iron-dependent, nonapoptotic cell death in oncogenic-RAS-harboring cancer cells. Chem. Biol. 2008, 15, 234–245. [Google Scholar] [CrossRef] [PubMed] [Green Version]
- Sastry, J.; Kellie, S.J. Severe neurotoxicity, ototoxicity and nephrotoxicity following high-dose cisplatin and amifostine. Pediatr. Hematol. Oncol. 2005, 22, 441–445. [Google Scholar] [CrossRef] [PubMed]
- Wang, S.; Li, M.Y.; Liu, Y.; Vlantis, A.C.; Chan, J.Y.; Xue, L.; Hu, B.G.; Yang, S.; Chen, M.X.; Zhou, S.; et al. The role of microRNA in cisplatin resistance or sensitivity. Expert. Opin. Ther. Targets 2020, 24, 885–897. [Google Scholar] [CrossRef] [PubMed]
- Guo, J.; Xu, B.; Han, Q.; Zhou, H.; Xia, Y.; Gong, C.; Dai, X.; Li, Z.; Wu, G. Ferroptosis: A Novel Anti-tumor Action for Cisplatin. Cancer Res. Treat. 2018, 50, 445–460. [Google Scholar] [CrossRef] [PubMed] [Green Version]


Publisher’s Note: MDPI stays neutral with regard to jurisdictional claims in published maps and institutional affiliations. |
© 2022 by the authors. Licensee MDPI, Basel, Switzerland. This article is an open access article distributed under the terms and conditions of the Creative Commons Attribution (CC BY) license (https://creativecommons.org/licenses/by/4.0/).
Share and Cite
Chen, H.-C.; Tang, H.-H.; Hsu, W.-H.; Wu, S.-Y.; Cheng, W.-H.; Wang, B.-Y.; Su, C.-L. Vulnerability of Triple-Negative Breast Cancer to Saponin Formosanin C-Induced Ferroptosis. Antioxidants 2022, 11, 298. https://doi.org/10.3390/antiox11020298
Chen H-C, Tang H-H, Hsu W-H, Wu S-Y, Cheng W-H, Wang B-Y, Su C-L. Vulnerability of Triple-Negative Breast Cancer to Saponin Formosanin C-Induced Ferroptosis. Antioxidants. 2022; 11(2):298. https://doi.org/10.3390/antiox11020298
Chicago/Turabian StyleChen, Hsin-Chih, Han-Hsuan Tang, Wei-Hsiang Hsu, Shan-Ying Wu, Wen-Hsing Cheng, Bao-Yuan Wang, and Chun-Li Su. 2022. "Vulnerability of Triple-Negative Breast Cancer to Saponin Formosanin C-Induced Ferroptosis" Antioxidants 11, no. 2: 298. https://doi.org/10.3390/antiox11020298