
Morpho-Physiological and Biochemical Responses of Hydroponically Grown Basil Cultivars to Salt Stress

 ,
,  ,
,  ,
,  and
and 
Abstract
:1. Introduction
2. Materials and Methods
2.1. Experimental Site and Plant Material
2.2. Experimental Design
2.3. Plant Collection
2.4. Digital Quantification of the Leaf Area
2.5. Color Measurement
2.6. Leaf Gas Exchange and Leaf Fluorescence
2.7. Pigment Measurement
2.8. Antioxidant Activity
2.9. Measurement of the Polyphenolic Profile
2.10. Mineral Concentration
2.11. Statistics
3. Results
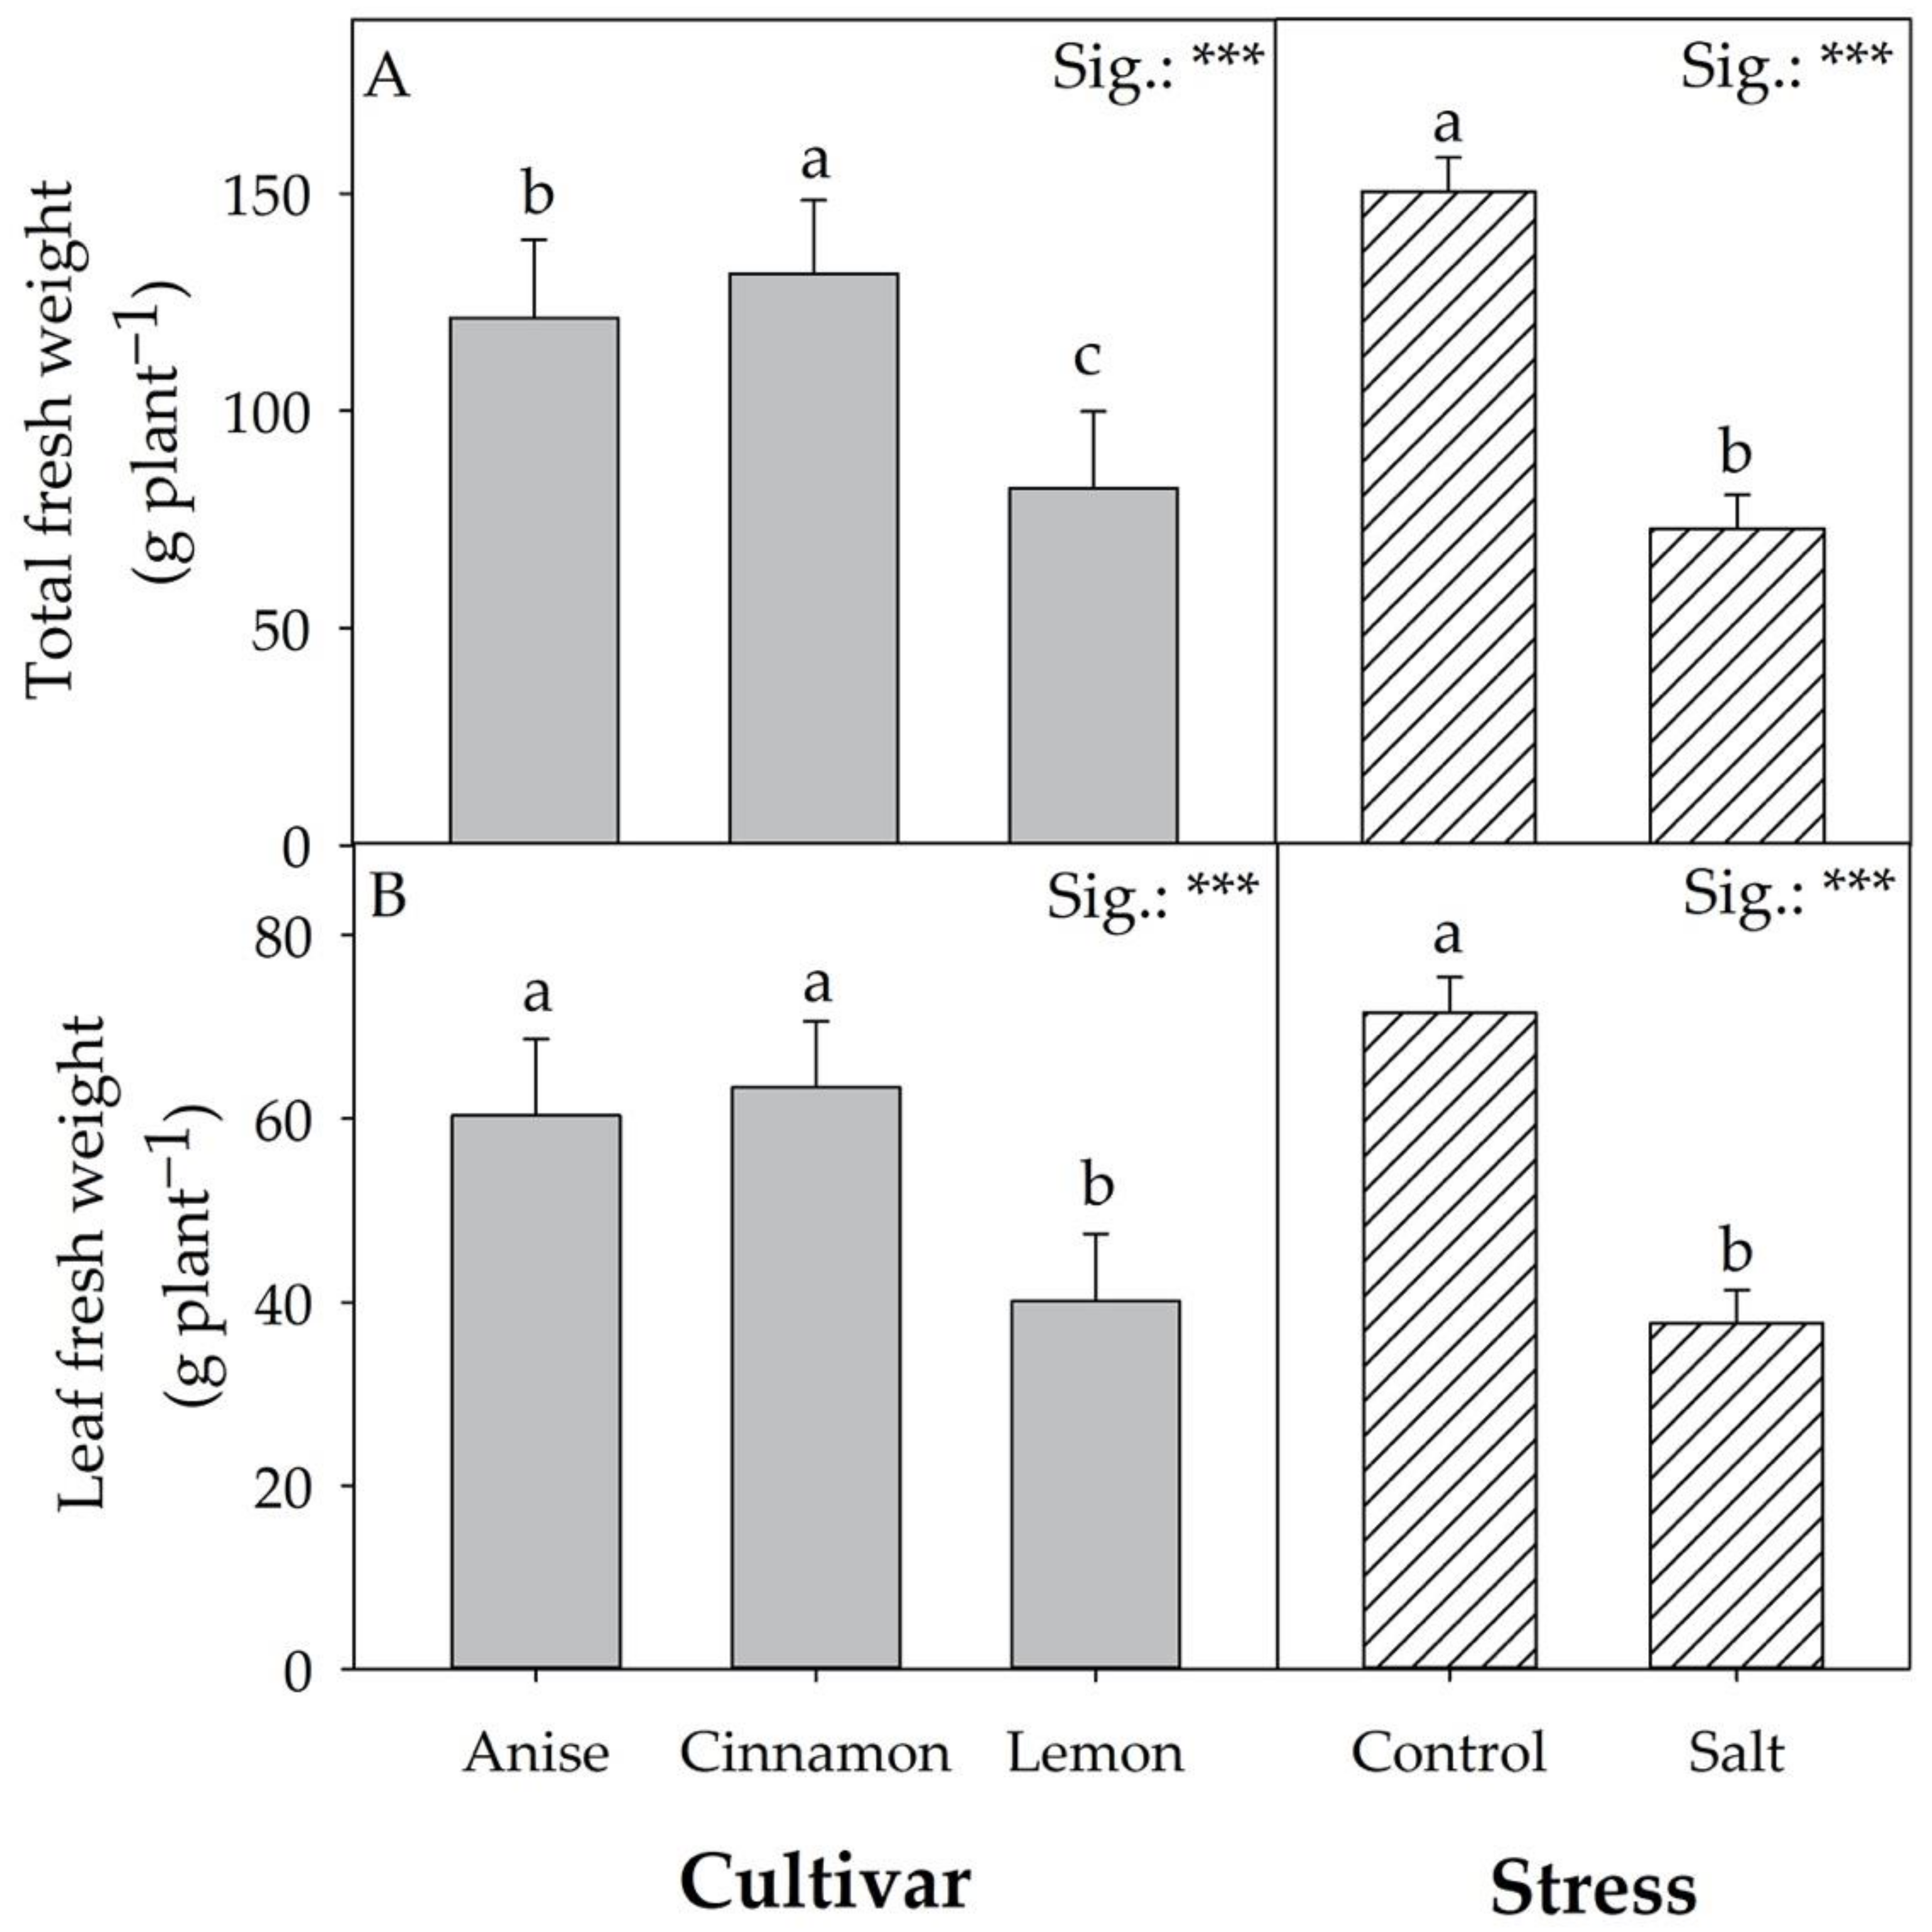
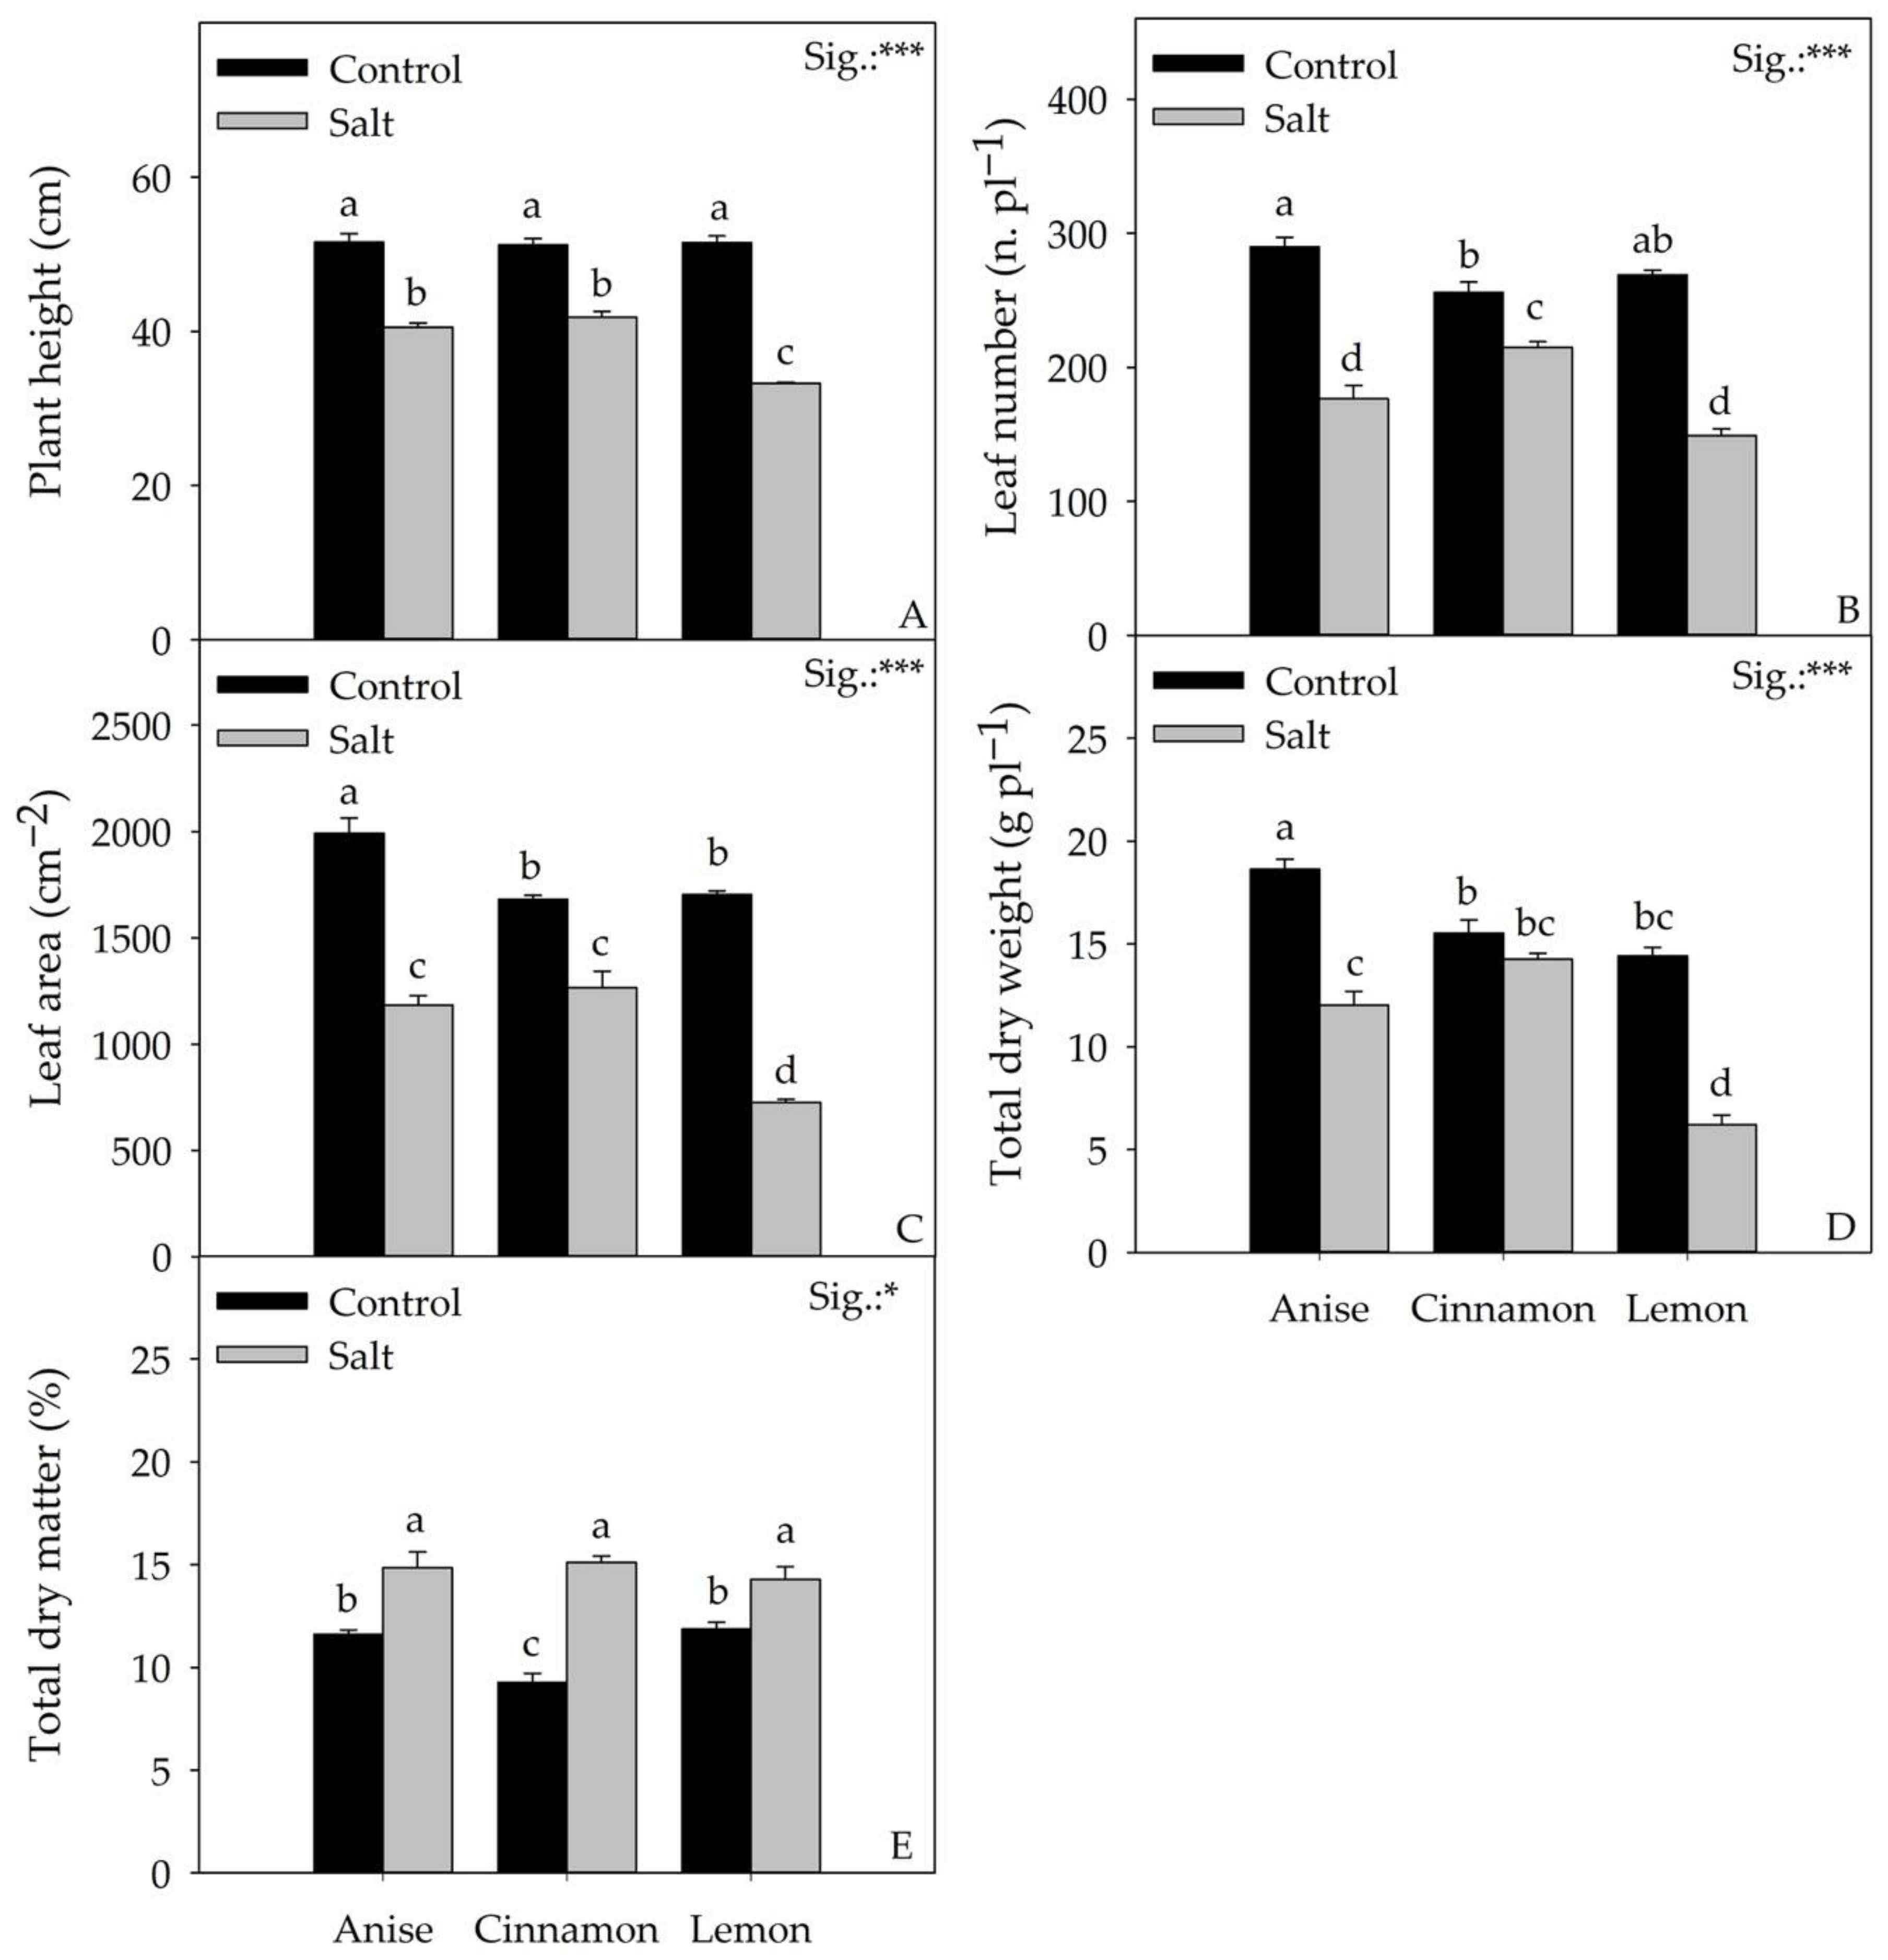
3.1. Biometric Parameters
3.2. Colorimetric Indices
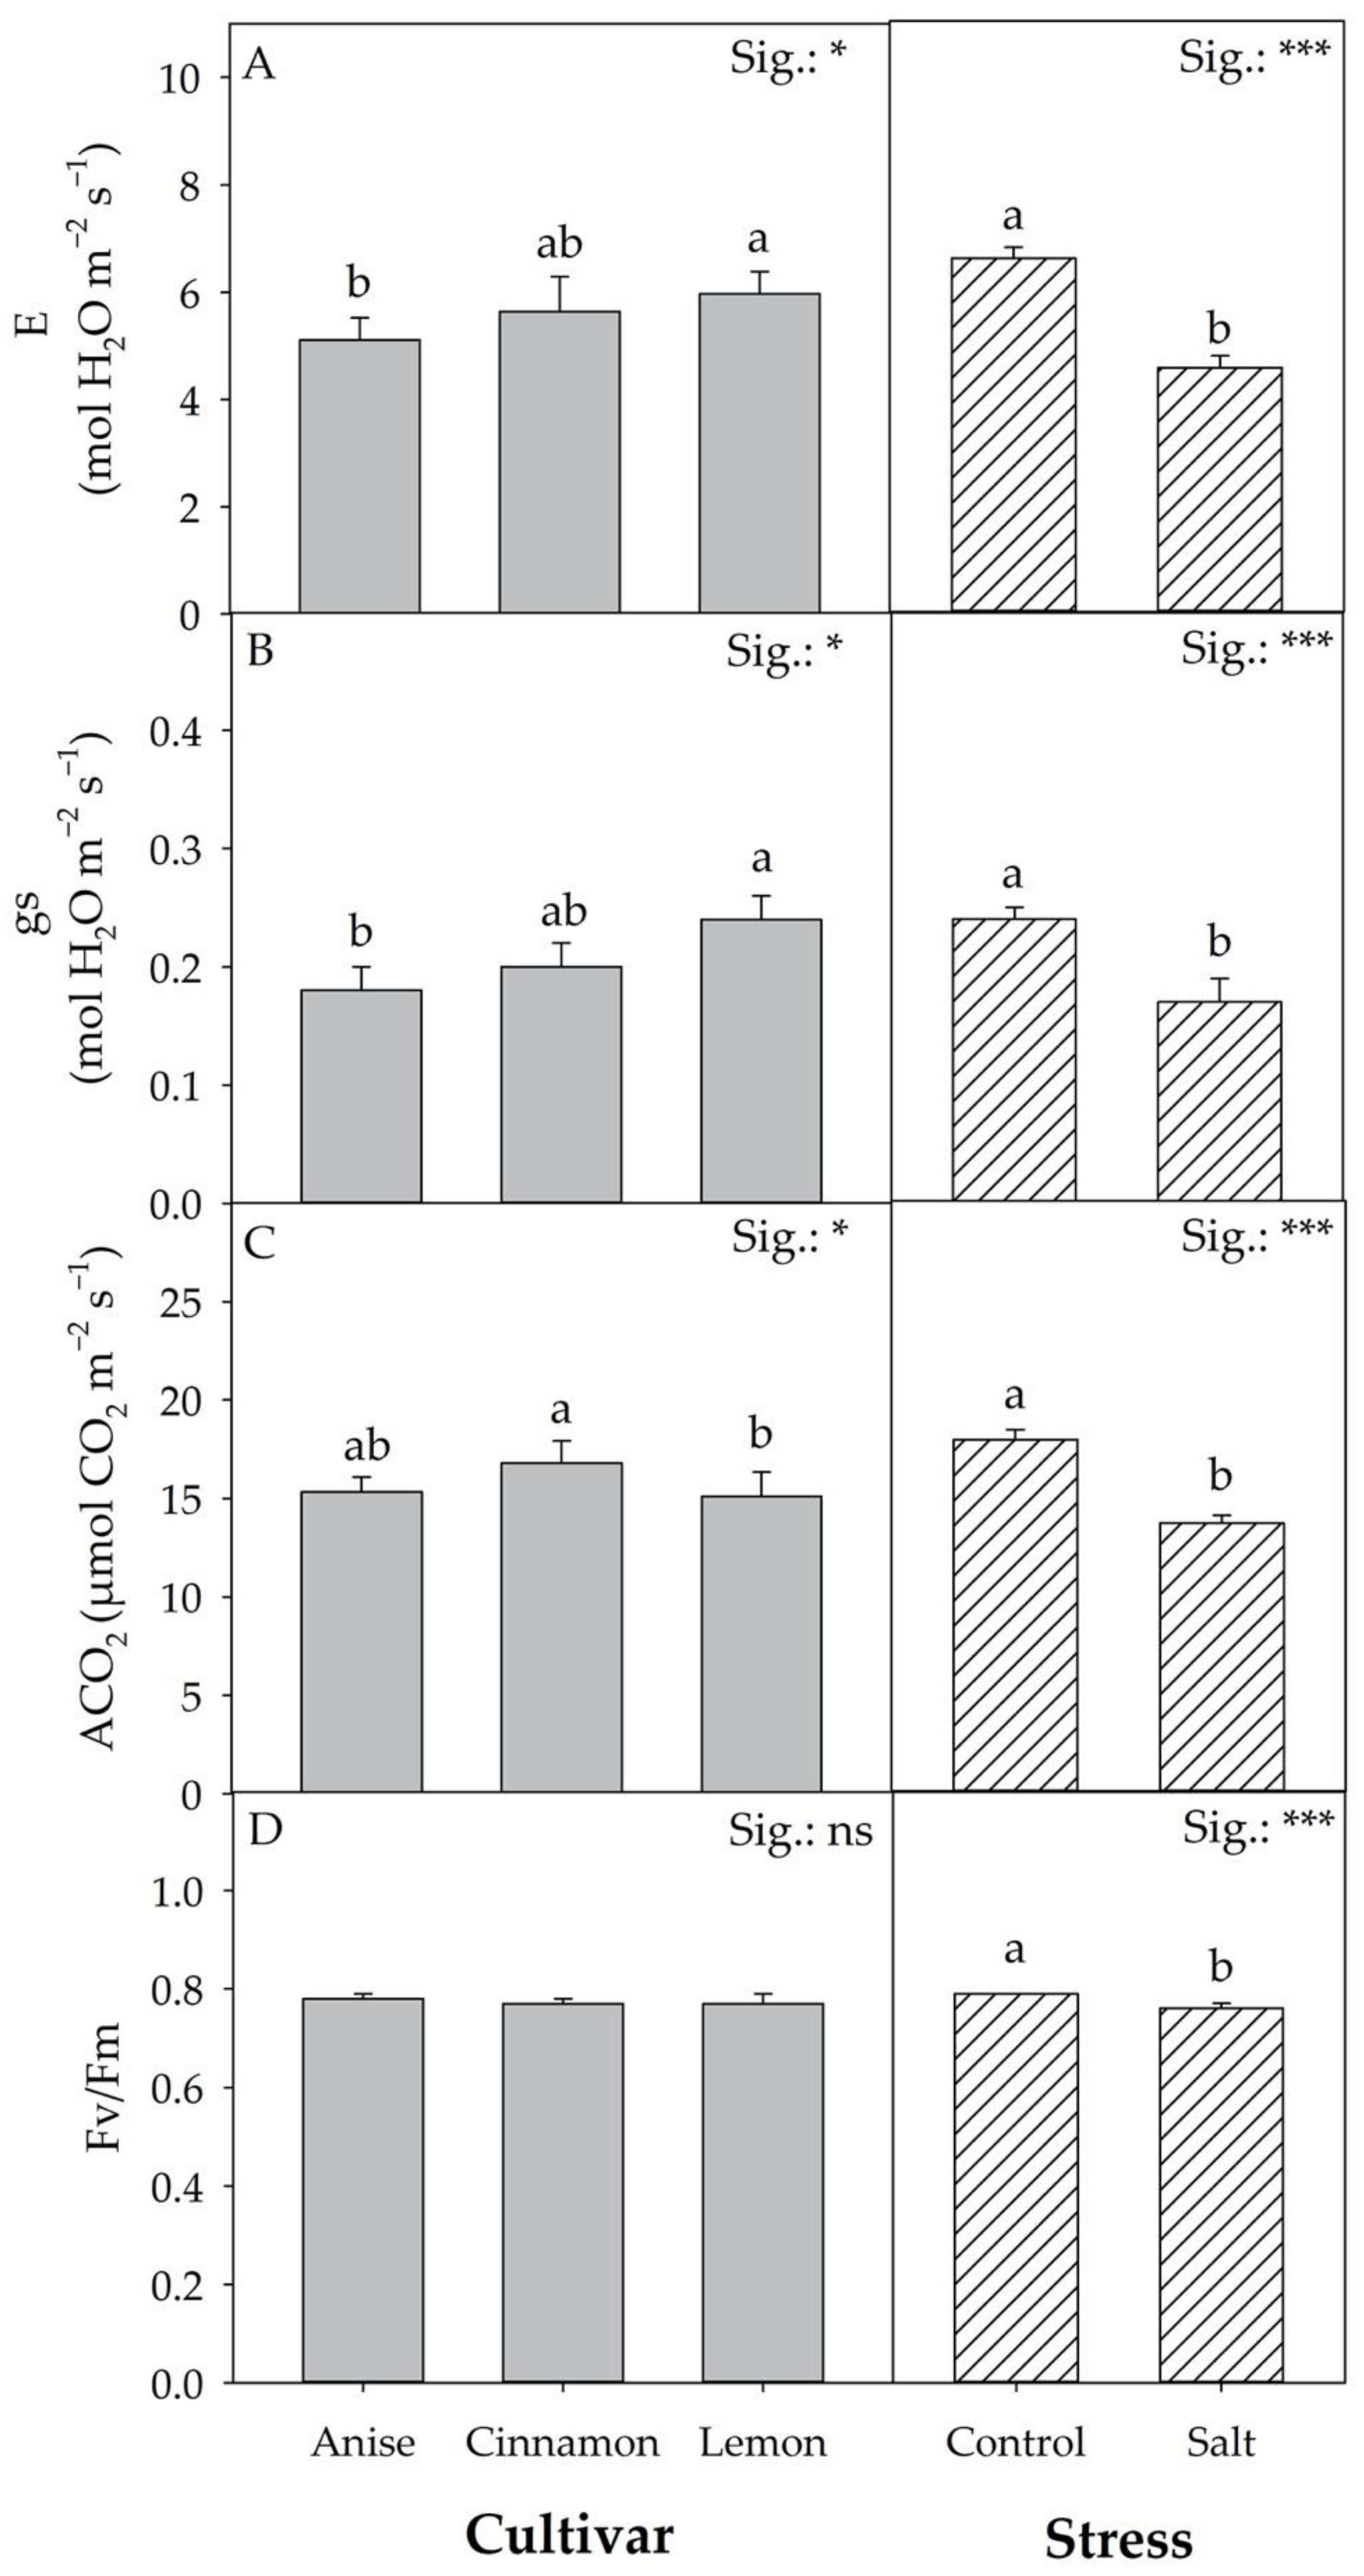
3.3. Leaf Physiological Parameters
3.4. Leaf Pigments
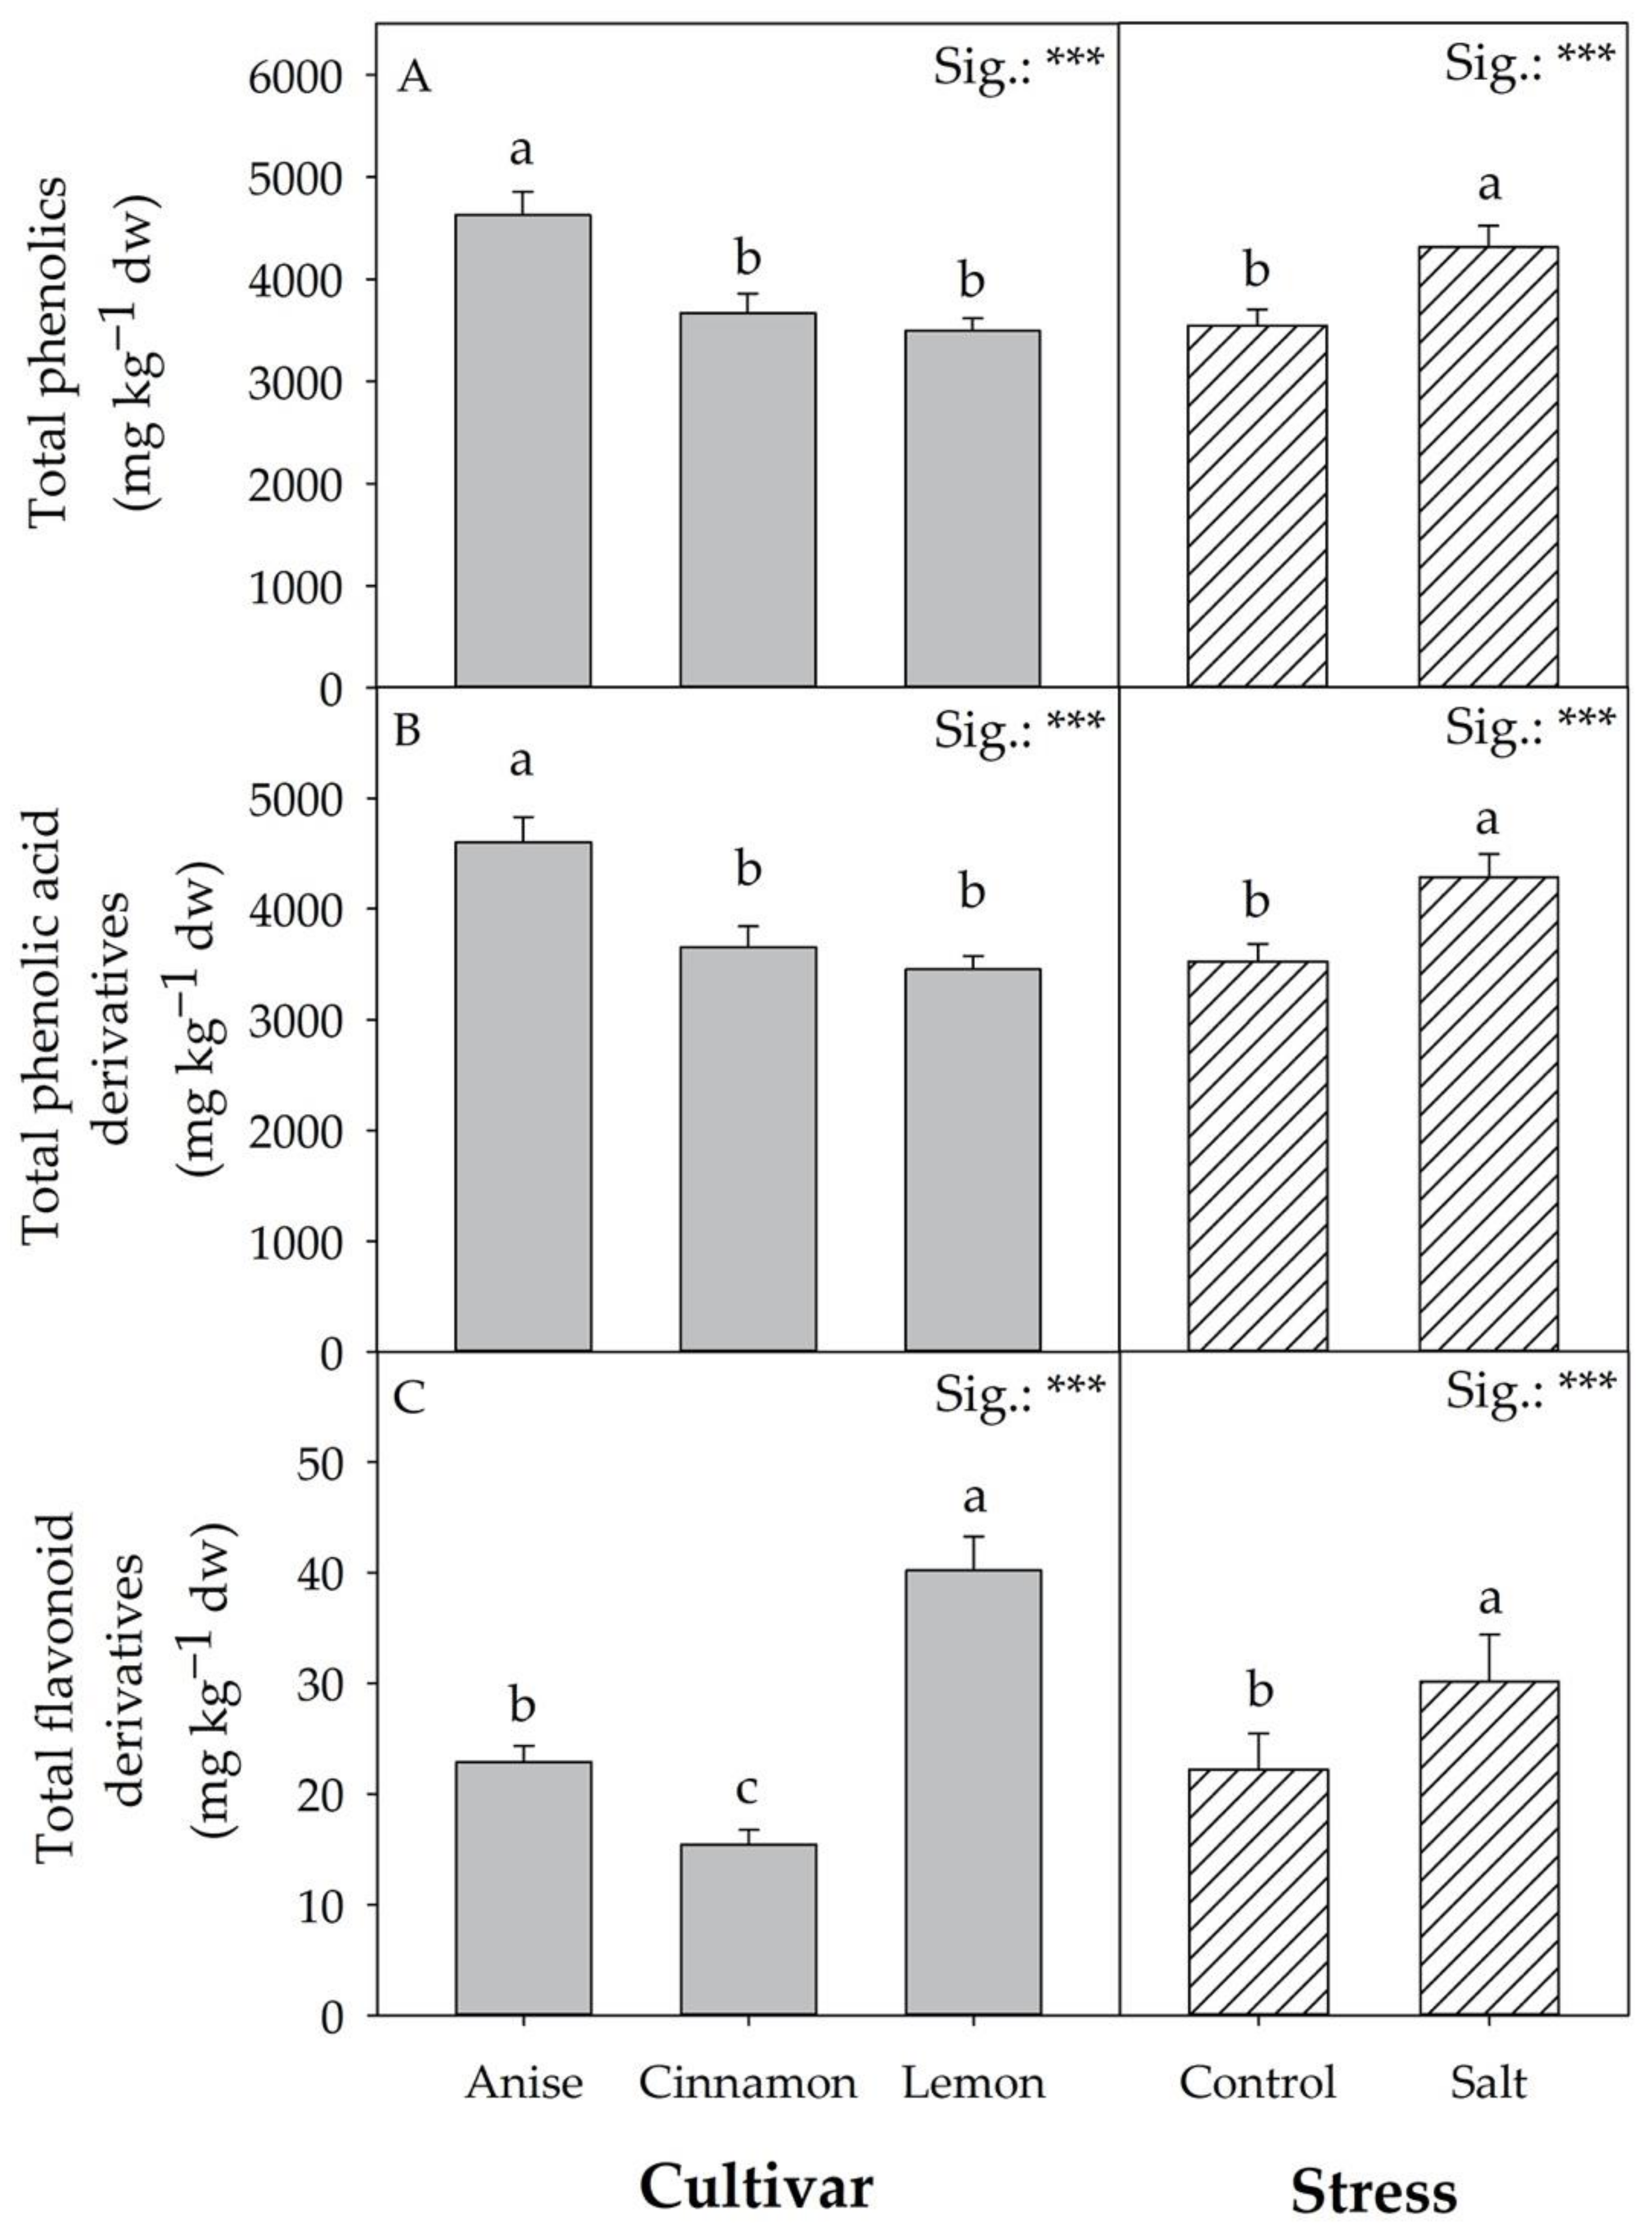
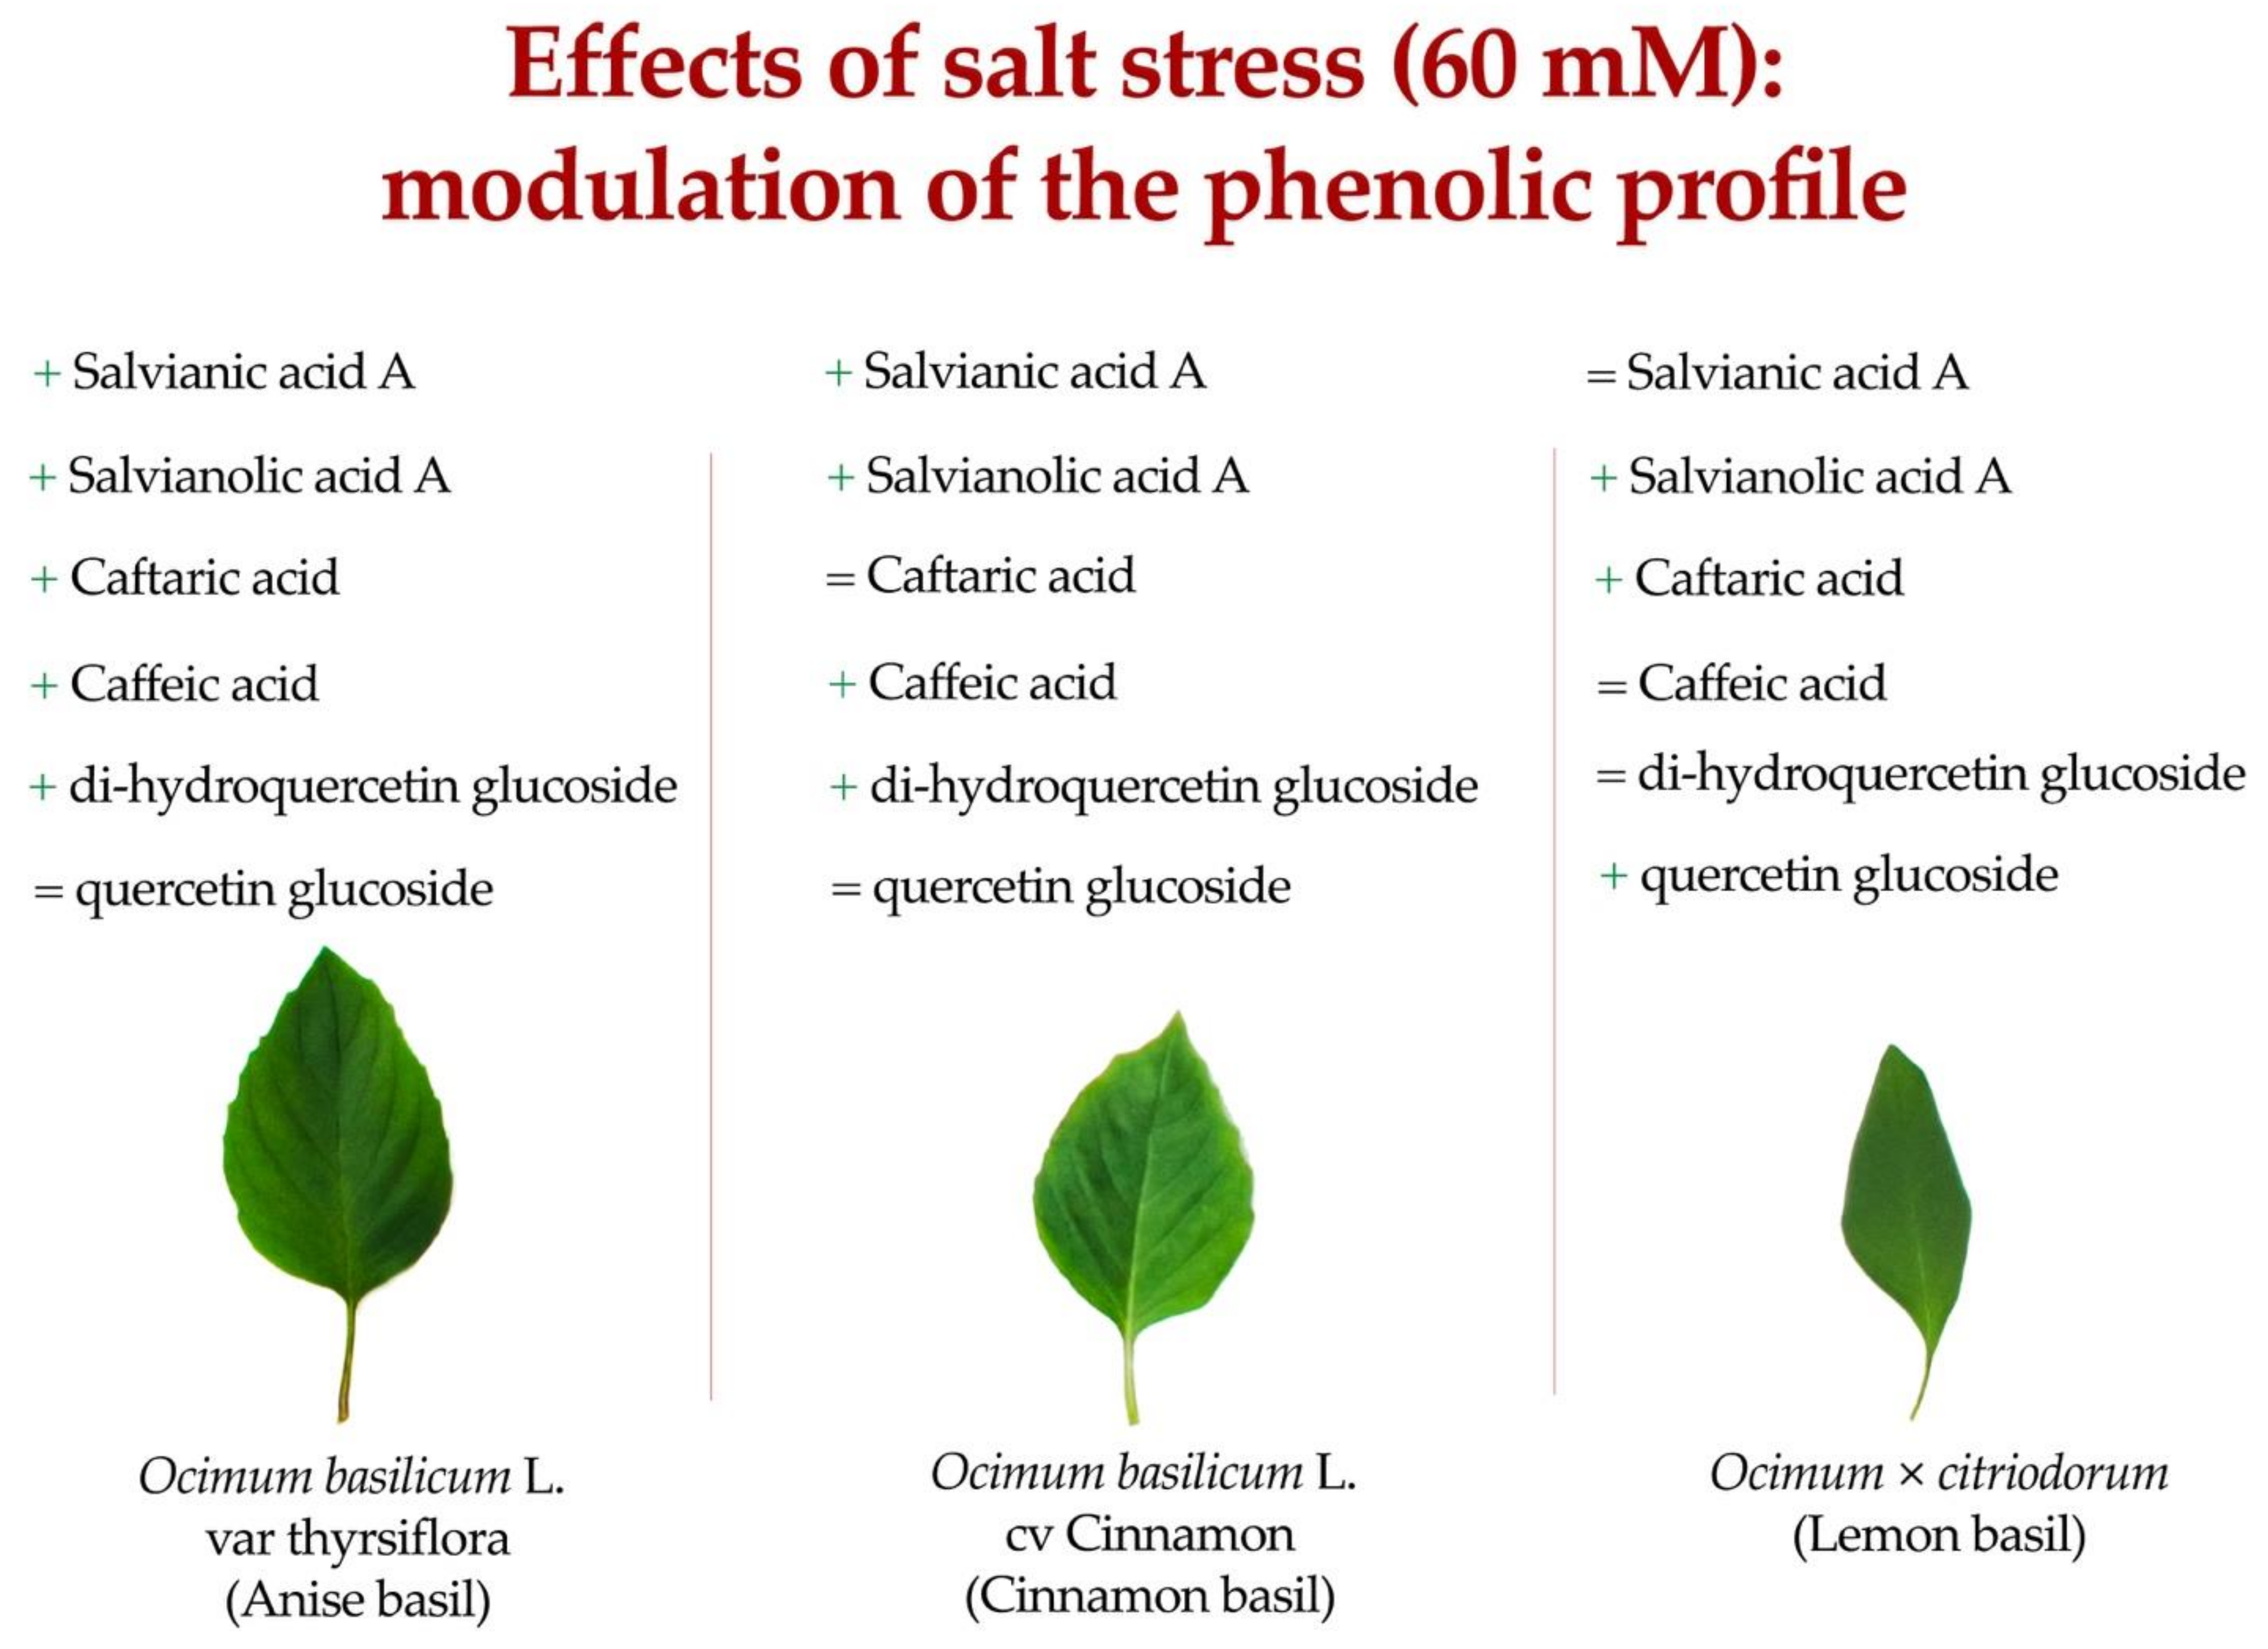
3.5. Phenolic Acids
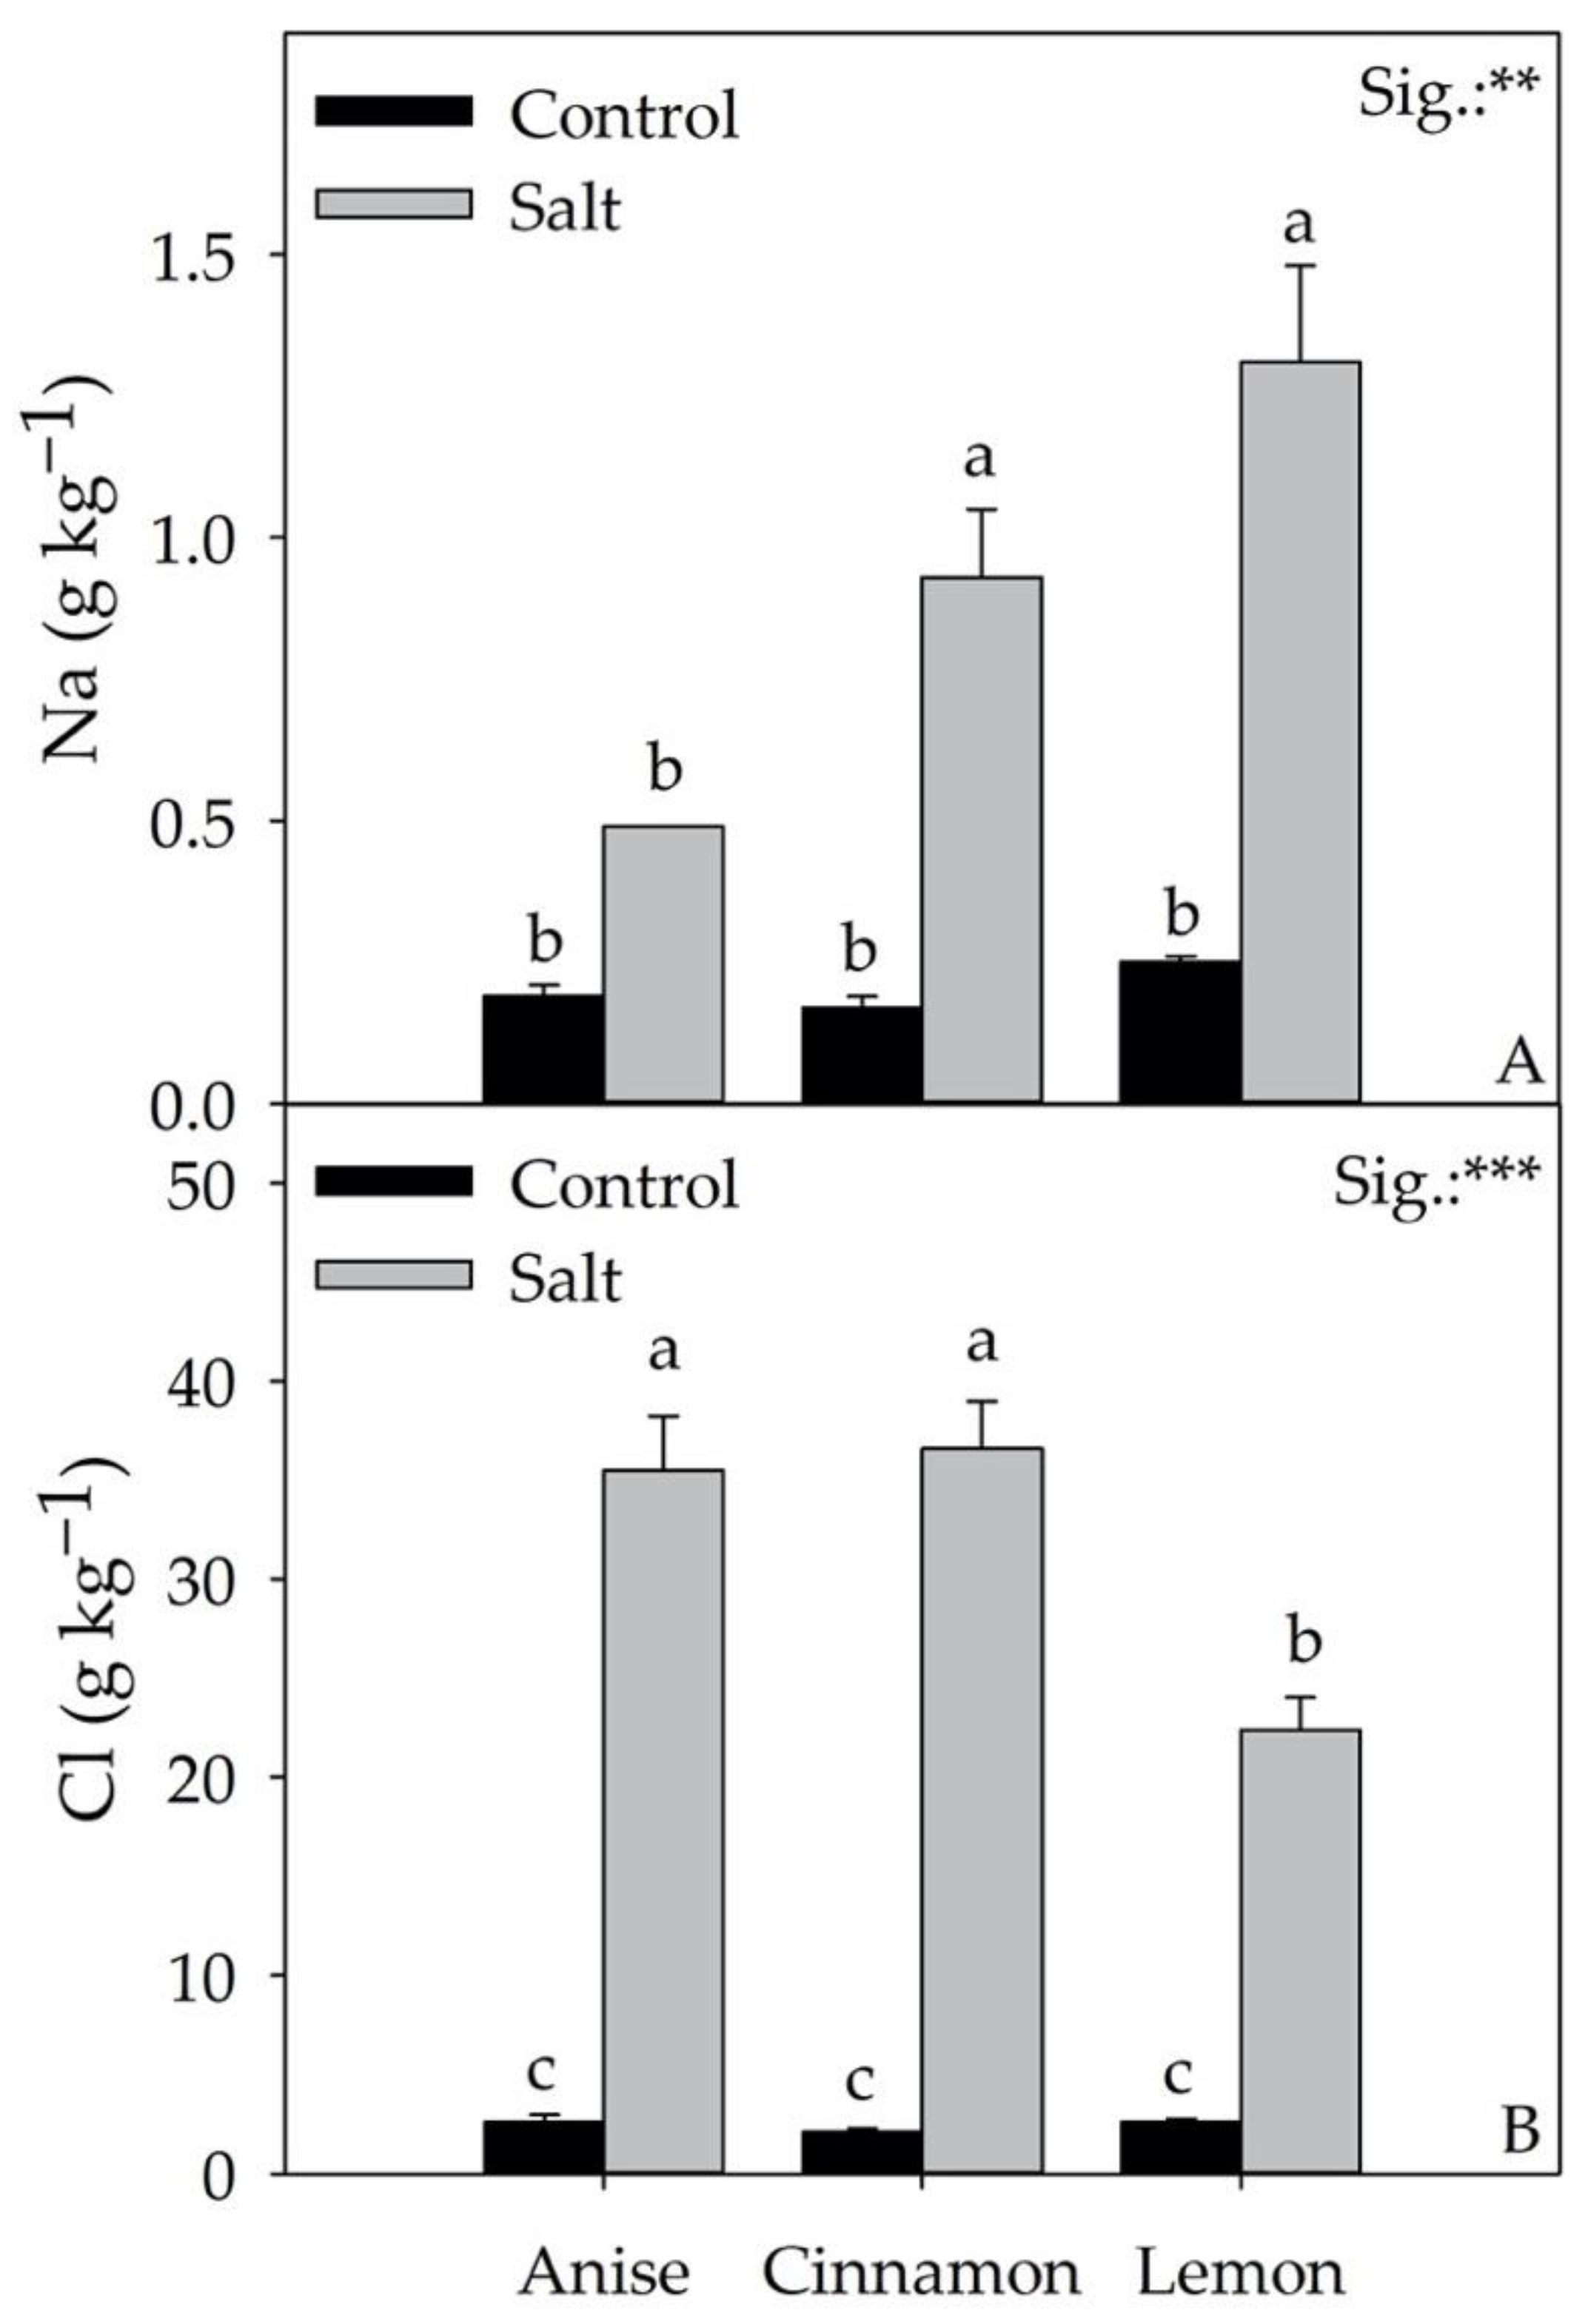
3.6. Leaf Minerals
4. Discussion
5. Conclusions
Supplementary Materials
Author Contributions
Funding
Institutional Review Board Statement
Informed Consent Statement
Data Availability Statement
Acknowledgments
Conflicts of Interest
Abbreviations
| NS | nutrient solution |
| ACO2 | net assimilation rate of CO2 |
| E | transpiration |
| Gs | stomatal conductance |
| HPLC-DAD | high-performance liquid chromatography with diode array detection |
| DPPH | (1,1-diphenyl-2-picrylhydrazyl) |
| ABTS | (2,2′-azinobis-(3-ethylbenzothiazoline-6-sulfonate) |
| FRAP | (ferric ion reducing antioxidant power) |
| UHPLC | ultrahigh performance liquid chromatography |
| HRMS | high resolution mass spectrometry |
References
- Hasanuzzaman, M.; Hakim, K.; Nahar, K.; Alharby, H.F. Plant Abiotic Stress Tolerance; Springer: Berlin/Heidelberg, Germany, 2019. [Google Scholar]
- Safriel, U.N. Status of desertification in the Mediterranean region. In Water Scarcity, Land Degradation and Desertification in the Mediterranean Region; Springer: Berlin/Heidelberg, Germany, 2009; pp. 33–73. [Google Scholar]
- Siyal, A.; Siyal, A.; Abro, Z. Salt affected soils their identification and reclamation. Pak. J. Appl. Sci. 2022, 2, 537–540. [Google Scholar]
- Tanaka, H.; Yamada, S.; Masunaga, T.; Yamamoto, S.; Tsuji, W.; Murillo-Amador, B. Comparison of nutrient uptake and antioxidative response among four Labiatae herb species under salt stress condition. Soil Sci. Plant Nutr. 2018, 64, 589–597. [Google Scholar] [CrossRef]
- Mancarella, S.; Orsini, F.; Van Oosten, M.; Sanoubar, R.; Stanghellini, C.; Kondo, S.; Gianquinto, G.; Maggio, A. Leaf sodium accumulation facilitates salt stress adaptation and preserves photosystem functionality in salt stressed Ocimum basilicum. Environ. Exp. Bot. 2016, 130, 162–173. [Google Scholar] [CrossRef]
- De Pascale, S.; Orsini, F.; Caputo, R.; Palermo, M.A.; Barbieri, G.; Maggio, A. Seasonal and multiannual effects of salinisation on tomato yield and fruit quality. Funct. Plant Biol. 2012, 39, 689–698. [Google Scholar] [CrossRef]
- Attia, H.; Ouhibi, C.; Ellili, A.; Msilini, N.; Bouzaïen, G.; Karray, N.; Lachaâl, M. Analysis of salinity effects on basil leaf surface area, photosynthetic activity, and growth. Acta Physiol. Plant. 2011, 33, 823–833. [Google Scholar] [CrossRef]
- Caliskan, O.; Kurt, D.; Temizel, K.E.; Odabas, M.S. Effect of salt stress and irrigation water on growth and development of sweet basil (Ocimum basilicum L.). Open Agric. 2017, 2, 589–594. [Google Scholar] [CrossRef] [Green Version]
- Negrão, S.; Schmöckel, S.; Tester, M. Evaluating physiological responses of plants to salinity stress. Ann. Bot. 2017, 119, 1–11. [Google Scholar] [CrossRef] [Green Version]
- Osakabe, Y.; Osakabe, K.; Shinozaki, K.; Tran, L.-S.P. Response of plants to water stress. Front. Plant Sci. 2014, 5, 86. [Google Scholar] [CrossRef] [Green Version]
- Radácsi, P.; Inotai, K.; Sárosi, S.; Czövek, P.; Bernáth, J.; Németh, É. Effect of water supply on the physiological characteristic and production of basil (Ocimum basilicum L.). Eur. J. Hortic. Sci. 2010, 75, 193. [Google Scholar]
- Valifard, M.; Mohsenzadeh, S.; Niazi, A.; Moghadam, A. Phenylalanine ammonia lyase isolation and functional analysis of phenylpropanoid pathway under salinity stress in ‘Salvia’ species. Aust. J. Crop Sci. 2015, 9, 656–665. [Google Scholar]
- Perin, E.C.; da Silva Messias, R.; Borowski, J.M.; Crizel, R.L.; Schott, I.B.; Carvalho, I.R.; Rombaldi, C.V.; Galli, V. ABA-dependent salt and drought stress improve strawberry fruit quality. Food Chem. 2019, 271, 516–526. [Google Scholar] [CrossRef] [PubMed]
- Lee, C.-J.; Chen, L.-G.; Chang, T.-L.; Ke, W.-M.; Lo, Y.-F.; Wang, C.-C. The correlation between skin-care effects and phytochemical contents in Lamiaceae plants. Food Chem. 2011, 124, 833–841. [Google Scholar] [CrossRef]
- Waller, S.B.; Cleff, M.B.; Serra, E.F.; Silva, A.L.; dos Reis Gomes, A.; de Mello, J.R.B.; de Faria, R.O.; Meireles, M.C.A. Plants from Lamiaceae family as source of antifungal molecules in humane and veterinary medicine. Microb. Pathog. 2017, 104, 232–237. [Google Scholar] [CrossRef] [PubMed]
- Majdi, C.; Pereira, C.; Dias, M.I.; Calhelha, R.C.; Alves, M.J.; Rhourri-Frih, B.; Charrouf, Z.; Barros, L.; Amaral, J.S.; Ferreira, I.C. Phytochemical characterization and bioactive properties of cinnamon basil (Ocimum basilicum cv. ‘Cinnamon’) and lemon basil (Ocimum × citriodorum). Antioxidants 2020, 9, 369. [Google Scholar] [CrossRef]
- Ciriello, M.; Formisano, L.; El-Nakhel, C.; Kyriacou, M.C.; Soteriou, G.A.; Pizzolongo, F.; Romano, R.; De Pascale, S.; Rouphael, Y. Genotype and successive harvests interaction affects phenolic acids and aroma profile of genovese basil for pesto sauce production. Foods 2021, 10, 278. [Google Scholar] [CrossRef]
- Kheng, L.W. Color spaces and color-difference equations. Color Res. Appl. 2002, 24, 186–198. [Google Scholar]
- Wellburn, A.R. The spectral determination of chlorophylls a and b, as well as total carotenoids, using various solvents with spectrophotometers of different resolution. J. Plant Physiol. 1994, 144, 307–313. [Google Scholar] [CrossRef]
- Salomon, M.V.; Piccoli, P.; Fontana, A. Simultaneous determination of carotenoids with different polarities in tomato products using a C30 core-shell column based approach. Microchem. J. 2020, 159, 105390. [Google Scholar] [CrossRef]
- Brand-Williams, W.; Cuvelier, M.-E.; Berset, C. Use of a free radical method to evaluate antioxidant activity. LWT-Food Sci. Technol. 1995, 28, 25–30. [Google Scholar] [CrossRef]
- Re, R.; Pellegrini, N.; Proteggente, A.; Pannala, A.; Yang, M.; Rice-Evans, C. Antioxidant activity applying an improved ABTS radical cation decolorization assay. Free Radic. Biol. Med. 1999, 26, 1231–1237. [Google Scholar] [CrossRef]
- Rajurkar, N.S.; Hande, S. Estimation of phytochemical content and antioxidant activity of some selected traditional Indian medicinal plants. Indian J. Pharm. Sci. 2011, 73, 146. [Google Scholar] [CrossRef] [PubMed] [Green Version]
- Vallverdu-Queralt, A.; Medina-Remon, A.; Martínez-Huélamo, M.; Jauregui, O.; Andres-Lacueva, C.; Lamuela-Raventos, R.M. Phenolic profile and hydrophilic antioxidant capacity as chemotaxonomic markers of tomato varieties. J. Agric. Food Chem. 2011, 59, 3994–4001. [Google Scholar] [CrossRef] [PubMed]
- El-Nakhel, C.; Pannico, A.; Graziani, G.; Kyriacou, M.C.; Gaspari, A.; Ritieni, A.; De Pascale, S.; Rouphael, Y. Nutrient supplementation configures the bioactive profile and production characteristics of three Brassica L. microgreens species grown in peat-based media. Agronomy 2021, 11, 346. [Google Scholar] [CrossRef]
- Formisano, L.; Ciriello, M.; El-Nakhel, C.; De Pascale, S.; Rouphael, Y. Dataset on the effects of anti-insect nets of different porosity on mineral and organic acids profile of Cucurbita pepo L. fruits and leaves. Data 2021, 6, 50. [Google Scholar] [CrossRef]
- Ciriello, M.; Formisano, L.; Soteriou, G.A.; Kyratzis, A.; De Pascale, S.; Kyriacou, M.C.; Rouphael, Y. Differential Response to NaCl Osmotic Stress in Sequentially Harvested Hydroponic Red and Green Basil and the Role of Calcium. Front. Plant Sci. 2022, 13, 799213. [Google Scholar] [CrossRef]
- Hendawy, S.; Khalid, K.A. Response of sage (Salvia officinalis L.) plants to zinc application under different salinity levels. J. Appl. Sci. Res. 2005, 1, 147–155. [Google Scholar]
- Chrysargyris, A.; Loupasaki, S.; Petropoulos, S.A.; Tzortzakis, N. Salinity and cation foliar application: Implications on essential oil yield and composition of hydroponically grown spearmint plants. Sci. Hortic. 2019, 256, 108581. [Google Scholar] [CrossRef]
- Bekhradi, F.; Delshad, M.; Marín, A.; Luna, M.C.; Garrido, Y.; Kashi, A.; Babalar, M.; Gil, M.I. Effects of salt stress on physiological and postharvest quality characteristics of different Iranian genotypes of basil. Hortic. Environ. Biotechnol. 2015, 56, 777–785. [Google Scholar] [CrossRef]
- Lazarević, B.; Šatović, Z.; Nimac, A.; Vidak, M.; Gunjača, J.; Politeo, O.; Carović-Stanko, K. Application of phenotyping methods in detection of drought and salinity stress in basil (Ocimum basilicum L.). Front. Plant Sci. 2021, 12, 629441. [Google Scholar] [CrossRef]
- Bernstein, N.; Kravchik, M.; Dudai, N. Salinity-induced changes in essential oil, pigments and salts accumulation in sweet basil (Ocimum basilicum) in relation to alterations of morphological development. Ann. Appl. Biol. 2010, 156, 167–177. [Google Scholar] [CrossRef]
- Ahmadi, M.; Souri, M.K. Growth and mineral content of coriander (Coriandrum sativum L.) plants under mild salinity with different salts. Acta Physiol. Plant. 2018, 40, 194. [Google Scholar] [CrossRef]
- Attia, H.; Karray, N.; Ellili, A.; Msilini, N.; Lachaâl, M. Sodium transport in basil. Acta Physiol. Plant. 2009, 31, 1045–1051. [Google Scholar] [CrossRef]
- Ghorbanpour, M.; Varma, A. Medicinal Plants and Environmental Challenges, 1st ed.; Springer: Cham, Switzerland, 2017; pp. 177–188. [Google Scholar]
- Scagel, C.F.; Lee, J.; Mitchell, J.N. Salinity from NaCl changes the nutrient and polyphenolic composition of basil leaves. Ind. Crops Prod. 2019, 127, 119–128. [Google Scholar] [CrossRef]
- Scagel, C.F.; Bryla, D.R.; Lee, J. Salt exclusion and mycorrhizal symbiosis increase tolerance to NaCl and CaCl2 salinity in ‘Siam Queen’ basil. HortScience 2017, 52, 278–287. [Google Scholar] [CrossRef] [Green Version]
- Borgognone, D.; Cardarelli, M.; Lucini, L.; Colla, G. Does CaCl2 play a role in improving biomass yield and quality of cardoon grown in a floating system under saline conditions? HortScience 2014, 49, 1523–1528. [Google Scholar] [CrossRef]
- Wurtzel, E.T. Changing form and function through carotenoids and synthetic biology. Plant Physiol. 2019, 179, 830–843. [Google Scholar] [CrossRef] [Green Version]
- Vafadar, F.; Amooaghaie, R.; Ehsanzadeh, P.; Ghanadian, M. Salinity stress alters ion homeostasis, antioxidant activities and the production of rosmarinic acid, luteolin and apigenin in Dracocephalum kotschyi Boiss. Biologia 2020, 75, 2147–2158. [Google Scholar] [CrossRef]
- Lattanzio, V.; Cardinali, A.; Ruta, C.; Fortunato, I.M.; Lattanzio, V.M.; Linsalata, V.; Cicco, N. Relationship of secondary metabolism to growth in oregano (Origanum vulgare L.) shoot cultures under nutritional stress. Environ. Exp. Bot. 2009, 65, 54–62. [Google Scholar] [CrossRef]
- Ciriello, M.; Formisano, L.; El-Nakhel, C.; Corrado, G.; Pannico, A.; De Pascale, S.; Rouphael, Y. Morpho-Physiological Responses and Secondary Metabolites Modulation by Preharvest Factors of Three Hydroponically Grown Genovese Basil Cultivars. Front. Plant Sci. 2021, 12, 671026. [Google Scholar] [CrossRef]
- Ciriello, M.; Pannico, A.; El-Nakhel, C.; Formisano, L.; Cristofano, F.; Duri, L.G.; Pizzolongo, F.; Romano, R.; De Pascale, S.; Colla, G. Sweet basil functional quality as shaped by genotype and macronutrient concentration reciprocal action. Plants 2020, 9, 1786. [Google Scholar] [CrossRef]
- Ciriello, M.; Kyriacou, M.C.; De Pascale, S.; Rouphael, Y. An Appraisal of Critical Factors Configuring the Composition of Basil in Minerals, Bioactive Secondary Metabolites, Micronutrients and Volatile Aromatic Compounds. J. Food Compos. Anal. 2022, 111, 104582. [Google Scholar] [CrossRef]
- Kwee, E.M.; Niemeyer, E.D. Variations in phenolic composition and antioxidant properties among 15 basil (Ocimum basilicum L.) cultivars. Food Chem. 2011, 128, 1044–1050. [Google Scholar] [CrossRef]
- Scarano, A.; Chieppa, M.; Santino, A. Looking at flavonoid biodiversity in horticultural crops: A colored mine with nutritional benefits. Plants 2018, 7, 98. [Google Scholar] [CrossRef] [PubMed]


| Treatment | L | a | b | Chroma | Hue Angle |
|---|---|---|---|---|---|
| Cultivar (CV) | |||||
| Anise | 42.45 ± 0.26 b | –12.61 ± 0.43 a | 17.54 ± 0.62 b | 21.61 ± 0.75 b | 125.76 ± 0.25 |
| Cinnamon | 42.84 ± 0.54 b | –13.03 ± 0.30 a | 18.14 ± 0.78 b | 22.35 ± 0.86 b | 125.85 ± 0.62 |
| Lemon | 44.10 ± 0.36 a | –14.77 ± 0.68 b | 20.46 ± 1.42 a | 25.25 ± 1.55 a | 126.03 ± 0.65 |
| Stress (S) | |||||
| Control | 43.83 ± 0.33 | –14.37 ± 0.53 | 20.54 ± 0.88 | 25.08 ± 1.04 | 125.07 ± 0.28 |
| Salt | 42.43 ± 0.31 | –12.57 ± 0.21 | 16.89 ± 0.20 | 21.06 ± 0.26 | 126.70 ± 0.35 |
| CV × S | |||||
| Anise × Control | 42.90 ± 0.29 | –13.33 ± 0.61 ab | 18.46 ± 0.92 b | 22.77 ± 1.10 b | 125.89 ± 0.31 ab |
| Anise × Salt | 42.00 ± 0.23 | –11.90 ± 0.21 a | 16.63 ± 0.48 b | 20.46 ± 0.50 b | 125.64 ± 0.45 b |
| Cinnamon × Control | 43.80 ± 0.57 | –13.52 ± 0.47 b | 19.57 ± 0.96 b | 23.79 ± 1.27 b | 124.66 ± 0.41 b |
| Cinnamon × Salt | 41.88 ± 0.45 | –12.55 ± 0.06 ab | 16.71 ± 0.23 b | 20.90 ± 0.15 b | 127.04 ± 0.57 a |
| Lemon × Control | 44.79 ± 0.09 | –16.27 ± 0.17 c | 23.59 ± 0.58 a | 28.66 ± 0.58 a | 124.65 ± 0.38 b |
| Lemon × Salt | 43.41 ± 0.40 | –13.27 ± 0.16 ab | 17.34 ± 0.16 b | 21.84 ± 0.21 b | 127.41 ± 0.17 a |
| Significance | |||||
| CV | ** | *** | *** | *** | ns |
| S | *** | *** | *** | *** | *** |
| CV × S | ns | * | * | * | ** |
| Treatment | Chlorophyll a | Chlorophyll b | Total Chlorophyll | Lutein | β-Carotene |
|---|---|---|---|---|---|
| mg g−1 fw | mg kg−1 fw | ||||
| Cultivar (CV) | |||||
| Anise | 1.21 ± 0.01 | 0.80 ± 0.03 | 2.01 ± 0.04 | 1305.20 ± 75.22 a | 556.82 ± 40.88a |
| Cinnamon | 1.22 ± 0.01 | 0.79 ± 0.01 | 2.01 ± 0.02 | 1243.47 ± 92.75 a | 555.45 ± 47.88 a |
| Lemon | 1.21 ± 0.01 | 0.89 ± 0.05 | 2.10 ± 0.05 | 953.05 ±6 3.54 b | 511.73 ± 4.51 b |
| Stress (S) | |||||
| Control | 1.22 ± 0.01 | 0.86 ± 0.04 | 2.08 ± 0.04 | 998.24 ± 50.62 | 478.50 ± 11.22 |
| Salt | 1.21 ± 0.01 | 0.79 ± 0.02 | 2.00 ± 0.02 | 1336.24 ± 61.77 | 604.17 ± 25.62 |
| CV × S | |||||
| Anise × Control | 1.23 ± 0.00 | 0.84 ± 0.05 | 2.07 ± 0.05 | 1139.44 ± 22.43 | 465.63 ± 5.39 d |
| Anise × Salt | 1.19 ± 0.01 | 0.75 ± 0.03 | 1.95 ± 0.03 | 1470.97 ± 17.47 | 648.02 ± 2.88 a |
| Cinnamon × Control | 1.20 ± 0.02 | 0.79 ± 0.01 | 1.99 ± 0.03 | 1042.12 ± 41.09 | 448.53 ± 5.11 e |
| Cinnamon × Salt | 1.24 ± 0.01 | 0.80 ± 0.03 | 2.04 ± 0.03 | 1444.81 ± 28.04 | 662.38 ± 1.61 a |
| Lemon × Control | 1.22 ± 0.01 | 0.96 ± 0.07 | 2.17 ± 0.08 | 813.16 ± 22.23 | 521.35 ± 2.27 b |
| Lemon × Salt | 1.20 ± 0.01 | 0.82 ± 0.03 | 2.02 ± 0.03 | 1092.94 ± 11.14 | 502.11 ± 1.97 c |
| Significance | |||||
| CV | ns | ns | ns | *** | *** |
| S | ns | ns | ns | *** | *** |
| CV × S | ns | ns | ns | ns | *** |
| Treatment | Salvianic Acid A | Salvianolic Acid k | Salvianolic Acid A | Salvianolic Acid L | Caftaric Acid | Rosmarinic Acid | Cichoric Acid | Caffeic Acid | Chlorogenic Acid | Feruloyl Tartaric Acid |
|---|---|---|---|---|---|---|---|---|---|---|
| mg kg−1 dw | ||||||||||
| Cultivar (CV) | ||||||||||
| Anise | 34.25 ± 2.34 b | 100.50 ± 7.14 | 15.16 ± 0.69 a | 75.18 ± 2.66 a | 72.26 ± 4.48 a | 1045.78 ± 51.34 a | 2867.13 ± 143.05 a | 128.18 ± 5.82 a | 29.10 ± 1.13 a | 234.67 ± 17.55 b |
| Cinnamon | 39.53 ± 1.35 a | 107.78 ± 6.93 | 2.73 ± 0.30 c | 35.69 ± 2.26 c | 21.28 ± 1.59 c | 689.18 ± 35.78 c | 2365.51 ± 125.86 b | 45.78 ± 2.5 b | 11.99 ± 0.82 c | 334.54 ± 16.14 a |
| Lemon | 6.00 ± 0.40 c | 96.47 ± 6.87 | 7.02 ± 0.56 b | 47.88 ± 2.87 b | 28.30 ± 2.87 b | 882.79 ± 33.32 b | 2204.55 ± 62.98 b | 48.03 ± 1.34 b | 18.26 ± 1.08 b | 114.86 ± 10.28 c |
| Stress (S) | ||||||||||
| Control | 23.77 ± 4.80 | 87.45 ± 2.48 | 7.19 ± 1.70 | 47.66 ± 5.89 | 34.38 ± 7.15 | 788.65 ± 49.42 | 2252.68 ± 90.84 | 67.13 ± 12.21 | 17.73 ± 2.47 | 197.23 ± 30.45 |
| Salt | 29.42 ± 5.68 | 115.71 ± 3.22 | 9.43 ± 1.95 | 58.18 ± 5.91 | 46.85 ± 8.90 | 956.51 ± 56.59 | 2705.44 ± 124.97 | 80.86 ± 14.96 | 21.84 ± 2.58 | 258.81 ± 33.66 |
| CV × S | ||||||||||
| Anise × Control | 29.48 ± 1.76 c | 86.79 ± 4.41 | 13.65 ± 0.15 b | 69.97 ± 2.74 | 62.83 ± 0.77 b | 944.97 ± 32.94 | 2589.89 ± 97.13 | 115.79 ± 2.16 b | 26.94 ± 1.06 | 198.92 ± 15.52 |
| Anise × Salt | 39.02 ± 1.20 ab | 114.21 ± 6.91 | 16.68 ± 0.31 a | 80.40 ± 0.73 | 81.68 ± 3.34 a | 1146.59 ± 43.95 | 3144.36 ± 126.56 | 140.57 ± 3.37 a | 31.26 ± 0.77 | 270.41 ± 4.69 |
| Cinnamon × Control | 36.69 ± 0.36 b | 93.65 ± 3.41 | 2.11 ± 0.19 f | 31.09 ± 1.27 | 18.33 ± 1.25 d | 611.74 ± 8.13 | 2089.00 ± 28.07 | 40.38 ± 0.92 d | 10.34 ± 0.71 | 300.37 ± 7.99 |
| Cinnamon × Salt | 42.38 ± 0.94 a | 121.91 ± 5.34 | 3.36 ± 0.18 e | 40.29 ± 1.64 | 24.23 ± 1.57 d | 766.62 ± 18.34 | 2642.02 ± 44.20 | 51.18 ± 1.09 c | 13.64 ± 0.34 | 368.71 ± 8.49 |
| Lemon × Control | 5.13 ± 0.10 d | 81.93 ± 2.87 | 5.80 ± 0.11 d | 41.92 ± 2.31 | 21.96 ± 0.19 d | 809.26 ± 8.96 | 2079.15 ± 59.19 | 45.23 ± 0.93 cd | 15.90 ± 0.19 | 92.41 ± 2.54 |
| Lemon × Salt | 6.87 ± 0.22 d | 111.01 ± 4.08 | 8.25 ± 0.21 c | 53.84 ± 0.61 | 34.64 ± 0.93 c | 956.32 ± 7.97 | 2329.94 ± 24.67 | 50.83 ± 0.54 c | 20.62 ± 0.44 | 137.31 ± 4.20 |
| Significance | ||||||||||
| CV | *** | ns | *** | *** | *** | *** | *** | *** | *** | *** |
| S | *** | *** | *** | *** | *** | *** | *** | *** | *** | *** |
| CV × S | ** | ns | ** | ns | ** | ns | ns | *** | ns | ns |
| Treatment | Di-Hydroquercetin Glucoside | Rutin | Quercetin Glucoside |
|---|---|---|---|
| mg kg−1 dw | |||
| Cultivar (CV) | |||
| Anise | 3.66 ± 0.18 a | 9.32 ± 0.78 b | 9.91 ± 0.54 b |
| Cinnamon | 0.87 ± 0.09 b | 10.77 ± 0.79 a | 3.78 ± 0.49 c |
| Lemon | 0.52 ± 0.02 c | 9.08 ± 0.41 b | 30.59 ± 2.67 a |
| Stress (S) | |||
| Control | 1.48 ± 0.45 | 8.36 ± 0.26 | 12.33 ± 3.47 |
| Salt | 1.89 ± 0.54 | 11.09 ± 0.43 | 17.18 ± 4.75 |
| CV × S | |||
| Anise × Control | 3.29 ± 0.06 b | 7.69 ± 0.25 | 8.86 ± 0.54 cd |
| Anise × Salt | 4.04 ± 0.10 a | 10.95 ± 0.58 | 10.95 ± 0.25 c |
| Cinnamon × Control | 0.68 ± 0.02 d | 9.15 ± 0.40 | 2.74 ± 0.28 e |
| Cinnamon × Salt | 1.06 ± 0.01 c | 12.39 ± 0.56 | 4.82 ± 0.22 de |
| Lemon × Control | 0.48 ± 0.03 d | 8.23 ± 0.26 | 25.40 ± 2.62 b |
| Lemon × Salt | 0.56 ± 0.01 d | 9.92 ± 0.20 | 35.77 ± 1.40 a |
| Significance | |||
| CV | *** | ** | *** |
| S | *** | *** | *** |
| CV × S | *** | ns | ** |
| Treatment | Nitrate | K | P | Ca | Mg |
|---|---|---|---|---|---|
| mg g−1 fw | g kg−1 dw | ||||
| Cultivar (CV) | |||||
| Anise | 2555.76 ± 785.29 a | 38.25 ± 3.24 a | 6.83 ± 0.43 b | 9.19 ± 1.04 ab | 5.97 ± 0.71 a |
| Cinnamon | 1542.67 ± 361.53 b | 31.72 ± 1.34 b | 6.35 ± 0.40 b | 9.32 ± 1.00 a | 5.73 ± 0.84 a |
| Lemon | 1403.80 ± 411.30 b | 35.16 ± 2.59 ab | 11.75 ± 0.45 a | 7.53 ± 0.27 b | 4.37 ± 0.14 b |
| Stress (S) | |||||
| Control | 2987.44 ± 332.92 | 39.26 ± 1.95 | 8.99 ± 0.92 | 7.29 ± 0.26 | 4.26 ± 0.15 |
| Salt | 680.71 ± 66.37 | 30.82 ± 1.20 | 7.64 ± 0.87 | 10.07 ± 0.71 | 6.46 ± 0.56 |
| CV × S | |||||
| Anise × Control | 4303.80 ± 136.53 a | 44.01 ± 3.76 | 7.24 ± 0.66 | 7.33 ± 0.67 b | 4.51 ± 0.3 b |
| Anise × Salt | 807.72 ± 95.40 c | 32.49 ± 2.25 | 6.42 ± 0.59 | 11.05 ± 1.21 a | 7.44 ± 0.51 a |
| Cinnamon × Control | 2341.87 ± 39.22 b | 33.24 ± 0.52 | 7.16 ± 0.39 | 7.18 ± 0.50 b | 3.90 ± 0.24 b |
| Cinnamon × Salt | 743.47 ± 115.19 c | 30.19 ± 2.53 | 5.55 ± 0.12 | 11.47 ± 0.38 a | 7.57 ± 0.32 a |
| Lemon × Control | 2316.65 ± 100.39 b | 40.54 ± 0.98 | 12.56 ± 0.34 | 7.36 ± 0.28 b | 4.37 ± 0.11 b |
| Lemon × Salt | 490.94 ± 49.49 c | 29.78 ± 1.93 | 10.94 ± 0.51 | 7.70 ± 0.50 b | 4.37 ± 0.29 b |
| Significance | |||||
| CV | *** | * | *** | * | *** |
| S | *** | *** | ** | *** | *** |
| CV × S | *** | ns | ns | * | *** |
Publisher’s Note: MDPI stays neutral with regard to jurisdictional claims in published maps and institutional affiliations. |
© 2022 by the authors. Licensee MDPI, Basel, Switzerland. This article is an open access article distributed under the terms and conditions of the Creative Commons Attribution (CC BY) license (https://creativecommons.org/licenses/by/4.0/).
Share and Cite
Ciriello, M.; Formisano, L.; Kyriacou, M.C.; Carillo, P.; Scognamiglio, L.; De Pascale, S.; Rouphael, Y. Morpho-Physiological and Biochemical Responses of Hydroponically Grown Basil Cultivars to Salt Stress. Antioxidants 2022, 11, 2207. https://doi.org/10.3390/antiox11112207
Ciriello M, Formisano L, Kyriacou MC, Carillo P, Scognamiglio L, De Pascale S, Rouphael Y. Morpho-Physiological and Biochemical Responses of Hydroponically Grown Basil Cultivars to Salt Stress. Antioxidants. 2022; 11(11):2207. https://doi.org/10.3390/antiox11112207
Chicago/Turabian StyleCiriello, Michele, Luigi Formisano, Marios C. Kyriacou, Petronia Carillo, Luca Scognamiglio, Stefania De Pascale, and Youssef Rouphael. 2022. "Morpho-Physiological and Biochemical Responses of Hydroponically Grown Basil Cultivars to Salt Stress" Antioxidants 11, no. 11: 2207. https://doi.org/10.3390/antiox11112207
APA StyleCiriello, M., Formisano, L., Kyriacou, M. C., Carillo, P., Scognamiglio, L., De Pascale, S., & Rouphael, Y. (2022). Morpho-Physiological and Biochemical Responses of Hydroponically Grown Basil Cultivars to Salt Stress. Antioxidants, 11(11), 2207. https://doi.org/10.3390/antiox11112207