Pallet Picking Strategy in Food Collecting Center


1
Department of Mechanics, Mathematics and Management, Polytechnic University of Bari, Viale Japigia 182, 70123 Bari, Italy
2
Department of Economics, University of Foggia, Largo Papa Giovanni Paolo II 1, 71121 Foggia, Italy
*
Author to whom correspondence should be addressed.
Appl. Sci. 2018, 8(9), 1503; https://doi.org/10.3390/app8091503
Submission received: 2 August 2018
/
Revised: 18 August 2018
/
Accepted: 27 August 2018
/
Published: 1 September 2018
(This article belongs to the Section Environmental Sciences)
Abstract
:This study aims to analyze the optimal warehouse layout for agricultural and food collecting centers that help small–medium farms to trade in the short food supply chain, by choosing among longitudinal, transversal, and fishbone layout. The developed model allows for the identification of the warehouse ensuring the least impact through inbound material handling, under both an economic and an environmental perspective. The analysis was carried out by using an analytical model to minimize the travelling time of the goods from picking to delivery area. The model considers the different turnover index from which four hypotheses were formulated to implement the results. The Carbon Footprint (CF) and Management Costs (MCs) were calculated by the picking time performance. Findings: Results show that the optimal warehouse layout can be identified after a careful consideration of the turnover indexes. However, for seasonality, the optimal design might be missed across the seasons. Practical implications: the analysis hereby presented is related to those collecting centers aiming to gather conspicuous amounts of seasonal food.
1. Introduction
Over the years, many changes have affected the agro-food system. In the wake of these changes, public policies have been leading economic players to rationalize the resource use in order to accomplish the goal of the efficiency of the agro-food system. The efficiency of agricultural production and the reduction of emissions are today important frontiers of research in the technical and economic field [1]. Within the European area, for example, the European Commission is fostering policies toward innovation transfer and knowledge uptake to optimize the input use. Within this scope, the main ambition consists in maximizing value, instead of the traditional maximization of profit. The idea of value must be understood as benefits for the stakeholders in economic, social and environmental domain [2].
In this context, the environmental concern is nowadays being raised as a relevant issue, and people are striving to find optimal methods to reduce polluting agents and resources depletion. Throughout this issue, the economic players must keep up the economic incomes, and as long as methodologic trade-off for achieving satisfying results in both directions are not found out, they are not willing to refuse to use resources and methods unsustainable for the environment [3]. Yet, studies should keep addressing for solutions, indeed is very difficult identify an optimal solution according to economic and environmental perspective, quite the best solution should be addressed to identify a trade-off on the basis of the performances related to both aspects [4]. Along with these considerations, the food marketing through short supply chain, whose actors are often small–medium organizations without marketing unit for reaching away markets, is quickly rising [3]. This hurdle is starting to be overcome by raising the role of collecting centers that gather seasonal foodstuffs for supplying local, regional, and off-region markets. This happens for organic-labelled food produced somewhere and sold elsewhere, away from the production [5].
The design of those collecting centers depends on several factors related to logistic constrains, food cold chain performance, as well as supply chain network. In all cases, the sustainability is considered as the central point of the issue [6]. According to Seuring and Muller, a supply chain network can be defined sustainable when information, capital flows, and cooperation among companies along the supply chain allow to minimizing the impact under economic, environmental and social perspective, keeping under consideration the stakeholder’ interests [7]. For sustainability of the supply chain, the focus is nowadays shifting over approaches based on products and lean management. The first approach is based on the product lifecycle standards that allows to optimize the environmental and social performances, from cradle to grave, of the products [7]. The second approach is based on Lean management, in this case is considered everything that enable operators to rationalize resources input and avoid mistakes that cause inefficiencies by reducing related costs of quality efficiency [5]. About lean, many studies [8,9,10] highlight seven critical issues that are normally subjected to wastes: transport, inventory, motion, waiting, over-processing, overproduction, and defects. On this subject, the food motion inside the warehouse is the question of this article. In the specific, the organizational layout, whether rightly chosen, allows for ameliorating sustainability performance both on the economic and environmental side. Indeed, it considers the logistic for moving foodstuffs when the collector have to face the seasonality of the freights [11,12,13,14].
Logistics, therefore, plays an important role in improving economic and environmental performance [15], and it concerns the ways to store goods and their flows along the chain. Along with these considerations, the modern global market is characterized by high uncertainty of product demand. Transportation costs can amount up to the 50% of total logistic costs and can affect the configuration of the logistic systems [16]. Additionally, the traditional manufacturing has been criticized for lots size, means of transport (defined as Outbound Logistic by Council of Supply Chain Management Professionals (CSCMP)), and management of the warehouse (referred as to Inbound or Intra Logistic by CSCMP), for which the need for sustainable manufacturing has been raised. In the specific, the environmental sustainability of logistic activities has become a prominent element of business strategy and competitive advantage. Hence, there are strong social and political pressures because of the increasing of public awareness for global warming and climate change finalized to reduce polluting emissions [15]. Along with these policies addressed to minimize the industrial environmental impacts, many companies have realized that the sustainable use of resources may also be associated with financial savings. In this regard, the Carbon Footprint (CF) and Management Costs (MCs) are relevant for measuring the goodness of the picked resources [6,16].
In the case of the Italian agro-food sector, organizations are mainly small-medium enterprises mostly operating in Short Food Supply Chain, characterized by variable lead time when stocking and picking goods in warehouse for marketing processes. In most cases, the goods are handled and stocked, without a specific criterion, and lacking of proper planning for managing the delivering time: in this sector, the warehouse layout is crucial, and it affects noticeably the delivering time. These deficiencies are addressed to those intermediaries that are required to set up a logistic layout to minimize the economic and environmental impacts of the handling activities. Thus, intermediaries play an increasingly important role to keep small–medium farms alive [16].
Starting from the lack of proper material handling planning in agro-food collect center, it emerges the necessity to provide a classification of a set of parameters and indicators allow to evaluate the logistic performance of agro-food collecting center under environmental/economic perspective and conduct further empirical investigation in the field of Short Food Supply Chain. This gap allows us to formulate the primary research question: Considering the new logistic strategies (e.g., warehouse layout, material handling equipment, warehouse storage strategy, etc.) in food collecting centers, and how they impact on the business of seasonal foodstuffs in the short food supply chain, is there a ‘best strategy’ that allows to optimize the logistic performance of agro-food collecting centers under economic and environmental perspective?
To fully investigate the primary research problem, the following subsidiary research questions are raised:
- What decisional parameters, in terms of logistics management, of agro-food collecting centers allow to evaluate the impacts on environmental and economic performance of short food supply chain?
- What specific capabilities will be expected to have the agro-food collecting centers in order to reduce costs and travelled distances, and, consequently, Carbon Footprint emissions and management/operative costs?
- How does the pallet picking strategy affect the business competitiveness of seasonal foodstuffs of the fruits and vegetables chain?
In other words, this study aims to assess the most efficient layout in agro-food class-based storage warehouses in order to identify the best pallet picking strategy allowing for the minimization of the environmental impact and the management cost due to inbound material handling. For this purpose, there have been considered three different warehouse management configurations: longitudinal, transversal, and fishbone. Each one is assessed considering the handling time from collecting the good from the rack, to the carry and to the picking area, according an ABC class-based storage approach. Following, an analytic model allows calculating the impact of the material handling strategy adopted based on different Material Handling Equipment (MHE) powered by different engines, such as internal combustion and electrical, both for Carbon Footprint and Management Costs. Optimizing the supply chain handling in the agro-food sector can be accomplished through modifying the MHE, adopting greener measures in it, and/or minimizing the food miles both inside and outside the warehouse.
The optimization of the logistic infrastructure, under an environmental perspective, depends on whether one adopts green energy sources instead of conventional ones, which are more polluting. This study does not focus on the end consumers, but rather on the mitigation of the environmental impact of the production activities. The methodological approach adopted is developed on analytic heuristic process jointly based on environmental and cost considerations, according to literature review shown in following section, there are not previous scientific studies on logistic in agro-food business, based on similar approach.
The paper consists of six more sections. The next one goes through the literature defining the warehouse structure and the warehouse costs impact over the farm management. The third section raises the necessity to improve the warehouse performance to gain competitiveness benefits. The fourth section explains the context within which the study has been implemented. The fifth section shows the adopted methodology to simulate the energy consumption and managing costs. The sixth section discusses the results through a simulation model, whilst the last section presents discussion and relevant conclusions.
2. Literature Review
As introduced in the prior paragraph, the sustainability is a wide concept that undoubtedly encompasses economic and environmental issues, such as polluting reduction and costs reduction, to say a few [17,18]. These two facets are squarely interrelated each other, and reducing environmental impacts means reducing costs for the ecosystem where organizations survive, so in turn, for single enterprises [19]. According to Centobelli et al. in [20] a considerable number of studies dealing with sustainability issues in logistics have been introduced, and several models have been developed in order to minimizing the impact under environmental and economic perspective. Indeed, scientific studies show that an improvement of environmental performances leads to an improvement of products and services quality which, in turn, improves cost performances. In this context, Validi et al. in [21] provide a mathematical model to select the shortest path allowing to reduce environmental harmful emission in the field of food supply chain. A model based on Artificial Neural Network is developed in order to predict the emissions and evaluate how the cost related to green practices positively impacts on competitiveness in workplaces [22]. A very similar methodology is adopted by Zhu and Sarkis in order to analysis and evaluate the relationship between the adoption of green supply chain practices and economic performance [23]. In search for solutions to the sustainability challenge, researcher and practitioners have explored and established the potential for managerial systems to drive sustainable organizational performance [24]. According to Harris et al. in [25] a first class of models is based on the well-known Economic Order Quantity (EOQ) strategy that aims to minimize the inventory and ordering costs as developed in 1913. Later, Baumol and Vinod in [26] modified the EOQ model with the purpose of evaluating transportation and other logistic costs separately. Several models followed the work of Baumol and Vinod [27,28], until a new inventory model that has been developed, namely the Sustainable Order Quantity (SOQ), which considers both economic and socio-environmental costs [29]. Models mainly differ in the function adopted for calculating transportation costs and the solutions thought lowering them. An increasing number of sustainable solutions make possible the minimization of logistic costs (inventory, transport costs) and environmental impact both, but most research is rather limited to studying the environmental impact of warehousing and inventory management from an outdoor perspective (outbound logistics) [18].
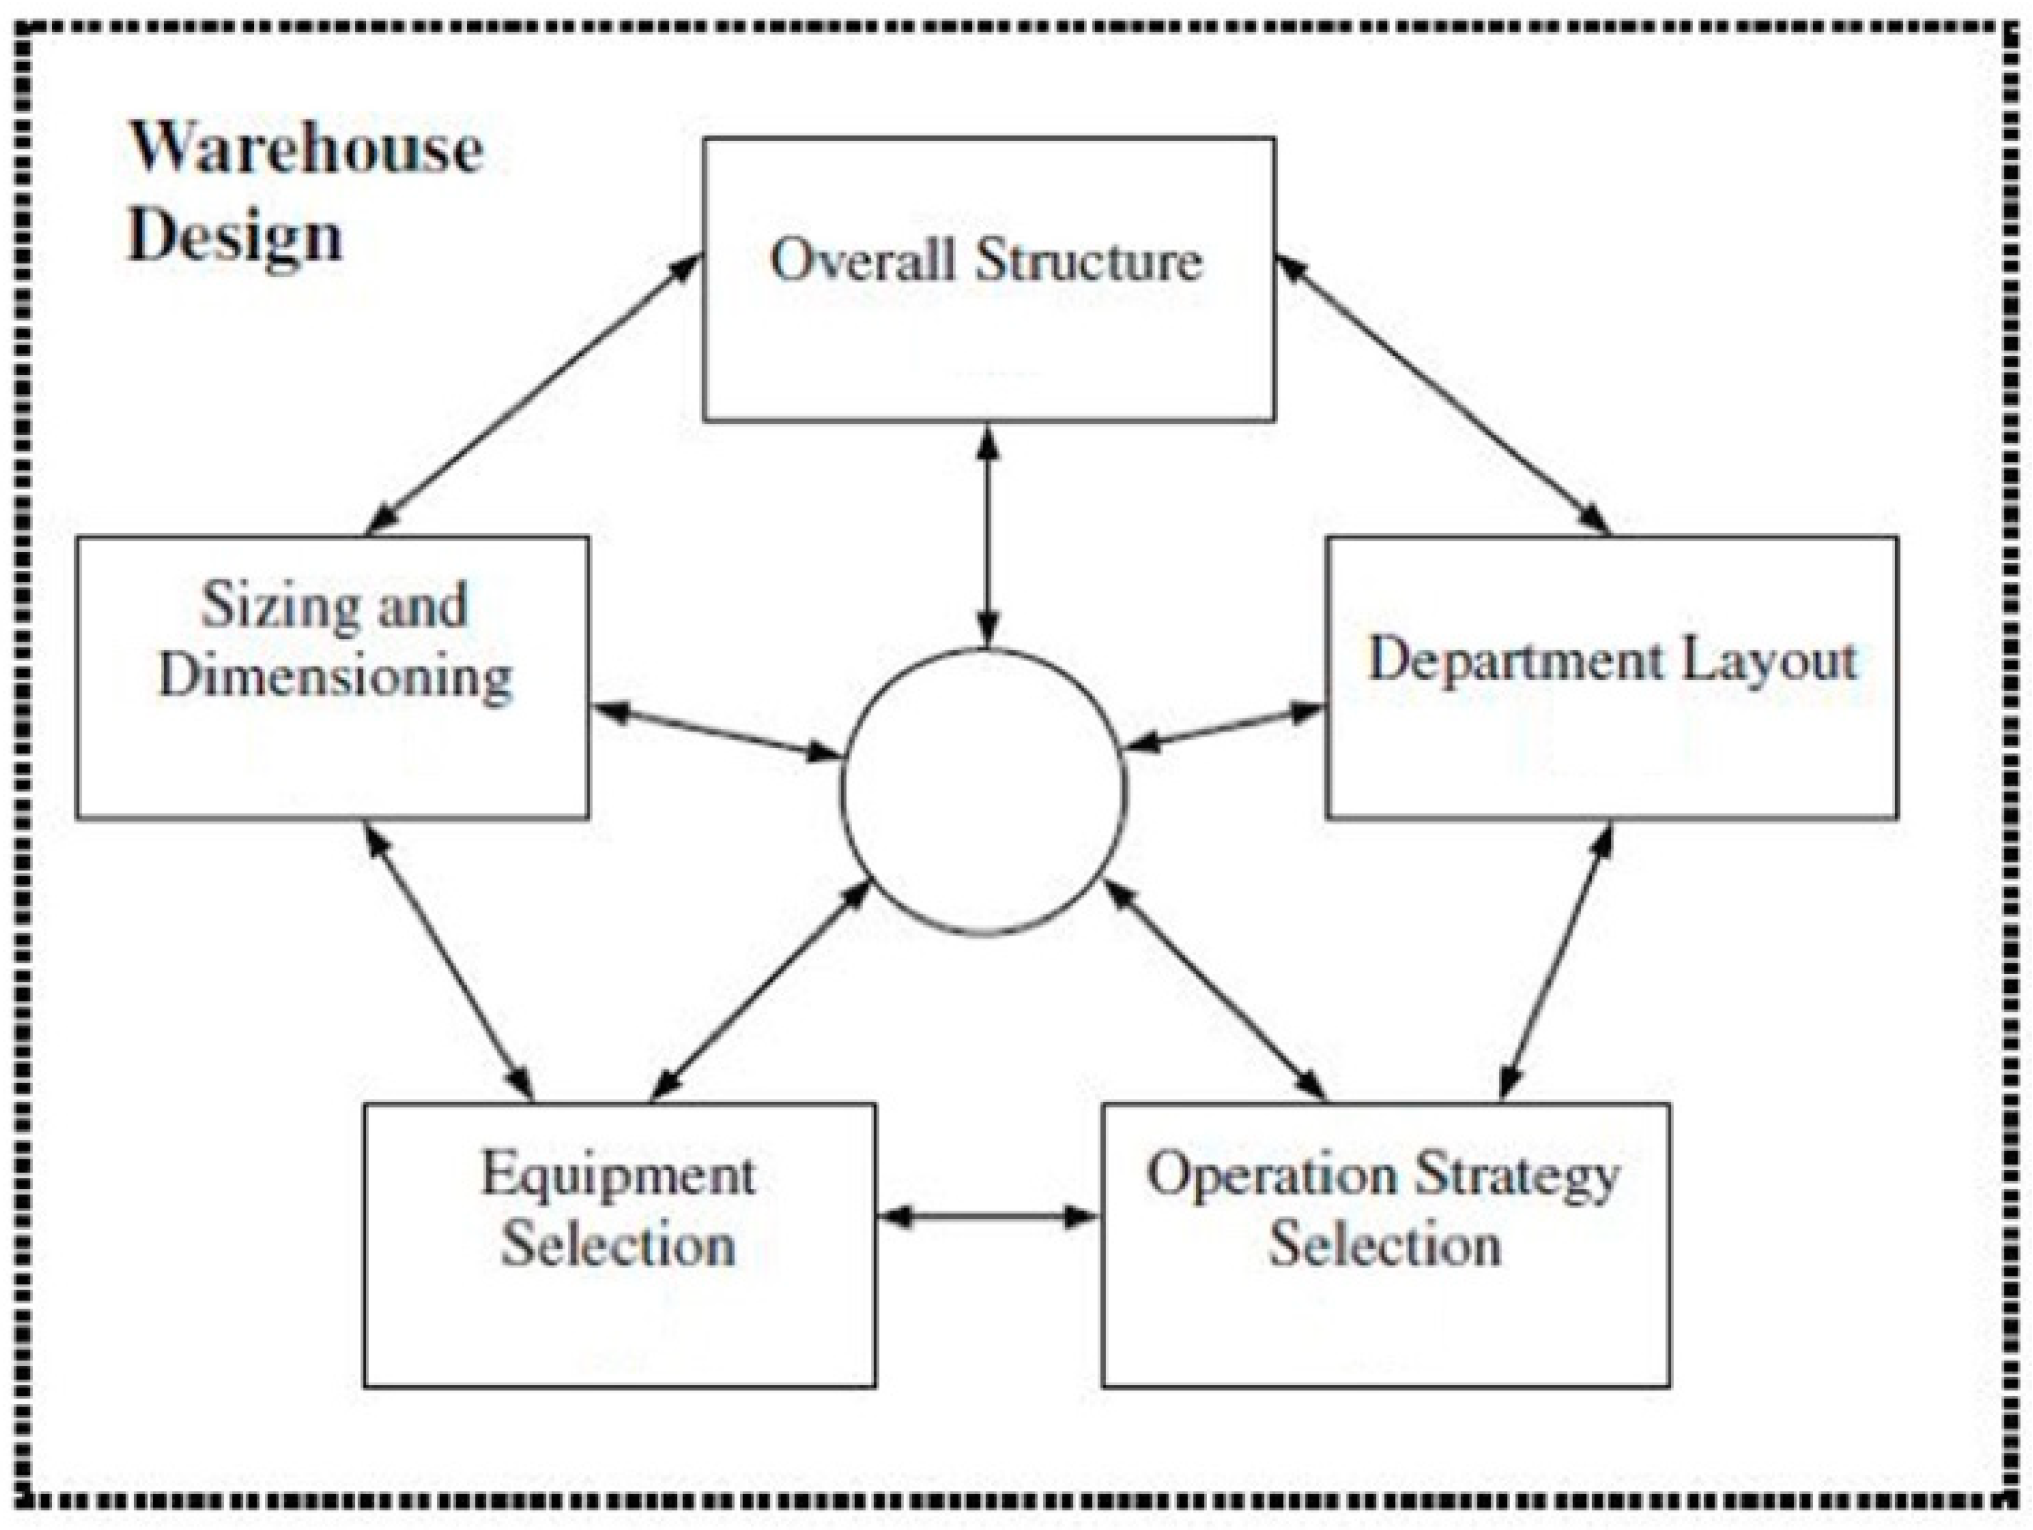
Gue et al. in [30] identified five decisional areas within the warehouse design, as shown in Figure 1 and reported, as follows:
- (i)
- Overall structure
- (ii)
- Department layout
- (iii)
- Operation Strategy Selection
- (iv)
- Equipment Selection
- (v)
- Sizing and Dimensioning
In particular, the Department layout (II) concerns the configuration of the aisles and the retrieval area. Instead, the Operation Selection Strategy (III) is related to the way the warehouse works in terms of layout and order picking. Under this study, both components play an important role in optimizing the material handling strategy, and in turn in affecting the returning value in terms of environmental and economic performance [19].
In the last decades, most researches have concentered on order picking strategy, in particular examining the energy usage in the forklift material handling, taking into account factors such as the pallet lift height and the routing of the non-road vehicles within the warehouse [31]. The choice of the Material Handling Equipment (MHE) characterized by low energy consumption is not the only strategy that allows for minimizing the environmental impact of the warehousing activities [32]. As a matter of fact, it is possible to ensure a low level of Carbon Footprint, with a minimal energy consumption, through adopting a specific material handling strategy through reducing the times of items retrieval and delivery in the warehouse [33]. According to Dukic and Oluic [34], the optimization of the routing policies is related to the identification of a batch order to be picked from the racks. This approach allows to minimize the total travel distance. For picker-to-part order picking system have been proposed different routing methods, including optimization algorithms. The performance of these heuristic approaches depends on the particular operating conditions of the system observed. It was estimated that the adoption of heuristic methods allows for an average reduction oscillating between 17% and 34% inside the path length of the forklift within the warehouse. In addition, the interaction between the routing strategy and the storage assignment adopted represents one of the most important aspects in the manual order picking approach [35].
In most studies the items to be stocked are considered like “elementary units” to operate in warehouses adopting multiple MHE, each of them characterized by a different loading capacity. In this case, the time spent in the picking activity depends on the number of units carried in each travel and on some technical specifications (travel speed, lift speed, capacity load, etc.) according to the MHE adopted. Boenzi et al. in [35] developed a new model allowing the identification of the best MHE in order to minimize the Carbon Footprint due to material handling activities, ensuring at same time the picking time required by warehouse management system.
Nonetheless, the studies concerning picking strategies leave several problems that still need to be solved. The review carried out by Gue et al. in [30], is a useful guide to tackle them. The review states five decisional areas, bearing in mind that each one of those cannot be evaluated as a stand-alone component but has to be integrated and developed in synergy with the others. The rationale is further shown by observing how a single decisional area modification affect outcomes of others [30].
Therefore, the literature review shows that:
- (i)
- Integrated models for the path routing identification and the storage assignment planning are not very widespread;
- (ii)
- Most researches considering the environmental issue in warehouse activities are focused on specific ‘save-energy’ aspects, and most of them are related to the building attributes;
- (iii)
- There is a lack in available scientific works that considers environmental sustainability in an integrated inventory and warehouse planning model;
- (iv)
- The order picking models ensure the reduction of the travel distance, retrieval time, or both, but in most cases the authors neglect the environmental performance and the management costs of the non-road vehicles adopted for material handling activities.
This paper is intended to help fill these gaps, and in particular, to provide an approach for minimizing the environmental and economic impacts of the intra logistic activities by means of jointly evaluating all aspects concerning the material handling activities, including the typology of the forklift to be adopted (internal combustion or electric engine equipped), the layout of the warehouse (longitudinal layout, transversal layout, and fishbone layout), and the turnover index of the foodstuffs to be stocked.
3. The Management of the Warehouse as a Factor of Competitiveness: The Case of Fresh Fruit and Vegetables
In recent years, the need for a satisfying response from the production–logistic system to the complex demands of the market has been raised as a significant topic of discussion and reflection. This trend is probably due to a new physiological need of flexibility, understood as the ability of an economic organization to cope with a series of “contingencies”, responding in a more economic and rapid manner to the environmental changes generated by the issue [19].
In the specific case of agro-food chains there are different types of Production-Distribution-Consumption (PDC) systems, each one characterized by specific organizational forms and different degrees of complexity, whose, in turn, generates different environmental impacts (e.g., greenhouse gas emissions). For agro-food organizations, the chain efficiency represents one of the frontiers for ameliorating competitiveness and related commercial policies by building up a positive environmental image [19,36]. The improved chain efficiency, customer services rate, product quality, availability, affordability, consumption rate and higher customers satisfaction, waste minimization, waste utilization, reduced cost and lead time, and strong competitive advantage in marketplace are only some of the outcomes of value addition practices in the food chain management [37].
In particular, the fruit and vegetable sector has undergone significant organizational changes in the last twenty years, in line with the general evolution in the agro-food system [4]. Advancements in information and transport technologies, changes in consumer habits, the evolution of large-scale retail trade, as well as the growth of global competition and the increase in foreign investments have redesigned the global economic and organizational context. These changes have raised the focus of the studies on the supply chain and the structure of the value chain [38,39,40]. This study is based on the management of the information flows aiming to reduce procurement times and costs, increasing effectiveness in satisfying consumer demand, and increasing the added value of the supply chain. The fundamental change of the company perspective lies on reconsidering competencies and competitive advantage from the perspective of the whole chain and not solely the step where the single operator is positioned: this brings consequences on the structure of the contractual relations and authorities existing between the different actors of the chain. For these reasons, logistics, as part of the whole supply chain, has been intensifying in complexity [41]. In the specific, it is precisely the evolving trends in demand generated by industry and commerce and the structural changes on the supply side that suggest the opportunity to take an integrated view of the market for freight transport and logistics. However, we is defined “sustainable” logistics as that one that is capable to address the problems of safety and the environment, as well as the needs of the economic development that depends on it [42].
One could then speak of a “triangle of sustainability” whose summits are:
- Economic efficiency
- Socio-territorial development
- Reduction of negative externalities
Despite of the important reorganization processes described above, some studies in the sector [43,44], show that in the Italian fruit and vegetable industry, the traditional retail sector covers an important portion inside the chain distribution, especially in Southern Italy. Nonetheless, it is precisely in the traditional distribution that the greatest inefficiencies due to fragmentation of demand and supply and the number and type of intermediaries to name a few are found. Therefore at least two-thirds of the products (in volume) follow non-optimized logistics chains [2]. In addition to inefficiencies detected, which would make the national companies uncompetitive, there are irresponsible companies that don’t pursuit the sustainable performance theme for the sake of short-term profits. Based on the recently review findings conducted by Shashi et al. in [37], it can be inferred that the significant mitigation in waste, emission, energy consumption, use of toxic materials and enlargement in the rate of recycling in agro-food chain operations are due to law requirements rather than merely a business choice [37]. When compared to other European countries such as France and Germany, the fruit and vegetable value chain in Italy presents several criticalities, with a strong imbalance towards a capillary distribution that affects almost equally preservable products (apples, etc.) and perishable products (strawberries, salads, etc.). In other words, the small–medium size of the Italian farms is representing a shortcoming when intermediaries approach to receive the freights from farms. This problem is becoming a hurdle difficult to overcome due to, operating in short food supply chain, the farms mostly offer seasonal foodstuffs. It follows that warehouse management, understood as a set of planning and control decisions and procedures, becomes a fundamental element for the competitiveness of a company [45].
The issue related to the small farms is faced in the next paragraph.
4. The Considered Context
Over the years, the agro-food sector has mainly changed because of several external forces. One is the rural development transition, which generates new objectives for the current players as its new purposes are qualitative oriented instead of the traditional quantitative ones. Small farms operating in close markets represent the common target adopting qualitative practices: to reach the farther demand, those actors need to outsource the marketing phases, which bear the highest costs. To do so, it appears that intermediaries are crucial. Even if their activities end when the product is delivered to the clients, they are part of an earlier stage consisting in setting up the design of the warehouse and of the internal logistic activities to minimize the needed resources [46]. It follows that, as stated earlier, designing the layout has an important impact on the equipment amount, the reduction of the working time and the increasing of the throughput. For seasonal foodstuffs, the intermediaries, supplied by local small producers from local areas, need to tackle the issue of the optimal design for enhancing sustainability performance and keep it up over time across the seasons. Then, when the optimal layout may change between seasons, the distributor can miss the sustainability [47,48]. The literature lacks studies in this perspective, and this article tries to contribute to this issue.
At this stage is necessary to introduce the logistic matter of the layout design for warehouse.
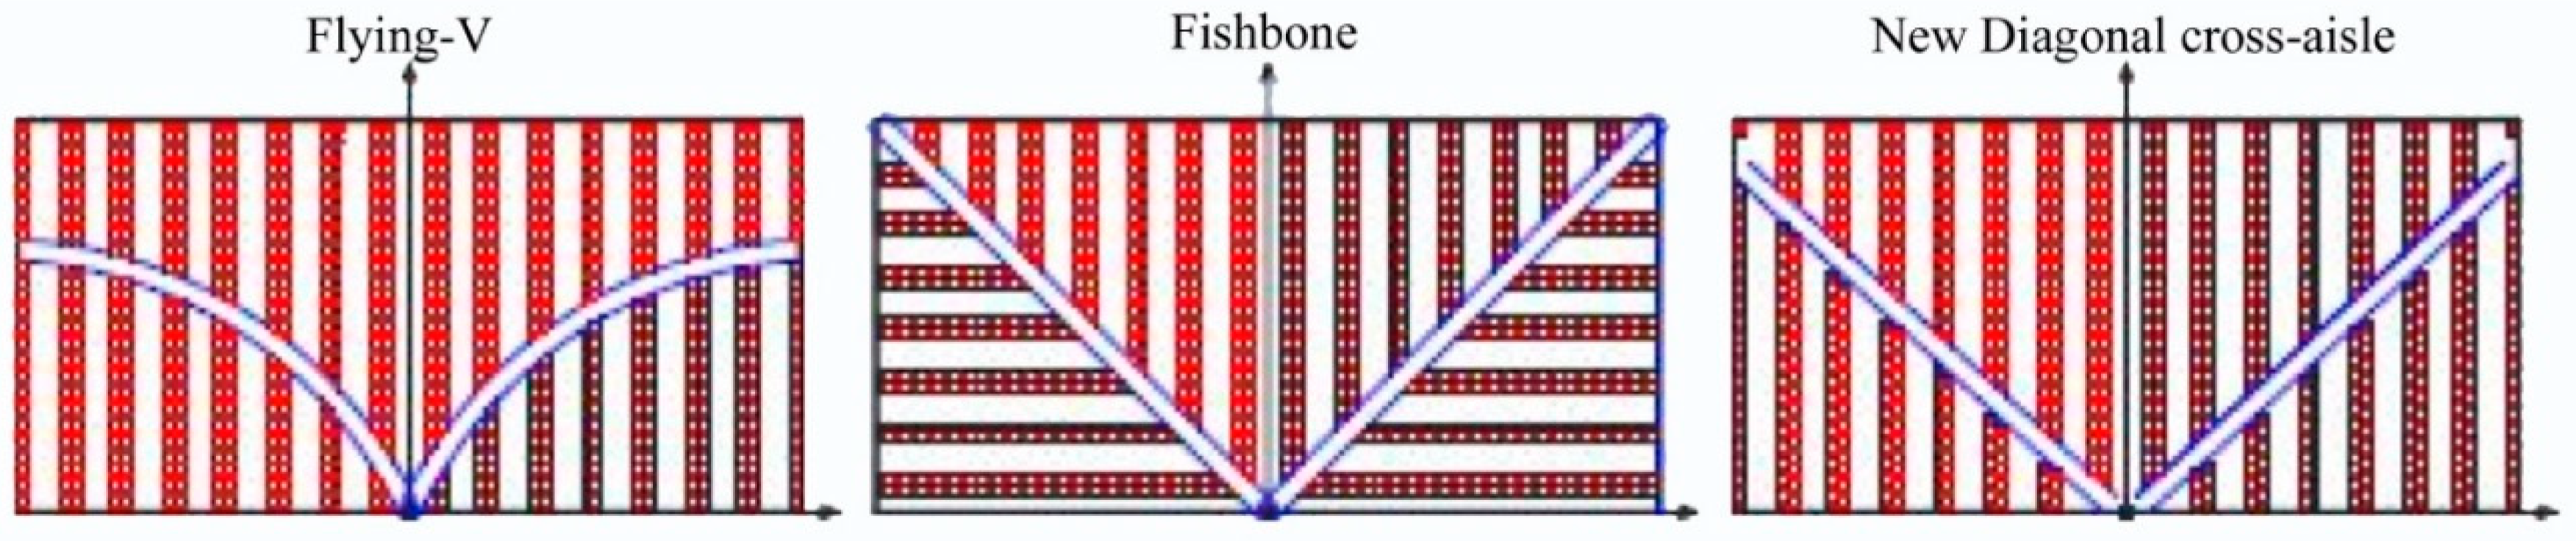
The literature states that the most used layouts until 2009 were the longitudinal and the transversal ones. The longitudinal one displays straight racks put in parallel, as well as the aisles, that are arranged as having the same width and length. The first attempt to optimize the longitudinal layout was developed with the transversal layout. The latter reduces the travelled time by decreasing the distances from the picking to the delivering area [21].
Since the introduction of the fishbone layout [49], many academic studies have attempted to design it as the most efficient. Worries concern the dimensions of the warehouse and the slope for the diagonal cross aisles. For instance, Gue & Meller [49] tried to overcome the common barriers preventing the optimal utilization of the longitudinal and transversal layouts, finding alternative solutions. In this respect, they elaborated the Flying-V layout, the Fishbone and New Diagonal cross-aisle as shown in Figure 2.
The choice of the warehouse design is considered a notable result as it reduces costs and travelled distances, and, consequently, Carbon Footprint emissions and additional costs.
5. Methodology
The design of the warehouse begins with the calculation of the travelled distances within each format. To do so, it is necessary to set and consider its main features. Before going to the description, the following list shows the notation used in the formula in the article:
- A: width of the warehouse [m];
- B: length of the warehouse [m];
- P/D: pickup and deposit point [m2];
- Lx: distance along the x axis between the P/D point and storage area [m];
- Ly: distance along the y axis between the P/D point and storage area [m];
- N: overall number of the items to be stocked in warehouse [unit]
- D: width of the aisles [m];
- el, ew, ed: size of the selected item according length, width, and depth [m];
- Vc: average travel speed of the forklift [km/h];
- t: average time taken by the forklift for the material handling activities [h];
- I: turnover index of the n-th item [#];
- : average path required for the handling of the items stored in warehouse [m/unit];
- CFLPG, CFele: average Carbon Footprint of the adopting forklift, equipped by electric (‘ele’ as subscript) or LPG (‘LPG’ as subscript) engine [kgCO2].
The method considers the following assumptions:
- The number of the total items stored in warehouse is constant and the maximum load capacity corresponds to N (there are not available slots in the racks of the warehouse);
- The items stocked have prismatic form and are characterized by the same sizes (ew, el, eh) and weight, the storing approach is based on only one-item for one-slot of the rack;
- The information order is known in advance;
- The picking of one-item does not depend by the position of the other items (racking system is adopted);
- The material handling phase is implemented by means of forklifts;
- Only one item is picked by the forklift for each loading/unloading cycle;
- The size of the warehouse is given;
- Class based storage is the stocked strategy adopted;
- The emission of the activities required for loading/unloading the pallet from rack are not considered, when the forklift is stopped. This assumption is considered acceptable since the time required for this operation is negligible when compared to the time required to reach the pallet;
- The energy and the time required for the pallet retrieving/stocking does not depend on the following: weight of the item, lift speed of the forks, and height of the slot where the item is stocked;
- Acceleration and deceleration of the forklift are not considered;
The process of pallet picking is composed by the following sequence of activities:
- the forklift starts moving from the P/D point travelling at a constant speed;
- the forklift stops in the storage area and pick the selected item;
- the forklift, with the load, goes back (moving on the same path of point number 1) to P/D point at a constant speed;
The process of pallet stocking is composed by the following sequence of activities:
- the forklift, with the load, starts moving from the P/D point travelling at a constant speed;
- the forklift stops in the storage area and stock the selected item;
- the forklift goes back (moving on the same path of point number 1) to P/D point at a constant speed;
The optimization purpose consists in minimizing the objective function considering the Carbon Footprint generated by the movement of the forklift. A comparison between forklift equipped with LPG engine versus an electrical one has been considered. These equations follow:
where:
- FLPG, Fele: Fuel and electric mission factor ;
- CLPG, Cele: average fuel and energy consumption hourly rate ;
- η: overall efficiency of the electric energy due to electrochemical charging efficiency of the battery;
- t: average time required for material handling activities [h/units].
The costs evaluation (Management Costs) has been distinguished in average Facilities Costs (FCs), as given by warehouse activities such as heating, lighting, cleaning service, warehouse maintenance, and so on. Additionally, these operations are equal for warehouses with either electric or LPG forklifts. On the other hand, Operative Costs (OCsLPG, OCsele) depend on average energy consumption relating to the handling activities in case of forklifts equipped by internal combustion or electric engine.
According to the following equations, the costs are calculated:
where:
- Area: overall surface of the warehouse [m2];
- : Utilities costs due to warehouse activities calculated per m-squared ;
- : average cost of the fuel or electricity for forklift engine supply .
The objective function to be minimized (Equation (6)) has been applied to come out the results of the overall minimum time (Ttot) required for picking and stocking all items from the rack within the warehouse. The function is evaluated on the basis of parameter, that depends on the total path for material handling activity considering the layout and the turnover index of the stocked items. To this extent, Vc depends on technical specification of the forklift, generally for safety concern, the travel speed of the forklift in warehouse should not exceed 10 (km/h).
where N identifies the overall number of the items to be handled in warehouse.
The average time required by the forklift for material handling activities (t) is strongly related to the travel speed and routing path for picking activities. This means that the first parameter depends by forklift performance (Vc) and the second parameter () on the pallet picking strategy adopted and on layout of the warehouse. Therefore, it is necessary to identify both parameters for each one of three different layouts adopted in the model.
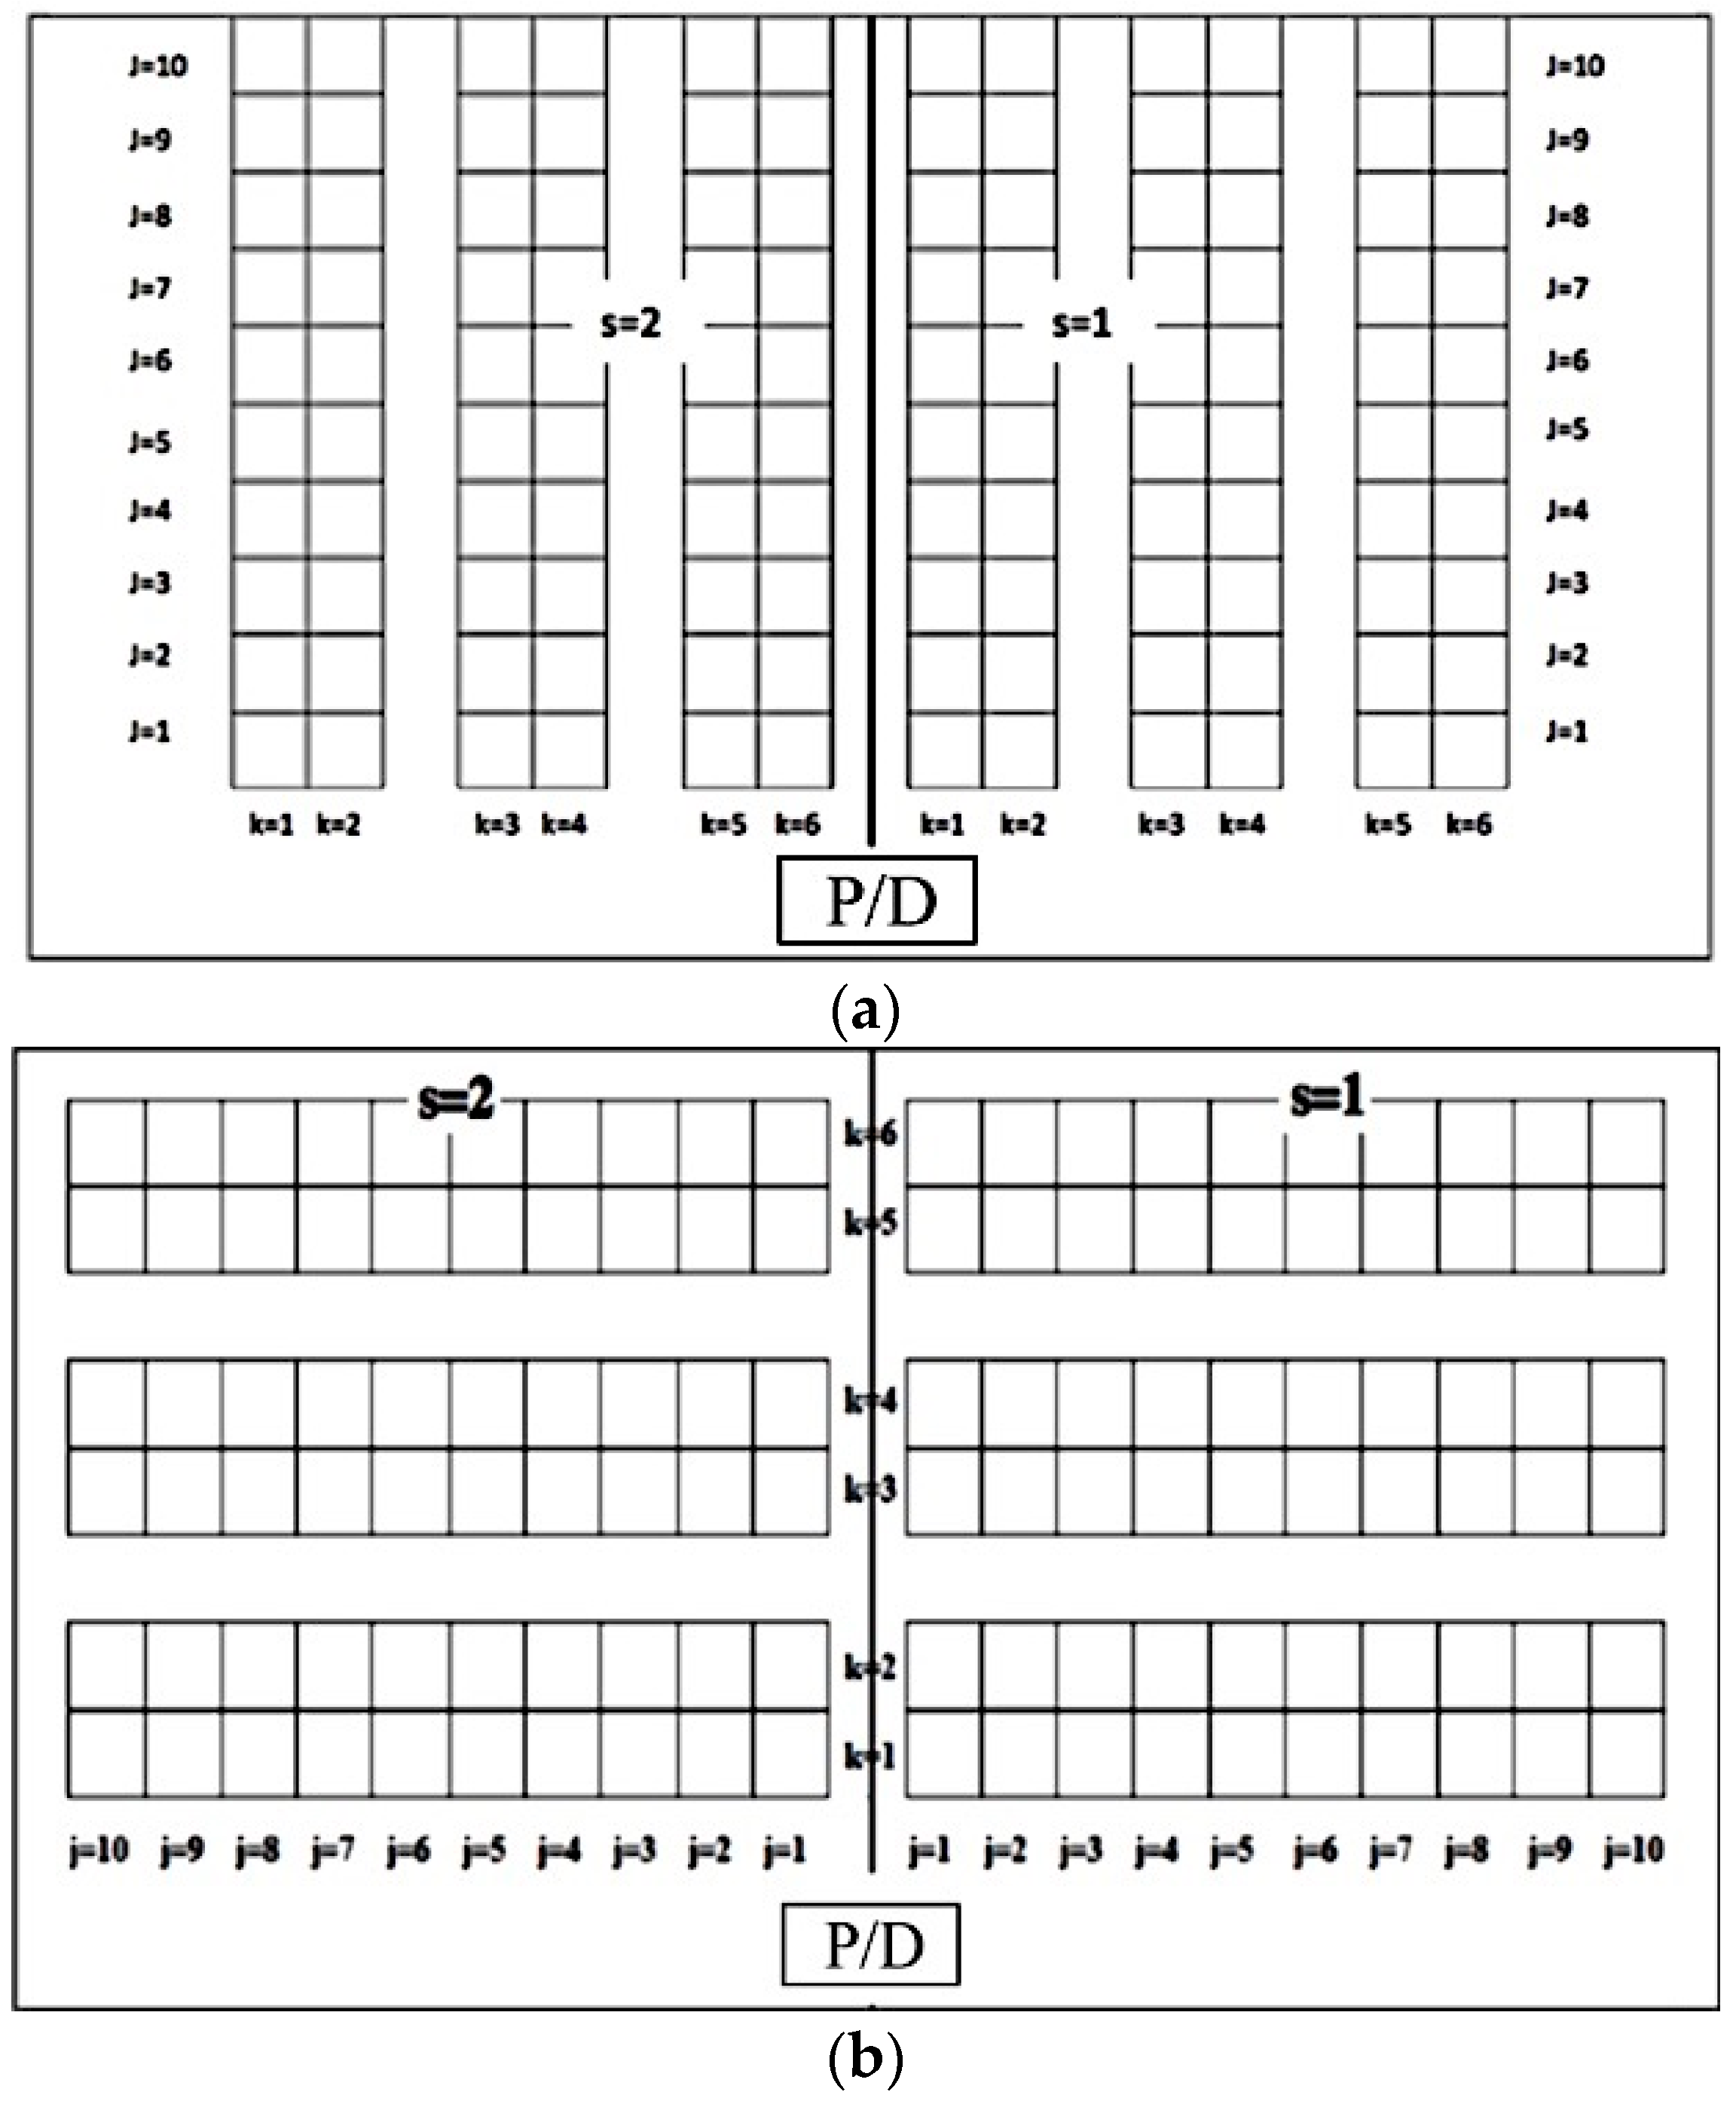
5.1. Longitudinal and Transversal Layouts
The ‘traditional’ layouts of the warehouses are identified as longitudinal and transversal: in the first case the shelving is laid out perpendicularly to the P/D point and there is one aisle for each rack (see Figure 3a). In the second case the shelving is laid out parallel to the P/D point and there is one main aisle for the material handling activities (see Figure 3b). The notations adopted to identify the geometrical features of both warehouses are listed below:
- s: sector of the layout;
- k: rank of the layout;
- j: position of the selected item within the generic rack;
- l: level of the shelf;
- Oskjl: position of the selected item to be retrieved.
These parameters are identified to evaluate the routing path of the forklift on the basis of adopted layout in the warehouse. In the following are shown the equations for calculating the average path for the handling of the items stored in warehouses characterized by longitudinal or transversal layouts:
where Pskjl is the path of the forklift for the handling of one selected item from position identified by s, k, j, and l parameters. According to the analytical model developed, this position can be identified by means X and V variables, which represent respectively the path travelled by the forklift to reach the k-th rack (X) and the path along the aisle to get the j-th rack (V). The Iskjl parameter instead identifies the specific turnover inventory ratio referring to selected items located in s, k, j, and l position.
In the cases of longitudinal and transversal layouts, the evaluation of both parameters (X and V) changes, as it depends on different geometrical constraints characterizing the layouts. Instead, the K, J, and L values identify the maximum number of available slots in the racks within the warehouse.
5.2. Fishbone Layout
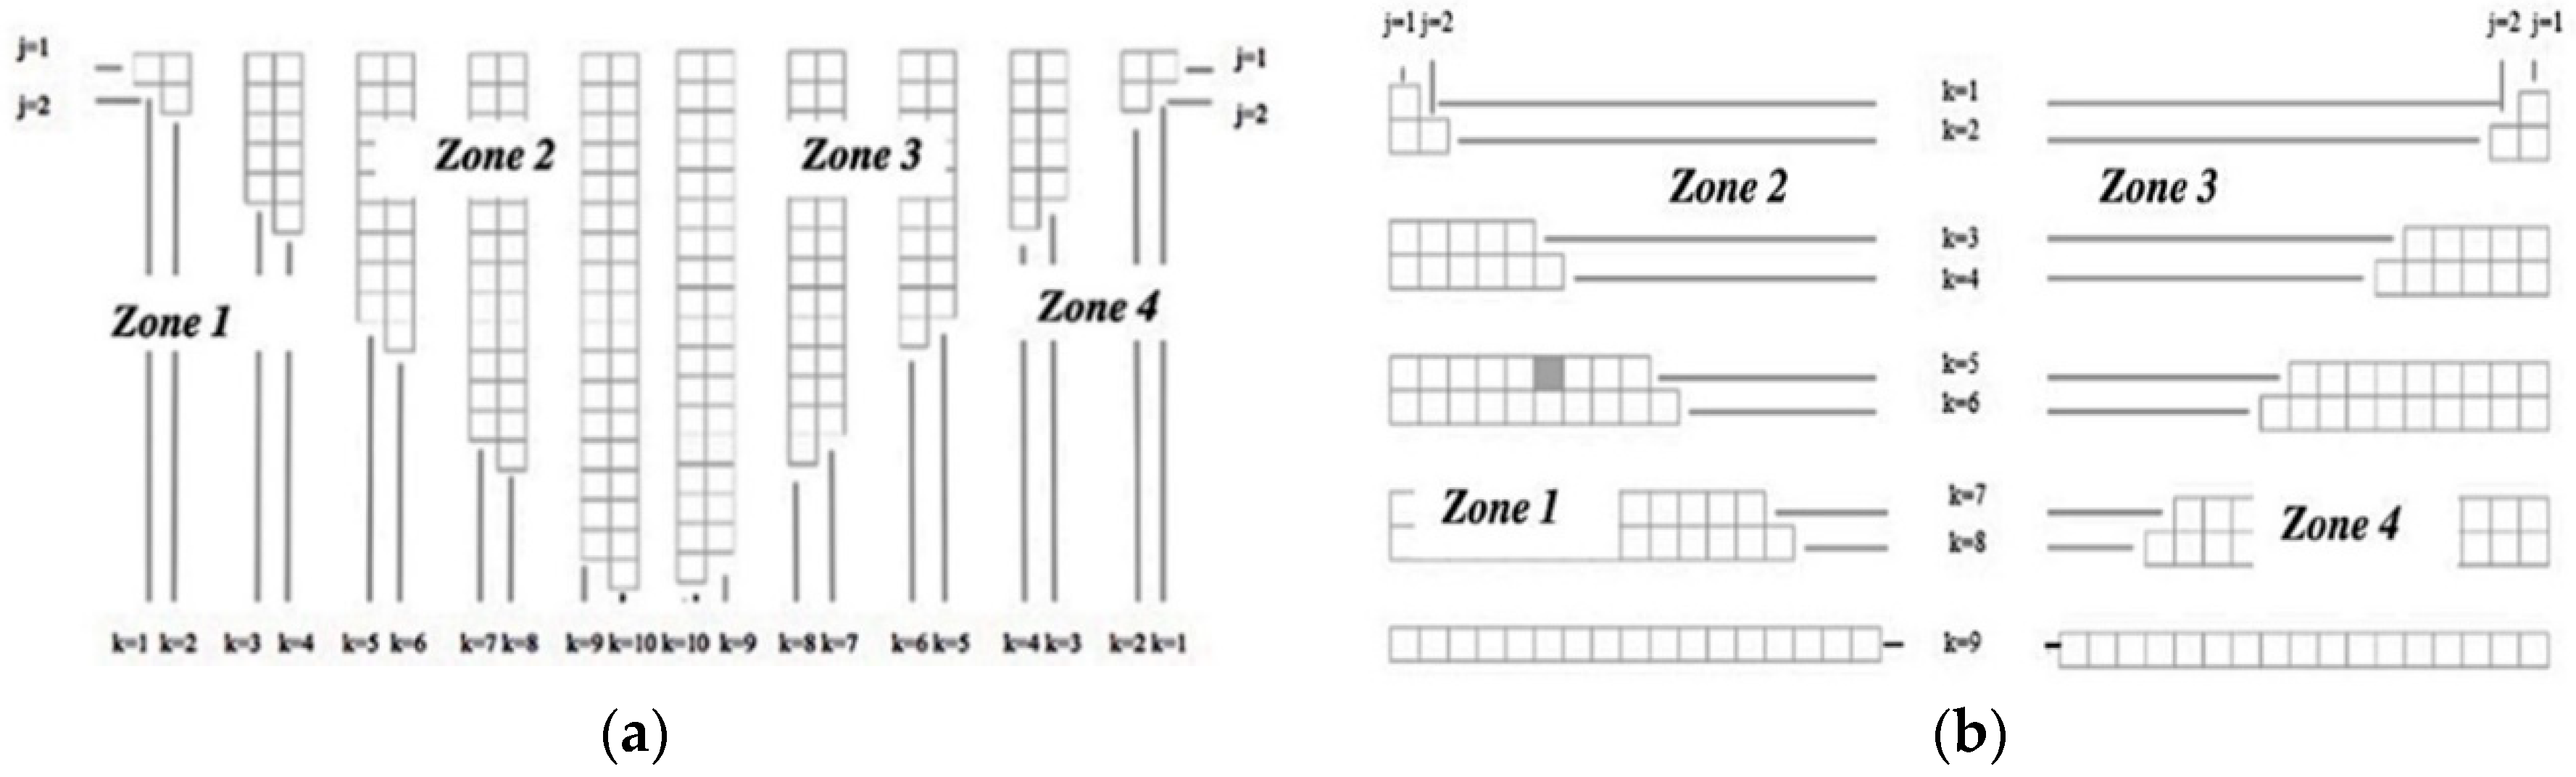
The fishbone layout was introduced by Gue & Meller in [49]: their proposed design presents two main diagonal aisles forming a “V” and picking aisles that are perpendicular to the sides of the warehouse (see Figure 4a). According to the authors, this design ensure savings of 20% inside paths for the picking and the depot of the items within the warehouse. This claim is related to the particular diagonal position of the main aisles. Indeed, the distance between P/D point and the selected item to be picked is very close to the Euclidean distance (see Figure 4b). This is not true in the case of the traditional rectilinear warehouse (both longitudinal and transversal layout) in which it is always necessary to traverse the full rectilinear aisle to complete picking activities. It is important to note that in these cases, the authors consider that the items to be stocked are all characterized by same turnover index ratio.
According to the design of fishbone layout, is possible to identify the following geometrical characteristics:
- There are four equal zones shaped as triangles and they are identified from ‘zone 1’ to ‘zone 4’;
- There are three aisles: one in the middle between zone 2–3, and two diagonally, respectively between zone 1–2 and zone 3–4;
- D parameters are the same for every aisle;
- The diagonal aisles always end in the upper corners of the warehouse.
The average path for the handling of the items stored in warehouses is calculated by means of the Equation (7); the nomenclature adopted to identify the geometrical features is shown in Figure 5a,b.
In this case, the developed analytical model to identify Pskjl is related to four different variables. In the specific, X represents the distance along the diagonal aisle to get the selected items and it depends on the slope of the aisles and the lengths of the legs of one of the identified triangles.
Concerning parameter V, this represents the distance within the parallel aisles from the start of the aisle to the position of the select item according to the j-th position.
6. Simulation Model and Results
A simulation model was implemented in order to identify the optimal warehouse layout for different agro-food collecting centers, adopting the proposed model. In the case hereby presented, the stocking of the three-different classes of items identified as A, B, and C is considered, with each of them being characterized by a specific turnover index ratio (IA, IB, and IC), whose values are listed below:
- IA = 90 the items are picked very frequently in a given interval time;
- IB = 12 the items are picked occasionally in a given interval time;
- IC = 3 the items are picked rarely in a given interval time.
The parameter I is assumed to embrace a season, therefore the goods from the collecting center are considered to be seasonal food. Four different scenarios are evaluated considering the same value of N parameters for each case; in Table 1 it is possible to observe that the percentage of the different classes of items to be stocked in the collecting center change significantly for each scenario.
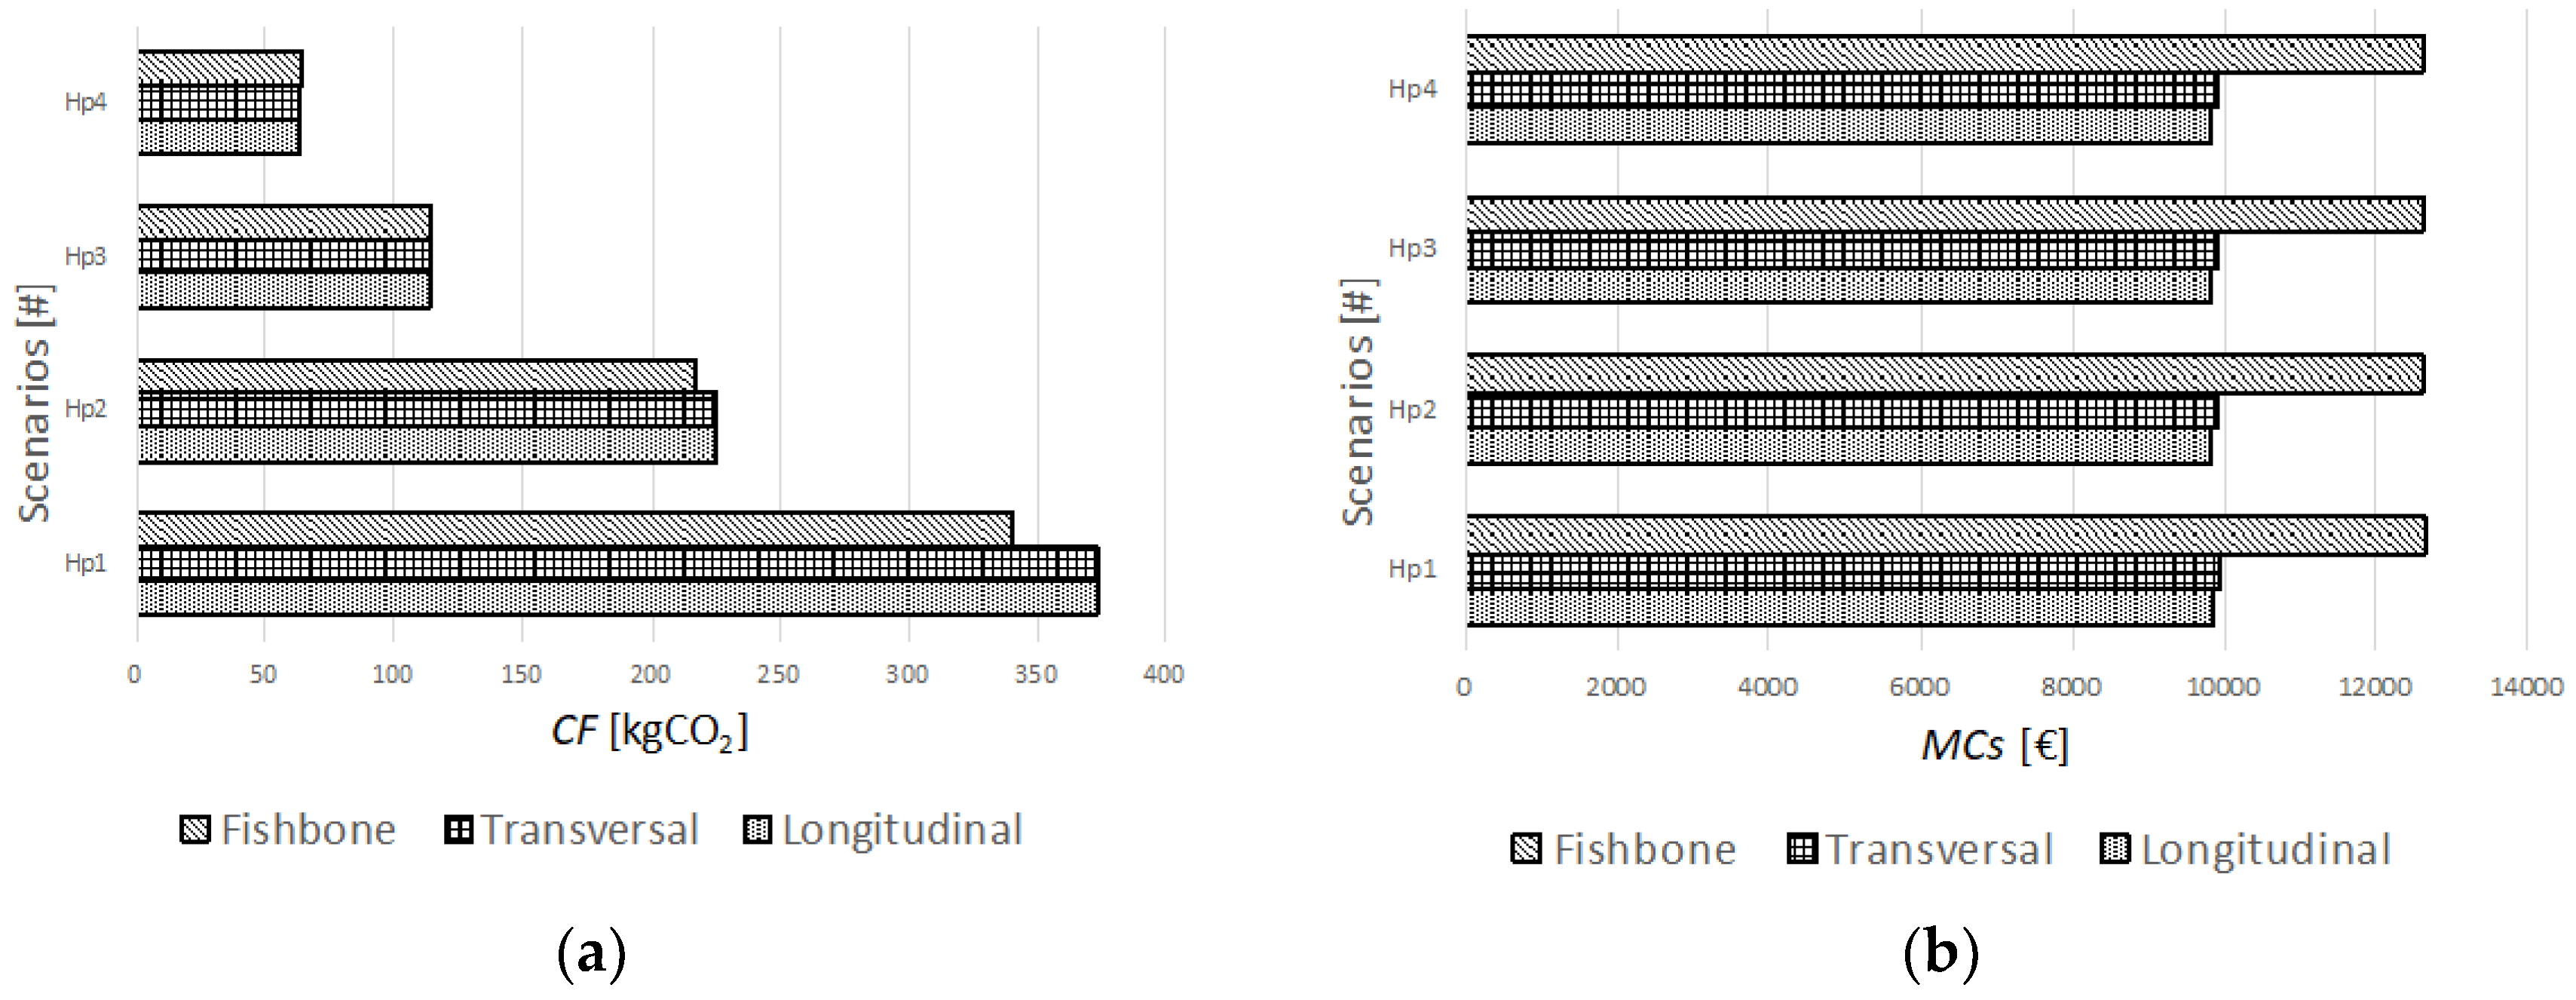
The model allows the evaluation of the environmental (measured as Carbon Footprint) and economic impacts (measured as Management Costs) due to material handling activities adopting a collecting center with different layouts and with forklifts powered by internal combustion or electric engine. The strategy suggested by the model is shown in the following tables, in four different scenarios, in order to minimize the Carbon Footprint (Table 2) and Management Costs (Table 3).
It is possible to observe that the layouts suggested by the model in the collecting center, change on the basis of the mix of the goods to be stocked. In particular, the environmental impact is reduced by approximately of 10% adopting the fishbone layout in cases identified as #1 and #2. Instead, in cases #3 and #4 the longitudinal and the transversal layouts ensured a reduction of Carbon Footprint by approximately of 1% (see Figure 6a). Although the fishbone layout ensured a lower average path for the handling of the goods, it requires a collecting center with larger surface area compared to the one calculated for the longitudinal and transversal layouts. As a result, the Management Costs of fishbone layouts averages 20% higher than the longitudinal and transversal layout in terms of economic scores (see Figure 6b).
Regarding the MHE evaluation, the electric forklift adoption gives the best results in terms of environmental and economical performances both. Indeed, in the cases analyzed, the electric forklift ensured a reduction of about 50% of Carbon Footprint and a OCs saving of about 20% when compared to LPG-forklift.
7. Discussion and Conclusions
In trying to find a solution to increase the environmental and economic sustainability of the food supply chain, this study shows that such issues can be treated with having consideration of the logistics inside the warehouse where foodstuffs are stocked. In that case, seasonal foodstuffs of the fruits and vegetables chain have been considered, and the logistics issue regards the layout design for stocking food in order to find the optimal solution in terms of Carbon Footprint and related Managing Costs. The researched value to be added to the supply chain [43] implies that through minimizing the picking time of the goods, the Carbon Footprint and related costs are optimized with checking out among the performance of each layout. Results show that when the layout is fixed over the time, the performance return the best solution. However, to fix the layout, it is necessary to take into account the turnover index of the supplied goods. Within a long supply chain, the issue does not matter, on the contrary, the short fruit and vegetable chain entails that the suppliers are locally placed, and the production comes from seasonal farming [50]. Nowadays the short chains of the seasonal foodstuffs are seen as a paradigm of quality and trust for the producers, and they are quickly taking hold. This evidence is mainly appearing in contexts where operate farms having small–medium sizes. Indeed, although they work close to the consumers, they make use of intermediaries to increase the market share. Intermediaries (collecting centers), in turn, when collecting freights from different small farms, need to set up the finest resources organization that encompass the logistics issues [13,51,52]. Nonetheless, the results of this study display that the optimum layout changes when changing the turnover index of the stocked goods. In this regard, the seasonal fruit and vegetable carry different turnover indexes in the warehouse, and the sustainability of the performance is inevitably subjected to change over the seasons.
Results, hereby presented, clearly suggest that when most goods stocked in collecting centers are characterized by high turnover indices, the fishbone layout ensure the minimal environmental impact if compared with the longitudinal and transversal layouts, by keeping lower level of Carbon Footprint for collecting center in which most goods stocked are characterized by low values of turnover index ratios.
Of course, the difference in terms of Carbon Footprint is much more relevant when considering the two types of engine fuel instead of the layout modification only. With a fishbone layout, in fact, the electrical engine generates half of the emissions produced by LPG engine instead.
This finding brings meaningful insight concerning the evolution of the warehouse layout studies: bringing together the fishbone layout and electrical engine, they can produce positive synergies in terms of environmental impact. Further comments in terms of cost level can be made, taking into account that implementing the fishbone layout is more expensive due to larger surface required and the higher complexity of the design. In this context, a limit of the model is surely represented by the utility costs related to warehouse facilities (FCs). The costs of a charging station and relative infrastructure installations required in the case of electric forklifts are not considered.
According to the output generated by the model in the previous section, Carbon Footprint and Management Costs performance depends on the turnover inventory ratio of the goods stocked. Consistently, if keeping the average turnover at a fixed level, it becomes easy to make the best decision after witnessing the results of the analytical model. In other words, if the average turnover index of the goods stocked in the collecting center can be aligned at a specific level within a season, it is possible to identify the optimum strategy. Therefore, a good approach can be oriented to store the goods by monitoring the average turnover index so that it is kept within or over a critical point that represents the border level for considering another layout as “optimal”.
The last consideration regards the divergence between the strategies suggested by the model in order to optimize the environmental and economic aspects. Consistently with this claim, in many cases the model, given the same input, could suggest two different strategies: one strategy allowing minimization of Carbon Footprint and another different strategy ensuring the minimization of the Management Costs. In these cases, it is harder for logistic operators to make a decision. Therefore, future development of the model should be include more optimization criteria in its objective function. This will lead to the possibility of applying it to more complex scenarios, thus ensuring greater flexibility and increasing the number of the industrial environments in which it can find place.
Author Contributions
F.F. and G.D.P. conceived of the presented idea. F.F. developed the model and performed the computations. F.F. and G.D.P. verified the analytical methods. G.D.P. and N.F. investigated on aspects related to management of agro-food collecting centers. All authors discussed the results and contributed to the final manuscript.
Funding
This research received no external funding.
Conflicts of Interest
The authors declare no conflict of interest.
References
- Gallo, C.; Faccilongo, N.; La Sala, P. Clustering analysis of environmental emissions: A study on Kyoto Protocol’s impact on member countries. J. Clean. Prod. 2018, 172, 3685–3703. [Google Scholar] [CrossRef]
- Savino, M.M.; Manzini, R.; Mazza, A. Environmental and economic assessment of fresh fruit supply chain through value chain analysis. A case study in chestnuts industry. Prod. Plan. Control 2015, 26, 1–18. [Google Scholar] [CrossRef]
- Tait, P.; Saunders, C.; Guenther, M.; Rutherford, P. Emerging versus developed economy consumer willingness to pay for environmentally sustainable food production: A choice experiment approach comparing Indian, Chinese and United Kingdom lamb consumers. J. Clean. Prod. 2016, 115, 65–72. [Google Scholar] [CrossRef]
- Hardy, P.Y.; Béné, C.; Doyen, L.; Pereau, J.C. Viability and resilience of small-scale fisheries through cooperative arrangements. Environ. Dev. Econ. 2016, 21, 713–741. [Google Scholar] [CrossRef]
- Albliwi, S.A.; Antony, J.; Lim, S.A.H. A systematic review of Lean Six Sigma for the manufacturing industry. Bus. Process Manag. J. 2015, 3, 665–691. [Google Scholar] [CrossRef]
- Facchini, F.; Mummolo, G.; Mossa, G.; Digiesi, S.; Boenzi, F.; Verriello, R. Minimizing the carbon footprint of material handling equipment: Comparison of electric and LPG forklifts. J. Ind. Eng. Manag. 2016, 5, 1035–1046. [Google Scholar] [CrossRef]
- Seruing, S.; Muller, M. From a literature review to a conceptual framework for sustainable supply chain management. J. Clean. Prod. 2008, 16, 1699–1710. [Google Scholar] [CrossRef]
- Garza-Reyes, J.A. Green lean and the need for Six Sigma. Int. J. Lean Six Sigma 2015, 3, 226–248. [Google Scholar] [CrossRef]
- Powell, D.; Lundeby, S.; Chabada, L.; Dreyer, H. Lean Six Sigma and environmental sustainability: The case of a Norwegian dairy producer. Int. J. Lean Six Sigma 2017, 1, 53–64. [Google Scholar] [CrossRef]
- Bao, Q.; Kochan, B.; Shen, Y.; Creemers, L.; Bellemans, T.; Janssens, D.; Wets, G. Applying FEATHERS for Travel Demand Analysis: Model Considerations. Appl. Sci. 2018, 8, 211. [Google Scholar] [CrossRef]
- Zhang, A.; Luo, W.; Ting Chia, S.; Sim, Z.H.X. Lean and Six Sigma in logistics: A pilot survey study in Singapore. Int. J. Oper. Prod. Manag. 2016, 11, 1625–1643. [Google Scholar] [CrossRef]
- Guo, Z.; Zhang, Y.; Zhao, X.; Song, X. A Timed Colored Petri Net Simulation-Based Self-Adaptive Collaboration Method for Production-Logistics Systems. Appl. Sci. 2017, 7, 235. [Google Scholar] [CrossRef]
- Ugarte, G.M.; Golden, J.S.; Dooley, K.J. Lean versus green: The impact of lean logistics on greenhouse gas emissions in consumer goods supply chains. J. Purch. Supply Manag. 2016, 22, 98–109. [Google Scholar] [CrossRef]
- McKinnon, A.; Browne, M.; Whiteing, A.; Piecyk, M. Green Logistics: Improving the Environmental Sustainability of Logistics; Kogan Page Publishers: London, UK, 2015. [Google Scholar]
- Soode-Schimonsky, E.; Richter, K.; Weber-Blaschk, G. Product environmental footprint of strawberries: Case studies in Estonia and Germany. J. Environ. Manag. 2017, 9, 564–577. [Google Scholar] [CrossRef] [PubMed]
- Đukić, G.; Česnik, V.; Opetuk, T. Order-picking methods and technologies for greener warehousing. Strojarstvo Časopis za Teoriju i Praksu u Strojarstvu 2010, 52, 23–31. [Google Scholar]
- Dekker, R.; Bloemhof, J.; Mallidis, I. Operations Research for green logistics–An overview of aspects, issues, contributions and challenges. Eur. J. Oper. Res. 2012, 219, 671–679. [Google Scholar] [CrossRef]
- Gulati, S.; Roy, D. Free trade and the greening of domestic industry. Environ. Dev. Econ. 2015, 20, 1–19. [Google Scholar] [CrossRef]
- Kumar, S.; Managi, S. Carbon-sensitive productivity, climate and institutions. Environ. Dev. Econ. 2016, 21, 109–133. [Google Scholar] [CrossRef]
- Centobelli, P.; Cerchione, R.; Esposito, E. Environmental Sustainability and Energy-Efficient Supply Chain Management: A Review of Research Trends and Proposed Guidelines. Energies 2018, 11, 275. [Google Scholar] [CrossRef]
- Validi, S.; Bhattacharya, A.; Byrne, P.J. Integrated low carbon distribution system for the demand side of a product distribution supply chain: A DoE-guided MOPSO optimiser-based solution approach. Int. J. Prod. Res. 2014, 52, 3074–3096. [Google Scholar] [CrossRef] [Green Version]
- Facchini, F.; Mossa, G.; Mummolo, G. A model based on artificial neural network for risk assessment to Polycyclic Aromatic Hydrocarbons in workplace. In Proceedings of the European Modeling and Simulation Symposium, Athens, Greece, 25–27 September 2013; pp. 282–289. [Google Scholar]
- Zhu, Q.; Sarkis, J.; Lai, K. Green supply chain management innovation diffusion and its relationship to organizational improvement: An ecological modernization perspective. J. Eng. Technol. Manag. 2012, 29, 168–185. [Google Scholar] [CrossRef]
- Chiarini, A. Environmental Policies for Evaluating Suppliers’ Performance Based on GRI Indicators. Bus. Strateg. Environ. 2017, 1, 98–111. [Google Scholar] [CrossRef]
- Harris, I.; Naim, M.; Palmer, A.; Potter, A.; Mumford, C. Assessing the impact of cost optimization based on infrastructure modelling on CO2 emissions. Int. J. Prod. Econ. 2011, 131, 313–321. [Google Scholar] [CrossRef] [Green Version]
- Baumol, W.J.; Vinod, H.D. An inventory theoretic model of freight transport demand. Manag. Sci. 1970, 7, 413–421. [Google Scholar] [CrossRef]
- Janic, M. Modelling the full costs of an intermodal and road freight transport network. Transp. Res. Part D Transp. Environ. 2007, 12, 33–44. [Google Scholar] [CrossRef]
- Sahin, E.; Dallery, Y. Assessing the impact of inventory inaccuracies within a newsvendor framework. Eur. J. Oper. Res. 2009, 197, 1108–1118. [Google Scholar] [CrossRef]
- Digiesi, S.; Facchini, F.; Mossa, G.; Mummolo, G.; Verriello, R. A Cyber-Based DSS for a Low Carben Integrated Waste Management System in a Smart City. IFAC-PapersOnline 2015, 48, 2356–2361. [Google Scholar] [CrossRef]
- Gue, J.; Goetschalckx, M.; McGinnis, L. Research warehouse design and performance evaluation: A comprehensive review. Eur. J. Oper. Res. 2010, 203, 539–549. [Google Scholar] [CrossRef]
- Zajac, P. The idea of the model of evaluation of logistics warehouse systems with taking their energy consumption under consideration. Arch. Civ. Mech. Eng. 2010, 2, 479–492. [Google Scholar] [CrossRef]
- Bing, X.; Bloemhof-Ruwaard, J.; Chaabane, A.; van der Vorst, J. Global reverse supply chain redesign for household plastic waste under the emission trading scheme. J. Clean. Prod. 2015, 103, 28–39. [Google Scholar] [CrossRef]
- Chen, J.X.; Chen, J. Supply chain carbon footprinting and responsibility allocation under emission regulations. J. Environ. Manag. 2017, 188, 255–267. [Google Scholar] [CrossRef] [PubMed]
- Dukic, G.; Oluic, C. Order-picking Routing Policies: Simple Heuristics, Advanced Heuristics and Optimal Algorithm. J. Mech. Eng. 2004, 50, 530–535. [Google Scholar]
- Boenzi, F.; Digiesi, S.; Facchini, F.; Mossa, G.; Mummolo, G. Greening Activities in Warehouses: A Model for Identifying Sustainable Strategies in Material Handling; Vienna, B.K., Ed.; DAAAM International: Zadar, Croatia, 2015; pp. 980–988. [Google Scholar]
- Carbon Trust, C. Product Carbon Footprinting: The New Business Opportunity; The Carbon Trust: London, UK, 2008. [Google Scholar]
- Cerchione, S.; Cerchione, R.; Singh, R.; Centobelli, P.; Shabani, A. Food cold chain management: From a structured literature review to a conceptual framework and research agenda. Int. J. Logist. Manag. 2018. [Google Scholar] [CrossRef]
- Fearne, A.; Hughes, D. Success factors in the fresh produce supply chain: Some examples from the UK. Supply Chain Manag. 1999, 4, 120–131. [Google Scholar] [CrossRef]
- Vavra, P.; Goodwin, B.K. Analysis of Price Transmission along the Food Chain; OECD: Paris, France, 2005. [Google Scholar]
- Fischer, C.; Gonzalez, M.A.; Henchion, M.; Leat, P. Trust and economic relationships in selected European agrifood chains. Acta Agric. Scand. Sect. C 2007, 1, 40–48. [Google Scholar] [CrossRef]
- Jayaram, J.; Xu, K. Determinants of quality and efficiency performance in service operations. Int. J. Oper. Prod. Manag. 2016, 3, 265–285. [Google Scholar] [CrossRef]
- Koh, S.L.; Gunasekaran, A.; Morris, J.; Obayi, R. Conceptualizing a circular framework of supply chain resource sustainability. Int. J. Oper. Prod. Manag. 2017, 10, 1520–1540. [Google Scholar] [CrossRef]
- Bertazzoli, A.; Fiorini, A.; Ghelfi, R. Food chains and value system: The case of potato, fruit, and cheese. J. Food Prod. Mark. 2011, 17, 303–326. [Google Scholar] [CrossRef]
- Cesaretti, G.P.; Green, R. L’organizzazione Della Filiera Ortofrutticola: Esperienze Internazionali a Confronto; FrancoAngeli: Milan, Italy, 2006. [Google Scholar]
- Faber, N.; De Koster, M.B.M.; Smidts, A. Organizing warehouse management. Int. J. Oper. Prod. Manag. 2013, 9, 1230–1256. [Google Scholar] [CrossRef]
- Soysal, M.; Bloemhof-Ruwaard, J.M.; Van der Vor, J.G.A.J. Modelling food logistics networks with emission considerations: The case of an international beef supply chain. Int. J. Prod. Econ. 2014, 152, 57–70. [Google Scholar] [CrossRef]
- Boronico, J.S.; Bland, D.J. Customer service: The distribution of seasonal food products under risk. Int. J. Phys. Distrib. Logist. Manag. 1996, 1, 25–39. [Google Scholar] [CrossRef]
- Fredriksson, A.; Liljestrand, K. Capturing food logistics: A literature review and research agenda. Int. J. Logist. Res. Appl. 2015, 1, 16–34. [Google Scholar] [CrossRef]
- Gue, K.; Meller, R. Aisle confifuration for unit-load warehouses. IIE Trans. 2009, 3, 171–182. [Google Scholar] [CrossRef]
- Accorsi, R.; Cholette, S.; Manzini, R.; Pini, C.; Penazzi, S. The land-network problem: Ecosystem carbon balance in planning sustainable agro-food supply chains. J. Clean. Prod. 2016, 112, 158–171. [Google Scholar] [CrossRef]
- Boenzi, F.; Digiesi, S.; Facchini, F.; Mossa, G.; Mummolo, G. Sustainable Warehouse Logistics: A NIP Model for non-road vehicles and storage configuration selection. In Proceedings of the XX Summer School Operational Excellence Experience Francesco Turco, Naples, Italy, 16–18 September 2015; pp. 263–270. [Google Scholar]
- Pandit, R.; Palekar, U. Response time considerations for optimal warehouse layout design. J. Eng. Ind. 1993, 115, 322–328. [Google Scholar]
Figure 1.
Warehouse Design.

Figure 2.
Flying-V, Fishbone, New Diagonal cross-aisle layouts.

Figure 3.
Nomenclature for longitudinal (a) and transversal (b) layout.

Figure 4.
Tridimensional fishbone layout (a) and geometrical specification (b).
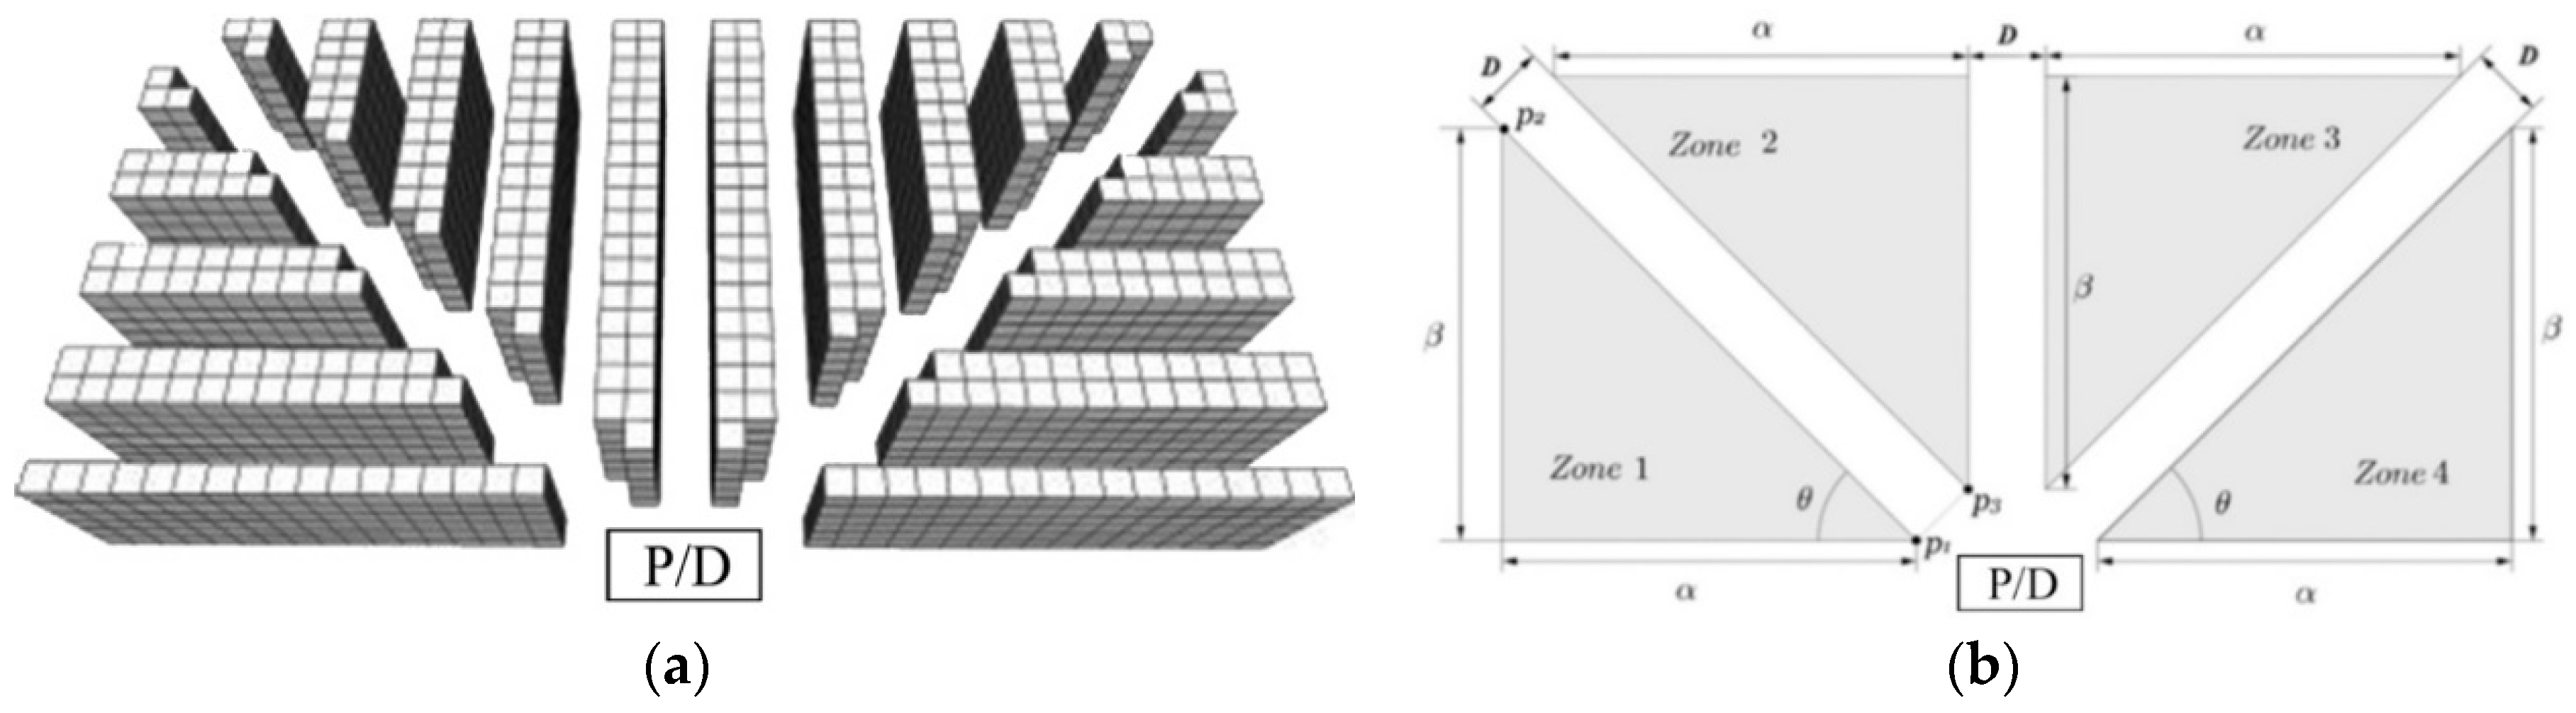
Figure 5.
Nomenclature of the fishbone layout for zones 2 and 3 (a) and zones 1 and 4 (b).

Figure 6.
Log report generate by the model regarding the Carbon Footprint (a) and Management Costs (b) evaluation in all scenarios.
Figure 6.
Log report generate by the model regarding the Carbon Footprint (a) and Management Costs (b) evaluation in all scenarios.


Table 1.
Hypothesis of the stored goods in the warehouse over the time, according four different scenarios corresponding to different mix of ABC classes.
Table 1.
Hypothesis of the stored goods in the warehouse over the time, according four different scenarios corresponding to different mix of ABC classes.
| Percentage of A, B, and C-Items Stocked in Warehouse | |||
|---|---|---|---|
| Scenarios | A (%) | B H (%) | C (%) |
| #1 | 100 | 0 | 0 |
| #2 | 70 | 20 | 10 |
| #3 | 40 | 30 | 30 |
| #4 | 20 | 50 | 30 |
Table 2.
Layout and Material Handling Equipment (MHE) identified in order to minimizing of the Carbon Footprint due to inbound material handling.
Table 2.
Layout and Material Handling Equipment (MHE) identified in order to minimizing of the Carbon Footprint due to inbound material handling.
| Input Parameters | Output (minimal CF) | |||||
|---|---|---|---|---|---|---|
| Scenarios | N (u] | A (%) | B (%) | C (%) | Layout | MHE |
| #1 | 120 | 100 | 0 | 0 | Fishbone | Electric-forklifts |
| #2 | 120 | 70 | 20 | 10 | Fishbone | Electric-forklifts |
| #3 | 120 | 40 | 30 | 30 | Longitudinal/Transversal | Electric-forklifts |
| #4 | 120 | 20 | 50 | 30 | Longitudinal/Transversal | Electric-forklifts |
Table 3.
Layout and MHE identified in order to minimizing of the Management Costs due to facilities costs (FCs) and Operative Costs (OCs).
Table 3.
Layout and MHE identified in order to minimizing of the Management Costs due to facilities costs (FCs) and Operative Costs (OCs).
| Input Parameters | Output (minimal MCs) | |||||
|---|---|---|---|---|---|---|
| Scenarios | N (u) | A (%) | B (%) | C (%) | Layout | MHE |
| #1 | 120 | 100 | 0 | 0 | Longitudinal/Transversal | Electric-forklifts |
| #2 | 120 | 70 | 20 | 10 | Longitudinal/Transversal | Electric-forklifts |
| #3 | 120 | 40 | 30 | 30 | Longitudinal/Transversal | Electric-forklifts |
| #4 | 120 | 20 | 50 | 30 | Longitudinal/Transversal | Electric-forklifts |
© 2018 by the authors. Licensee MDPI, Basel, Switzerland. This article is an open access article distributed under the terms and conditions of the Creative Commons Attribution (CC BY) license (http://creativecommons.org/licenses/by/4.0/).
Share and Cite
MDPI and ACS Style
Facchini, F.; De Pascale, G.; Faccilongo, N. Pallet Picking Strategy in Food Collecting Center. Appl. Sci. 2018, 8, 1503. https://doi.org/10.3390/app8091503
AMA Style
Facchini F, De Pascale G, Faccilongo N. Pallet Picking Strategy in Food Collecting Center. Applied Sciences. 2018; 8(9):1503. https://doi.org/10.3390/app8091503
Chicago/Turabian StyleFacchini, Francesco, Gianluigi De Pascale, and Nicola Faccilongo. 2018. "Pallet Picking Strategy in Food Collecting Center" Applied Sciences 8, no. 9: 1503. https://doi.org/10.3390/app8091503
Note that from the first issue of 2016, this journal uses article numbers instead of page numbers. See further details here.