Article

Leaf Development Monitoring and Early Detection of Water Deficiency by Low Field Nuclear Magnetic Resonance Relaxation in Nicotiana tabacum Plants

1
Irstea, UR OPAALE, 17 Avenue de Cucillé-CS 64427, F-35044 Rennes, France
2
University Bretagne Loire, F-35044 Rennes, France
3
University Rennes 1, UMR INRA Agrocampus Ouest, IGEPP, INRA, UMR 1349, F-35653 Le Rheu, France
4
Agro Innovation International, Centre Mondial de l’Innovation, Groupe Roullier, F-35401 St Malo, France
*
Author to whom correspondence should be addressed.
Appl. Sci. 2018, 8(6), 943; https://doi.org/10.3390/app8060943
Submission received: 17 May 2018 / Revised: 1 June 2018 / Accepted: 4 June 2018 / Published: 7 June 2018
(This article belongs to the Special Issue Applications of Low Field Magnetic Resonance)

Abstract

:
Drought is the main abiotic stress worldwide affecting harvest quality and quantity of numerous crops. To enable better water management, low field NMR (nuclear magnetic resonance) relaxometry was assessed as a developmental marker and a new method for early detection of water deficiency. The effect of a foliar biostimulant against water stress was also investigated. Two leaves of different ranks (four and eight) were studied. The leaves of different ranks were characterized by different NMR T2 spectra which validated the ability of NMR to describe the developmental stage of tobacco. Results also showed that T2 NMR relaxation spectra allow the detection of mild water stress (80% of the field capacity) through the precise characterization of the leaf water status while other water stress markers (relative water content, photosynthetic related parameters…) were not yet impacted. The agricultural impact of the mild water stress was determined through the nitrogen rate in shoots and amino acids assay six weeks after the beginning of the stress and results shows that foliar application of biostimulant limits the negative consequences of drought. Our results demonstrate the sensitivity of NMR to detect slight changes triggered in the leaf by water stress at the tissue level.

1. Introduction

Drought is the main abiotic stress that limits the quantity and quality of the harvest of numerous crops worldwide. Climate models indicate that, because of global warming, drought episodes will become more frequent in the coming decades and maintaining stable crop yields under both normal and drought stress conditions will be indispensable for the food security of the growing world population.
Water stress has adverse impacts on many aspects of plant physiology, one of the first being photosynthesis [1]. Drought stress can also have a negative impact on plants at other levels, including limiting growth [2], and creating oxidative stress [3]. Water stress thus negatively affects the quantity and quality of the yield of most crops. Plant responses to water deficiency depend on the species [4], the age of the plant [5], the genotype [6], and the intensity of the stress [7]. Severe drought has been extensively studied [8,9,10], whereas mild drought stress has not, even though mild stress occurs more frequently in cultivated areas [6].
Due to climate change and policies aimed at reducing the quantities of fertilizer used, new methods for the protection of plants from drought have been investigated. Improved control of plant water status and irrigation is one option, and non-destructive ways to detect and prevent water stress are thus receiving considerable attention [11,12]. Another option is the use of biostimulants. Plant biostimulants contain substance(s) and/or micro-organisms whose function when applied to plants or the rhizosphere is to stimulate natural processes to enhance/benefit nutrient uptake, nutrient efficiency, tolerance to abiotic stress, and crop quality [13]. The use of foliar biostimulants in agriculture is relatively recent but few studies published to date have shown biostimulants to have a positive effect on yield in several crops, oilseed rape [14], cotton [15], bean [16], and carrot [17]. Using biostimulants makes it possible to reduce the amount of fertilizer thereby reducing the negative impact of the crop on the environment. The use of biostimulants to prevent abiotic stress is less documented, but several studies have highlighted changes in the expression of genes involved in the abiotic stress resistance [18,19,20].
The severity of the effect of drought on plants is often assessed through relative water content, leaf hydric potential or photosynthetic capacity [21]. However, these parameters do not account for differences in tissue inside the lamina. Using the insects’ feeding particularity, Nardini et al. [22] demonstrated that the two main parenchyma of the leaf (palisade and spongy) played different roles in leaf hydraulic resistance. Changes in cell size in response to drought have already been reported in various species [23,24,25]. These effects of drought stress can be effectively monitored using NMR (nuclear magnetic resonance) relaxometry. NMR relaxation is a powerful technique to study changes in the status and distribution of water in plant tissues and has also been used to investigate water status in seeds [26], fruit [27], stem [28] leaves [29,30,31] or to monitor water relations in trees [32]. In plant tissues, the NMR transverse relaxation (T2 relaxation) is always described by multi-exponential decay. Each NMR relaxation peak describes a specific water pool in the tissue. In apple fruit, Snaar and Van As [33] suggested that each peak of the multi-exponential NMR relaxation signal describes the water in the specific cell compartment (vacuole, cytosol and apoplast). Indeed, transverse relaxation time T2 is sensitive to the chemical composition of water solution in each compartment, to the size of the water compartment, and to the diffusional process between different water pools. Water proton relaxation times are related to the rotational and translational mobility of water molecules [34]. They are also modified by the mobility and structure of the surrounding macromolecules (i.e., starch, proteins, and polysaccharides) through proton exchange. Moreover, relaxation times are affected by the exchange of molecules between different compartments that is determined by water diffusion and, therefore, by the compartment size and membrane permeability. The transverse relaxation of each water pool can be distinguished thanks to the slow diffusion process between cell compartments compared to the NMR relaxation process. In oilseed rape leaves, a new attribution was recently demonstrated [30]. The palisade and spongy cells of young oilseed rape leaves are similar in size but develop differently, resulting in cells of very different size between the tissues in old leaves. NMR relaxation was shown to be able to finely describe the changes in cell size that occur during leaf development and can be used to monitor the water in vacuoles of palisade or spongy cells in old leaves separately [30]. Applied on a wide leaf panel collected from plant grown in both controlled and field conditions, the low field NMR relaxometry was shown to provide precise and robust markers of development of oilseed rape leaves [30]. NMR relaxation is thus a powerful tool to monitor changes in water relations inside the leaf caused by development or different stress as Nitrogen deficiency [35] or thermal stress [36]. Only a few studies have focused on the impact of water stress on the NMR relaxation signal of the leaf [37,38]. Nagarajan et al. demonstrated that the mean NMR relaxation time of the leaf was longer in drought tolerant wheat varieties [31]. Furthermore, a unilateral instrument operating at a low magnetic field enables non-destructive NMR measurements. Using that tool, Capitani et al. measured a decrease in the mean T2 of the leaf with the decrease in leaf relative water content of different species directly in the field [37].
The aim of this study was to answer to three questions: first, is it possible to monitor leaf development in tobacco leaves through low field NMR? Secondly, is NMR sensitive enough to detect the impact of mild drought stress on tobacco leaves? Finally, can foliar biostimulants correct the effects of mild drought stress? We investigated the impact of water stress on two different ranks of leaves in order to check if the sensitivity of NMR is affected by the stage of development of the leaf. Two early stages of plant development were studied, very young plants 42 days after sowing (DAS) and 15-day old plants in order to evaluate if NMR relaxation can be used for the early detection of water stress. The stress used in the study was very mild, i.e., 80% of field capacity but was maintained over a period of several weeks Physiological measurements (water content, photosynthetic related parameters, leaf area, etc.) were used to assess the impact of water stress. Finally, the plants were harvested and the impact of water stress was measured through nitrogen concentration and amino acid composition.

2. Materials and Methods

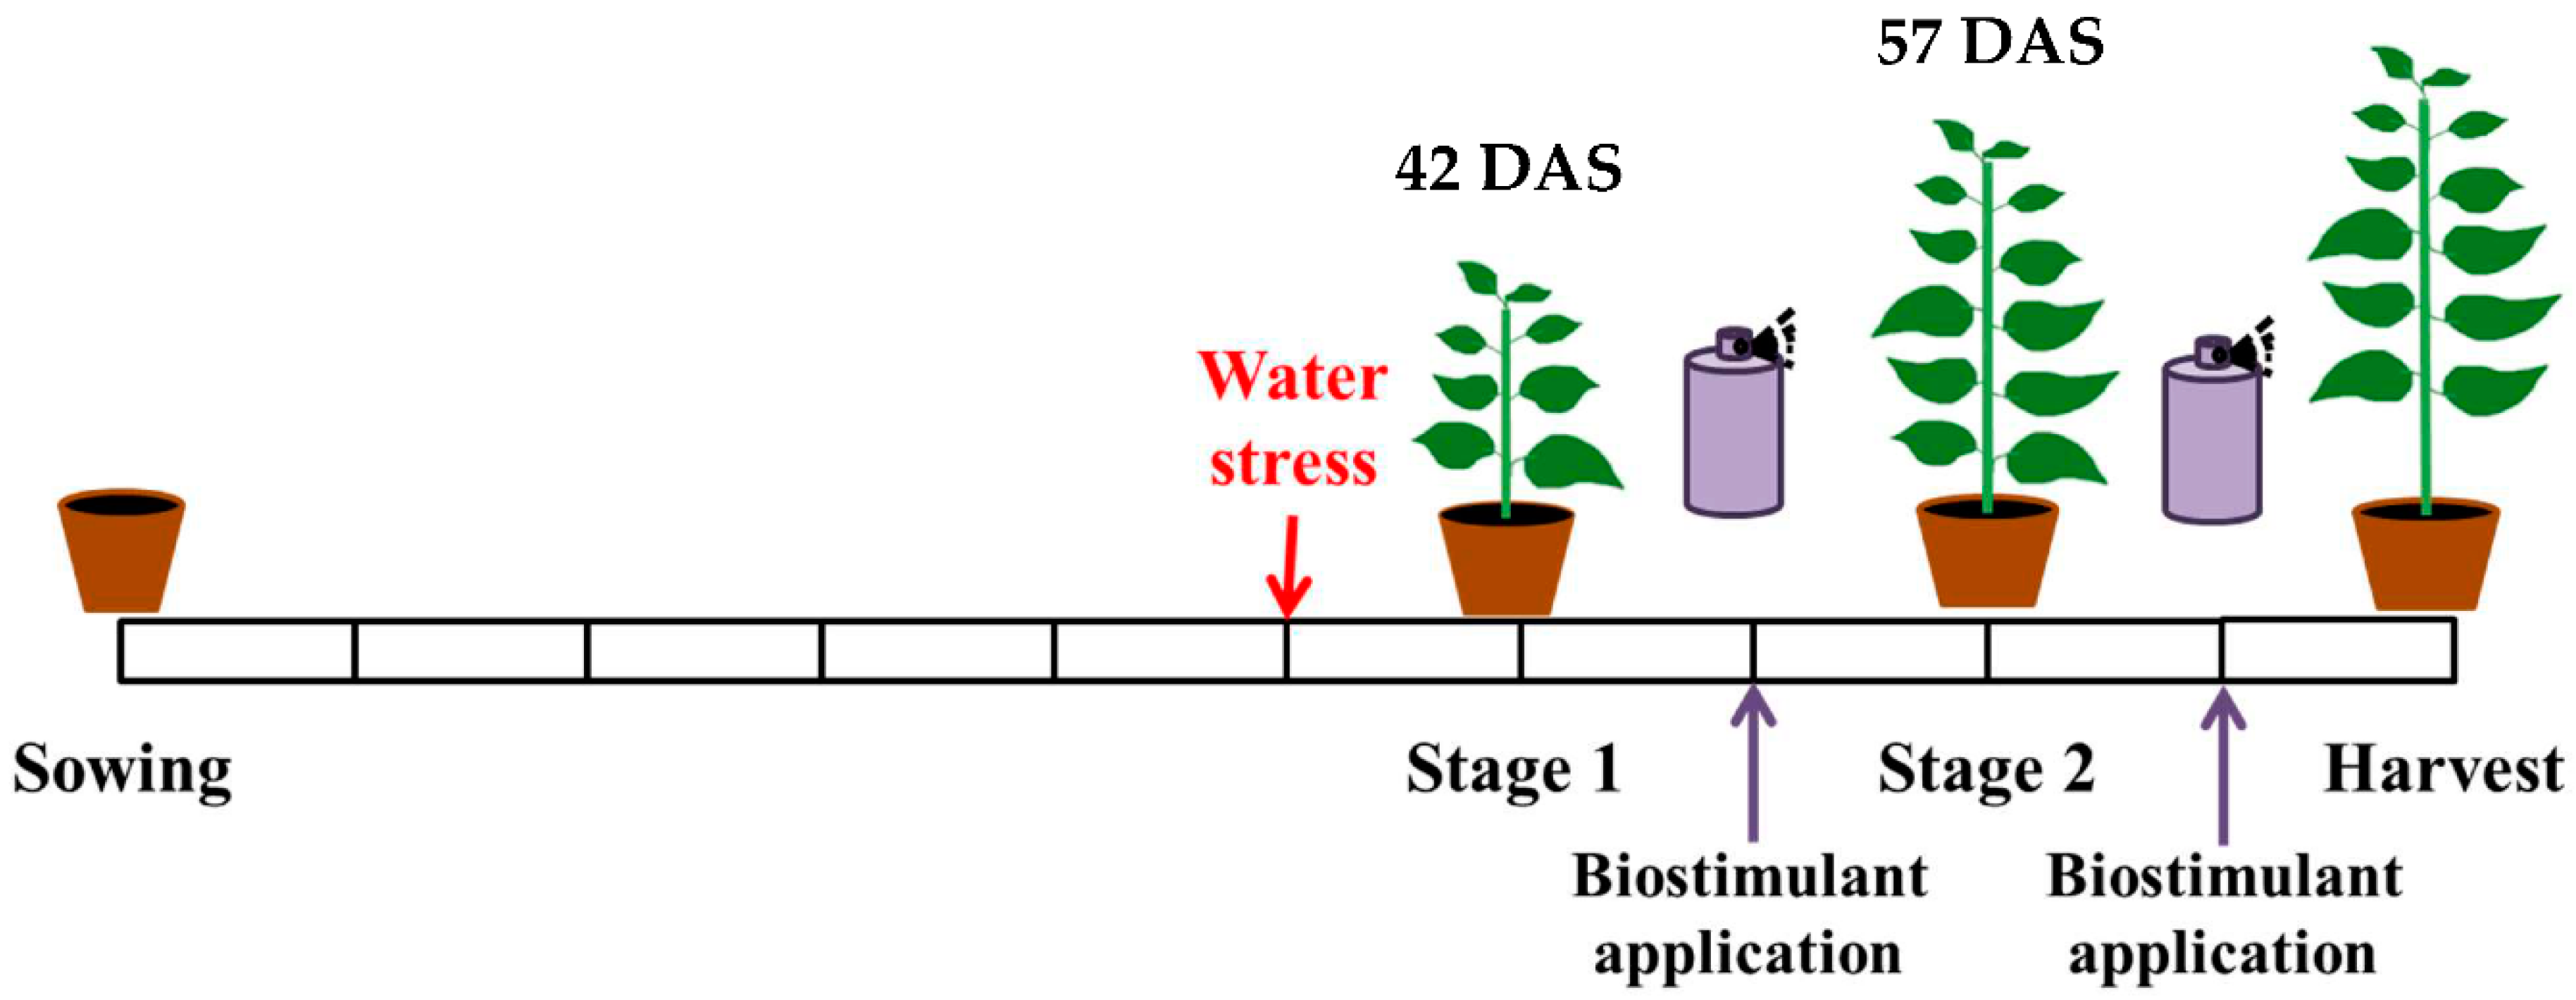
2.1. Experimental Design

The experimental design is depicted in Figure 1. Water stress corresponding to humidity in the pot of 80% of the field water capacity was applied 27 DAS and maintained for a period of 42 days. TIMAC SL28 is a foliar biostimulant produced by TIMAC AGRO (Saint-Malo, France). It is manufactured from a by-product of soy milk production sold by TRIBALLAT NOYAL (Noyal-sur-Vilaine, France). It is obtained through the aqueous extraction of organic soybean seeds (Glycine max.). TIMAC SL28, a soluble plant extract (2% dry matter), contains natural chemical compounds including soluble sugars; oligogalactosides, soluble proteins and phytohormones. TIMAC SL28 was first applied at 34 DAS, and the second time at 49 DAS. The application was realized by spraying the leaves with a 3% solution of TIMAC SL28 until it flowed. Two stages of development were defined for the measurements, 42 DAS (two weeks after the beginning of the stress) and 57 DAS (Figure 1).

2.2. Plant Material

Twelve genotype Xanthi tobacco plants were sown in TS3 recipe 607 (Klasmann) for each treatment and grown in a growth chamber for eight weeks in the following conditions: 14 h daylight (200 µmol photons m−2·s−1) and 10 h dark (relative humidity 80%; temperature 21 ± 1 °C).

2.3. Treatment

Hereafter, the plants are referred to as C for control plants, S for stressed plants, S-Ti for stressed plants treated with TIMAC SL28. Control and stressed plants were sprayed with water when the third group of plants was treated with TIMAC SL28.

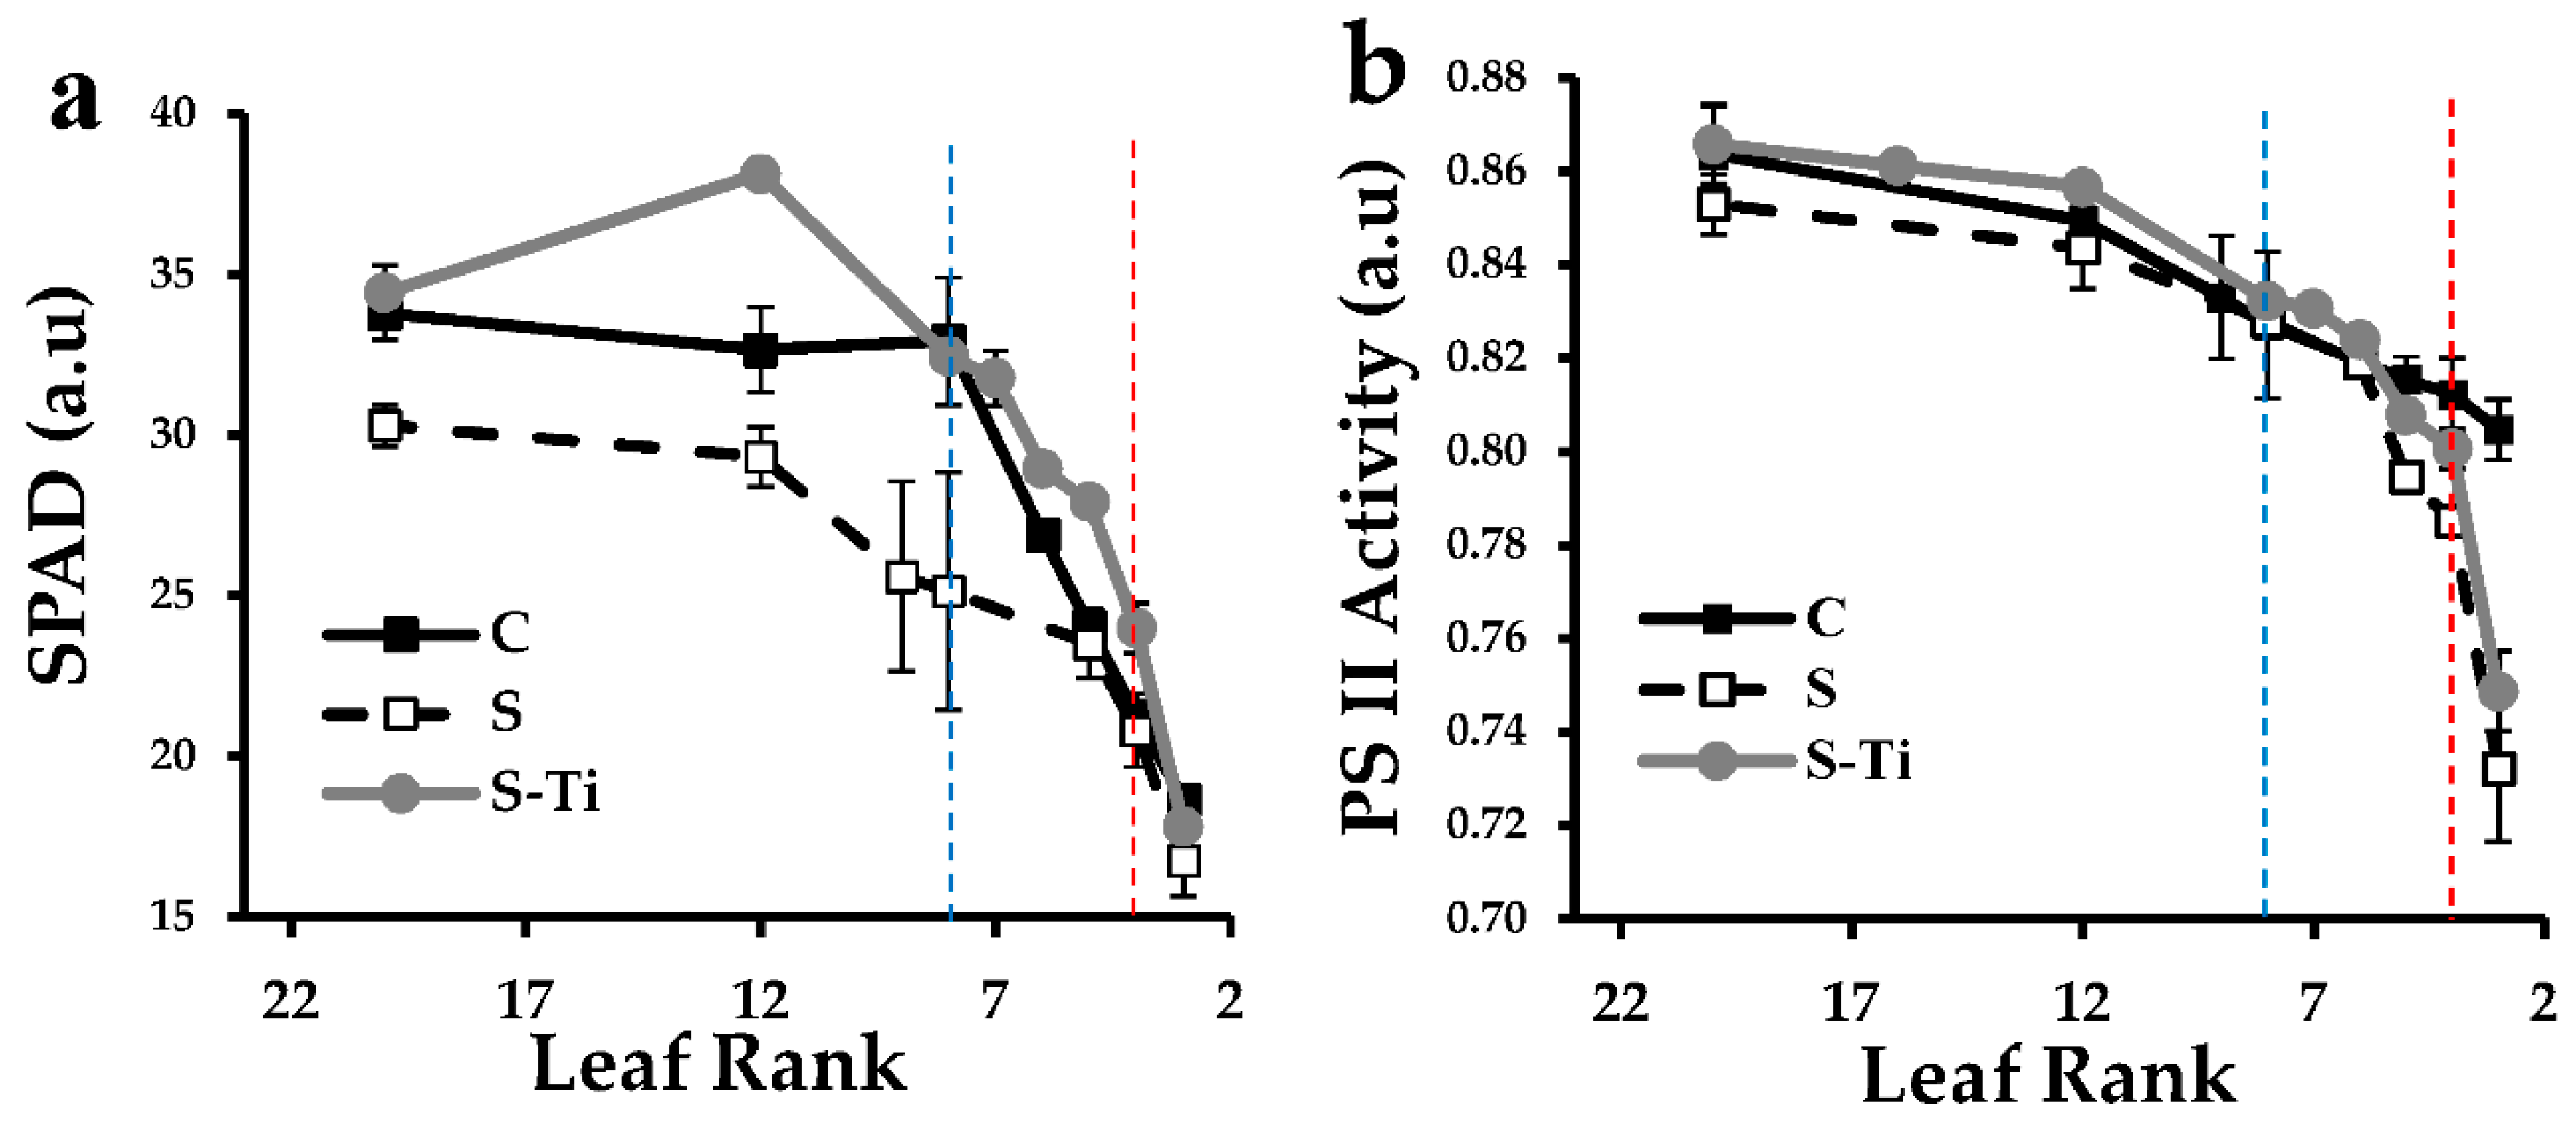
2.4. SPAD and PSII Activity

Photosystem II (PSII) activity (Fv/Fm) was measured (the morning before sunrise) on all plants using a portable chlorophyll fluorometer (Hansatech Handy PEA, Hansatech Instruments Ltd., Norfolk, UK). The measurements were made near the central vein, after 10 min adaption to the dark. SPAD (Soil Plant Analysis Development) values were determined using a non-destructive Minolta SPAD-502 chlorophyll meter (Tokyo, Japan). SPAD of each leaf is the average value of 6 to 8 independent measurements.

2.5. Sampling

The first leaf to appear after cotyledons was named Leaf rank 1, the second leaf was named Leaf rank 2 and so on. For NMR and physiological measurements, two leaf ranks were sampled from four plants in each treatment at two stages (42 and 57 days after sowing): leaf rank 4 (LR 4) and leaf rank 8 (LR 8). In order to prevent any modification in the plan development induced by the sampling and manipulation, new plants were sampled at each stage. Eight to 10 leaf discs (8 mm in diameter) were cut from the lamina tissue of the leaves selected for the NMR measurements to ensure similar weights of tissue were sampled. To obtain homogeneous tissues, discs were taken from each side of the central vein as close as possible to the rib, avoiding lateral veins. The discs were then placed in NMR tubes that were closed with a 2-cm long Teflon cap to avoid water loss during measurement. Leaf samples were weighed in the NMR tubes before and after each NMR experiment and no significant variations were observed, thereby confirming the absence of water loss during NMR measurements.

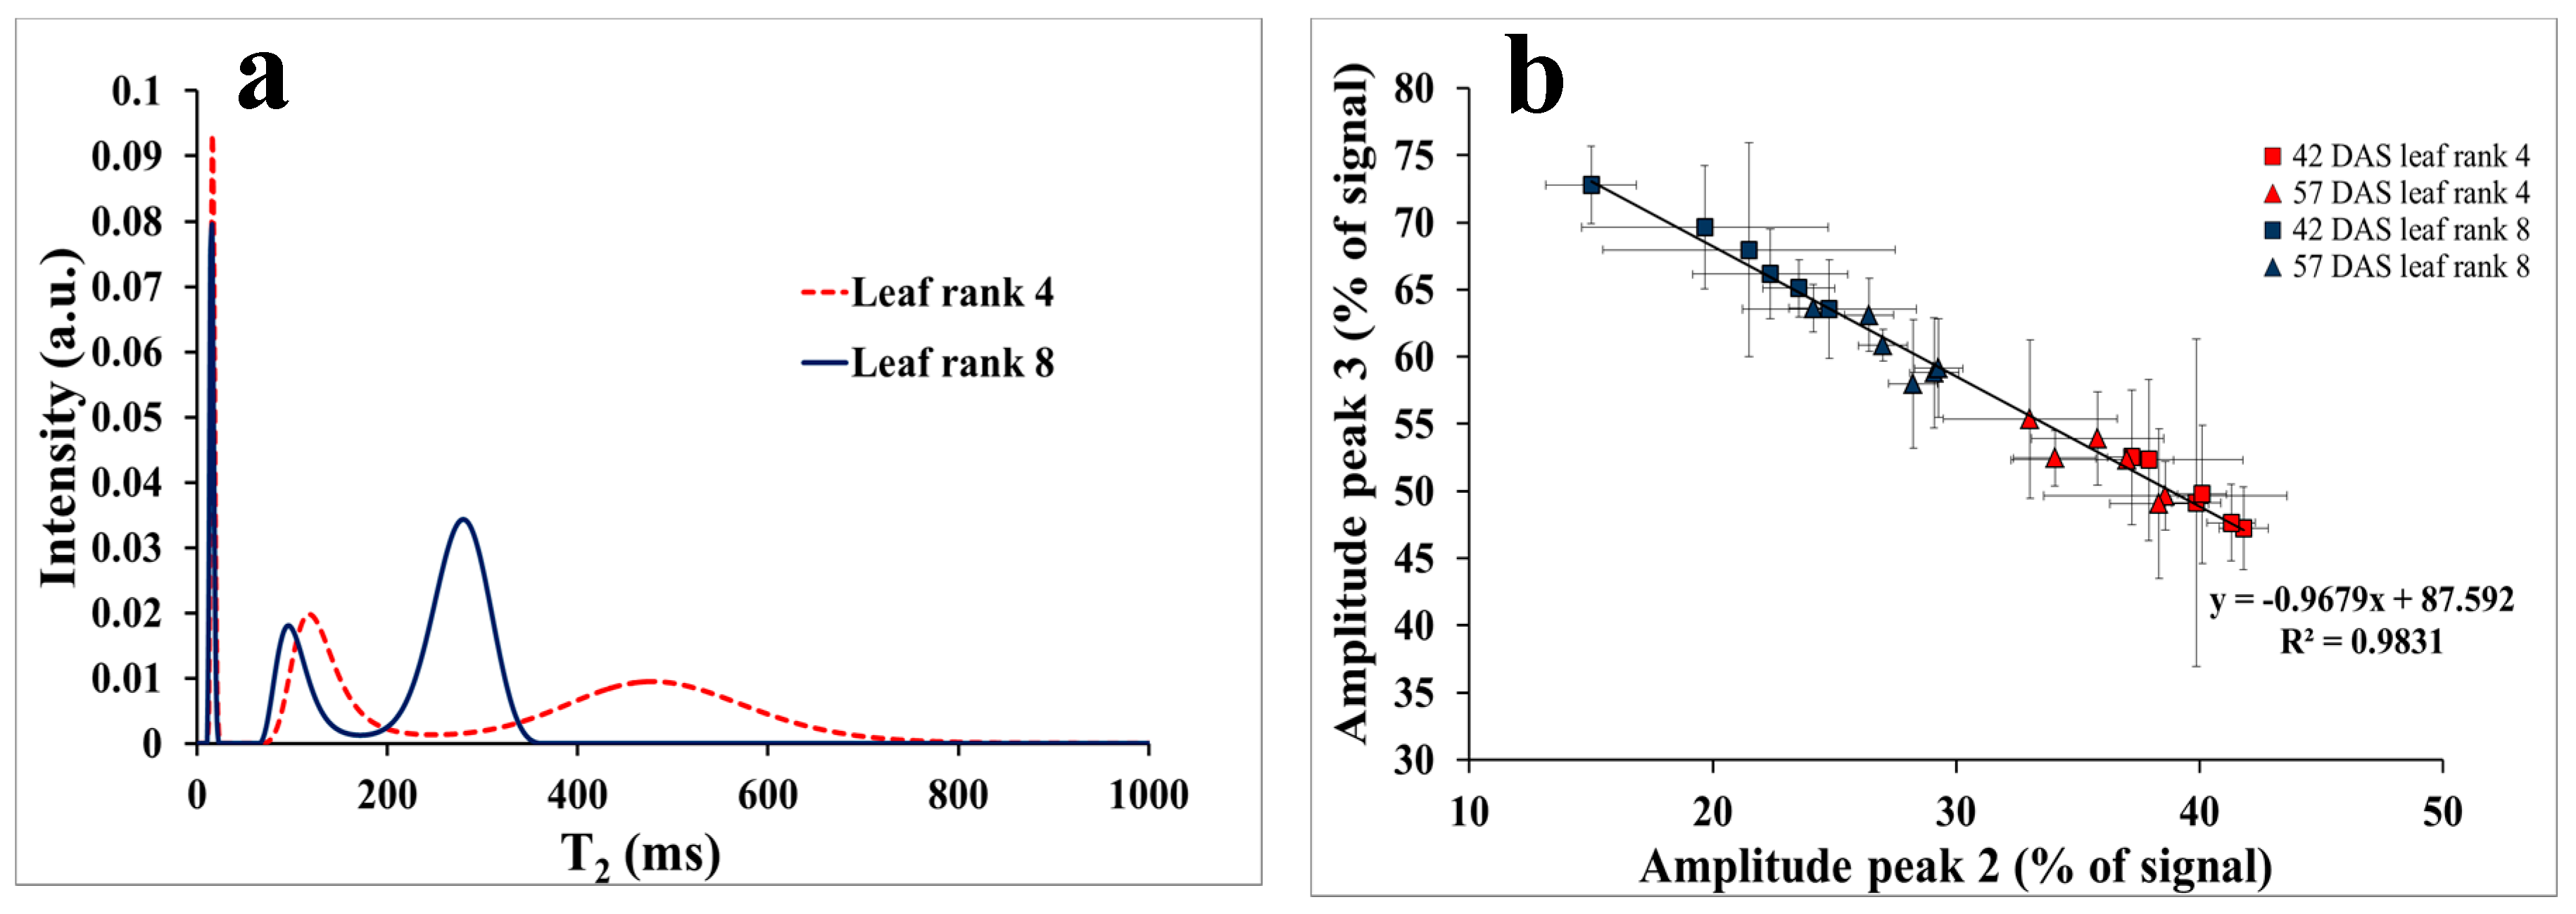
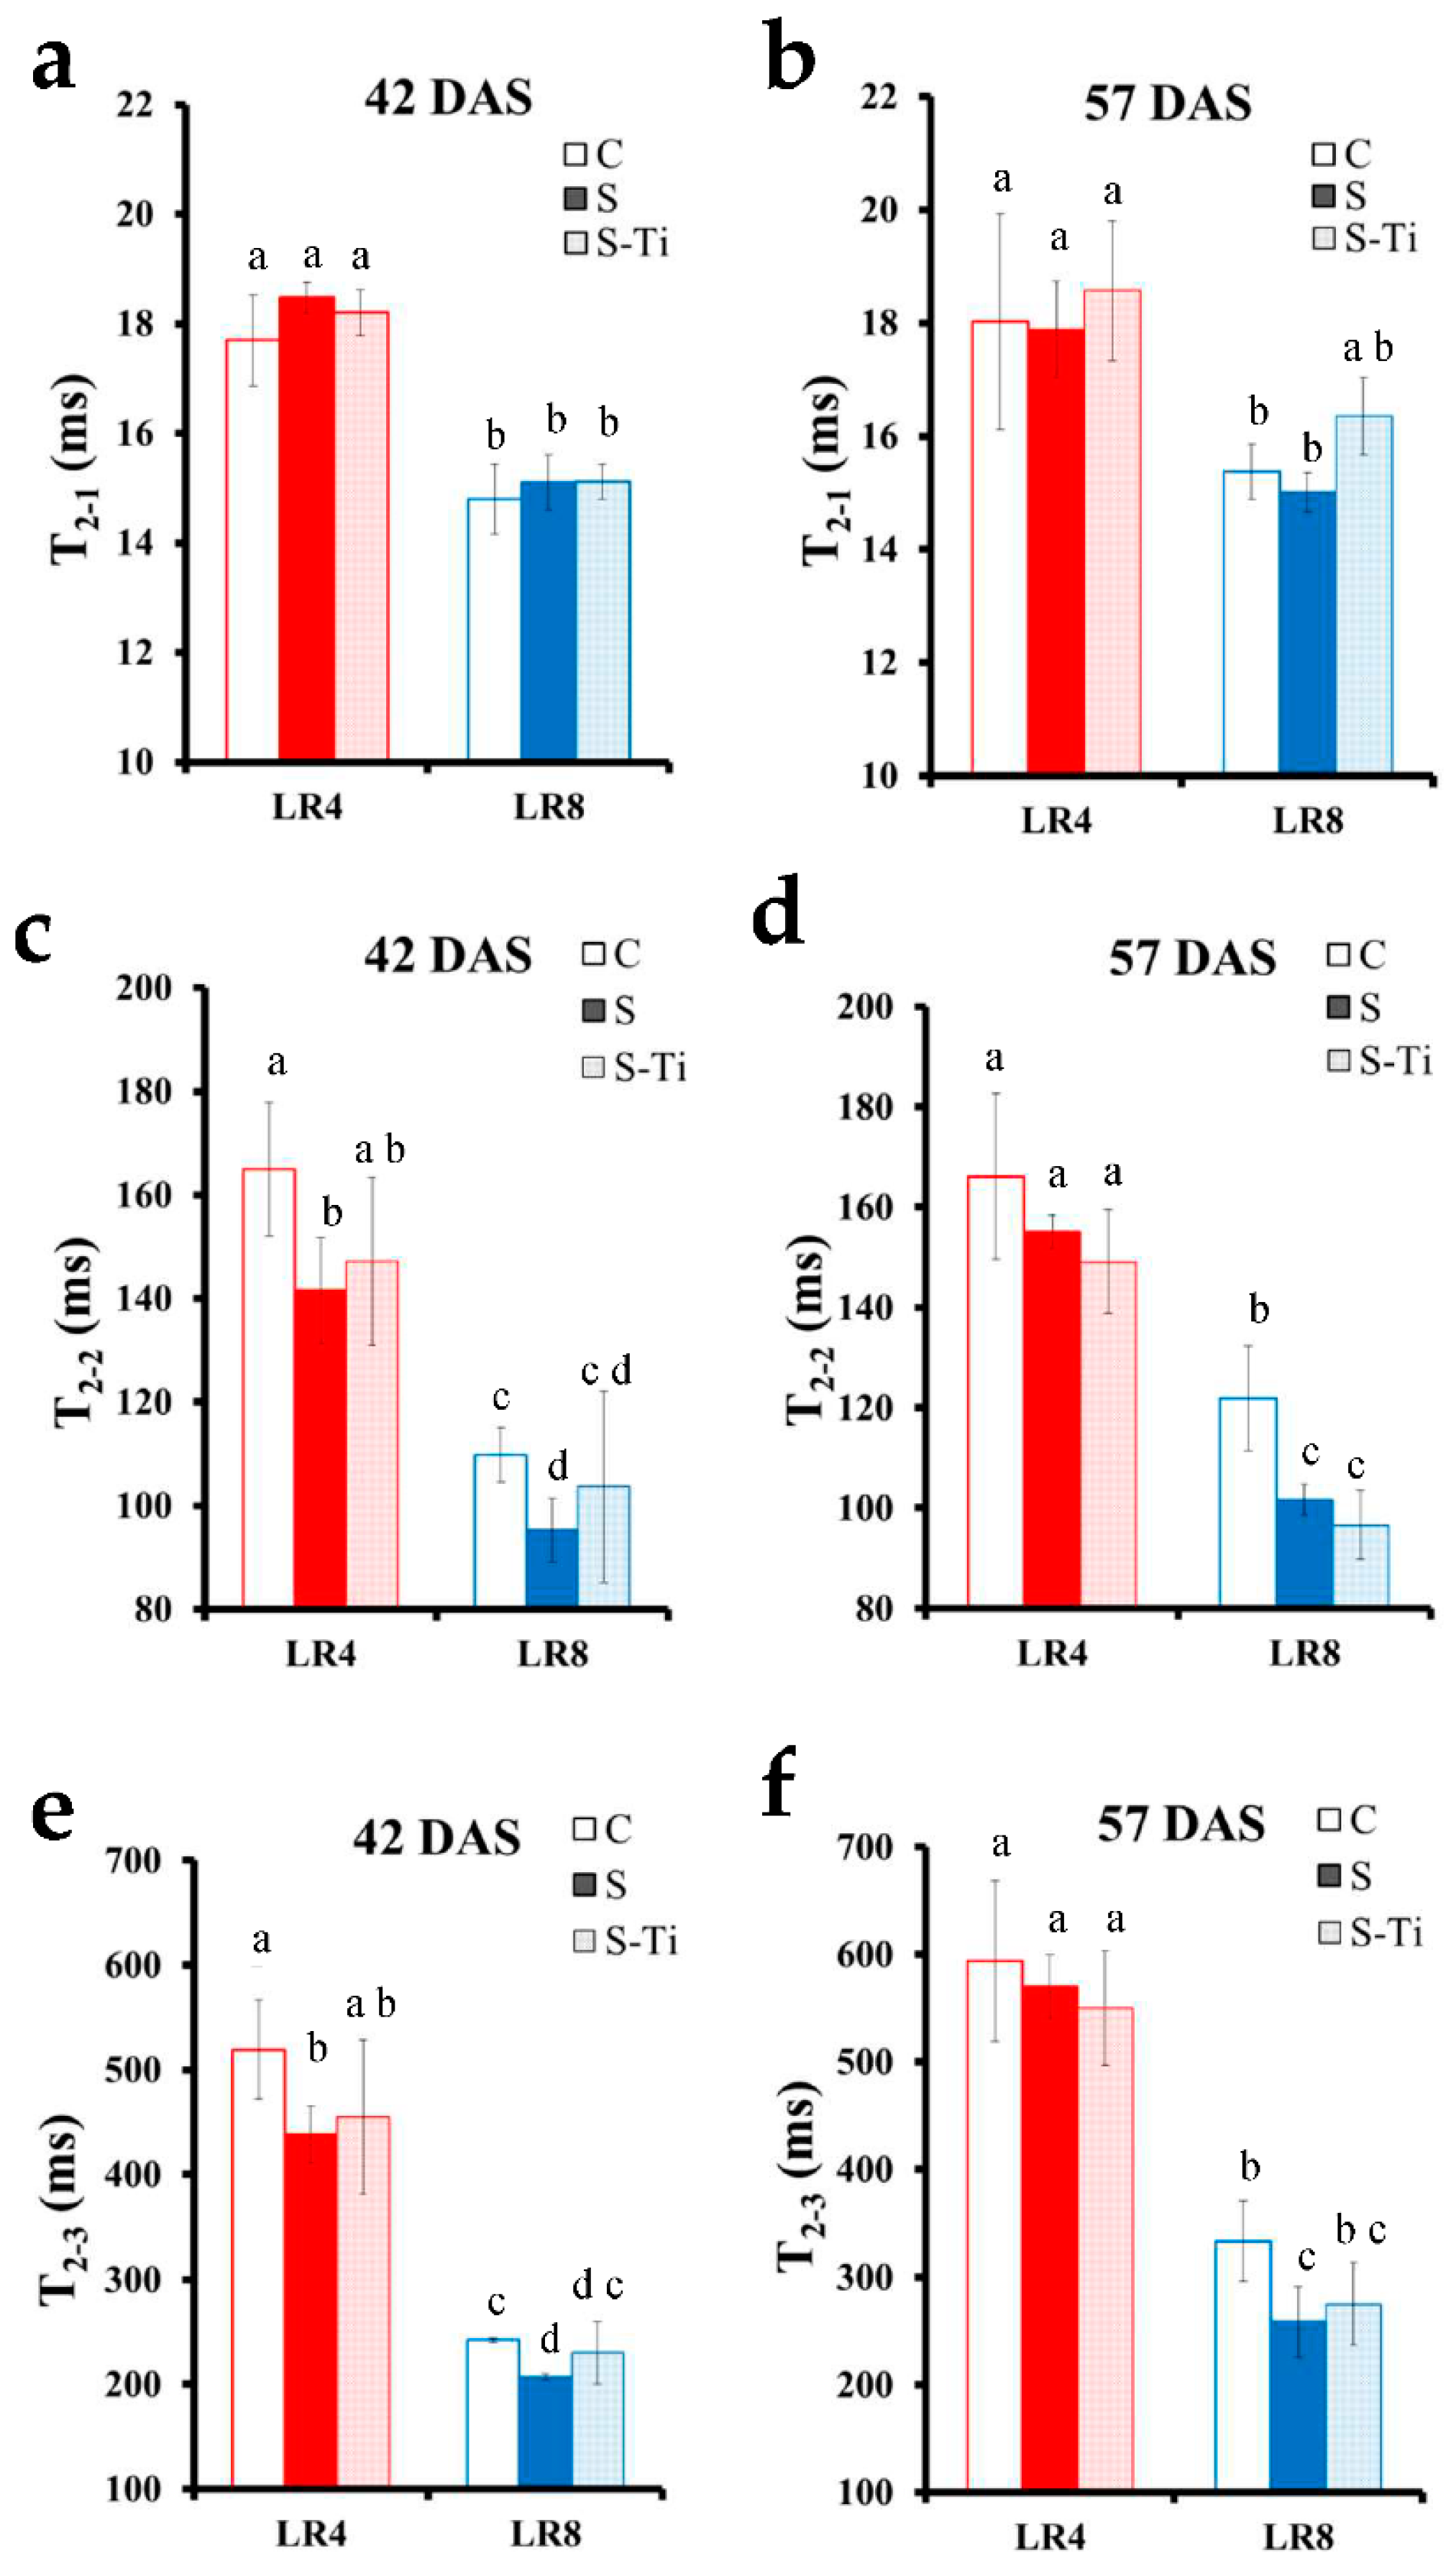
2.6. NMR Relaxometry

NMR Relaxometry measurements were performed on a 20 MHz spectrometer (Minispec PC 120, Bruker, Karlsruhe, Germany) equipped with a thermostated probe. The temperature was set at 20 °C. T2 was measured using a Car–Purcell–Meiboom–Gill (CPMG) sequence with the 90°–180° pulse spacing τ 0.1 ms. The signal of a single point at the echo maximum was acquired and data were averaged over 32 acquisitions. The number of successive echoes recorded was adjusted for each sample in order to reach the baseline of the relaxation curve. The recycle delay for each sample was adjusted to 5 X T1 after measurement of the T1 with a fast saturation recovery sequence. The total data acquisition time for T2 (including spectrometer adjustments and T1 measurement) was about 10 min per sample.
Fitting was performed according to two methods using Scilab software (version 5.5.1, Scilab Entreprises SAS, Orsay, France): first T2 relaxation curves were fitted using the maximum entropy method (MEM) [39], which provides the continuous distribution of relaxation components without any assumption concerning their number. In this representation, the peaks of the distribution are centered at the corresponding most probable T2 values, while peak areas correspond to the intensity of the T2 components. T2 relaxation curves were also analyzed using the Levenberg–Marquardt algorithm, which allows a discrete solution for the fitting curve according to the equation: I ( t ) = I 1
I ( t ) = I 1 exp ( t / T 2 1 ) + I 2 exp ( t / I 2 2 ) + I 3 exp ( t / I 2 3 ) + cte
where Ii is the intensity of the ith exponential at the equilibrium state and T2−i the characteristic transverse relaxation time for the ith exponential. The initial fitting parameters used for the Levenberg–Marquardt method were chosen according to the results of the MEM. The NMR results of all the leaf samples agreed regardless of the fitting algorithm used.
Specific leaf water weight per component (LWWi) was computed according to the equation:
LWWi = I r i × m w A
where mw corresponds to the water mass (in g) of the NMR sample comprising six leaf discs, A to the area of the discs (in m2) and IR-i to the relative intensity of the ith NMR signal component (in %).

2.7. Water Relations

Leaf samples were weighed in the NMR tubes (fresh weight in g·m−2 (FW)). At the end of the NMR experiments, the discs were rehydrated for 2 h in the dark. Excess water on the surface of the leaf was carefully removed with absorbent paper. The leaf discs were weighed again (turgid weight in g·m−2 (TW)). Next, all the leaf discs were oven dried at 70 °C for 36 h to determine dry weight (DW) in g·m−2.
Relative water content was calculated as: RWC = (FW − DW)/(TW − DW).

2.8. Nitrogen and Free Amino Acids Assay

At harvest, one leaf per plant was frozen at −80 °C, ground and lyophilized. Nitrogen assays were then conducted with a Flash 2000 Organic Elemental Analyzer (Thermo Scientific, Waltham, MA, USA). Amino acids were extracted in a Methanol/Chloroform solution from lyophilized dry matter of three individual repeats. Samples were derivatized using Waters AccQ-Tag Ultra Derivatization Kit (Waters, Elstree, UK). Individual amino acid content was determined by Ultra Performance Liquid Chromatography H-Class/Photodiode Array analyzer according to the instructions of the manufacturer (Waters, Elstree, UK).

2.9. Data Analysis

Statistical analyses were performed using the R software (R version 3.3.2). For each combination of stage and leaf rank, the effect of the treatment on each studied trait was assessed using a Mann–Whitney Wilcoxon test (p-value < 0.05). In the same way, Mann–Whitney Wilcoxon tests were performed for each stage x treatment and leaf rank x treatment combination to assess the effect of leaf rank and stage, respectively.

3. Results

3.1. Leaf Development and Impact of Mild Drought Stress

At the first stage studied, 42 days after sowing (DAS), the plants were very young (10 leaves) and no differences in photosynthetic parameters were observed between the leaves of the same plant or among control (C), water stressed (S) and plants sprayed with biostimulant (S-Ti) (SPAD values: 36 ± 1 A.U.; Fv/Fm: 0.86 ± 0.01 A.U.). At the second stage studied (57 DAS), the number of leaves had increased (20 leaves on average) on all plants, and significant variations in photosynthetic parameters (SPAD measurement and PSII activity) were observed among the leaves (Figure 2).
In control plants, the chlorophyll content estimation (SPAD) started to decrease in leaves below rank 8 and a continuous decrease was observed in older leaves. In control plants, a slight decrease in PSII activity was detected in leaves above rank 10. In water stressed plants, the chlorophyll content estimation of all leaves was significantly lower than that of leaves of control plants from leaf rank 20 up to leaf rank 8. Moreover, the rank at which SPAD values started to decrease was lower in water stressed plants (around leaf rank 10). In the older leaves (leaf ranks below 5) no significant differences were observed in SPAD values between control and water stressed plants. In water stressed plants, the pattern of decrease in PS II activity was the same as in young leaves of control plants (leaf rank above 6) but decreased in older leaves. The SPAD values of leaves treated with TIMAC SL28 was equivalent to that measured in leaves of the control plants, indicating that TIMAC SL28 significantly reduced the effect of water stress. Nevertheless, no significant effects of TIMAC SL28 treatment on PSII activity were observed.
Water content (WC) and relative water content (RWC) measured in the leaves are listed in Table 1. In LR 4 of control plants, WC and RWC was 96.5 ± 0.4% and 96.6 ± 1.8% at 42 DAS, respectively, and did not change between stages. The mild water stress applied to plants had no significant impact on these parameters in leaf rank 4 and TIMAC SL28 had no significant effect. The WC of leaf rank 8 in the control plants did not change between the stages, whereas the RWC of these leaves increased from 84.4 ± 5.1% to 93.2 ± 1.2%. Water stress did not affect the WC of leaf rank 8. Nevertheless, the RWC of water stressed plant leaves did not increase between stages as observed in the leaves of control plants. Treatment with TIMAC SL28 had no impact on the WC values of leaf rank 8 or on their development pattern between stages. However, compared to water stressed plants, the addition of TIMAC SL28 increased their RWC at both stages.
The WC and RWC presented different patterns between leaf ranks. Both the WC and RWC were higher in leaves of leaf rank 4 compared to leaf rank 8 and remained constant over the two weeks in control plants. Moreover, the RWC in leaf rank 8 increased between the two stages, as the leaf gained water during growth. Adding biostimulant allowed the plant to maintain its capacity to increase the RWC of the leaf during expansion.
The fresh weight (FW) and dry matter weight (DW) of leaf rank 4 in the control plants did not change between stages; FW was 72.8 ± 5.6 g·m−2 and DW 2.55 ± 0.15 g·m2. Water stress did not alter these parameters (Table 2). The addition of TIMAC SL28 had an effect on DW: at the second stage (57 DAS), DW was higher (3.12 g·m−2) than in the leaves of control plants. The FW of LR 8 from control plants increased from 36.6 ± 0.6 to 49.6 ± 6.4 g·m−2 between the two stages (Table 2). But the DW remained constant at around 2.5 g·m−2. The increase in the FW of LR 8 between stages was limited by the water stress (from 40.4 ± 3.6 to 45.7 ± 4.3 g·m−2) whereas DW was not modified by water stress. TIMAC SL28 showed a similar pattern of change to that observed in control plants with an increase in FW. The DW of mature leaves of TIMAC SL28 treated plants increased between stages.
The FW of leaf rank 4 was higher than that of leaf rank 8 at the two stages studied. Like RWC, the FW of leaf rank 4 remained constant over time but increased in younger leaves (LR 8).

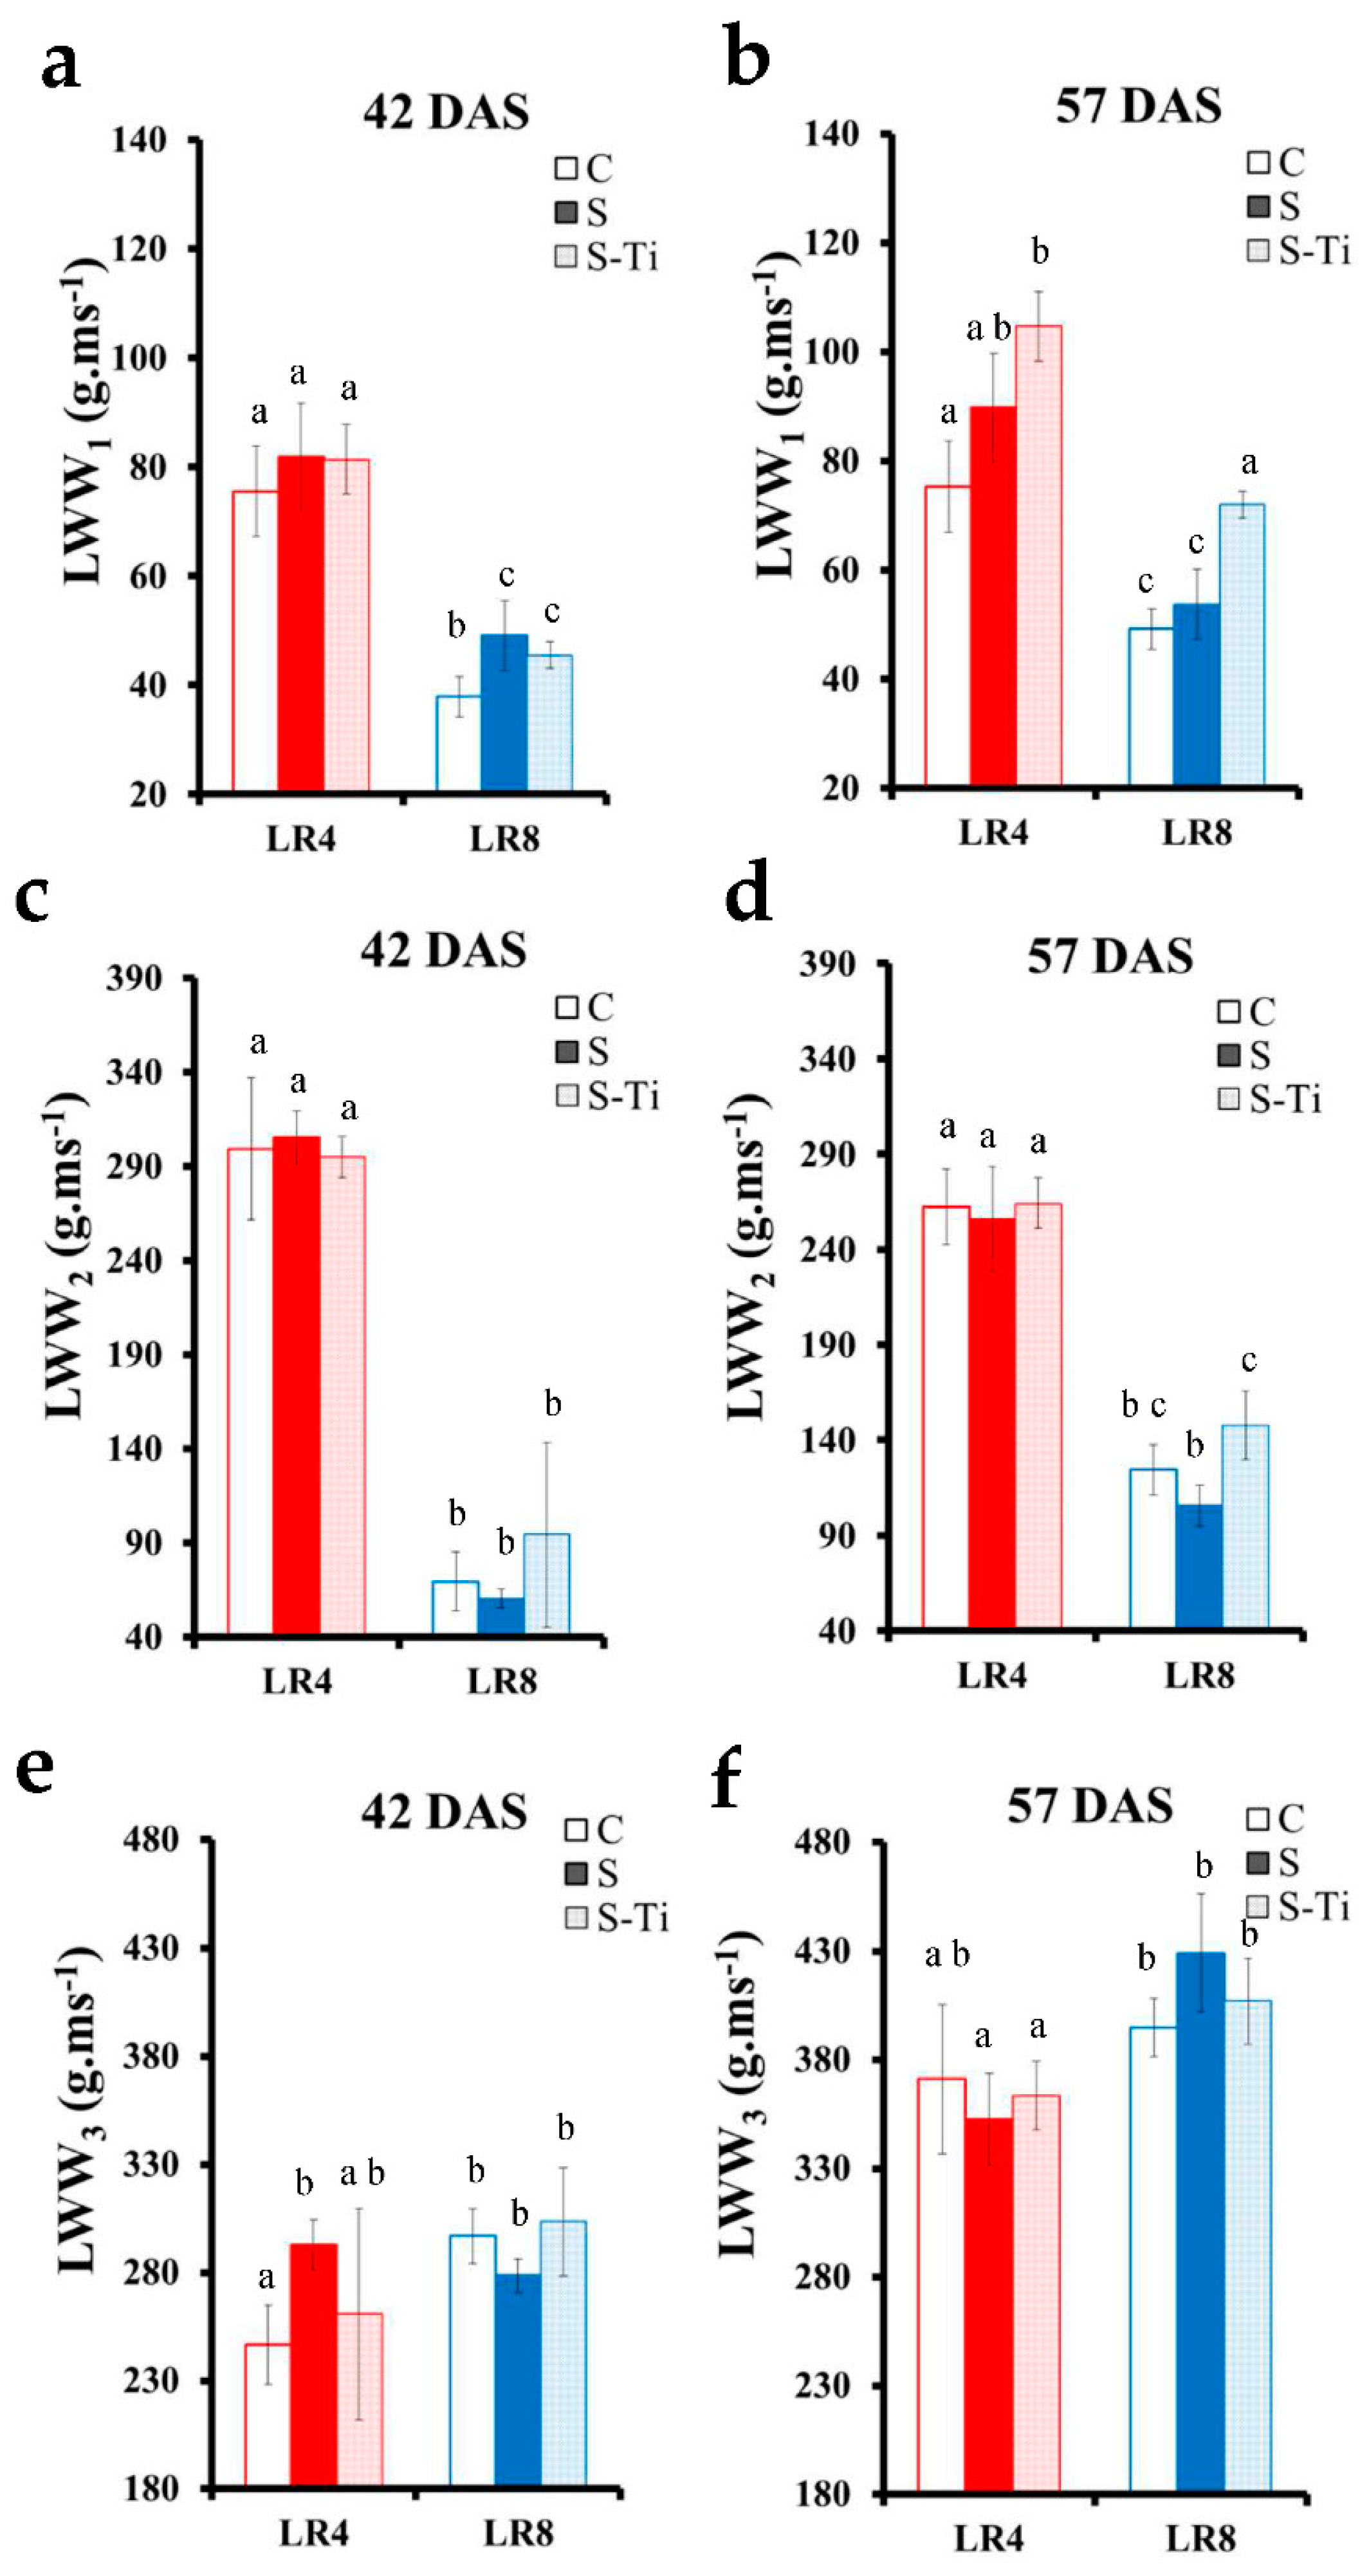
3.2. NMR Monitoring of Mild Drought Stress

The distribution of water proton T2 in the leaf shown in Figure 3a was a general feature of NMR spectra obtained for the leaves of the two leaf ranks under the different treatments at the two stages. This spectrum describes the distribution of the NMR transverse relaxation times of water molecules in leaf tissue and the surface area of each peak is directly related to the specific water fraction and can be expressed in g of water per leaf area in m2. All T2 distributions presented three distinct peaks; the first one centered around 18 ms, the second one centered between 100 to 150 ms, and the last one centered between 250 ms for LR 8 and 500 ms for LR 4. The two leaves rank studied presented different T2 and LWW for all conditions. At both stages and for all peaks, the T2 is always longer for older leaves (LR4) than the mature one (LR8) (Figure 4).
The developmental stage of leaves mainly affected the last peak of the spectrum. The T2 value of the third peak increased with the age of the leaf. Figure 3b) shows the correlation between relative intensities of the second (RI-2) and third peaks (RI-3) (expressed as a percentage of the total signal). This high correlation represented by these two peaks reflects the strong interaction involving a diffusional process between the two water compartments. The correlation between RI-2 and RI-3 was observed in both leaf ranks studied, showing that the interaction between water pools was not affected by the age of the leaf. Nevertheless, a clear difference in water distribution was observed between the two leaf ranks during plant development. Indeed, the relative intensity of the third peak IR-3 decreased between stages for LR 8, and increased in older leaves (LR 4) confirming that two different developmental processes were occurring in the two leaves studied. The values of the T2 and intensity (expressed in water g·m−2) of each peak as a function of the different treatment are presented in Figure 4 and Figure 5.
The T2 value of the first peak (T2-1) remained around 18 ms in the older leaves (LR 4) under all treatments at both stages. Likewise, the T2-1 of leaf rank 8 remained around 15 ms at the two stages. Water stress had no effect on T2-1 independently of the developmental stage of the plants. The addition of TIMAC SL28 increased T2-1 at 57 DAS in old leaves (LR 4).
The T2-2 of the second peak measured in old leaves (LR 4) of the control plants remained around 160 ms at both stages (Figure 4c,d). At 42 DAS, T2-2 decreased significantly (around 140 ms) in the leaves of water stressed plants, but at 57 DAS, the T2-2 of these leaves did not differ significantly from that in the leaves of control plants. At the first stage, leaves from plants treated with TIMAC SL28 showed strong variability in T2-2 and no significant differences in the leaves from control and water stressed plant were detected. At the second stage (57 DAS), T2-2 in leaves treated with TIMAC SL28 was equivalent to the T2-2 of leaves of control or water stressed plants. In leaf rank 8, the T2-2 measured in control plant leaves was lower than in LR4 at both stages (around 110 ms at 42 DAS and around 120 ms at 57 DAS) (Figure 4c,d). In this leaf rank, T2-2 was lower in the leaves of water stressed plants regardless of the stage (around 90 ms, and around 100 ms respectivly). At the first stage (42 DAS), the impact of water stress on T2-2 was limited by the addition of TIMAC SL28. At the second stage (57 DAS), the T2-2 measured in S-Ti leaves was equivalent to that measured in the leaves of water stressed plants, showing no effect of the biostimulant.
As for all the other peaks, T2-3 of old leaves were longer than those of mature leaves, the T2-3 in the older leaves (LR 4) of control plants is 500 ms at 42 DAS and increased to 550 ms at 57 DAS. At 42 DAS, water stress led to a significant decrease in T2-3. At 57 DAS, the T2-3 in the leaves of water stressed plants had increased to reach the value of the T2-3 measured in the leaves of control plants, so the effect of water stress on the T2-3 was no longer significant after 15 days. In leaf rank 8 of control plants, T2-3 increased from around 230 to 340 ms between the two stages (Figure 4e,f). The water stress induced a signicant decrease in T2-3 at the two stages (T2-3 around 210 and 260 ms respectively). The addition of TIMAC SL28 did not lead to any difference in the T2-3 in the LR 8 leaves of control and water stressed plants. Regardless of the development stage, the T2-3 in leaves from S-Ti plants did not differ significantly either from control or water stressed plants.
The LWW1 of LR 4 was around 75 g·m−2 in control plants and remained constant at both stages (Figure 5a,b). Moreover, no significant effect of water stress was observed on the amount of this water fraction. The addition of TIMAC SL28 significantly increased the amount of water associated with this peak in the leaves of both leaf ranks but only at 57 DAS. On the other hand, in LR8 of control plants, it increased with the development stage. This variation was not observed in stressed plants. The LWW1 of leaf rank 8 of control plants was 38 g·m−2 at 42 DAS and reached 50 g·m−2 15 days after. At the first stage, the LWW1 in leaf rank 8 of water stressed plants was higher than that in the leaves of control plants but did not increase between stages. At the second stage, the LWW1 of leaves from control and from water stressed plants was the same.
The LWW2 of older leaf (LR 4) (Figure 5d) was around 300 g·m−2 in the leaves of control plants at the first stage. In these leaves, opposite from LR 8, the LWW2 decreased between the two stages. At the second stage, the LWW2 was around 270 g·m−2 and, at both stages, neither water stress nor the addition of TIMAC SL28 had an effect on LWW2 (for LR 4). The LWW2 of leaf rank 8 of control plants was 70 g·m−2 at 42 DAS and, unlike in older leaves, increased to 120 g·m−2 at 57 DAS. Water stress and addition of TIMAC SL28 had no significant effect on LWW2 for that rank.
LWW3 measured in leaves of leaf rank 4 (Figure 5f) was around 360 g·m−1 and did not change between the two stages in control plants. At 42 DAS, water stress or the addition of the TIMAC SL28 had no effect on the amount of water in old leaves expressed in LWW3. At the second stage (57 DAS), the LWW3 increased significantly up to 430 g·m2 in leaves of the water stressed plants, this increase was not observed in plants treated with the TIMAC SL28.
The LWW3 of LR 8 of control plants was, like the other LWW, lower in LR8 than in LR 4 for all conditions and for the two stages. In LR8, LWW3 increased from 250 to 290 g·m−2 between the two stages. Different behaviour was observed in water stressed plants, LWW3 in the leaves of stressed plant was higher than that in the leaves of control plant leaves and did not increase between the two stages. The addition of TIMAC SL28 had no significant impact on that parameter.

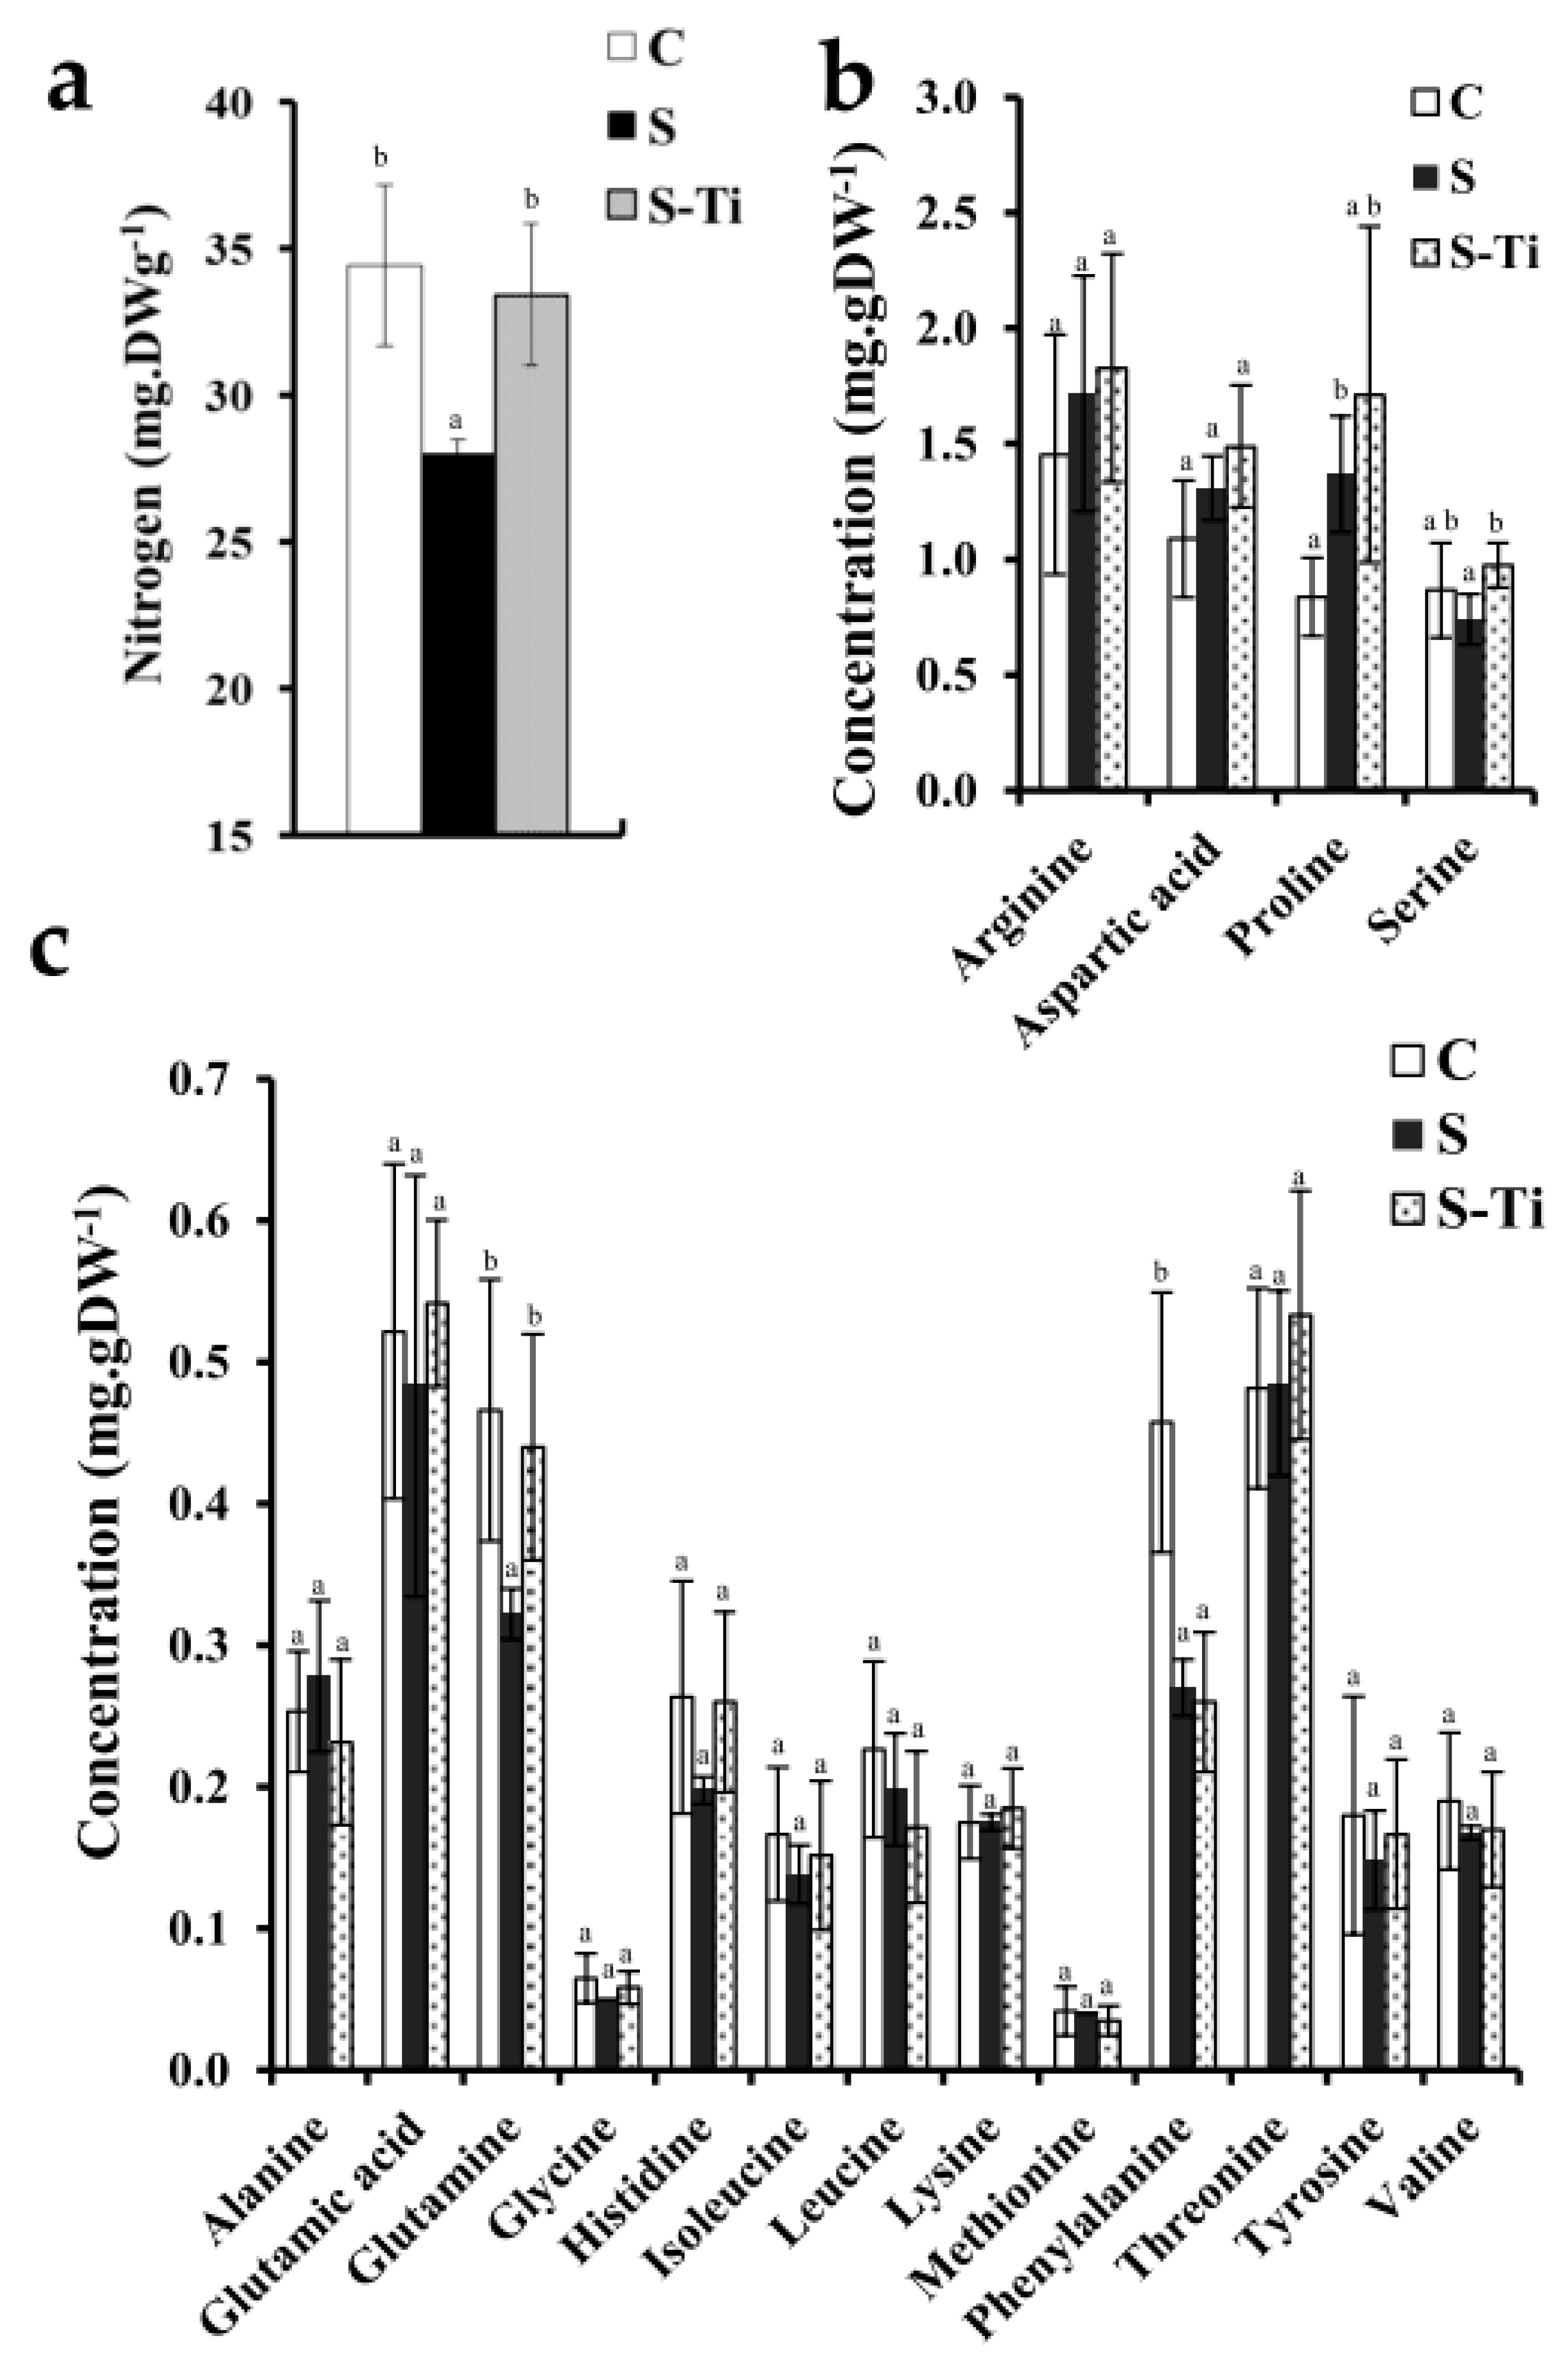
3.3. Impact at Harvest

Nitrogen is the main—and most expensive—nutrient in agriculture [40] and nitrogen deprivation is a known effect of drought [41]. Nitrogen assays were therefore performed to confirm the long-term effect of biostimulant at harvest (72 DAS). Figure 6 shows the nitrogen concentration in the shoots of plants under all treatments at 72 DAS.
The concentration of nitrogen was around 35 mg·DWg−1 in the shoots of control plants. Water stress triggered a decrease in this concentration (27 mg·DWg−1). The addition of TIMAC SL28 cancelled the effect of the water stress on the nitrogen concentration in the shoot at harvest. Note that TIMAC SL28 only contains 0.04% of N and this N add during biostimulant application can not explain alone the differences observed at harvest.
The free amino acids composition of the plants shoots at harvest was very similar between the treatments (Figure 6). The mild water stress impacted negatively only glutamine and serine concentrations and provoked an increase in proline and phenylalanine concentrations. The negative effect of mild drought stress on glutamine and serine concentrations was cancelled by biostimulant treatment, whereas phenylalanine concentration remained as high as in stress plants. Mean proline concentration was high in S-Ti plants, but also presented a high variability and therefore no statistical differences were observed between treatments for that parameter.

4. Discussion

In the present study, we investigated by NMR relaxation measurements both the leaf development and effects of mild drought stress on young tobacco plants. The impact of the application of a biostimulant on the adaptation of the plants to mild water stress was also studied. The effects of mild water stress on plants was characterized through physiological parameters of leaves at two stages of the plant development (42 and 57 DAS, respectively), as this organ is known to be sensitive to water stress [42] and biochemical assay at harvest (72 DAS).
Each stage was characterized by plants with a different number of leaves: the first stage (42 DAS) corresponded to very young plants (10 leaves) and the second stage (57 DAS) to older plants with more than 20 leaves proving the strong development of the plants between the two stages. Leaf ranks 4 and 8 were selected, as this made it possible to distinguish two different developmental processes between the two stages. Leaf rank 4 corresponded to small not completely expanded leaves during the 15-day study. The low SPAD values and PSII activity suggested the beginning of senescence of these leaves and the inversion of the sink source relationship. In addition, the high water content indicated that these leaves had begun senescence when sampled at 57 DAS [43]. On the other hand, rank 8 leaves expanded considerably between the two stages and had high photosynthetic related parameters values at 57 DAS (Figure 2), indicating that the leaves were mature. After 57 DAS, these leaves had reached their maximum size, as shown by subsequent observations, proving that the leaves were at the end of the expansion process. The differential development process observed between the leaves at the two stages studied was monitored through NMR and is discussed below.

4.1. Leaves at Two Developmental Stages Monitored through NMR

In plants, peaks of the T2 spectra can be associated with the water molecules in different subcellular compartments [44,45]. The NMR spectra of oilseed rape leaves have been extensively studied and an attribution of the different water peaks has been proposed [30]. In young oilseed rape leaves, the water NMR signal consists of three peaks: the first one characterized by a T2 around 2 ms was associated with the water interacting with polysaccharides (cell wall, starch), the second one characterized by a T2 around 15 ms was associated with the water in plastids and other small vacuoles, and the last one, the highest in terms of intensity and with the longest T2 around 150 ms, was associated with the water inside the cell vacuoles [35]. It has been shown in Brassica napus that vacuoles of palisade cells evolve differently than the spongy ones with leaf age. Consequently, this physiological evolution leads to an increase in the T2 value of the water in the vacuoles of palisade cells, whereas the T2 associated with the water in the spongy cells vacuoles remains stable. The consequence is the appearance of a new peak (T2 of more than 300 ms) that describes only the water in the vacuoles of the palisade cells, whereas the water in the vacuoles of spongy cells is described by a separate peak (T2 of about 150 ms).
The NMR signal of tobacco leaves was similar to the NMR signal of the oilseed rape leaves. The main difference was that no peak around 2 ms was detected in tobacco leaves, whereas the other peaks present in the oilseed rape leaf signal were also present in the NMR signal of tobacco leaf. The absence of T2 around 2 ms can be explained by lower starch content in young tobacco leaves, which were younger than the oilseed leaves studied. Indeed, Song et al. [46] reported considerable variation in the amount of starch in leaves from young and mature tobacco plants. Using scanning electron microscopy, they observed that the volume of starch relative to the cell volume was less than 2% in leaves from the early mature plants (12th leaf rank at 70 DAS) and represented 15% in mature plants (at 100 DAS). Therefore, according to the attribution of the T2 peaks to water cellular fractions proposed for oilseed rape leaf and due to the agreement in the relaxation time of the different water fractions, the following attribution can be assumed for tobacco: the first peak with a T2-1 of 15 ms could be associated with plastids and small vacuoles, the second one with a T2-2 of 120 ms could be associated with the water inside the vacuole of spongy cells, and the last peak characterized by T2 longer than 300 ms, with the water inside the vacuoles of palisade cells. Unlike in oilseed rape leaves, the vacuolar volume of the two main parenchyma of the young tobacco leaves is already very different [47], resulting in two separate peaks.
Based on this similar attribution between oilseed rape and tobacco plants, two different developmental processes can be distinguished in the tobacco leaves from the two leaf ranks.
In mature leaves (LR 8), we observed an increase in the T2 corresponding to the palisade cells (T2-3) between the two stages. Moreover, LWW1, LWW2 and LWW3 increased between stages. This is explained by the enlargement of cells concomitantly with the increase in fresh weight during leaf expansion. Moreover, in these leaves (LR 8), the proportion of total leaf water associated with the palisade cells was higher than the proportion associated with the spongy cells. This change in the water balance detected by NMR showed that the change in leaf fresh weight was mainly associated with the palisade cells.
In older leaves (LR 4), the T2 and LWW of the water from the vacuole of palisade cells were higher than in mature leaves (LR 8). The difference in T2-2 and T2-3 between the leaf ranks can therefore mainly be explained by the increase in the water content of the leaf. Thus, the variation of the T2 in LR 8 and LR 4 at 57 DAS is logical. However, the older leaves studied (LR4) of stressed plants had begun senescence at 57 DAS as shown by the increase in T2-3 and LWW3 whereas T2-2 remained stable, which is typical of the progression of senescence previously reported in oilseed rape leaves [35]. For these leaves, most of the vacuolar water was associated with the spongy cells vacuoles at 42 DAS, but this fraction decreased after 57 DAS to the benefit of the water fraction associated with the vacuoles of the palisade cells. Despite the fact the fresh weight remained constant, NMR results show that the water distribution changed significantly between stages, highlighting the sensitivity of the NMR spectra to investigate modifications in tissue structure. These changes in T2, and LWW in LR 4 water stressed leaves were not observed in control leaves; however, the high value of T2 and LWW, compared to LR8, and the low photosynthetic parameters 57 DAS indicated that these leaves were closed to begin senescence.
The similarity in NMR signal and its evolution with leaf ageing in Brassica napus and Nicotiana tabacum confirmed that this method could be used to monitor leaf development in different species.

4.2. Impact of Mild Drought Stress

The impact of water stress depends to a great extent on the development stage of the plant and on the intensity of the stress [5]. The stress applied in this study was low (humidity in the pot was 80% field water capacity) but remained constant over a period of several weeks. As a result of the low intensity of the water stress, most of the parameters measured on leaves were not affected (WC, RWC, FW, etc.). At the first stage (42 DAS), plants were stressed for only two weeks and the water stress was mild, and thus no differences in photosynthetic related parameters were detected. However, the stress did have a negative impact on these parameters at 57 DAS (Figure 2) as expected [48,49].
At harvest, the nitrogen concentration in the shoots was lower in water stressed plants (Figure 5). Drought affects all water movements and nutrient uptake in the roots and often causes N deprivation [41]. The water stress impact on free amino acids concentration at harvest was very small. At harvest, five weeks after the beginning of the water stress, the primary metabolism was not strongly affected, at the exception of proline, an amino acid known to accumulate in case of water stress [50,51,52]. Decrease in serine and glutamine concentration can be linked to the decrease in Nitrogen.
In the leaves of both leaf ranks studied, the T2 value of the first water peak attributed to water in the plastids and small vacuoles remained stable, indicating that this compartment was not affected by the water stress. The increase in LWW1 between stages only observed in LR 8 was certainly due to the parallel increase in fresh weight.
Several mechanisms triggered by water stress could explain variations in the NMR parameters of peaks corresponding to the vacuoles. Indeed, T2 changes can be explained first by a reduction in the vacuolar water content that will lead to a decrease in T2, second, an increase in the concentration of soluble compounds in the vacuole that will lead to a decrease in T2, and finally the permeability of the membrane can also change the T2. One way to distinguish between all these mechanisms is to also consider the change in LWW. Therefore, this parameter is only sensitive to water content. Thus, a simultaneous increase (or decrease) in T2 and LWW for a specific water compartment is strong evidence for a change in water content in the cell compartment without taking other mechanisms such as solute concentration or membrane permeability, into account. All of these mechanisms can be affected by water stress, a reduction in the water in the leaf and hence in the vacuoles is a known effect of water stress [25] as is an increase in the concentration of soluble compounds [53]. Moreover, the permeability of the tonoplast increases [54,55] or decreases [56,57] depending on the stress and the species.
The T2 and LWW of the palisade and spongy cells were significantly affected by the water stress. In LR 8, at 42 DAS, the T2-2 and T2-3 decreased, LWW2 remained constant and LWW3 increased after water stress. The decrease in T2-3 can be explained by osmotic adjustment as the increase in LWW3 indicated more water in this compartment. Indeed, it is known that water stress induces the accumulation of soluble osmo-protectants in leaf vacuoles, so we can assume that this accumulation process is one of the mechanisms involved in the decrease in T2-3 in LR 8 at 42 DAS. At the second stage (57 DAS), water stress induced a decrease in both T2 and LWW for the two vacuolar peaks. At this stage, the T2 was mainly explained by the water content of the vacuole, and no effect of water stress on the osmotic potential was detected. Assuming that the increase in vacuolar LWW and T2 between the two stages in mature leaves (LR8) of control plants expressed the development of the leaf, then the NMR results show that the water stress in mature leaves limits leaf development.
In old leaves (LR 4), at 42 DAS, the effect of water stress was a reduction in the T2 of the two vacuolar compartments, and despite lower T2 means no significant decrease in T2 was observed at 57 DAS in response to water stress. This pattern of change in the vacuolar NMR parameters is the opposite of that observed in mature leaves. In these leaves (LR 4), no significant changes in the water content of the vacuole attributed to the palisade cell (LWW3) were observed in response to water stress, but the increase in LWW3 between the two stages was higher in stressed leaves than in controls. This accumulation of water thus played a role in the increase in the T2-3, which limited the reduction in T2 assumed to be caused by osmotic adjustment. Accumulation of water in palisade cells has been described during senescence, resulting in an increase in the water associated with that tissue [33]. In the present study, the bigger increase in the LWW3 in old leaves of stressed plants suggests that the stress accelerated senescence.

4.3. Effects of Biostimulant

In the present study, the biostimulant acted at different levels, i.e., photosynthesis related parameters, water distribution in the leaf and nitrogen and amino acids concentration at harvest. The first clear benefit of the application of a biostimulant was to allow plants to maintain photosynthetic related parameters equal to control plant. For these parameters, TIMAC SL28 was shown to be more effective in young and mature leaves than in old leaves. In addition, the DW of leaves sprayed with biostimulant was higher than that of control leaves at 57 DAS, which can be linked to adaptation to water stress, by, for example, increasing the cuticle [58] or trichome [59]. At harvest, the main benefit of applying the biostimulant was the concentration of N, which was equivalent to that in the control plants. N starvation affects harvest in most crops [40], and is one consequence of water stress [41]. Serine and glutamine concentration was negatively impacted by water stress and the biostimulant treatment corrected this effect. The results of NMR showed that applying TIMAC SL28 reduced the impact of water stress on leaves. Indeed, the difference between control and water stressed plants was reduced after application of TIMAC SL28. The change in LWW suggests that TIMAC SL28 maintained the developmental expansion of mature leaves (LR 8) and limited the acceleration of senescence in old leaves (LR4). The specific effect of TIMAC SL28 on the relaxation parameters attributed to plastids and small vacuoles (T2-1; LWW1) requires more investigation. The use of foliar biostimulant allowed plants to maintain a satisfactory level of N and free amino acids and to offset most of the consequences of water stress.

5. Conclusions

The NMR results agreed with the physiological measurements and confirmed two different developmental processes in the two leaves studied: expansion in matures leaves (LR 8) and senescence in old leaves (LR 4). This study proved the ability of low field NMR to monitor these developmental processes in tobacco leaves. Our team [35] already demonstrated that NMR relaxation spectra are a powerful developmental indicator to characterize the physiological age of the leaf in Brassica napus. The similarity of the tobacco leaf NMR signal and its agreement with physiological measurements confirms the potential of NMR to provide a universal index of development whatever the plant species.
Early detection of plant stress is critical, especially in intensive production systems, in order to minimize loss of productivity. Leaf water potential or relative water content are usually used to provide direct information about the plant water status, but require destructive sampling, and are thus difficult to use as a development indicator in the field or in greenhouses. This is why several authors have attempted to detect and quantify water stress using thermal emittance and reflectance measurements [60,61,62]. For example, Behmann et al. [62] presented a method that enables detection of drought stress in plants from series of hyperspectral images. The method detected drought stress even before changes were detected by the naked eye, but, in these studies, water stress was applied by stopping watering so that the resulting stress was severe; in addition, when water stress was detected in these studies, most of the physiological parameters had already been affected by the stress. The NMR measurement in this study was very precise and enabled the detection of slight changes in water at the level of the tissue, and these kinds of measurements have already been shown to be possible in the field [63].

Author Contributions

All authors planned and designed the research. C.S. performed the experiments, and analyzed data. All authors read and approved the manuscript.

Funding

This research was funded by Agro Innovation International.

Conflicts of Interest

Jean-Claude Yvin and Florence Cruz worked for Agro Innovation International.

References

  1. Osakabe, Y.; Osakabe, K.; Shinozaki, K.; Tran, L.S.P. Response of plants to water stress. Front. Plant Sci. 2014, 5. [Google Scholar] [CrossRef] [PubMed] [Green Version]
  2. Tardieu, F.; Tuberosa, R. Dissection and modelling of abiotic stress tolerance in plants. Curr. Opin. Plant Biol. 2010, 13, 206–212. [Google Scholar] [CrossRef] [PubMed]
  3. You, J.; Chan, Z.L. ROS Regulation during Abiotic Stress Responses in Crop Plants. Front. Plant Sci. 2015, 6. [Google Scholar] [CrossRef] [PubMed]
  4. Wang, W.X.; Vinocur, B.; Altman, A. Plant responses to drought, salinity and extreme temperatures: Towards genetic engineering for stress tolerance. Planta 2003, 218, 1–14. [Google Scholar] [CrossRef] [PubMed]
  5. Skirycz, A.; De Bodt, S.; Obata, T.; De Clercq, I.; Claeys, H.; De Rycke, R.; Andriankaja, M.; Van Aken, O.; Van Breusegem, F.; Fernie, A.R.; et al. Developmental Stage Specificity and the Role of Mitochondrial Metabolism in the Response of Arabidopsis Leaves to Prolonged Mild Osmotic Stress. Plant Phys. 2010, 152, 226–244. [Google Scholar] [CrossRef] [PubMed]
  6. Clauw, P.; Coppens, F.; De Beuf, K.; Dhondt, S.; Van Daele, T.; Maleux, K.; Storme, V.; Clement, L.; Gonzalez, N.; Inze, D. Leaf Responses to Mild Drought Stress in Natural Variants of Arabidopsis. Plant Phys. 2015, 167, 800–816. [Google Scholar] [CrossRef] [PubMed] [Green Version]
  7. Subramanian, K.S.; Santhanakrishnan, P.; Balasubramanian, P. Responses of field grown tomato plants to arbuscular mycorrhizal fungal colonization under varying intensities of drought stress. Sci. Hortic. 2006, 107, 245–253. [Google Scholar] [CrossRef]
  8. Des Marais, D.L.; McKay, J.K.; Richards, J.H.; Sen, S.; Wayne, T.; Juenger, T.E. Physiological Genomics of Response to Soil Drying in Diverse Arabidopsis Accessions. Plant Cell 2012, 24, 893–914. [Google Scholar] [CrossRef] [PubMed] [Green Version]
  9. Bouchabke, O.; Chang, F.Q.; Simon, M.; Voisin, R.; Pelletier, G.; Durand-Tardif, M. Natural Variation in Arabidopsis thaliana as a Tool for Highlighting Differential Drought Responses. PLoS ONE 2008, 3. [Google Scholar] [CrossRef] [PubMed]
  10. Harb, A.; Krishnan, A.; Ambavaram, M.M.R.; Pereira, A. Molecular and Physiological Analysis of Drought Stress in Arabidopsis Reveals Early Responses Leading to Acclimation in Plant Growth. Plant Phys. 2010, 154, 1254–1271. [Google Scholar] [CrossRef] [PubMed]
  11. Wiriya-Alongkorn, W.; Spreer, W.; Ongprasert, S.; Spohrer, K.; Pankasemsuk, T.; Muller, J. Detecting drought stress in longan tree using thermal imaging. Maejo Int. J. Sci. Technol. 2013, 7, 166–180. [Google Scholar]
  12. Berni, J.A.J.; Zarco-Tejada, P.J.; Sepulcre-Canto, G.; Fereres, E.; Villalobos, F. Mapping canopy conductance and CWSI in olive orchards using high resolution thermal remote sensing imagery. Remote Sens. Environ. 2009, 113, 2380–2388. [Google Scholar] [CrossRef]
  13. Available online: http://www.biostimulants.eu/ (accessed on 27 September 2017).
  14. Przybysz, A.; Gawronska, H.; Gajc-Wolska, J. Biological mode of action of a nitrophenolates-based biostimulant: Case study. Front. Plant Sci. 2014, 5. [Google Scholar] [CrossRef] [PubMed]
  15. Baldo, R.; Scalon, S.D.Q.; Rosa, Y.; Mussury, R.M.; Betoni, R.; Barreto, W.D. Cotton plant cultivar delta opal behavior under water stress with or without biostimulant. Cienc. E Agrotecnol. 2009, 33, 1804–1812. [Google Scholar] [CrossRef]
  16. Kocira, A.; Kocira, S.; Swieca, M.; Zlotek, U.; Jakubczyk, A.; Kapela, K. Effect of foliar application of a nitrophenolate-based biostimulant on the yield and quality of two bean cultivars. Sci. Hortic. 2017, 214, 76–82. [Google Scholar] [CrossRef]
  17. Szczepanek, M.; Wilczewski, E.; Poberezny, J.; Wszelaczynska, E.; Keutgen, A.; Ochmian, I. Effect of biostimulants and storage on the content of macroelements in storage roots of carrot. J. Elementol. 2015, 20, 1021–1031. [Google Scholar] [CrossRef]
  18. Trevisan, S.; Manoli, A.; Ravazzolo, L.; Franceschi, C.; Quaggiotti, S. mRNA-Sequencing Analysis Reveals Transcriptional Changes in Root of Maize Seedlings Treated with Two Increasing Concentrations of a New Biostimulant. J. Agric. Food Chem. 2017, 65, 9956–9969. [Google Scholar] [CrossRef] [PubMed]
  19. Ertani, A.; Schiavon, M.; Nardi, S. Transcriptome-Wide Identification of Differentially Expressed Genes in Solanum lycopersicon L. in Response to an Alfalfa-Protein Hydrolysate Using Microarrays. Front. Plant Sci. 2017, 8. [Google Scholar] [CrossRef] [PubMed] [Green Version]
  20. Goni, O.; Fort, A.; Quille, P.; McKeown, P.C.; Spillane, C.; O’Connell, S. Comparative Transcriptome Analysis of Two Ascophyllum nodosum Extract Biostimulants: Same Seaweed but Different. J. Agric. Food Chem. 2016, 64, 2980–2989. [Google Scholar] [CrossRef] [PubMed]
  21. Tardieu, F.; Simonneau, T. Variability among species of stomatal control under fluctuating soil water status and evaporative demand: Modelling isohydric and anisohydric behaviours. J. Exp. Bot. 1998, 49, 419–432. [Google Scholar] [CrossRef]
  22. Nardini, A.; Raimondo, F.; Lo Gullo, M.A.; Salleo, S. Leafminers help us understand leaf hydraulic design. Plant Cell Environ. 2010, 33, 1091–1100. [Google Scholar] [CrossRef] [PubMed]
  23. Martinez, J.P.; Silva, H.; Ledent, J.F.; Pinto, M. Effect of drought stress on the osmotic adjustment, cell wall elasticity and cell volume of six cultivars of common beans (Phaseolus vulgaris L.). Eur. J. Agron. 2007, 26, 30–38. [Google Scholar] [CrossRef]
  24. Guerfel, M.; Baccouri, O.; Boujnah, D.; Chaibi, W.; Zarrouk, M. Impacts of water stress on gas exchange, water relations, chlorophyll content and leaf structure in the two main Tunisian olive (Olea europaea L.) cultivars. Sci. Hortic. 2009, 119, 257–263. [Google Scholar] [CrossRef]
  25. Lecoeur, J.; Wery, J.; Turc, O.; Tardieu, F. Expansion of pea leaves subjected to short water-deficit-cell number and cell-size are sensitive to stress at different periods of leaf development. J. Exp. Bot. 1995, 46, 1093–1101. [Google Scholar] [CrossRef]
  26. Krishnan, P.; Singh, R.; Verma, A.P.S.; Joshi, D.K.; Singh, S. Changes in seed water status as characterized by NMR in developing soybean seed grown under moisture stress conditions. Biochem. Biophys. Res. Commun. 2014, 444, 485–490. [Google Scholar] [CrossRef] [PubMed]
  27. Burdon, J.; Clark, C. Effect of postharvest water loss on ‘Hayward’ kiwifruit water status. Postharvest Biol. Technol. 2001, 22, 215–225. [Google Scholar] [CrossRef]
  28. Windt, C.W.; Vergeldt, F.J.; De Jager, P.A.; Van As, H. MRI of long-distance water transport: A comparison of the phloem and xylem flow characteristics and dynamics in poplar, castor bean, tomato and tobacco. Plant Cell Environ. 2006, 29, 1715–1729. [Google Scholar] [CrossRef] [PubMed]
  29. McCain, D.C. Nuclear Magnetic Resonance study of spin and magnetic-field gradient in maple leaves. Biophys. J. 1995, 69, 1111–1116. [Google Scholar] [CrossRef]
  30. Musse, M.; De Franceschi, L.; Cambert, M.; Sorin, C.; Le Caherec, F.; Burel, A.; Bouchereau, A.; Mariette, F.; Leport, L. Structural changes in senescing oilseed rape leaves at tissue and subcellular levels monitored by Nuclear Magnetic Resonance relaxometry through water status. Plant Phys. 2013, 163, 392–406. [Google Scholar] [CrossRef] [PubMed]
  31. Nagarajan, S.; Joshi, D.K.; Ahand, A.; Verma, A.P.S.; Pathak, P.C. Proton NMR transverse relaxation time and membrane stability in wheat leaves exposed to high temperature shock. Indian J. Biochem. Biophys. 2005, 42, 122–126. [Google Scholar] [PubMed]
  32. Windt, C.W.; Soltner, H.; van Dusschoten, D.; Blumler, P. A portable Halbach magnet that can be opened and closed without force: The NMR-CUFF. J. Magn. Reson. 2011, 208, 27–33. [Google Scholar] [CrossRef] [PubMed]
  33. Snaar, J.E.M.; Van, A.H. Probing water compartments and membrane permeability in plant cells by 1H NMR relaxation measurements. Biophys. J. 1992, 63, 1654–1658. [Google Scholar] [CrossRef]
  34. Henk, V.S. Intact plant MRI for the study of cell water relations, membrane permeability, cell-to-cell and long distance water transport. J. Exp. Bot. 2007, 58, 743–756. [Google Scholar] [CrossRef]
  35. Sorin, C.; Musse, M.; Mariette, F.; Bouchereau, A.; Leport, L. Assessment of nutrient remobilization through structural changes of palisade and spongy parenchyma in oilseed rape leaves during senescence. Planta 2015, 241, 333–346. [Google Scholar] [CrossRef] [PubMed]
  36. Maheswari, M.; Joshi, D.K.; Saha, R.; Nagarajan, S.; Gambhir, P.N. Transverse relaxation time of leaf water protons and membrane injury in wheat (Triticum aestivum L.) in response to high temperature. Ann. Bot. 1999, 84, 741–745. [Google Scholar] [CrossRef]
  37. Capitani, D.; Brilli, F.; Mannina, L.; Proietti, N.; Loreto, F. In Situ Investigation of Leaf Water Status by Portable Unilateral Nuclear Magnetic Resonance. Plant Phys. 2009, 149, 1638–1647. [Google Scholar] [CrossRef] [PubMed] [Green Version]
  38. Gambhir, P.N.; Shantha, N.; Kumari, P.; Kumar, S.; Pande, P.C.; Nagarajan, S. Proton NMR study of water in leaf and seed tissues of wheat varieties differing in tolerance to water stress. Indian J. Exp. Biol. 1997, 35, 304–306. [Google Scholar]
  39. Mariette, F.; Guillement, J.P.; Tellier, C.; Marchal, P. Continuous relaxation time distribution decomposition by MEM. In Signal Treatment and Signal Analysis in NMR; Rutledge, D.N., Ed.; Elsevier: Paris, France, 1996; pp. 218–234. [Google Scholar]
  40. Singh, U. Integrated nitrogen fertilization for intensive and sustainable agriculture. J. Crop Improv. 2005, 15, 259–288. [Google Scholar] [CrossRef]
  41. Albert, B.; Le Caherec, F.; Niogret, M.F.; Faes, P.; Avice, J.C.; Leport, L.; Bouchereau, A. Nitrogen availability impacts oilseed rape (Brassica napus L.) plant water status and proline production efficiency under water-limited conditions. Planta 2012, 236, 659–676. [Google Scholar] [CrossRef] [PubMed]
  42. Aasamaa, K.; Niinemets, U.; Sober, A. Leaf hydraulic conductance in relation to anatomical and functional traits during Populus tremula leaf ontogeny. Tree Phys. 2005, 25, 1409–1418. [Google Scholar] [CrossRef] [Green Version]
  43. Masclaux, C.; Valadier, M.H.; Brugiere, N.; Morot-Gaudry, J.F.; Hirel, B. Characterization of the sink/source transition in tobacco (Nicotiana tabacum L.) shoots in relation to nitrogen management and leaf senescence. Planta 2000, 211, 510–518. [Google Scholar] [CrossRef] [PubMed]
  44. Hills, B.P.; Duce, S.L. The influence of chemical and diffusive exchange on water proton transverse relaxation in plant-tissue. Magn. Reson. Imaging 1990, 8, 321–331. [Google Scholar] [CrossRef]
  45. Snaar, J.E.M.; Van As, H. A method for the simultaneous measurement of NMR spin-lattice and spin-spin relaxation times in compartmentalized systems. J. Magn. Reson. 1992, 99, 139–148. [Google Scholar] [CrossRef]
  46. Song, Z.P.; Wang, J.N.; Sun, M.; Wu, J.C.; Gong, C.R.; Liu, G.S. Effects of organic fertilizer applications on starch changes in tobacco (Nicotiana tabacum L.) leaves during maturation. Soil Sci. Plant Nutr. 2016, 62, 173–179. [Google Scholar] [CrossRef]
  47. Falcioni, R.; Moriwaki, T.; Bonato, C.M.; de Souza, L.A.; Nanni, M.R.; Antunes, W.C. Distinct growth light and gibberellin regimes alter leaf anatomy and reveal their influence on leaf optical properties. Environ. Exp. Bot. 2017, 140, 86–95. [Google Scholar] [CrossRef]
  48. Flexas, J.; Medrano, H. Drought-inhibition of photosynthesis in C-3 plants: Stomatal and non-stomatal limitations revisited. Ann. Bot. 2002, 89, 183–189. [Google Scholar] [CrossRef]
  49. Lawlor, D.W.; Cornic, G. Photosynthetic carbon assimilation and associated metabolism in relation to water deficits in higher plants. Plant Cell Environ. 2002, 25, 275–294. [Google Scholar] [CrossRef] [PubMed] [Green Version]
  50. Hare, P.D.; Cress, W.A. Metabolic implications of stress-induced proline accumulation in plants. Plant Growth Regul. 1997, 21, 79–102. [Google Scholar] [CrossRef]
  51. Sperdouli, I.; Moustakas, M. Interaction of proline, sugars, and anthocyanins during photosynthetic acclimation of Arabidopsis thaliana to drought stress. J. Plant Phys. 2012, 169, 577–585. [Google Scholar] [CrossRef] [PubMed]
  52. Gregorova, Z.; Kovacik, J.; Klejdus, B.; Maglovski, M.; Kuna, R.; Hauptvogel, P.; Matusikova, I. Drought-Induced Responses of Physiology, Metabolites, and PR Proteins in Triticum aestivum. J. Agric. Food Chem. 2015, 63, 8125–8133. [Google Scholar] [CrossRef] [PubMed]
  53. Mwadzingeni, L.; Shimelis, H.; Tesfay, S.; Tsilo, T.J. Screening of Bread Wheat Genotypes for Drought Tolerance Using Phenotypic and Proline Analyses. Front. Plant Sci. 2016, 7. [Google Scholar] [CrossRef] [PubMed]
  54. Sarda, X.; Tousch, D.; Ferrare, K.; Cellier, F.; Alcon, C.; Dupuis, J.M.; Casse, F.; Lamaze, T. Characterization of closely related delta-TIP genes encoding aquaporins which are differentially expressed in sunflower roots upon water deprivation through exposure to air. Plant Mol. Biol. 1999, 40, 179–191. [Google Scholar] [CrossRef] [PubMed]
  55. Yamada, S.; Nelson, D.E.; Ley, E.; Marquez, S.; Bohnert, H.J. The expression of an aquaporin promoter from Mesembryanthemum crystallinum in tobacco. Plant Cell Phys. 1997, 38, 1326–1332. [Google Scholar] [CrossRef]
  56. Johansson, I.; Karlsson, M.; Shukla, V.K.; Chrispeels, M.J.; Larsson, C.; Kjellbom, P. Water transport activity of the plasma membrane aquaporin PM28A is regulated by phosphorylation. Plant Cell 1998, 10, 451–459. [Google Scholar] [CrossRef] [PubMed]
  57. Kjellbom, P.; Larsson, C.; Johansson, I.; Karlsson, M.; Johanson, U. Aquaporins and water homeostasis in plants. Trends Plant Sci. 1999, 4, 308–314. [Google Scholar] [CrossRef]
  58. Lu, S.Y.; Zhao, H.Y.; Des Marais, D.L.; Parsons, E.P.; Wen, X.X.; Xu, X.J.; Bangarusamy, D.K.; Wang, G.C.; Rowland, O.; Juenger, T.; et al. Arabidopsis ECERIFERUM9 Involvement in Cuticle Formation and Maintenance of Plant Water Status. Plant Physiol. 2012, 159, 930–944. [Google Scholar] [CrossRef] [PubMed] [Green Version]
  59. Aharoni, A.; Dixit, S.; Jetter, R.; Thoenes, E.; van Arkel, G.; Pereira, A. The SHINE clade of AP2 domain transcription factors activates wax biosynthesis, alters cuticle properties, and confers drought tolerance when overexpressed in Arabidopsis. Plant Cell 2004, 16, 2463–2480. [Google Scholar] [CrossRef] [PubMed]
  60. Ondimu, S.; Murase, H. Water stress detection in Sunagoke moss (Rhacomitrium canescens) using combined thermal infrared and visible light imaging techniques. Biosyst. Eng. 2008, 100, 4–13. [Google Scholar] [CrossRef]
  61. Vermeulen, K.; Aerts, J.M.; Dekock, J.; Bleyaert, P.; Berckmans, D.; Steppe, K. Automated leaf temperature monitoring of glasshouse tomato plants by using a leaf energy balance model. Comput. Electron. Agric. 2012, 87, 19–31. [Google Scholar] [CrossRef]
  62. Behmann, J.; Steinrucken, J.; Plumer, L. Detection of early plant stress responses in hyperspectral images. ISPRS J. Photogramm. Remote Sens. 2014, 93, 98–111. [Google Scholar] [CrossRef]
  63. Musse, M.; Leport, L.; Cambert, M.; Debrandt, W.; Sorin, C.; Bouchereau, A.; Mariette, F. A mobile NMR lab for leaf phenotyping in the field. Plant Methods 2017, 13. [Google Scholar] [CrossRef] [PubMed] [Green Version]
Figure 1. Schematic representation of the experimental. One rectangle represents one week.
Applsci 08 00943 g001
Figure 2. (a) SPAD among the canopy of the plants for the different treatments at the second stage. (b) PSII activity among the canopy of the plants for the different treatments at the second stage. Dotted lines indicate the 8th (blue) and 4th (red) leaf ranks. Bars represent standard deviation.
Applsci 08 00943 g002
Figure 3. (a) T2 distribution obtained by the MEM method for leaf ranks 8 and 4 of well-watered plants at the second stage; (b) correlation between amplitudes of the second and third peaks for LR 4 (red) and LR 8 (bleu) for stages 1 (cube) and 2 (triangle).
Applsci 08 00943 g003
Figure 4. T2 in ms of the first (a,b), second (c,d) and last peaks (e,f) obtained in leaves from two ranks and for all treatments at 42 days after sowing (DAS) (a,c,e) and 57 DAS (b,d,f). Bars represent standard deviation. Different letters means statistical differences (p < 0.05).
Applsci 08 00943 g004
Figure 5. LWW (leaf water weight) in g·m−2 of the first (a,b), second (c,d) and last peaks (e,f) obtained in leaves from two ranks and for all treatments at 42 DAS (a,c,e) and 57 DAS (b,d,f). Bars represent standard deviation. Different letters means statistical differences (p < 0.05).
Applsci 08 00943 g005
Figure 6. (a) nitrogen rate per plant in shoots at harvest time for all treatments; (b,c) free amino acids content. Bars represents standard deviation and different letters means statistical differences (p < 0.05) between treatments.
Applsci 08 00943 g006
Table 1. Water Content (WC) and Relative Water Content (RWC) of LR 4 and LR 8 at two stages (42 and 57 days after sowing (DAS)) and for different treatments. Different letters means statistical differences (p < 0.05) between treatments or leaf ranks and different numbers means statistical differences (p < 0.05) between stages for the same leaf.
Leaf RankTreatmentWC (%)
42 DAS
WC (%)
57 DAS
RWC (%)
42 DAS
RWC (%)
57 DAS
4Control96.5 ± 0.4 a,196.7 ± 0.8 a,b,196.2 ± 1.8 a,195.2 ± 2.8 a,1
Stress96.0 ± 0.3 a,196.6 ± 0.1 a,192.3 ± 4.3 a c,195.4 ± 2.4 a,1
Stress-Ti96.0 ± 0.4 a,196.1 ± 0.2 b,194.5 ± 3.4 a c,196.0 ± 2.1 a,1
8Control93.4 ± 0.6 b,195.4 ± 1.1 a,b,c,284.4 ± 5.1 b,193.2 ± 1.2 a,b,2
Stress93.6 ± 1.0 b,193.9 ± 0.9 c,187.4 ± 6.5 b,c,188.8 ± 3.5 b,1
Stress-Ti93.3 ± 0.6 b,194.4 ± 0.4 c,291.6 ± 3.8 a,b,c,191.1 ± 4.5 a,b,1
Table 2. Fresh Weight per leaf area (FW) and Dry Weight per leaf area (DW) of the LR4 and LR8 at two stages and for different treatments. Different letters means statistical differences (p < 0.05) between treatments or leaf ranks and different numbers means statistical differences (p < 0.05) between stages for the same leaf.
Leaf RankTreatmentFW per Leaf Area
42 DAS
FW per Leaf Area
57 DAS
DW per Leaf Area
42 DAS
DW per Leaf Area
57 DAS
4Control72.8 ± 5.6 a,176.3 ± 2.1 a,12.55 ± 0.15 a,12.55 ± 0.45 a,1
Stress72.6 ± 2.5 a,177.1 ± 0.2 a,22.41 ± 0.15 a,12.61 ± 0.09 a,2
Stress-Ti76.2 ± 5.3 a,180.7 ± 7.4 a,12.88 ± 0.43 a,13.12 ± 0.20 b,2
8Control36.6 ± 0.6 b,149.6 ± 6.4 b,22.65 ± 0.12 a,12.53 ± 0.22 a,1
Stress40.4 ± 3.6 b,145.7 ± 4.3 b,12.60 ± 0.20 a,12.77 ± 0.16 a,1
Stress-Ti40.5 ± 3.6 b,152.0 ± 4.7 b,22.42 ± 0.14 a,12.92 ± 0.06 b,2

