Article

Energy Management Scheme for an EV Smart Charger V2G/G2V Application with an EV Power Allocation Technique and Voltage Regulation

by
Saad Ullah Khan
1,
Khawaja Khalid Mehmood
1,
Zunaib Maqsood Haider
1,
Syed Basit Ali Bukhari
1,
Soon-Jeong Lee
2,
Muhammad Kashif Rafique
1 and
Chul-Hwan Kim
1,*
1
College of Information and Communication Engineering, Sungkyunkwan University, Suwon 16419, Korea
2
KEPCO Economy and Management Research Institute, Naju 58217, Korea
*
Author to whom correspondence should be addressed.
Appl. Sci. 2018, 8(4), 648; https://doi.org/10.3390/app8040648
Submission received: 20 March 2018 / Revised: 16 April 2018 / Accepted: 20 April 2018 / Published: 21 April 2018

Abstract

:
The increasing penetration of electric vehicles (EVs) in the distribution grid has established them as a prospective resource for ancillary services. These services require adequate control strategies for prompt and efficient operation. In this study, an energy management scheme (EMS) has been proposed to employ an off-board EV smart charger to support the grid during short-term variance of renewables and reactive load onset. The scheme operates by calculating power references for the charger instantaneously. The EMS incorporates a proportional power division methodology, proposed to allocate power references to the individual EVs connected to the charger DC-bus. This methodology considers the state-of-charge and battery sizes of the EVs, and it can aggregate energy from various types of EVs. The proposed scheme is compared with another power allocation method, and the entire EMS is tested under the scenarios of power mismatch and voltage sag/swell events. The results show that the proposed scheme achieves the goal of the aggregation of EVs at the charger level to support the grid. The EMS also fulfills the objectives of voltage regulation and four-quadrant operation of the smart charger.

1. Introduction

New policies regarding CO2 emission control have encouraged the penetration of renewable energy in the power generation sector and electric vehicles (EVs) in the transportation sector. Renewables such as photovoltaics and wind turbines are being integrated into the distribution system as distributed generation (DG) systems [1]. Both photovoltaics and wind turbines give fluctuating power output owing to the intermittent nature of their energy source. The resulting power imbalance can cause instability in the grid due to the distribution transformer overloading and the line congestion in low power periods [2]. It is not feasible for conventional generators with high response times to compensate for such rapid power changes [3]. Although, the battery energy storage systems (BESSs) with a power electronics interface have high ramp rates and quick response times well suited for renewables application [4], they increase the overall system and operating costs [5]. Solar power fluctuations can be smoothed by smaller batteries [6], giving rise to the prospect of utilizing EV batteries in cooperation with renewables.
Though the penetration of EVs in the distribution grid has increased [7], EVs are parked and connected to the grid either in charging mode or idle mode for more than 95% of the time [8]. The probability of an EV parked anywhere during the midday period is over 0.9, and parked any day at home is higher than 0.5. From the perspective of developed countries, two vehicles per household and one being parked at home most of the time is a reasonable assumption [9]. According to [10], more than 90% of vehicles are parked at home for one-third of the day. As such, studies show that the daily mileage of EVs is not much, and they are parked the majority of the time. Furthermore, at any instance during the day, the presence of EVs parked and connected to a charger is a high possibility. If the parked EVs are maintained to be plugged in and connected to the grid for the entire parking duration, the potential of utilizing the EVs for vehicle-to-grid (V2G) or grid-to-vehicle (G2V) services is promising. This application of EVs can reduce the overall costs of purchasing and maintaining BESS units and results in economic benefits for distribution system operators (DSOs). Moreover, the price-based energy flow schemes encourage EV owners to participate in them, and the EVs serve as a source of revenue for their owners, promoting the EV market. Furthermore, when EVs are charged from renewables and discharged during the power deficit, the renewables are utilized to their maximum economic and environmental support potential [11]. Otherwise, charging EVs from the energy generated from conventional power plants simply shifts the carbon footprint from the vehicle exhaust systems to power plants. In addition, the stress on the grid is lessened when power is generated in the close vicinity of charging EVs.
Making the EV ready for departure at all times has accelerated the installation of off-board fast charging stations, which have been a focus of recent research for V2G/G2V operation and reactive power support. A control scheme for a unified four-quadrant operation of a three-leg inverter for three-phase fast charging and single-phase slow charging has been developed in [12]. In [13], the capacitive and inductive operation of an off-board bidirectional EV charger is explored, incorporating user-based charging commands. Control of active and reactive power by utilizing a three-phase grid-tie inverter with anti-islanding detection and voltage/frequency deviation protection has been proposed in [14]. Various studies have addressed active power control in compliance with inverter DC-link voltage and the reactive power with point of common coupling (PCC) voltage [15,16,17]. However, it is more suitable and standardized to communicate active power P and reactive power Q reference signals between the charger and the grid, and to derive other references based on these P Q references [18]. Calculation of P and Q references for voltage regulation has been studied in [19]. With the advancement of EV infrastructure, EVs with different battery capacities can be connected to a single high-power fast charger simultaneously to act as an aggregated storage unit. A method for computing P reference for V2G is discussed in [8], which considers two EVs connected to the photovoltaic inverter DC-bus in a single-phase system. The EVs discharge to compensate for the low solar power; however, the strategy through which the power is shared among the EVs has not been demonstrated. Various discharging rates for V2G are allocated to multiple EVs connected to the same charger in [15]. The rates are designated by the customers, which is impracticable for a dynamic grid scenario, where the allocated power should be based on the grid requirements. A charging scenario of multiple EVs has been considered in compliance with voltage regulation from a smart charger in [16]. Charging of EVs is executed without considering any coordination with the grid. In [20], the control schemes of a three-phase four-quadrant converter and bi-directional converter of EVs are described, and the study lacks the power allocation control from the EV perspective. Overall, the proper designation of charging or discharging rates to the integrated EVs at the charger level while keeping in view the ongoing grid conditions is absent in the previous studies.
The concept of EV power allocation and aggregation has been previously explored in parking lot-level studies. In [21], the charging power allotment to EVs within the aggregator is determined by a heuristic algorithm. The charging costs are minimized, while the peak loading is also avoided. Linear programming is used in [22] to allocate the charging power of each EV in a parking lot. Five discrete charging rates are considered, which are decided by the customer. To reduce the power fluctuation level in a residential area, an aggregated charging model has been proposed in [23]. The model considers the total number of EVs, as well as the SoC of each EV under an updatable optimization method. These studies are executed considering EV fleets, with day-ahead energy forecasts and long time resolutions (in the range of 5–15 min). Thus, these methods are unfeasible for instantaneous power allocation during renewables’ power transients, which are short term (within the seconds range) and cannot be forecasted. Furthermore, all of these schemes only consider the same type of EVs or batteries, and management between different EV battery types is yet to be explored at the power allocation level. Instantaneous power allocation to multiple BESSs with several battery sizes has been studied in [24]. The batteries charge or discharge in descending order of their rated capacity. It is natural to assume that a larger battery should be allotted a higher share of power. However, EV power allocation from this perspective should be analyzed with different battery capacity EVs.
In this paper, we have proposed a comprehensive energy management scheme (EMS) to govern the four-quadrant operation of a smart EV charger and the aggregation of various types of EVs connected to the charger. The EMS communicates with the EVs, smart charger, grid and DSO. The EMS can coordinate with a variable-power DG in the close vicinity of the charger, as well as a reactive load onset simultaneously to generate the P Q references instantaneously. Furthermore, a method is proposed within the EMS to allocate active power appropriately among multiple EVs connected to the smart charger DC-bus. The proposed method (PM) allots power references to an individual EV based on the battery state-of-charge (SoC) and its capacity. The power reference calculation for the EVs is derived from the active power reference (P) of the smart charger. The power can be aggregated from several types of EVs for V2G/G2V operation. The proposed scheme can also incorporate the power references for EV charging/discharging long-term strategies (LTSs) such as peak shaving and load leveling by communicating with the DSO.
The modeling and the simulations are conducted using EMTP/ATPDraw [25]. Various simulation scenarios are designed to test the functionality of the EMS, and the proposed power allocation scheme is compared with a battery capacity-based power allocation method [24]. The main contributions of this work can be summarized as follows:
  • An aggregation-based power reference allocation approach for individual EVs has been established by considering their battery size and SoC.
  • The proposed scheme is studied with different types of EVs.
  • The EMS calculates instantaneous power references for the EV smart charger and the EV side converters, based on dynamic grid conditions and communication with EVs to prevent off-limit operations.
  • Equivalent circuit modeling of power electronics converters and the EMS implementation in the electro-magnetic transient program (EMTP-ATPDraw), utilizing a short time step of 1.667 μ s and a 6000-Hz converter switching frequency; show the instantaneous behavior of the scheme.
  • The EMS can include long-term schemes under the command from the system operator.
The rest of the paper is organized as follows: Section 2 discusses modern distribution grids, and Section 3 states the modeling and control of the various components of the modern grid: integrated renewables and EVs. The proposed EMS and their functionalities are explained in Section 4. Section 5 outlines the simulation conditions and the parameters. A demonstration of the results and their analysis are presented in Section 6. Finally, conclusions are drawn in Section 7.

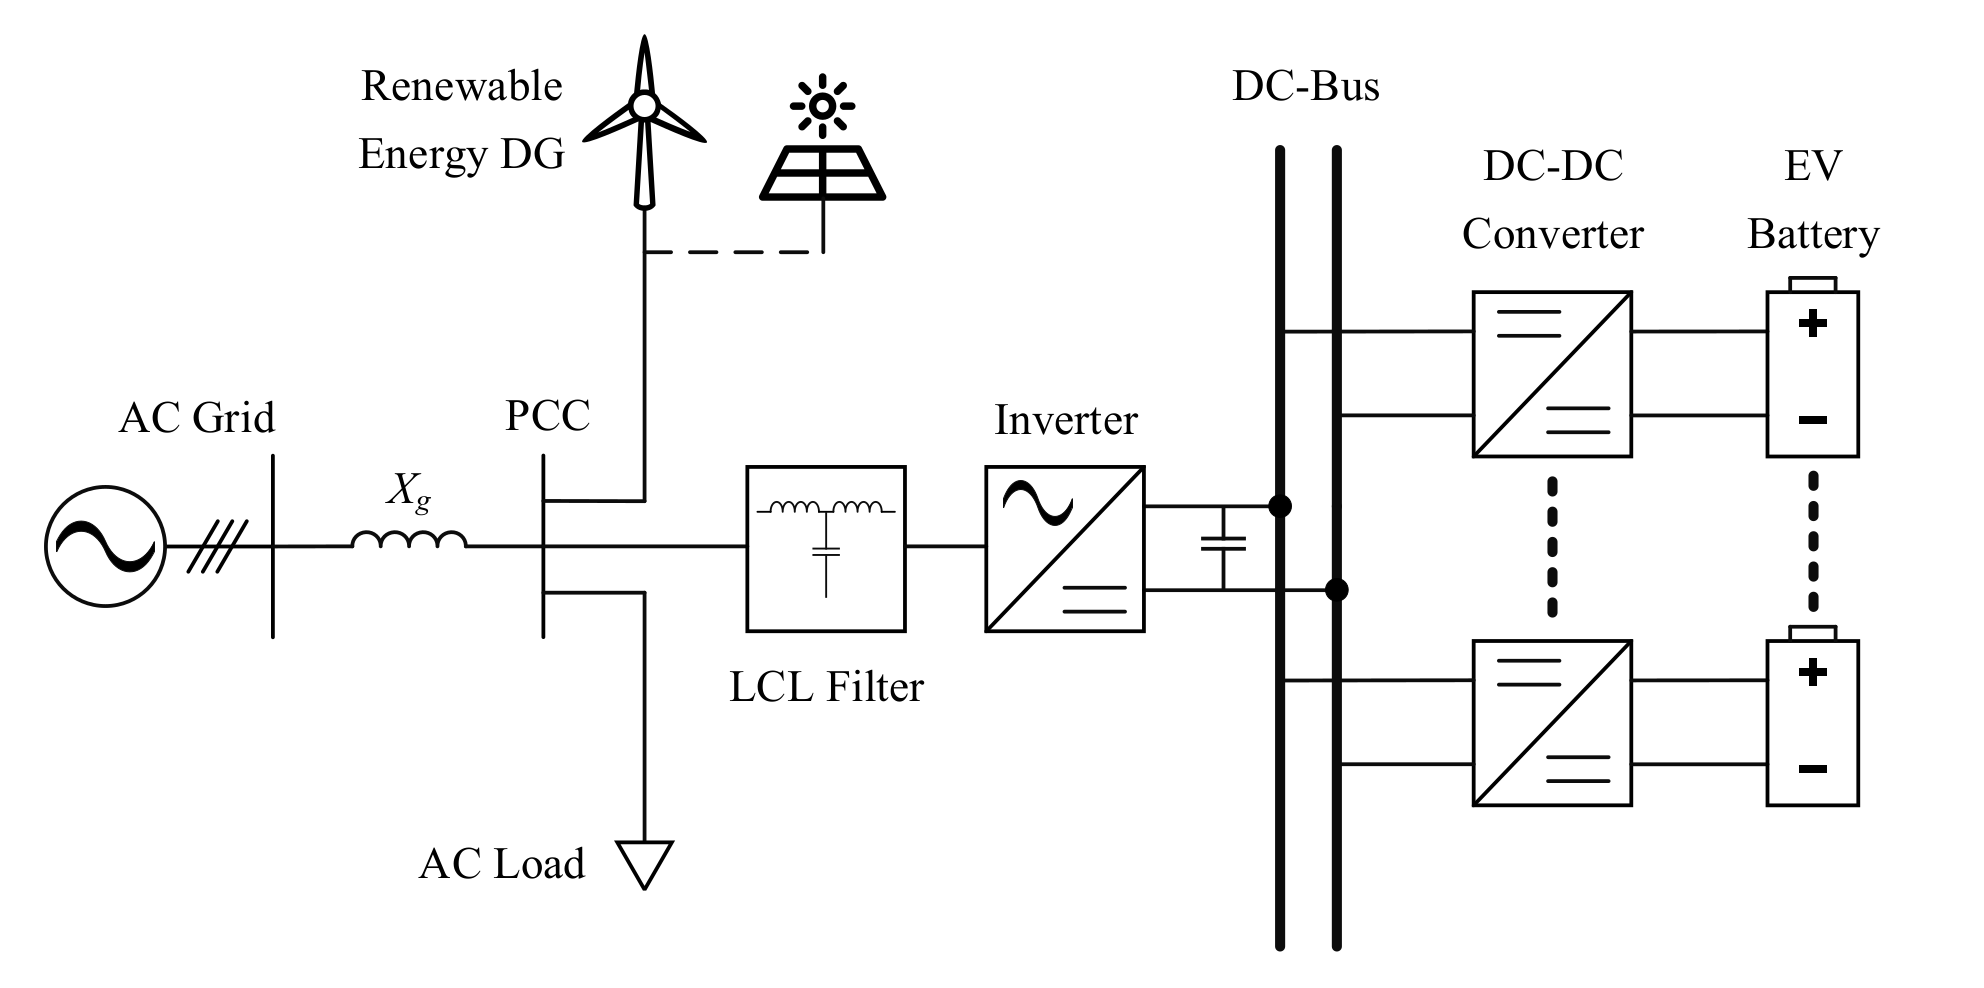
2. Modern Distribution Grids

As grid load continues to increase, the high cost of renewing the infrastructure such as distribution lines and transformers has become a serious constraint [26,27]. These constraints have given rise to the introduction of generation in the form of DGs in proximity to the load [28], which reduces the stress on the distribution transformers and lines. Appropriately-placed and -sized DGs reduce losses and also tend to satisfy the power and voltage limitations [29]. Furthermore, solar or wind-based DGs are an eco-friendly way to generate power, which helps to reduce the greenhouse gases emission [30]. Solar and wind power are well suited to be integrated as DGs owing to the ease of integration at the required location because of their small size and expandable nature. Environmental policy requirements have also encouraged the introduction of renewables. At the same time, EVs have been introduced in the transportation sector to shift the trend away from conventional vehicles. Figure 1 depicts a schematic of a renewable energy DG and EV integration at the PCC, adjacent to the load being fed from the AC grid and the DG. EVs are connected parallel to each other at the DC-bus of the charger.
The grid impedance is mainly inductive [31,32]; thus, X g R g is assumed. The inductance X g represents the connection between the grid bus and the PCC. The transfer of active power P g and reactive power Q g from the grid to the PCC is given as follows:
P g = V g V p c c X g sin δ
Q g = V g 2 X g V g V p c c X g cos δ
where V g is the voltage on the grid bus, V p c c is the voltage on the PCC, the power angle is ϕ g ϕ p c c = δ , ϕ g = 0 is the phase angle of the grid bus and ϕ p c c = δ is the phase angle of the PCC bus. This configuration shows that the active power transfer depends on the power angle, while the reactive power is related to the voltage.

3. Component Modeling and Control
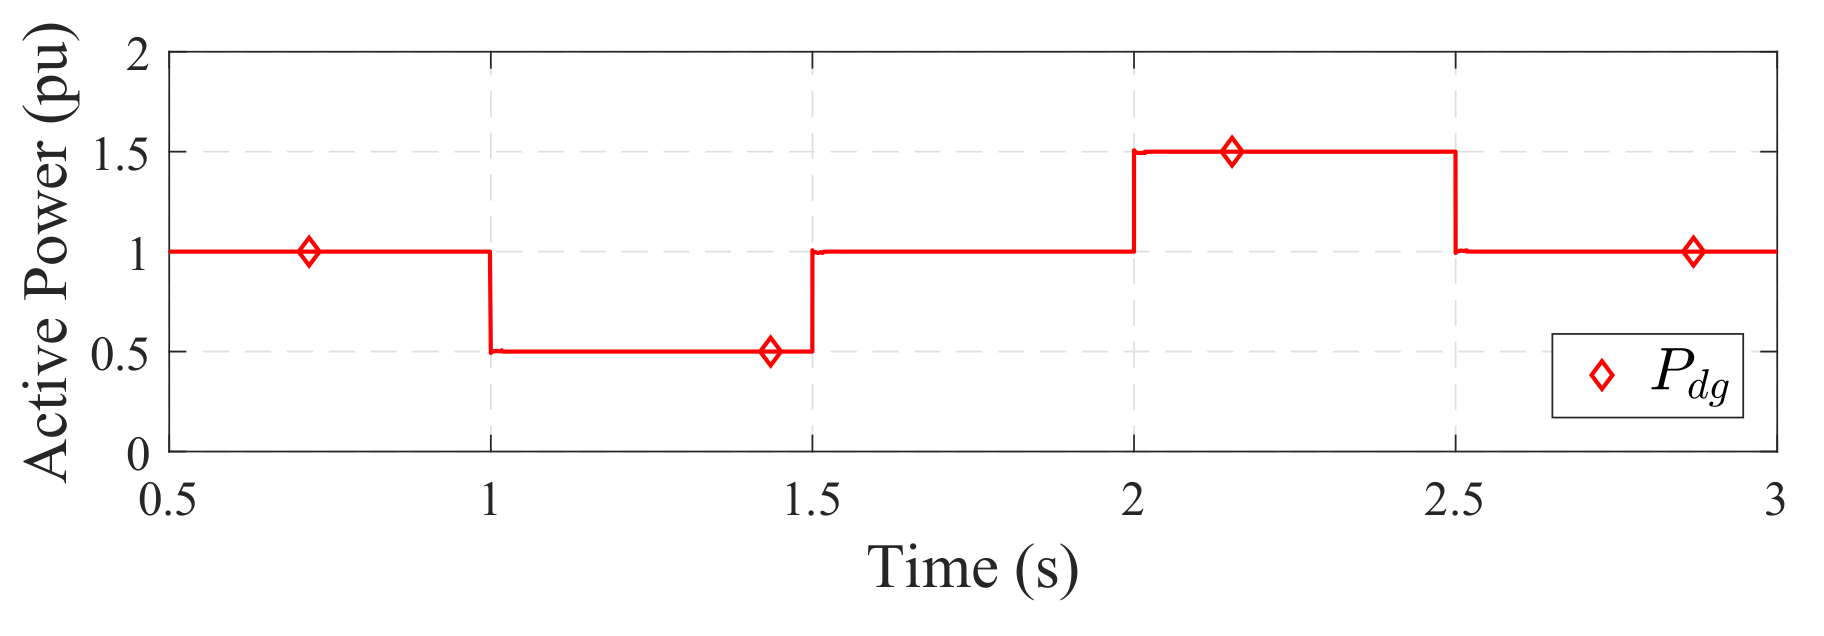
This section briefly describes the modeling and control of the various components of modern distribution grids used in this study: DG, EV battery, the converters and their controllers. EMTP/ATPDraw is used for modeling the components and their control.

3.1. DG Model

A mathematical DG model is devised to study the V2G and G2V scenarios. The DG is connected to the PCC bus, adjacent to the load and the EVs as shown in Figure 1. The three-phase sinusoidal currents i d g ( a b c ) based on the output power P d g with respect to time t are given by:
i d g ( a ) ( t ) i d g ( b ) ( t ) i d g ( c ) ( t ) = I d g cos ( ω g t δ ) I d g cos ( ω g t δ 2 π 3 ) I d g cos ( ω g t δ + 2 π 3 )
I d g = P d g V p c c × 2 3
where ω g is the grid angular frequency. The three-phase sinusoidal DG currents are in phase with the three-phase sinusoidal PCC bus voltage v p c c ( a b c ) to make it an active power source operating at the unity power factor. The DG is incorporated in the system as a current source.
A positive and negative variation of 50% from the mean output power value is considered for the DG, which is based on the fluctuating characteristics of photovoltaics and wind turbines [3,33,34,35]. Figure 2 shows the DG power output with deviations from the 1 pu mean value.

3.2. EV Battery Model

Since the presence of multiple EVs is studied, an agent-based battery modeling method is utilized. Each EV battery is modeled individually. Parameters of the EVs selected in this study are listed in Table 1.
The EV batteries are modeled based on the Tremblay Li-ion battery model [40]. The discharge and charge voltage characteristics ( V b D and V b C ) are given by the Li-ion battery Equations (5) and (6), respectively:
V b D = E 0 R b i b K φ φ i b t ( i b t + i b f ) + A e B i b t
V b C = E 0 R b i b K φ i b t 0.1 φ i b f K φ φ i b t i b t + A e B i b t
where E 0 is the constant battery voltage, R b is the internal resistance of the battery, K is the polarization constant, φ is the ampere-hour battery capacity, i b is the battery current, i b f is the filtered current, i b t = i b d t is the battery charge at time t, A is the exponential zone amplitude and B is the exponential zone time constant inverse. The battery parameters for both EVs are given in Table 2.
Based on these parameters, and using Equation (5), the discharge voltage characteristics and SoC profiles of both EVs have been established as shown in Figure 3. The discharge curves have been measured at 1C, which is the discharge current that depletes the entire battery capacity in one hour from an SoC of 100% to 0%.
According to the battery discharge curves shown in Figure 3, the nominal battery operation region lies between the exponential region and the cut-off region, which corresponds to an SoC between 20% and 80%. This fact has been especially standardized by SAEStandard J1772 [41], in which a full charge from 20% to 80% SoC is considered for the higher power levels. The nominal voltage represents the linear zone in the battery discharge curve profile, and operating the battery in this range is favorable to preserve battery life. Only the constant current (CC) strategy is utilized. As mentioned earlier, the full charge for high-power charging is from 20% to 80% SoC, and the usual practice is to switch to a constant voltage (CV) scheme when the SoC reaches 80% to charge the battery to 100%. This aspect is not feasible in the fast-charging scenario and, hence, not considered in this study.

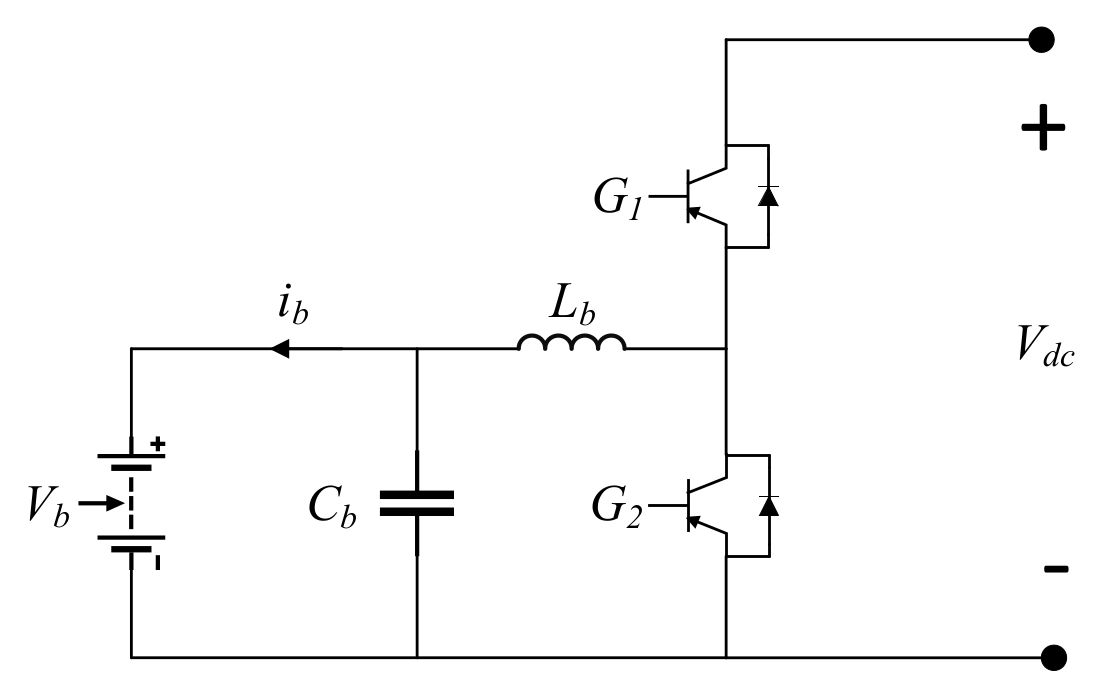
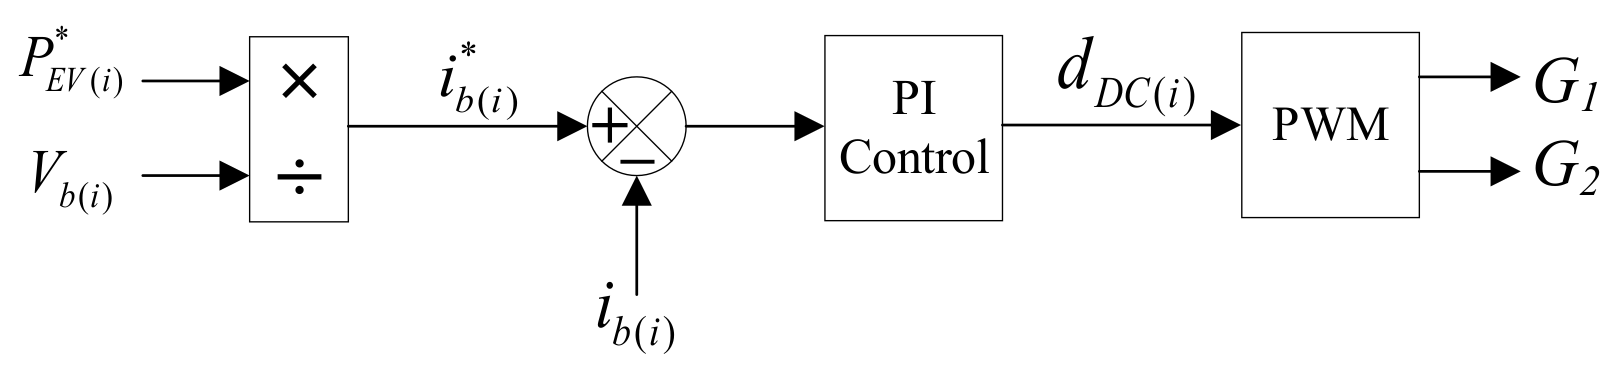
3.3. Bidirectional DC-DC Converter

EV-side DC-DC converter models are based on the half-bridge topology. Such DC-DC converters have the ability to perform in both directions. The topology is simple with fewer components, low cost, higher efficiency and one input for pulse width modulation (PWM) [20]. The design consists of an inductor L b and a capacitor C b for the battery side. Two transistor switches G 1 and G 2 with anti-parallel diodes are operated by complementary signals from the controller and provide the bi-directional ability. G 1 switch operation is for charging where it bucks the right-side V d c to V b , whereas G 2 switch operation is for discharging, which is active during the boost operation [32]. The circuitry is shown in Figure 4. Values for L b and C b for the converter are calculated as follows [42]:
L b = V d c V b 2 Δ i L f s ( D C ) D b u c k = V b 2 Δ i L f s ( D C ) D b o o s t
C b = Δ i L 8 Δ v C f s ( D C )
where V d c is the DC-link voltage, V b is the nominal battery voltage, Δ i L = γ D C × i b 1 C is the current ripple in L b for a 1C current, γ D C is the current ripple percentage, Δ v C = γ v × V b is the voltage ripple in C b , γ v is the voltage ripple percentage, f s ( D C ) is the switching frequency, D b u c k = V b / V d c and D b o o s t = 1 ( V b / V d c ) .
The DC-DC converter controller tends to operate the battery as a current source in the CC strategy [18]. The battery current loop is cascaded with a PI control block, which gives the duty ratio d D C ( i ) of the i-th EV (Equation (9)). The duty ratio d D C ( i ) is fed into the PWM, which operates the two switches G 1 and G 2 .
d D C ( i ) = ( i b ( i ) * i b ( i ) ) K p ( b ) + K i ( b ) s
where i b ( i ) * = P E V ( i ) * / V b ( i ) is the reference battery current, P E V ( i ) * is the active power reference of the i-th EV and K p ( b ) and K i ( b ) are the proportional and integral gains of the PI controller. When P E V ( i ) = 0 , the signal to both switches G 1 and G 2 becomes zero, and the switches are in halt mode. The control strategy is shown in Figure 5.

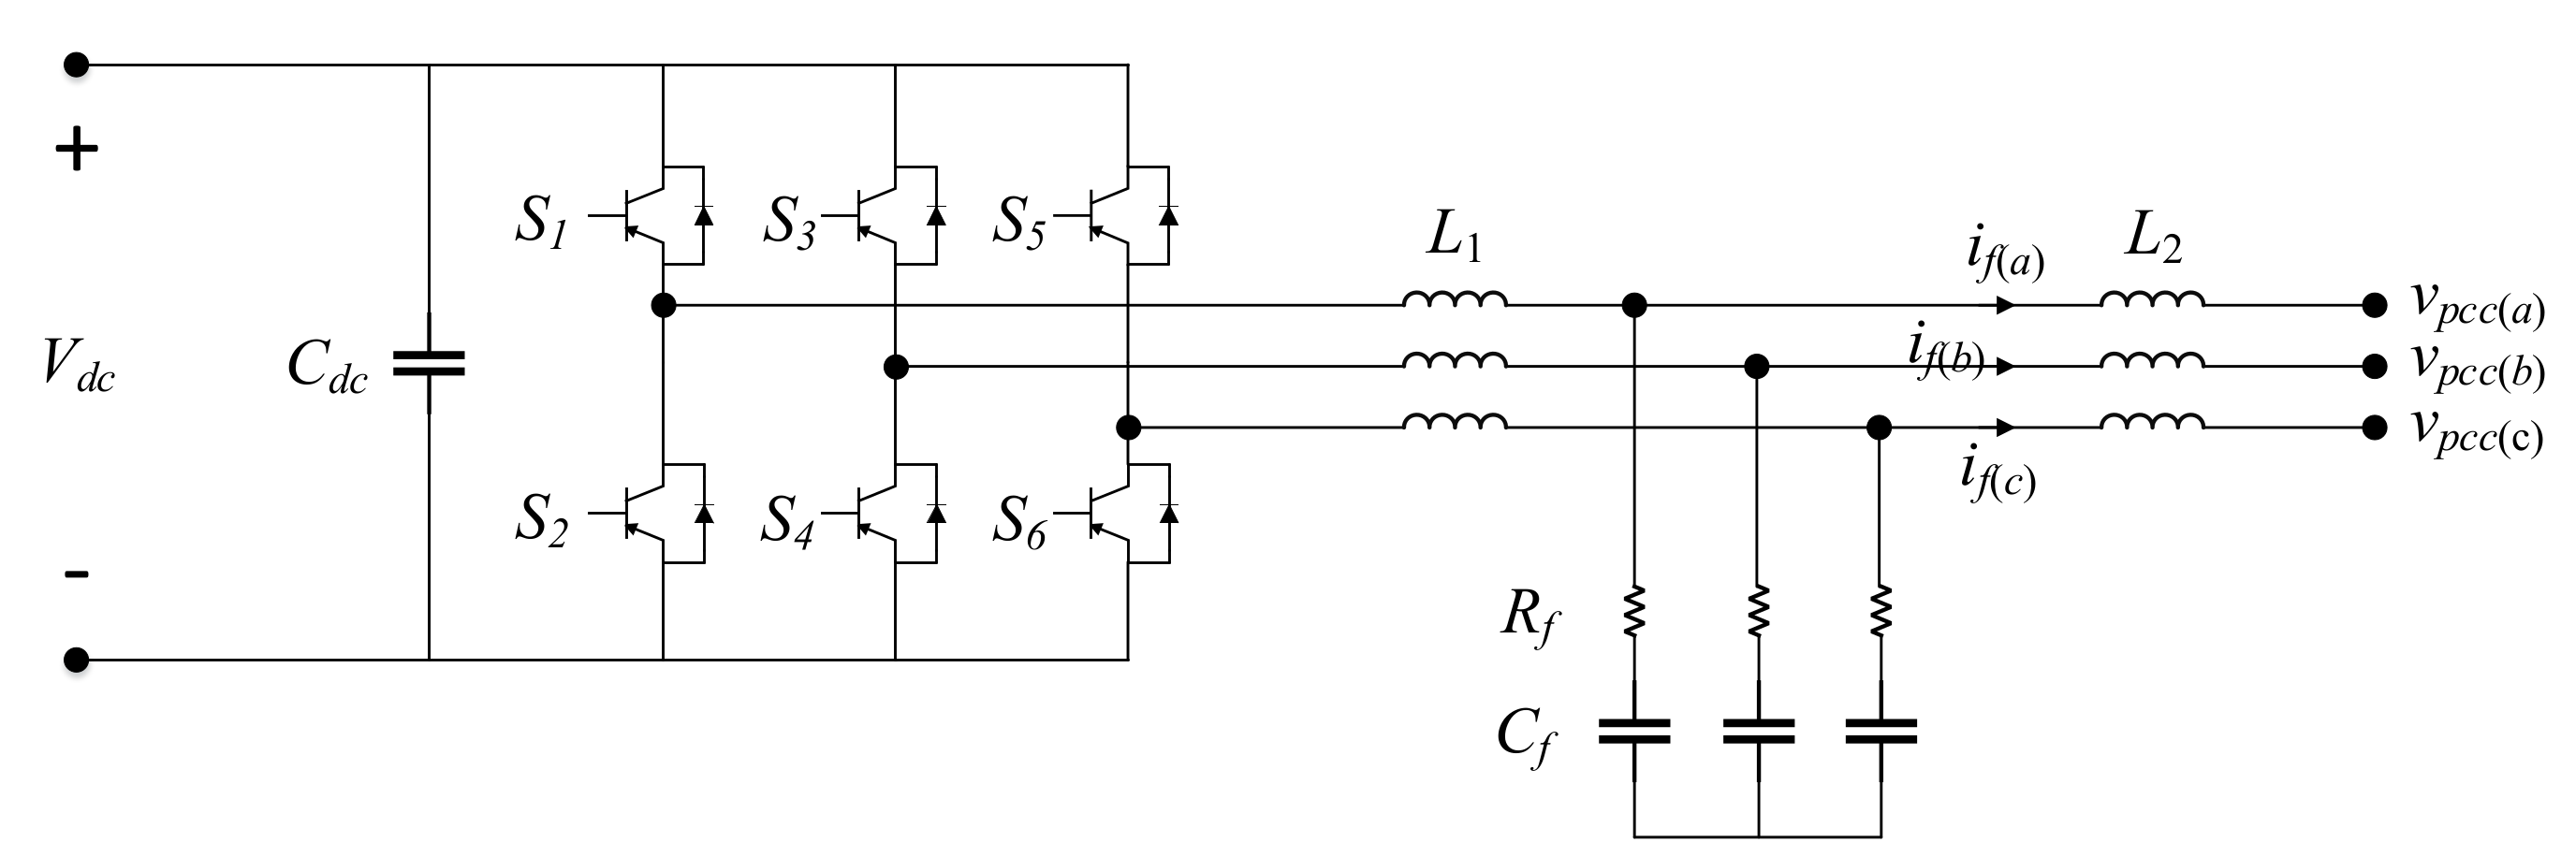
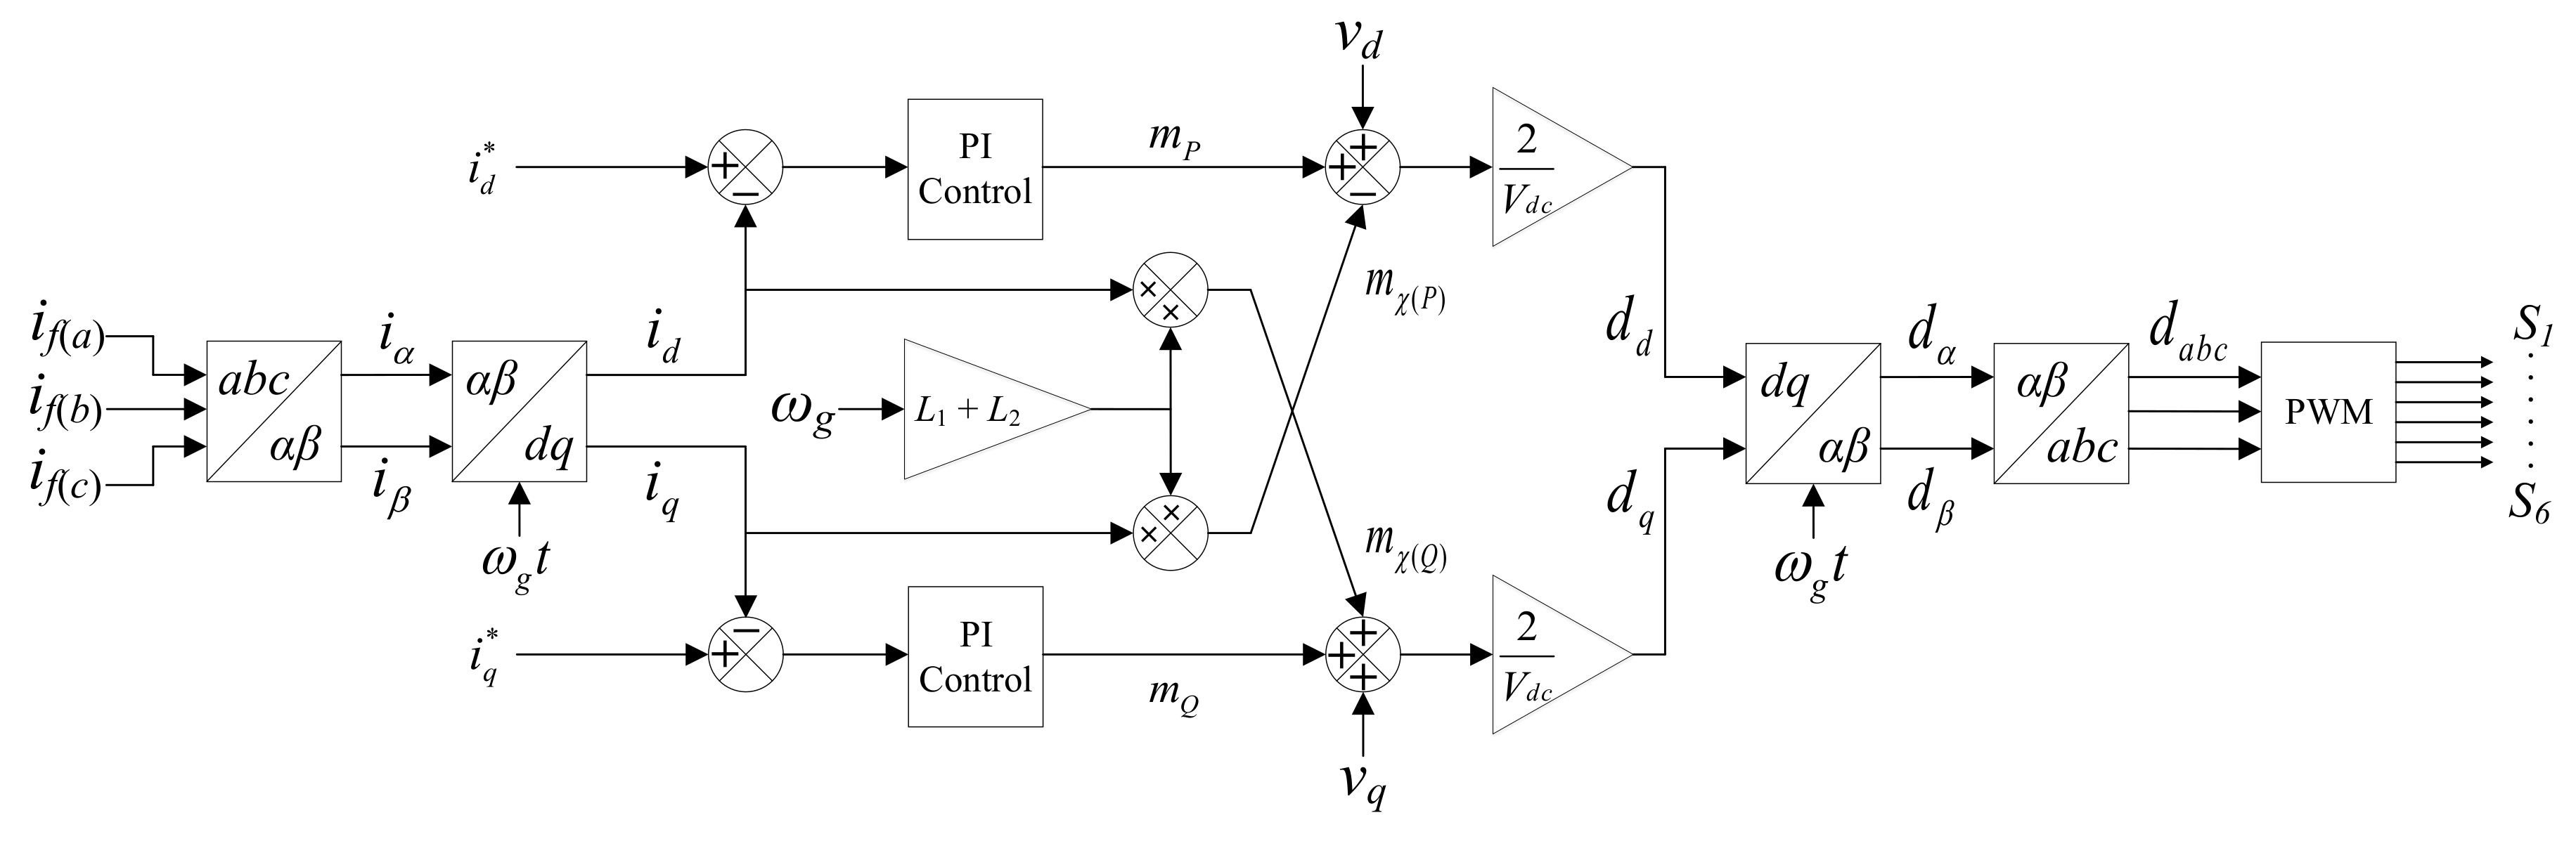
3.4. Four-Quadrant Converter

Conventional chargers perform only one-way power transfer from the grid to the EV and operate at a close to unity power factor, whereas a bidirectional charger offers the capability to discharge the battery energy for support. However, a four-quadrant charger enhances the functionality of a bidirectional charger by adding the ability to provide or absorb reactive power. It can operate at any point on the P Q circle, where S n = P 2 + Q 2 and S n is the kVA rating of the charger. Such chargers lie in the category of off-board fast-charging stations where the weight and size is not a significant constraint. Four-quadrant operation of a converter is demonstrated in Figure 6.
The four-quadrant grid-side converter of the smart charger is a three-leg voltage source inverter. The topology of the inverter is shown in Figure 7. The DC-link capacitance size C d c is calculated by considering the energy rate of change during transients, as well as the charger rating [17] as follows:
C d c = 2 λ Δ r S n cos ϕ Δ x f g V d c 2
where λ is a multiple of the grid frequency f g , Δ r is the range of change of DC power, cos ϕ is the power factor and Δ x is the allowable DC-bus voltage variation during transients.
Each leg of the inverter bridge is connected further to an LCLfilter in a Y-configuration. The LCL filter reduces the high-frequency harmonics and supports the use of lower switching frequency for the inverter. The LCL filter has an inverter-side inductor L 1 , a grid-side inductor L 2 and a filter capacitor C f [43]. The values of these components are calculated as:
L 1 = V d c V L G 2 2 γ A C f s ( i n v ) S n
C f = ϱ S n ω g V L L 2
L 2 = 1 ρ 2 + 1 ω s ( i n v ) 2 C f
where V L G is the PCC RMS phase voltage, V L L is the PCC RMS line voltage, γ A C is the current ripple in L 1 , f s ( i n v ) is the inverter switching frequency, ϱ is the power factor variation, ρ is the desired attenuation and ω s ( i n v ) = 2 π f s ( i n v ) . A passive damping resistor R f is included in series with the filter capacitor to avoid resonance; its value is given by:
R f = 1 3 ω r e s C f
where:
ω r e s = L 1 + L 2 L 1 L 2 C f
and its range should be according to the condition: 10 f g < f r e s < 0.5 f s ( i n v ) .

3.5. Four-Quadrant Converter Controller

The inverter controller receives the P Q references from the EMS. The control is in the d q frame with a conventional current loop. Synchronization of the inverter with the grid is achieved through the phase locked loop (PLL), which intakes the three-phase voltage signals from the PCC bus v p c c ( a b c ) . The PLL configuration is shown in Figure 8. Various output signals from the PLL are utilized in the current control.
The EMS controls real and reactive power using a current-control strategy. The goal of the current control is to generate the three-phase duty ratios d a b c for the PWM and the switching pulses for the switches S 1 to S 6 of the inverter. These signals are derived from the active and reactive power references. The reference direct and quadrature currents i d * and i q * for the current control are calculated from the P ( i n v ) * and Q ( i n v ) * references established by the EMS as follows:
i d * = 2 3 ( v d 2 + v q 2 ) [ P ( i n v ) * v d + Q ( i n v ) * v q ]
i q * = 2 3 ( v d 2 + v q 2 ) [ P ( i n v ) * v q Q ( i n v ) * v d ]
where v d and v q are the direct and quadrature voltages from PLL. The instantaneous d q currents i d and i q are generated from the three-phase LCL filter current i f ( a b c ) . The control process is shown in Figure 9.

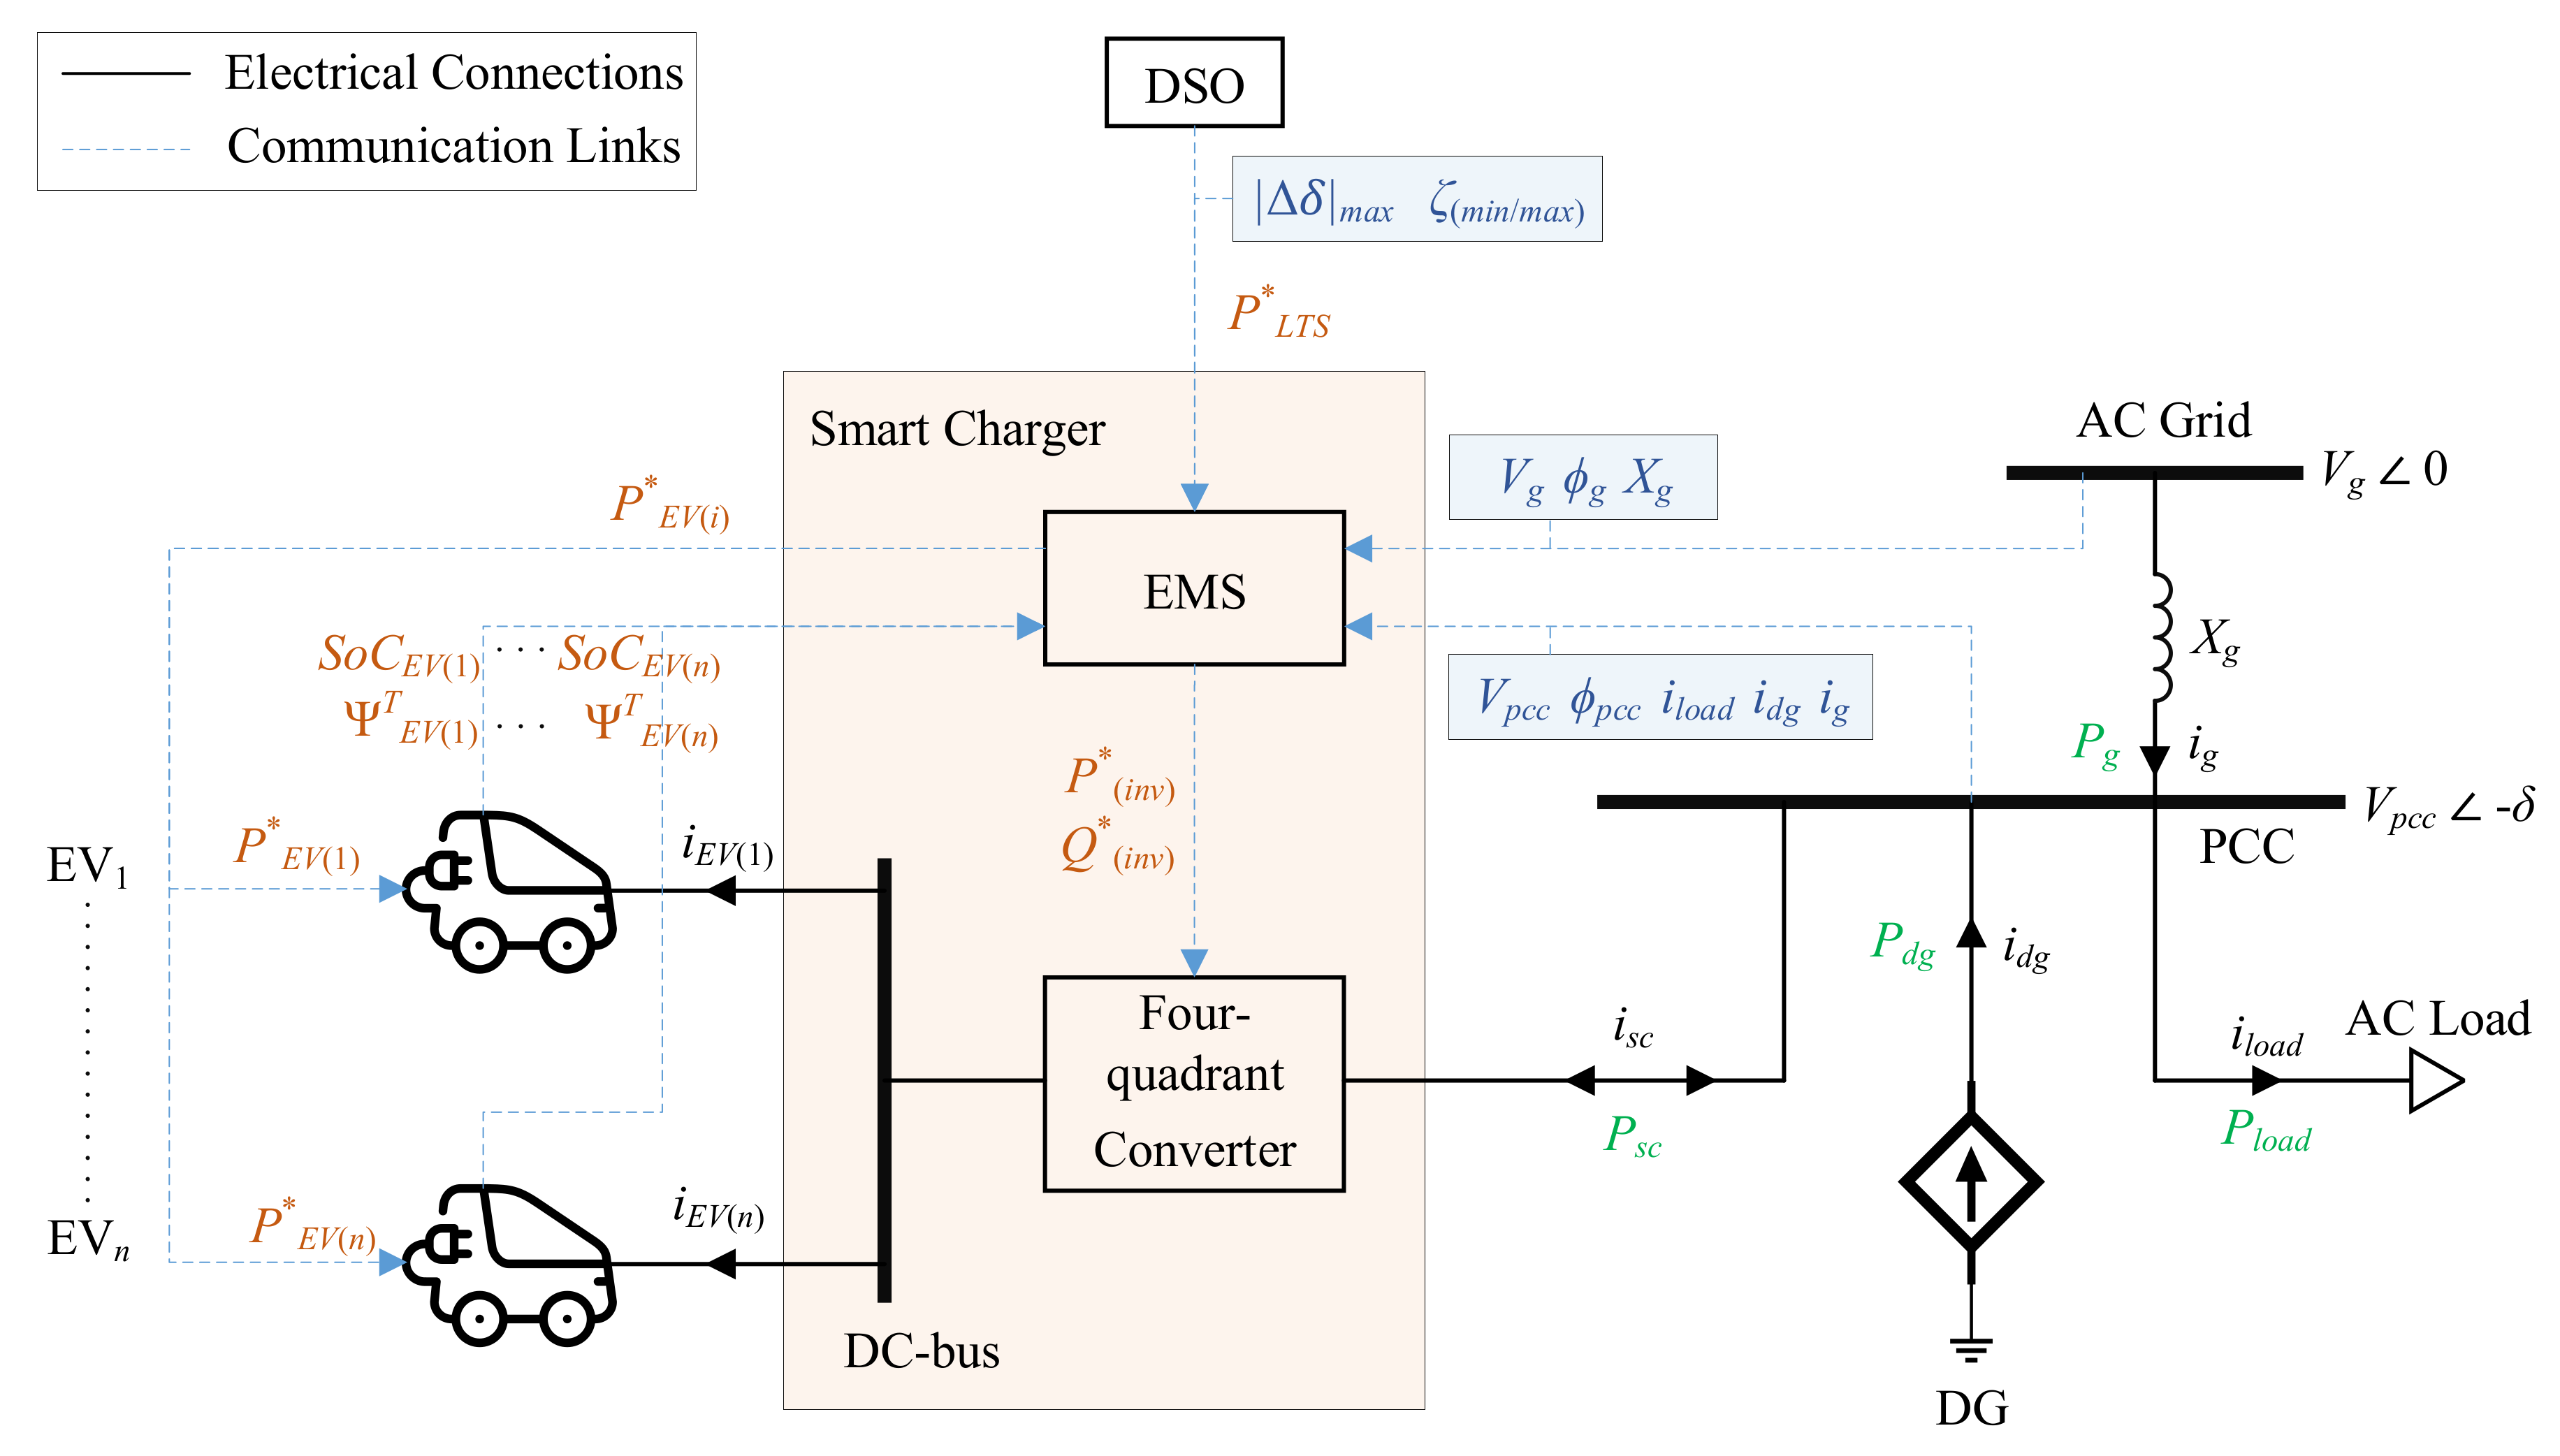
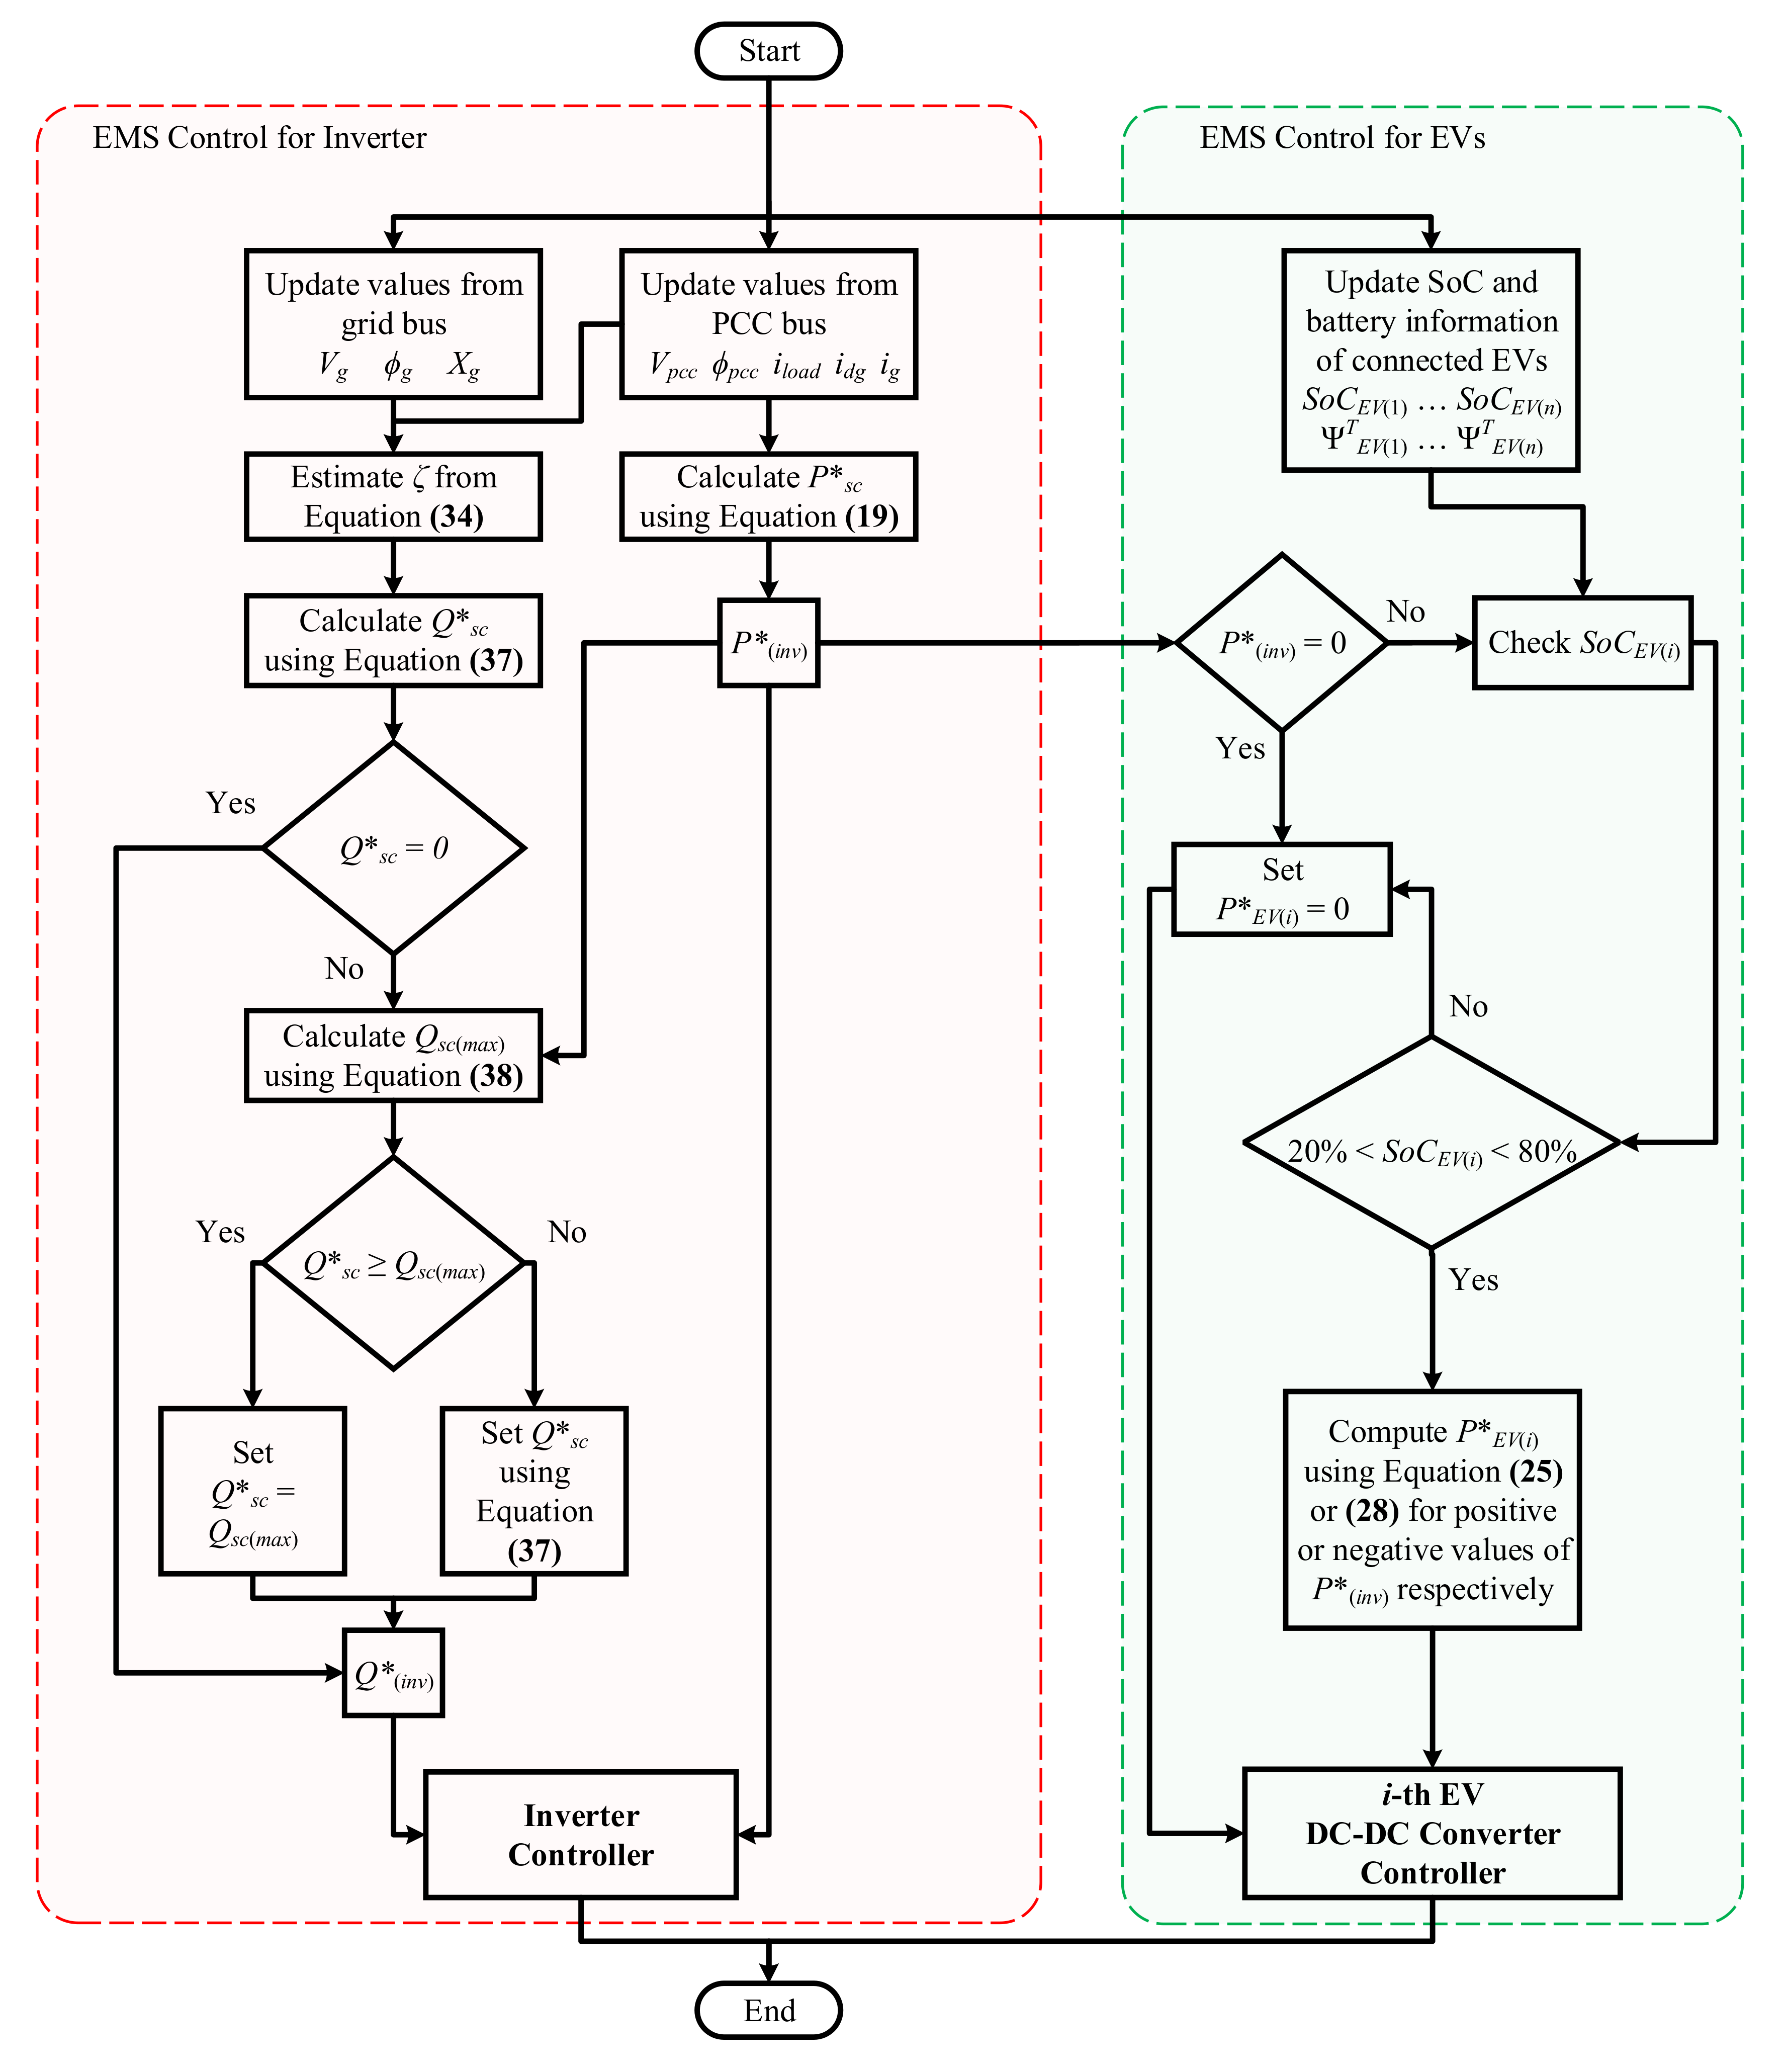
4. EMS for a Smart Charger

Utilizing EV battery capacities to provide active power ride-through for short-term renewables transients such as for photovoltaics during cloudy weather and wind turbines during variable wind speed is an appealing prospect. Moreover, making the EV charger capable of reactive power support for voltage regulation simultaneously further enhances its functionality.
In this study, we have proposed a comprehensive EMS, which calculates the P Q references instantaneously during grid disturbances for a three-phase fast charging station. The charger termed as a smart charger is composed of two main entities: a four-quadrant converter and the EMS to drive its operation (Figure 10).
The EMS is the key to designate the active and reactive power flows between the EV charger and the grid. The voltages, phase angles and currents are measured from the grid and the PCC and fed to the EMS. Furthermore, it takes the information from EVs regarding their SoC and battery capacities and distributes the energy accordingly among them. The EMS sends the reference signals to the grid-side three-phase four-quadrant converter controller and the EV side DC-DC converter controllers. The process through which the EMS derives the specific references for its various functionalities is detailed ahead.

4.1. Active Power Ride-Through

Consider the power system shown in Figure 10. The grid is transferring power P g = 100 kW to the PCC. A constant power load P l o a d = 250 kW with the unity power factor is connected to the PCC. A DG supplying P d g = 150 kW to the load is located in close vicinity to the PCC. When plugged in, the EVs connected to the smart charger are idle, charging or discharging based on the rate governed by the DSO. The EV power during such ongoing schemes is represented by P L T S , and this scenario is given by the following equation:
P g + P d g = P l o a d ± P L T S
A smart charger is authorized by the DSO to provide grid support whenever required. The primary objective of this power ride-through management subsystem is to designate the EV charging and discharging power to mitigate the short-term power imbalances caused by the DG. In the real world, the grids have power transfer limits due to line losses and thermal limitations. Therefore, the DSO defines the power transfer limit depending on the distribution line ampacity and distribution transformer rating.
During renewables’ power variance, the EMS calculates the active power reference P s c * for the smart charger. The low output from the DG corresponds to an increased power transfer from the grid to the PCC, and the EMS calls for V2G operation. In contrast, during surplus generation by the DG, the power transfer from the grid decreases, and the EVs are charged to absorb the surplus power, while the G2V improves the load factor. The total amount of active power required or to be consumed by EVs is calculated as follows:
P s c * = P l o a d ( P g + P d g )
where P g is fixed by the DSO (in this study: 100 kW). When P s c * is negative, EVs are charging, whereas they are discharging when the reference power is positive. The calculated power is subjected to a saturation block according to the kVA rating of the charger. The power reference P ( i n v ) * fed to the smart charger inverter is given by:
P ( i n v ) * = P s c * , P d g 150 kW 0 , otherwise
The power angle δ 0 indicates the power angle of preferred power transfer from the grid to the PCC, and the deviation of power angle from this value ( Δ δ ) is calculated as:
Δ δ = δ δ 0
The DSO also defines the magnitude of the maximum deviation from the preferred power angle Δ δ m a x . In this study, Δ δ m a x = 0.0125 rad is considered corresponding to a 100-kW power transfer.

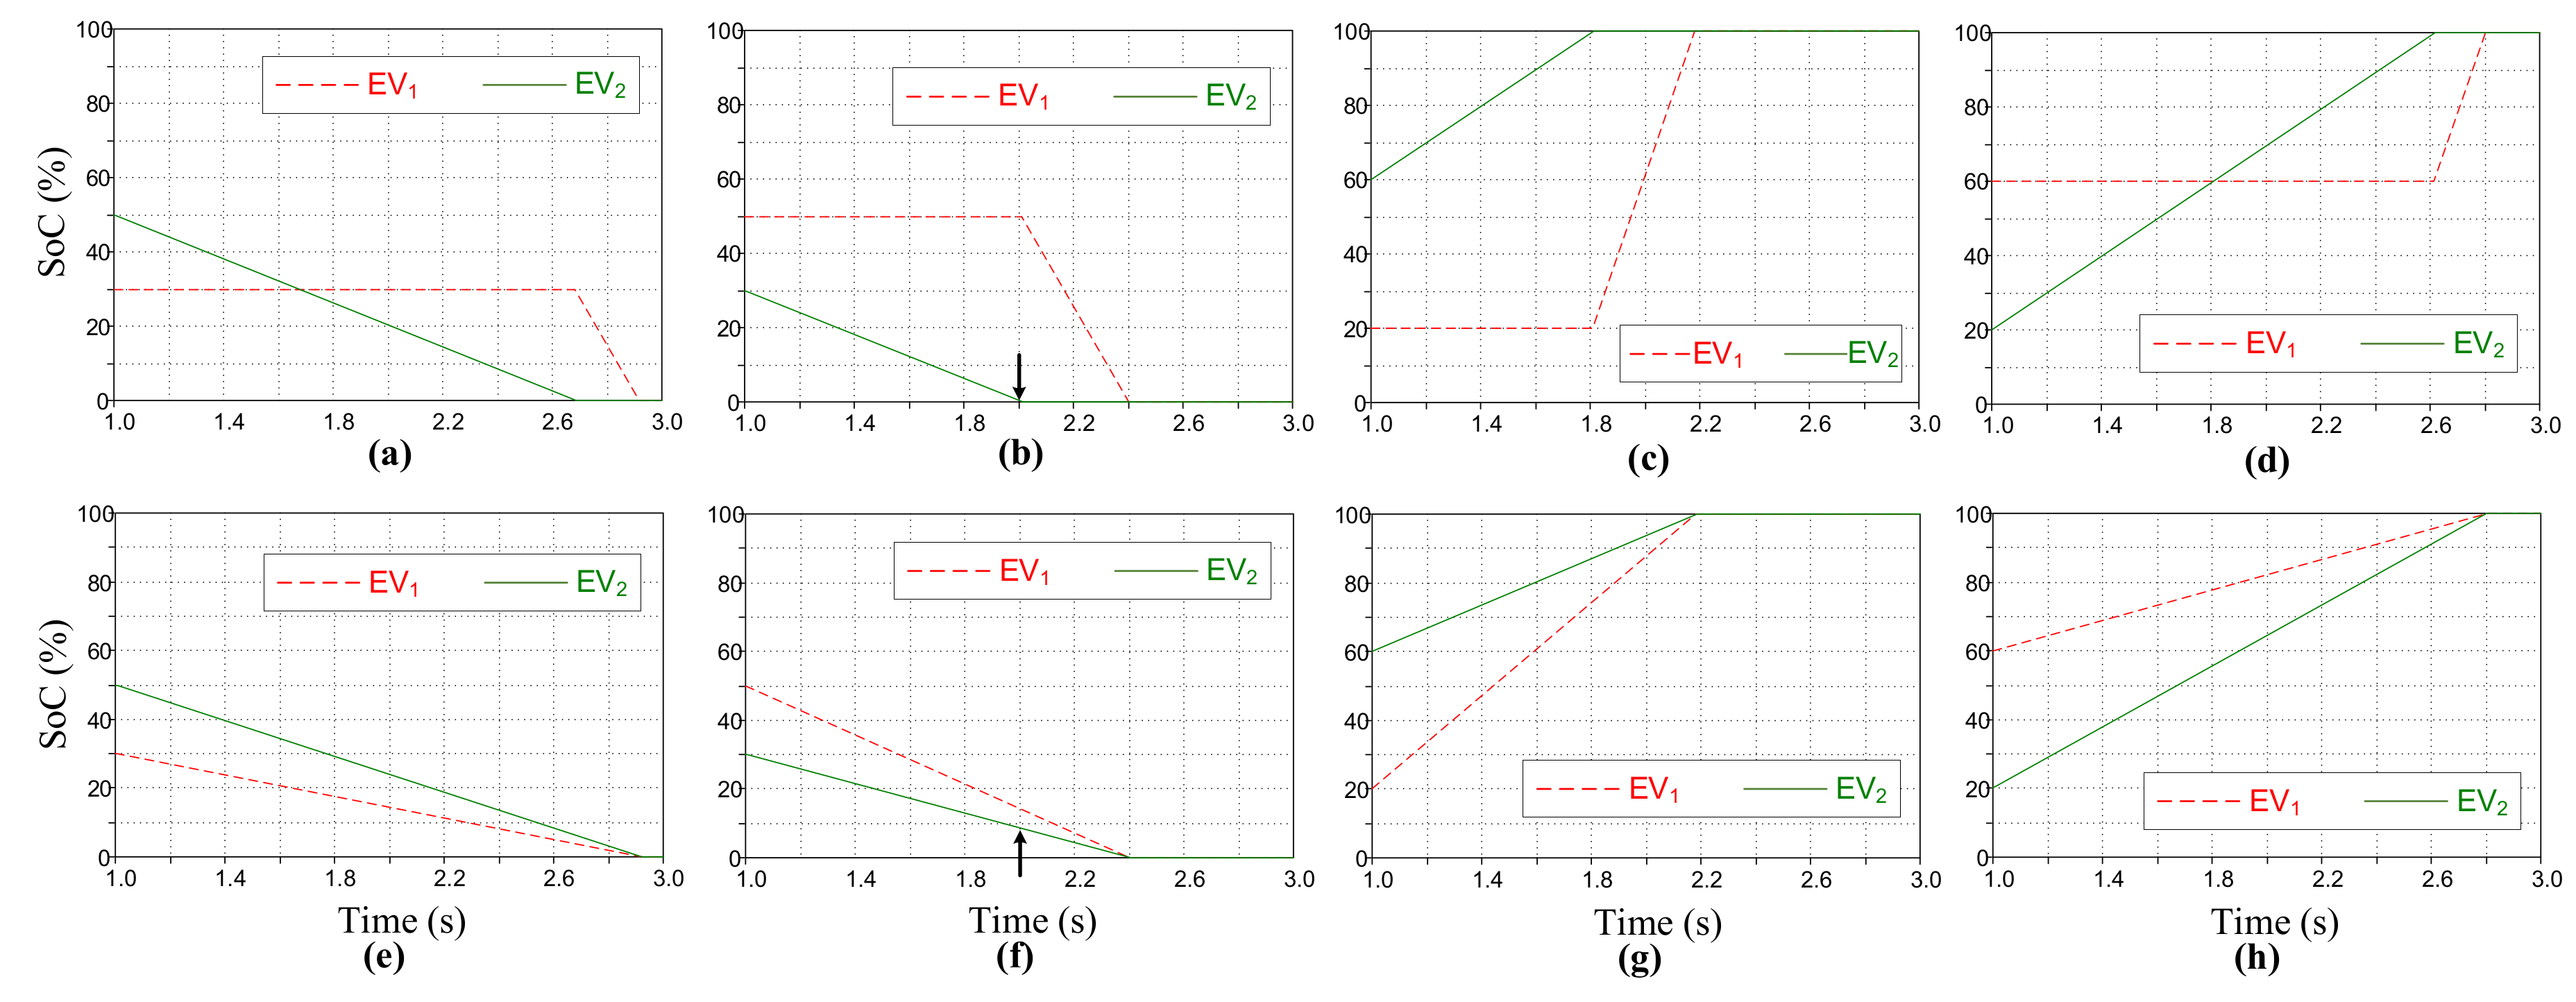
4.2. Proposed Power Allocation Method to EVs

As multiple EVs are connected to the grid near each other, the approach of creating EV fleets by aggregating the capacities of the EV batteries for ancillary services has come forth. However, the previous component-modeling level studies, which consider multiple EVs connected to a common DC-bus of the smart charger, have ignored this concept [15,16,20]. Previous research has established various methods for EV power allocation based on optimization procedures, which incorporate forecasting and have long time intervals and execution times [21,22,23]. These methods are not feasible for renewables with short-term variances, which require a fast and heuristic approach to deal with the EV power allocation objective. We have proposed a method for EV power distribution for V2G/G2V scenarios that serves to aggregate the EVs. The strategy functions within the EMS and updates the power references for individual EVs based on the ongoing status from the grid while also communicating with the EVs. The scheme is executed based on the rated battery capacity and SoC of EVs. The EVs participate in V2G/G2V with reference to the calculated on-board energy. During V2G, the EVs discharge to compensate the active power variance, and the power division among EVS is based on the available battery energy on-board. In the case of G2V, when the EVs charge from the surplus renewable output, the power is allotted among the EVs according to the energy required for the full state of charge, thus following a similar logic. A significant advantage of this scheme is that it can serve to aggregate various types of EVs with different sizes of battery banks. Though this scheme is initially proposed for a single fast charging station, it can be extended to multiple chargers by introducing coordination among them.
The total rated aggregated battery capacity Ψ T of n EVs connected to the DC-bus of the smart charger is given by:
Ψ T = i = 1 n Ψ E V ( i ) T
where Ψ E V ( i ) T is the rated battery capacity of the i-th EV. The available energy Ψ E V ( i ) A v l of any i-th EV can be calculated using its current SoC S o C E V ( i ) as:
Ψ E V ( i ) A v l = Ψ E V ( i ) T × S o C E V ( i )
Therefore, the aggregated available energy Ψ ( n ) E V s A v l of n EVs is:
Ψ ( n ) E V s A v l = i = 1 n Ψ E V ( i ) T × S o C E V ( i )
Based on the available energy of an EV and the total available energy calculated, the individual power reference allocated to an EV for discharging during V2G is given by:
P E V ( i ) * = Ψ E V ( i ) A v l Ψ ( n ) E V s A v l P ( i n v ) *
Conversely, the charging power of each EV is estimated using the energy required for a full charge. The required energy Ψ E V ( i ) R e q of the i-th EV can be calculated as:
Ψ E V ( i ) R e q = Ψ E V ( i ) T Ψ E V ( i ) A v l
and the aggregated required energy Ψ ( n ) E V s R e q of n EVs is:
Ψ ( n ) E V s R e q = i = 1 n Ψ E V ( i ) T Ψ E V ( i ) A v l
Thus, for charging the EV during G2V, the individual EV power is:
P E V ( i ) * = Ψ E V ( i ) R e q Ψ ( n ) E V s R e q P ( i n v ) *
and the total power from all EVs should satisfy the following condition:
i = 1 n P E V ( i ) * = P ( i n v ) *
The i-th EV’s power for the DC side is:
P E V ( i ) = V d c × i E V ( i ) = V b ( i ) × i b ( i )
where i E V ( i ) is the current flowing in or out of the DC-DC converter of the i-th EV. Based on this power, the EV battery charging/discharging current reference i b ( i ) * of the i-th EV is calculated as follows:
i b ( i ) * = P E V ( i ) * V b ( i )
P E V ( i ) * is subjected to the SoC to stay within 20% and 80% limits. The functioning of the EV power allocation can be summarized as follows:
P E V ( i ) * = Ψ E V ( i ) A v l Ψ ( n ) E V s A v l P ( i n v ) * , P ( i n v ) * > 0 20 % < S o C E V ( i ) < 80 % Ψ E V ( i ) R e q Ψ ( n ) E V s R e q P ( i n v ) * , P ( i n v ) * < 0 20 % < S o C E V ( i ) < 80 % 0 , P ( i n v ) * = 0 0 , P ( i n v ) * 0 S o C E V ( i ) < 20 % S o C E V ( i ) > 80 %
The SoC value S o C E V ( i ) of the i-th EV is sent to the EMS as:
S o C E V ( i ) = S o C E V ( i ) 0 ± t 1 t 1 + τ i b ( i ) d t φ b ( i ) T
where S o C E V ( i ) 0 is the initial SoC of the i-th EV when the EV is parked and plugged in and φ b ( i ) T is the rated ampere-hour battery capacity of the i-th EV. Identical power can be assigned to different individual EVs based on the following two cases:
  • The EVs have the same battery type and the same SoC.
  • For different battery types; equal energy is available on-board each EV.

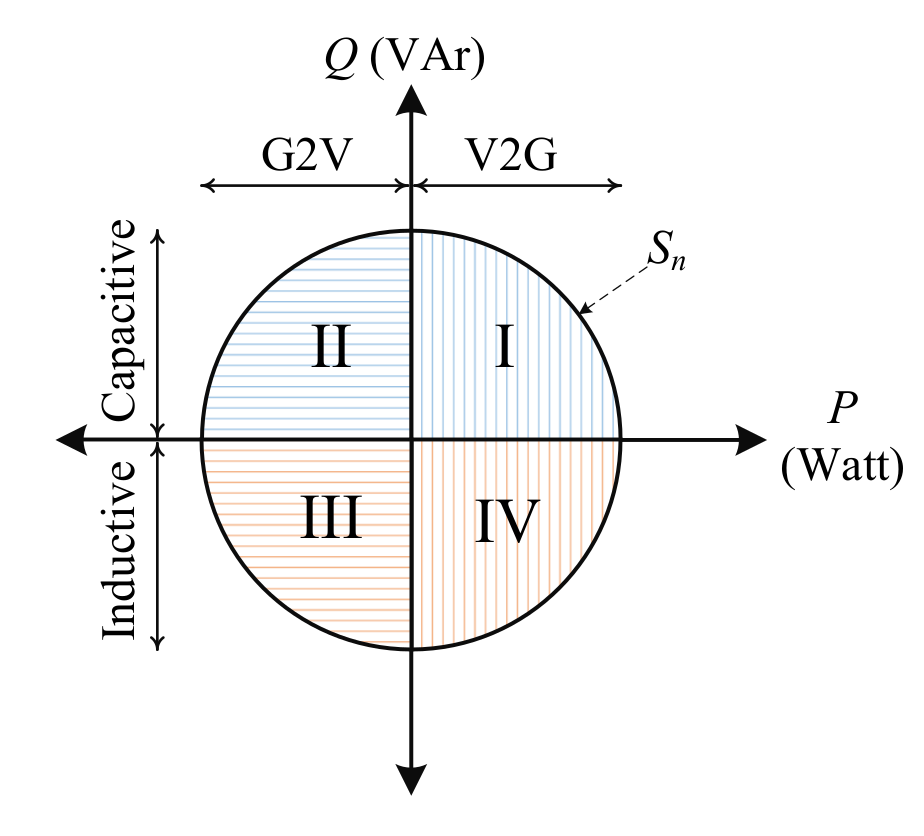
4.3. Reactive Power Support for Voltage Regulation

The smart charger also serves to regulate the voltage at the PCC bus with its reactive power action. In this study, voltage sag and swell are induced by the consumption and production of reactive power, respectively. The DC-link capacitor is sufficient for reactive power operation, and the EV battery energy is not utilized. Thus, the presence of EVs at the charger is not a concern. This feature enables the stationary off-board smart charger to be capable of providing reactive support at all times. Reactive power is controlled by shifting the current phase angle to provide inductive or capacitive action. The voltages are computed in RMS, and the balanced sag or swell factor ζ can be calculated for each phase as:
ζ = V p c c V p c c 0
where V p c c is the operational RMS PCC voltage measured at all instances and V p c c 0 is the RMS PCC voltage in normal conditions. In systems with a low impedance between the adjacent buses as assumed in this study, the voltage on adjacent buses is almost equal during normal conditions, i.e., V p c c 0 V g . Therefore,
ζ = V p c c V g
Rearranging the reactive power transfer equation and using Equation (35), we can derive the reactive power as a function of sag or swell factor ζ given by:
Q s c * = V g 2 X g ( 1 ζ cos δ )
and when the power angle δ < 20 , Equation (36) reduces to the following:
Q s c * = V g 2 X g ( 1 ζ )
The Q s c * reference calculated by the EMS is forwarded to the inverter controller as Q ( i n v ) * . The negative sign of Q means inductive operation, and the charger absorbs the reactive power, decreasing the voltage and supporting swell suppression. Positive Q implies capacitive action, and the charger supplies the reactive power to improve voltage sag. The maximum reactive power capability of the charger is calculated by using the following equation.
Q s c ( m a x ) = S n 2 ( P s c * ) 2
The full reactive power support can be provided by the charger when P s c * = 0 . While the EVs are absorbing maximum power P s c = S n , reactive support cannot be provided. Therefore, it is a recommended practice to increase the charger kVA rating by 10% to 20% above the maximum active power to keep the charger capable of reactive power support at all times [1]. In summary,
Q ( i n v ) * = V g 2 X g ( 1 ζ ) , ζ 0 Q s c * < Q s c ( m a x ) S n 2 ( P s c * ) 2 , ζ 0 Q s c * Q s c ( m a x ) S n , ζ 0 P s c * = 0 0 , ζ = 1

4.4. EMS Control Flow Process

For a better understanding, this section states the control flow process of the EMS. The EMS consists of two primary sub-control operations that work in parallel: the control for the smart charger inverter and the DC-DC converter of EVs. The inverter control further comprises two parallel processes for active and reactive power. The sub-control mechanisms coordinate with each other within the progression of the control structure. The following steps describe the multi-stage control flow of the EMS:
  • At each time step, the EMS updates the values of voltages, currents and phase angles from the grid and PCC. The information regarding the EV SoC is updated from the EVs. Since the rated battery capacity is a constant during the whole control process, it is determined from the EV upon the initial connection with the smart charger.
  • In the second stage, the smart charger active and reactive power references are calculated from Equations (19) and (37). All the required values to be utilized in these equations are adopted from the first step.
  • The P ( i n v ) * reference calculated is final, while the other references Q ( i n v ) * and P E V ( i ) * coordinate with it to calculate their conclusive values. The reactive power block receives the reference P ( i n v ) * to calculate the maximum reactive power capacity Q s c ( m a x ) . Further, it checks that the calculated reactive power reference is within reactive capability. If this condition is breached, the reactive reference is set as Q s c ( m a x ) . Simultaneously, the EV control block checks the P ( i n v ) * reference and the SoC constraints for the EVs and calculates the power references for individual EVs based on the proposed proportional methodology.
  • The computed references P ( i n v ) * and Q ( i n v ) * are fed to the inverter controller, while P E V ( i ) * is fed to the controller of the DC-DC converter of the i-th EV. The control advances to the next time step.
The EMS sets the charge/discharge rate of each EV during steady state, as well as under dynamic grid conditions. It updates the available charging capacity of the smart charger upon entry or exit of each EV from its DC-bus. The number of EVs connected to the charger depends on the charging power P E V ( i ) * set for all the connected EVs and S n , as stated below:
i = 1 n P E V ( i ) * S n
The complete workflow within the EMS is shown in Figure 11. Differential DG power is supplied by the EVs to the grid, while the remaining charger capacity can be utilized for reactive power operation. The smart charger reactive power capability Q s c depends on the maximum reactive power capacity Q s c ( m a x ) , which is calculated from the active power reference given to the inverter P ( i n v ) * . Therefore, active power has priority over reactive power compensation.

5. Simulation Conditions

The simulations have been performed on EMTP/ATPDraw. Two EVs E V 1 and E V 2 are connected to the smart charger DC-bus in the idle mode; thus, P L T S = 0 . The parameter values for this study are listed in Table 3. The initial SoC of each EV ( S o C E V ( i ) 0 ) is determined by using:
S o C E V ( i ) 0 = d E V ( i ) T d E V ( i ) A v g d E V ( i ) T
where d T is utilized from Table 1, and the average daily distance ( d a v ) covered by the EV is assumed as follows:
  • The average daily distance covered by a car is 32.6 km [44].
  • School bus operation is more feasible to study from an EV perspective, as such buses do not make multiple trips throughout a day, as public transport buses do. The average mileage of a school bus is 80.5 km [45,46].
Thus, the initial SoC of E V 1 is calculated as 75%= and E V 2 as 50%. It is a reasonable approach to consider the same driving patterns for conventional vehicles and EVs [47].
We have assumed 1 h = 1 s in this study to reduce the simulation time. Henceforth, the Ampere-hour capacity of battery correlates to Ampere-second in Equation (33) for SoC calculation. This assumption also signifies the changes in SoC during EV battery charge/discharge operations.
If the variation factor of DG power is Υ d g , then the power mismatch Δ P d g is given by:
Δ P d g = Υ d g × P d g
The power capacity of a smart charger should be enough to absorb or provide the differential energy because of the renewable DG, and thus, the condition P s c Δ P d g should be satisfied. This condition proves to be an essential basis for determining the smart charger rating ( S n ), and thus, accordingly, S n Δ P d g . With a variation Υ d g of ±50% considered, the kVA rating of smart charger S n is set to be 150 kVA.

6. Results and Discussion

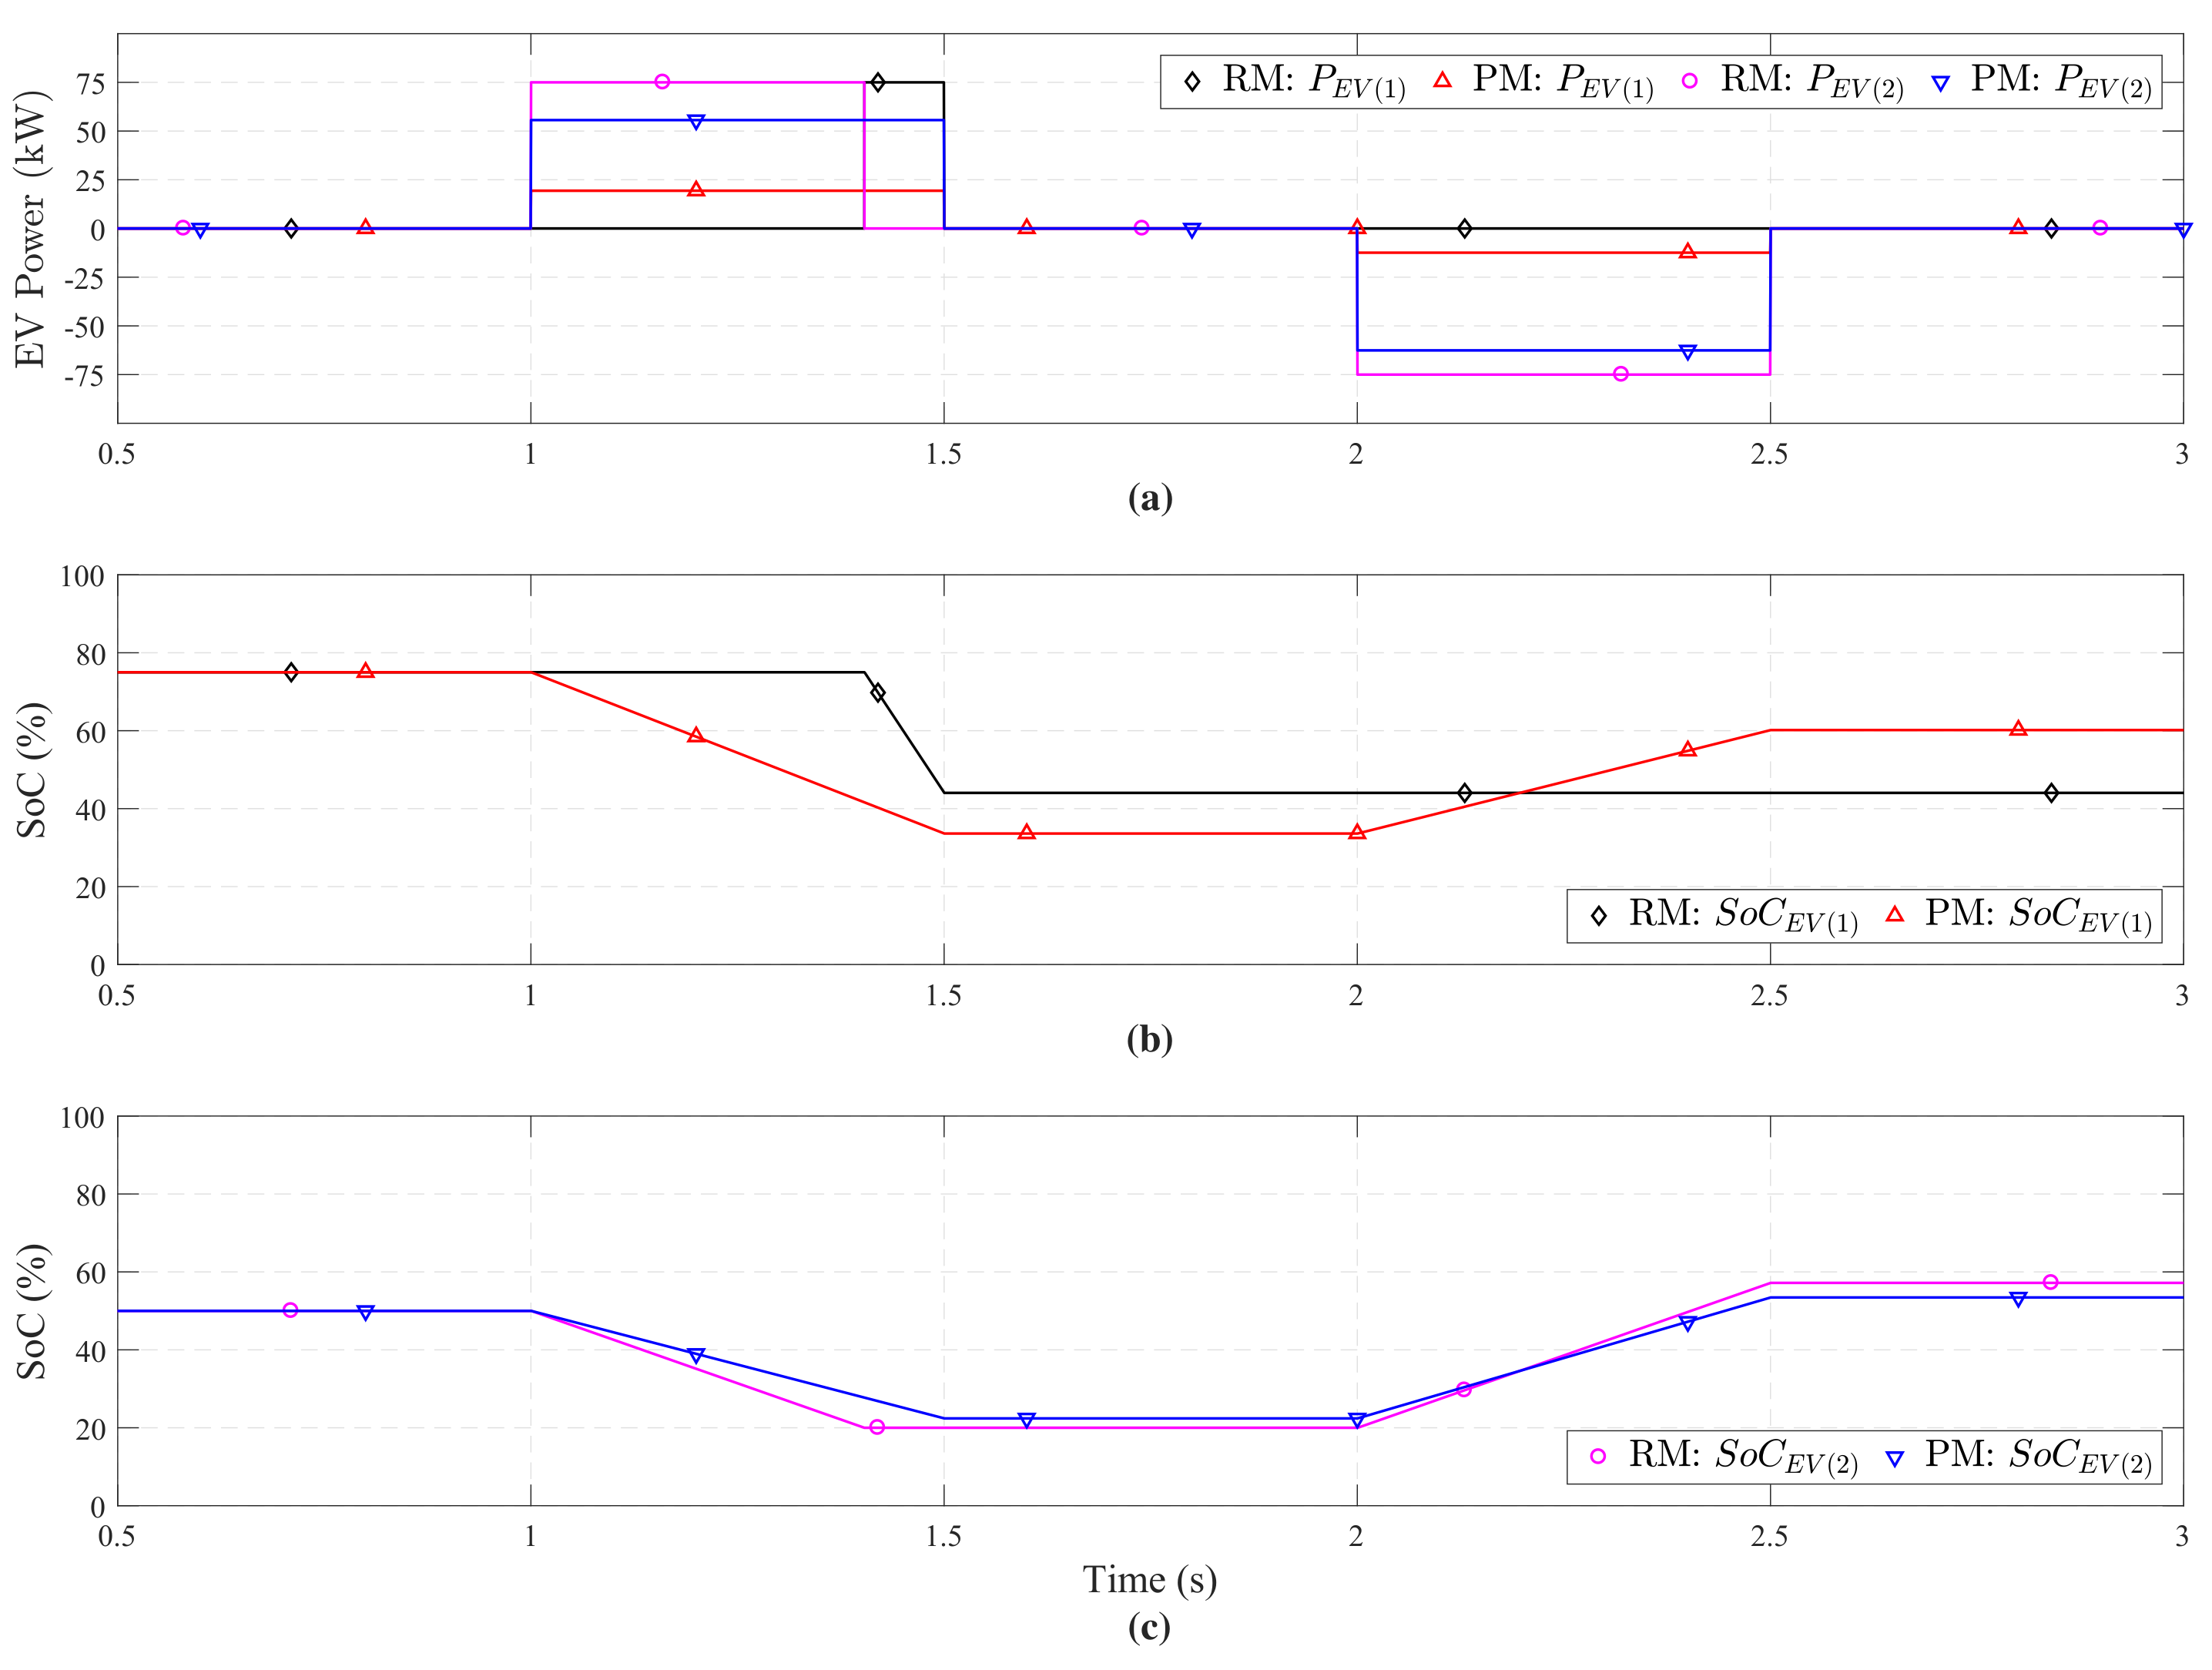
6.1. Power Allocation Schemes Comparison

Firstly, the proposed power allocation method is tested in parallel with another power allocation method to verify its functionality. A general comparison is drawn with a battery capacity-based strategy [24], in which the batteries charge or discharge in descending order of their rated capacity. This comparison of both schemes is independent of the EMS control process. Hence, the constraints of 20% to 80% SoC are not applied here to show the behavior for a full battery discharge and charge. Eight simulations have been executed to study the SoC profiles of EV batteries under the discharging and charging scenarios, with four simulations for each method. The total power assigned to the smart charger to be distributed between the two EVs is 50 kW for the charging cases and 30 kW for discharging. The EVs are allowed to charge or discharge completely. The cases are simulated for the initial SoC of E V 2 greater than E V 1 and vice versa.
Considering the reference method (RM) for power allocation [24], since the battery capacity of E V 2 is greater than E V 1 (Table 1), E V 2 should be fully charged or discharged first, and afterward, E V 1 is engaged. This practice is shown in Figure 12a–d. On the contrary, the proposed scheme employs both EVs simultaneously for discharging and charging (Figure 12e–h). It considers the battery size, as well as the current SoC and calculates the power references for each EV proportionate to the instantaneous energy stored on-board the EV.
According to the reference method, the bigger battery should be engaged first for discharging, though it might have a low SoC, which can result in swift depletion. This aspect can be observed in Figure 12b, where the SoC of E V 2 is at a low value, and it is depleted quicker, as compared to the proposed scheme (Figure 12f), where E V 2 still has energy left (10% SoC) at the same time instant.
Thus, if the batteries are discharged till the t = 2 s mark, the E V 2 is depleted fully for the reference method as compared to the proposed approach. The reference power allocation scheme is undesirable from the E V 1 owner’s perspective as it causes battery degradation by reducing the number of life cycles [30].
In case of charging, according to the reference technique, the E V 2 is charged to 100% SoC quicker, and E V 1 has to wait for its turn as shown in Figure 12c,d. This outcome is undesirable for the E V 1 owner. Therefore, the battery capacity-based power allocation mechanism is a source of discontentment for both EV owners in different scenarios. Conversely, the proposed method is a favorable alternative to keep all EVs satisfied as the power has been allocated to them according to their on-board energy. Though the EVs charge or discharge at various rates, they complete charging or discharging at the same time.
The following cases verify the overall functionality of the EMS incorporating the power allocation schemes.

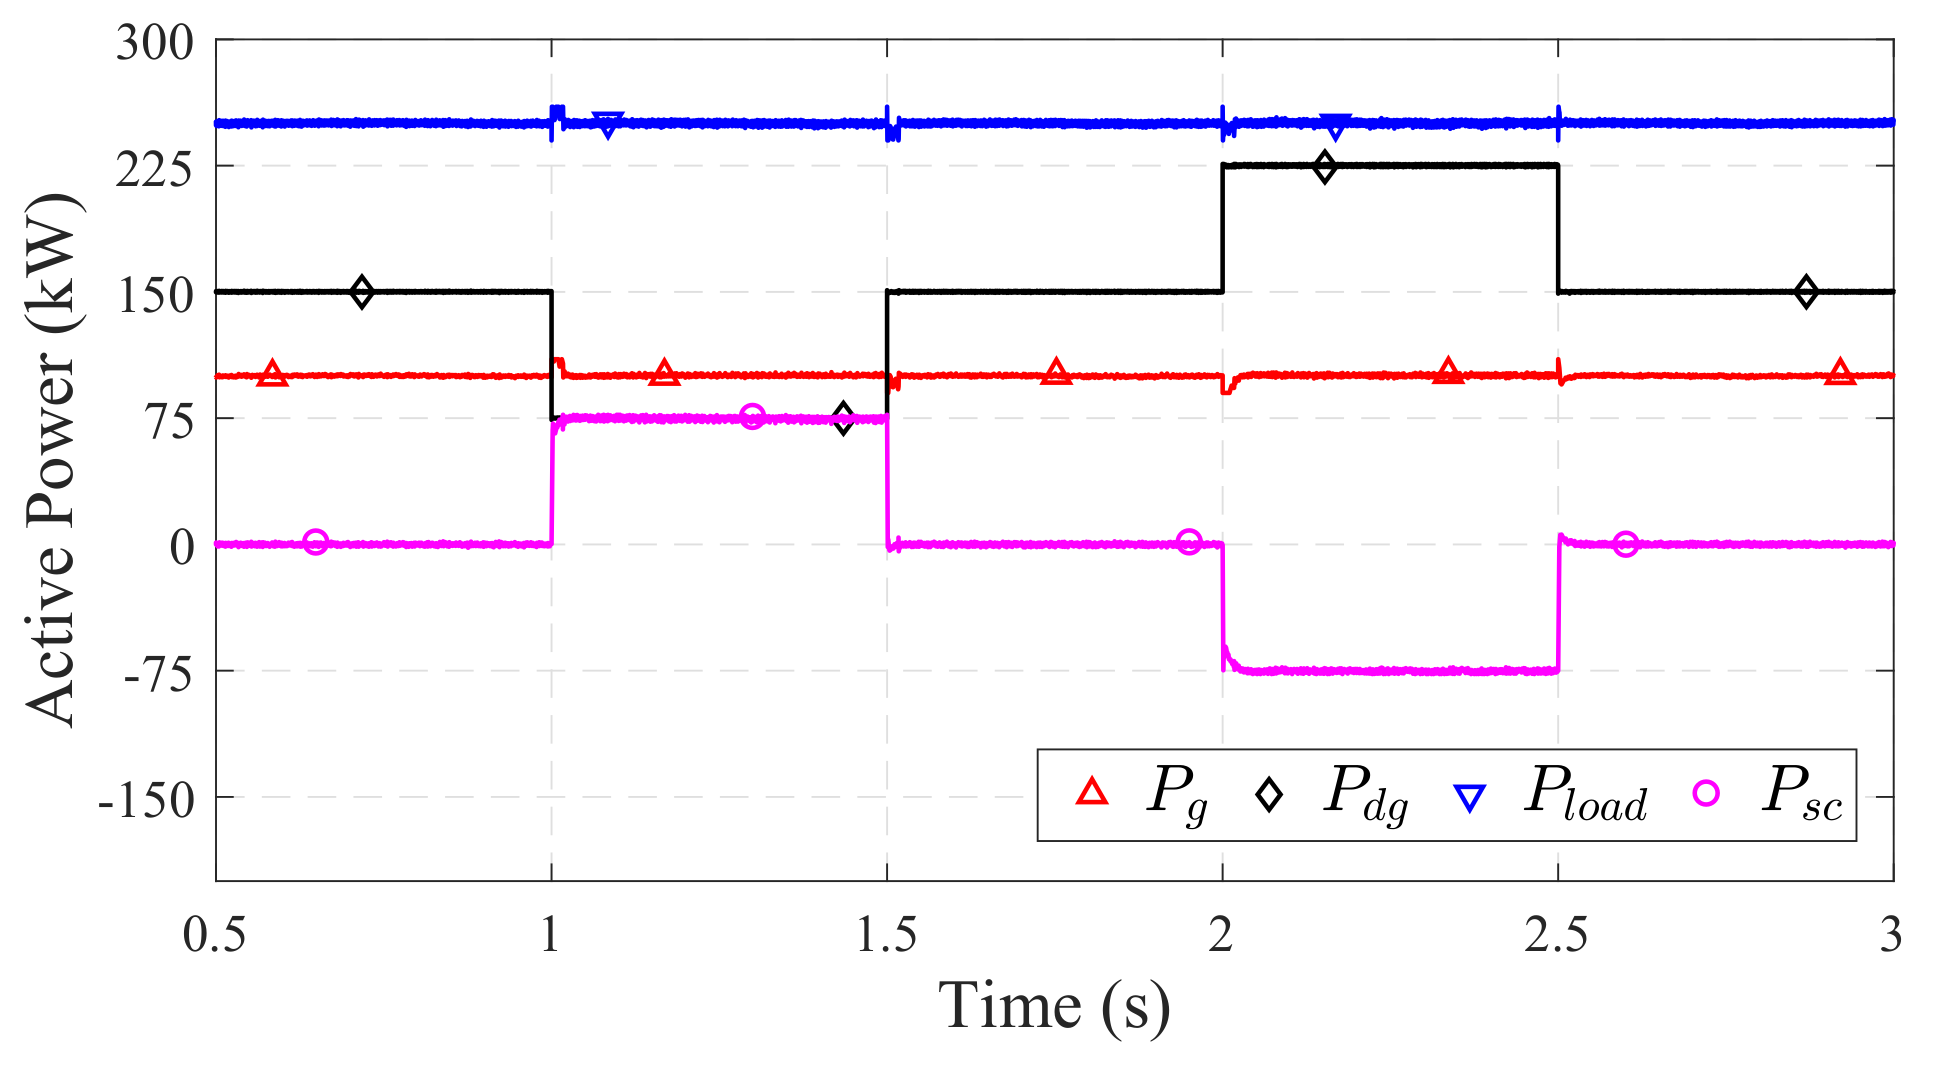
6.2. DG Power Fluctuation Case

In this case, the DG changes its mean output power P d g = 150 kW with a variation factor Υ d g of ± 50 % . The smart charger participates in V2G and G2V action to compensate for the power mismatches and keep the grid power P g constant as shown in Figure 13. The load requirement is fulfilled from the DG, the grid and the EVs. Since the power transfer from the grid varies under DG power fluctuation, the load factor is calculated to be 57.14% without smart charger application. With V2G/G2V support, the load factor becomes 100%.
Figure 14 shows that the change in power angle magnitude Δ δ surpasses the limit Δ δ m a x of 0.0125 rad set by the DSO without a smart charger, while Δ δ stays approximately zero with EV support.
The EMS calculates the active power reference P ( i n v ) * to be given to the controller of the smart charger inverter, and at the same time, it checks the status of the EVs and calculates the power references for the EVs. Figure 15a shows a comparison of power supplied and consumed by the EVs for the two power allocation approaches during the DG output variance. The proposed method provides better coordination among the EVs and manages the energy appropriately, as compared to the reference technique. Figure 15b,c shows that during V2G, the E V 2 is employed in the reference method till it touches the 20% low SoC boundary, and after that, the smaller E V 2 is engaged and its SoC depleted to 44%. Subsequently, during the G2V period, only E V 2 charges to 57% SoC, and E V 1 is unable to participate.
On the contrary, with the proposed method, both EVs are employed in accordance with their on-board battery energy and show improved SoC results at the end of the simulation period. Especially E V 1 gets to participate in the G2V operation, and its final SoC is 60%, indicating an improvement from the reference case. The final SoC differences for E V 2 is marginal for both schemes. Table 4 demonstrates that the proposed scheme is a distributed strategy, with the application of each EV in the aggregation indicating a utilization factor of 100%.

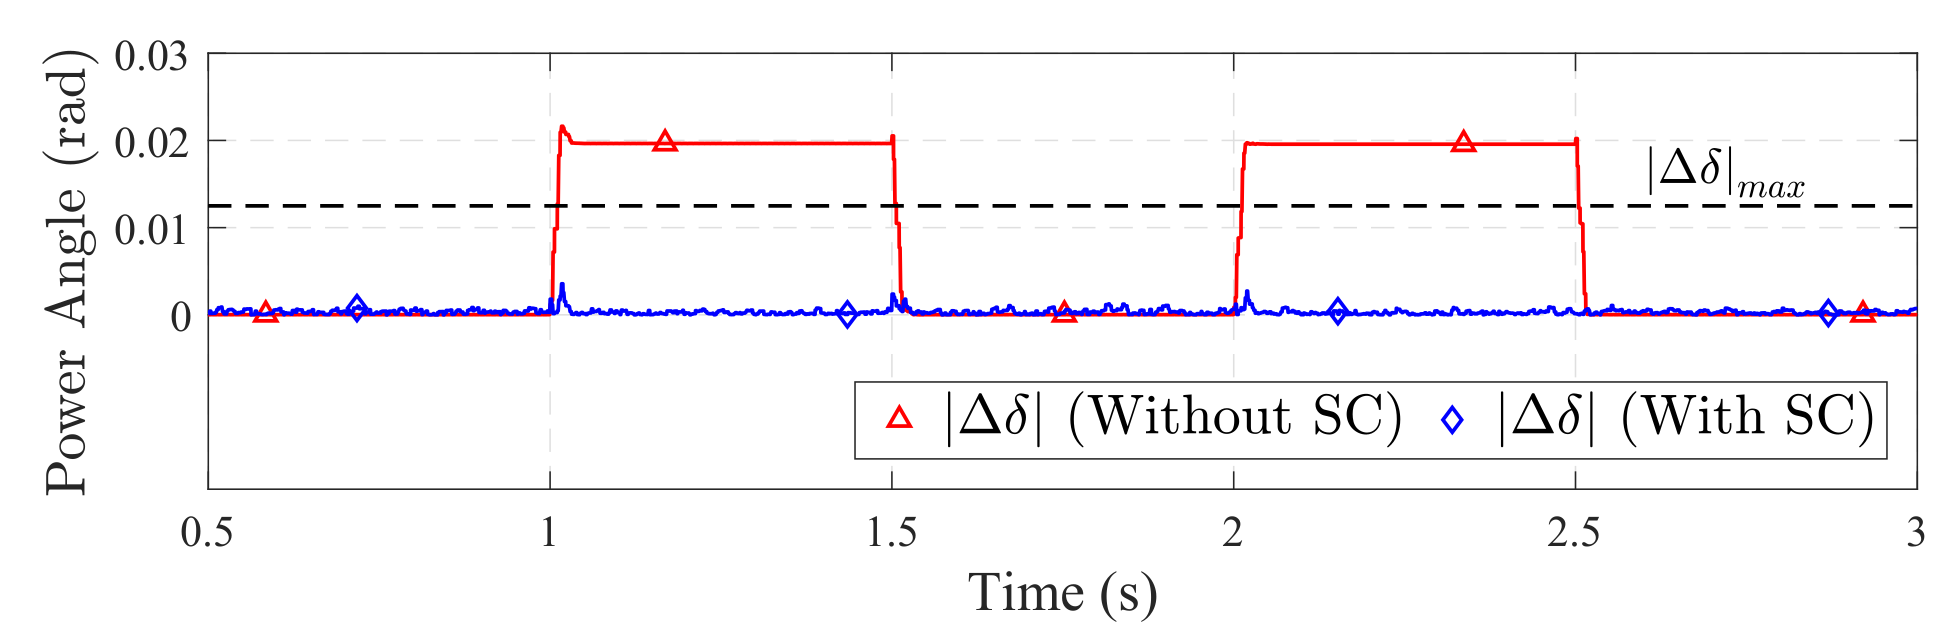
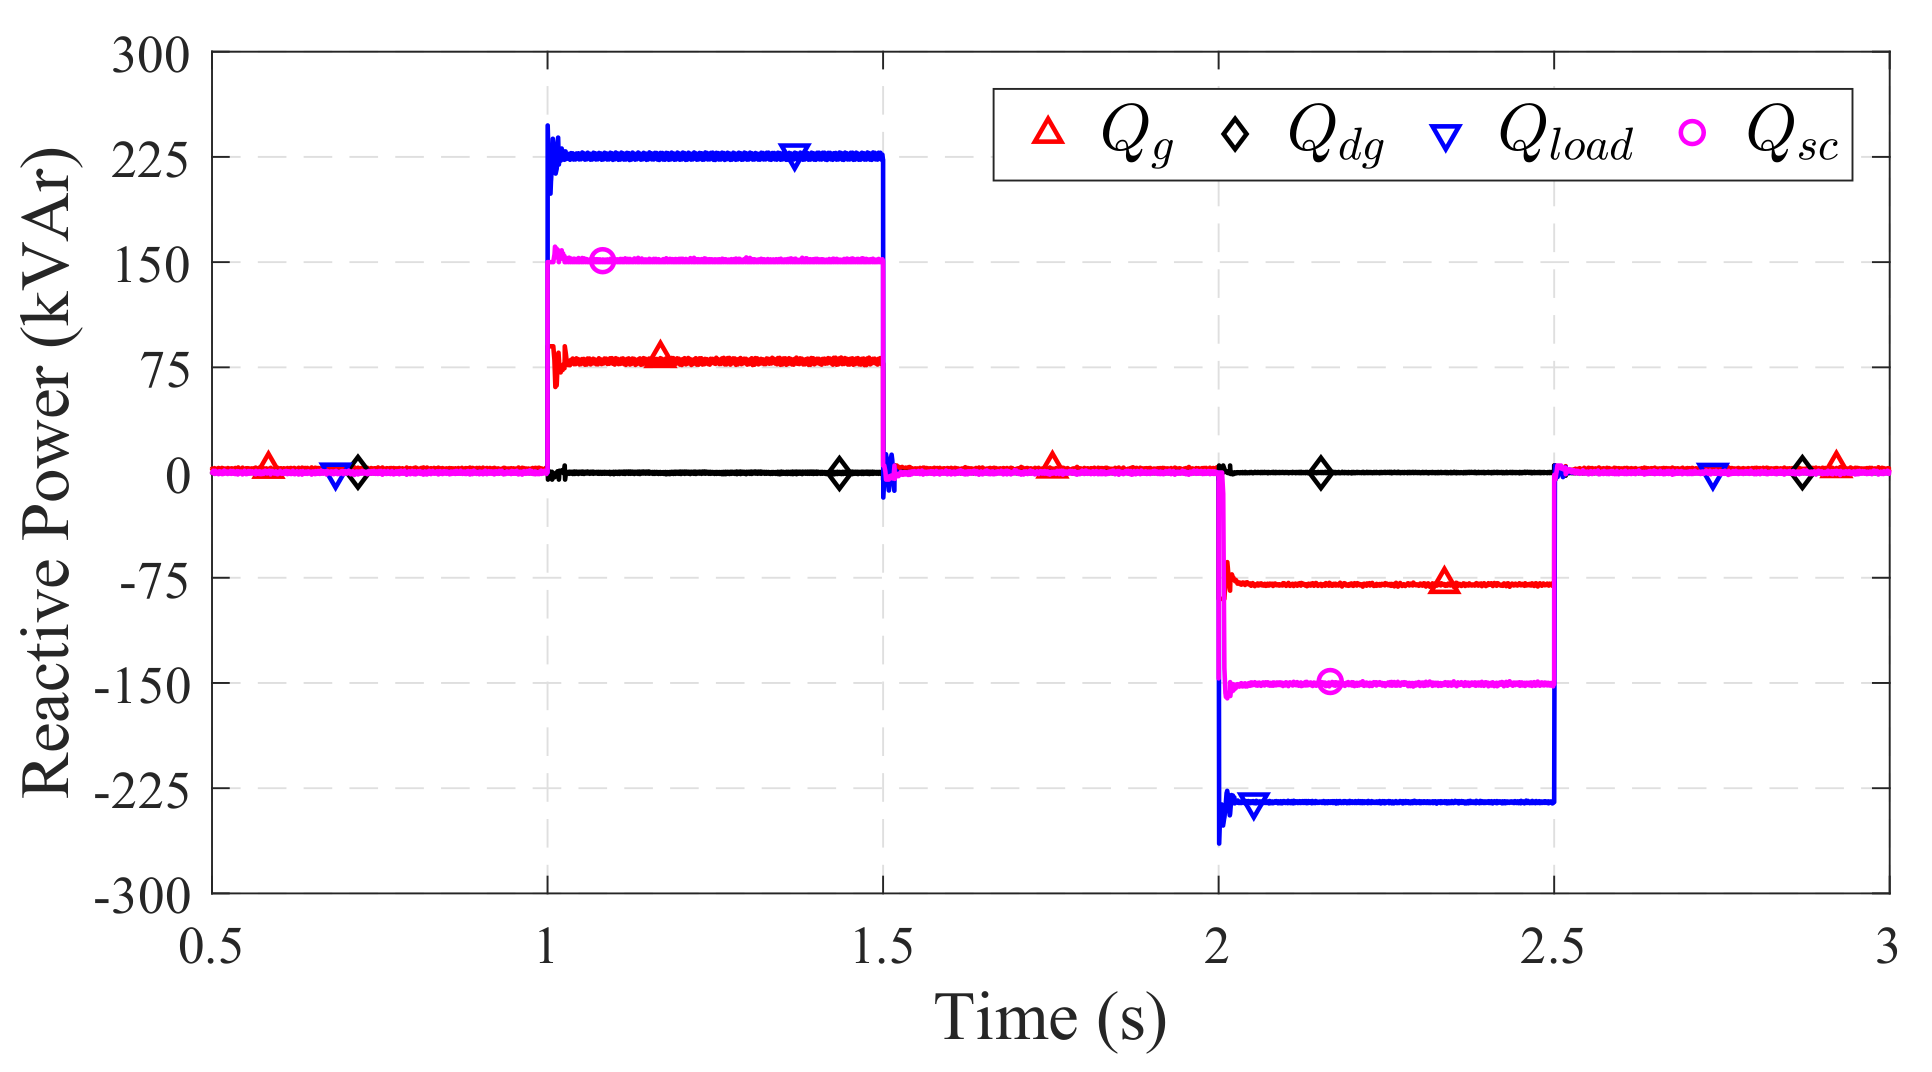
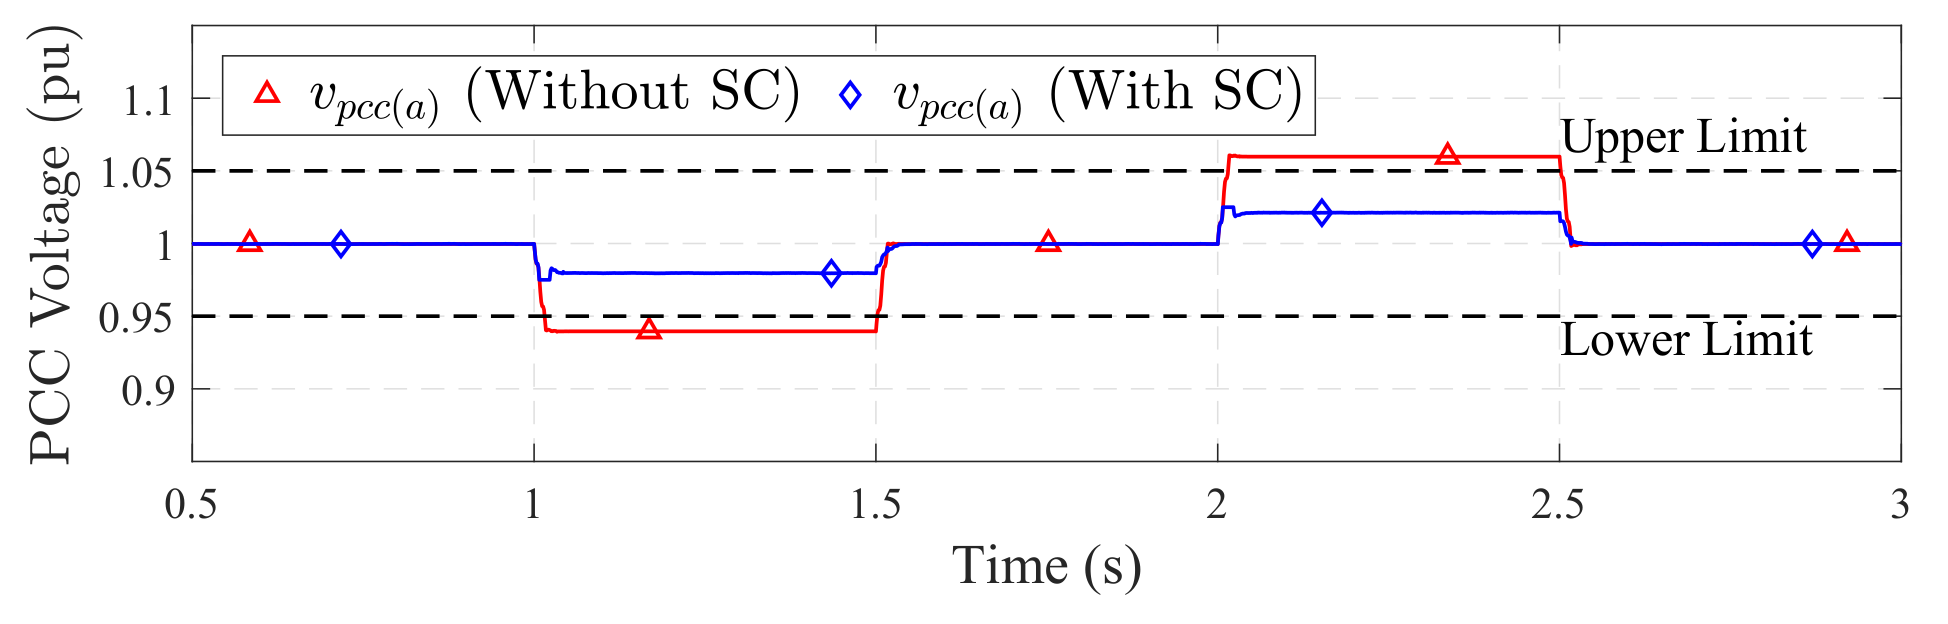
6.3. Voltage Regulation

The EMS also drives the reactive power support of the smart charger under voltage sag or swell during reactive load onset. As shown in Figure 16, the period t = 1 s to 1.5 s is represented by a large consumption of 216 kVAr, while from t = 2 s to 2.5 s, there is a significant production of reactive power at the load end. These events are accommodated by the smart charger to lessen the stress on the grid. The EMS calculates reactive power to be provided or consumed to compensate the sag and swell, respectively.
The load consuming reactive power brings about a sag at the PCC voltage, which is indicated in Figure 17 (without SC). The voltage sags below the lower limit of 0.95 pu defined for normal operation [48]. On the contrary, the reactive power produced at the load end is absorbed by the grid, thus producing a swell, and the PCC voltage surpasses the upper limit of 1.05 pu. With smart charger employment and zero active power requirements, the full capacity of the smart charger is utilized for reactive support to bring the voltage within limits, as shown in Figure 17 (with SC).
Furthermore, the reactive power services provided by the smart charger do not engage the EV batteries at all, as can be seen from Figure 18.

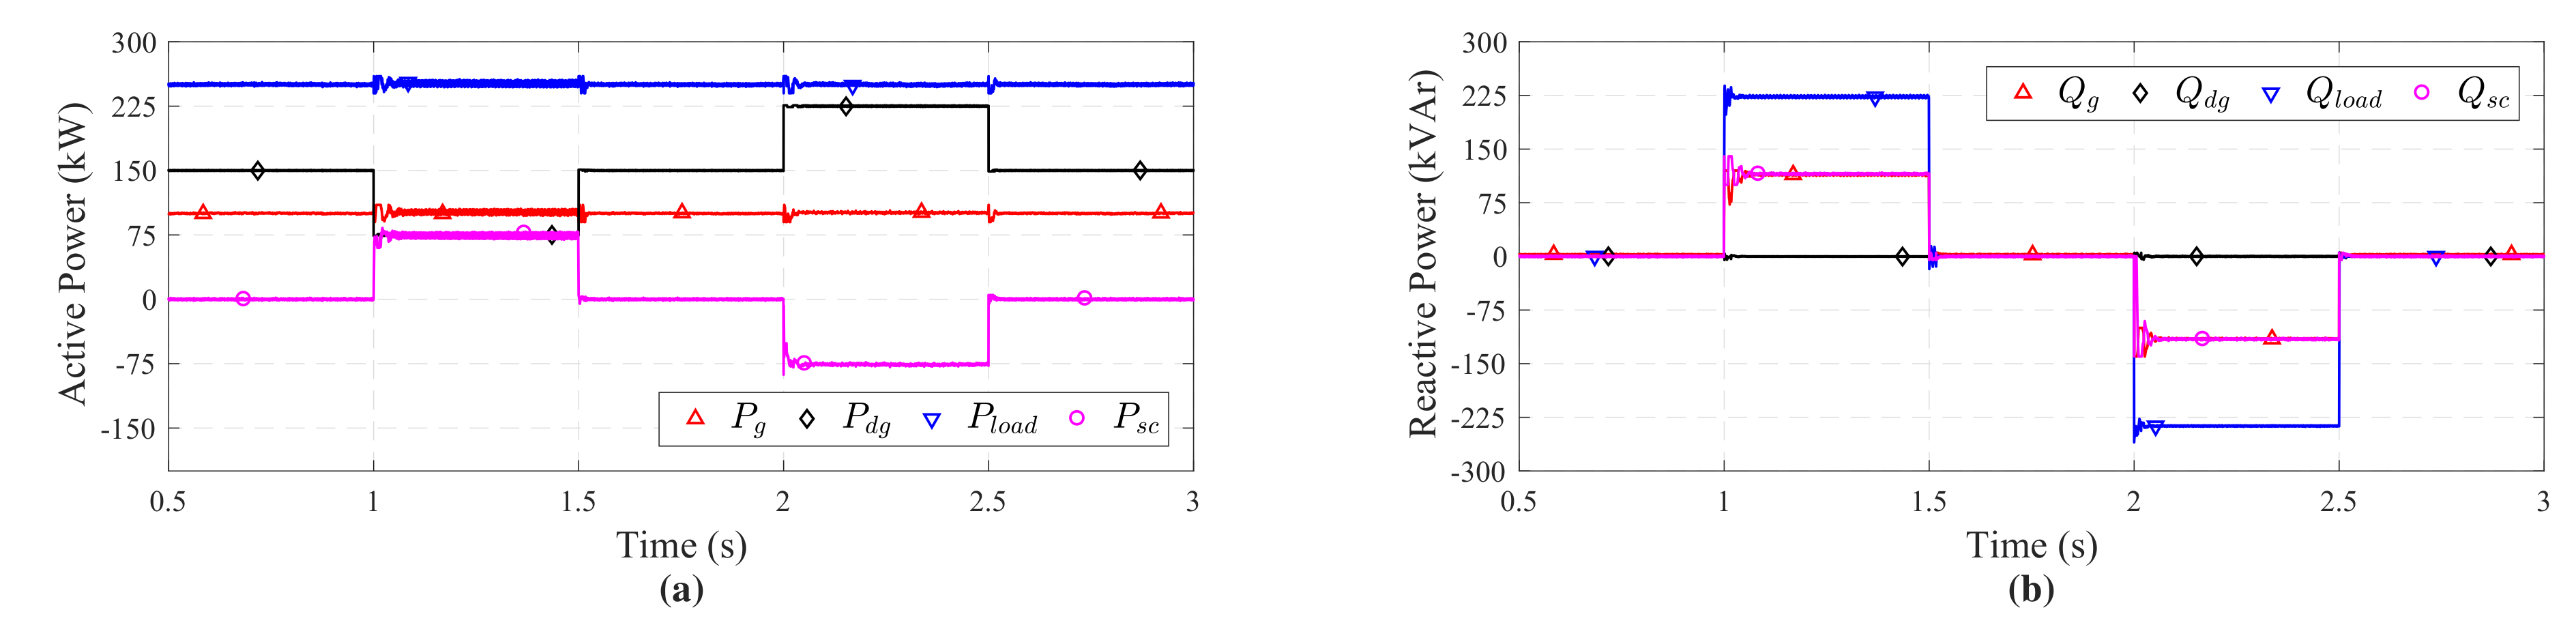
6.4. Four-Quadrant Operation

All the functionalities of the smart charger can be utilized when the inverter operates as a four-quadrant converter. As shown in Figure 19a,b, the DG changes the power output over the course of time, and at the same instant, reactive power at the load side is also introduced. Therefore, with EMS support, power fluctuation mitigation and voltage regulation are provided by the EVs and the smart charger under such dynamic grid conditions. The inverter operates on specific points in the P Q circle during this whole operation.

7. Conclusions

In this study, we proposed an energy management scheme to govern the operation of a smart EV charger. The proposed scheme can allocate instantaneous active power reference to different types of EVs connected to the charger DC-bus and aggregate their battery energy based on a proportional power division methodology. The EV power allocation strategy takes into consideration both the EV battery capacity and the SoC. The proposed technique was compared with another battery-capacity-based power allocation method. The results showed that the larger EV battery was less vulnerable to battery degradation according to the proposed approach. Furthermore, the scheme contributed to the satisfaction of all EV customers, enabling the participation of all EVs. Furthermore, during V2G/G2V scenarios, to support the grid during renewables; transients, a 100% utilization factor showed the aggregation of EVs at the charger level. The V2G/G2V operation reduced the grid congestion and increased the load factor. Additionally, the EMS, with its reactive support section, guided the smart charger to improve the voltage profile under sag and swell events. The EMS and smart charger’s four-quadrant operation was also verified. Finally, the proposed EMS can also incorporate long-term EV charging/discharging strategies such as load-leveling and peak-shaving by communicating with the distribution system operator.
The overall results signify the importance of energy management control schemes for EVs to be utilized for ancillary services. Management of EV ancillary services in cooperation with local renewable sources is crucial for the evolution of the traditional grid into a smart grid.

Acknowledgments

This work was supported by the National Research Foundation of Korea (NRF) grant funded by the Korean government (MSIP) (No. 2015R1A2A1A10052459).

Author Contributions

The manuscript was written by Saad Ullah Khan under the supervision of Chul-Hwan Kim. The modeling, simulation and analysis process was executed by Saad Ullah Khan. Technical support was provided by Khawaja Khalid Mehmood, Zunaib Maqsood Haider and Syed Basit Ali Bukhari. Soon-Jeong Lee and Muhammad Kashif Rafique helped in the review.

Conflicts of Interest

The authors declare no conflict of interest.

References

  1. Ehsani, M.; Falahi, M.; Lotfifard, S. Vehicle to Grid Services: Potential and Applications. Energies 2012, 5, 4076–4090. [Google Scholar] [CrossRef]
  2. De Carne, G.; Zou, Z.; Buticchi, G.; Liserre, M.; Vournas, C. Overload Control in Smart Transformer-Fed Grid. Appl. Sci. 2017, 7, 208. [Google Scholar] [CrossRef]
  3. Traube, J.; Lu, F.; Maksimovic, D.; Mossoba, J.; Kromer, M.; Faill, P.; Katz, S.; Borowy, B.; Nichols, S.; Casey, L. Mitigation of Solar Irradiance Intermittency in Photovoltaic Power Systems With Integrated Electric-Vehicle Charging Functionality. IEEE Trans. Power Electron. 2013, 28, 3058–3067. [Google Scholar] [CrossRef]
  4. Järvelä, M.; Valkealahti, S. Ideal Operation of a Photovoltaic Power Plant Equipped with an Energy Storage System on Electricity Market. Appl. Sci. 2017, 7, 749. [Google Scholar] [CrossRef]
  5. Shivashankar, S.; Mekhilef, S.; Mokhlis, H.; Karimi, M. Mitigating methods of power fluctuation of photovoltaic (PV) sources—A review. Renew. Sustain. Energy Rev. 2016, 59, 1170–1184. [Google Scholar] [CrossRef]
  6. Wang, T.; Kamath, H.; Willard, S. Control and Optimization of Grid-Tied Photovoltaic Storage Systems Using Model Predictive Control. IEEE Trans. Smart Grid 2014, 5, 1010–1017. [Google Scholar] [CrossRef]
  7. Haider, Z.M.; Mehmood, K.K.; Rafique, M.K.; Khan, S.U.; Lee, S.J.; Kim, C.H. Water-filling algorithm based approach for management of responsive residential loads. J. Mod. Power Syst. Clean Energy 2018, 6, 118–131. [Google Scholar] [CrossRef]
  8. Falahi, M.; Chou, H.M.; Ehsani, M.; Xie, L.; Butler-Purry, K.L. Potential Power Quality Benefits of Electric Vehicles. IEEE Trans. Sustain. Energy 2013, 4, 1016–1023. [Google Scholar]
  9. Alam, M.J.E.; Muttaqi, K.M.; Sutanto, D. Effective Utilization of Available PEV Battery Capacity for Mitigation of Solar PV Impact and Grid Support With Integrated V2G Functionality. IEEE Trans. Smart Grid 2016, 7, 1562–1571. [Google Scholar] [CrossRef]
  10. Gao, S.; Chau, K.T.; Liu, C.; Wu, D.; Chan, C.C. Integrated Energy Management of Plug-in Electric Vehicles in Power Grid With Renewables. IEEE Trans. Veh. Technol. 2014, 63, 3019–3027. [Google Scholar] [CrossRef] [Green Version]
  11. Yilmaz, M.; Krein, P.T. Review of the Impact of Vehicle-to-Grid Technologies on Distribution Systems and Utility Interfaces. IEEE Trans. Power Electron. 2013, 28, 5673–5689. [Google Scholar] [CrossRef]
  12. Arancibia, A.; Strunz, K.; Mancilla-David, F. A Unified Single- and Three-Phase Control for Grid Connected Electric Vehicles. IEEE Trans. Smart Grid 2013, 4, 1780–1790. [Google Scholar] [CrossRef]
  13. Kesler, M.; Kisacikoglu, M.C.; Tolbert, L.M. Vehicle-to-Grid Reactive Power Operation Using Plug-In Electric Vehicle Bidirectional Offboard Charger. IEEE Trans. Ind. Electron. 2014, 61, 6778–6784. [Google Scholar] [CrossRef]
  14. Sampaio, L.P.; de Brito, M.A.; de A. e Melo, G.; Canesin, C.A. Grid-tie three-phase inverter with active power injection and reactive power compensation. Renew. Energy 2016, 85, 854–864. [Google Scholar] [CrossRef]
  15. Li, S.; Bao, K.; Fu, X.; Zheng, H. Energy Management and Control of Electric Vehicle Charging Stations. Electric Power Compon. Syst. 2014, 42, 339–347. [Google Scholar] [CrossRef]
  16. Yong, J.Y.; Ramachandaramurthy, V.K.; Tan, K.M.; Mithulananthan, N. Bi-directional electric vehicle fast charging station with novel reactive power compensation for voltage regulation. Int. J. Electr. Power Energy Syst. 2015, 64, 300–310. [Google Scholar] [CrossRef]
  17. Arancibia, A.; Strunz, K. Modeling of an electric vehicle charging station for fast DC charging. In Proceedings of the 2012 IEEE International Electric Vehicle Conference (IEVC), Greenville, SC, USA, 4–8 March 2012; pp. 1–6. [Google Scholar]
  18. Kisacikoglu, M.C.; Kesler, M.; Tolbert, L.M. Single-Phase On-Board Bidirectional PEV Charger for V2G Reactive Power Operation. IEEE Trans. Smart Grid 2015, 6, 767–775. [Google Scholar] [CrossRef]
  19. Choi, W.; Lee, W.; Sarlioglu, B. Reactive power control of grid-connected inverter in vehicle-to-grid application for voltage regulation. In Proceedings of the 2016 IEEE Transportation Electrification Conference and Expo (ITEC), Dearborn, MI, USA, 26–29 June 2016; pp. 1–7. [Google Scholar]
  20. Sayed, K.; Gabbar, H.A. Electric Vehicle to Power Grid Integration Using Three-Phase Three-Level AC/DC Converter and PI-Fuzzy Controller. Energies 2016, 9, 532. [Google Scholar] [CrossRef]
  21. Xu, Z.; Hu, Z.; Song, Y.; Zhao, W.; Zhang, Y. Coordination of PEVs charging across multiple aggregators. Appl. Energy 2014, 136, 582–589. [Google Scholar] [CrossRef]
  22. Jhala, K.; Natarajan, B.; Pahwa, A.; Erickson, L. Coordinated Electric Vehicle Charging for Commercial Parking Lot with Renewable Energy Sources. Electr. Power Compon. Syst. 2017, 45, 344–353. [Google Scholar] [CrossRef]
  23. Zheng, J.; Wang, X.; Men, K.; Zhu, C.; Zhu, S. Aggregation Model-Based Optimization for Electric Vehicle Charging Strategy. IEEE Trans. Smart Grid 2013, 4, 1058–1066. [Google Scholar] [CrossRef]
  24. Lee, S.J.; Kim, J.H.; Kim, C.H.; Kim, S.K.; Kim, E.S.; Kim, D.U.; Mehmood, K.K.; Khan, S.U. Coordinated Control Algorithm for Distributed Battery Energy Storage Systems for Mitigating Voltage and Frequency Deviations. IEEE Trans. Smart Grid 2016, 7, 1713–1722. [Google Scholar] [CrossRef]
  25. Prikler, L.; Høidalen, H.K. ATPDRAW version 5.6 for Windows 9x/NT/2000/XP/Vista. Available online: http://www.elkraft.ntnu.no/atpdraw/ATPDMan56.pdf (accessed on 2 February 2016).
  26. Ipakchi, A.; Albuyeh, F. Grid of the future. IEEE Power Energy Mag. 2009, 7, 52–62. [Google Scholar] [CrossRef]
  27. Chiradeja, P.; Ramakumar, R. An approach to quantify the technical benefits of distributed generation. IEEE Trans. Energy Convers. 2004, 19, 764–773. [Google Scholar] [CrossRef]
  28. Alanne, K.; Saari, A. Distributed energy generation and sustainable development. Renew. Sustain. Energy Rev. 2006, 10, 539–558. [Google Scholar] [CrossRef]
  29. Hung, D.Q.; Mithulananthan, N.; Bansal, R.C. Analytical Expressions for DG Allocation in Primary Distribution Networks. IEEE Trans. Energy Convers. 2010, 25, 814–820. [Google Scholar] [CrossRef]
  30. Mehmood, K.K.; Khan, S.U.; Lee, S.J.; Haider, Z.M.; Rafique, M.K.; Kim, C.H. Optimal sizing and allocation of battery energy storage systems with wind and solar power DGs in a distribution network for voltage regulation considering the lifespan of batteries. IET Renew. Power Gener. 2017, 11, 1305–1315. [Google Scholar] [CrossRef]
  31. Camacho, A.; Castilla, M.; Miret, J.; Vasquez, J.C.; Alarcon-Gallo, E. Flexible Voltage Support Control for Three-Phase Distributed Generation Inverters Under Grid Fault. IEEE Trans. Ind. Electron. 2013, 60, 1429–1441. [Google Scholar] [CrossRef]
  32. Kisacikoglu, M.C.; Ozpineci, B.; Tolbert, L.M. EV/PHEV Bidirectional Charger Assessment for V2G Reactive Power Operation. IEEE Trans. Power Electron. 2013, 28, 5717–5727. [Google Scholar] [CrossRef]
  33. Daud, M.Z.; Mohamed, A.; Wanik, M.Z.C.; Hannan, M.A. Performance evaluation of grid-connected photovoltaic system with battery energy storage. In Proceedings of the 2012 IEEE International Conference on Power and Energy (PECon), Kota Kinabalu, Malaysia, 2–5 December 2012; pp. 337–342. [Google Scholar]
  34. Nguyen, T.H.; Lee, D.C. Ride-Through Technique for PMSG Wind Turbines using Energy Storage Systems. J. Power Electron. 2010, 10, 733–738. [Google Scholar] [CrossRef]
  35. Ge, B.; Wang, W.; Bi, D.; Rogers, C.B.; Peng, F.Z.; de Almeida, A.T.; Abu-Rub, H. Energy storage system-based power control for grid-connected wind power farm. Int. J. Electr. Power Energy Syst. 2013, 44, 115–122. [Google Scholar] [CrossRef]
  36. Nissan. 2015 LEAF—First Responder’s Guide. Available online: https://www.nissan-techinfo.com/refgh0v/og/FRG/2015-Nissan-LEAF-FRG.pdf (accessed on 27 May 2017).
  37. Nissan. 2015 LEAF—Owner’s Manual. Available online: https://www.nissan.ca/content/dam/nissan/ca/owners/manuals/LEAF/2015-Nissan-LEAF.pdf (accessed on 17 October 2017).
  38. Automotive Energy Supply Corporation. Available online: http://www.eco-aesc-lb.com/en/product/liionev/ (accessed on 16 May 2017).
  39. AVIC Automotive Korea. Available online: http://www.avickorea.com (accessed on 1 July 2017).
  40. Tremblay, O.; Dessaint, L.A. Experimental Validation of a Battery Dynamic Model for EV Applications. World Electr. Veh. J. 2009, 3, 289–298. [Google Scholar]
  41. SAE International. SAE Electric Vehicle and Plug in Hybrid Electric Vehicle Conductive Charge Coupler; SAE J 1772; SAE International: Warrendale, PA, USA, 2016; pp. 1–110. [Google Scholar]
  42. Erickson, R.; Maksimovic, D. Fundamentals of Power Electronics; Springer: New York, NY, USA, 2007. [Google Scholar]
  43. Reznik, A.; Simões, M.G.; Al-Durra, A.; Muyeen, S.M. LCL Filter Design and Performance Analysis for Grid-Interconnected Systems. IEEE Trans. Ind. Appl. 2014, 50, 1225–1232. [Google Scholar] [CrossRef]
  44. Arias, M.B.; Bae, S. Electric vehicle charging demand forecasting model based on big data technologies. Appl. Energy 2016, 183, 327–339. [Google Scholar] [CrossRef]
  45. Ercan, T.; Noori, M.; Zhao, Y.; Tatari, O. On the Front Lines of a Sustainable Transportation Fleet: Applications of Vehicle-to-Grid Technology for Transit and School Buses. Energies 2016, 9, 230. [Google Scholar] [CrossRef]
  46. Noel, L.; McCormack, R. A cost benefit analysis of a V2G-capable electric school bus compared to a traditional diesel school bus. Appl. Energy 2014, 126, 246–255. [Google Scholar] [CrossRef]
  47. Wu, Q.; Nielsen, A.H.; stergaard, J.; Cha, S.T.; Marra, F.; Andersen, P.B. Modeling of Electric Vehicles (EVs) for EV Grid Integration Study. In European Conference SmartGrids & E-Mobility; Ostbayerisches Technologie-Transfer-Institut: Regensburg, Germany, 2010. [Google Scholar]
  48. IEEE Application Guide for IEEE Std 1547(TM). IEEE Standard for Interconnecting Distributed Resources with Electric Power Systems; IEEE Std 1547.2-2008; IEEE: Piscataway, NJ, USA, 2009; pp. 1–217. [Google Scholar]
Figure 1. Schematic of renewables and EV integration with the grid. PCC, point of common coupling.
Applsci 08 00648 g001
Figure 2. DG output power with ± 50 % variance.
Applsci 08 00648 g002
Figure 3. Battery discharge curves. (a) Discharge voltage characteristics of the Nissan LEAF battery. (b) Discharge voltage characteristics of the ENVYON battery. (c) SoC characteristics of the Nissan LEAF battery. (d) SoC characteristics of the ENVYON battery.
Applsci 08 00648 g003
Figure 4. Bi-directional DC-DC converter circuit topology.
Applsci 08 00648 g004
Figure 5. DC-DC converter control strategy block diagram.
Applsci 08 00648 g005
Figure 6. P Q capability characteristics of an EV smart charger.
Applsci 08 00648 g006
Figure 7. Four-quadrant converter circuit topology with LCL filter.
Applsci 08 00648 g007
Figure 8. Phase locked loop block diagram.
Applsci 08 00648 g008
Figure 9. Four-quadrant converter control strategy block diagram.
Applsci 08 00648 g009
Figure 10. Energy management scheme (EMS) control functioning within the smart charger system.
Applsci 08 00648 g010
Figure 11. EMS control process.
Applsci 08 00648 g011
Figure 12. A comparison of power allocation schemes. (ad) Reference method discharging and charging. (eh) Proposed method discharging and charging.
Applsci 08 00648 g012
Figure 13. Three-phase active powers of the grid, DG, load and smart charger showing V2G and G2V action.
Applsci 08 00648 g013
Figure 14. Power angle variation magnitude with and without the smart charger.
Applsci 08 00648 g014
Figure 15. (a) Discharging and charging power of the two EVs under the reference method (RM) and the proposed method (PM). (b) E V 1 SoC comparison RM vs. PM. (c) E V 2 SoC comparison RM vs. PM.
Applsci 08 00648 g015
Figure 16. Three-phase reactive powers of the grid, DG, load and smart charger.
Applsci 08 00648 g016
Figure 17. RMS PCC voltage profile with and without the smart charger.
Applsci 08 00648 g017
Figure 18. EV power profiles during reactive operation.
Applsci 08 00648 g018
Figure 19. (a) Three-phase active powers of the grid, DG, load and smart charger. (b) Three-phase reactive powers of the grid, DG, load and smart charger.
Applsci 08 00648 g019
Table 1. EV characteristics.
LabelEV NameVehicle TypeBattery Pack (kWh)Range (km)
E V 1 Nissan LEAF [36,37,38]Car23.4 [65 Ah, 360 V]134
E V 2 ENVYON [39]Bus100.8 [160 Ah, 630 V]160 *
* Assumed range.
Table 2. Battery parameters.
ParametersNissan LEAFENVYON
E 0 (V)390.37683.15
K0.040.03
φ (Ah)65160
A (V)30.2352.91
B (Ah) 1 0.930.38
R b ( Ω ) 0.060.04
Table 3. Parameter values.
EntityParameterValue
Grid V g 380 V
f g 60 Hz
L g 0.1 mH
Renewable energy DG P d g 150 kW
Υ d g ±50%
E V 1
DC-DC converter
V b ( 1 ) 360 V
L b ( 1 ) 22.42 mH
C b ( 1 ) 37.62 μ F
f s ( D C 1 ) 6000 Hz
E V 2
DC-DC converter
V b ( 2 ) 630 V
L b ( 2 ) 3.28 mH
C b ( 2 ) 52.91 μ F
f s ( D C 2 ) 6000 Hz
Grid side inverter S n 150 kVA
V d c 700 V
C d c 2551.02 μ F
L 1 0.603 mH
L 2 0.015 mH
C f 275.545 μ F
R f 0.078 Ohm
f s ( i n v ) 6000 Hz
Table 4. EV power allocation method comparison.
MethodologyVehicleV2GG2VInitial SoCFinal SoCUtilization Factor
(RM) Battery capacity-based power allocation method [24] E V 1 YesNo75%44%75%
E V 2 YesYes50%57%
(PM) Proposed proportional power allocation method E V 1 YesYes75%60%100%
E V 2 YesYes50%53%

