Article

Evaluation of the Toxin-to-Protein Binding Rates during Hemodialysis Using Sorbent-Loaded Mixed-Matrix Membranes

by
Christos S. Stiapis
1,2,
Eugene D. Skouras
1,3,
Denys Pavlenko
4,
Dimitrios Stamatialis
4 and
Vasilis N. Burganos
1,*
1
Institute of Chemical Engineering Sciences (ICE-HT), Foundation for Research and Technology, Hellas (FORTH), Stadiou, Platani, GR-26504 Patras, Greece
2
Department of Chemical Engineering, University of Patras, GR-26504 Patras, Greece
3
Department of Mechanical Engineering TE, TEI of Western Greece, GR-26334 Patras, Greece
4
(Bio)artificial Organs group, Department of Biomaterials Science and Technology, TechMed Institute for Biomedical Technology and Technical Medicine, University of Twente, 7522 NB Enschede, The Netherlands
*
Author to whom correspondence should be addressed.
Appl. Sci. 2018, 8(4), 536; https://doi.org/10.3390/app8040536
Submission received: 1 March 2018 / Revised: 27 March 2018 / Accepted: 28 March 2018 / Published: 31 March 2018

Abstract

:
The transport and reaction phenomena that take place in multi-layered mixed-matrix membranes with activated carbon (AC) sorbents that are expected to improve extra-corporeal blood purification, are studied at the macroscopic scale. A model was developed that aims at the description of the removal efficiency of harmful uremic toxins from the blood in the presence of carbon-adsorptive particles and produces results that are aligned with the experimental data. The importance of the generally unknown kinetic rate constants of the association of toxins to albumin is investigated through sensitivity analysis. Matching with further experimental data allowed the extraction of vital kinetic rate constants for key uremic toxins such as indoxyl sulfate (IS) and p-cresyl sulfate (PCS). Moreover, the effects of the plasma composition, as well as of the membrane loading with activated carbon, on the total removal of the protein-bound toxins are quantified and discussed.

Graphical Abstract

1. Introduction

In recent years, new membranes with embedded functionalized particles in their matrix, so-called mixed-matrix membranes, appeared in the literature as promising alternatives to the conventional dialysis membranes [1]. Their advantages stem from the fact that an additional driving force to enhance toxin removal is offered by the presence of adsorptive particles in the macroporous membrane layer, combined with a particle-free thin “selective” membrane layer on the blood-contacting side that offers selective separation of the uremic toxins and prevents direct contact of the adsorptive particles with the blood. The supplementary driving force of the adsorptive particles has been experimentally observed to improve the removal of toxins, such as creatinine (Cr), from the blood, due to the enhanced concentration gradient that is generated [2]. Moreover, this extra driving force has been shown to enhance the removal of “hard-to-remove” toxins, such as protein-bound toxins (PBTs), considerably. PBTs are often bound to albumin and form complexes with it, thus rendering simple hemodialysis ineffective for their removal from the patient’s blood [3]. Because of their elevated binding constants (10−5–10−4 M) [4], only a small fraction of the PBTs are usually present in the plasma as free solutes, called the “free fraction”, while the majority of the PBTs are attached to albumin, forming a complex called the “bound fraction”. The protein-binding of the uremic toxins is considered reversible, because it is mainly driven by van der Waals forces [5]. As free toxins are removed, for instance through a hemodialysis membrane, the toxin concentration in the blood is gradually diminished. According to Le Chatelier’s principle, the partial subtraction of the free form will shift the equilibrium towards the enhancement of dissociation of the complex [6]. This argument is further supported by the fact that, due to the membrane cut-off function, the protein-bound toxins are removed almost exclusively as free fractions, thus the dissociation of a protein-bound toxin to its dissolved free form is the only possible way of removal [7]. Moreover, the presence of the activated carbon as a sorbent in the membrane matrix increases the concentration gradient and, thus, helps deplete the region around the albumin from the free fraction of the toxin, favoring in this way the detachment of the bound fraction from the protein. Despite the experimental evidence of this removal enhancement, it is necessary to develop a detailed macroscopic model that will encompass the mechanisms behind the toxin removal, quantify their effects, and assist the experimental, as well as the operational, aspects of the membrane development.
Most of the models in the literature describe the mass transfer of a toxin through the membrane with an overall mass transfer coefficient, Ko, that accounts for the mass transfer resistances in the blood side, the membrane, and the dialysate [8]. However, these models fail to provide accurate predictions under variable operating conditions, because all the reaction and transport mechanisms are encompassed in an overall mass transfer coefficient. In other studies, separate treatment of mass transfer through convection and diffusion is performed [9], assuming constant volumetric flux through the membrane. There are also studies where phenomenological description of the carrier fluid and the transport of the toxins on linear non-equilibrium thermodynamics is applied [10]. The toxin concentrations on the membrane surfaces in contact with blood and dialysate are assumed constant and are related to the bulk toxin concentrations through a linear equilibrium relationship. This assumption is not valid, however, in the case of membrane fibers of sufficient length to allow variation of the toxin concentration in the blood along the fiber length. Moreover, most of the models in the literature appear to neglect the complex interactions of proteins, such as albumin and fibrinogen, with the blood and the toxins. Recently, an indirect calculation of toxin interaction constants was suggested using experimental data [11].
In this work, a detailed flow and mass transport model is developed that considers the characteristics and the operational conditions of the whole hemodialysis module, as it includes terms like flowrates, packing density of the fibers in the module, as well as blood and dialysate compositions. After validating the model against experimental data, we predict the PBTs’ removal in a 3-hollow fiber/module configuration. Although some equilibrium constant data for the affinity of PBTs to albumin are available, to the best of the authors’ knowledge, there are no literature data concerning the binding and dissociation rates of the specific PBTs to albumin.
A parametric analysis is also conducted of the effect of the binding rate on the removal of p-cresyl sulfate (PCS) and indoxyl sulfate (IS). These compounds are examples of protein-bound uremic toxins, which, needless to say, do not account for the entire cardiovascular risk present in this type of patient. The particular toxins were chosen due to the fact that, not only do they bind to albumin in the blood, but they also competitively bind to the same site on human serum albumin (HSA) [12]. As a result, PCS and IS free fractions are strongly intercorrelated, and secondary to this, dialytic clearances of indoxyl sulfate and p-cresyl sulfate are also closely related [4], creating interesting dynamics during their association with albumin. The main objective is the numerical validation and quantification of the role of activated carbon particles to enhance the removal of PBTs.

2. Materials and Methods

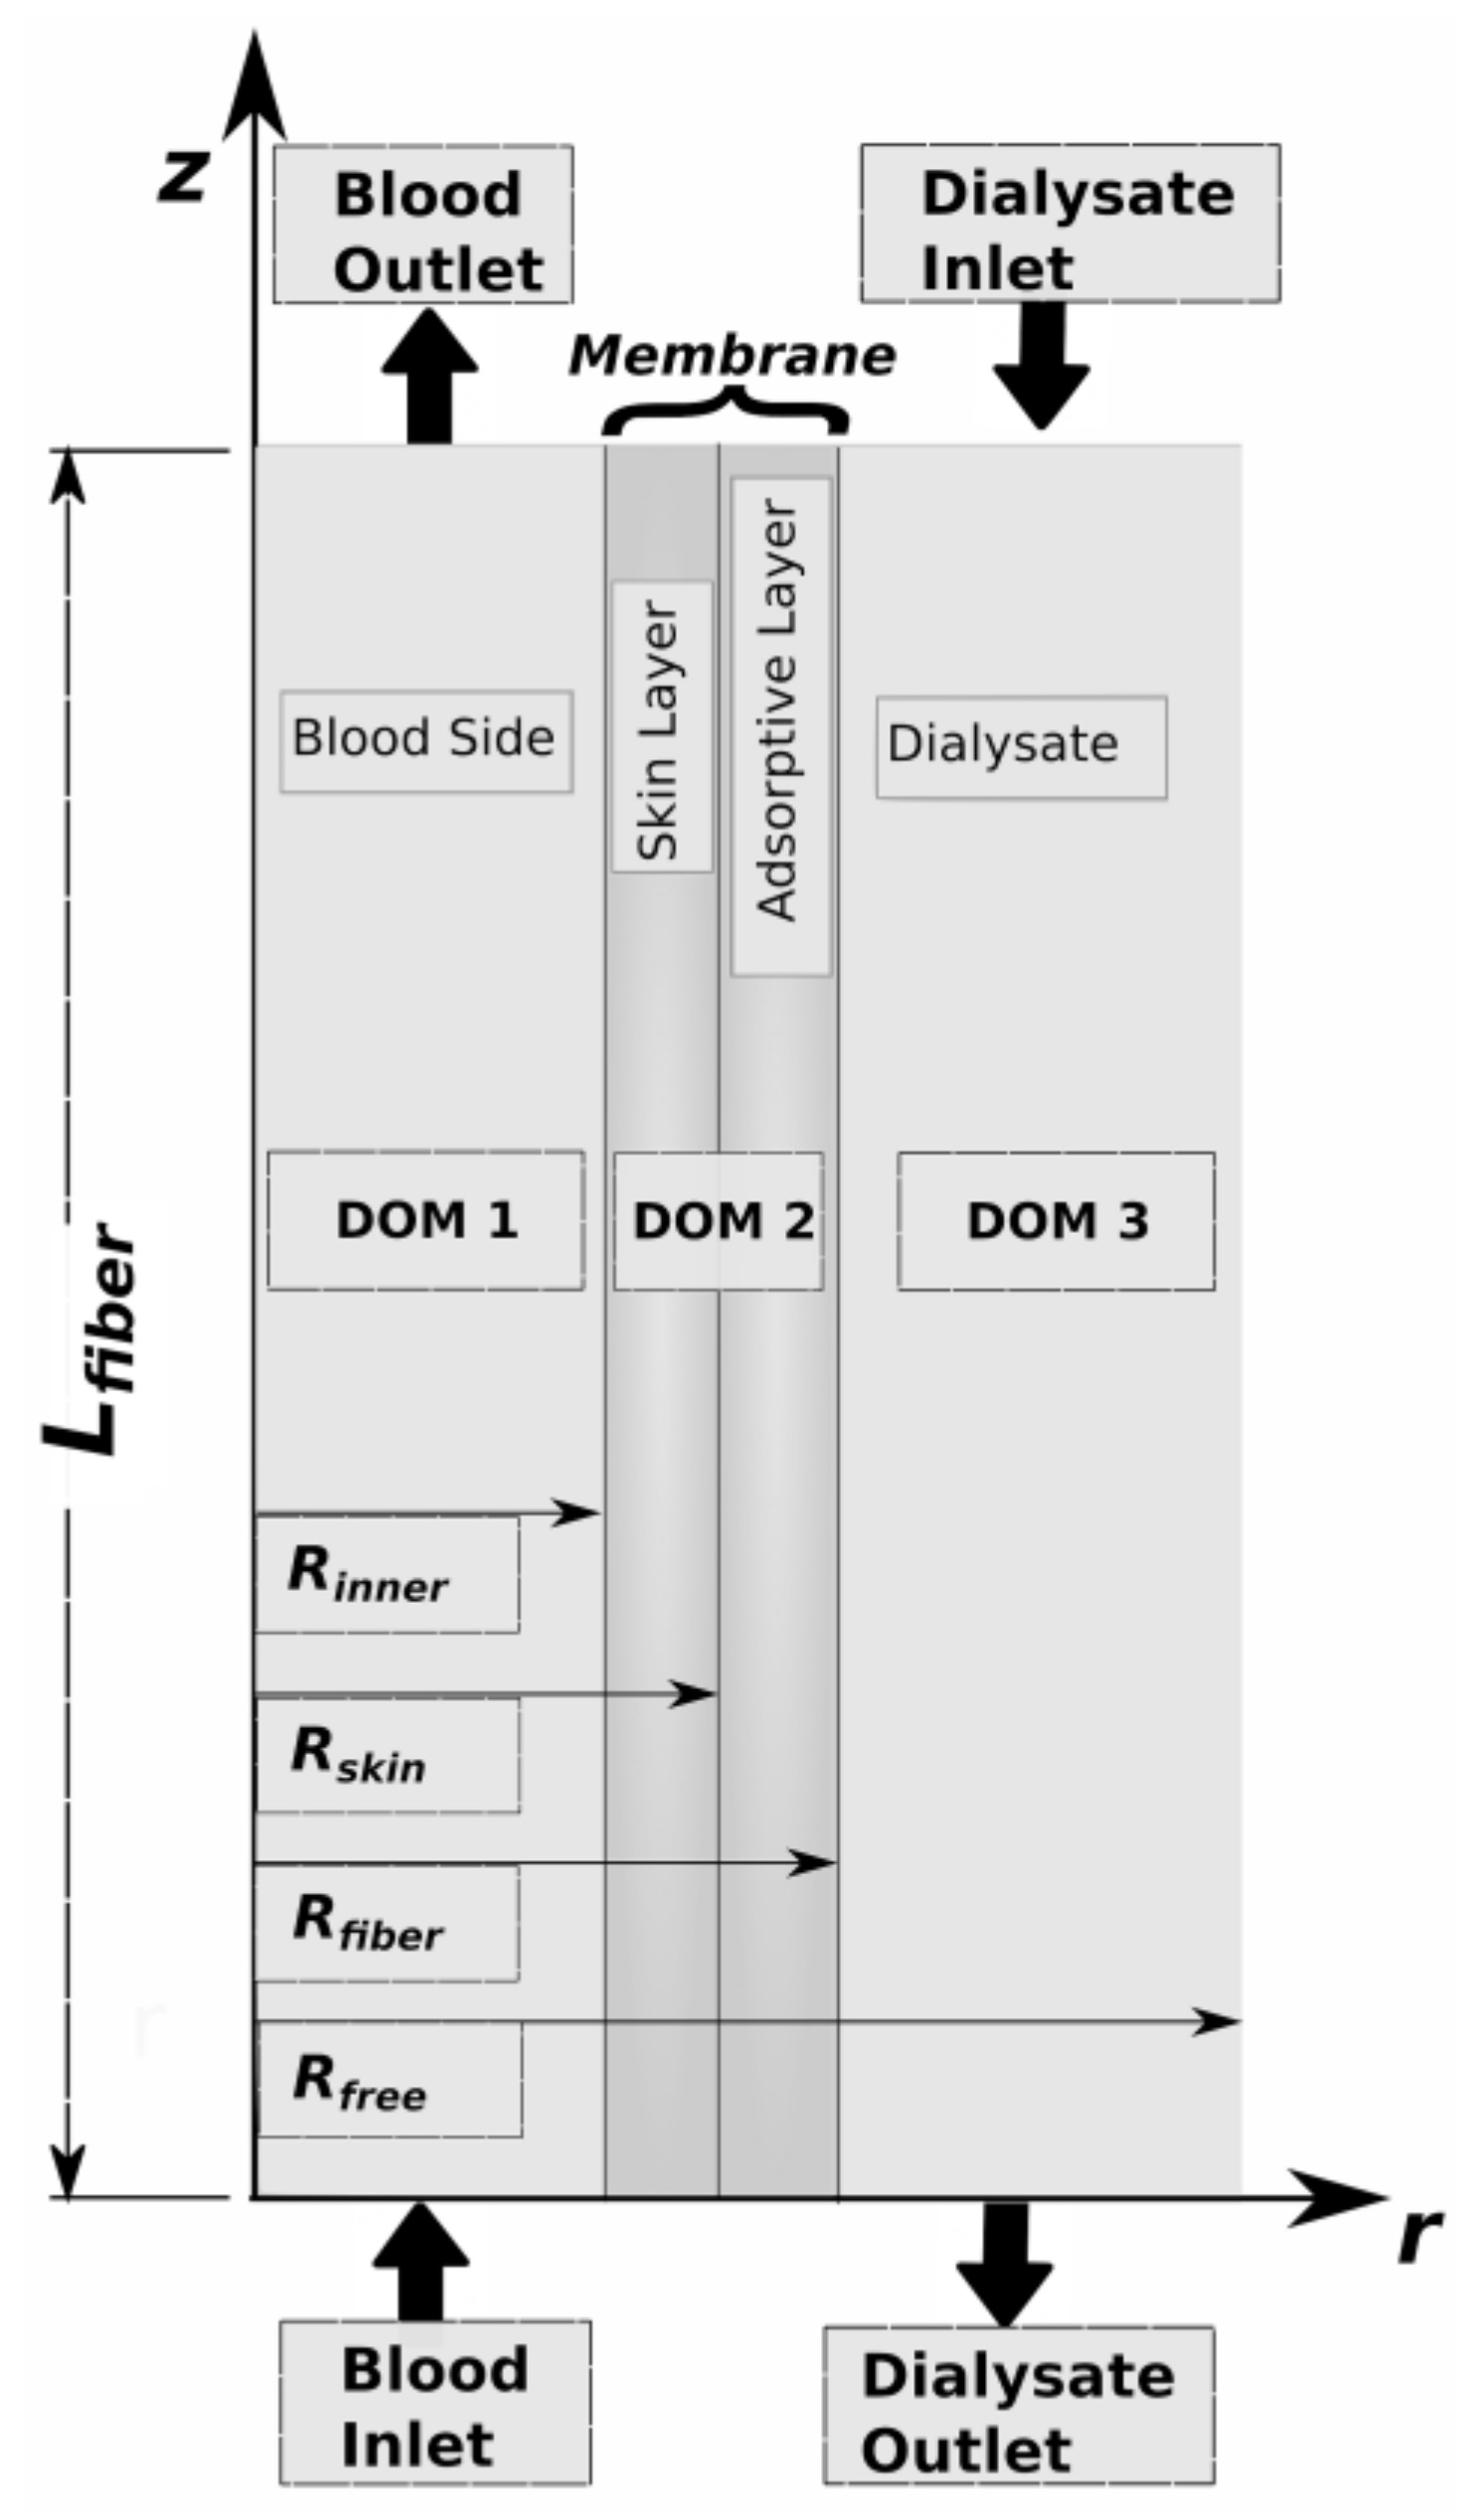
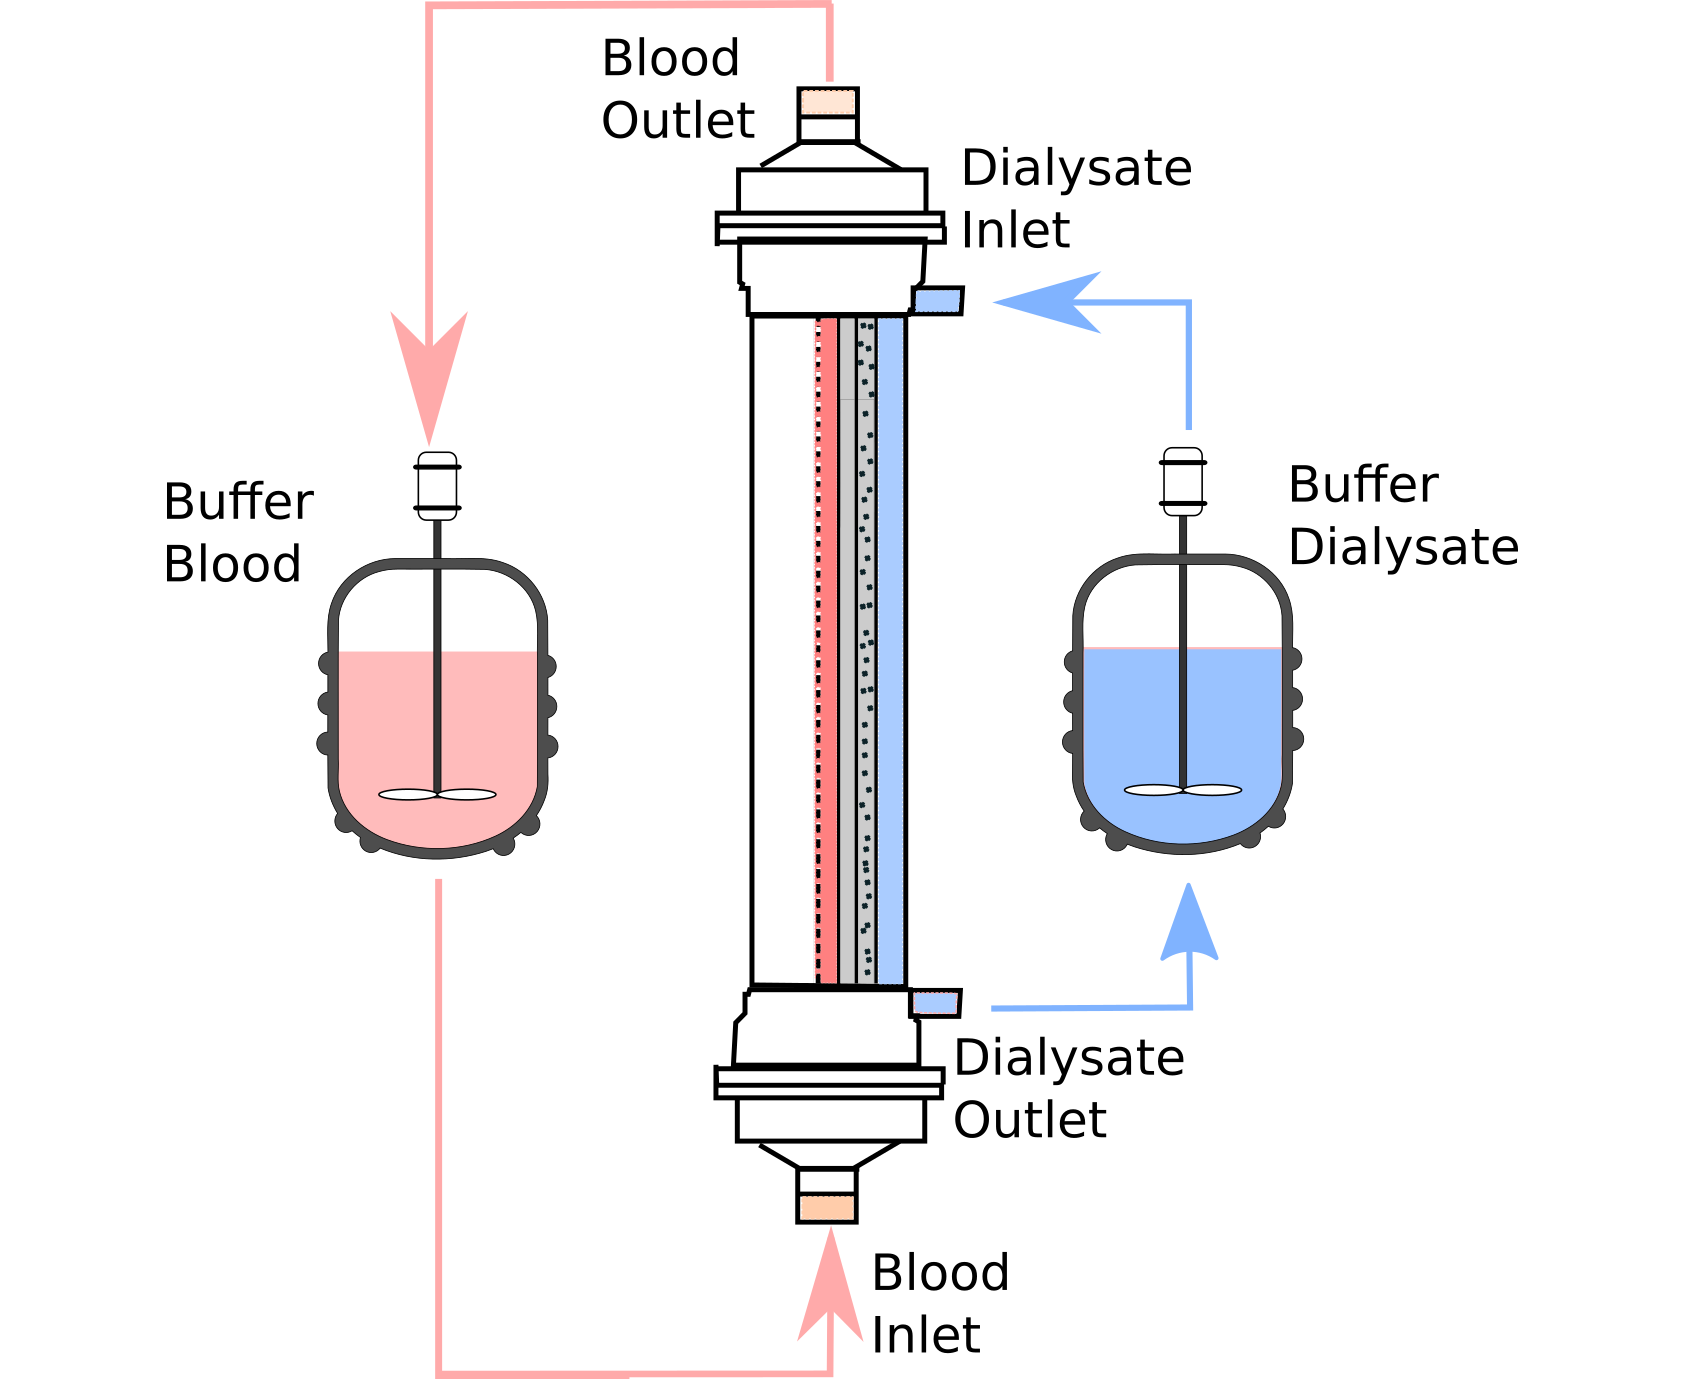
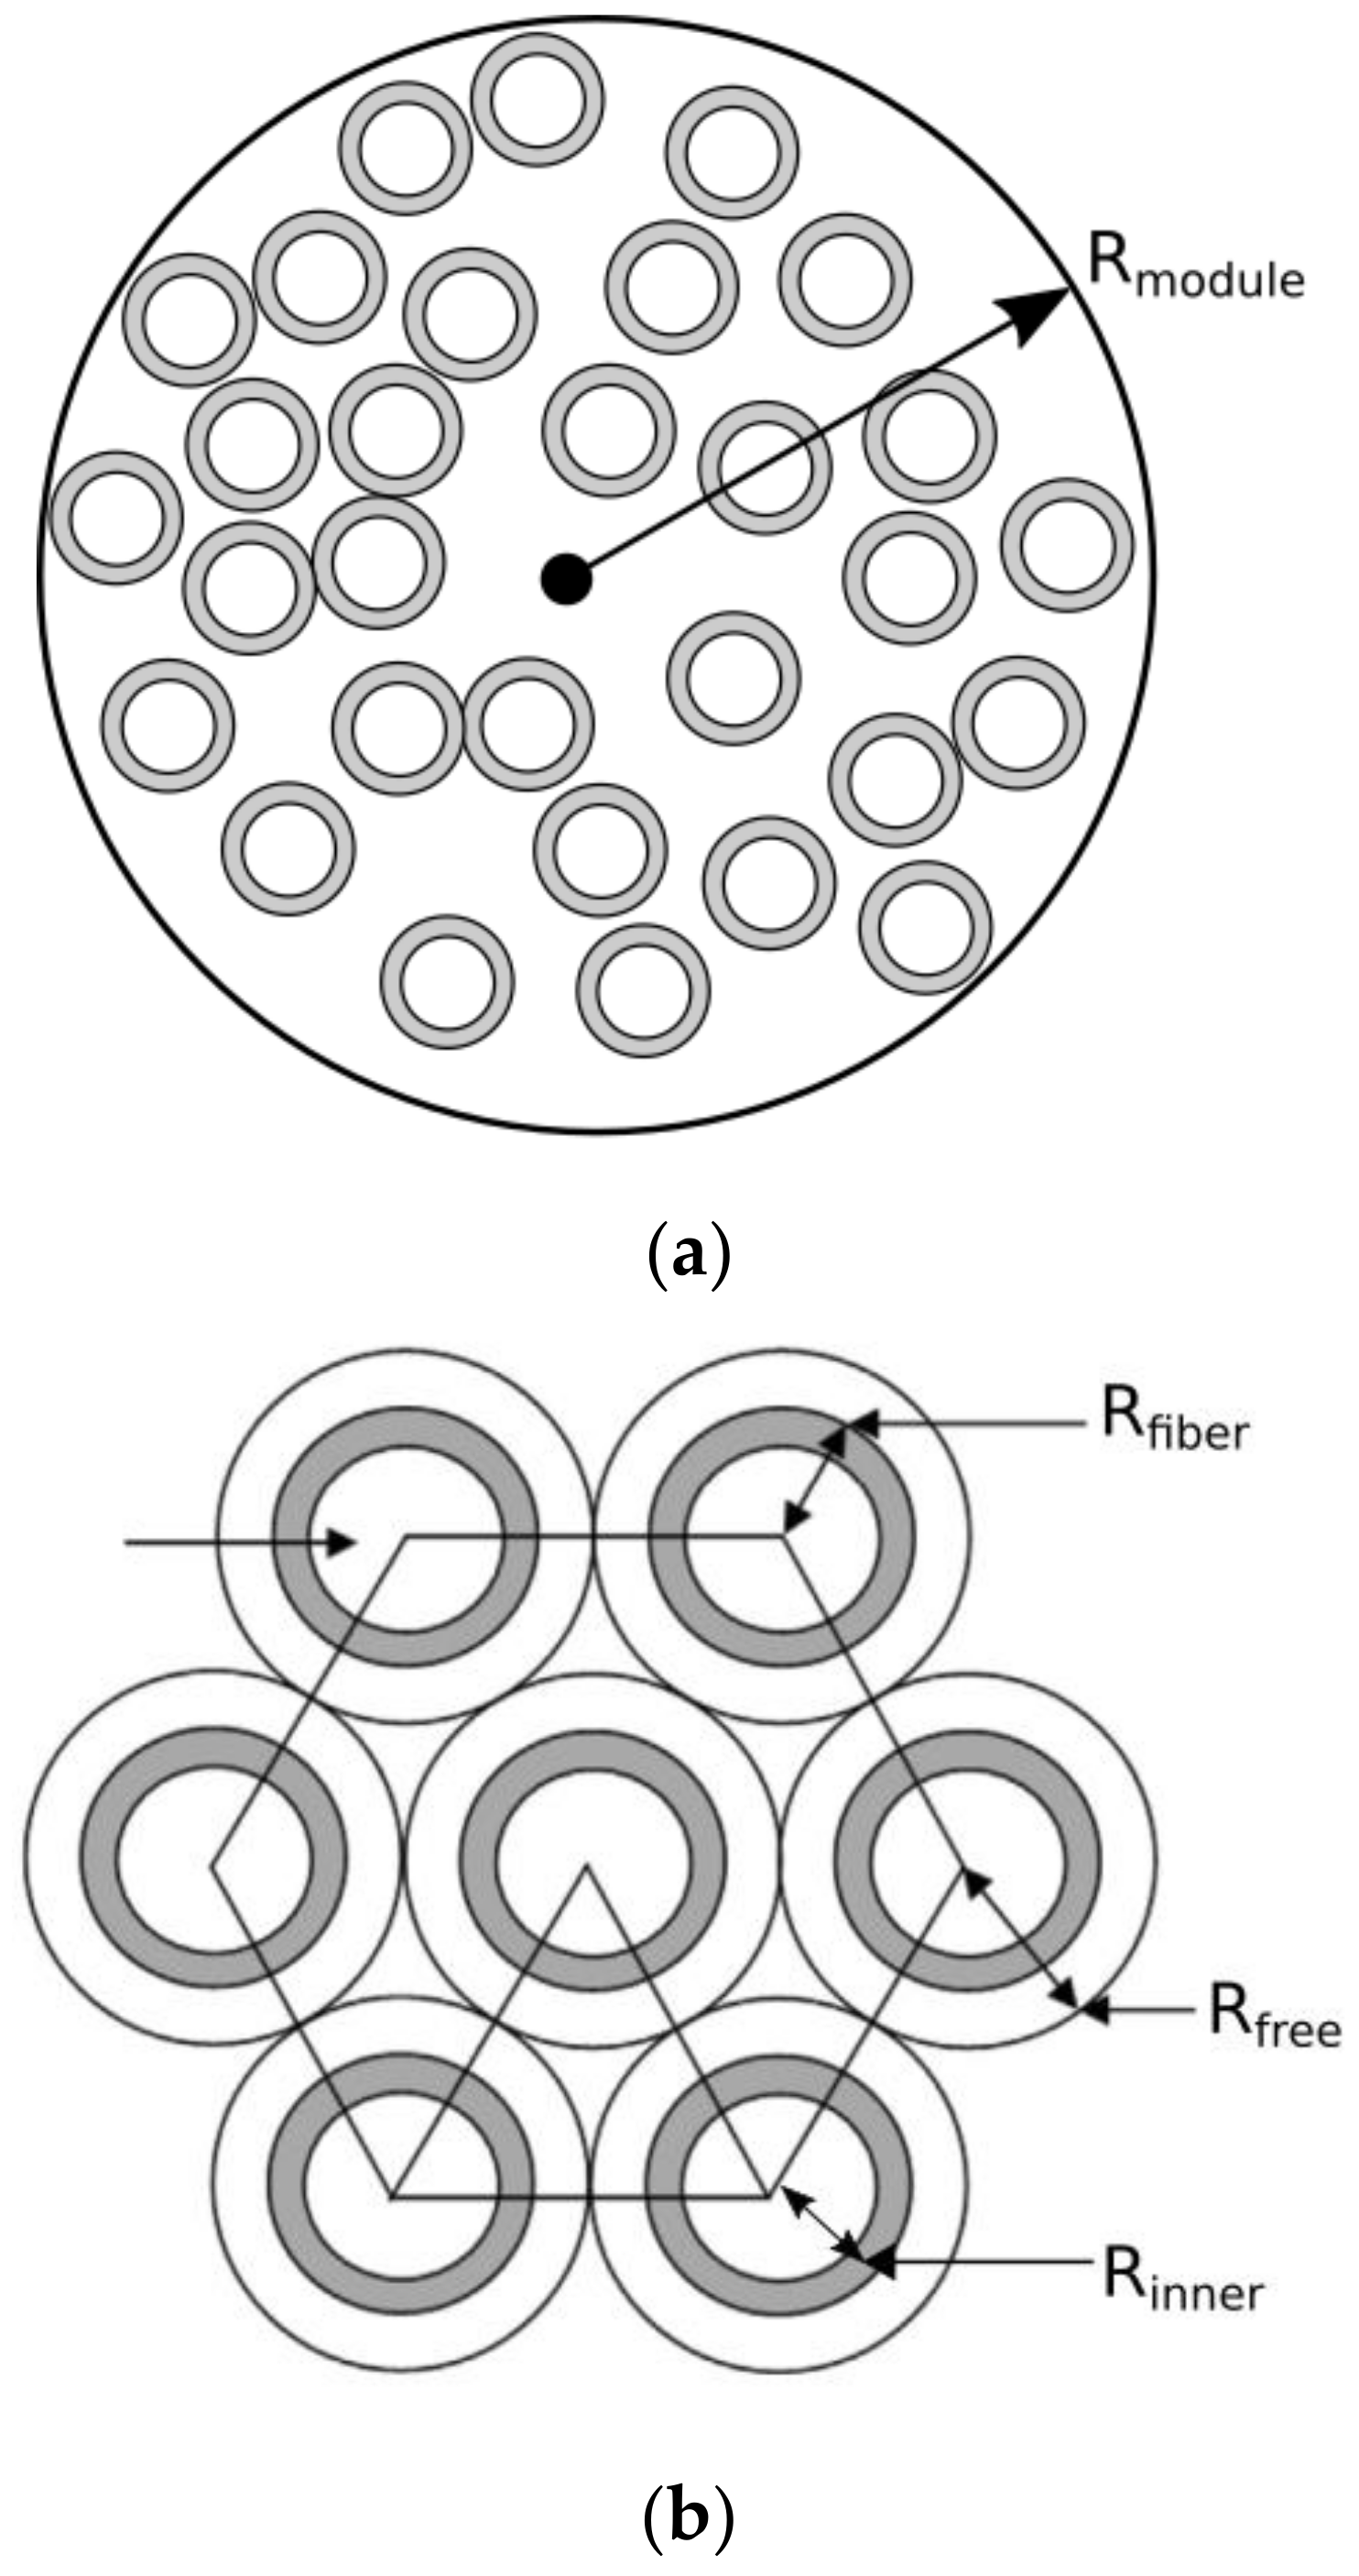
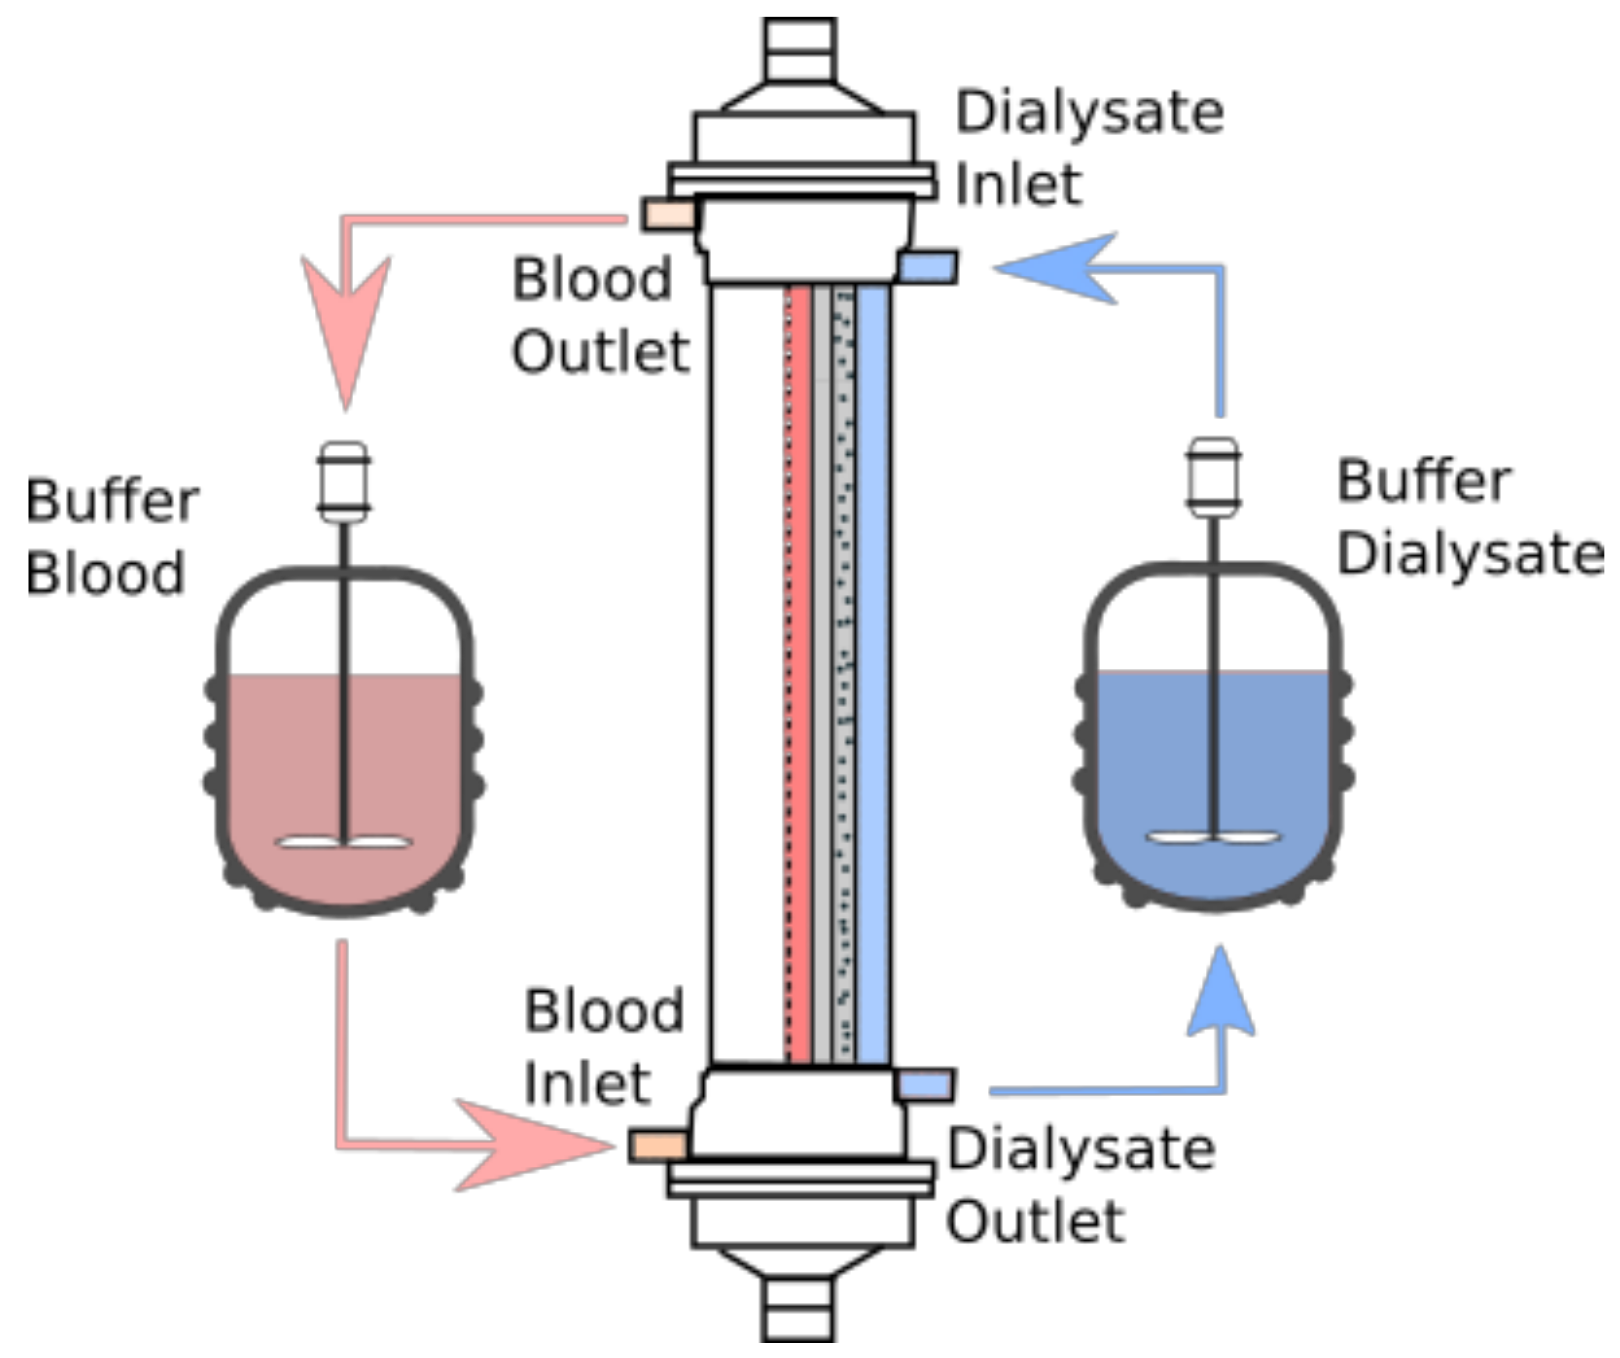
2.1. Model Description

A hemodialysis module comprises a large number of hollow fibers. In order to perform a feasible analysis, we simplify the fiber packing problem, Figure 1a, in the module by dividing the apparatus into sub-cells that contain hollow fibers in a regular arrangement, shown in Figure 1b. The fibers are assumed to have a cylindrical shape, and the fluid flow is calculated using the unit cell model [13]. In practice, it is implicitly assumed that each hollow fiber of the module has the same fractional contribution to the overall separation performance.
Following Happel’s free surface model [14], we have adopted the assumption that the unit cell is composed of three concentric cylinders: (a) a tube/blood side, (b) a membrane side, and (c) a shell/dialysate side. The inner cylinder of radius Rinner corresponds to the blood domain (DOM1) of the membrane; the membrane domain (DOM2) has thickness dmem and extends from a radial position Rinner to Rfiber = Rinner + dmem; and the cylindrical fluid envelope (DOM3) with free surface of radius Rfree, which encloses the dialysate fluid that flows in the countercurrent direction to the blood flow. This representation reduces the analysis of the entire dialysis module into the analysis of a single hollow fiber that consists of the three aforementioned domains shown in Figure 2. The membrane domain (DOM2) is further divided into two distinct layers, namely, the skin layer and the adsorptive layer that contains the carbon sorbents.

2.2. Momentum Transport

Although transmembrane pressure is also applied in order to increase the permeance of the toxin through the membrane in real operational conditions, in the present work, we focus on the operational regime where diffusion and adsorption are the main mechanisms for toxin removal. A constant, fully developed laminar velocity profile for the blood and the dialysate streams along the direction parallel to the fiber is assumed, whereas flow in the radial direction is neglected. Moreover, the carrier fluid (human plasma) is assumed to behave as a Newtonian fluid, in contrast to the human blood, which is non-Newtonian. In the present approach, we focus on human plasma, although the model can be extended to account for human blood rheology.
A fully developed laminar velocity profile of a viscous fluid is assumed for the blood domain:
v z = 2 Q b l o o d N π R f i b e r 2 [ 1 ( r R i n n e r ) 2 ]
where N is the number of fibers in the module, Qblood is the blood flowrate, and r is the radial coordinate. It is also assumed that the total blood flowrate is equally distributed among the fibs. A laminar, parabolic velocity distribution is prescribed in the exterior of the hollow fibers in the dialysate domain, adopting Happel’s model [15]:
v z = 2 Q d i a l y s a t e U 2 ( ( R f r e e R f i b e r ) 2 1 ) ( 1 ( r R f i b e r ) 2 + 2 ( R f r e e R f i b e r ) 2 ln ( r R f i b e r ) ) 4 ( R f r e e R f i b e r ) 2 1 3 ( R f r e e R f i b e r ) 4 + 4 ( R f r e e R f i b e r ) 4 ln ( R f r e e R f i b e r ) ,
where R f r e e is defined as:
R f r e e = ( 1 1 ϕ ) R i n n e r ,
ϕ = 1 N ( R f i b e r R m o d u l e ) 2
where ϕ the fraction of the void volume (the space between the hollow fibers) in the hemodialysis module.

2.3. Mass Transport

2.3.1. The Blood-Sided Domain (DOM1)

On the blood tube side (DOM1), convective and diffusive mass transport of a solution of toxins with the proteins is active. Although the toxins permeate the membrane, this is not the case for the proteins that are rejected from the membrane due to the selective-layer cut-off. The interaction of the toxins and the albumin in the domain is described by an effective reaction rate term in the transport equation. The corresponding transport equation for each chemical species on the blood side is as follows:
C p r o t e i n , b l o o d t ( D b u l k , p r o t e i n , b l o o d C p r o t e i n , b l o o d ) + v C p r o t e i n , b l o o d = r A t o x i n , b l o o d ,
C c o m p l e x , b l o o d t · ( D b u l k , c o m p l e x , b l o o d C c o m p l e x , b l o o d ) + v C c o m p l e x , b l o o d = r A t o x i n , b l o o d ,
C t o x i n , b l o o d t · ( D b u l k , t o x i n , b l o o d C t o x i n , b l o o d ) + v C t o x i n , b l o o d = r A t o x i n , b l o o d ,
where r A i is the reversible, bimolecular binding reaction rate of the protein-bound toxin to albumin and the formation of the protein-bound toxin-albumin complex.
For most toxins, the molar ratio to albumin is typically low, resulting in an excess of albumin binding sites. In this case, the influence of albumin concentration on the free fraction depends mainly on the binding constant [16]. However, the concentration of those toxins in patients with advanced chronic kidney disease becomes relevant, due to their elevated levels, and results in reduced protein binding caused by the competitive toxin binding on albumin available sites. The identification of the binding sites of PCS and IS on HSA has been extracted with the site marker displacement experiments [17], showing that numerous uremic toxins bind specifically to the Sudlow’s sites I in subdomain 2A and II of human serum albumin [18]. The binding procedure was investigated and explained thoroughly by Watanabe [4], where it was found that there is a high affinity of the PBTs towards the Sudlow’s site II in subdomain IIIA on HSA [5], and that there are low-affinity sites for both toxins on HSA. The concentration equilibrium association constant of the PCS and the IS with human serum albumin was determined to be Keq,PCS = 1 × 10⁵ M−1 [4] and Keq,IS = 0.98 × 10² M−1 [4], respectively, for the high-affinity sites. The low-affinity sites exhibit much lower binding constants for both toxins, such as Keq,2,PCS = 8 × 10³ M−1 and Keq,2,IS = 19.6 × 10³ M−1 [4]. Moreover, the binding affinity of PCS for HSA has been investigated by Bergé-Lefranc [6], who reported a moderate affinity for PCS on HSA that translated to a binding constant of Keq,PCS = 3.3 × 10² M−1. From the literature review, it is observed that there is a discrepancy in the affinity constants of the toxins on HSA; however, due to the fact that the affinity constants of the toxins are directly correlated to the toxins’ bound and unbound fractions, a closer inspection of the fractions may facilitate the indirect extraction of the affinity constants. In another study [6], the measured bound percentage of PCS ranged from 13% to 30%. The bound fraction of various toxins in the human plasma is reported in the work of Itoh [19], where the bound fraction of the total indoxyl sulfate is 97.7 ± 0.2, while the total bound fraction of PCS is 95.1 ± 0.6. The bound fraction of the PBT spiked with uremic concentrations of 40 mg/L, yielding the values of 88.7% and 92% for IS and PCS, respectively. Those findings set the concentration equilibrium association constant of IS and PCS with HSA to Keq,IS = 0.34 × 10² M−1 and Keq,PCS = 0.54 × 10² M−1 , respectively.
In the present study, we consider the fact that the complex comprised of the adhesion of a free toxin adhered to the albumin (protein) dissociates to its elements without detectable intermediates. This phenomenon is described by an association and a dissociation reaction step. The association reaction involves two reactants, the albumin and the toxin, and is described by a second-order reaction rate, while the microscopic dissociation rate describes simply the probability that the complex will dissociate in a unit of time. In our case, we define an apparent dissociation rate that is modeled by a first-order reaction with respect to the complex concentration. This apparent dissociation rate denotes the net dissociation of the toxin from the complex in the form of:
r t o x i n , b l o o d = k d i s , t o x i n , b l o o d C c o m p l e x ( t o x i n - A l b ) , b l o o d .

2.3.2. The Skin/Web Layer Domain (DOM2)

The skin layer is a very thin membrane segment in contact with the blood. A diffusion equation is used to describe the mass transport of the toxin. Albumin, as well as the complexes formed in the blood domain, with a molecular weight of 66.5 kDa [5] do not permeate through the membrane due to the membrane cut-off. Thus, a simple diffusion equation is employed solely for the transport of the toxins:
C t o x i n , i t ( D e f f 1 , t o x i n , i C t o x i n , i ) = 0
Deff1, toxin,i is the effective diffusivity of toxin i in the layer under consideration.

2.3.3. The Adsorptive Layer (DOM2)

Isothermal mass transport of the toxins within the adsorptive layer is considered, including diffusion into the membrane pore structure, and physical adsorption on the activated carbon particles. In this work, we adopted the modeling procedure followed in [20,21], which involves macroscopic mass transport of the dissolved toxins that is accompanied by the bulk fluid motion and adsorption and described by the transient diffusion-reaction equation. The activated carbon sorbent is assumed to be a homogeneous medium during adsorption modeling, uniformly packed in the interior of the adsorptive membrane layer. Moreover, instantaneous equilibrium between the toxin and the sorbent is assumed, and any viscous force that acts on the sorbent is neglected.
More analytically, the following assumptions, are considered:
  • Film diffusion effects are negligible.
  • Diffusion is fast compared to intra-particle adsorption; hence, local equilibrium conditions apply.
Adsorption is modeled using Langmuir isotherms. The isotherms for the creatinine and the toxin adsorption in the dual-layer mixed-matrix membranes (MMMs) appear to be of Langmuir type, according to literature [22]. Thus, the differential mass balance of the toxin is given by:
C t o x i n , i t · ( D e f f 2 , t o x i n , i C t o x i n , i ) = ρ A C ε q t o x i n , i t ,
where C t o x i n , i , q t o x i n , i are the (pore) concentration of toxin i in the fluid and the adsorbed mass of the toxin on the sorbent, respectively. ρ A C is the density of the carbon in the membrane volume, and ε is the porosity of the adsorptive membrane layer. The accumulation rate is given by the chain rule with respect to the concentration in the fluid:
q t o x i n , i t = ( d q t o x i n , i d C t o x i n , i ) C t o x i n , i t .
The correlation of the toxin concentration in the plasma to that of the monolayer capacity on the activated carbon is given by the Langmuir formalism as follows:
q t o x i n , i = q t o x i n , 0 i K t o x i n , i C t o x i n , i 1 + K t o x i n , i C t o x i n , i ,
q t o x i n , i C t o x i n , i = q t o x i n , 0 i K t o x i n , i ( 1 + K t o x i n , i C t o x i n , i ) 2 ,
q t o x i n , 0 i is the maximum adsorption constant, and K t o x i n , i is the Langmuir kinetics constant. Ιn this work, in the case of creatinine, the isotherm of a similar (previous generation) membrane absorber [22] under batch adsorption condition was used, while for PCS and IS the adsorption isotherms were unknown. The Langmuir parameters of the equilibrium for the toxin data were extracted by a fitting procedure.

2.3.4. The Dialysate-Side Domain (DOM3)

The mass transport in the dialysate domain is described with an advection-diffusion equation:
C t o x i n , i t ( D t o x i n , i C t o x i n , i ) + v C t o x i n , i = 0 .

2.4. Boundary Conditions for Mass Transport

2.4.1. The Blood Inlet

The concentrations of toxins, albumin, and their complexes are assumed to be in equilibrium at the blood inlet. In order to observe the effects of the model parameters on the efficiency of the separation process, it is necessary to evaluate the concentration values in the buffers/tanks used, as multiple passes of both the blood and the dialysate were considered (see Figure 3). This means that the concentration of the toxins in the inlet of both domains is not constant and depends on the mixture composition. As the separation process progresses, the total toxin mass to be removed is reduced leading to a gradual shift of the equilibrium in the buffer/tank. By assuming that there is an immediate distribution and equilibrium establishment between the toxins, the HSA, and the complexes throughout the buffer tank, the calculation of the free toxin fraction in the buffer is simplified. The concentration of the ligands at the inlet is given by the solution of the set of algebraic equations, and is used as initial condition for the solution of the differential equations in the blood domain:
C A l b , t o t = C A l b I S + C A l b P C S + C A l b f r e e ,
C I S , t o t = C I S f r e e + C A l b I S ,
C P C S , t o t = C P C S f r e e + C A l b P C S ,
K e q , I S = C A l b I S C A l b f r e e C I S f r e e ,
K e q , P C S = C A l b P C S C A l b f r e e C P C S f r e e .
The total toxin concentration for IS and PCS in the blood buffer tank is varied according to the equations:
d C P C S , t o t d t = A i n n e r J b , P C S n ^ A i n n e r d A ,
d C I S , t o t d t = A i n n e r J b , I S n ^ A i n n e r d A ,
where J b , P C S and J b , I S is the total mass flux of the toxin in the blood domain and n ^ A i n n e r is the unit vector vertical to the inner membrane surface ( A i n n e r ) pointing outwards.

2.4.2. The Dialysate

The accumulation of the toxins in the dialysate buffer tank is described by the following equations for each toxin:
d C P C S , t o t d t = A o u t e r J d , P C S n ^ A o u t e r d A ,
d C I S , t o t d t = A o u t e r J d , I S n ^ A o u t e r d A ,
where J d , P C S and J d , I S is the total mass flux of the toxin in the dialysate domain and n ^ A o u t e r is the unit vector vertical to the outer membrane surface ( A o u t e r ) pointing outwards.

2.4.3. The Blood and Dialysate Outlets

At the blood and dialysate outlets, all the concentration derivatives normal to the boundaries, (i.e., in the axial direction) are set to zero. This is equivalent to having only convective outflow in the axial direction.

2.4.4. The Boundary Conditions at Layer Interfaces

At the interfaces between consecutive layers— blood domain to skin layer, skin layer to adsorptive layer, and adsorptive layer to dialysate domain—the continuity of diffusive fluxes is employed as boundary condition for the toxin concentrations.

2.5. Mass Transport

The diffusion coefficient of creatinine in water at room temperature was set to 9 × 10⁻¹⁰ m2/s [23], while the diffusivity of albumin in human serum was set to 6.8 × 10⁻¹¹ m2/s [24].
For the toxins at hand, we assumed that the blood plasma has the same material properties and rheological behavior as water at 25 °C at atmospheric pressure. Thus, the value of the diffusion coefficient of the toxins in water was adopted, and it was approximated by the Stokes–Einstein equation.
The membrane rejected albumin but was permeated by the rest of the solutes (IS, PCS, and Cr). This selectivity was attributed to the inner layer of the membrane, where the pores were small enough to prohibit the permeation of albumin but sufficiently large to let the toxins pass through. In this approach, we desired to correlate the porosity and tortuosity of the membrane layer with the permeability of the membrane. For this reason, we assumed that the capillary tube model adequately described the fluid flow through the membrane layers. Under this assumption, the membrane layers were considered as a bundle of capillary tubes with the spaces between them filled with a non-porous material. The relation between the permeability, the tortuosity, and the porosity of each layer is expressed by [25]:
ε l a y e r τ l a y e r = 8 K e f f , l a y e r r c , l a y e r 2 ,
where r c , l a y e r is the characteristic capillary tube radius, τ l a y e r is the layer tortuosity, K e f f , l a y e r is the membrane layer permeability, and ε l a y e r is the membrane layer porosity, and subscript layer takes values 1 or 2 for the skin and the adsorptive layer, respectively.
The overall effective diffusion coefficient and the effective permeability are calculated with the method of membrane layer resistances in series [26]. For a system with two different membrane layers, the overall diffusivity and permeability for radial flow is obtained using the harmonic average:
D e f f , m e m = ln ( R a d s R i n n e r ) ln ( R s k i n R i n n e r ) D e f f , 1 + ln ( R a d s R s k i n ) D e f f , 2 ,
K e f f , m e m = ln ( R a d s R i n n e r ) ln ( R s k i n R i n n e r ) K e f f , 1 + ln ( R a d s R s k i n ) K e f f , 2 .
Assuming bulk diffusion for all solutes in the total membrane topology and dividing Equation (25) with the bulk diffusivity of the toxin, the following equation is obtained:
D e f f , m e m = ln ( R a d s R i n n e r ) ln ( R s k i n R i n n e r ) ε 1 τ 1 + ln ( R a d s R s k i n ) ε 2 τ 2 .
Moreover, substituting Equation (24) into Equation (26) yields:
K e f f , m e m = ln ( R f i b e r R i n n e r ) 8 τ 1 ln ( R s k i n R i n n e r ) ε 1 r c , 1 2 + 8 τ 2 ln ( R f i b e r R s k i n ) ε 2 r c , 2 2 .
By simultaneously solving Equations (27) and (28) we correlate the transport coefficients in each membrane layer to the corresponding effective membrane coefficients, and thus, can lead to the extraction of the unknown structural quantities for each layer:
ε 1 τ 1 = ( 8 ( ε tot τ tot ) K e f f , m e m ln ( R s k i n R i n n e r ) ) ( r c , 2 2 r c , 1 2 ) ( ( ε tot τ tot ) r c , 2 2 8 K e f f , m e m ) ln ( R f i b e r R i n n e r ) r c , 1 2
ε 2 τ 2 = ( 8 ( ε tot τ tot ) K e f f , m e m ln ( R f i b e r R s k i n ) ) ( r c , 2 2 r c , 1 2 ) ( ( ε tot τ tot ) r c , 1 2 8 K e f f , m e m ) ln ( R f i b e r R i n n e r ) r c , 2 2
The macroscopic effective diffusivity of the whole membrane, needed in the expression above, can be extracted by direct comparison between experimental and numerical dynamic profiles of the creatinine removal by diffusion. The numerical profiles were obtained by solving the creatinine transport model using COMSOL Multiphysics®. The values that were utilized in this work, are those where the experimental and the numerical profiles of the creatinine removal matched within an average relative error of 0.05 for a 4-h treatment. As a feature to characterize the relative error between the two values, we used the normalized root mean square deviation (NRMSD) between the time varying protein clearance and the experimental clearance of the creatinine,
e r r o r = 1 n i = 1 n | Rem n , e x p Rem n , n u m Rem n , e x p | ,
with n being the total number of experimental data obtained from the diffusion-based removal experiments at different time intervals.

3. Results and Discussion

3.1. Effective Properties of the Membrane Layers

The total ratio of the overall membrane porosity to the overall membrane tortuosity was found to be ε tot τ tot = 0.23, which translates to a total effective diffusivity of 2.25 × 10⁻¹⁰ m2/s for creatinine. The calculated value is close to the effective transport value for similar, hollow fiber membranes commonly contained in hemodialyzers, such as the Syntra160® (Baxter Healthcare, Deerfield, IL, USA) and the HF80S® (Fresenius Medical Care, Bad Homburg, Germany), with effective diffusivity of creatinine equal to 1.97 × 10⁻¹⁰ m2/s and 1.85 × 10⁻¹⁰ m2/s , respectively [27].
On the grounds that HSA cannot transport through the membrane, the pore radius should be equal to or smaller than the HSA radius. In the literature, it was found that albumin effective radius is 3.4 nm [28]; however, albumin does not have a spherical shape. The minimum radius of this protein, Rmin is calculated by [29]:
R min = 0.066 ( M W ) 0.33 n m ,
where MWD is the molecular weight in Daltons. Thus, the value of 2.6 nm is set as the characteristic capillary radius for the skin layer. The characteristic capillary radius for the second layer is set to 7.2 μm, which is the average macrovoid size, sampled from the SEM image [30]. Considering the above formulation, the effective layer transport properties are summarized in Table 1.

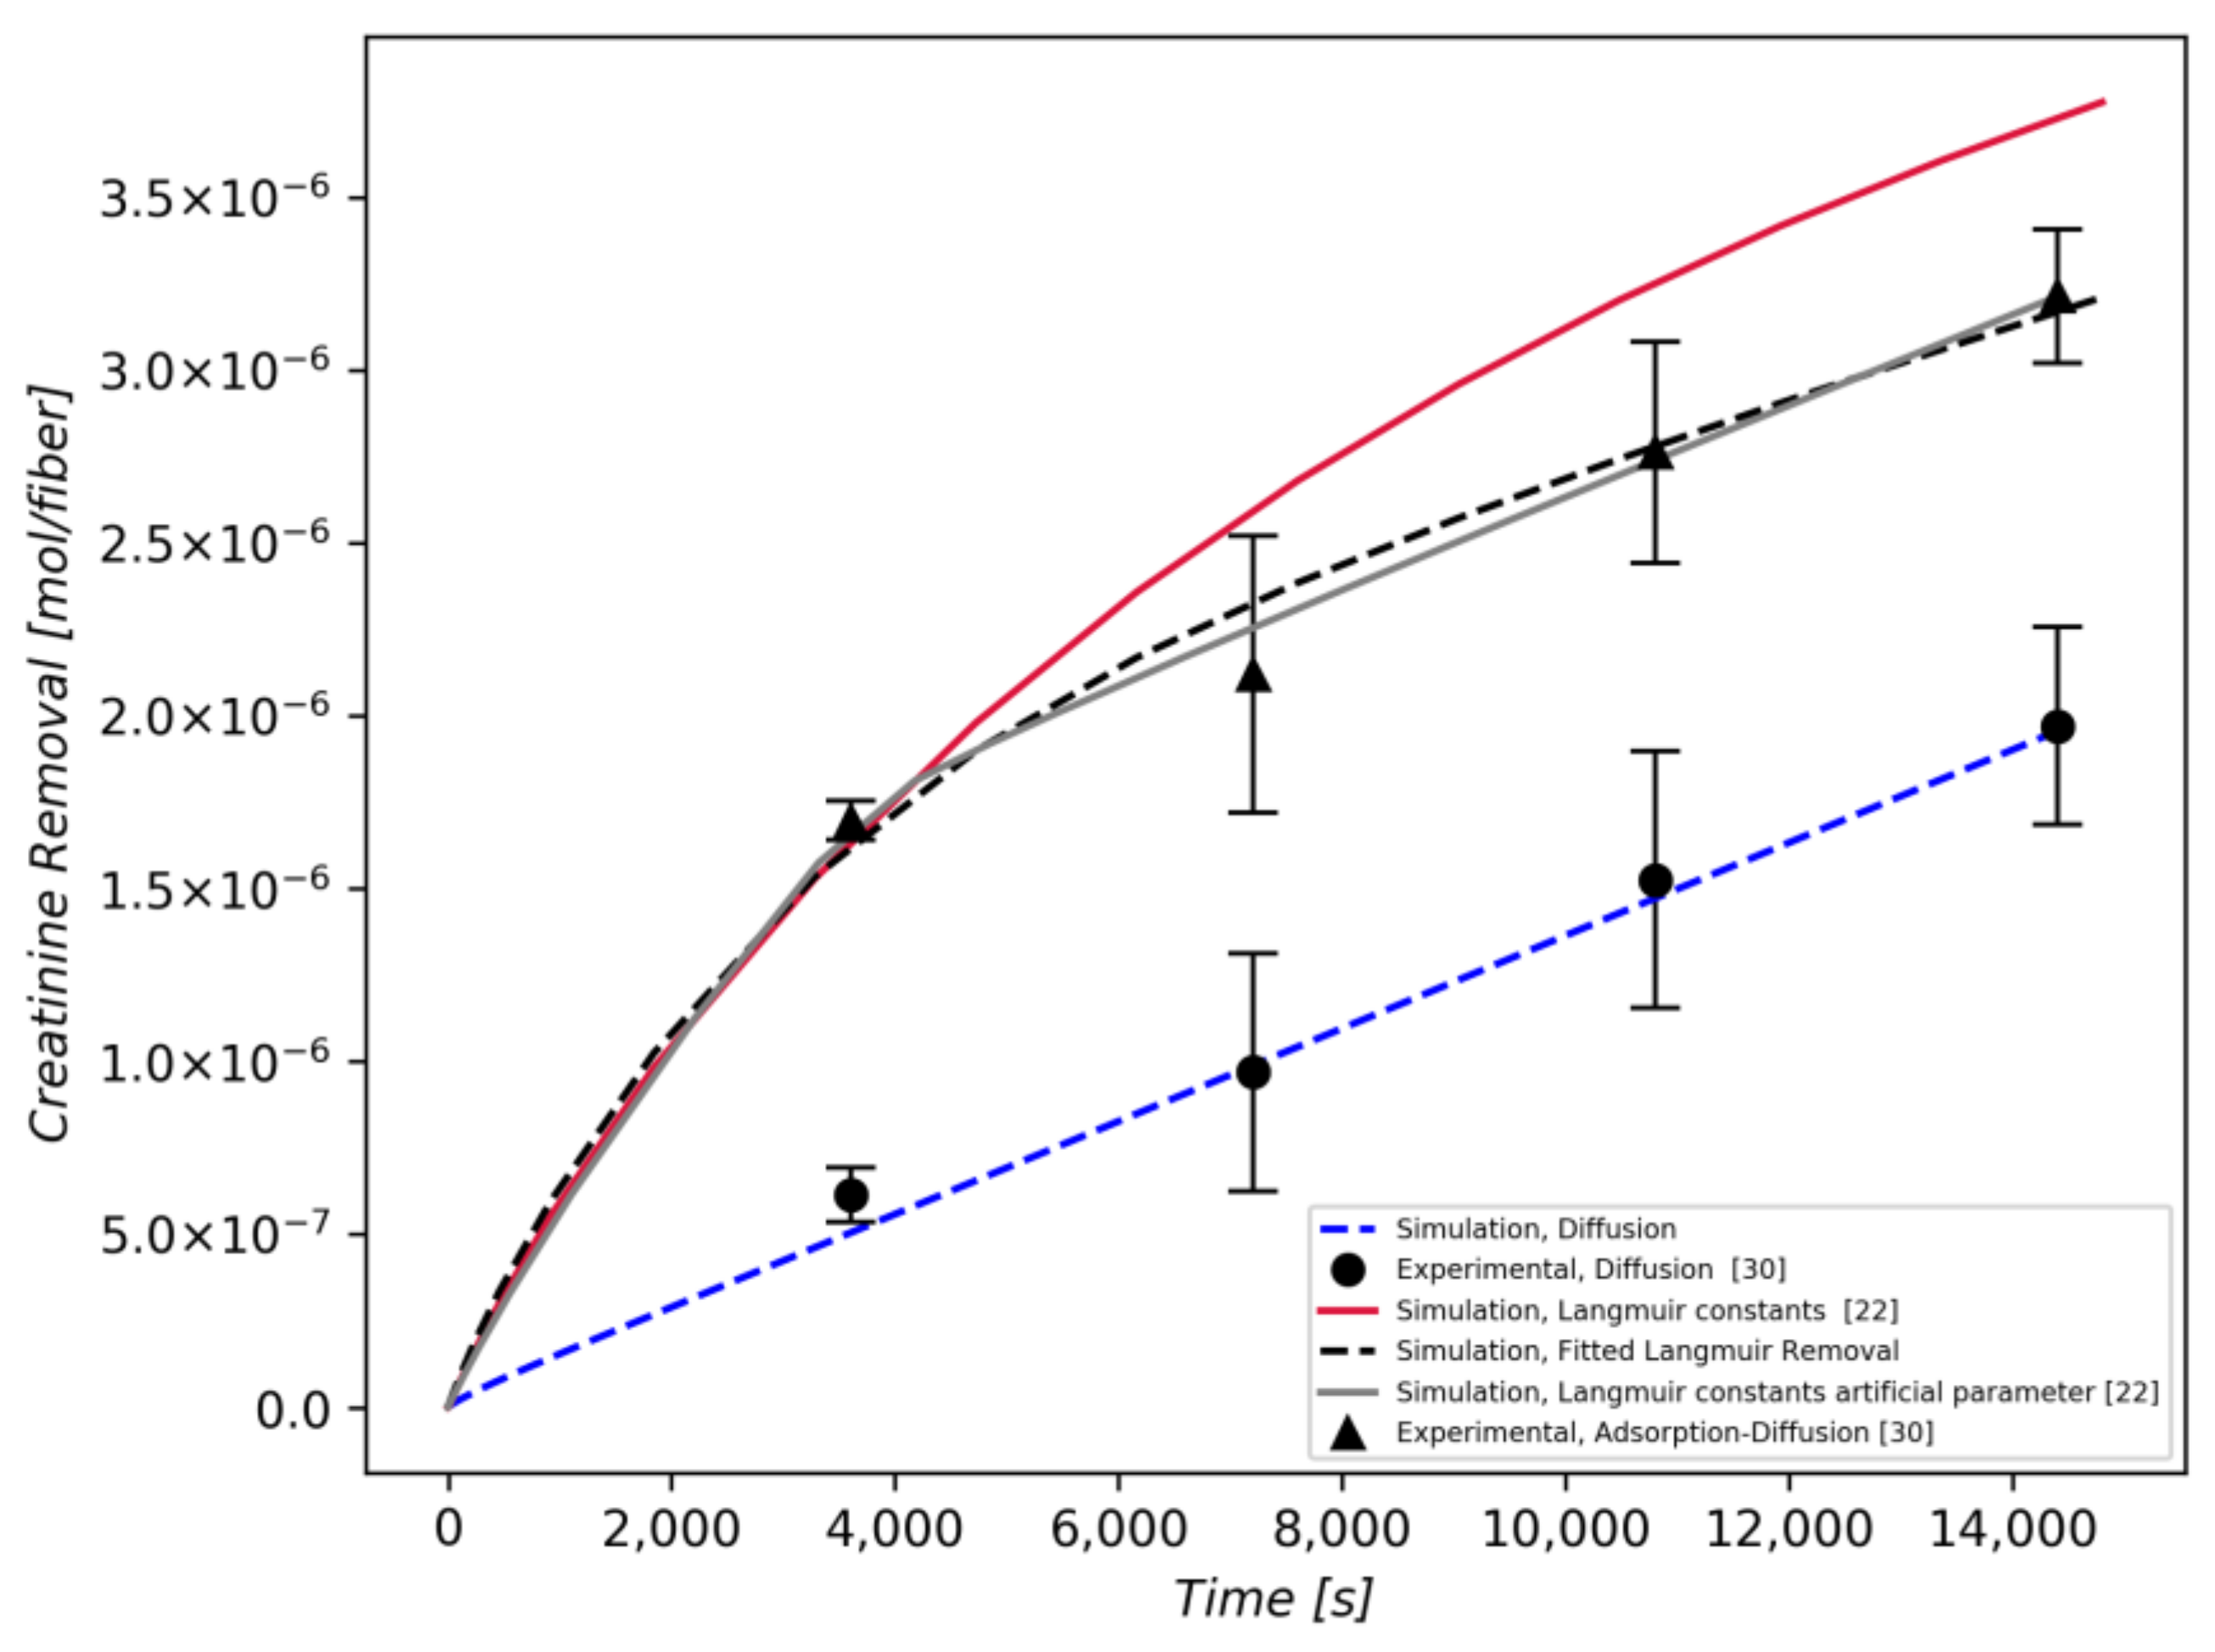
3.2. Creatinine Removal

Initially, the model was validated against experimental data for the same membrane, published in the literature [30], in a diffusion-adsorption experiment.
Figure 4 shows that the model behavior using the Langmuir adsorption constants of Tijink et al. [22], which where extracted from a previous generation mixed-matrix membrane (M2) filled with the same AC particles, is reasonably accurate at the early stages of the separation process, whereas at later stages of the removal process, the model overestimates the creatinine removal (red curve). This is attributed to the fact that the adsorption capacity for creatinine in [22] is high (3.07 g/g AC), in contrast to other publications that report lower values of adsorption constants [31,32], rendering adsorption the dominant mechanism for solute removal in the beginning of the process.
An improved prediction of the creatinine removal over time can be obtained (grey line) if the unit step function is employed to act on the aforementioned adsorption constants of the creatinine, in order to nullify their effect after saturation [3600 s of operation]. This is based on the fact that the sorbents are saturated at this time, and the separation process beyond that point is carried out by diffusion only [30].
In the absence of any information on the adsorption isotherm or the sorbent saturation time, a non-linear optimization routine is employed to evaluate the adsorption constants that are treated as free variables. Specifically, the Nelder–Mead method [33] is utilized to minimize the relative error between the experimental curve and the curve obtained by solving the set of partial differential equations, generating a best fit curve with the optimum adsorption constants [34]. The best fit is obtained for maximum adsorption capacity q c r e a t i n i n e , 0 i = 0.804 mol / kg and Langmuir constant K l c r e a t i n i n e , i = 6.9    m 3 / mol and is shown in Figure 4 (black dashed curve).

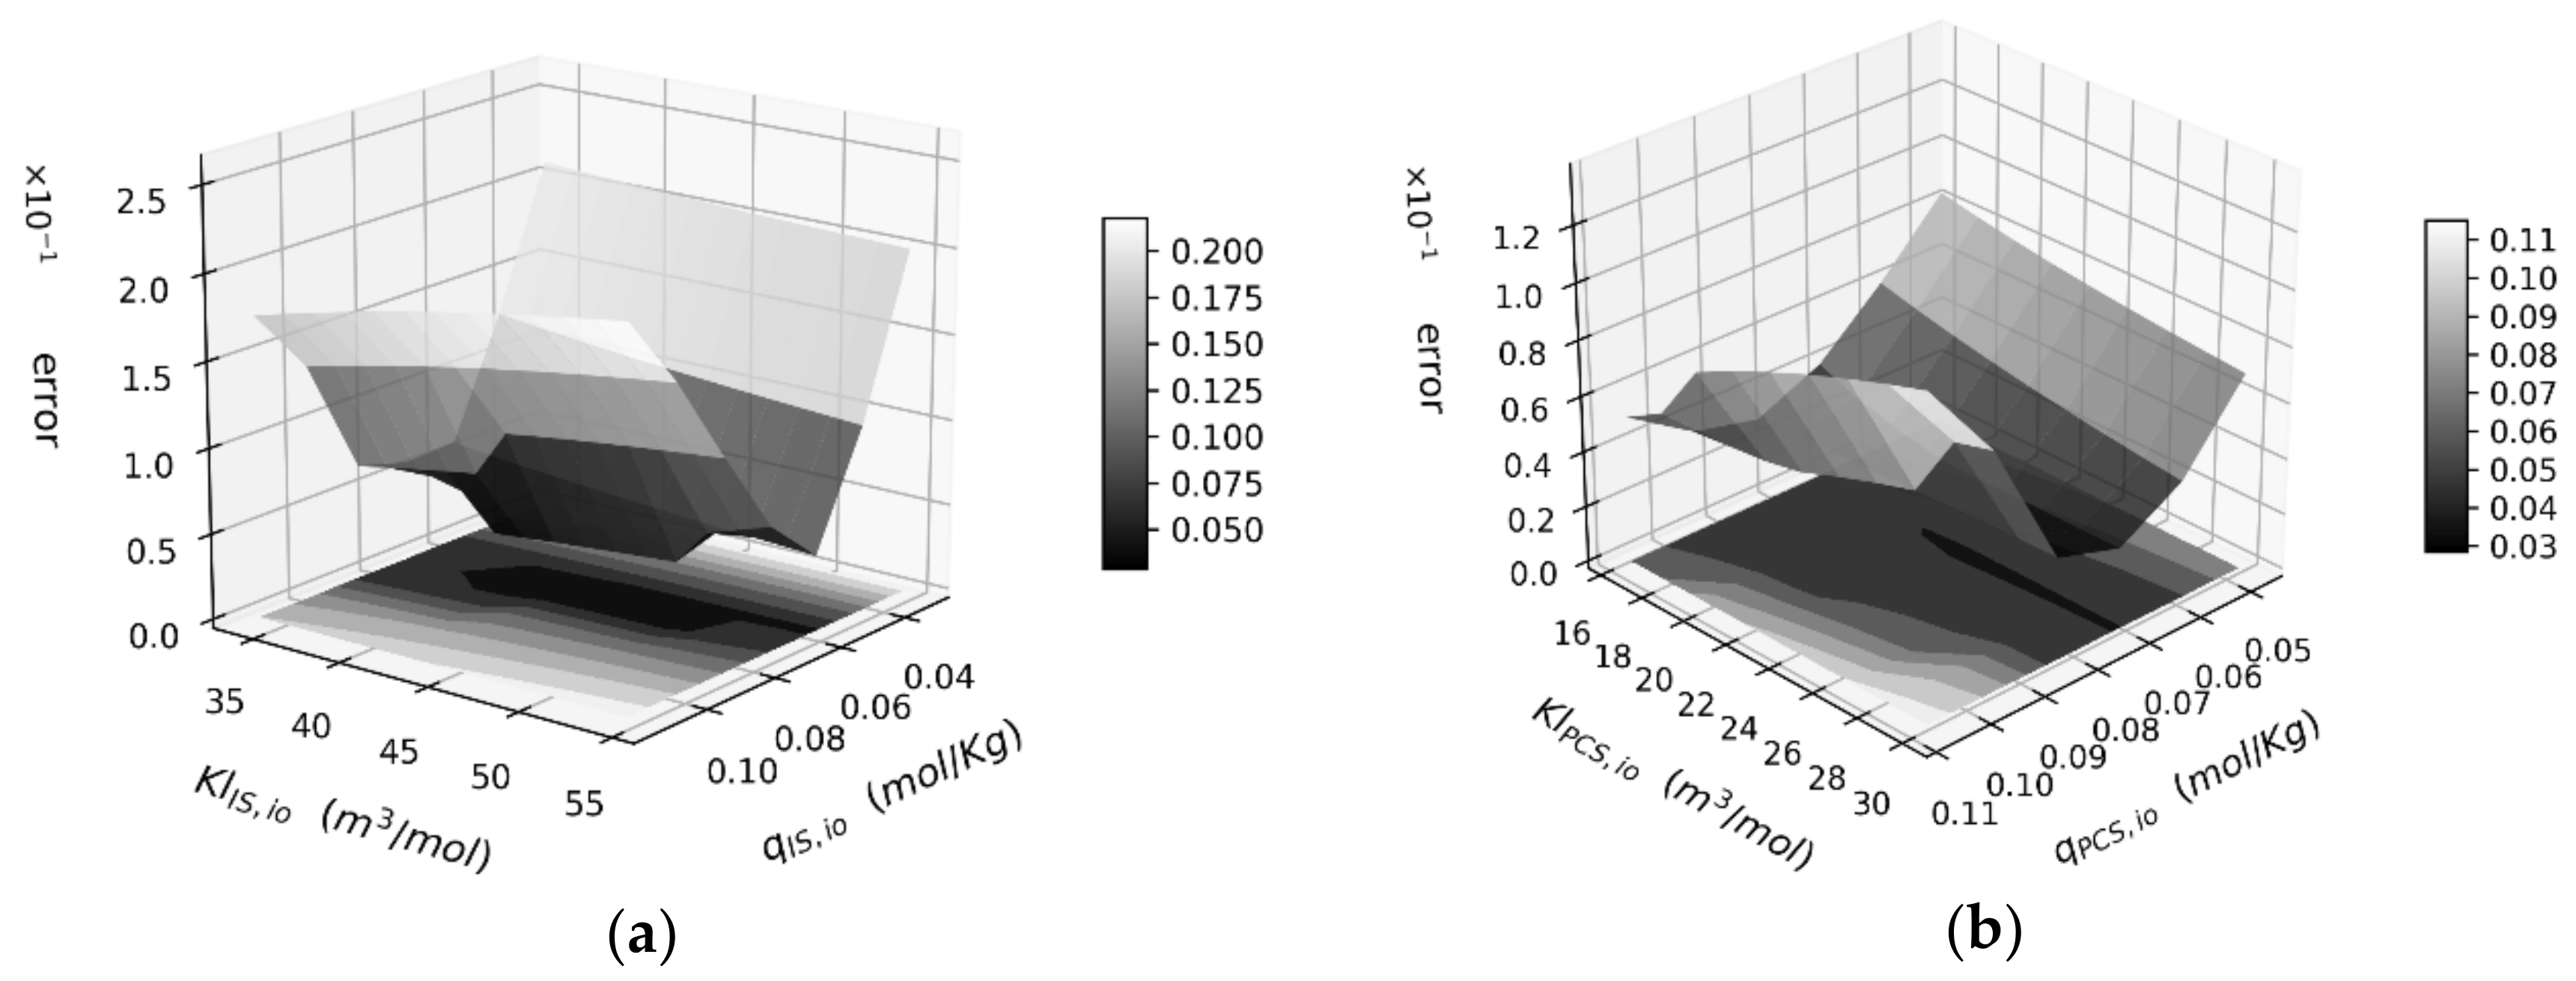
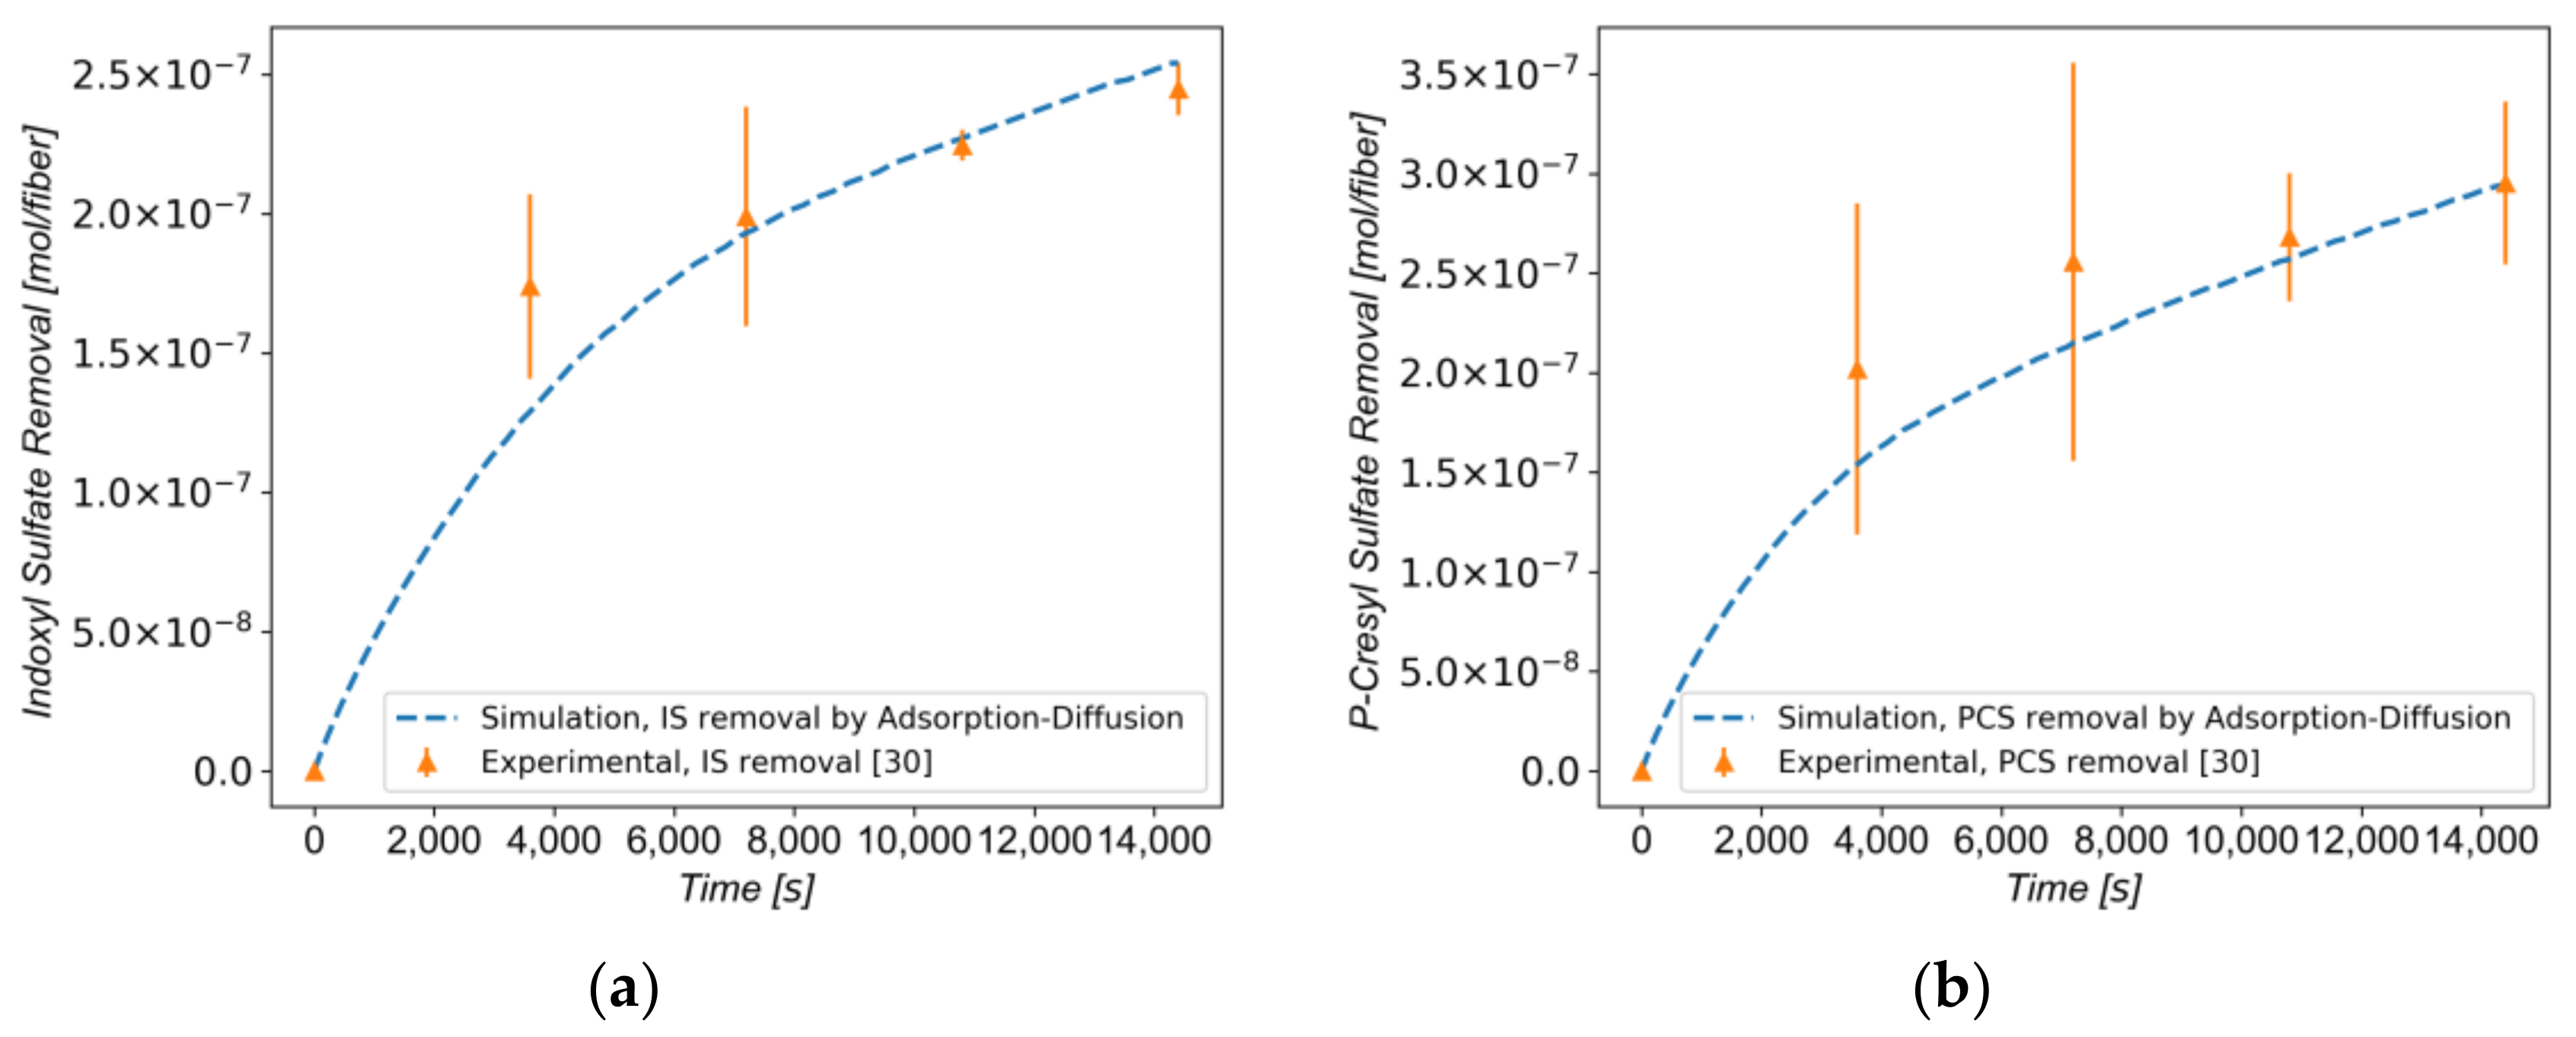
3.3. Protein-Bound Toxins Removal

Following validation of the model for creatinine by an ex-vivo study, a parameter study has been performed for the investigation of the removal efficiency of the PBTs under AC loading in the membrane. Due to the fact that the specific association and dissociation rate constants were not available in the literature, the toxins’ apparent dissociation rate constant was considered as a fitting parameter.
Using the mathematical model and the optimization routine previously described, we adopted the Langmuir adsorption constants that were calculated in the previous section. The error function depends on the model parameters and was represented by an n-dimensional surface, the minimum of which was sought. In order to ensure that a given set of “optimal” model parameters represented the true global minimum of the error surface and not a local minimum, we varied the initial guesses and compared the resulting model for several parameters. Surface plots of the relationship between q t o x i n , 0 i , K l t o x i n , i and the relative error regarding the experimental data for several apparent dissociation rates were produced.
It was observed that the dissociation rate constant value affected drastically the removal and the error function value. This was attributed to the fact that for low values of the dissociation rate constant, the concentration gradient to drive the toxin transport through the membrane was weak, and the values of q t o x i n , 0 i , K l t o x i n , i became irrelevant as the sorption was negligible. On the other hand, high values of the dissociation rate constant increased the concentration gradient significantly, resulting in a total toxin removal that overestimated the experimental data to a great extent. The values of k d i s , I S , b l o o d = 0.7278 s−1 and k d i s , P C S , b l o o d = 1.81 s−1 provided the most appropriate concentration gradient for the removal of both toxins. The surface plots for the best-fitted apparent dissociation rate for IS and PCS are shown in Figure 5a,b, respectively.
The optimal parameter combinations are located in the valleys of both surfaces with an average error of 4.4%. The final results for each toxin are shown in Table 2. The parameter set for IS gives an error value of 4.8%, while the parameter value set for PCS gives an error value of 3.9%.
In Figure 6a,b, the total removal curve for the optimal combination of parameters is shown for each toxin and compared to the experimental data in [30]. The curve fit is satisfactory, and the final toxin removal for both toxins was accurately reproduced.

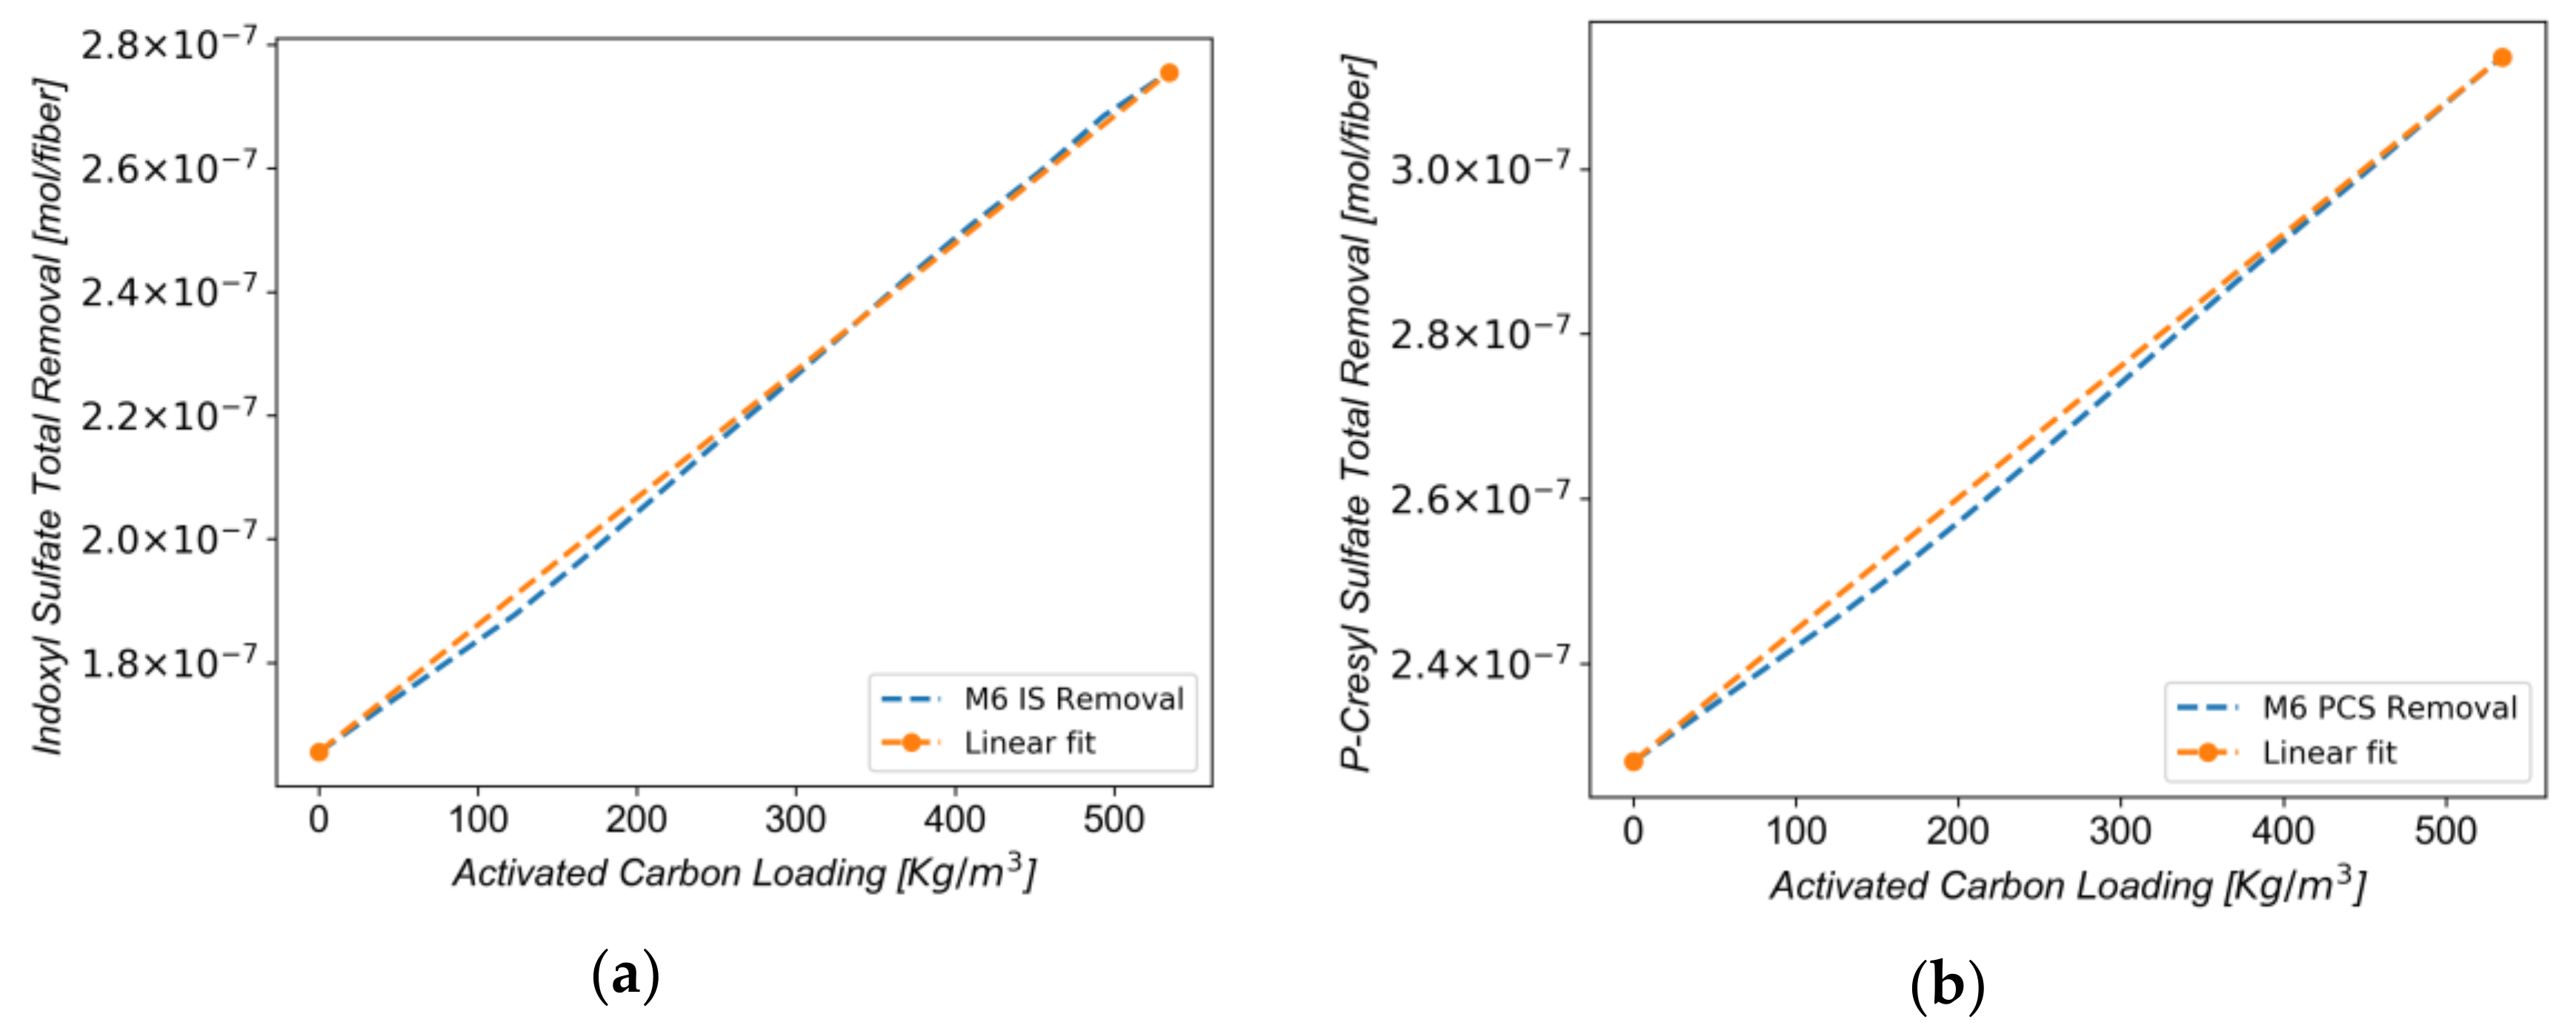
3.4. Effect of Carbon Loading on Toxin Removal

The correlation of the membrane activated carbon loading to the total protein-bound toxin removal was studied next. It is important to note that particle loading is an important parameter, affecting not only membrane morphology, but also the number of adsorptive sites in the mixed-matrix membrane per unit volume. Assuming the negligible effect of the particle loading on the transport properties of the membrane, the total protein-bound toxin removal per fiber was estimated for IS (Figure 7a) and for PCS (Figure 7b), respectively.
The results show a strong positive linear relationship between the activated carbon loading in the membrane and the protein-bound-toxin removal. The y-intercept in Figure 7a (that is, at zero particle loading) is 1.7 × 10⁻⁷ mol/fiber, whereas the slope reveals that 2.1 × 10⁻¹⁰ mol of IS are removed in each fiber per kg/m3 of AC loading. In Figure 7b, the y-intercept is 2.28 × 10⁻⁷ mol/fiber with the slope indicating that 1.63 × 10⁻¹⁰ mol of PCS are removed in each fiber per kg/m3 of AC loading. The simulations show that removal of both toxins is greatly enhanced by the increase of particle loading in the membrane matrix. Comparison of the cases with zero carbon loading and with 411.13 kg/m3 carbon loading (corresponding to the loading of the MMM, reported in ref [30]) shows that the adsorptive layer achieves a 52% improvement in IS removal, and a 31% improvement in PCS removal in comparison to diffusion alone. In addition, our model seems to estimate well the values for the removal of the PBTs solely by diffusion with commercial membranes. In fact, the Fresenius F8HPS® (Fresenius Medical Care, Bad Homburg, Germany), removed 187 mg/m2 of IS and 225 mg/m2 of PCS, while the predicted removal for the M6 membrane was 240 mg/m2 and 300 mg/m2, respectively [30]. Considering that the MMM had a three times lower ultrafiltration coefficient than the F8HPS, we can confirm the finding from the literature that there are no significant differences between the low-flux and the high-flux membranes [19] in the clearance of the PBTs in the absence of activated carbon in their matrices.
In this fashion, the additional driving force attributed to the presence of the AC sorbents can be quantified and its extent evaluated. Moreover, the dependence of protein and toxin concentrations on spatial coordinates and time can also be estimated. In this way, the resulting apparent dissociation rates can be used in order to estimate the free fraction of the protein-bound toxins in a hemodialysis process accounting for toxin dissociation from the albumin.

4. Conclusions

A macroscopic model for the prediction of the toxin removal in hemodialysis modules utilizing mixed-matrix membranes has been developed. A method to predict the effective properties of each layer was presented, using the values for the macroscopic effective properties of the entire membrane and its pore size distribution.
The macroscopic model was used to study the adsorption kinetics of albumin on the activated carbon that is dispersed inside the membrane layers, and to determine the Langmuir constants of adsorption for three different toxins (creatinine, indoxyl sulfate, and p-cresyl sulfate), as well as the dissociation rate constants of the toxins from albumin. The creatinine removal was found to be in very good agreement with known experimental values and other theoretical estimates. By employing a fitting procedure, the apparent dissociation constant of the two protein-bound toxins (IS and PCS) were extracted. The enhancement of the removal rate of the toxins by the combined adsorption-diffusion in a counter-current flow arrangement was proven numerically and was quantified. The developed model can be further utilized during the design and the manufacturing of the MMM to be used in the hemodialysis processes.

Acknowledgments

This paper was produced as part of the Innovation Training Network (ITN) project “TheLink”, funded by the European Union’s Horizon 2020 Research and the Innovation program under the “Marie Sklodowska-Curie” Grant Agreement No. 642890. Methods for transport and sorption simulations in porous membranes were also developed under the “Stavros Niarchos Foundation—FORTH Fellowships” within the Greek project ARCHERS. D. Pavlenko and D. Stamatialis acknowledge the financial support of the ITN project “BIOART”, funded by the European Union FP7 program under the “Marie Sklodowska-Curie” Grant Agreement No. 316690.

Author Contributions

V.N.B., E.D.S., and C.S.S. designed the model; C.S.S. performed the simulations; D.S. designed the experiments; and D.P. provided experimental data. All the authors analyzed the results. C.S.S. wrote the paper.

Conflicts of Interest

The authors declare no conflict of interest.

References

  1. Tijink, M.; Kooman, J.; Wester, M.; Sun, J.; Saiful, S.; Joles, J.; Borneman, Z.; Wessling, M.; Stamatialis, D. Mixed matrix membranes: A new asset for blood purification therapies. Blood Purif. 2014, 37, 1–3. [Google Scholar] [CrossRef] [PubMed]
  2. Tijink, M.S.L.; Wester, M.; Sun, J.; Saris, A.; Bolhuis-Versteeg, L.A.M.; Saiful, S.; Joles, J.A.; Borneman, Z.; Wessling, M.; Stamatialis, D.F. A novel approach for blood purification: Mixed-matrix membranes combining diffusion and adsorption in one step. Acta Biomater. 2012, 8, 2279–2287. [Google Scholar] [CrossRef] [PubMed]
  3. Cristina Annesini, M.; Piemonte, V.; Turchetti, L. Simultaneous removal of albumin-bound toxins in liver support devices: Bilirubin and tryptophan adsorption on activated carbon. Chem. Eng. Trans. 2013, 32, 1069–1074. [Google Scholar]
  4. Watanabe, H.; Noguchi, T.; Miyamoto, Y.; Kadowaki, D.; Kotani, S.; Nakajima, M.; Miyamura, S.; Ishima, Y.; Otagiri, M.; Maruyama, T. Interaction between two sulfate-conjugated uremic toxins, p-cresyl sulfate and indoxyl sulfate, during binding with human serum albumin. Drug Metab. Dispos. 2012, 40, 1423–1428. [Google Scholar] [CrossRef] [PubMed]
  5. Devine, E.; Krieter, D.H.; Rüth, M.; Jankovski, J.; Lemke, H.-D. Binding affinity and capacity for the uremic toxin indoxyl sulfate. Toxins 2014, 6, 416–429. [Google Scholar] [CrossRef] [PubMed]
  6. Bergé-Lefranc, D.; Chaspoul, F.; Calaf, R.; Charpiot, P.; Brunet, P.; Gallice, P. Binding of p-cresylsulfate and p-cresol to human serum albumin studied by Microcalorimetry. J. Phys. Chem. B 2010, 114, 1661–1665. [Google Scholar] [CrossRef] [PubMed]
  7. Abad, S.; Vega, A.; Quiroga, B.; Arroyo, D.; Panizo, N.; Reque, J.E.; López-Gómez, J.M. Protein-bound toxins: Added value in their removal with high convective volumes. Nefrología 2016, 36, 637–642. [Google Scholar] [CrossRef] [PubMed]
  8. Stiller, S.; Mann, H.; Brunner, H. Backfiltration in hemodialysis with highly permeable membranes. In Highly Permeable Membranes; Karger Publishers: Basel, Switzerland, 1985; pp. 23–32. [Google Scholar]
  9. Wüpper, A.; Dellanna, F.; Baldamus, C.; Woermann, D. Local transport processes in high-flux hollow fiber dialyzers. J. Membr. Sci. 1997, 131, 181–193. [Google Scholar] [CrossRef]
  10. Katchalsky, A.; Curran, P.F. Nonequilibrium Thermodynamics in Biophysics; Harvard University Press: Cambridge, MA, USA, 1967. [Google Scholar]
  11. Maheshwari, V.; Thijssen, S.; Tao, X.; Fuertinger, D.; Kappel, F.; Kotanko, P. A novel mathematical model of protein-bound uremic toxin kinetics during hemodialysis. Sci. Rep. 2017, 7, 10371. [Google Scholar] [CrossRef] [PubMed]
  12. Sakai, T.; Takadate, A.; Otagiri, M. Characterization of binding site of uremic toxins on human serum albumin. Biol. Pharm. Bull. 1995, 18, 1755–1761. [Google Scholar] [CrossRef] [PubMed]
  13. Boucif, N.; Nguyen, P.T.; Roizard, D.; Favre, E. Theoretical studies on carbon dioxide removal from a gas stream in hollow fiber membrane contactors. Desalination Water Treat. 2010, 14, 146–157. [Google Scholar] [CrossRef]
  14. Happel, J. Viscous flow relative to arrays of cylinders. AIChE J. 1959, 5, 174–177. [Google Scholar] [CrossRef]
  15. Chen, B.; Gao, Z.; Jin, W.; Zheng, S. Analytical mass transfer solution of longitudinal laminar flow of happel’s free surface model. Int. J. Heat Mass Transf. 2011, 54, 4000–4008. [Google Scholar] [CrossRef]
  16. Meijers, B.K.; Bammens, B.; Verbeke, K.; Evenepoel, P. A review of albumin binding in ckd. Am. J. Kidney Dis. 2008, 51, 839–850. [Google Scholar] [CrossRef] [PubMed]
  17. Sudlow, G.; Birkett, D.; Wade, D. Further characterization of specific drug binding sites on human serum albumin. Mol. Pharmacol. 1976, 12, 1052–1061. [Google Scholar] [PubMed]
  18. Takamura, N.; Maruyama, T.; Otagiri, M. Effects of uremic toxins and fatty acids on serum protein binding of furosemide: Possible mechanism of the binding defect in uremia. Clin. Chem. 1997, 43, 2274–2280. [Google Scholar] [PubMed]
  19. Itoh, Y.; Ezawa, A.; Kikuchi, K.; Tsuruta, Y.; Niwa, T. Protein-bound uremic toxins in hemodialysis patients measured by liquid chromatography/tandem mass spectrometry and their effects on endothelial ros production. Anal. Bioanal. Chem. 2012, 403, 1841–1850. [Google Scholar] [CrossRef] [PubMed]
  20. Fournel, L.; Mocho, P.; Brown, R.; le Cloirec, P. Modeling breakthrough curves of volatile organic compounds on activated carbon fibers. Adsorption 2010, 16, 147–153. [Google Scholar] [CrossRef]
  21. Ochoa-Tapia, J.A.; Whitaker, S. Bulk and surface diffusion in porous media: An application of the surface-averaging theorem. Chem. Eng. Sci. 1993, 48, 2061–2082. [Google Scholar] [CrossRef]
  22. Tijink, M.S.L.; Wester, M.; Glorieux, G.; Gerritsen, K.G.F.; Sun, J.; Swart, P.C.; Borneman, Z.; Wessling, M.; Vanholder, R.; Joles, J.A.; et al. Mixed matrix hollow fiber membranes for removal of protein-bound toxins from human plasma. Biomaterials 2013, 34, 7819–7828. [Google Scholar] [CrossRef] [PubMed]
  23. Shaw, R.A.; Rigatto, C.; Reslerova, M.; Ying, S.L.; Man, A.; Schattka, B.; Battrell, C.F.; Matthewson, J.; Mansfield, C. Toward point-of-care diagnostic metabolic fingerprinting: Quantification of plasma creatinine by infrared spectroscopy of microfluidic-preprocessed samples. Analyst 2009, 134, 1224–1231. [Google Scholar] [CrossRef] [PubMed]
  24. Wakeham, W.; Salpadoru, N.; Caro, C. Diffusion coefficients for protein molecules in blood serum. Atherosclerosis 1976, 25, 225–235. [Google Scholar] [CrossRef]
  25. Jackson, R. Transport in Porous Catalysts; Elsevier: Amsterdam, The Netherlands, 1977. [Google Scholar]
  26. Bali, N.; Petsi, A.J.; Skouras, E.D.; Burganos, V.N. Three-dimensional reconstruction of bioactive membranes and pore-scale simulation of enzymatic reactions: The case of lactose hydrolysis. J. Membr. Sci. 2017, 524, 225–234. [Google Scholar] [CrossRef]
  27. Liao, Z.; Klein, E.; Poh, C.K.; Huang, Z.; Lu, J.; Hardy, P.A.; Gao, D. Measurement of hollow fiber membrane transport properties in hemodialyzers. J. Membr. Sci. 2005, 256, 176–183. [Google Scholar] [CrossRef]
  28. Islam, M.S.; Szpunar, J. Study of dialyzer membrane (Polyflux 210H) and effects of different parameters on dialysis performance. Open J. Nephrol. 2013, 3, 161–167. [Google Scholar] [CrossRef]
  29. Erickson, H.P. Size and shape of protein molecules at the nanometer level determined by sedimentation, gel filtration, and electron microscopy. Biol. Proced. Online 2009, 11. [Google Scholar] [CrossRef] [PubMed]
  30. Pavlenko, D.; van Geffen, E.; van Steenbergen, M.J.; Glorieux, G.; Vanholder, R.; Gerritsen, K.G.F.; Stamatialis, D. New low-flux mixed matrix membranes that offer superior removal of protein-bound toxins from human plasma. Sci. Rep. 2016, 6, 34429. [Google Scholar] [CrossRef] [PubMed]
  31. Lee, C.-J.; Hsu, S.-T.; Hu, S.-C. A one-compartment single-pore model for extracorporeal hemoperfusion. Comput. Biol. Med. 1989, 19, 83–94. [Google Scholar] [CrossRef]
  32. Tsai, H.-A.; Syu, M.-J. Synthesis of creatinine-imprinted poly (β-cyclodextrin) for the specific binding of creatinine. Biomaterials 2005, 26, 2759–2766. [Google Scholar] [CrossRef] [PubMed]
  33. Gao, F.; Han, L. Implementing the nelder-mead simplex algorithm with adaptive parameters. Comput. Optim. Appl. 2012, 51, 259–277. [Google Scholar] [CrossRef]
  34. Schoning, L.-C.; Li, Y. Multivariable optimisation of a homogeneous charge microwave ignition system. In Proceedings of the 2013 19th International Conference on Automation and Computing (ICAC), London, UK, 13–14 September 2013; IEEE: Piscataway, NJ, USA; pp. 1–5. [Google Scholar]
Figure 1. (a) Schematic arrangement of fibers in a hemodialysis module; (b) Hexagonal packing of the fibers, assumed in this study.
Applsci 08 00536 g001
Figure 2. Unit cell with the corresponding domains. Dimensions: Rinner = 225 μm, Rskin = 246 μm, Rfiber = 283 μm, Lfiber = 10 cm. Not to scale.
Applsci 08 00536 g002
Figure 3. Schematic representation of the simulated process. In the membrane module, the distribution of domains in the radial coordinate is shown, as detailed in Figure 2.
Applsci 08 00536 g003
Figure 4. Comparison of numerically calculated removal of creatinine with the experimental dynamic adsorption-diffusion experiment for a 4-h treatment. Experimental data were extracted from [30]. Red and grey curves are obtained by utilizing Langmuir constants from Tijink et al. [22]; the black dashed curve is obtained by a fitting procedure.
Applsci 08 00536 g004
Figure 5. (a) Error function surface for IS removal for fixed kdis,IS,blood at 0.72875 s−1; (b) Error function surface for PCS removal for fixed kdis,PCS,blood at 1.81 s−1.
Applsci 08 00536 g005
Figure 6. (a) Total removal curve for IS as predicted by the present model, compared with experimental data found in the literature [30] (b) Total removal curve for PCS as predicted by the present model, compared with experimental data found in the literature [30].
Applsci 08 00536 g006
Figure 7. (a) Error function surface for IS removal for fixed kdis,IS,blood at 0.72875 s−1; (b) Error function surface for PCS removal for fixed kdis,PCS,blood at 1.81 s−1.
Applsci 08 00536 g007
Table 1. Effective transport properties of the membrane layers.
LayerThickness K e f f , i D e f f , i D b u l k , i
Inner Layer21 μm1.6 × 10−19 m20.19
Outer Layer47 μm1.6 × 10−12 m20.25
Table 2. Effective transport properties of the membrane layers.
Toxin k d i s , i ( 1 / s ) q t o x i n , o i ( m o l / K g A C ) K l t o x i n , o i ( m 3 / m o l )
IS0.730.07341
PCS1.820.06925

