
The Index System for the Development Level Evaluation of Regional Construction Industrialization: A Case Study in Jiangsu, China

1
Department of Construction and Real Estate, School of Civil Engineering, Southeast University, Nanjing 210096, China
2
School of Civil Engineering, Lanzhou University of Technology, Lanzhou 730050, China
*
Author to whom correspondence should be addressed.
Appl. Sci. 2017, 7(5), 492; https://doi.org/10.3390/app7050492
Submission received: 23 March 2017
/
Revised: 19 April 2017
/
Accepted: 4 May 2017
/
Published: 10 May 2017
(This article belongs to the Special Issue The Industrialization of the Building Construction Process)
Abstract
:In recent years, there have been concerns raised about construction industrialization in China, which have initiated a wave of policy change in both governmental and industrial organizations in order to change the mode of conventional construction. However, the current development level of regional construction industrialization (RCI) in China has not been well-characterized. This study screened preliminary index systems in five dimensions: technical, economic, sustainable, enterprise development and development environment. Based on the data gathered from the questionnaire surveys and subsequently analyzed, twenty-two critical evaluation indicators were identified. Analytic Hierarchy Process (AHP) was then employed to determine the weighting of each indicator. The evaluation method of the development level was formulated on the basis of the evaluation criteria. Jiangsu Province was used as an example in this study, with the development level of this province being comprehensively examined using a combination of the index system and evaluation method. The results show that Jiangsu has a relatively high RCI development level. The data from analysis scores of five dimensions and twenty-two indicators show that the index system is feasible, with evaluation results being consistent with actual practice. These findings provide a good practical reference for making decisions about how best to guide the development of RCI.
1. Introduction
Rapid progress of urbanization in China has created a huge construction market. As a result, based on an average annual increase rate of 1%, the urbanization rate in China is expected to reach a historic high of 60% by 2020. However, conventional construction technologies are still an extensive mode of production due to having construction-related environmental issues, lower labor productivity, serious energy consumption, a lower degree of mechanization and the current shortage of labor. One of the effective solutions is construction industrialization, which has become increasingly important for the entire construction industry. Construction industrialization refers to the practice of producing construction components in a manufacturing factory, transporting complete or semi-complete components to construction sites and finally assembling these components to construct buildings [1]. The manufacturing process may be undertaken using factory prefabrication or site prefabrication [2].
Various terms and acronyms that were associated with construction industrialization originated from previous studies, including precast concrete building, off-site prefabrication [3], off-site construction [4], industrialized building [5,6], and modern methods of construction [7]. In the construction industrialization field, prefabrication was regarded as the first level, followed by mechanization, automation, robotics and reproduction [8]. Prefabrication techniques had been widely adopted in the construction industry in various countries. Compared with conventional construction technologies, the inherent superiority of the technology include, among others, reducing labor demand [9], improving quality control [10], noise and dust reduction [11], higher standards for health and safety [11,12], construction waste reduction [13], time and cost savings [14], and low resource depletion [15]. In addition, some innovative technologies, such as parametric 3D modeling in building construction for precast concrete [16,17], dynamic simulation [18], and tracking and locating components in a precast storage yard utilizing radio frequency identification technology and global position system [19,20], have been effectively applied in the construction industrialization field. The employment of these innovative systematic information technologies are expected to ease the complexities and dynamics of construction industrialization simulation to reflect actual industry practice [21]. In virtue of the inherent superiority of construction industrialization, changing the mode of conventional construction into industrialization is critical for the development of urbanization in China, which has been emphasized through a series of national guidelines and policies, including the National Plan on Construction during the 13th Five-Year Plan [22]. Ji and Zhu predicted that, by 2020, more than 200 million m2 of gross floor area would be built annually through industrialized construction [23]. Consequently, a long-standing and considerable demand for construction industrialization existed because of industrialization during rapid urbanization.
In performance evaluation of construction industrialization research, Jaillon and Poon examined the evolution of precasting technology in high-rise residential developments and explored the technological influences in the public and private sectors [12]. Pan et al. developed value-based decision criteria and quantified relative importance for assessing building technologies systematically [24]. Nahmens and Bindroo conducted a large-scale survey of industrialized housing producers to assess the level of customization offered and operational performance [25]. Lu and Yuan investigated the manufacture and cross-border transportation processes to assess the waste reduction potentials of using prefabrication in construction [26]. Lu et al. examined a multi-residential building to assess the potential environmental and social benefits of precast technologies [15]. Through the evaluation of economic performance, Pan et al. examined house-builders’ practices and strategies regarding the use of offsite technologies [4]. Performance evaluation of construction industrialization research had moved from a conventional focus on cost–benefit analysis to a more extensive perspective of sustainability [21].
However, most of the previous studies on construction industrialization concentrated on the technical aspects of the system, performance evaluation, decision making strategies [27] and policymaking [28], with only a limited number of studies being conducted on the regional development level of construction industrialization. Wang and Ji analyzed various factors they believed were affecting development of construction industrialization in China before building a system that incorporated these influencing factors. However, these authors did not establish an evaluation model [29]. Bing and Chen established a linear regression model and analyzed the level of construction industrialization of China in 2010, finding out that the construction industrialization level of China at this time was close to that of Japan in the early 1980s [30]. However, there is no clear conclusion about China’s construction industrialization level. China’s various provinces and cities formulate corresponding policies in accordance with the development level of the region, but there is a lack of studies aiming to evaluate regional development levels. Therefore, it is important to research and create a scientific and reasonable method for evaluating the level of regional construction industrialization. To bridge this gap, this paper aims to propose a method for evaluating the level of regional construction industrialization in order to provide the basis for policy adjustment.
2. Research Objective and Methodology
2.1. Research Objectives
This research aims to provide a reasonable method to evaluate the level of regional construction industrialization (RCI) in order to provide evidence for decision-making and to ensure that subsequent development is comprehensive, coordinated and sustainable. The research objectives include: (1) determining the index system for the development level evaluation of RCI; (2) proposing an evaluation method for the RCI development level; and (3) examining the index system and evaluation method in a case study, through comparing evaluation results with actual practice to verify the rationality of the method.
2.2. Methodology
Questionnaire surveys, analytic hierarchy process (AHP) and case studies are widely used methods for extracting or identifying evaluation dimensions or indicators [31,32]. Qualitative methods and cases studies are more appropriate for studying new phenomena than quantitative methods, because they provide more accurate and detailed explanations for the occurrence of new phenomena [33]. In the management of prefabricated construction field, case study and survey are found to be the primary methods for data collection [21].
Based on the prior studies, a preliminary evaluation index system was established with utilizing the theory and practice of construction industrialization from five dimensions: technical, economic, sustainable, enterprise development and development environment. Twenty-five indicators were selected through the expert interview method. In addition, the method of questionnaire was designed to ensure the rationality of the preliminary index system. These methods ensured that the final index system would be comprehensive and reliable. Statistical analyses were performed to validate the survey and provide the basis for determining weight. During the process of formulating an evaluation method, AHP was then employed to determine the weighting of each indicator.
2.3. Analytic Hierarchy Process Method
Weight determination is one of the most critical components for evaluating RCI development level. AHP is a common decision-making method with multiple criteria. It was developed by Saaty in the 1970s to assist in solving complex decision problems by capturing both subjective and objective evaluation measures [34]. The fundamental approach of AHP is based on defining the big problem as a hierarchical structure, with the small problems being located in the lower levels. Thus, the solutions to the small problems are aggregated to form a solution for the big problem [35]. The steps are as follows [36]:
(1) Construction of a hierarchy-type structure: Divide the evaluation object into a target layer (), a dimension layer (Ai), and an index layer (Aij).
(2) Pairwise comparison: AHP uses a pair-wise comparison of the criteria importance with respect to the goal. In this paper, using the importance scale suggested by Saaty was employed to make a comparison about the importance of the different dimensions and indicators [34], as shown in Table 1. Through analysis of questionnaire results combined with the experts’ evaluation of this field, a judgment matrix was built. The size of the comparison matrix () is where is the number of criteria relative to a specific criterion.
The pairwise comparison matrix is indicated as , and satisfies:
where represents the relative importance of over .
(3) Consistency assurance: Saaty defined a consistency index (CI), which is computed for each matrix size from relevant values [34]. The consistency ratio (CR) is defined as the ratio between the CI of a given matrix and the CI of a same-size reference matrix containing random values.
To check for consistency, A′ matrix is calculated where A′ is the normalized matrix of A:
where .
Then, the Eigen value and Eigen vect or were computed by Equations (4) and (5).
where is the Eigen vector, is Eigen value of the given matrix and is the largest Eigenvalue value of the pair-wise comparison matrix.
According to Saaty, it is safe to assume that the largest Eigenvalue is greater than or equal to (). The closer is to n, the more consistent A is.
The consistency ratio (CR) is calculated by AHP as:
where RI is the random consistency index related to the dimension of matrix listed in Table 2.
the level of inconsistency is considered acceptable. Otherwise, the comparison matrix needs to be reconstructed.
(4) Calculate the weighting of each indicator. The weighting vector formed from the judgment matrix is obtained by repeating the three earlier processes mentioned above.
According to the evaluation index system and evaluation method, followed by gathering the required data, a case study was conducted to test whether the evaluation results are consistent with reality. The methodology adopted in this paper is shown in Figure 1.
3. Index System Screening
3.1. Preliminary Screening of Indicators
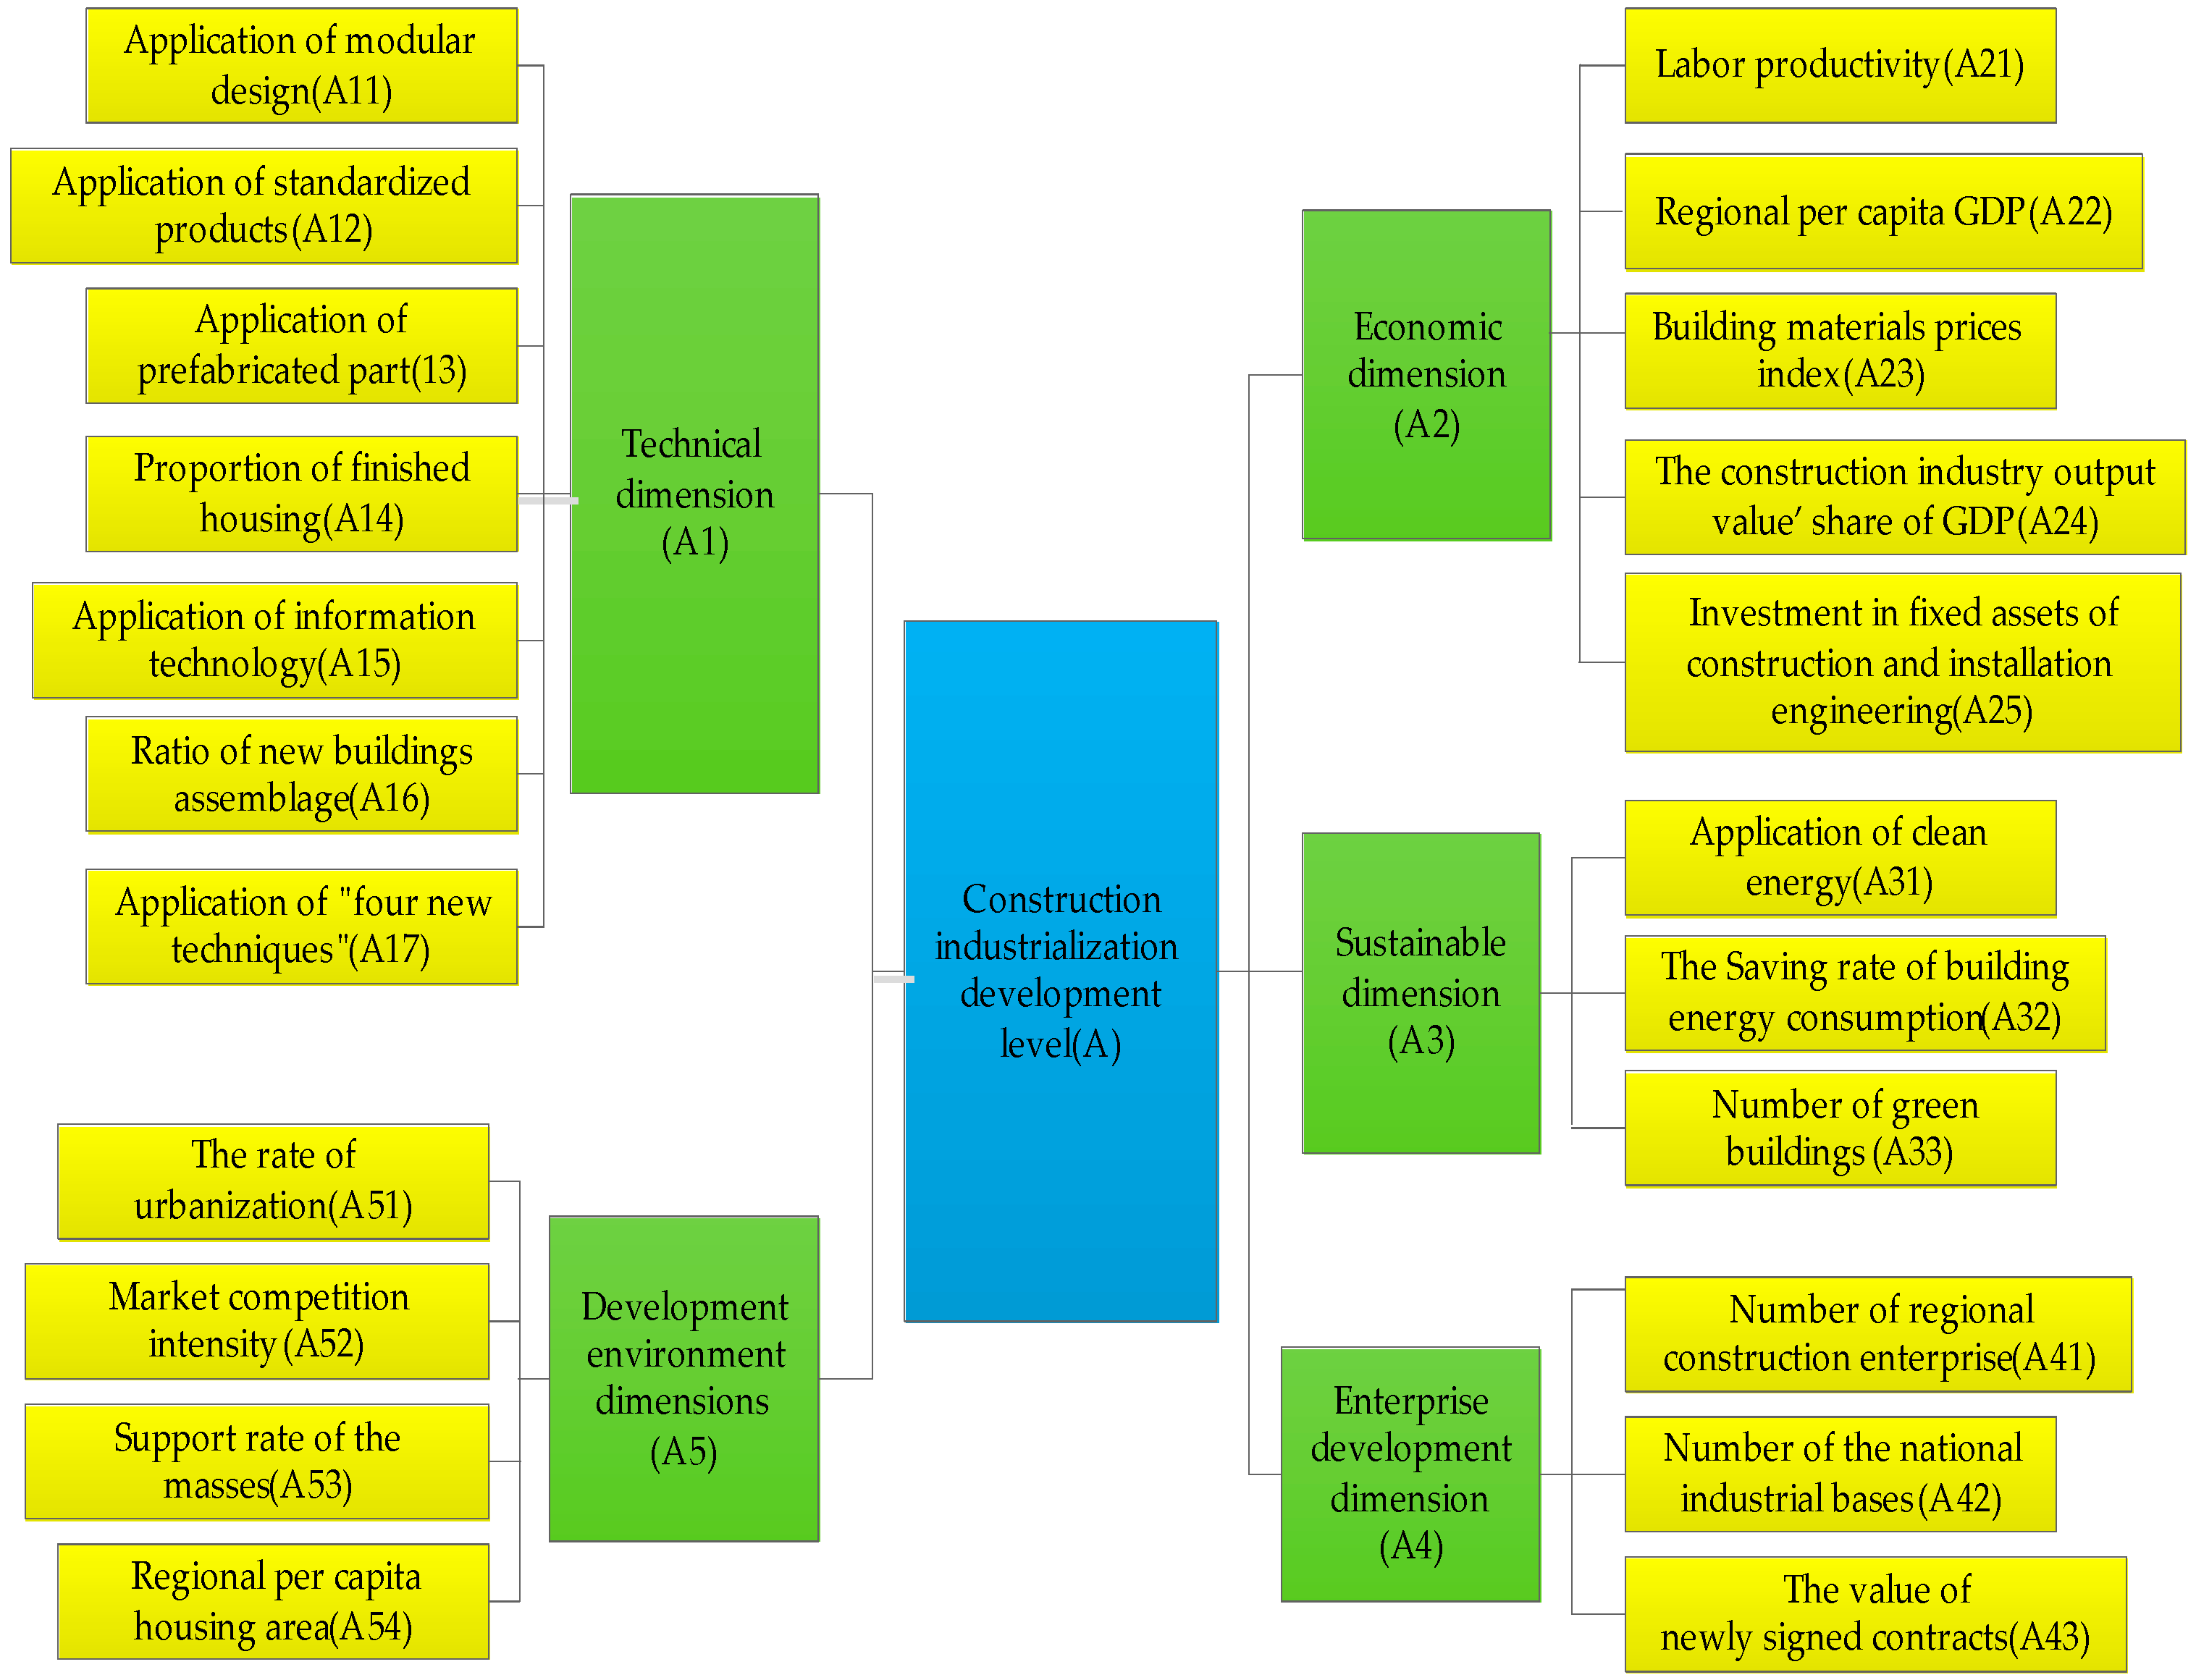
The preliminary screening of indicators was based on whether they directly reflect the development level of RCI. It is necessary to select and include the indicators that can possibly affect this development level. In order to establish a comprehensive evaluation index system, the comprehensive evaluation of the development level should be considered from different views. During the development of construction industrialization, advanced technology is an important embodiment [37]. Therefore, the development level of advanced technology is an important guideline to evaluate the development level of construction industrialization. Li et al. reviewed of the research on the management of prefabricated construction during the period from 2000 to 2013 [21] and found that performance evaluation mainly include environmental sustainability performance [11,15,26], economic performance [4,18], and social performance [38,39]. This paper identified the index system of RCI development level using the technical, economic, sustainable and enterprise development dimensions. In addition, support rate of the masses can be used to measure the development environment of the RCI [40], so it is regarded as the fundamental indicator in influencing the RCI development level. In this paper, these indicators were grouped into the “development environment dimension”.
The following three methods are adopted for selection of indicators. First, literature analysis and policy research were used to identify the original indicators. Secondly, preliminary indicators were selected based on the expert interview method. The final index system was then determined through the questionnaire survey method. The process of index system screening is shown in Figure 2. Original indicators related to the development level of RCI were identified. Based on literature analysis and policy research, twenty-six related articles and seventeen recent policies were included. According to literature analysis and policy research, thirty-four related original indicators were found. There were some similarities between the thirty-four related original indicators, so interviews were then conducted to discuss the availability of those dimensions and indicators. Nine relevant scholars and eleven government regulators of construction industry were invited to be interviewed. Eventually, the five dimensions were approved, and the original indicators were reduced to twenty-five preliminary indicators (Table 3), which were thought to better represent the development level of RCI. For the purpose of facilitating the preliminary index system to be understand, some indicators should be made a further explanation: labor productivity (A21) represented the total output of building industry; while The saving rate of building energy consumption (A32) could be obtained by evaluating how much energy consumption would be reduced for the target building compared to the standard building in the early design phase; market competition intensity (A52) referred to the competition intensity among relative enterprises who work on construction industrialization design and construction; support rate of the masses (A53) meant the degree of support and confidence of house purchasers.
3.2. Finalizing the Index System
3.2.1. Questionnaire Survey
The questionnaire was designed to test the preliminary indicators of the RCI development level, in particular from the angle of reasonability and operability. The questionnaires consist of twenty-five indicators with a 5-point Likert scale (1—can be ignored or not important; 2—somewhat important; 3—important; 4—very important; and 5—extremely important). Six-hundred survey questionnaires were distributed to personnel in construction companies as well as to government regulators of construction industry. In the first part of the questionnaire, respondents were asked to answer questions about their job title and years of construction industrialization project experience. In the second part, they were asked to make their own judgments on the indicators of RCI development level according to experience. This survey was conducted from September to November 2015. Finally, 152 completed responses were received. The respondent rate was 25.3%, consistent with the criterion of 20–30% for questionnaire surveys in engineering management studies [41]. Table 4 presents the profile of the data collected via the questionnaires.
3.2.2. Reliability Analysis
Reliability analysis was performed on the 152 valid questionnaires, with the results indicating a high reliability (Cronbach’s α = 0.834). Shen et al. noted that the threshold value of Cronbach’s α for a reliable questionnaire is 0.70 [42].
3.3.3. Mean Value and Ranking of the Indicators
The scores and rankings of the twenty-five RCI development level indicators were examined by descriptive statistics (Table 5). The mean values for these twenty-five indicators range from a minimum of 2.473 (A44) to a maximum of 4.685 (A16). Nearly half (48%) of the indicators’ mean values are over 4.00 (12 indicators), with just three being below 3.0 (A18, A34, and A44). This indicates that most of the indicators are very important and can be used as a representation of the RCI development level in China. Of the top five indicators with the highest mean values, three belong to the technical dimension (A1). The result shows that the technological level of construction industrialization could strongly influence the RCI development.
3.3.4. The Final Index System
According to the analysis of questionnaire results, the large majority of indicators have been proven to be effective. The indicators with mean values below 3.0 were filtered out, namely 3D printing technology (A18), the utilization of land resources (A34) and number of the employees (A44), which indicated that these three indicators are relatively less important for evaluating the development level of RCI with regards to reasonability and operability. The final composition of the index system is shown in Figure 3.
4. Case Study
4.1. Study Area
Jiangsu Province is composed of 13 prefecture-level cities located in the east of China, with an overall area of 10.72 × 10⁴ km2 and a population of 79.76 million in 2015 [43]. Jiangsu is one of China’s most developed regions, primarily due to the high urbanization and industrialization of the cities in the south of the Yangtze River. The gross domestic production (GDP) of Jiangsu was about 7.609 trillion in 2016, ranking it second out of all Chinese provinces [44]. The per capita GDP of Jiangsu was ranked first out of all Chinese provinces. Jiangsu’s total output of construction industry is 2.479 trillion Yuan in 2015, which ranked first out of all Chinese provinces [44]. As a result, Jiangsu is a strong province in the economic and construction industry fields.
4.2. Evaluation Criteria
In order to conduct a scientific and rational evaluation of the construction industrialization development level, it is imperative to establish the evaluation criteria [45]. Standard evaluation criteria are chosen on a scientific basis, which must be reasonable and easy to operate [46]. In this paper, the evaluation criteria of the RCI development level were set according to four categories: (i) quantitative index with comparison to the national average in 2015, such as A21, A22, A23, A24, A51 and A54; (ii) quantitative index with comparison to the proportion of the national total in 2015, such as A25, A33, A41, A42 and A43; (iii) quantitative index regarding some specific data for application proportions, which will be evaluated by experts in a qualitative manner due to this data being difficult to acquire, such as A11, A12, A13, A14, A15, A16, A17 and A32; and (iv) quantitative index evaluated by experts in qualitative manner, such as A31, A52 and A53. The development level of RCI is divided into five evaluation grades on a five-point scale: 5—excellent; 4—good; 3—medium; 2—fair; and 1—poor. According to the above categories for criteria, the evaluation criteria of the RCI development level for each indicator are shown in Table 6, Table 7, Table 8, Table 9 and Table 10.
4.3. Data Collection
According to the evaluation index system and evaluation criteria above, the required data of Jiangsu in 2015 were gathered (Table 11). All data about the national average level and total amount were extracted from National Statistical Yearbook (2015). Related data of development level in Jiangsu were collected from Statistical Yearbook of Jiangsu Province (2015), related government development plans and bulletin information.
4.4. Calculation Results of the Indicator Weight
Eleven experts were invited to participate in the review of this project, in which the scores representing the relative importance of the various indicators were generated after the comparison between each two indicators provided by the experts’ judgments. The evaluation indicator set of the target layer A was: A = {A1, A2, A3, A4, A5}; A1 = {A11, A12, A13, A14, A15, A16, A17}; A2 = {A21, A22, A23, A24, A25}; A3 = {A31, A32, A33}; and A4 = {A41, A42, A43}, A5 = {A51, A52, A53, A54} (Figure 3). The judgment matrix and the weight of each indicator are obtained using Equations (1)–(7). The results are shown in Table 12, Table 13, Table 14, Table 15, Table 16 and Table 17.
4.5. Calculation Results of Evaluation Score
After calculating the weight of each indicator, the expert scoring method for experts using a five-point scale was designed. Sixteen experts from universities, the Administration of Housing and Construction in addition to construction enterprises provided the answers from 1 to 5, representing their individual view of the RCI development level in Jiangsu. The score for each indicator of Jiangsu in 2015 was calculated, with the steps being as follows: Mean of indicator score is calculated according to Equation (8), followed by calculating the dimension score according to Equation (9), and finally calculating the target evaluation score according to Equation (10). The results are shown in Table 18.
where is the number of experts, represents the score of as the expert evaluation, represents the weight of , and represents the weight of .
5. Result Analysis
5.1. Result Analysis of Questionnaire Survey
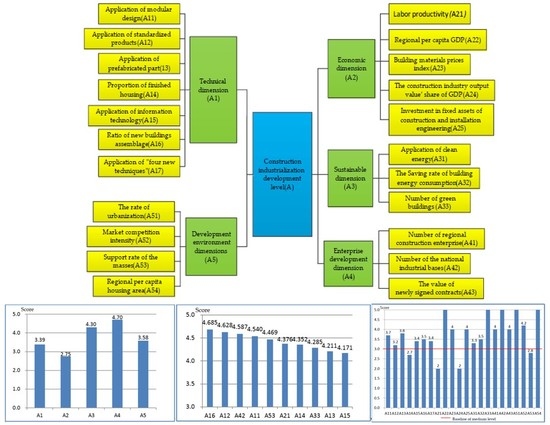
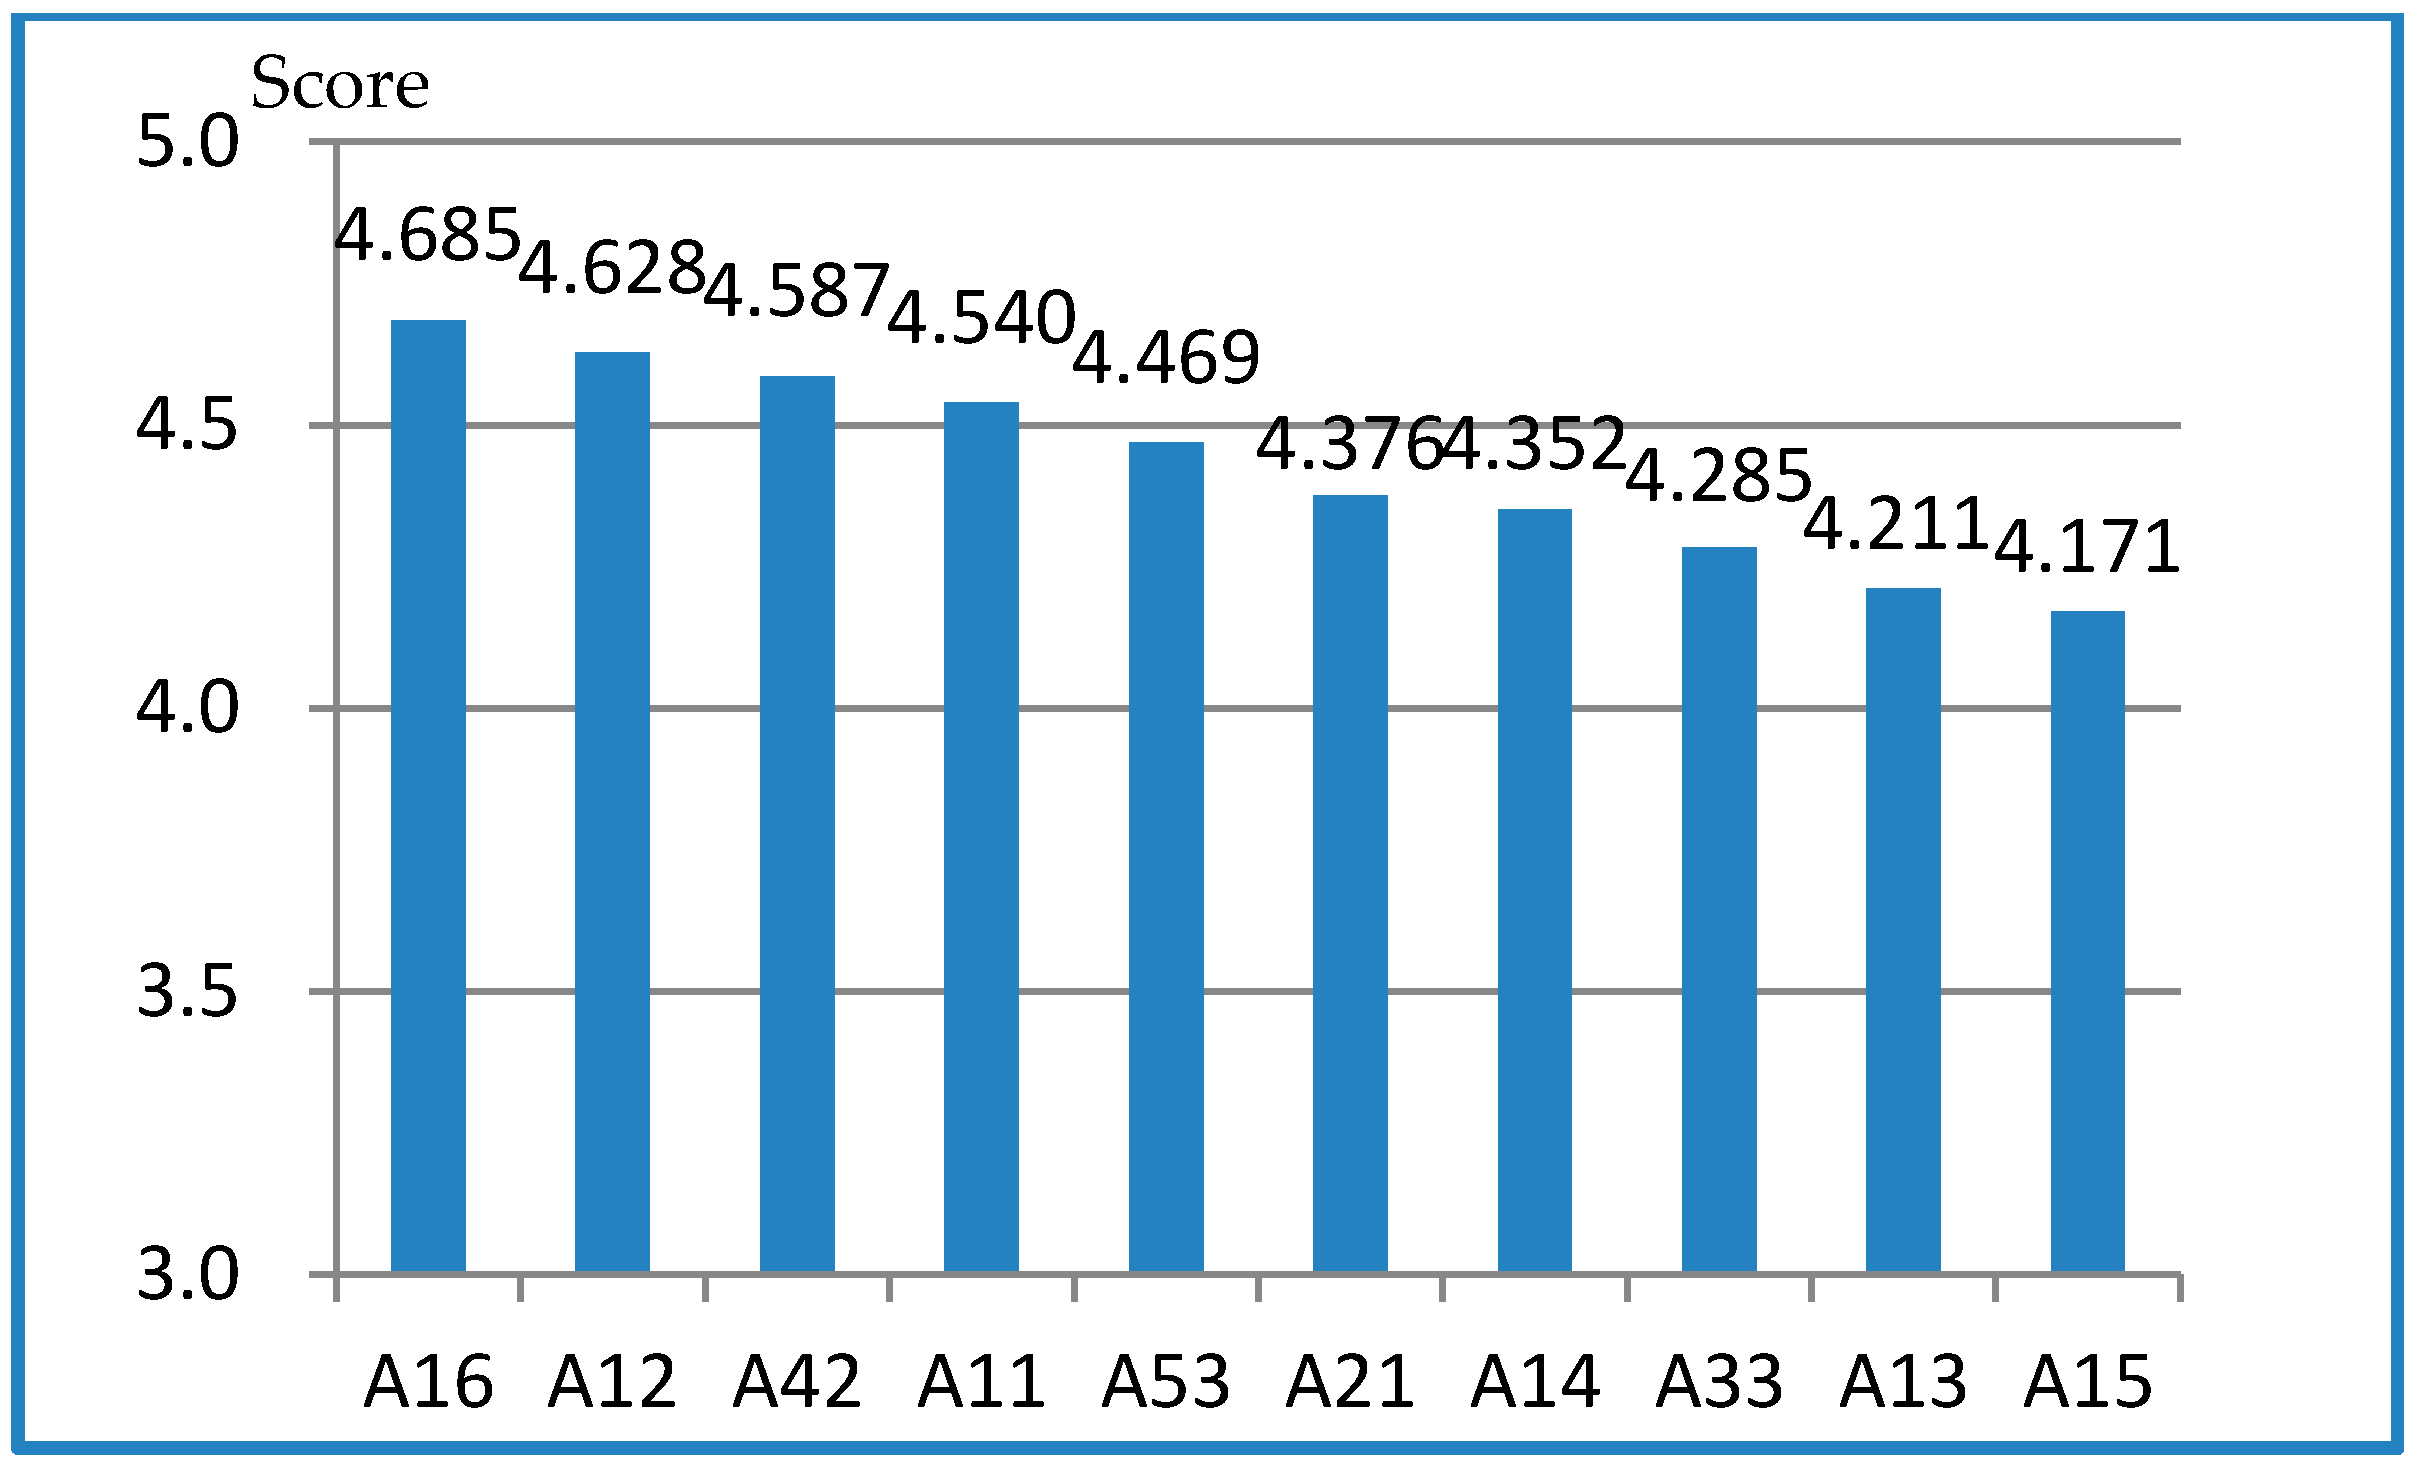
Based on the questionnaire survey data gathered and the comprehensive analysis of the data, twenty-two indicators were identified as the important components for the RCI development level. After calculating and analyzing the questionnaire survey data, it was found that the total effects of the dimension layers on RCI development level ranged from 3.742 to 4.383. Given that six out of ten top indicators were located in the technical dimension (Figure 4), it is believed that the core dimension for RCI development level was the technical dimension. The ratio of new buildings assemblage (A16, 4.685), application of standardized products (A12, 4.628), number of the national industrial bases (A42, 4.587), application of modular design (A11, 4.540) and support rate of the masses (A53, 4.469) were identified as the most important indicators of RCI development level, which were the top five indicators, indicating that these indicators played vital roles in the index system. In addition, it could be distinctly observed that the economic dimension ranges from 3.157 to 4.376, ranking this dimension fourth out of the five dimensions. The results indicated that the level of economic development was not a key factor that could have a significant influence on the performance of construction industrialization, which was not quite the same as in other industries.
5.2. Result Analysis of Case Study
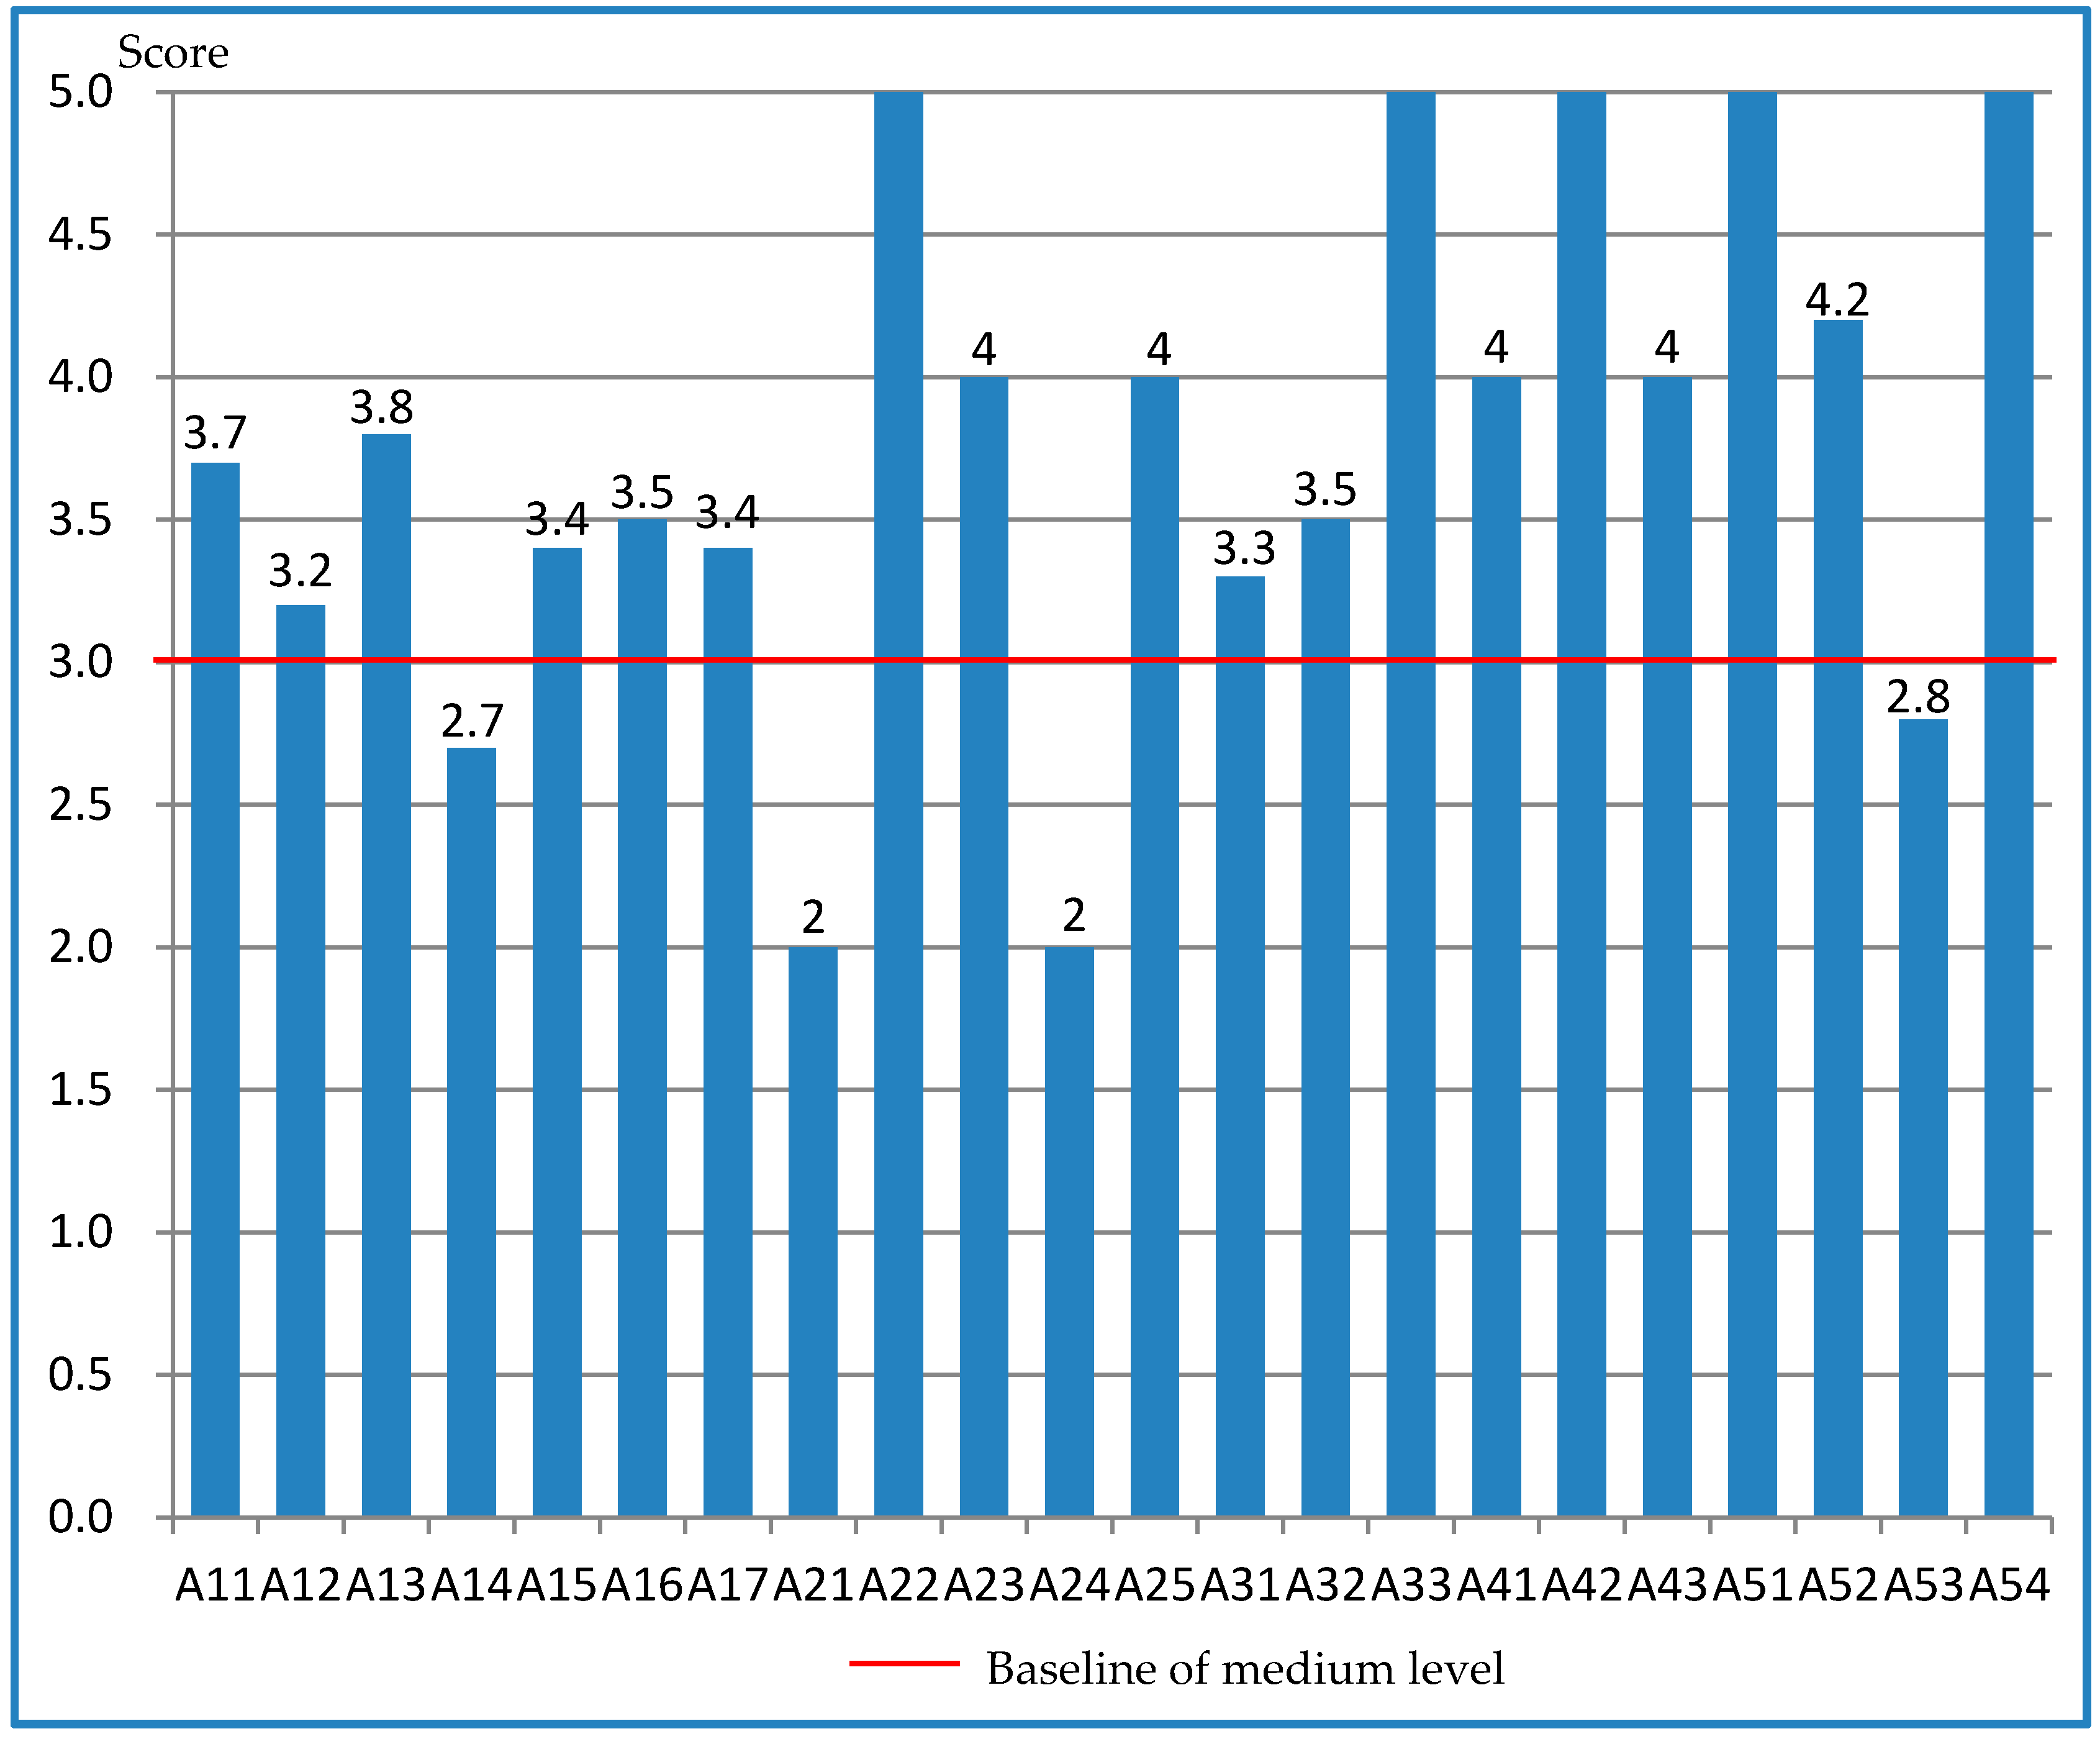
As a case study, Jiangsu Province was taken as an example for testing the validity of the proposed index system and evaluation method for the development level of RCI in this study. The score for the development level of Jiangsu construction industrialization in 2015 was obtained. The results showed that the degree score of the development level is 3.81, which was a relatively high value. Scores for the five dimensions are illustrated in Figure 5. It was discovered that, in the five dimensions, the enterprise development dimension achieved the top score while economic dimension received the lowest score. The construction enterprise developmental level of Jiangsu was the leading level in China and would provide foundation and drive for construction industrialization. Although acting as the leader province in China with regards to total output of its construction industry, Jiangsu is confronting an era of slower economic growth.
Through the analysis of all the indicator scores as shown in Figure 6, it was discovered that indicator scores of the technical dimension were below the good level of 4.0. In addition, proportion of finished housing (A14, 2.7), labor productivity (A21, 2), the construction industry output value’ share of GDP (A24, 2), and support rate of the masses (A53, 2.8) were below the medium level of 3.0. One possible reason for above indicators having low value could be the slower economic growth. Support rate of the masses was ranked as being fifth most important out of all the indicators (Figure 4) despite becoming third last in importance in all the indicator scores (Figure 6). The government should strengthen publicity and guidance of the industry as people lack up-to-date knowledge of technologies. Furthermore, this could potentially increase public support for construction industrialization.
6. Conclusions
Most prior studies on construction industrialization concentrated on the technical system, energy analysis and information technology, with fewer studies aiming to evaluate the development level of construction industrialization. To address this knowledge gap, a method for evaluating the level of regional construction industrialization was proposed.
This study identifies twenty-two critical evaluation indicators and validates it on the example of Jiangsu Province. The results show that Jiangsu has a relatively high RCI development level, however, all indicator scores of the technical dimension are below the “good” level. To promote the development of construction industrialization, emphases may be placed on introducing corresponding mandates and encouraging policies in increasing technology research and development and application level to guide construction industry to improve technology application level. The data from analysis scores of five dimensions and twenty-two indicators show that the index system is feasible, with evaluation results being consistent with actual practice. Although the index system presented here can provide a useful framework for researchers to further evaluate the development level of construction industrialization, the work is just an initial exploration that is open to test and improvement. A follow-up study based on more relevant indicators is expected to test the fitness of evaluation method proposed in this study.
In further research, it is critical to extend and broaden the index system with the rapid development of construction industrialization. Meanwhile, the relationship among the index system of various indicators should be considered. In addition, how to establish the coordination mechanism for the government to formulate supportive policy is also deserved to make a thorough study.
Acknowledgments
The authors’ special thanks go to all experts and survey participants of the paper, and to the National Natural Science Foundation of China (51578144), Ministry of Housing and Rural-Urban of China Science and Technology Project (2014-R4-005), “Research on Promotion of Construction Industry Modernization”, Ministry Housing and Rural-Urban of Jiangsu Province Project, and “Research on the 13th Five-Year Plan for Construction Industry Modernization of Jiangsu Province”.
Author Contributions
Ping Liu contributed to the questionnaire design and the research framework. Qiming Li was responsible for the evaluation section. Liangliang Song and Ruoyu Jia did all the work of this paper together under the leadership of Qiming Li.
Conflicts of Interest
The authors declare no conflict of interest.
References
- Tam, V.W.Y.; Tam, C.M.; Zeng, S.X.; Ng, W.C.Y. Towards adoption of prefabrication in construction. Build. Environ. 2007, 42, 3642–3654. [Google Scholar] [CrossRef]
- Testa, C. The Industrialization of Building; Van Nostrand Reinhold Company: New York, NY, USA, 1972; pp. 13–16. [Google Scholar]
- Kale, S.; Arditi, D. Diffusion of ISO 9000 certification in the precast concrete industry. Constr. Manag. Econ. 2006, 24, 485–495. [Google Scholar] [CrossRef]
- Pan, W.; Gibb, A.G.F.; Dainty, A.R.J. Leading UK housebuilders’ utilization of offsite construction methods. Build. Res. Inf. 2008, 36, 56–67. [Google Scholar] [CrossRef]
- Meiling, J.H.; Sandberg, M.; Johnsson, H. A study of a plan-do-check-act method used in less industrialized activities: Two cases from industrialized housebuilding. Constr. Manag. Econ. 2014, 32, 109–125. [Google Scholar] [CrossRef]
- Jonsson, H.; Rudberg, M. Classification of production systems for industrialized building: A production strategy perspective. Constr. Manag. Econ. 2014, 32, 53–69. [Google Scholar] [CrossRef]
- Goodier, C.; Gibb, A. Future opportunities for offsite in the UK. Constr. Manag. Econ. 2007, 25, 585–595. [Google Scholar] [CrossRef]
- Richard, R.B. Industrialised building systems: Reproduction before automation and robotics. Autom. Constr. 2005, 14, 442–451. [Google Scholar] [CrossRef]
- Nadim, W.; Goulding, J.S. Offsite production in the UK: The way forward? A UK construction industry perspective. Constr. Innov. 2010, 10, 181–202. [Google Scholar] [CrossRef]
- Jaillon, L.; Poon, C.S. Sustainable construction aspects of using prefabrication in dense urban environment: A Hong Kong case study. Constr. Manag. Econ. 2008, 26, 953–966. [Google Scholar] [CrossRef]
- Pons, O.; Wadel, G. Environmental impacts of prefabricated school buildings in Catalonia. Habitat Int. 2011, 35, 553–563. [Google Scholar] [CrossRef]
- Jaillon, L.; Poon, C.S. The evolution of prefabricated residential building systems in Hong Kong: A review of the public and the private sector. Autom. Constr. 2009, 18, 239–248. [Google Scholar] [CrossRef]
- Baldwin, A.; Poon, C.S.; Shen, L.Y.; Austin, S.; Wong, I. Designing out waste in high-rise residential buildings: Analysis of precasting methods and traditional construction. Renew. Energy 2009, 34, 2067–2073. [Google Scholar] [CrossRef]
- Chiang, Y.H.; Chan, H.W.; Lok, K.L. Prefabrication and barriers to entry—A case study of public housing and institutional buildings in Hong Kong. Habitat Int. 2006, 30, 482–499. [Google Scholar] [CrossRef]
- Lu, A.; Ngo, T.; Crawford, R.H.; Gammampila, R.; Mendis, P. Life cycle greenhouse gas emissions and energy analysis of prefabricated reusable building modules. Energy Build. 2012, 47, 159–168. [Google Scholar]
- Sacks, R.; Kaner, I.; Eastman, C.M.; Jeong, Y.S. The Rosewood experiment—Building information modeling and interoperability for architectural precast facades. Autom. Constr. 2010, 19, 419–432. [Google Scholar] [CrossRef]
- Boafo, F.E.; Kim, J.H.; Kim, J.T. Performance of Modular Prefabricated Architecture: Case Study-Based Review and Future Pathways. Sustainability 2016, 8, 558. [Google Scholar] [CrossRef]
- Pan, N.H.; Chiu, T.C.; Chen, K.Y. Full-span Pre-cast Launching Method (FPLM) analysis with Dynamic Simulation—Case studies of Taiwan High-Speed Rail (THSR) Project. Autom. Constr. 2008, 17, 592–607. [Google Scholar] [CrossRef]
- Yin, S.Y.L.; Tserng, H.P.; Wang, J.C.; Tsai, S.C. Developing a precast production management system using RFID technology. Autom. Constr. 2009, 18, 677–691. [Google Scholar] [CrossRef]
- Ergen, E.; Akinci, B.; Sacks, R. Tracking and locating components in a precast storage yard utilizing radio frequency identification technology and GPS. Autom. Constr. 2007, 16, 354–367. [Google Scholar] [CrossRef]
- Li, Z.; Shen, G.Q.; Xue, X. Critical review of the research on the management of prefabricated construction. Habitat Int. 2014, 43, 240–249. [Google Scholar] [CrossRef]
- Xinhua News Agency. 2015. Available online: http://news.xinhuanet.com/finance/2015-11/03/c_1117025413.htm (accessed on 20 October 2016).
- Ji, Y.; Zhu, F.; Li, H.X.; Al-hussein, M. Construction Industrialization in China: Current Profile and the Prediction. Appl. Sci. 2017, 7, 180. [Google Scholar] [CrossRef]
- Pan, W.; Dainty, A.R.J.; Gibb, A.G.F. Establishing and Weighting Decision Criteria for Building System Selection in Housing Construction. J. Constr. Eng. Manag. 2012, 138, 1239–1250. [Google Scholar] [CrossRef]
- Nahmens, I.; Bindroo, V. Is Customization Fruitful in Industrialized Homebuilding Industry? J. Constr. Eng. Manag. 2011, 137, 1027–1035. [Google Scholar] [CrossRef]
- Lu, W.; Yuan, H. Investigating waste reduction potential in the upstream processes of offshore prefabrication construction. Renew. Sustain. Energy Rev. 2013, 28, 804–811. [Google Scholar] [CrossRef]
- Song, J.; Fagerlund, W.R.; Haas, C.T.; Tatum, C.B.; Vanegas, J.A. Considering Prework on Industrial Projects. J. Constr. Eng. Manag. 2005, 131, 723–733. [Google Scholar] [CrossRef]
- Park, M.; Ingawale-Verma, Y.; Kim, W.; Ham, Y. Construction policymaking: With an example of singaporean government’s policy to diffuse prefabrication to private sector. KSCE J. Civ. Eng. 2011, 15, 771–779. [Google Scholar] [CrossRef]
- Wang, N.; Ji, Y. Analysis on Key Factors to Affect Construction Industrialization Development in China. In Proceedings of the Information Management, Innovation and Industrial Engineering, Kunming, China, 26–28 November 2010. [Google Scholar]
- Bing, X.; Chen, J.J. Research on the Measuring Model of Construction Industrialization Development Level. In Proceedings of the International Conference on Management and Service Science, Wuhan, China, 24–26 August 2010. [Google Scholar]
- Li, S.; Wu, X.; Zhou, Y.; Liu, X. A study on the evaluation of implementation level of lean construction in two Chinese fi rms. Renew. Sustain. Energy Rev. 2017, 71, 846–851. [Google Scholar] [CrossRef]
- Shi, R.; Fan, X.; He, Y. Comprehensive evaluation index system for wind power utilization levels in wind farms in China. Renew. Sustain. Energy Rev. 2017, 69, 461–471. [Google Scholar] [CrossRef]
- Yin, R.K. Case Study Research: Design and Methods; SAGE: Thousand Oaks, CA, USA, 2009. [Google Scholar]
- Saaty, T.L. The Analytic Hierarchy Process: Planning, Priority Setting, Resource Allocation; McGraw-Hill: New York, NY, USA; 1980. [Google Scholar]
- Raviv, G.; Shapira, A.; Fishbain, B. AHP-based analysis of the risk potential of safety incidents : Case study of cranes in the construction industry. Saf. Sci. 2017, 91, 298–309. [Google Scholar] [CrossRef]
- Dweiri, F.; Kumar, S.; Khan, S.A.; Jain, V. Designing an integrated AHP based decision support system for supplier selection in automotive industry. Expert Syst. Appl. 2016, 62, 273–283. [Google Scholar] [CrossRef]
- Zhong, R.Y.; Peng, Y.; Xue, F.; Fang, J.; Zou, W.; Luo, H.; Ng, S.T.; Lu, W.; Shen, G.Q.P.; Huang, G.Q. Automation in Construction Prefabricated construction enabled by the Internet-of-Things. Autom. Constr. 2017, 76, 59–70. [Google Scholar] [CrossRef]
- Eastman, C.M.; Sacks, R. Relative Productivity in the AEC Industries in the United States for On-Site and Off-Site Activities. J. Constr. Eng. Manag. 2008, 134, 517–526. [Google Scholar] [CrossRef]
- Johnson, C. Impacts of prefabricated temporary housing after disasters: 1999 earthquakes in Turkey. Habitat Int. 2007, 31, 36–52. [Google Scholar] [CrossRef]
- Pan, W.; Dainty, A.R.J.; Gibb, A.G.F. Encouraging Appropriate Use of Offsite Production (OSP): Perspectives of Designers; Hong Kong Polytechnic University: Hong Kong, China, 2004. [Google Scholar]
- Zhao, X.; Singhaputtangkul, N. Effects of Firm Characteristics on Enterprise Risk Management: Case Study of Chinese Construction Firms Operating in Singapore. J. Manag. Eng. 2016, 32, 5016008. [Google Scholar] [CrossRef]
- Shen, Y.; Koh, T.Y.; Rowlinson, S.; Bridge, A.J. Empirical Investigation of Factors Contributing to the Psychological Safety Climate on Construction Sites. J. Constr. Eng. Manag. 2015, 141, 4015038. [Google Scholar] [CrossRef]
- Statistics Bureau of Jiangsu Province. 2016. Available online: http://www.jssb.gov.cn/tjxxgk/tjsj/sjxxfb/ (accessed on 6 January 2017).
- China’s National Bureau of Statistics. 2016. Available online: http://data.stats.gov.cn/ (accessed on 8 January 2017).
- Valenzuela-Venegas, G.; Salgado, J.C.; Díaz-Alvarado, F.A. Sustainability indicators for the assessment of eco-industrial parks: Classification and criteria for selection. J. Clean. Prod. 2016, 133, 99–116. [Google Scholar] [CrossRef]
- Wang, Q.; Lu, S.; Yuan, X.; Zuo, J.; Zhang, J.; Hong, J. The index system for project selection in ecological industrial park : A China study. Ecol. Indic. 2017, 77, 267–275. [Google Scholar] [CrossRef]
- Ministry of Housing and Rural-Urban of China. National Programmer for Construction Industry Modernization. 2015. Available online: http://www.precast.com.cn/index.php/news_detail-id-4866.html (accessed on 25 October 2016).
- Jiangsu Province People’s Government. Green Building Action Plan of Jiangsu Province. 2013. Available online: http://www.jiangsu.gov.cn/jsgov/tj/bgt/201306/t20130626_387416.html (accessed on 18 October 2016).
- Jiangsu Province People’s Government. 2012. Available online: http://www.jiangsu.gov.cn/jsgov/tj/bgt/201211/t20121121_253252.html (accessed on 5 November 2016).
- Ministry of Housing and Rural-Urban of China. 2016. Available online: http://huanbao.bjx.com.cn/news/20160203/706809.shtml (accessed on 26 November 2016).
- Construction Industry Modernization Website. 2015. Available online: http://www.new-ci.com/html/43-1/1399.htm (accessed on 16 December 2016).
- Jiangsu Province People’s Government. 2015. Available online: http://xh.xhby.net/mp2/html/2016-02/25/content_1378994.htm (accessed on 27 November 2016).
Figure 1.
Methodology adopted in this study.
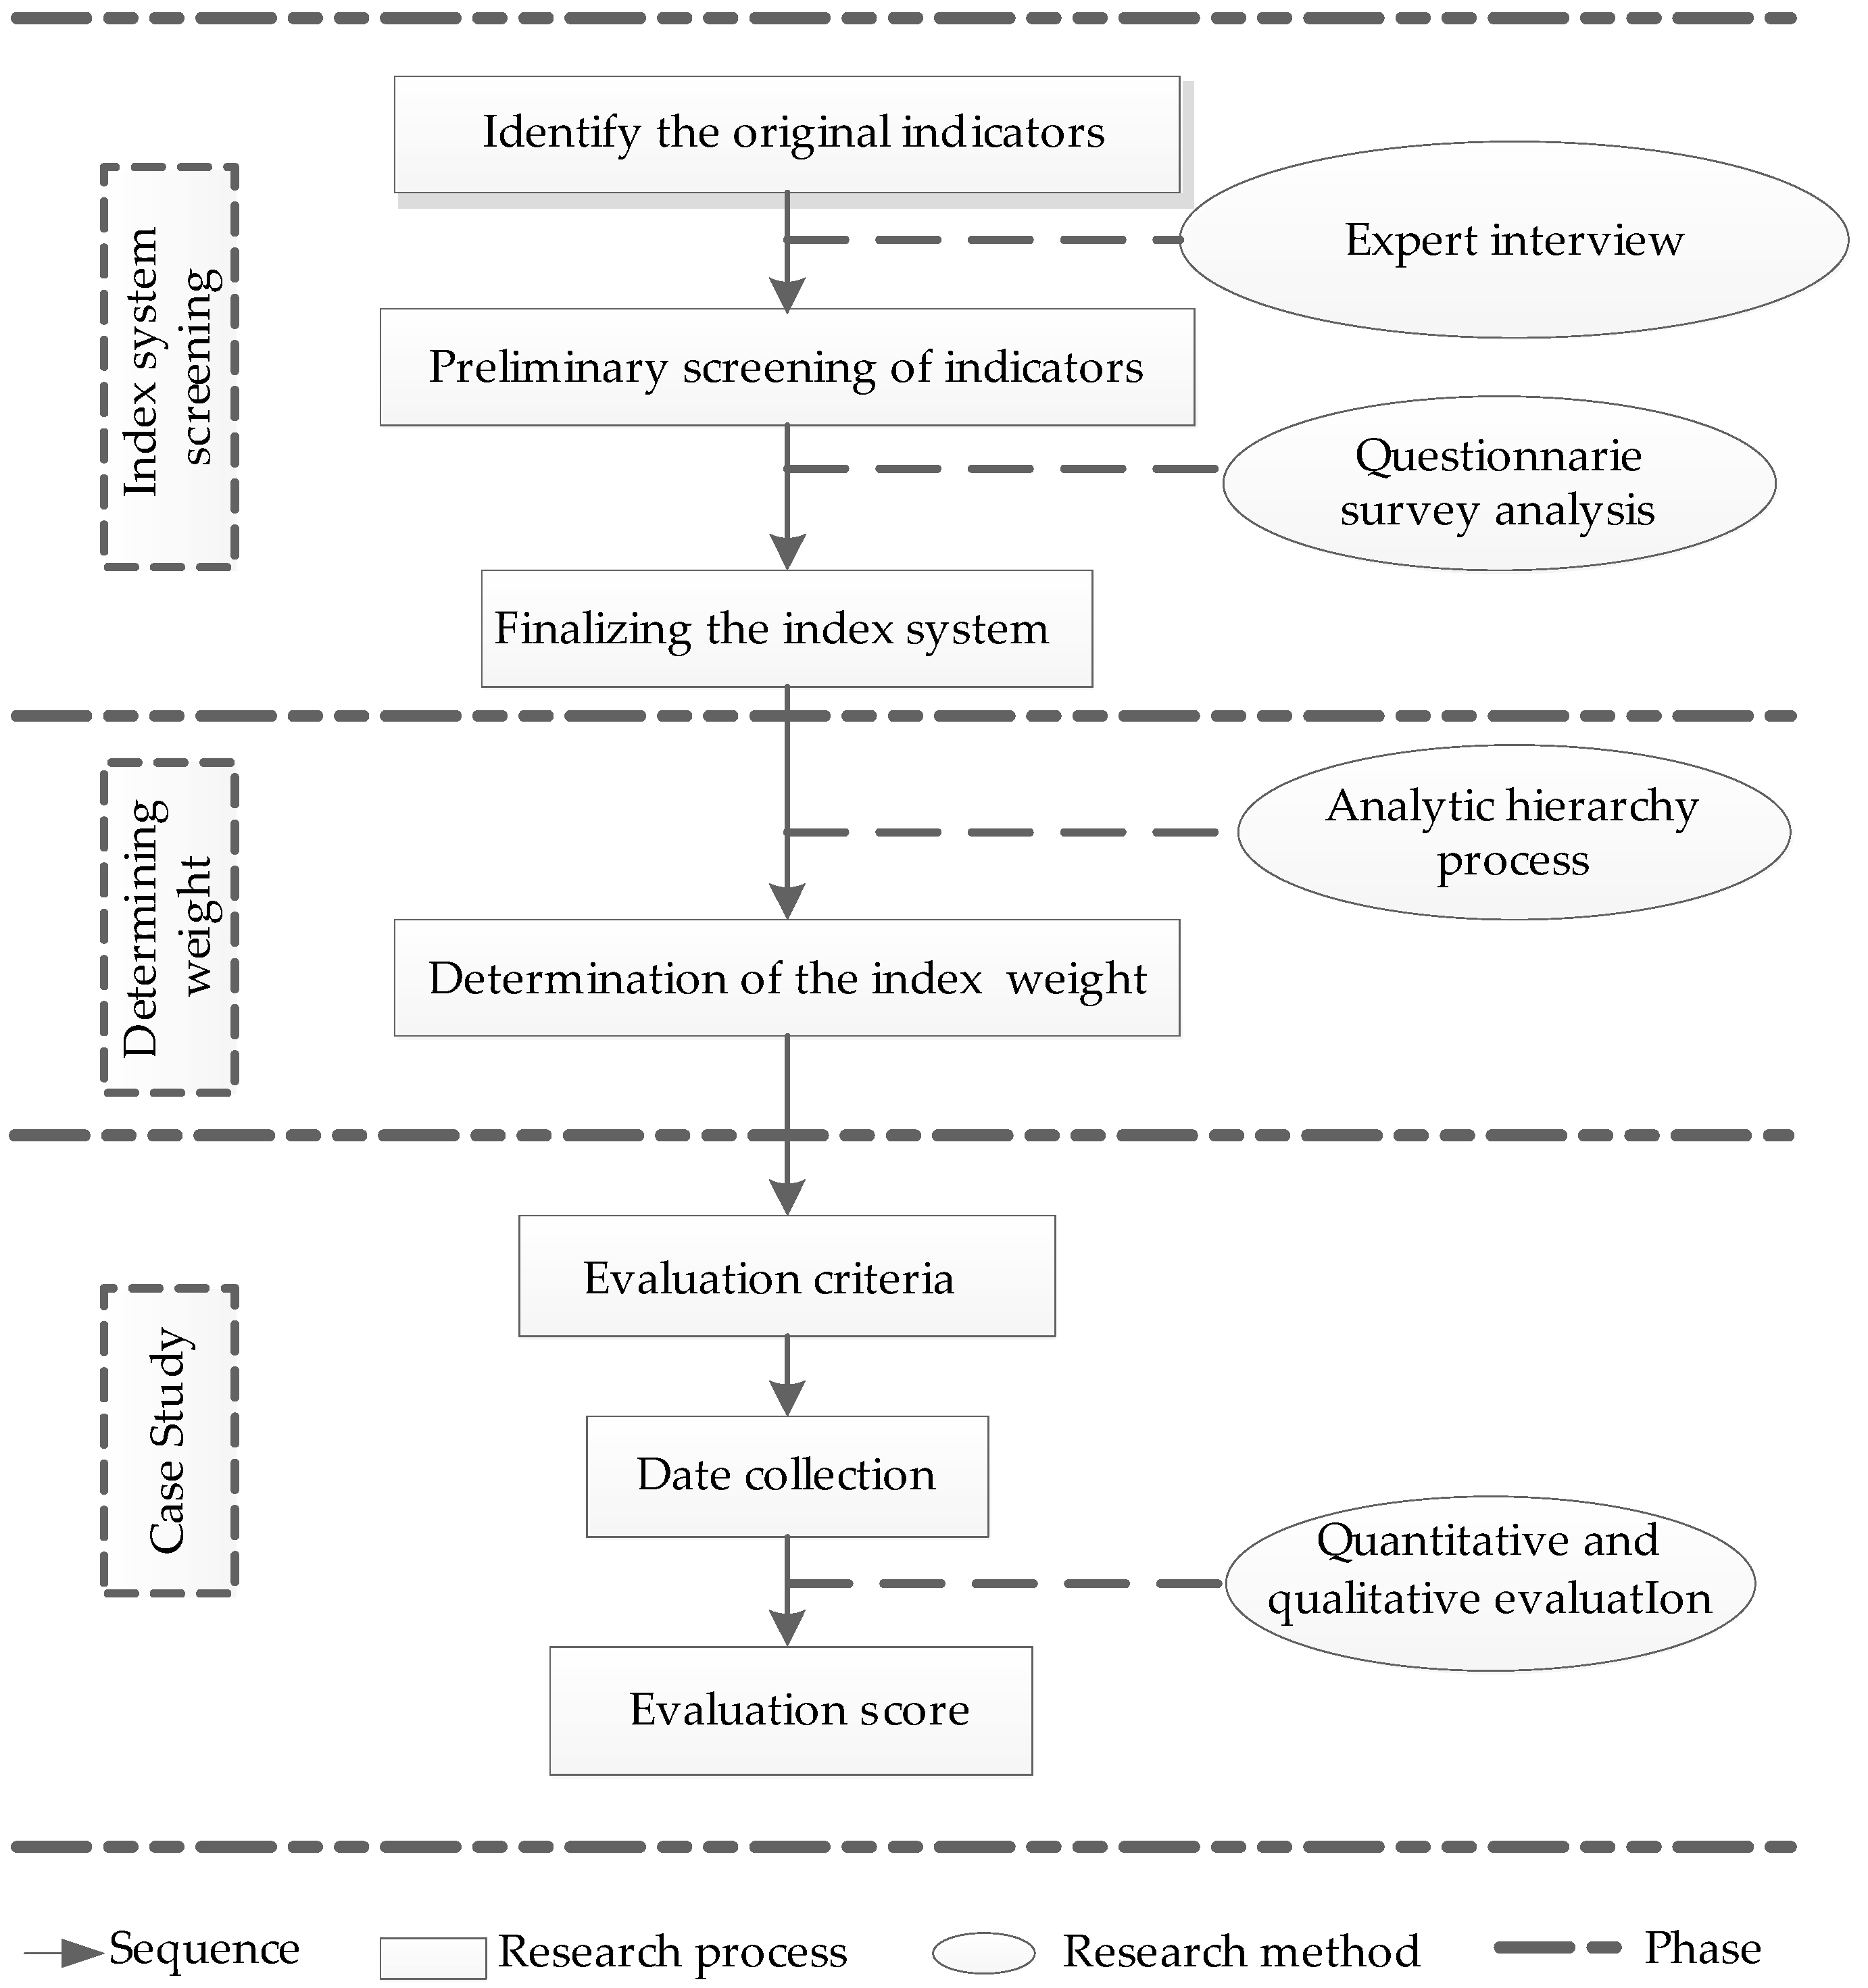
Figure 2.
Process of index system screening.
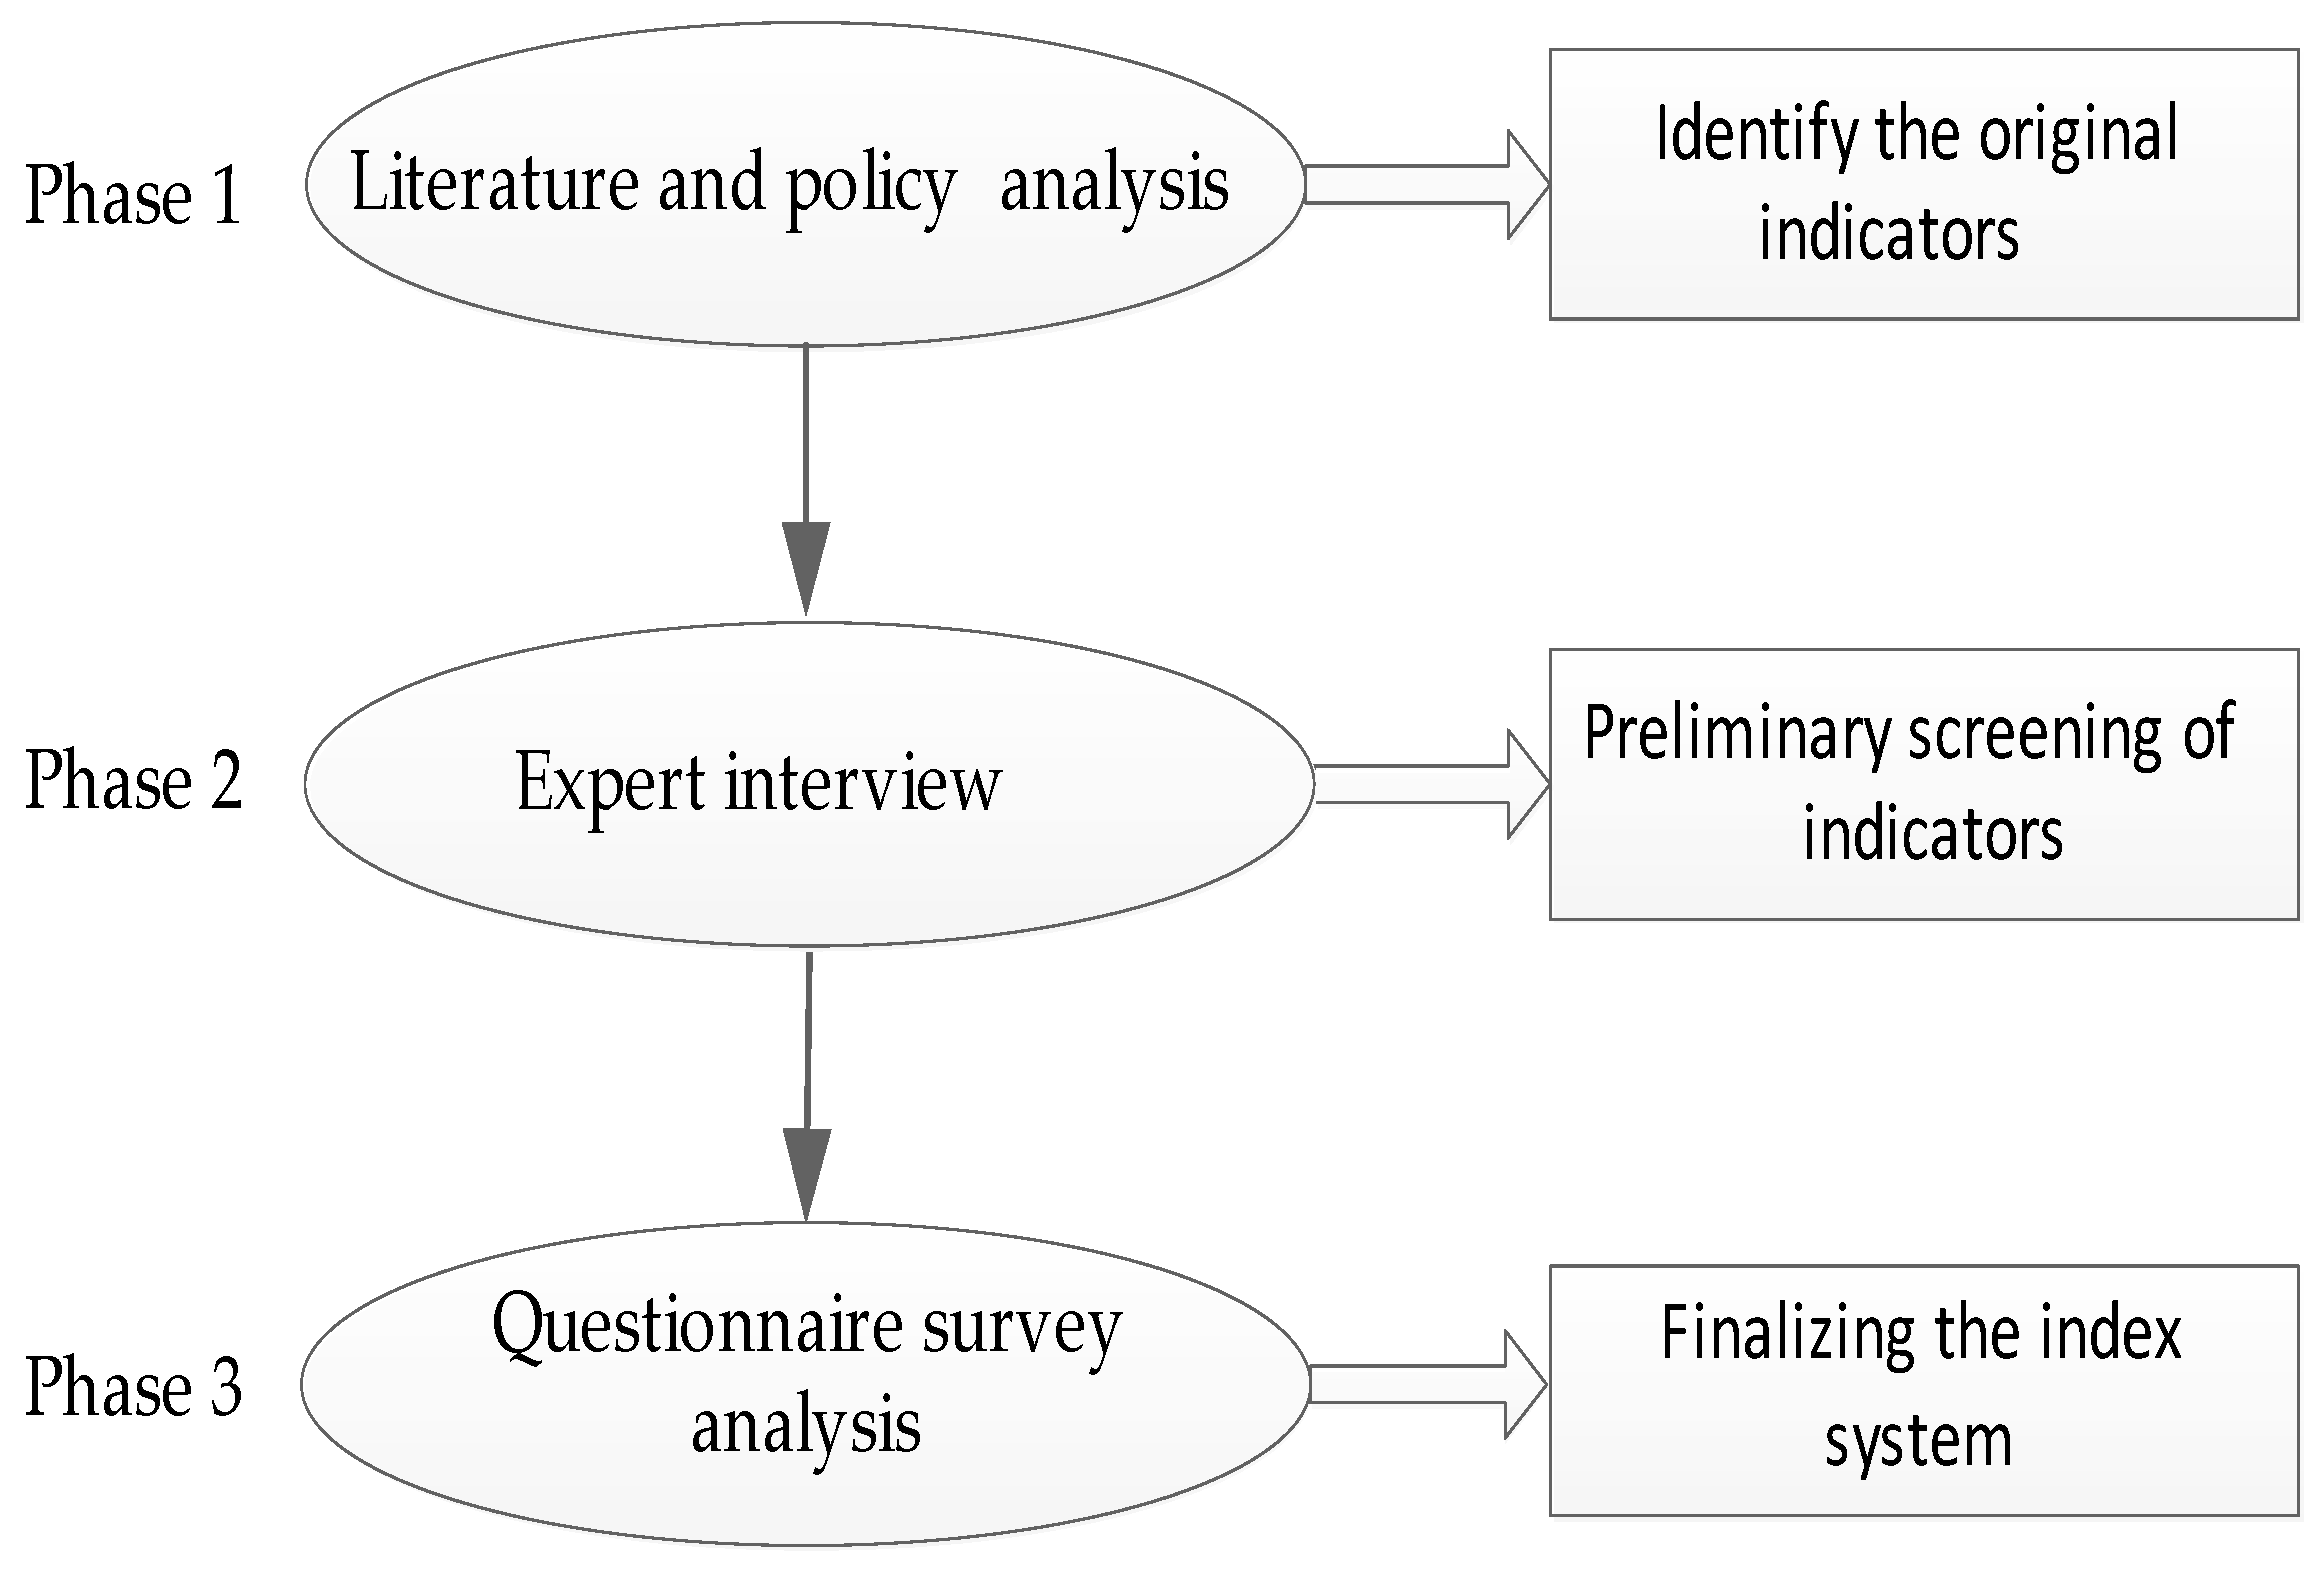
Figure 3.
The final index system for construction industrialization development level.

Figure 4.
The top ten ranked indicators through questionnaire survey analysis.

Figure 5.
Scores on the five dimensions for the development level of Jiangsu.
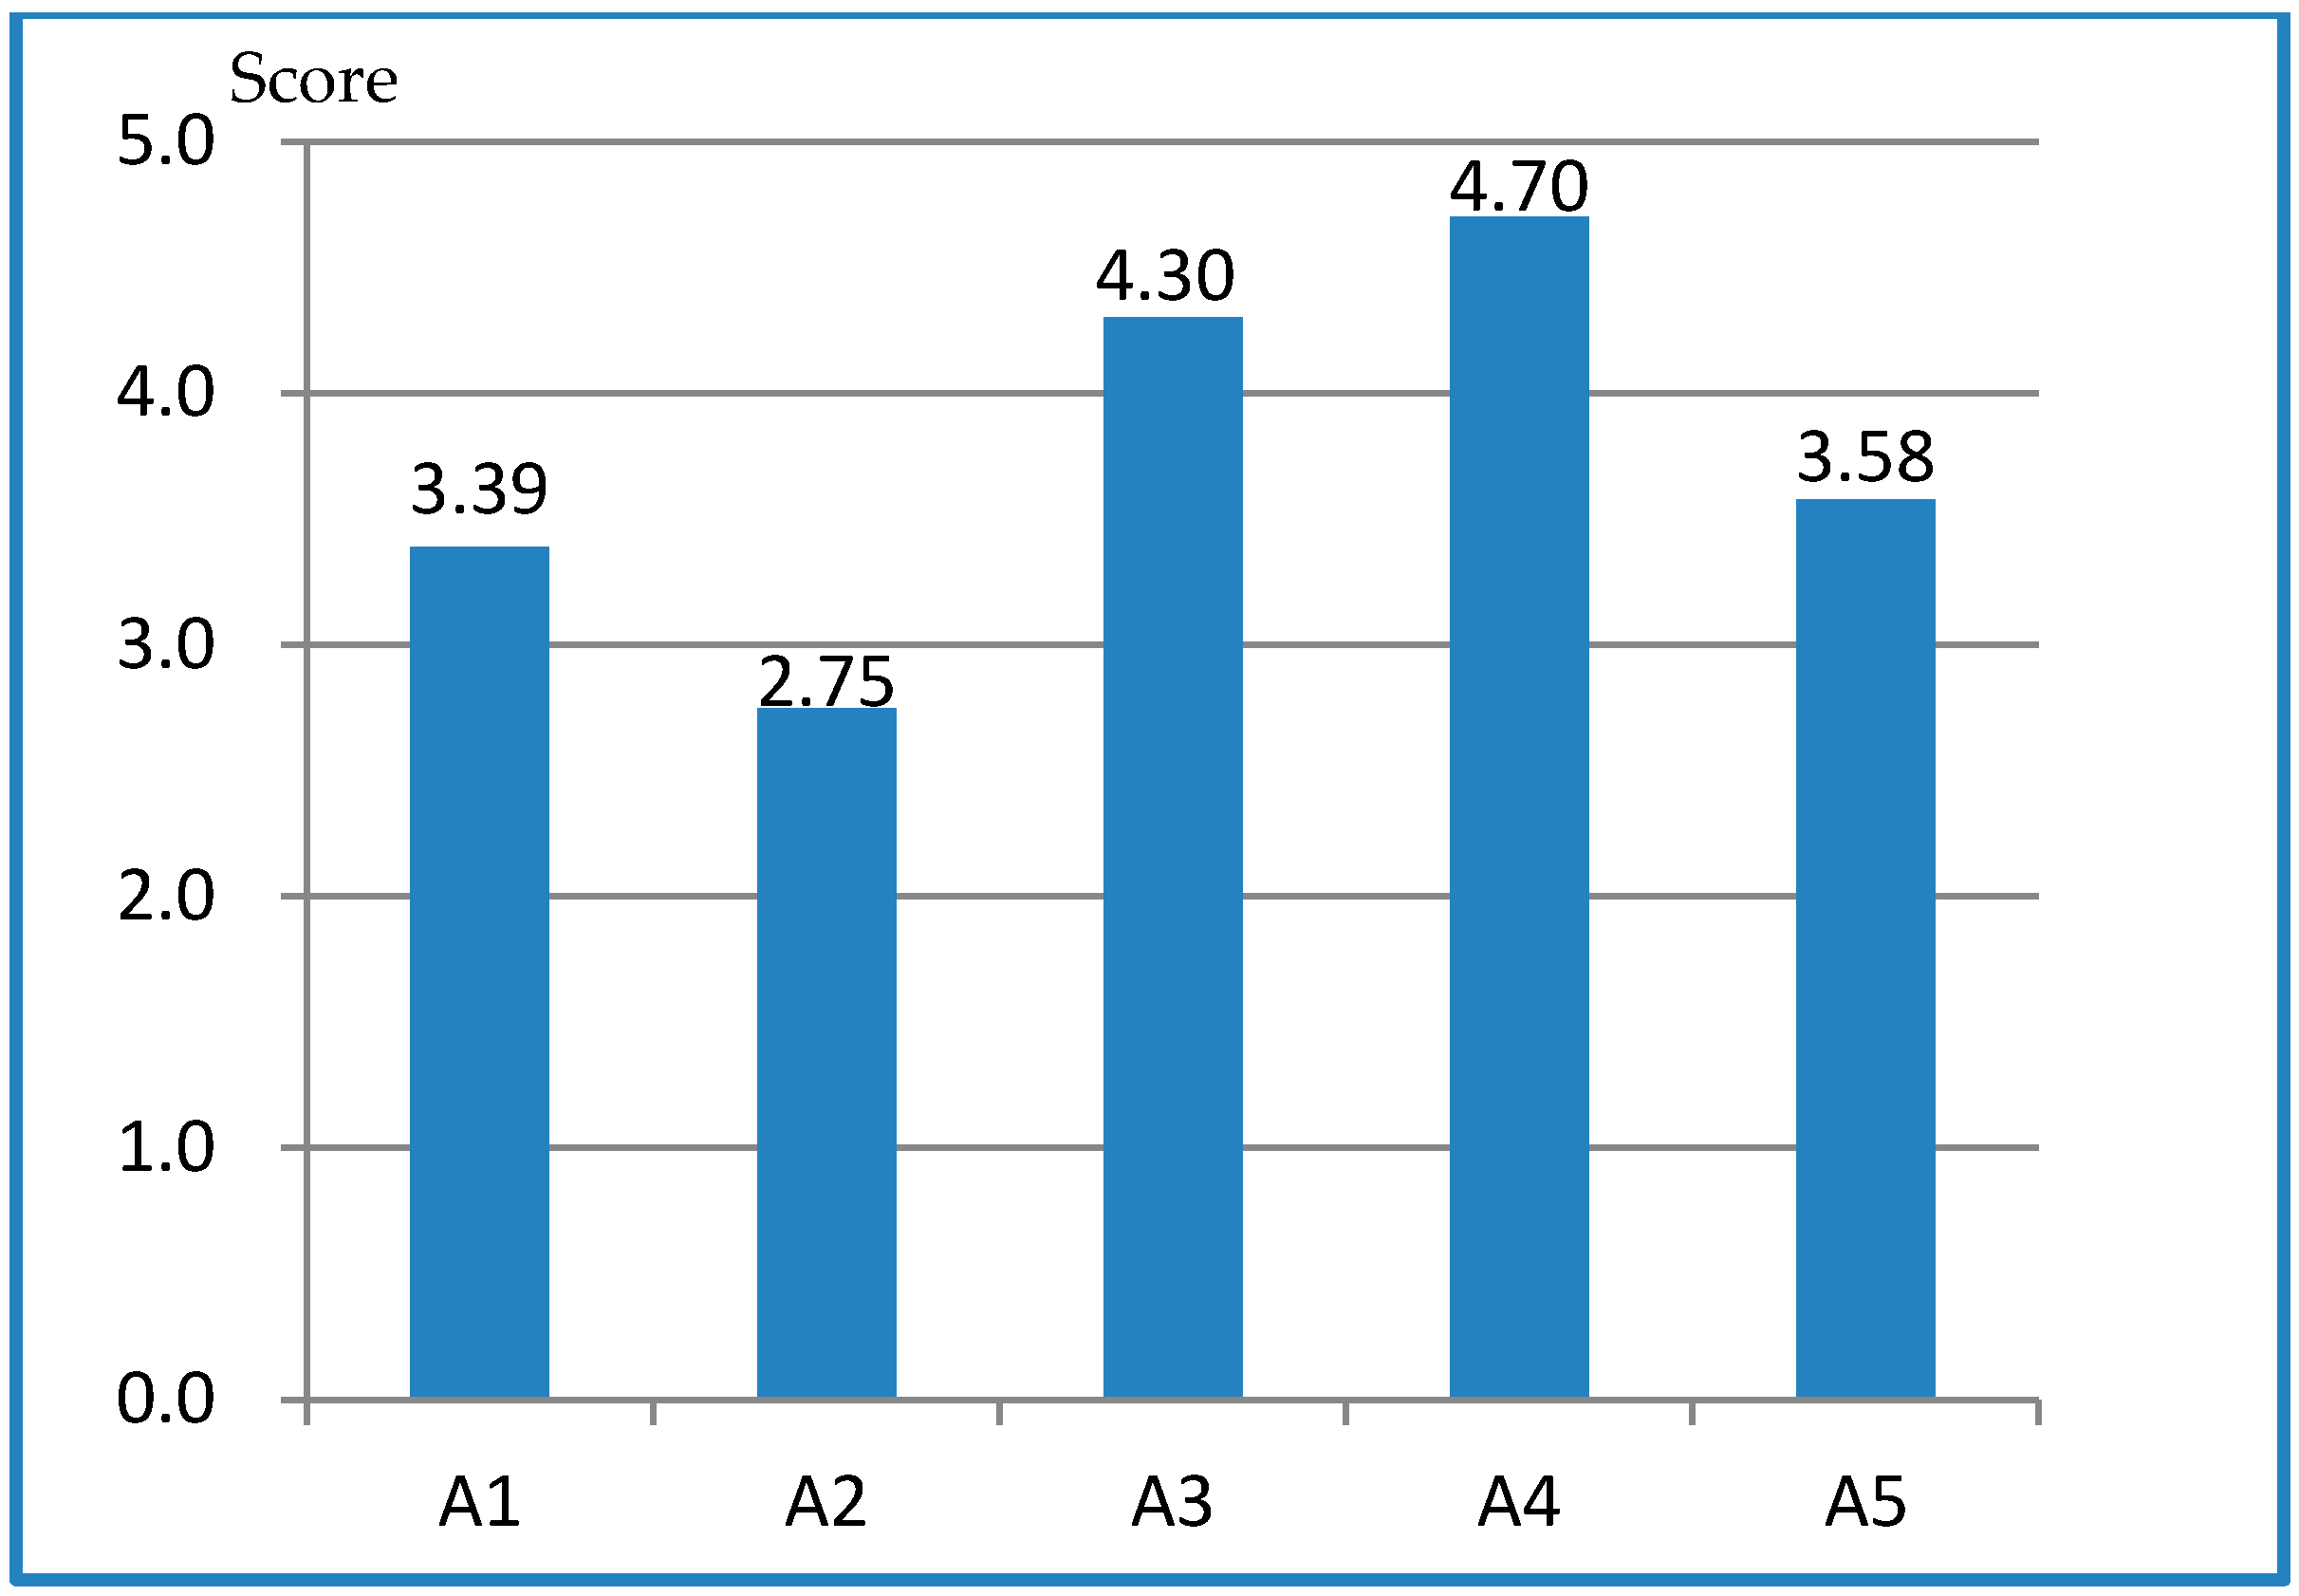
Figure 6.
Indicator scores for the development level of Jiangsu.

Table 1.
Description of importance.
| Score | Importance Description |
|---|---|
| 1 | “i” is equal important to “j” |
| 3 | “i” is weakly more important to “j” |
| 5 | “i” is strongly important to “j” |
| 7 | “i” is very strongly important to “j” |
| 9 | “i” is absolute more importance to “j” |
Note: 2, 4, 6 and 8 are intermediate values.
Table 2.
Random consistency index (RI).
| n | 1 | 2 | 3 | 4 | 5 | 6 | 7 | 8 | 9 | 10 |
|---|---|---|---|---|---|---|---|---|---|---|
| RI | 0 | 0 | 0.52 | 0.89 | 1.12 | 1.26 | 1.36 | 1.41 | 1.46 | 1.49 |
Table 3.
Preliminary index system of development level evaluation.
| Target Layer | Dimension Layer | Index Layer |
|---|---|---|
| Regional construction industrialization development level | Technical dimension (A1) | Application of modular design (A11); Application of standardized products (A12); Application of prefabricated part (A13); Proportion of finished housing (A14); Application of information technology (A15); Ratio of new buildings assemblage (A16); Application of “four new techniques” (A17); 3D printing technology (A18). |
| Economic dimension (A2) | Labor productivity (A21); Regional per capita GDP (A22); Building materials prices index (A23); The construction industry output value’ share of GDP (A24); Investment in fixed assets of construction and installation engineering (A25). | |
| Sustainable dimension (A3) | Application of clean energy (A31); The saving rate of building energy consumption (A32); Number of green buildings (A33); The utilization of land resources (A34). | |
| Enterprise development dimension (A4) | Number of regional construction company (A41); Number of the national industrial bases (A42); The value of newly signed contracts (A43); Number of the employees in the regional construction industry (A44). | |
| Development environment dimension (A5) | The rate of urbanization (A51); Market competition intensity (A52); Support rate of the masses (A53); Regional per capita housing area (A54). |
Table 4.
Profile of the data collected from the questionnaires.
| Respondents’ Characteristics | Description | N | % |
|---|---|---|---|
| Construction companies (N = 67) | Senior manager | 35 | 52.2 |
| Project manager | 21 | 31.3 | |
| Project engineer | 11 | 16.5 | |
| Government regulators (N = 85) | Leader | 62 | 72.9 |
| Staff | 23 | 27.1 | |
| Years of experience (N = 152) | <5 | 19 | 12.5 |
| 5–9 | 31 | 20.4 | |
| 10–20 | 74 | 48.7 | |
| >20 | 28 | 18.4 | |
| Regions (N = 152) | Jiangsu Province | 91 | 59.9 |
| Zhejiang Province | 17 | 11.2 | |
| Shanghai | 14 | 9.2 | |
| Others | 30 | 19.7 |
Table 5.
Scores and ranking of the indicators.
| Dimension | Indicator | Mean | Std. Dev | CV | Rank | Group Mean | Group Rank | Verification |
|---|---|---|---|---|---|---|---|---|
| Technical dimension (A1) | A11 | 4.540 | 0.61 | 0.13 | 4 | 4.383 | 1 | Pass |
| A12 | 4.628 | 0.58 | 0.13 | 2 | Pass | |||
| A13 | 4.211 | 0.78 | 0.19 | 9 | Pass | |||
| A14 | 4.352 | 0.82 | 0.19 | 7 | Pass | |||
| A15 | 4.171 | 1.21 | 0.29 | 10 | Pass | |||
| A16 | 4.685 | 0.46 | 0.10 | 1 | Pass | |||
| A17 | 4.095 | 0.86 | 0.21 | 11 | Pass | |||
| A18 | 2.875 | 1.14 | 0.40 | 23 | No | |||
| Economic dimension (A2) | A21 | 4.376 | 0.49 | 0.11 | 6 | 3.774 | 4 | Pass |
| A22 | 3.157 | 0.78 | 0.25 | 22 | Pass | |||
| A23 | 3.866 | 0.50 | 0.13 | 15 | Pass | |||
| A24 | 3.925 | 0.83 | 0.21 | 14 | Pass | |||
| A25 | 3.548 | 0.71 | 0.20 | 17 | Pass | |||
| Sustainable dimension (A3) | A31 | 3.430 | 0.83 | 0.24 | 19 | 3.892 | 3 | Pass |
| A32 | 3.961 | 0.66 | 0.17 | 13 | Pass | |||
| A33 | 4.285 | 0.87 | 0.20 | 8 | Pass | |||
| A34 | 2.601 | 0.81 | 0.31 | 24 | No | |||
| Enterprise development dimension (A4) | A41 | 3.361 | 0.74 | 0.22 | 20 | 4.002 | 2 | Pass |
| A42 | 4.587 | 1.05 | 0.23 | 3 | Pass | |||
| A43 | 4.059 | 0.67 | 0.17 | 12 | Pass | |||
| A44 | 2.473 | 0.71 | 0.29 | 25 | No | |||
| Development environment dimension (A5) | A51 | 3.774 | 0.48 | 0.13 | 16 | 3.742 | 5 | Pass |
| A52 | 3.471 | 0.85 | 0.24 | 18 | Pass | |||
| A53 | 4.469 | 0.45 | 0.10 | 5 | Pass | |||
| A54 | 3.254 | 0.62 | 0.19 | 21 | Pass |
Table 6.
Evaluation criteria of index system in the technical dimension (A1).
| Index | Evaluation Criteria | Score | Rule Explained |
|---|---|---|---|
| A11, A12 A13, A15 A16, A17 | Proportion more than 20% | 5 | National programmer for construction industry modernization [47] |
| Proportion within 15–20% | 4 | ||
| Proportion within 10–15% | 3 | ||
| Proportion within 5–10% | 2 | ||
| Proportion lower than 5% | 1 | ||
| A14 | Proportion more than 60% | 5 | Compared with data of “Green building action plan of Jiangsu province” [48] |
| Proportion within 40–60% | 4 | ||
| Proportion within 20–40% | 3 | ||
| Proportion within 10–20% | 2 | ||
| Proportion lower than 10% | 1 |
Table 7.
Evaluation criteria of index system in the economic dimension (A2).
| Index | Scoring Criteria | Score | Rule Explained |
|---|---|---|---|
| A21 | more than 340,000 Yuan per person | 5 | The national average is 324,026 [44] |
| within 330,000–340,000 Yuan/person | 4 | ||
| within 320,000–330,000 Yuan/person | 3 | ||
| within 290,000–320,000 Yuan/person | 2 | ||
| lower than 290,000 Yuan per person | 1 | ||
| A22 | more than 70,000 Yuan per person | 5 | The national average is 52,000 Yuan/person [44] |
| within 60,000–70,000 Yuan/person | 4 | ||
| within 50,000–60,000 Yuan/person | 3 | ||
| within 40,000–50,000 Yuan/person | 2 | ||
| lower than 40,000 Yuan/person | 1 | ||
| A23 | Price index below 90 | 5 | The national average is 100.0 [44] |
| Price index within 90–95 | 4 | ||
| Price index within 95–100 | 3 | ||
| Price index within 100–105 | 2 | ||
| Price index more than 105 | 1 | ||
| A24 | Proportion more than 7.5% | 5 | The national average is 6.86% [44] |
| Proportion within 7.0–7.5% | 4 | ||
| Proportion within 6.5–7.0% | 3 | ||
| Proportion within 6.0–6.5% | 2 | ||
| Proportion lower than 6.0% | 1 | ||
| A25 | Proportion more than 15% | 5 | The national total is 37,972 trillion Yuan [44] |
| Proportion within 7–15% | 4 | ||
| Proportion within 4–7% | 3 | ||
| Proportion within 2–4% | 2 | ||
| Proportion below 2% | 1 |
Table 8.
Evaluation criteria of index system in the sustainable dimension (A3).
| Index | Scoring Criteria | Score | Rule Explained |
|---|---|---|---|
| A31 | A large number of projects | 5 | Expert decision |
| Within 3–5 | 4 | ||
| Several projects | 3 | ||
| Within 1–2 | 2 | ||
| No project | 1 | ||
| A32 | Ratio reaches 65% or more | 5 | Compared with data of “The twelfth Five-Year Plane of energy efficiency in buildings of Jiangsu province” [49] |
| Ratio within 55–65% | 4 | ||
| Ratio within 45–55% | 3 | ||
| Ratio within 30–45% | 2 | ||
| Ratio below 30% | 1 | ||
| A33 | Proportion more than 15% | 5 | The national total is 3636 [50] |
| Proportion within 7–15% | 4 | ||
| Proportion within 4–7% | 3 | ||
| Proportion within 2–4% | 2 | ||
| Proportion below 2% | 1 |
Table 9.
Evaluation criteria of index system in the enterprise development dimension (A4).
| Index | Scoring Criteria | Score | Rule Explained |
|---|---|---|---|
| A41 | Proportion more than 15% | 5 | The national total is 80,911 [44] |
| Proportion within 7–15% | 4 | ||
| Proportion within 4–7% | 3 | ||
| Proportion within 2–4% | 2 | ||
| Proportion below 2% | 1 | ||
| A42 | Number reaches 7 or more | 5 | The national total is 70 [51] |
| Number within 5–6 | 4 | ||
| Number within 3–4 | 3 | ||
| Number 2 | 2 | ||
| Number 1 or under | 1 | ||
| A43 | Proportion more than 15% | 5 | The national total is 18.43 trillion Yuan [44] |
| Proportion within 7–15% | 4 | ||
| Proportion within 4–7% | 3 | ||
| Proportion within 2–4% | 2 | ||
| Proportion below 2% | 1 |
Table 10.
Evaluation criteria of index system in the development base dimension (A5).
| Index | Scoring Criteria | Score | Rule Explained |
|---|---|---|---|
| A51 | Ratio reaches 65% or more | 5 | The national average is 56.1% [44] |
| Ratio within 60–65% | 4 | ||
| Ratio within 55–60% | 3 | ||
| Ratio within 55–50% | 2 | ||
| Ratio below 50% | 1 | ||
| A52 | High degree of market competition | 5 | Expert decision |
| Within 3–5 | 4 | ||
| Common degree of market competition | 3 | ||
| Within 1–3 | 2 | ||
| Poor degree of market competition | 1 | ||
| A53 | High degree acceptance | 5 | Expert decision |
| Within 3–5 | 4 | ||
| Common degree acceptance | 3 | ||
| Within 1–3 | 2 | ||
| Poor degree acceptance | 1 | ||
| A54 | More than 40 m2 | 5 | The national average is 33 m2 [44] |
| Within 37–40 m2 | 4 | ||
| Within 33–37 m2 | 3 | ||
| Within 30–33 m2 | 2 | ||
| Lower than 30 m2 | 1 |
Table 11.
The relative data of quantitative evaluation index.
| Index | Data | Source |
|---|---|---|
| A21 | 297,437/Yuan/Year | Statistical Yearbook of Jiangsu [43] |
| A22 | 88,500 | National Bureau of Statistics of China [44] |
| A23 | 91.7 | Statistical Yearbook of Jiangsu [43] |
| A24 | 6% | National economy and social development statistical bulletin of Jiangsu [52] |
| A25 | 2.757 trillion Yuan | Statistical Yearbook of Jiangsu [43] |
| A33 | 562 | Ministry of Housing and Urban-Rural Construction of China [50] |
| A41 | 9146 | Statistical Yearbook of Jiangsu [43] |
| A42 | 8 | List of national housing industrialization base [51] |
| A43 | 2.077 trillion Yuan | Statistical Yearbook of Jiangsu [43] |
| A51 | 66.5% | National economy and social development statistical bulletin of Jiangsu [52] |
| A54 | 45.22 m2 | Statistical Yearbook of Jiangsu [43] |
Table 12.
The judgment matrix and weight based on .
| A | A1 | A2 | A3 | A4 | A5 | Weight | ||
|---|---|---|---|---|---|---|---|---|
| A1 | 1 | 1/5 | 1/4 | 1/3 | 1/5 | 5.224 | 0.47 | CI = 0.056 < 0.1 Uniform convergence |
| A2 | 5 | 1 | 3 | 4 | 1/2 | 0.08 | ||
| A3 | 4 | 1/3 | 1 | 3 | 1/2 | 0.13 | ||
| A4 | 3 | 1/4 | 1/3 | 1 | 1/4 | 0.26 | ||
| A5 | 5 | 2 | 2 | 4 | 1 | 0.06 |
Table 13.
The judgment matrix and weight based on .
| A1 | A11 | A12 | A13 | A14 | A15 | A16 | A17 | Weight | ||
|---|---|---|---|---|---|---|---|---|---|---|
| A11 | 1 | 2 | 1/4 | 1/3 | 1/5 | 3 | 1/5 | 7.264 | 0.18 | CI = 0.044 < 0.1 Uniform convergence |
| A12 | 1/2 | 1 | 1/5 | 1/4 | 1/6 | 2 | 1/6 | 0.26 | ||
| A13 | 4 | 5 | 1 | 3 | 1/2 | 5 | 1/3 | 0.06 | ||
| A14 | 3 | 4 | 1/3 | 1 | 1/3 | 4 | 1/4 | 0.10 | ||
| A15 | 5 | 6 | 2 | 3 | 1 | 6 | 1/2 | 0.04 | ||
| A16 | 1/3 | 1/2 | 1/5 | 1/4 | 1/6 | 1 | 1/7 | 0.33 | ||
| A17 | 5 | 6 | 3 | 4 | 2 | 7 | 1 | 0.03 |
Table 14.
The judgment matrix and weight based on .
| A2 | A21 | A22 | A23 | A24 | A25 | Weight | ||
|---|---|---|---|---|---|---|---|---|
| A21 | 1 | 1/5 | 1/3 | 1/3 | 1/3 | 5.104 | 0.45 | CI = 0.026 < 0.1 Uniform convergence |
| A22 | 5 | 1 | 3 | 3 | 2 | 0.07 | ||
| A23 | 3 | 1/3 | 1 | 2 | 1/2 | 0.16 | ||
| A24 | 3 | 1/3 | 1/2 | 1 | 1/2 | 0.21 | ||
| A25 | 4 | 1/2 | 2 | 2 | 1 | 0.11 |
Table 15.
The judgment matrix and weight based on .
| A3 | A31 | A32 | A33 | Weight | ||
|---|---|---|---|---|---|---|
| A31 | 1 | 3 | 4 | 3.036 | 0.13 | CI = 0.018 < 0.1 Uniform convergence |
| A32 | 1/3 | 1 | 2 | 0.32 | ||
| A33 | 1/4 | 1/2 | 1 | 0.55 |
Table 16.
The judgment matrix and weight based on .
| A4 | A41 | A42 | A43 | Weight | ||
|---|---|---|---|---|---|---|
| A41 | 1 | 7 | 3 | 3.062 | 0.09 | CI = 0.031 < 0.1 Uniform convergence |
| A42 | 1/7 | 1 | 1/4 | 0.70 | ||
| A43 | 1/3 | 4 | 1 | 0.21 |
Table 17.
The judgment matrix and weight based on .
| A5 | A51 | A52 | A53 | A54 | Weight | ||
|---|---|---|---|---|---|---|---|
| A51 | 1 | 1/2 | 4 | 1/3 | 4.075 | 0.20 | CI = 0.025 < 0.1 Uniform convergence |
| A52 | 2 | 1 | 5 | 1/2 | 0.12 | ||
| A53 | 1/4 | 1/5 | 1 | 1/6 | 0.60 | ||
| A54 | 3 | 2 | 6 | 1 | 0.08 |
Table 18.
Calculated results of Jiangsu construction industrialization development level.
| Evaluation Target (A) | Dimension (Ai) | Index (Aij) | W(ij) | SC(i) | W(i) | SC | |
|---|---|---|---|---|---|---|---|
| Regional construction industrialization development level | A1 | A11 | 3.7 | 0.18 | 3.39 | 0.47 | 3.81 |
| A12 | 3.2 | 0.26 | |||||
| A13 | 3.8 | 0.06 | |||||
| A14 | 2.7 | 0.10 | |||||
| A15 | 3.4 | 0.04 | |||||
| A16 | 3.5 | 0.33 | |||||
| A17 | 3.4 | 0.03 | |||||
| A2 | A21 | 2 | 0.45 | 2.75 | 0.08 | ||
| A22 | 5 | 0.07 | |||||
| A23 | 4 | 0.16 | |||||
| A24 | 2 | 0.21 | |||||
| A25 | 4 | 0.11 | |||||
| A3 | A31 | 3.3 | 0.13 | 4.30 | 0.13 | ||
| A32 | 3.5 | 0.32 | |||||
| A33 | 5 | 0.55 | |||||
| A4 | A41 | 4 | 0.09 | 4.70 | 0.26 | ||
| A42 | 5 | 0.70 | |||||
| A43 | 4 | 0.21 | |||||
| A5 | A51 | 5 | 0.20 | 3.58 | 0.06 | ||
| A52 | 4.2 | 0.12 | |||||
| A53 | 2.8 | 0.60 | |||||
| A54 | 5 | 0.08 |
© 2017 by the authors. Licensee MDPI, Basel, Switzerland. This article is an open access article distributed under the terms and conditions of the Creative Commons Attribution (CC BY) license (http://creativecommons.org/licenses/by/4.0/).
Share and Cite
MDPI and ACS Style
Liu, P.; Li, Q.; Song, L.; Jia, R. The Index System for the Development Level Evaluation of Regional Construction Industrialization: A Case Study in Jiangsu, China. Appl. Sci. 2017, 7, 492. https://doi.org/10.3390/app7050492
AMA Style
Liu P, Li Q, Song L, Jia R. The Index System for the Development Level Evaluation of Regional Construction Industrialization: A Case Study in Jiangsu, China. Applied Sciences. 2017; 7(5):492. https://doi.org/10.3390/app7050492
Chicago/Turabian StyleLiu, Ping, Qiming Li, Liangliang Song, and Ruoyu Jia. 2017. "The Index System for the Development Level Evaluation of Regional Construction Industrialization: A Case Study in Jiangsu, China" Applied Sciences 7, no. 5: 492. https://doi.org/10.3390/app7050492
Note that from the first issue of 2016, this journal uses article numbers instead of page numbers. See further details here.