
Estimation of Noise Magnitude for Speech Denoising Using Minima-Controlled-Recursive-Averaging Algorithm Adapted by Harmonic Properties


Abstract
:1. Introduction
2. Review of the MCRA Noise Estimator
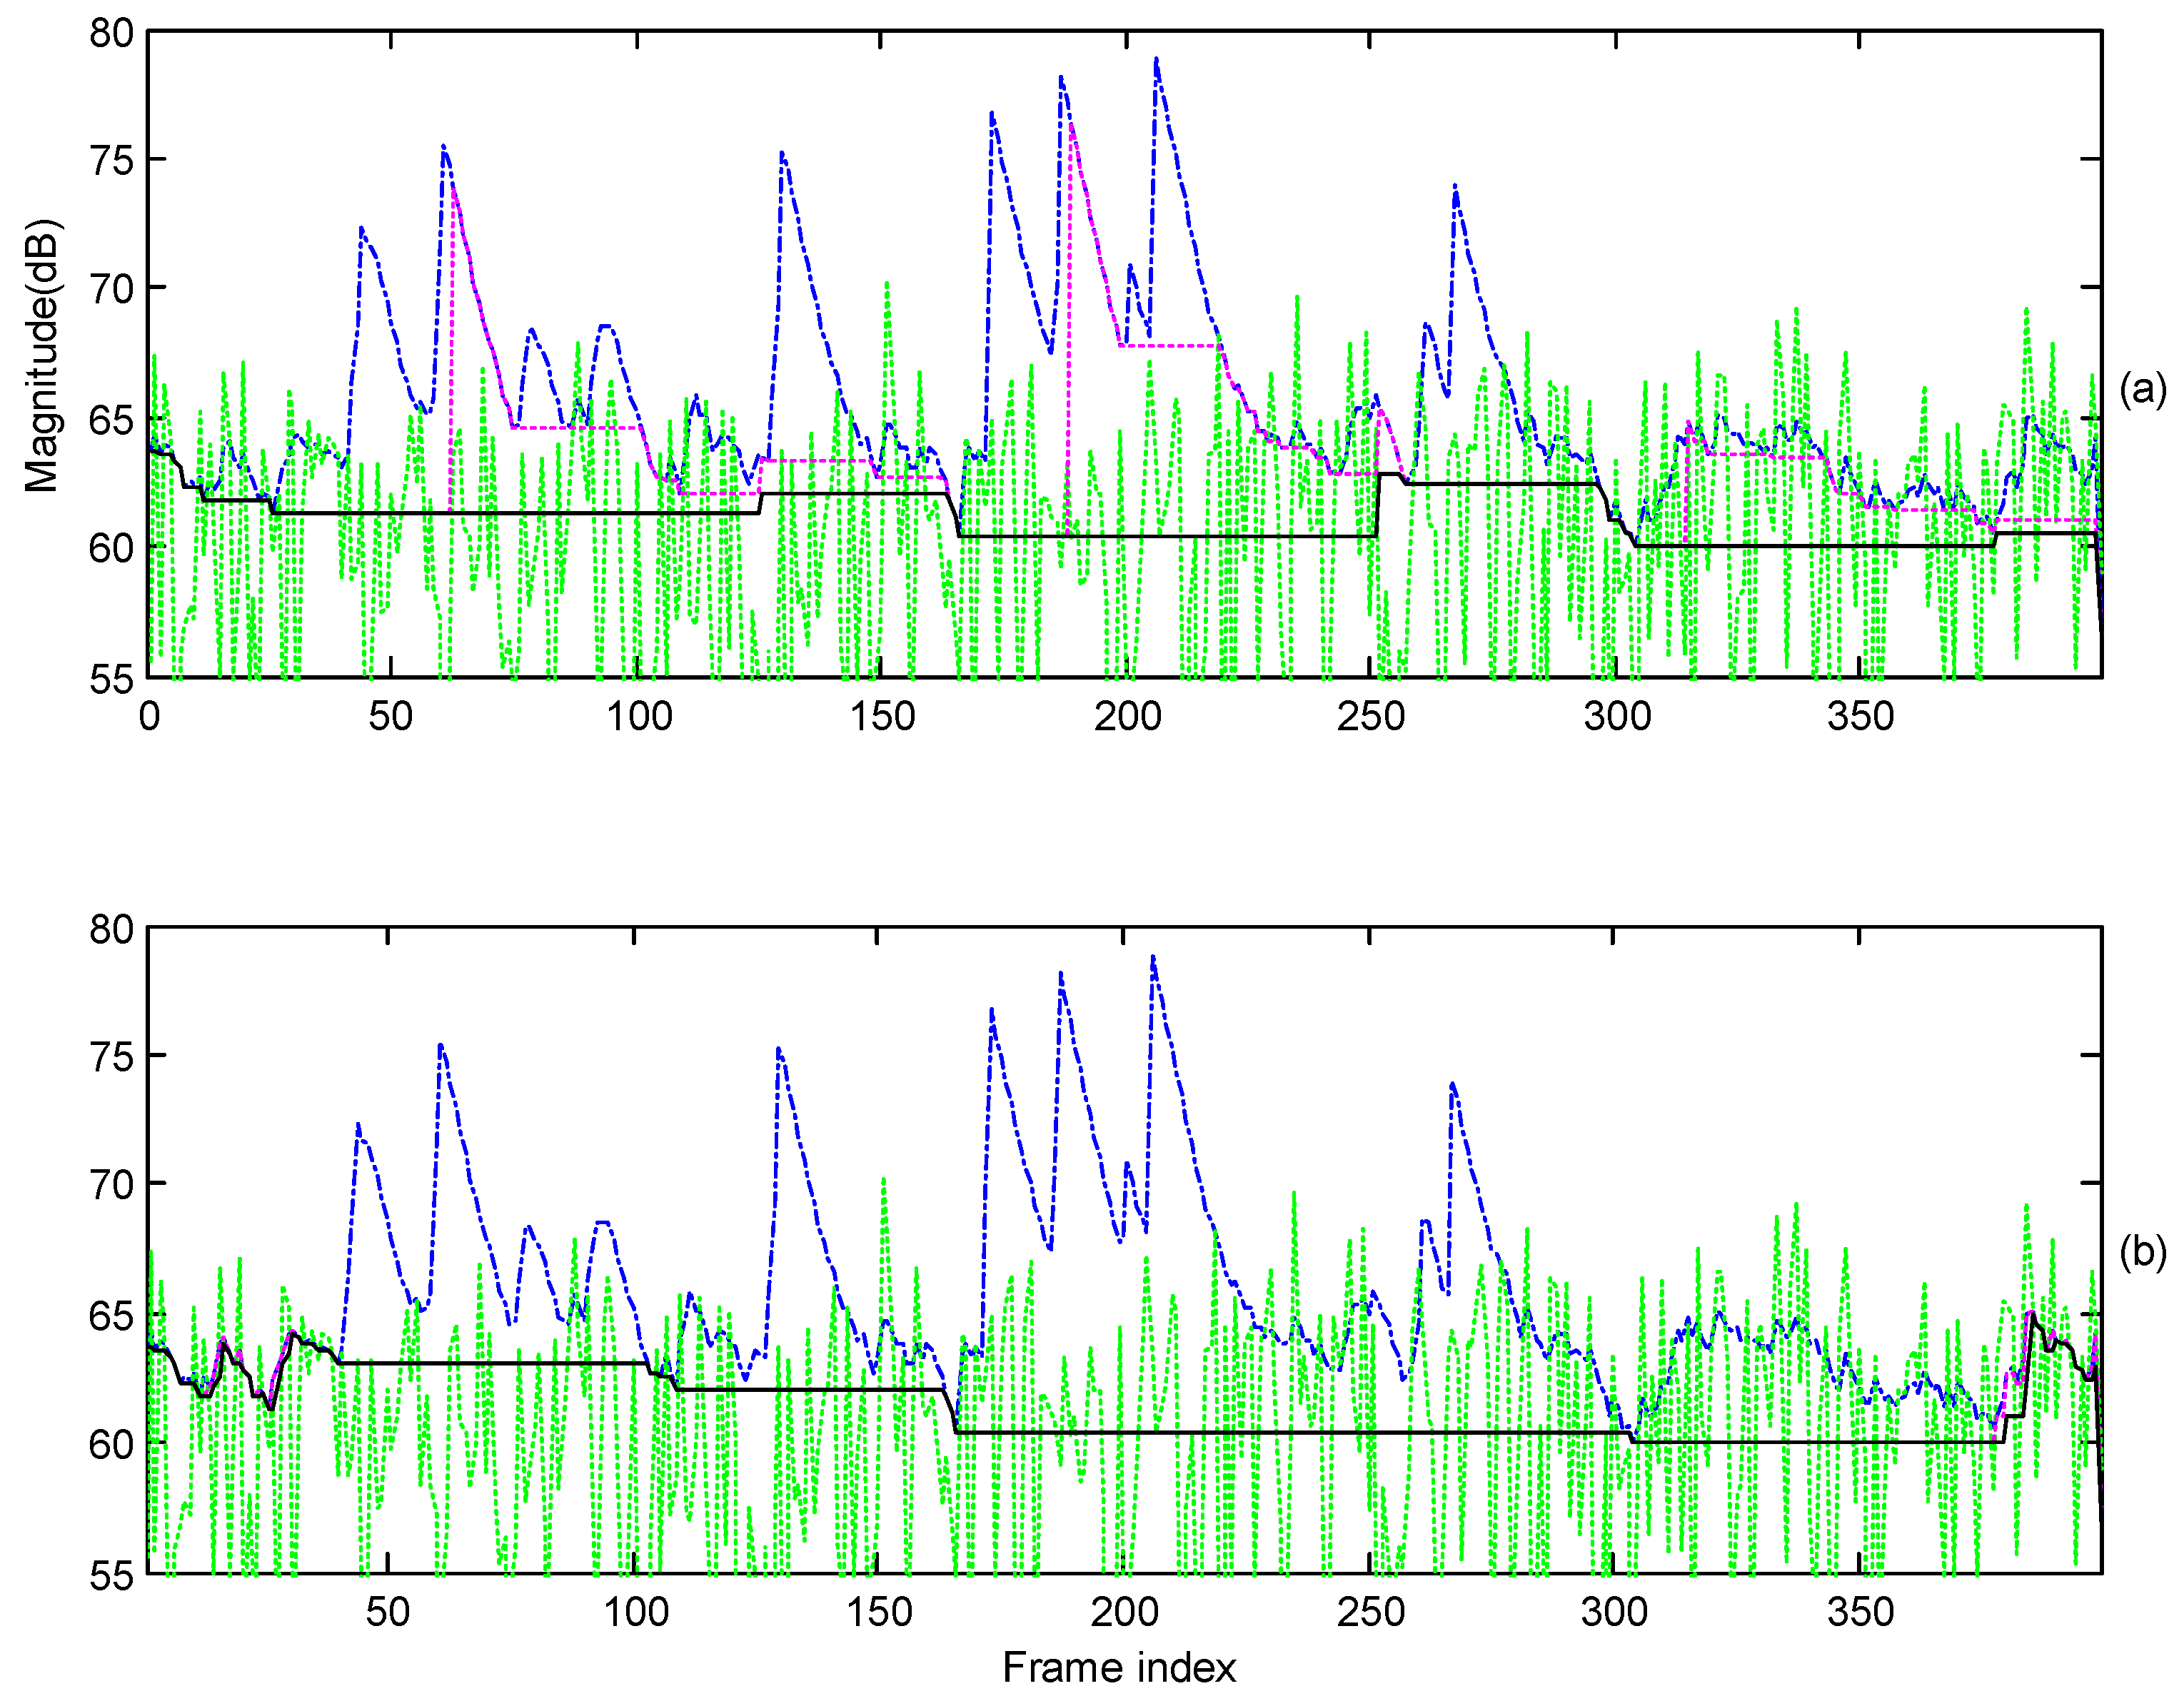
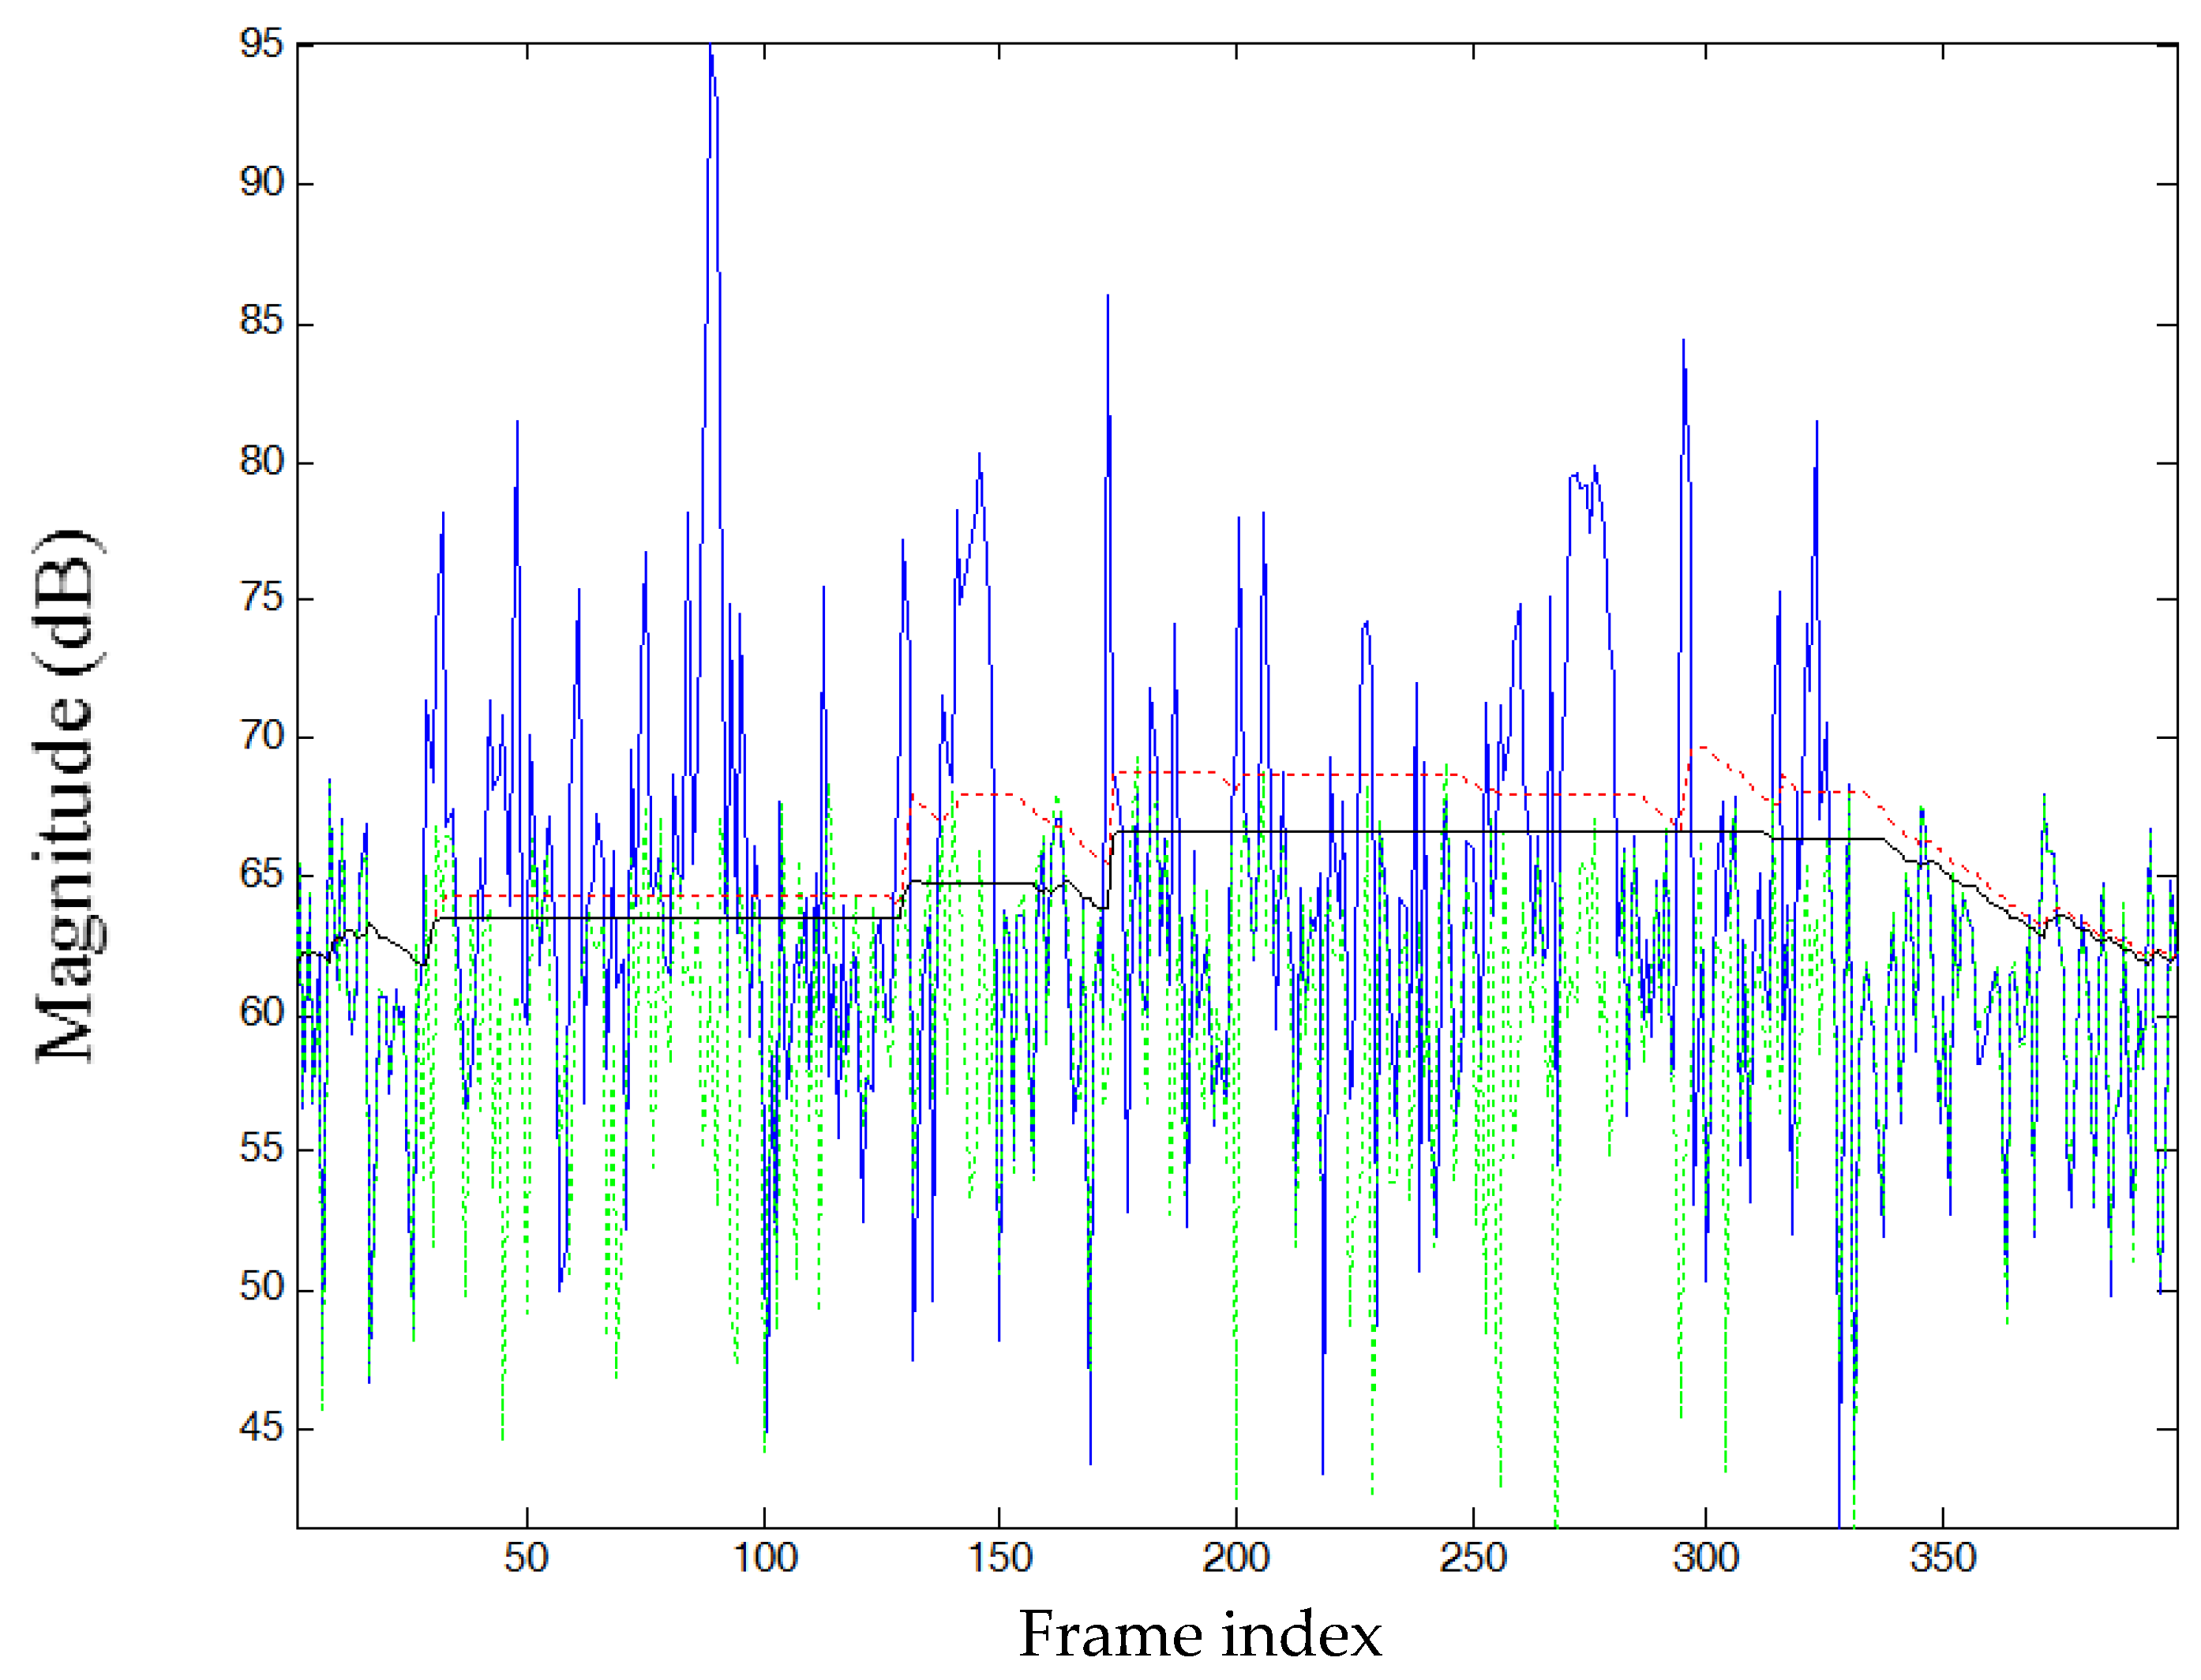
3. Modification of MCRA Algorithm
3.1. Variable Segment Length Adapted by Harmonic Properties
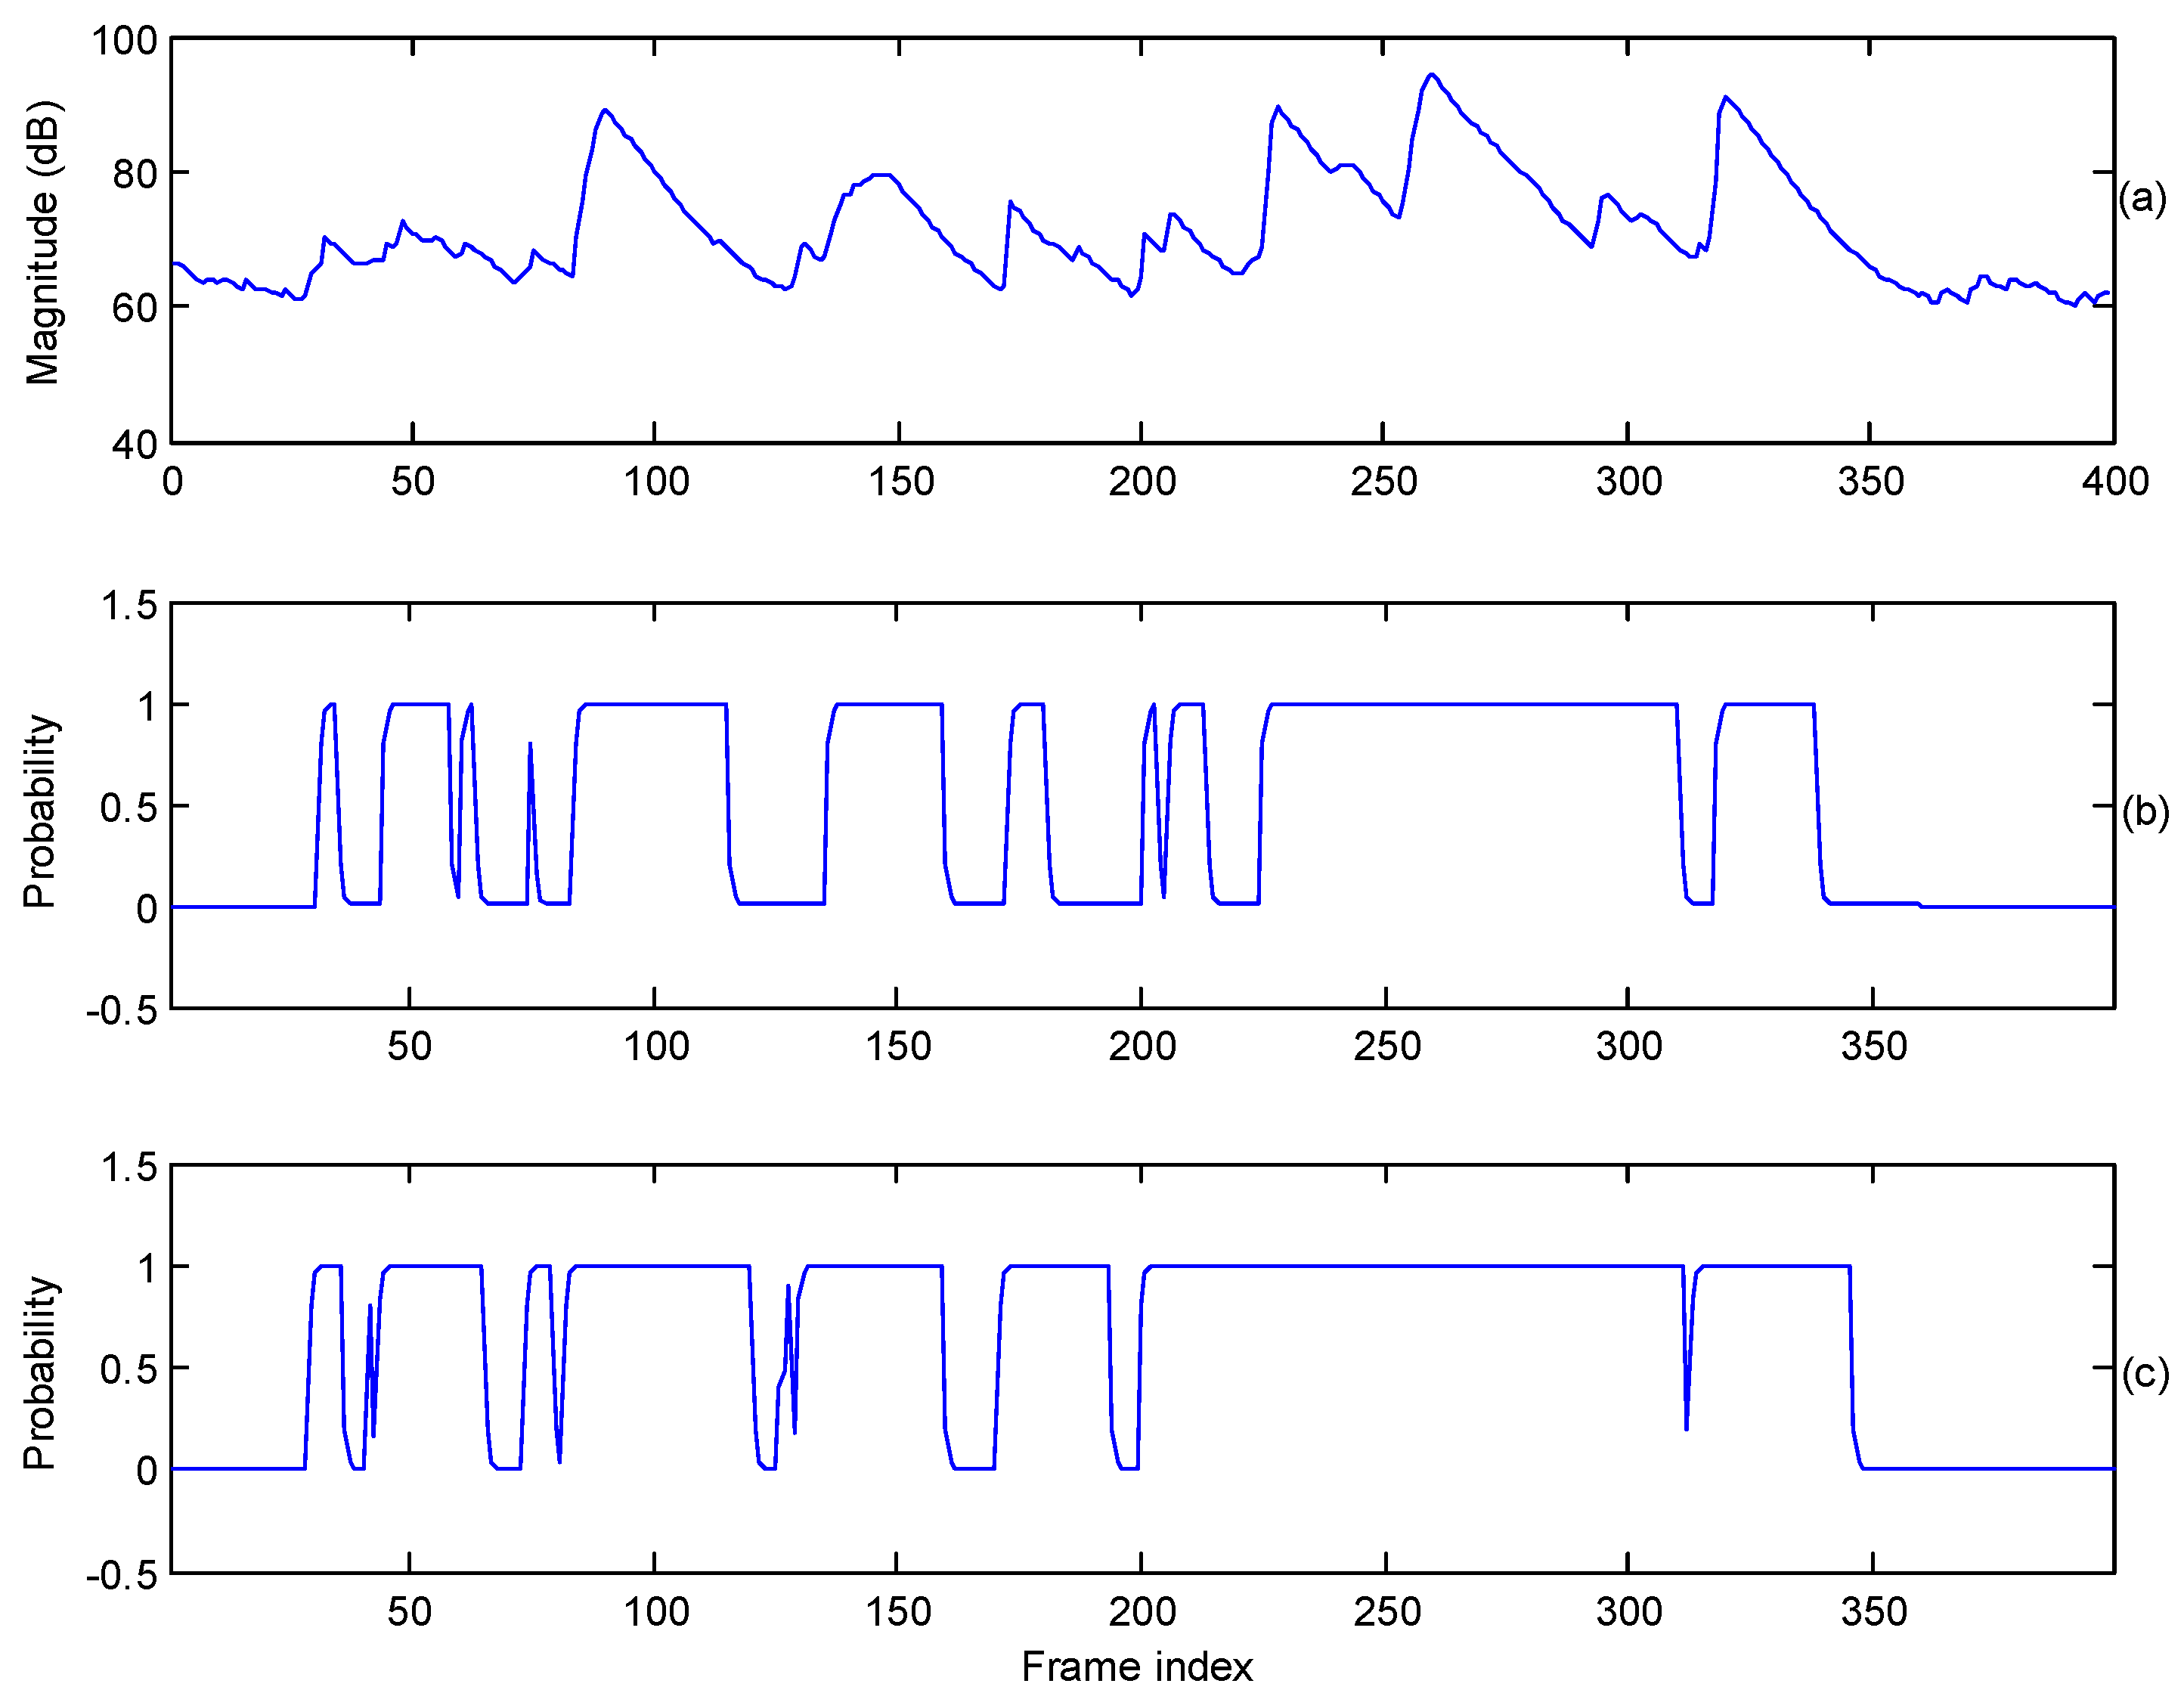
3.2. Speech Presence Probability Adapted by Harmonic Properties
3.3. Detection of Vowel Frames
4. Experimental Results
4.1. Speech Denoising Method
4.2. Segmental SNR Improvement
4.3. Perceptual Evaluation of Speech Quality
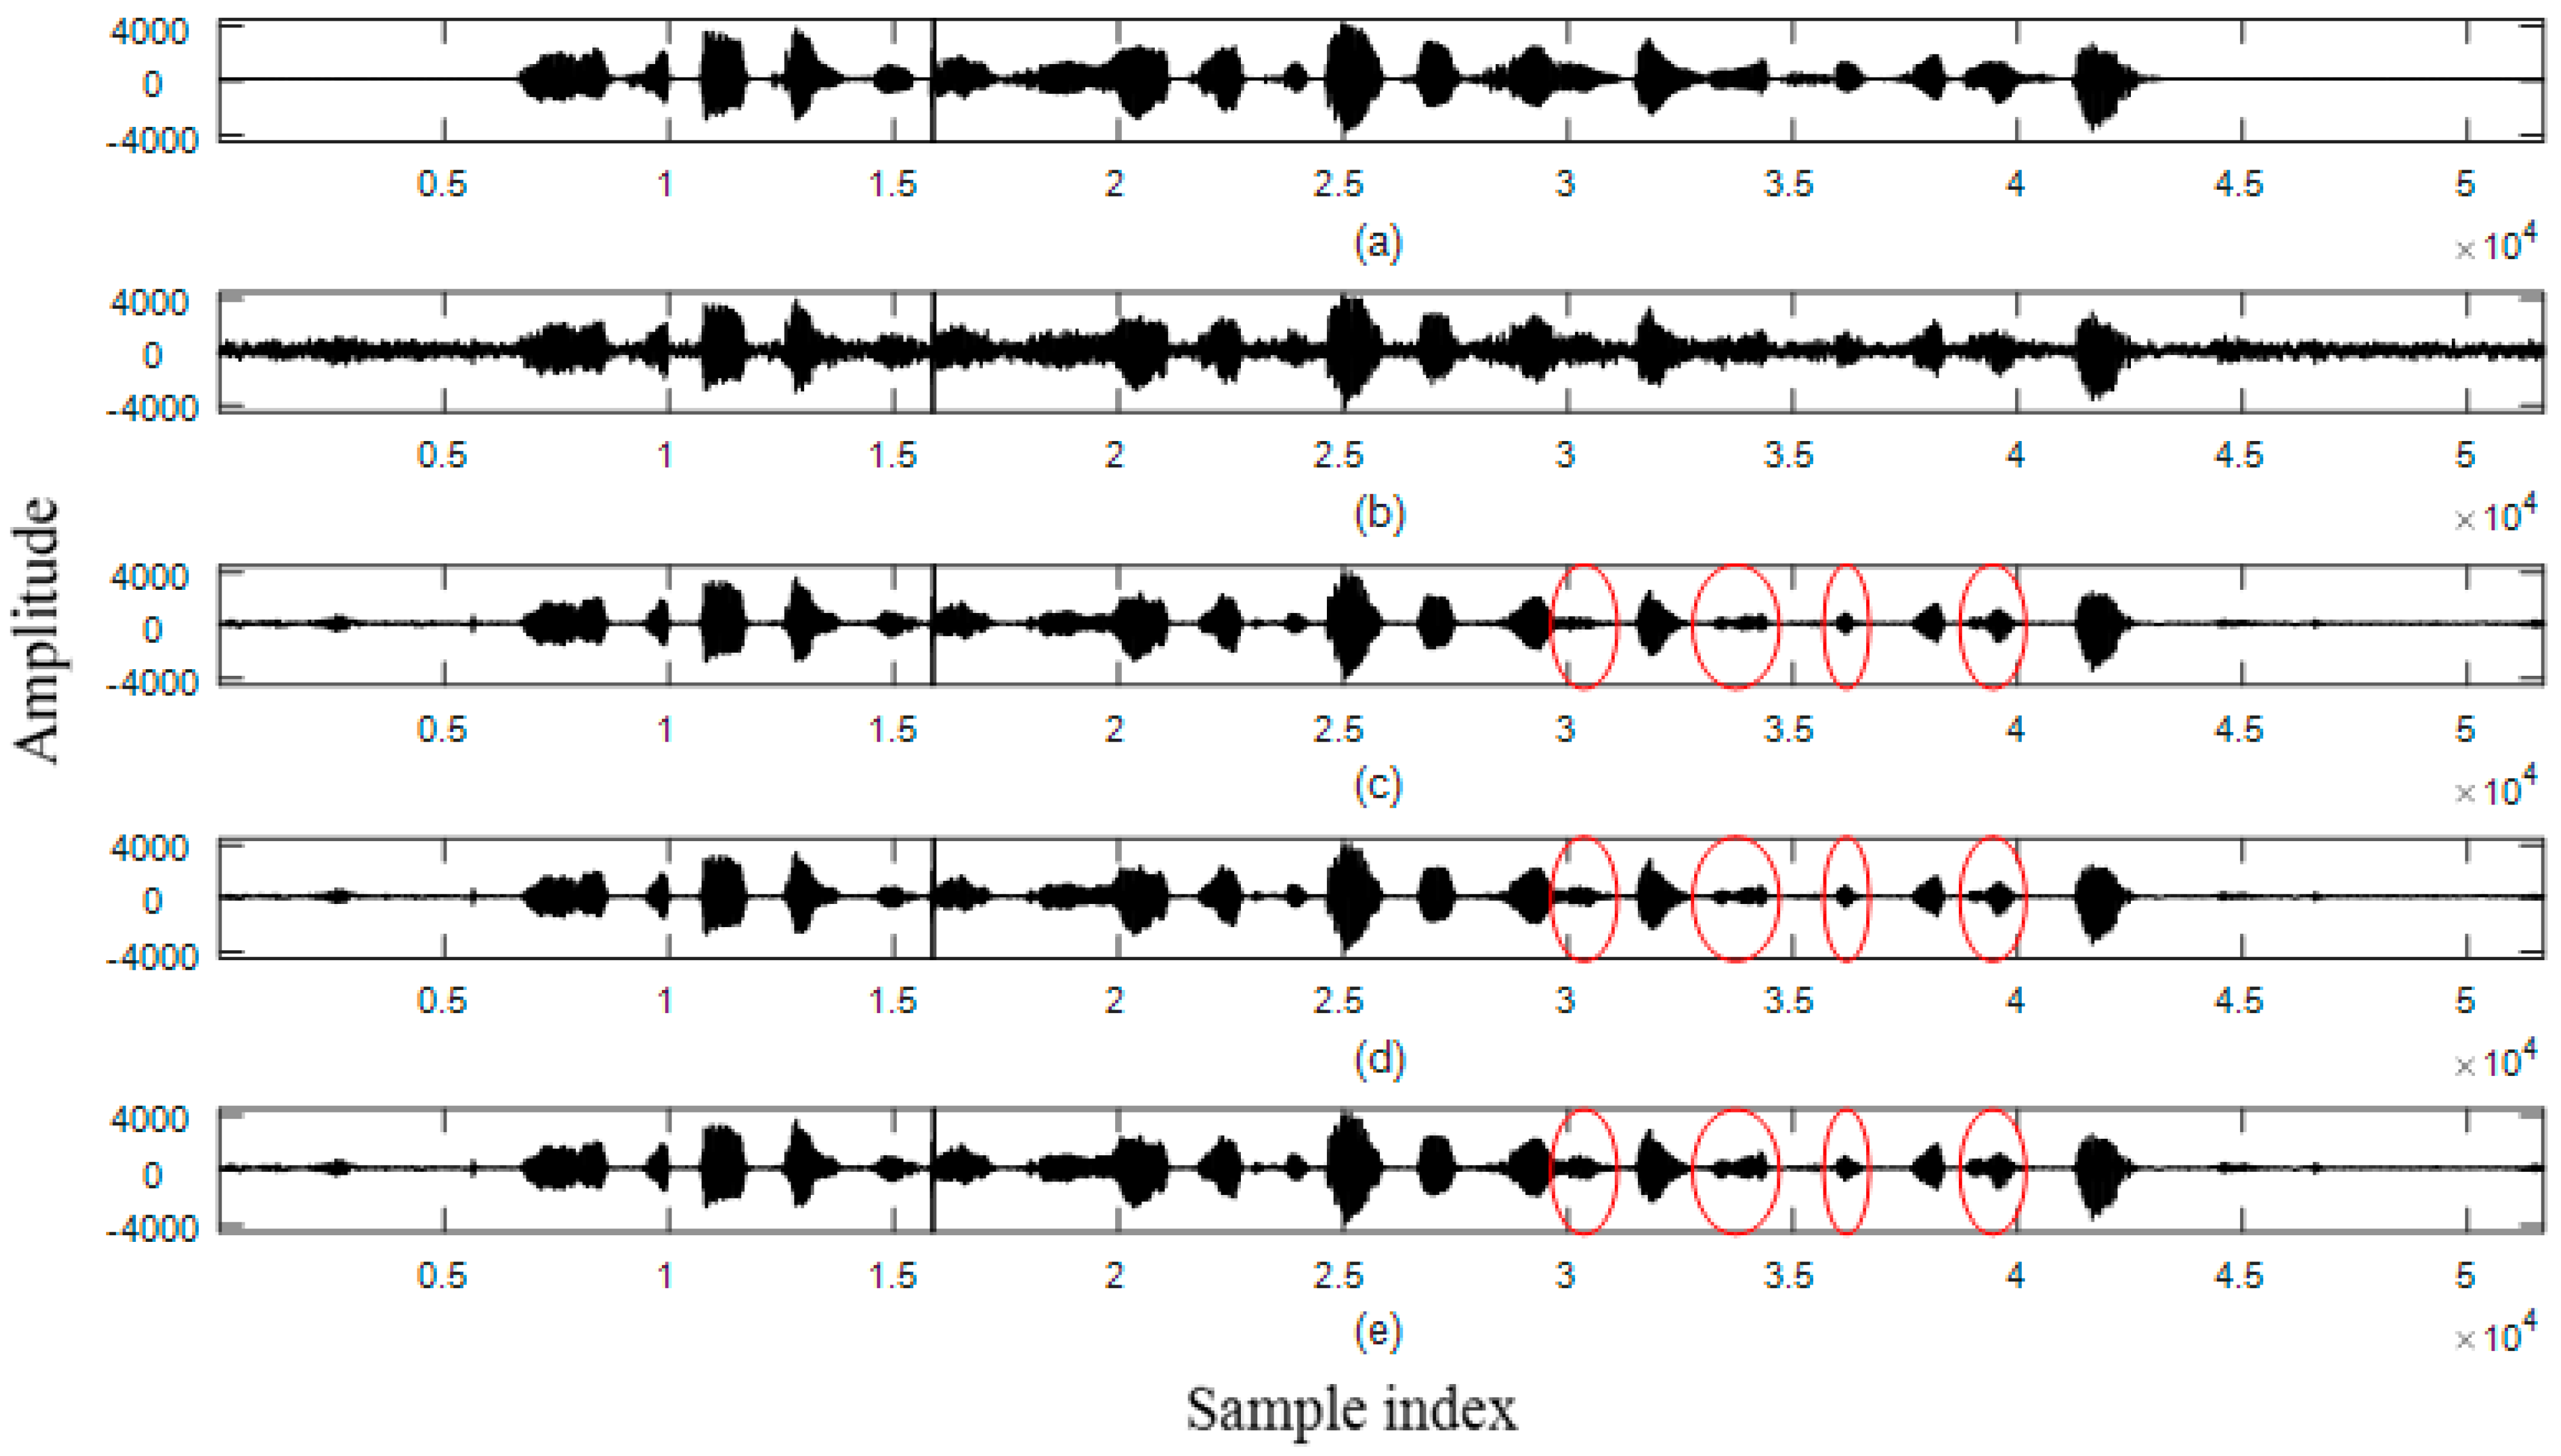
4.4. Waveforms
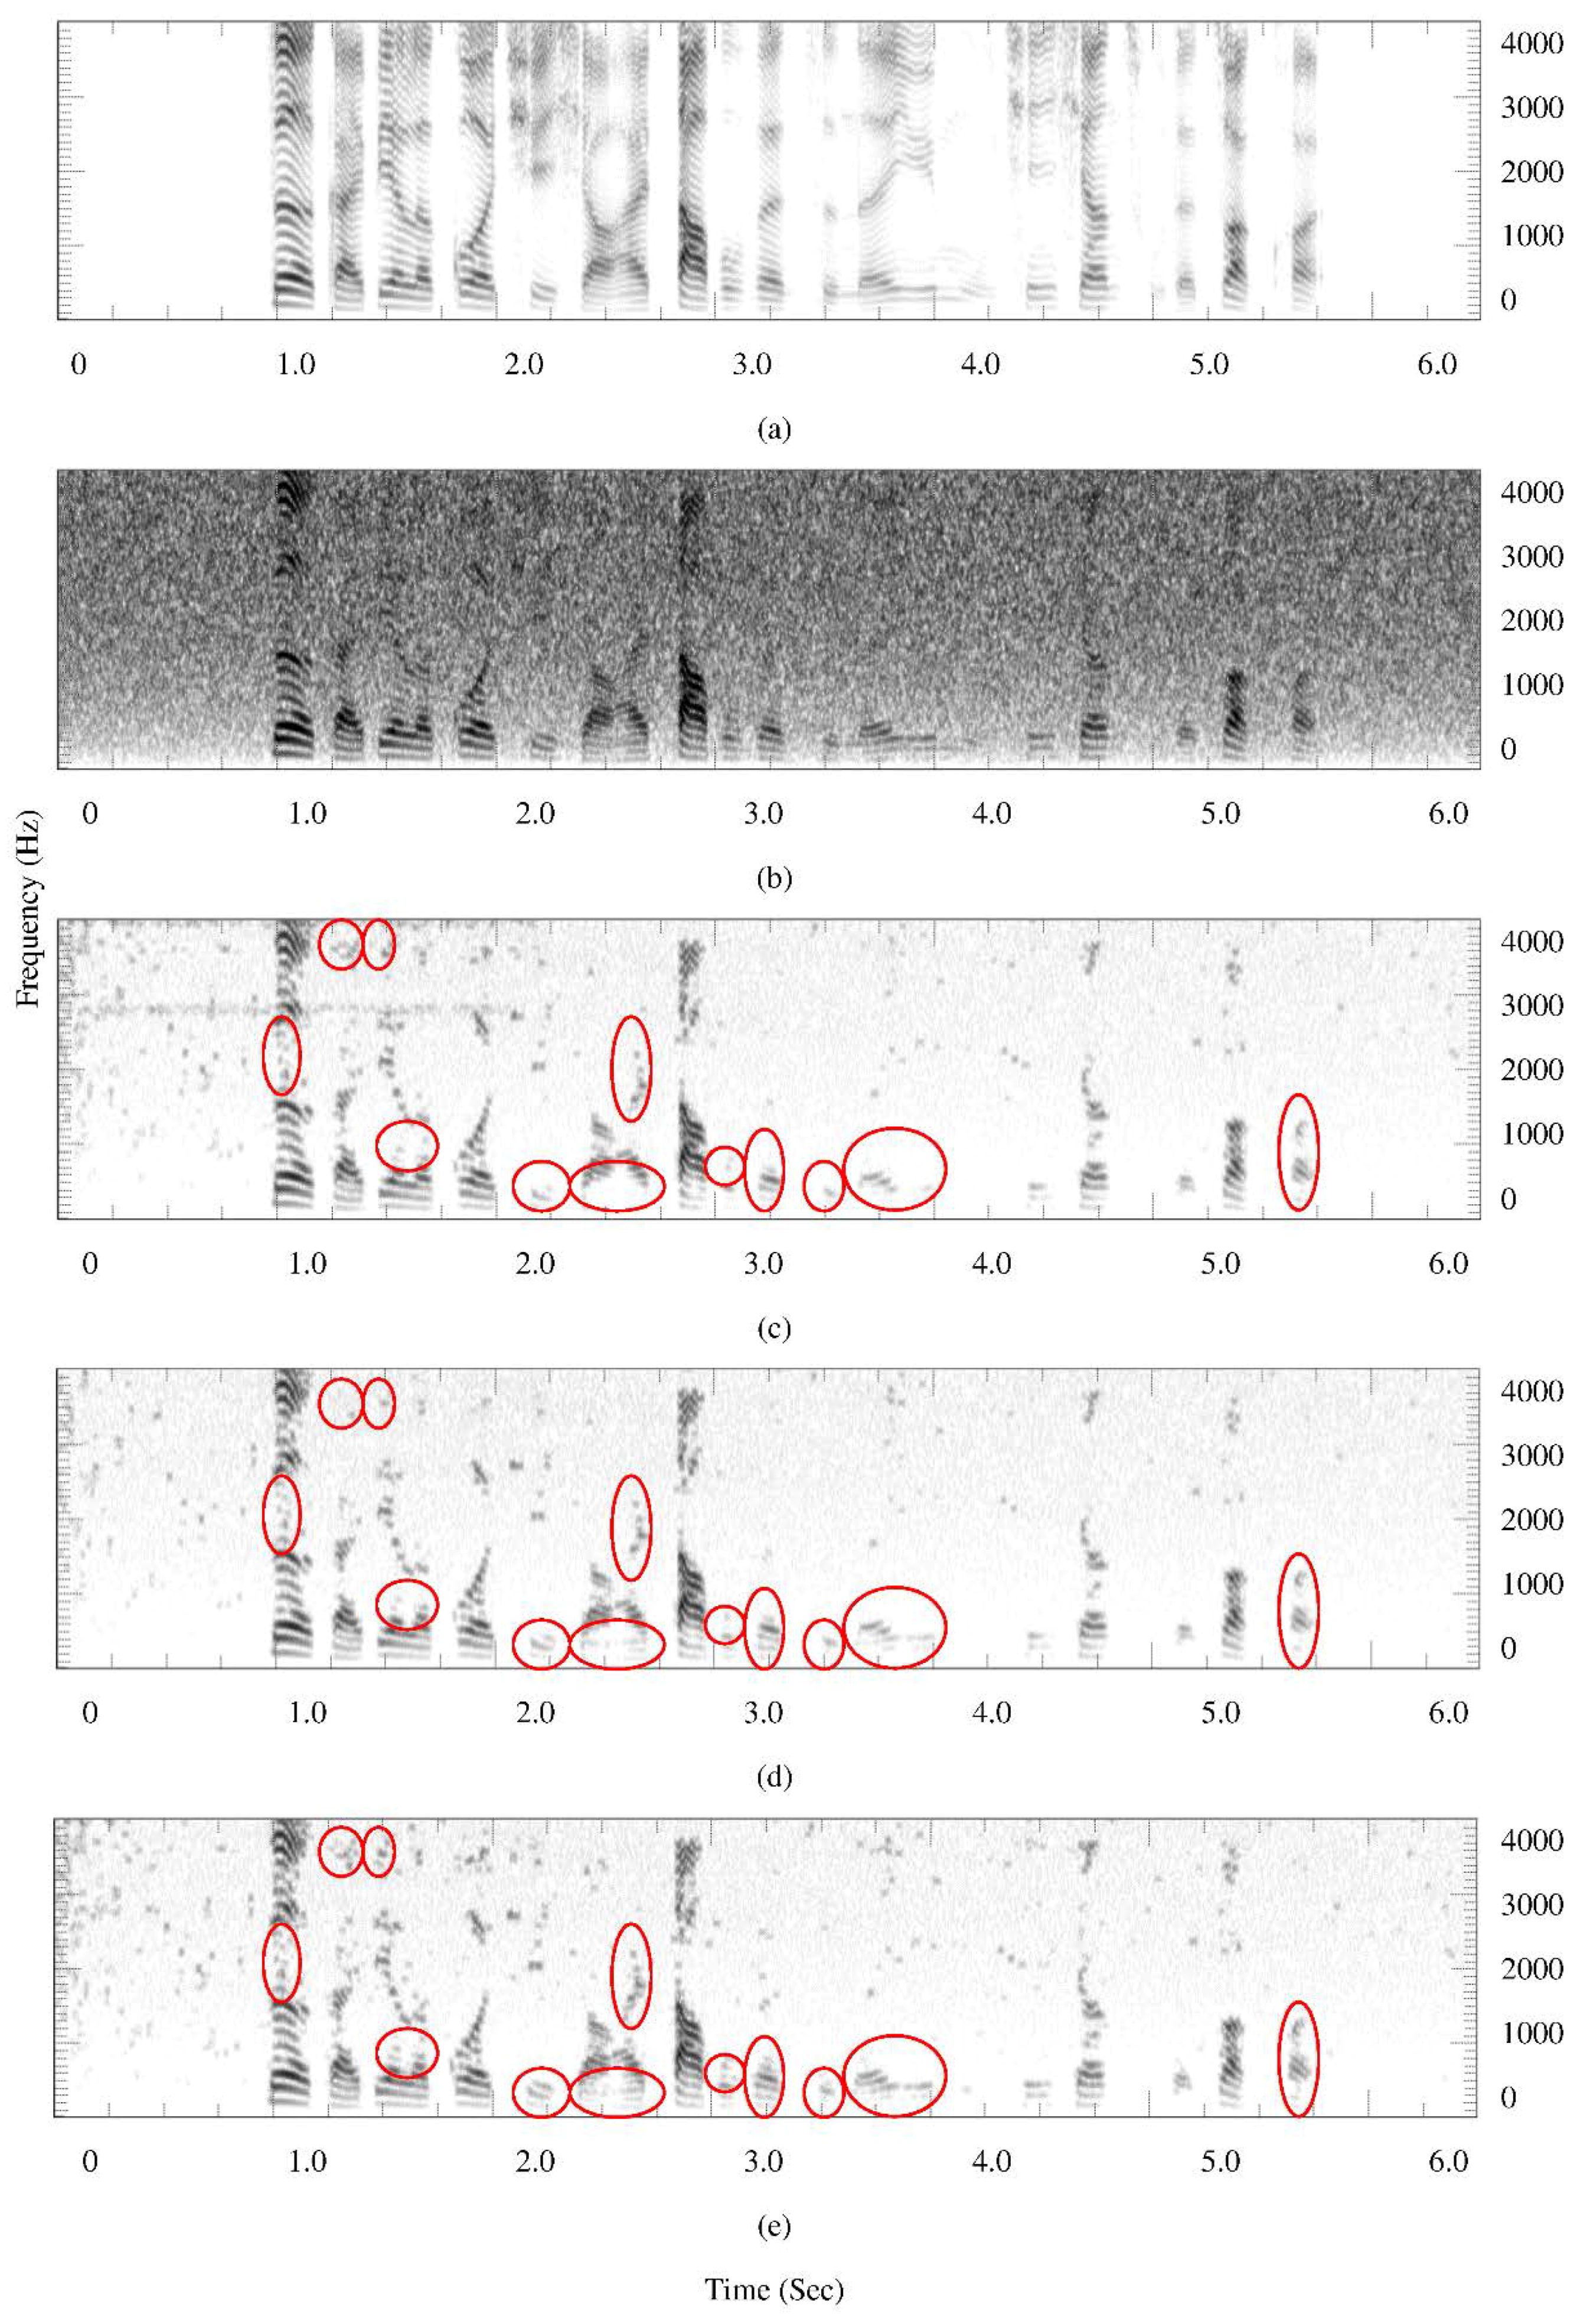
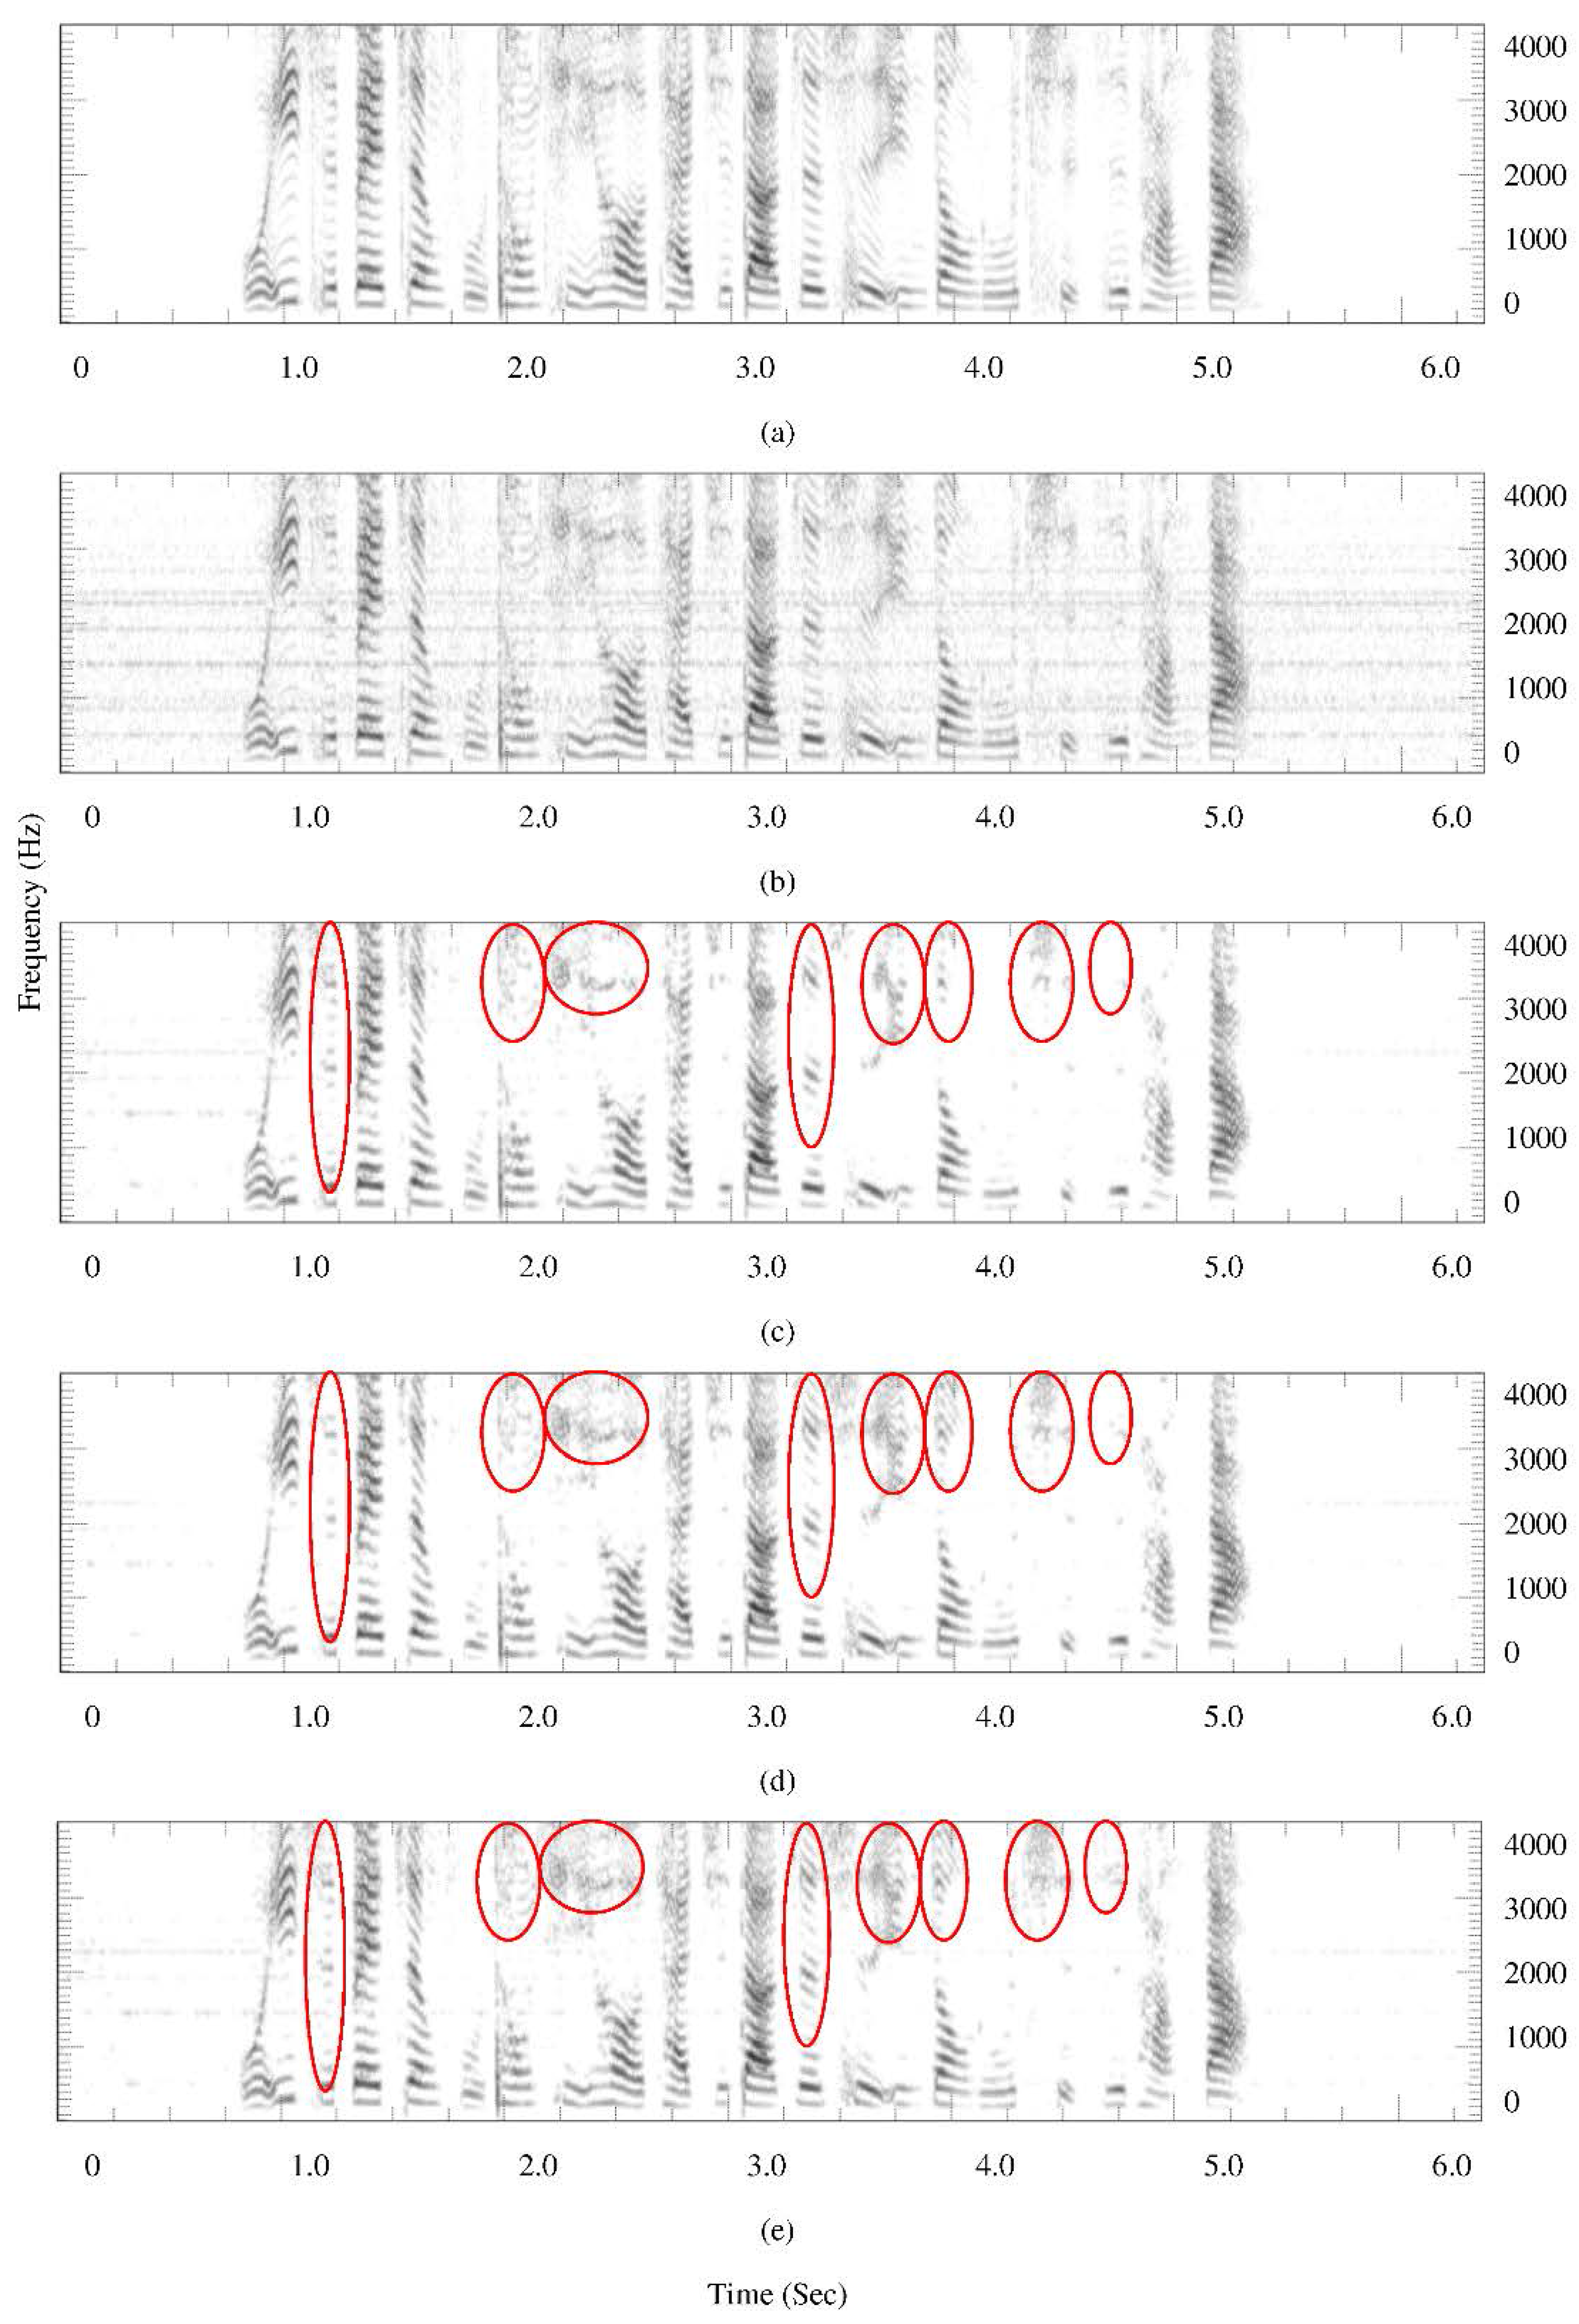
4.5. Spectrograms
4.6. Log Spectral Distance
4.7. Speech Distortion Index
4.8. Discussion
5. Conclusions
Acknowledgments
Author Contributions
Conflicts of Interest
Appendix A
- Set 1: speech interfered by factory noise with average SegSNR = 5 dB
- Clean Speech: Spoken by a female speaker
- Noisy Speech
- MCRA
- MCRA_FB
- Proposed
- Set 2: Speech interfered by white noise with average SegSNR = 0 dB
- Clean Speech: Spoken by a male speaker
- Noisy Speech
- MCRA
- MCRA_FB
- Proposed
References
- Kianyfar, A.; Abutalebi, H.R. Improved speech enhancement method based on auditory filter bank and fast noise estimation. In Proceedings of the International Symposium on Telecommunications, Tehran, Iran, 9–11 September 2014; pp. 441–445.
- Krawczyk-Becker, M.; Fischer, D.; Gerkmann, T. Utilizing spectro-temporal correlations for an improved speech presence probability based noise power estimation. In Proceedings of the IEEE International Conference on Acoustics, Speech, and Signal Processing, Brisbane, Australia, 19–24 April 2015; pp. 365–369.
- Cohen, I.; Berdugo, B. Noise estimation by minima controlled recursive averaging for robust speech enhancement. IEEE Signal Process. Lett. 2002, 9, 12–15. [Google Scholar] [CrossRef]
- Cohen, I. Noise spectrum estimation in adverse environments: Improved minima controlled recursive averaging. IEEE Trans. Speech Audio Process. 2003, 11, 466–475. [Google Scholar] [CrossRef]
- Fan, N.; Rosca, J.; Balan, R. Speech noise estimation using enhanced minima controlled recursive averaging. In Proceedings of the IEEE International Conference on Acoustics, Speech, and Signal Processing, Honolulu, HI, USA, 15–20 April 2007; pp. 581–584.
- Kum, J.M.; Chang, J.H. Speech enhancement based on minima controlled recursive averaging incorporating second-order conditional map criterion. IEEE Signal Process. Lett. 2009, 16, 624–627. [Google Scholar]
- Wu, D.; Zhu, W.P.; Swamy, M.N.S. Noise spectrum estimation with improved minimum controlled recursive averaging based on speech enhancement residue. In Proceedings of the IEEE International Midwest Symposium on Circuits and Systems, Boise, ID, USA, 5–8 August 2012; pp. 948–951.
- Chen, Y.J.; Wu, J.L. Forward-backward minima controlled recursive averaging to speech enhancement. In Proceedings of the IEEE International Symposium on Computational Intelligence for Multimedia, Signal and Vision Processing, Singapore, 16–19 April 2013; pp. 49–52.
- Yong, P.C.; Nordoholm, S.; Dam, H.H. Noise estimation with low complexity for speech enhancement. In Proceedings of the IEEE Workshop on Applications of Signal Processing to Audio and Acoustics, New Paltz, NY, USA, 16–19 October 2011; pp. 109–112.
- Mai, V.K.; Pastor, D.; Aissa-EI-Bey, A.; Le-Bidan, R. Robust estimation of non-stationary noise power spectrum for speech enhancement. IEEE/ACM Trans. Audio Speech Lang. Process. 2015, 23, 670–682. [Google Scholar] [CrossRef]
- Rangachari, S.; Loizou, P.C. A noise-estimation algorithm for highly non-stationary environments. Speech Commun. 2006, 48, 220–231. [Google Scholar] [CrossRef]
- Shimanura, T.; Kobayashi, H. Weighted autocorrelation for pitch extraction of noisy speech. IEEE Trans. Speech Audio Process. 2001, 9, 727–730. [Google Scholar] [CrossRef]
- Lu, C.-T. Reduction of musical residual noise using block-and-directional-median filter adapted by harmonic properties. Speech Commun. 2014, 58, 35–48. [Google Scholar] [CrossRef]
- ITU-T, ITU-T P.862. Perceptual Evaluation of Speech Quality (PESQ), an Objective Method for End-to-End Speech Quality Assessment of Narrow-Band Telephone Networks and Speech Codecs; Int. Telecommun. Union: Geneva, Switzerland, 2001. [Google Scholar]
- Rix, A.W.; Beerends, J.G.; Hollier, M.P.; Hekstra, A.P. Perceptual evaluation of speech quality assessment of telephone networks and codecs. In Proceedings of the IEEE International Conference on Acoustics, Speech, and Signal Processing, Salt Lake City, UT, USA, 7–11 May 2001; pp. 749–752.
- Lu, C.-T. Noise reduction using three-step gain factor and iterative-directional-median filter. Appl. Acoust. 2014, 76, 249–261. [Google Scholar] [CrossRef]
- Virag, N. Single channel speech enhancement based on masking properties of the human auditory system. IEEE Trans. Speech Audio Process. 1999, 7, 126–137. [Google Scholar] [CrossRef]
- Plapous, C.; Marro, C.; Scalart, P. Improved singal-to-noise ratio estimation for speech enhancement. IEEE Trans. Audio Speech Lang. Process. 2006, 14, 2098–2108. [Google Scholar] [CrossRef]
- Schroeder, M.R.; Atal, B.S.; Hall, J.L. Optimizing digital speech coders by exploiting masking properties of the human ear. J. Acoust. Soc. Am. 1979, 66, 1647–1652. [Google Scholar] [CrossRef]
- Loizou, P.C. Speech Enhancement Theory and Practice; CRC Presss Taylor & Francis Group: Boca Raton, FL, USA, 2007; pp. 198–202. [Google Scholar]
- Chen, J.; Benesty, J.; Huang, Y.; Docle, S. New insights into the noise reduction Wiener filter. IEEE Trans. Audio Speech Lang. Process. 2006, 14, 1218–1234. [Google Scholar] [CrossRef]
- Lu, X.; Tsao, Y.; Matsuda, S.; Hori, C. Speech enhancement based on deep denoising autoencoder. In Proceedings of the Interspeech, Lyon, France, 25–29 August 2013.
- Fu, S.-W.; Tsao, Y.; Lu, X. SNR-Aware Convolutional Neural Network Modeling for Speech Enhancement. In Proceedings of the Interspeech, San Francisco, CA, USA, 8–12 September 2016.
- Xu, Y.; Du, J.; Dai, L.-R.; Lee, C.-H. An experimental study on speech enhancement based on deep neural networks. IEEE Signal Process. Lett. 2014, 21, 65–68. [Google Scholar] [CrossRef]


| Noise Type | SNR | Average SegSNR Improvement | ||
|---|---|---|---|---|
| (dB) | MCRA | FB_MCRA | Proposed | |
| White | 0 | 6.95 | 7.15 | 7.83 |
| 5 | 4.44 | 4.70 | 5.64 | |
| 10 | 1.57 | 2.08 | 3.44 | |
| F16 | 0 | 5.81 | 5.73 | 5.98 |
| 5 | 3.78 | 3.83 | 4.53 | |
| 10 | 1.44 | 1.76 | 2.83 | |
| Factory | 0 | 5.41 | 5.35 | 5.62 |
| 5 | 3.43 | 3.47 | 4.17 | |
| 10 | 1.14 | 1.46 | 2.53 | |
| Helicopter | 0 | 6.22 | 6.29 | 6.34 |
| 5 | 4.13 | 4.32 | 4.99 | |
| 10 | 1.76 | 2.25 | 3.28 | |
| Car | 0 | 7.87 | 10.08 | 9.86 |
| 5 | 5.70 | 8.19 | 9.08 | |
| 10 | 3.10 | 5.97 | 7.05 | |
| Babble | 0 | 4.26 | 4.23 | 4.22 |
| 5 | 2.79 | 2.83 | 3.26 | |
| 10 | 0.94 | 1.27 | 2.25 | |
| Noise Type | SNR | PESQ | |||
|---|---|---|---|---|---|
| (dB) | Noisy | MCRA | FB_MCRA | Proposed | |
| White | 0 | 1.64 | 2.13 | 2.11 | 2.24 |
| 5 | 1.94 | 2.48 | 2.48 | 2.60 | |
| 10 | 2.28 | 2.77 | 2.80 | 2.94 | |
| F16 | 0 | 1.86 | 2.31 | 2.30 | 2.32 |
| 5 | 2.20 | 2.65 | 2.64 | 2.72 | |
| 10 | 2.56 | 2.95 | 2.97 | 3.08 | |
| Factory | 0 | 1.84 | 2.23 | 2.22 | 2.24 |
| 5 | 2.18 | 2.59 | 2.59 | 2.63 | |
| 10 | 2.55 | 2.90 | 2.92 | 2.98 | |
| Helicopter | 0 | 2.05 | 2.44 | 2.46 | 2.45 |
| 5 | 2.39 | 2.78 | 2.80 | 2.87 | |
| 10 | 2.75 | 3.08 | 3.13 | 3.20 | |
| Car | 0 | 3.43 | 3.24 | 3.43 | 3.38 |
| 5 | 3.86 | 3.42 | 3.63 | 3.72 | |
| 10 | 4.14 | 3.55 | 3.78 | 3.87 | |
| Babble | 0 | 1.91 | 2.09 | 2.08 | 2.07 |
| 5 | 2.26 | 2.49 | 2.48 | 2.46 | |
| 10 | 2.62 | 2.85 | 2.87 | 2.86 | |
| Noise Type | SNR | LSD | ||
|---|---|---|---|---|
| (dB) | MCRA | FB_MCRA | Proposed | |
| White | 0 | 2.49 | 2.59 | 2.08 |
| 5 | 2.87 | 2.94 | 2.28 | |
| 10 | 3.53 | 3.51 | 2.45 | |
| F16 | 0 | 2.68 | 2.87 | 2.54 |
| 5 | 3.18 | 3.37 | 2.69 | |
| 10 | 4.07 | 4.01 | 2.88 | |
| Factory | 0 | 2.86 | 2.96 | 2.79 |
| 5 | 3.37 | 3.40 | 2.89 | |
| 10 | 4.26 | 4.10 | 3.22 | |
| Helicopter | 0 | 3.11 | 3.16 | 3.29 |
| 5 | 4.08 | 3.84 | 3.09 | |
| 10 | 5.72 | 4.89 | 3.72 | |
| Car | 0 | 14.40 | 10.60 | 15.83 |
| 5 | 20.68 | 14.88 | 14.52 | |
| 10 | 28.71 | 20.88 | 18.46 | |
| Babble | 0 | 3.65 | 3.95 | 3.20 |
| 5 | 4.30 | 4.55 | 3.19 | |
| 10 | 5.46 | 5.39 | 3.62 | |
| Noise Type | SNR | Speech Distortion Index | |||
|---|---|---|---|---|---|
| (dB) | Noisy | MCRA | FB_MCRA | Proposed | |
| White | 0 | 0.2972 | 0.0945 | 0.0915 | 0.0898 |
| 5 | 0.0939 | 0.0537 | 0.0499 | 0.0384 | |
| 10 | 0.0297 | 0.0341 | 0.0281 | 0.0168 | |
| F16 | 0 | 0.3042 | 0.1287 | 0.1319 | 0.1202 |
| 5 | 0.0961 | 0.0656 | 0.0636 | 0.0504 | |
| 10 | 0.0304 | 0.0365 | 0.0314 | 0.0218 | |
| Factory | 0 | 0.3175 | 0.1426 | 0.1443 | 0.1327 |
| 5 | 0.1004 | 0.0698 | 0.0683 | 0.0540 | |
| 10 | 0.0317 | 0.0384 | 0.0332 | 0.0237 | |
| Helicopter | 0 | 0.3062 | 0.1193 | 0.1187 | 0.1126 |
| 5 | 0.0968 | 0.0623 | 0.0591 | 0.0463 | |
| 10 | 0.0306 | 0.0350 | 0.0295 | 0.0211 | |
| Car | 0 | 0.3758 | 0.0968 | 0.0642 | 0.0673 |
| 5 | 0.1188 | 0.0467 | 0.0309 | 0.0255 | |
| 10 | 0.375 | 0.0278 | 0.0164 | 0.0130 | |
| Babble | 0 | 0.3410 | 0.1706 | 0.1749 | 0.1598 |
| 5 | 0.1078 | 0.0781 | 0.0764 | 0.0603 | |
| 10 | 0.0341 | 0.0403 | 0.0343 | 0.0229 | |
© 2016 by the authors; licensee MDPI, Basel, Switzerland. This article is an open access article distributed under the terms and conditions of the Creative Commons Attribution (CC-BY) license (http://creativecommons.org/licenses/by/4.0/).
Share and Cite
Lu, C.-T.; Lei, C.-L.; Shen, J.-H.; Wang, L.-L.; Tseng, K.-F. Estimation of Noise Magnitude for Speech Denoising Using Minima-Controlled-Recursive-Averaging Algorithm Adapted by Harmonic Properties. Appl. Sci. 2017, 7, 9. https://doi.org/10.3390/app7010009
Lu C-T, Lei C-L, Shen J-H, Wang L-L, Tseng K-F. Estimation of Noise Magnitude for Speech Denoising Using Minima-Controlled-Recursive-Averaging Algorithm Adapted by Harmonic Properties. Applied Sciences. 2017; 7(1):9. https://doi.org/10.3390/app7010009
Chicago/Turabian StyleLu, Ching-Ta, Chung-Lin Lei, Jun-Hong Shen, Ling-Ling Wang, and Kun-Fu Tseng. 2017. "Estimation of Noise Magnitude for Speech Denoising Using Minima-Controlled-Recursive-Averaging Algorithm Adapted by Harmonic Properties" Applied Sciences 7, no. 1: 9. https://doi.org/10.3390/app7010009