
Successful Control of Major Project Budgets

Lichtenberg & Partners, Baneskellet 16, Vedbæk DK-2950, Denmark
Adm. Sci. 2016, 6(3), 8; https://doi.org/10.3390/admsci6030008
Submission received: 15 March 2016
/
Revised: 29 June 2016
/
Accepted: 29 June 2016
/
Published: 8 July 2016
(This article belongs to the Special Issue Project Risk Management: Challenge Established Practice)
Abstract
:This paper differs from scientific papers describing current research. In line with the theme of this special issue, it challenges conventional risk management practice against the background of former research results successfully finished decades ago. It is well-known that conventional practice frequently results in budget overruns of large projects. International reviews document that. Severe delays of schedules are also well-known. This paper describes successful research results from almost three decades ago, which successfully challenges this severe problem and has led to new practices. The research involved is an unusual mix: Scandinavian researchers from psychology, statistical theory and engineering economy. The resulting procedure has been widely used since around 1990 and challenges conventional procedures. The procedure is documented to be able to yield statistically correct prognoses, when the “rules of the game” have been correctly followed. After a short summary of the basic situation, this paper summarizes the research, followed by some resulting experiences, focusing on two recent studies each of 40 infrastructures and other major projects. In both sets, the actual final cost largely equaled the expected project cost. This result is a marked change from international past and present experience. Finally, the need for further research and progress is discussed.
1. Introduction
Severe budget overruns and delays are still common while using conventional procedures and principles, especially among larger projects, despite the fact that Project Management and Cost Engineering have made tremendous advances in recent decades. Some reasons behind this are discussed below as a brief overview. This as a background to a presentation of Scandinavian research results that challenges conventional practice, as it has documented to yield correct statistical prognoses of costs and/or duration of large projects, inclusive of IT projects.
One of the most referred sources for describing project cost overruns is the Standish Group “Chaos” report [1]. It presents depressing results from a large sample of IT projects. This source is not alone in claiming that most projects go wrong. Other sources include Flyvbjerg, Holm, Buhl [2,3], and their conclusions from an analysis of many infrastructure projects was that 90% had cost overruns, generally of a significant size. They showed that the situation has not improved for decades. Merrow [4] documents that the situation is not much better in the private sector: 65%–75% of industrial megaprojects fail on business targets. These projects are generally large and complex. However, does size matter? Odeck [5] studied this and his results indicate that small projects can have even worse results than large projects—cost overruns were even more frequent and relatively larger in small projects. To summarize, historically, we know for a fact that projects still have a strong tendency for cost overruns—large and small, private and public, when using conventional procedures.
The reasons behind cost overruns have also been thoroughly examined and discussed. Flyvbjerg et al. [2,3] argued that the main problem is that planners and promoters often deliberately underestimate costs and risks and overestimate the benefits in order to increase the likelihood that their project gets approval and funding. This view is supported by other studies—i.e., that there are political or strategic reasons for cost overrun. Similar reasons are identified by Merrow [4] in business projects. These reasons need to be understood and handled in order to improve project execution performance. A key requirement is to have good quality, independent analysis of the project budget prior to go-ahead. A humoristic version of the story is illustrated in Figure 1 below.
Another set of reasons for cost overruns are known to stem from human judgment, as recently documented in practical applications by the international Futuraone group of consultants [6], and excellently explained by Kahneman in 2011 [7]. In 1985, Lange [8]1 disclosed the reasons for this in a master’s thesis. He identified more than twenty pitfalls when making subjective quantitative evaluations. A considerable part of the total project results, total cost or duration, necessarily stems from such expert evaluations. It is documented that these pitfalls may twist the evaluations severely, and thus the total result. This research was an eye-opener in Scandinavia, and it initiated a different way of thinking about how cost estimation should be carried out.
The research also revealed that there is a tendency to focus on tangible, “hard” aspects, and to avoid dealing with more subjective “softer” aspects. Subjective matters have generally been considered in only a superficial manner, if included at all. Today, the problem of not dealing with more subjective aspects is magnified by the high level of uncertainty and change.
Traditional tools and techniques for project planning and management are based on deterministic logic, even though leading scholars realized early on that this was not sufficient. While the well-known cost items are estimated and calculated in all detail, the contingency is typically superficially handled, although its importance is still more important. When theory tried to cope with this uncertainty via traditional methods, it becomes very complicated. These conventional tools became increasingly challenging, especially for small organizations. Uncertainty was seen as almost impossible to handle when using classical statistical theories in planning and estimating. These procedures were either too primitive or too difficult to use in practice. This realization sparked a development in Denmark and Norway, which initiated a completely new approach to estimating project budgets and schedule durations.
2. Untraditional Early Research Efforts
Successful results in scheduling during the 1950s came from the use of the famous Program Evaluation Review Technique (PERT), one of the well-known Critical Path Methods. It introduced the triple estimate in scheduling as a means of quantifying uncertainty (uncertainty ranges, based on minimum, most likely, and maximum values). The same idea was introduced in the 1970s for cost estimates as a possible answer to obtaining more reliable budget forecasts. This research effort was led by the author of this paper at the Technical University of Denmark (DTU).
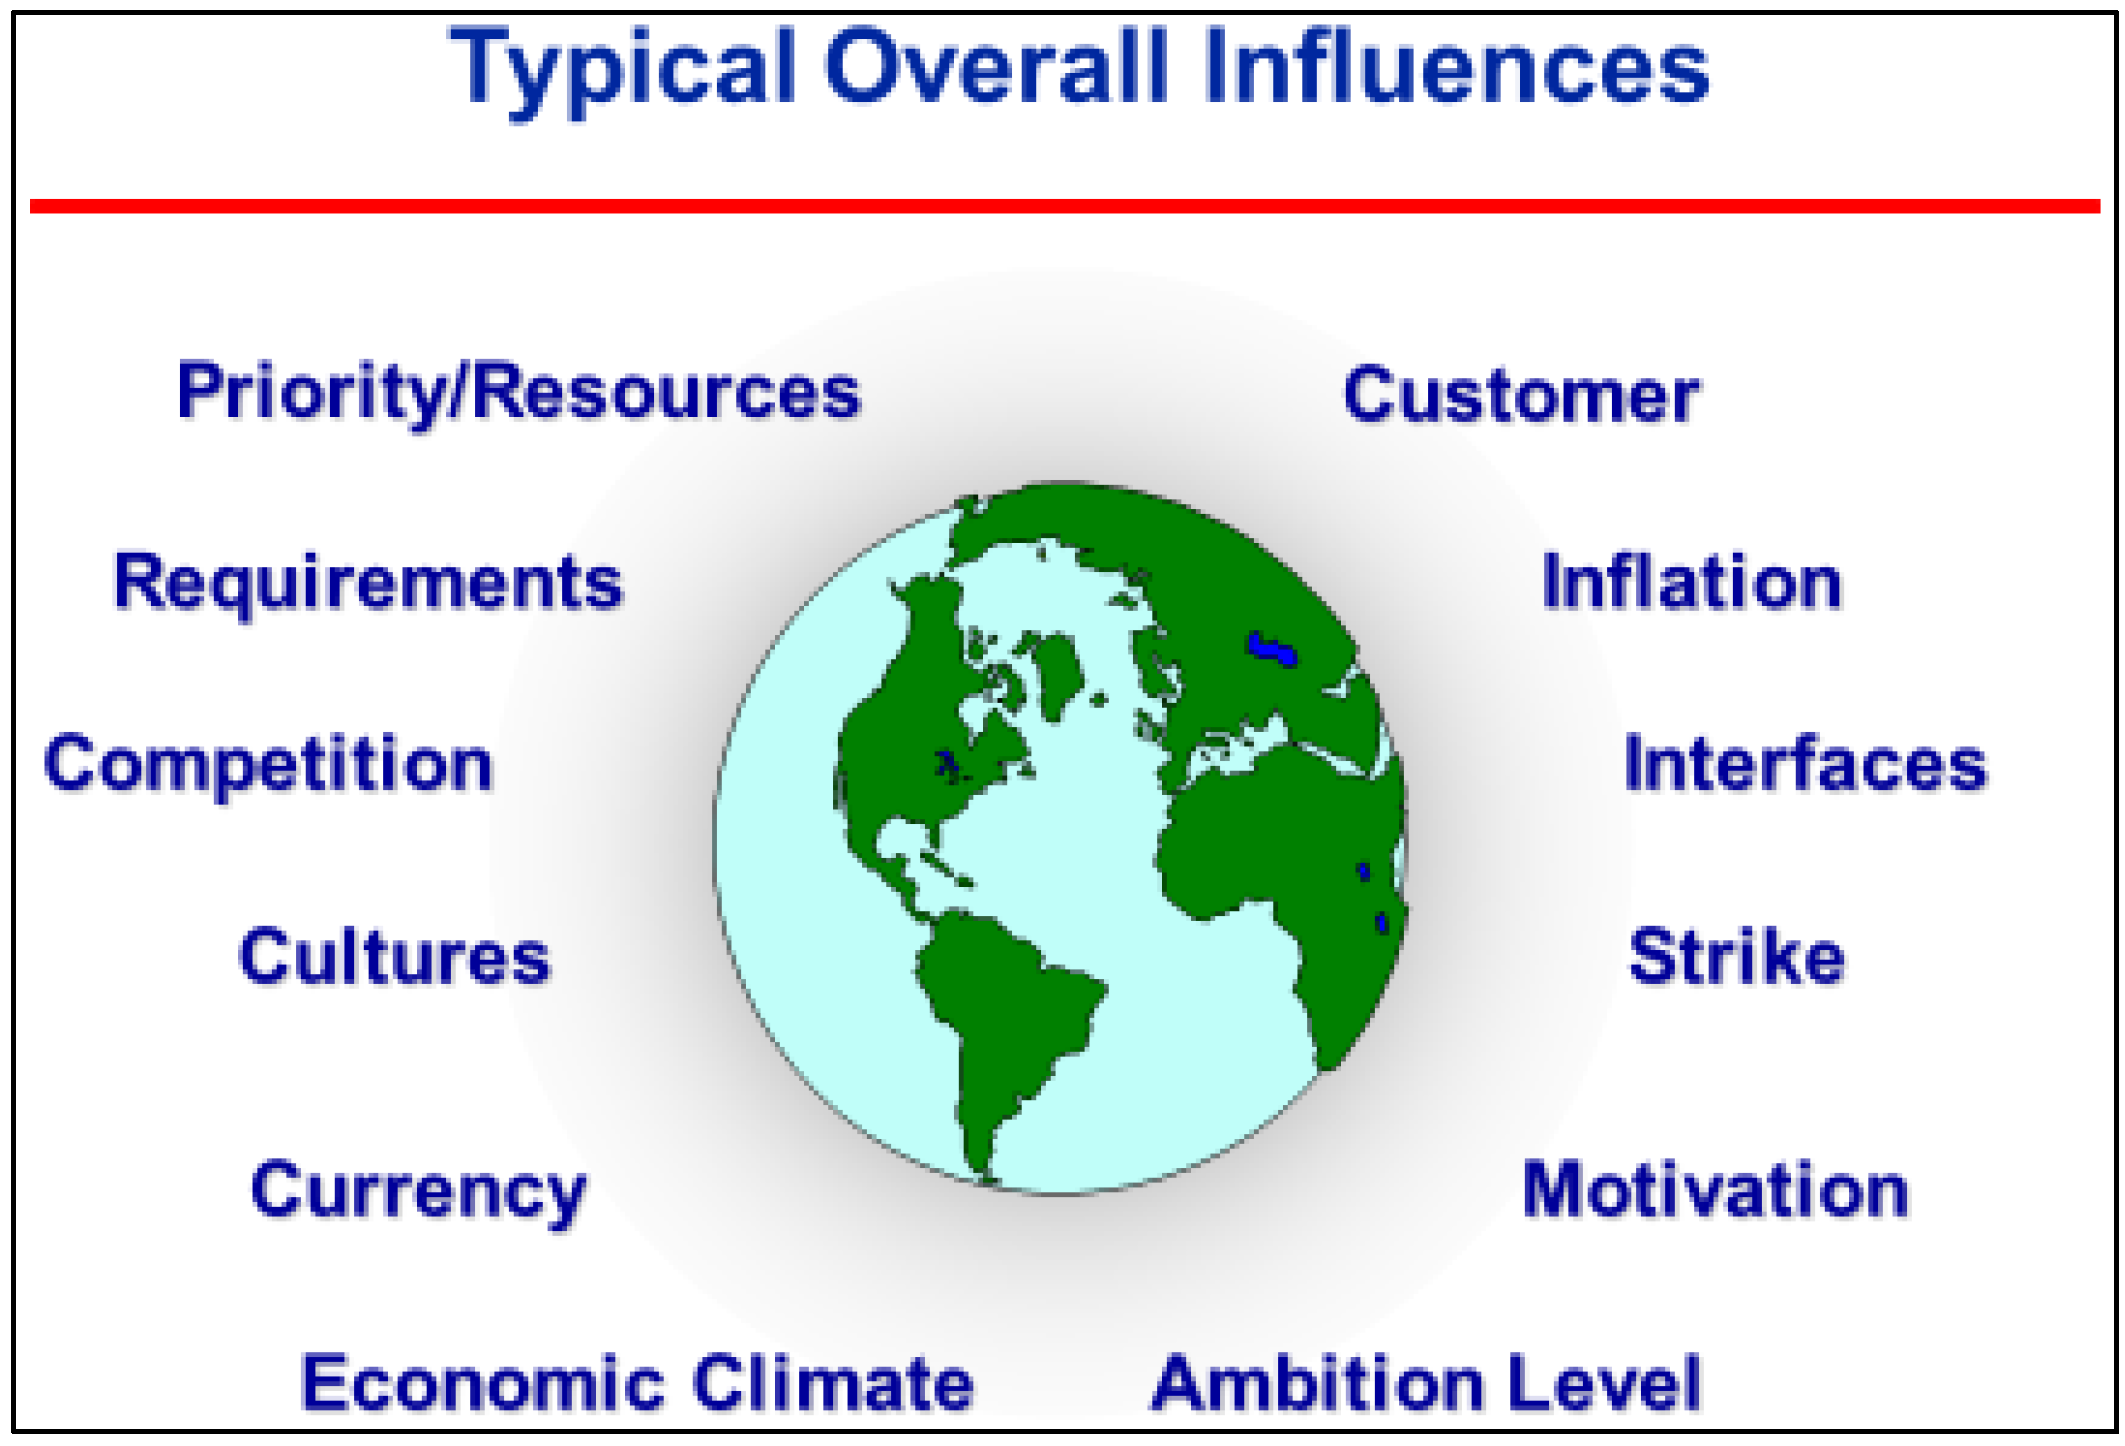
The research soon encountered practical difficulties. How should uncertainty be handled? Projects and, not least, their situations were unique and complex. The many statistical dependencies between different parts of an estimate were difficult to model. However, this problem was solved by isolating and defining all significant dependencies between the individual cost items and including them separately in a statistical model. A “base case” estimate with all the significant interdependencies removed contained individual items which were largely statistically independent of each other. This enabled a much simpler statistical approach to be used to calculate the result. The influence of the key interdependencies, risks, and opportunities were then added in afterwards as Overall Influences (see Figure 2).
Another problem was to cope with the huge amount of data that often existed. This was solved by using a top-down approach instead of working from bottom-up. The top-down procedure starts with a set of around 8 to 12 main items that cover the whole scope, and a similar number of variables which represent the key interdependencies (i.e., those aspects that could have a systematic influence on part or all of a budget rather than on a particular budget line item). The estimators evaluate triple estimates of all of these variables (base estimate and overall influence factors). The total cost is then calculated using normal statistical rules. The contributions to total uncertainty by each variable (triple estimate) in the model are shown as an Uncertainty Profile or a “top ten list”, with the largest contributor of uncertainty at the top. The most uncertain variable at the top of the list is by nature the most critical for the total result. This element is therefore subject to specifying it in greater detail or clarifying further.
The calculation is then updated and a new Uncertainty Profile or “top ten list” appears. The procedure continues with further successive steps (hence the term “Successive Principle” or “the Stepwise Method”). Surprisingly quickly, the most significant uncertainties are reduced and clarified as much they can be. The end result—due to the 20/80 rule—will typically hold less than a hundred items and factors, often fewer than 30–40. The top-down approach enables the best possible result to be generated in the most efficient manner possible. Figure 3 and Figure 4 below illustrate this procedure.
A prototype of the Successive Principle procedure was launched locally in Denmark during the 1970s and published by Lichtenberg [10,11]. Its obvious advances soon made it widespread in Denmark, but it suffered from severe failures due to the many pitfalls when estimators make subjective evaluations. The results suffered from this and the use gradually faded out in Denmark. However, during the 1980s, the problem was examined and finally solved after the pioneering work of Lange [8], when he identified more than twenty psychological pitfalls relating to estimating from a study of international psychological literature, together with providing preliminary advice on how to overcome them.
Further development effort came about via a collaboration between researchers from statistical theory, psychology and engineering economics at the Technical Universities of Denmark and Norway, led by the author in Denmark and the late professor Reidar Hugsted and his team in Norway, in collaboration with professor in Psychology at Oslo University K. H. Teigen [12,13]. Today, this subject is represented by professor Ole Jonny Klakegg at the Technical University of Norway in Trondheim [14]. Norway, for some years, has been the leading partner. During the 80s, this research largely solved the remaining problems with the method, refer to Aass et al. [15].
3. A Brief Overview of the Final Research Results
3.1. General
The research effort between the 1970s and 1980s is the foundation of this article. It constitutes a unique symbiosis between statistical theory, psychology and project economy—in which the Bayesian statistical theory, together with a consistent drive towards statistical independency between uncertain data, is combined and supported by sub procedures which keep control over the many different psychological pitfalls. Until now, they have distorted results in any other models—together with project economy, and its top down calculation principles.
The Successive Principle was originally a tool for early phase cost estimating and scheduling in the construction industry, and it was known by some users as “intelligent cost estimating”. It has now developed into an integrated management instrument, which is also used to augment productivity and competition.
The Successive Principle is based on four cornerstones:
- (1)
- Accept uncertainty as a significant and exiting issue, and follow its rules;
- (2)
- Carry out intelligent, unbiased evaluations in balanced groups;
- (3)
- Work top-down, developing the quantitative model in successive steps by specifying the most significant uncertainty in more detail after each step;
- (4)
- Identify and include Overall Influences.
3.2. On Schedules
The results in the area of scheduling seem to be successful as well. Several project schedules of large IT projects and other complicated projects have been analysed according to these principles. Surprisingly, many of these have met their deadline or were finished according to the prognoses. However, no proper documentation exists that the results have been an effect of the analyses or that they had other reasons.
Quality assurance of schedules is a basic application. The original PERT procedure for scheduling from the 1950s faded out. Most likely, among other reasons, due to the fact that it neglected the statistical dependency among the activities, and thus seriously biased the results.
However, the idea of evaluating activities in a network using triple estimates was already included early in the research leading to the Successive Principle (refer to Lichtenberg & Møller [16]). The concept of safeguarding statistical independency among all uncertain elements and the inclusion of Merge Event Bias in the calculations gradually leads to successful results. They, together with cost applications, were launched around 1990. Unfortunately, scientific references from this research are not available today, except for reference Archibald & Lichtenberg [17].
Schedules are basically analysed according to the same procedure that is described for cost analyses, but instead of a cost break down structure, a high level logically-linked critical path network is used as the basis for the analysis. Typically, it consists of 10–20 main activities or groups of activities which represent the “base case” schedule. Additional activities are then added at the end or at relevant points in the network to model the timely effect from the Overall Influences upon the base schedule, using the qualitative Uncertainty Analysis as a guide (see Supplementary Materials, step C and D). This part of the procedure runs exactly as in cost analyses described below.
During the following part of the procedure, the duration of all physical activities are evaluated under base case conditions, while the effects from the Overall Influences are evaluated according to the opportunities and risks in each category of the Overall Influences.
A schedule uncertainty analysis normally uses Monte Carlo simulation in order to identify and include the degree of criticality and Merge Event Biases. This last concept covers the fact that when two or more uncertain near critical paths merge, an additional delay materialises.
The top-down procedure is also used here, but for schedule analyses, any specification using the Successive Principle takes the form of a sub-network, except specifications of the Overall Issues.
The Uncertainty Profile or top ten list are less simple here, as it is calculated as the product of the degree of criticality, measured in percent, and the local variance [16].
3.3. Cost Analyses
The following sections will focus on the cost side. The basic procedure normally includes a main analysis performed as a workshop from half a day to one or a few days. The result—under condition of keeping to the “rules of the game”—is partly a neutral and correct statistical value of the final result—cost, duration or profitability, and partly a ranked list of primary optimization possibilities, actually the final Uncertainty Profile or top ten list.
During the main workshop the project, costs are gradually evaluated and the uncertainties reduced during some successive steps. In the following period of time, the identified optimization options are examined, and realized or decided if relevant. The former analysis result is then updated as a result of the optimization work. The end result being an optimal and neutral mean value and related uncertainty, ready for decision makers to define a realistic working budget and a reserve. This is illustrated in Figure 5.
The Method involves an Analysis Group in a creative, multi-disciplinary process in which qualitative and quantitative data about the future are captured and modelled. All issues are included, “soft” factors as well as ‘hard’ technical ones. The overall idea is to promote a dynamic and stimulating process, which concentrates thinking on the uncertainties (unknowns and “unknown unknowns”) rather than the certainties (knowns). The process is led by an experienced facilitator.
The approach involves distinct Qualitative, Quantitative and Action-Planning stages. As noted above, the quantitative modelling is top-down in nature, detailing and evaluating the most important issues on the top-ten list of uncertainties in successive steps. This allows the group to keep an overview, to focus on the really important aspects, and to avoid wasting time and resources on the many issues which are of little or no importance.
A basic practical procedure is described in the Supplementary Materials below, besides being in a congress paper [17], while a full description and discussion is found in the author’s handbook on the method [9].
4. Results and Experiences
The decision makers receive normally a definite total dollar value figure from calculators. They then have to more or less guess whether this figure is an optimistically one or it maybe is too high. Obviously, it may go wrong at times. Actually, it happens most frequently as outlined in Section 1.
The decision makers via this research need not to guess anymore. They are now able to decide the relevant risk of overrun. Accepting the build-in uncertainty in a budget estimate, the decision makers are now able to balance against a low budget, with related risk of overrun and a higher budget, with a related higher possibility to avoid overruns. In the latter case, we risk that the project discretely uses idle resources in “nice to have” situations, which may be of secondary benefit compared to alternative use.
In Norway, for years, they have solved this balance problem, while operating with two budgets, (1) a working budget, which is typically decided close to the calculated mean value, and thus having ca. 50% chance to keep to budget; and (2) an ultimate budget, inclusive of a reserve up to the 80% likeliness for keeping to budget.
Major Norwegian projects financed by the state have to be started by the government, and accepted by the parliament for the final “go” and financing. Smaller projects are decided by the relevant agency. The difference between the working budget and the total budget is kept as a reserve at a higher level decision party. The project may, if necessary, ask for additional funds from this reserve pool according to defined rules, but it is not too easy and it requires an unlucky development, such as bankruptcies or the like. In case of underrun, the idle resources go back to the funding agency.
Since the year 2000, the final costs of all large Norwegian public projects—inclusive of IT projects—have been very close to the analysed mean values on average, and thus to the working budgets, as further developed in Section 4.2 below.
Some organizations use the procedure ad hoc, while using external facilitators from consultants. This was the case of the example in Section 4.1 below. Other organizations implement the procedure in their organization, managed by a high level administrative body of specialists, who act as facilitators, and maintain the procedure at a high professional level. The Norwegian construction company, the AF group, and some Scandinavian public organizations within rail and road are examples of this approach.
During three decades, up to a thousand projects have been successfully analysed using this methodology. However, it has been hard for many people to believe that it is actually possible to get full control over the budgets (and schedules) of large projects. Every successful individual project may have other reasons behind their success.
Two cases will exemplify the typical applications and the potential benefit. Oslo Spectrum is a large multiuse arena. The winning project from the architect competition estimated the cost at $43 million. Three years later, many interested parties had worked with the project organization to be included. Before the “go,” a quality analysis after these principles was decided. It showed $114 million as the mean-value. The project was then reorganized, in part supported by the analysis results, down to a mean of $76 million. This was accepted and became the working budget, while the ultimate budget was $86 million. The official final account was $76 million.
Another example is the Lillehammer Olympic Games in 1994. The initial investment budget rose from $230 million to $385 million over the summer, more than four years before the games. A risk analysis showed an expected final total cost of $1230 million. This potential overrun was of course politically unacceptable. The investment plans were then reorganized—in part supported by the analysis result—and followed by several updating analyses. The expected investment figure was eventually some months later reduced to $800 million as a mean value. This became the working budget, while the official committee was allocated a reserve of approx. $90 million. However, the final official accounts equaled the analysis mean value of $800 million, so the reserve fund was saved and was later used to operate the facilities after the games.
Many of the successful results have generally been explained as pure luck, perfect project management or the like. However, this capability to successfully predict the project outcome has for the first time been more properly documented from two independent series of large projects. They are summarized below.
4.1. A Set of 40 Large Danish Road Projects (2002–2007)
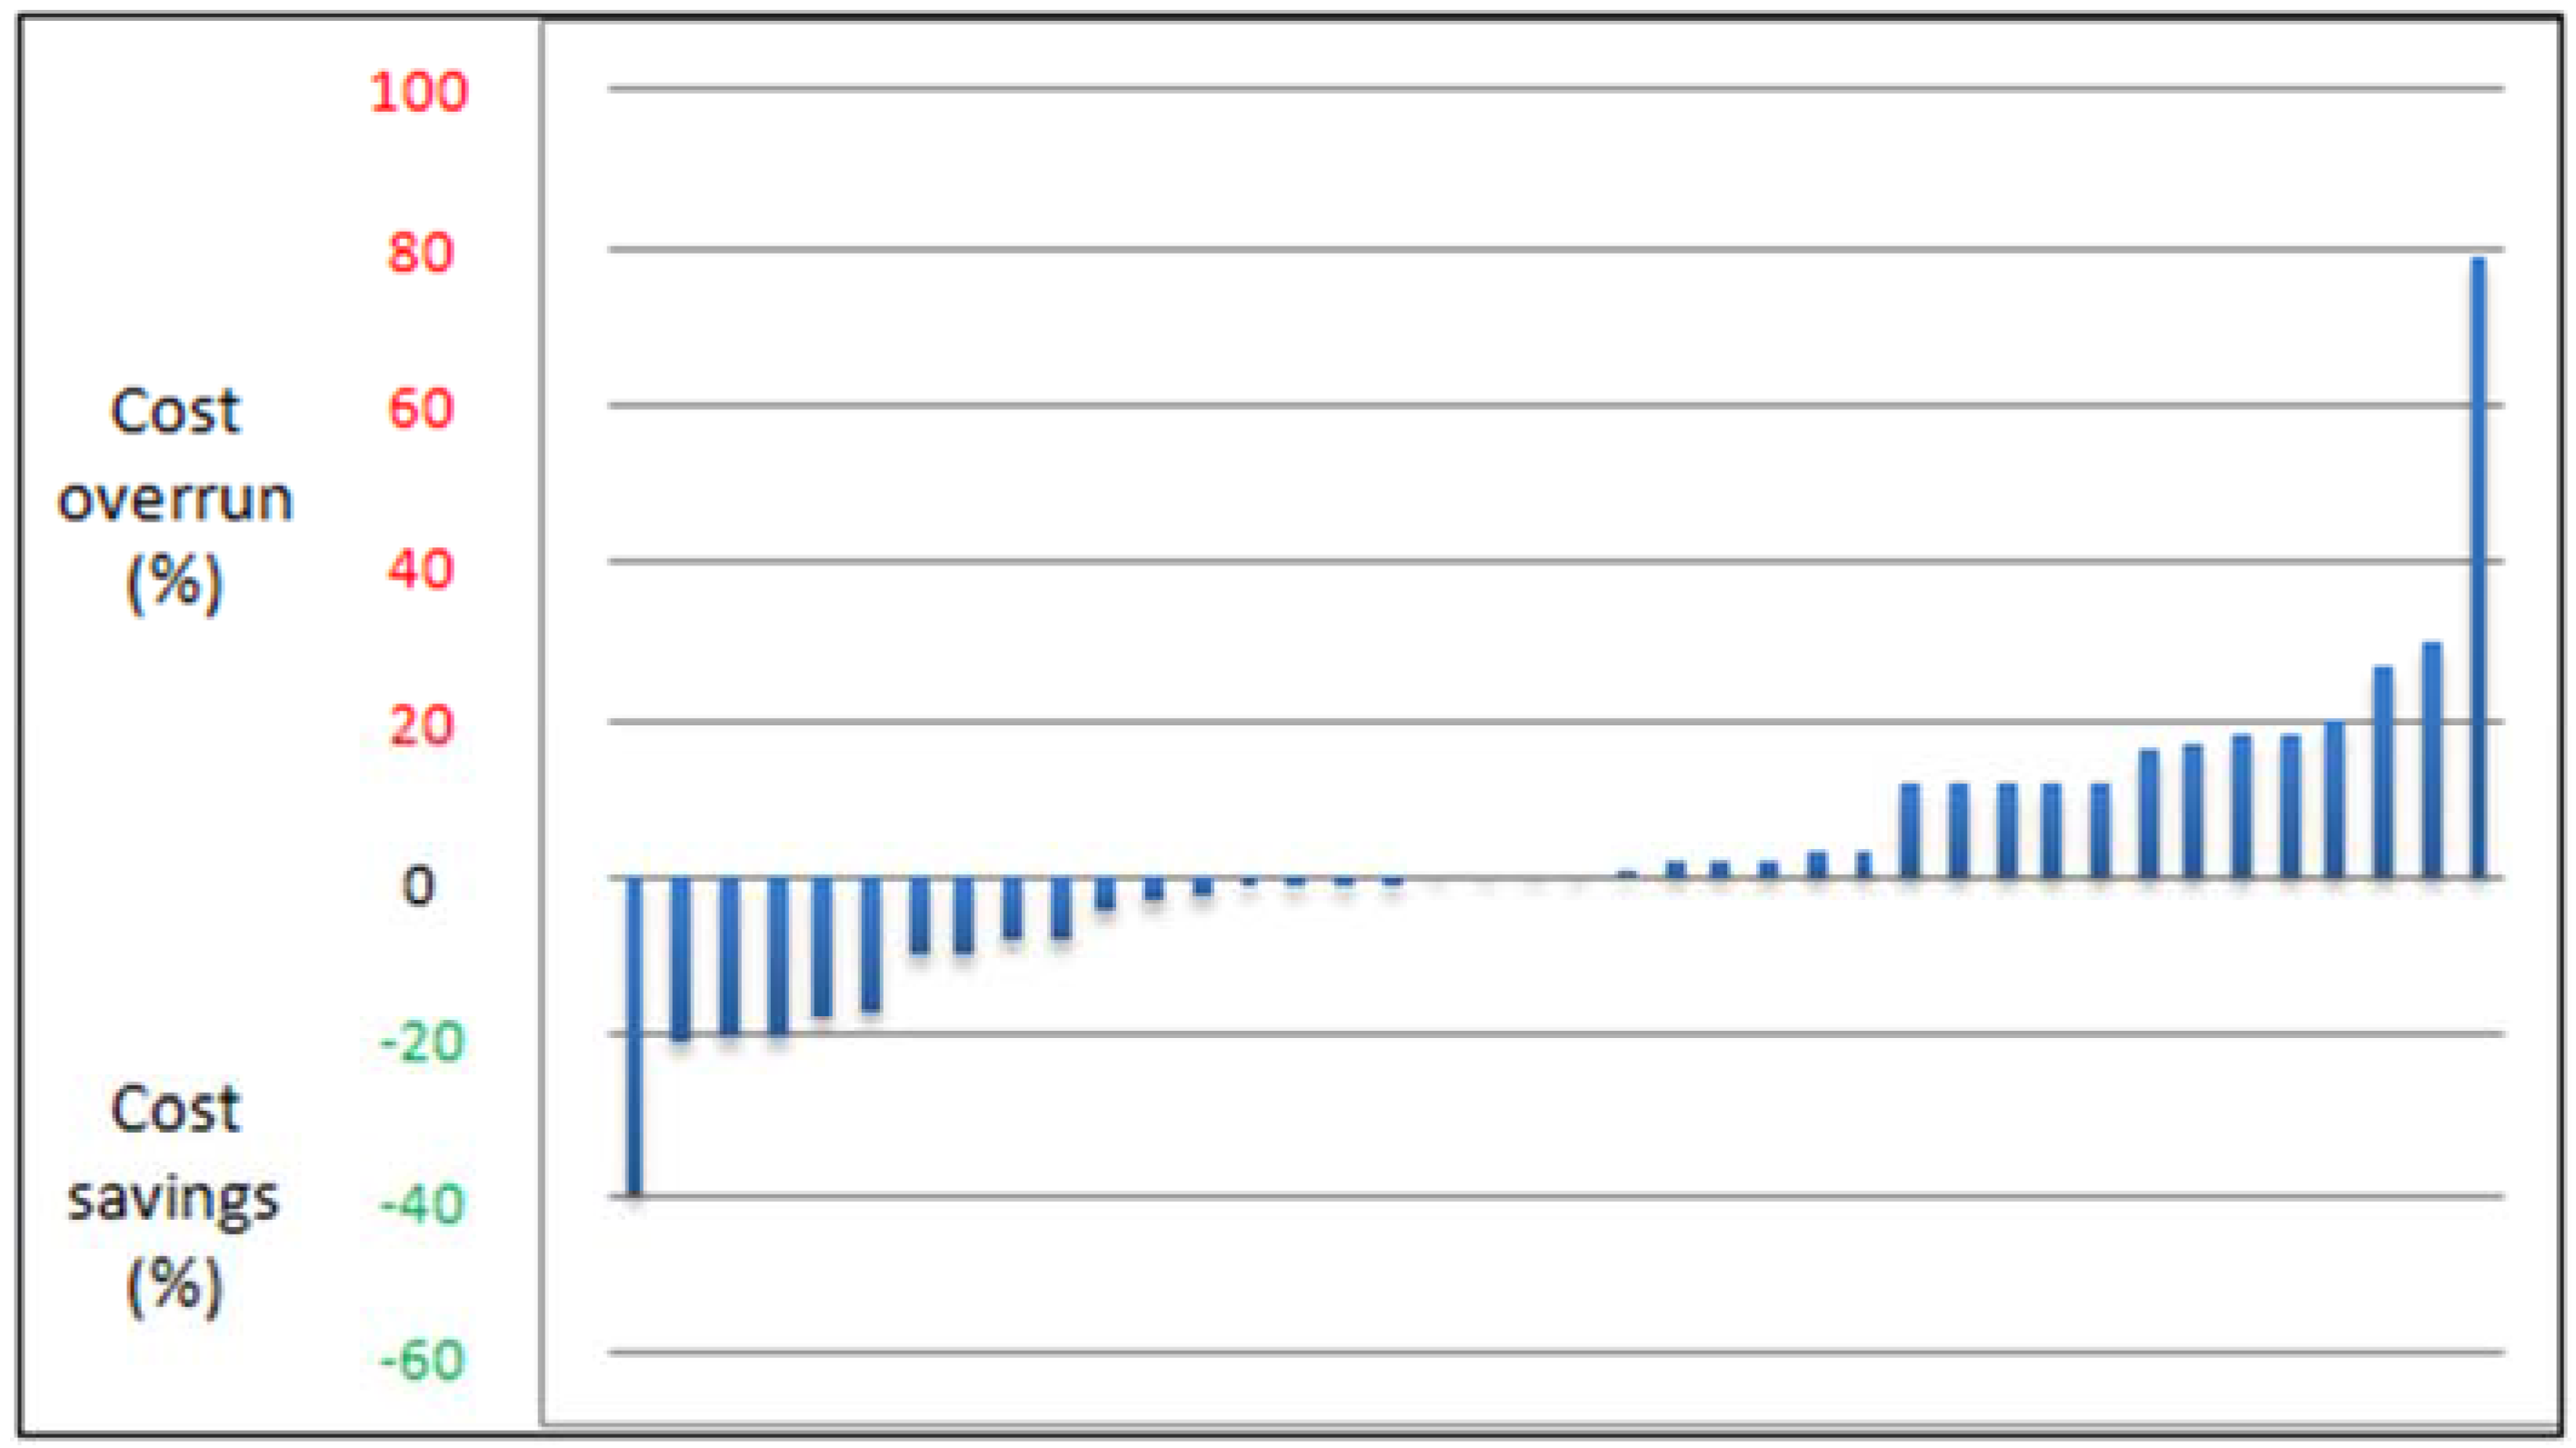
Over the period 2002–2007, the investment costs of all current large-scale Danish highway projects were estimated by the National Danish Road Authorities using the Successive Principle. The projects typically included new motor roads, as well as enlargements of existing roads, typically from 2 + 2 to 3 + 3 lanes. They were in various phases, a few in their early phases, the majority prior to the sanction/execute decision, and a few in the following phases. By 2013, a significant number of these projects were finished, and it was possible to compare 40 prognoses with the related actual final costs for these projects. The total investment was ca. $2300 million. The result is illustrated in Figure 6 below. The vertical scale indicates whether the actual project cost is lower or higher than the expected cost. This is measured in percent of the actual cost.
It can be seen that far more projects were under the expected costs compared with those that exceeded it. The average savings compared with the expected costs were approximately 5%. A likely reason to this is the fact that project managers were very keen to make use of the top ten list of the primary key risks and uncertainties that is generated from the quantitative cost analysis. Concentrating their risk mitigation effort and exploitation of potential improvements onto these primary areas reduces cost efficiently, and this may explain why many of the projects eventually ended up under-running the mean cost that was predicted from the analysis. An example may illustrate this.
If, for example, the cost effect of local communities appears as a large uncertainty at the top ten list, the project manager is urged to initiate talks and the best possible cooperation with local decision makers, such as leading local politicians. This will often result in lesser problems and related additional costs than estimated in the budget.
The estimated uncertainty in the whole set of projects, measured as a standard deviation, corresponded well with the spread in the results. For more details, refer to [18].
4.2. All Major Norwegian Governmental Projects Approved and Completed over 13 Years
This case example is referred from an official report, no. 36, from the Norwegian research program, concept, Samset et al. [19]. During the 1990s, Norwegian large public projects too often lead to serious overruns. During the same period, the Successive Principle began to manifest itself as able to make realistic budgets, largely among contractors, the offshore industry and in other areas in the private sector. Gradually, some public agencies also implemented the procedure and improved their budgets. Inspired by these results, the government initiated a commission. In 1999, it suggested the use of the Successive Principle towards all major projects financed by the State, Berg [20]. The so-called KS2 or QS2 procedure was made obligatory from the year 2000 towards all of these projects above $70 million.
It became the ambition that about 80% of the projects should stay within the approved official budget. Any higher ambition was assumed to be too costly. As a result, it became normal in these public projects to offer the executing body a “working budget” close to the estimated mean value, which included an expected cost for contingency. To compensate for unavoidable uncertainty, a financial reserve was included in the approved official budget. This reserve of course was under the control of a higher level body.
Since then, quality audits based on the Successive Principle have been obligatory for all large-scale Norwegian public-sector investment projects above $70 million before the final decision to finance and execute. The practical administration was given to some authorized consultants, which were independent of the project owner. The analysis scope was widened to also assess the organizational set up and some other aspects. In 2002, a permanent research program, Concept, was launched, with the purpose to follow and further develop this system [21].
By 2013, 40 of these projects of all categories, including IT projects, had been completed. An official report [19] by the Concept group published the results so far. The report shows that the actual final project cost on average was very close to the working budget and thus to the expected mean values. This is illustrated in Figure 7. The data in the figure are taken from the above mentioned reference [19].
It can be seen that it is possible to predict the final project costs fairly accurately in statistical terms. This is true for the estimated mean values. However, the spread in the actual costs are somewhat larger than estimated in this set. This underlines the fact that difficulties still exist in evaluating subjective uncertainty in an unbiased way.
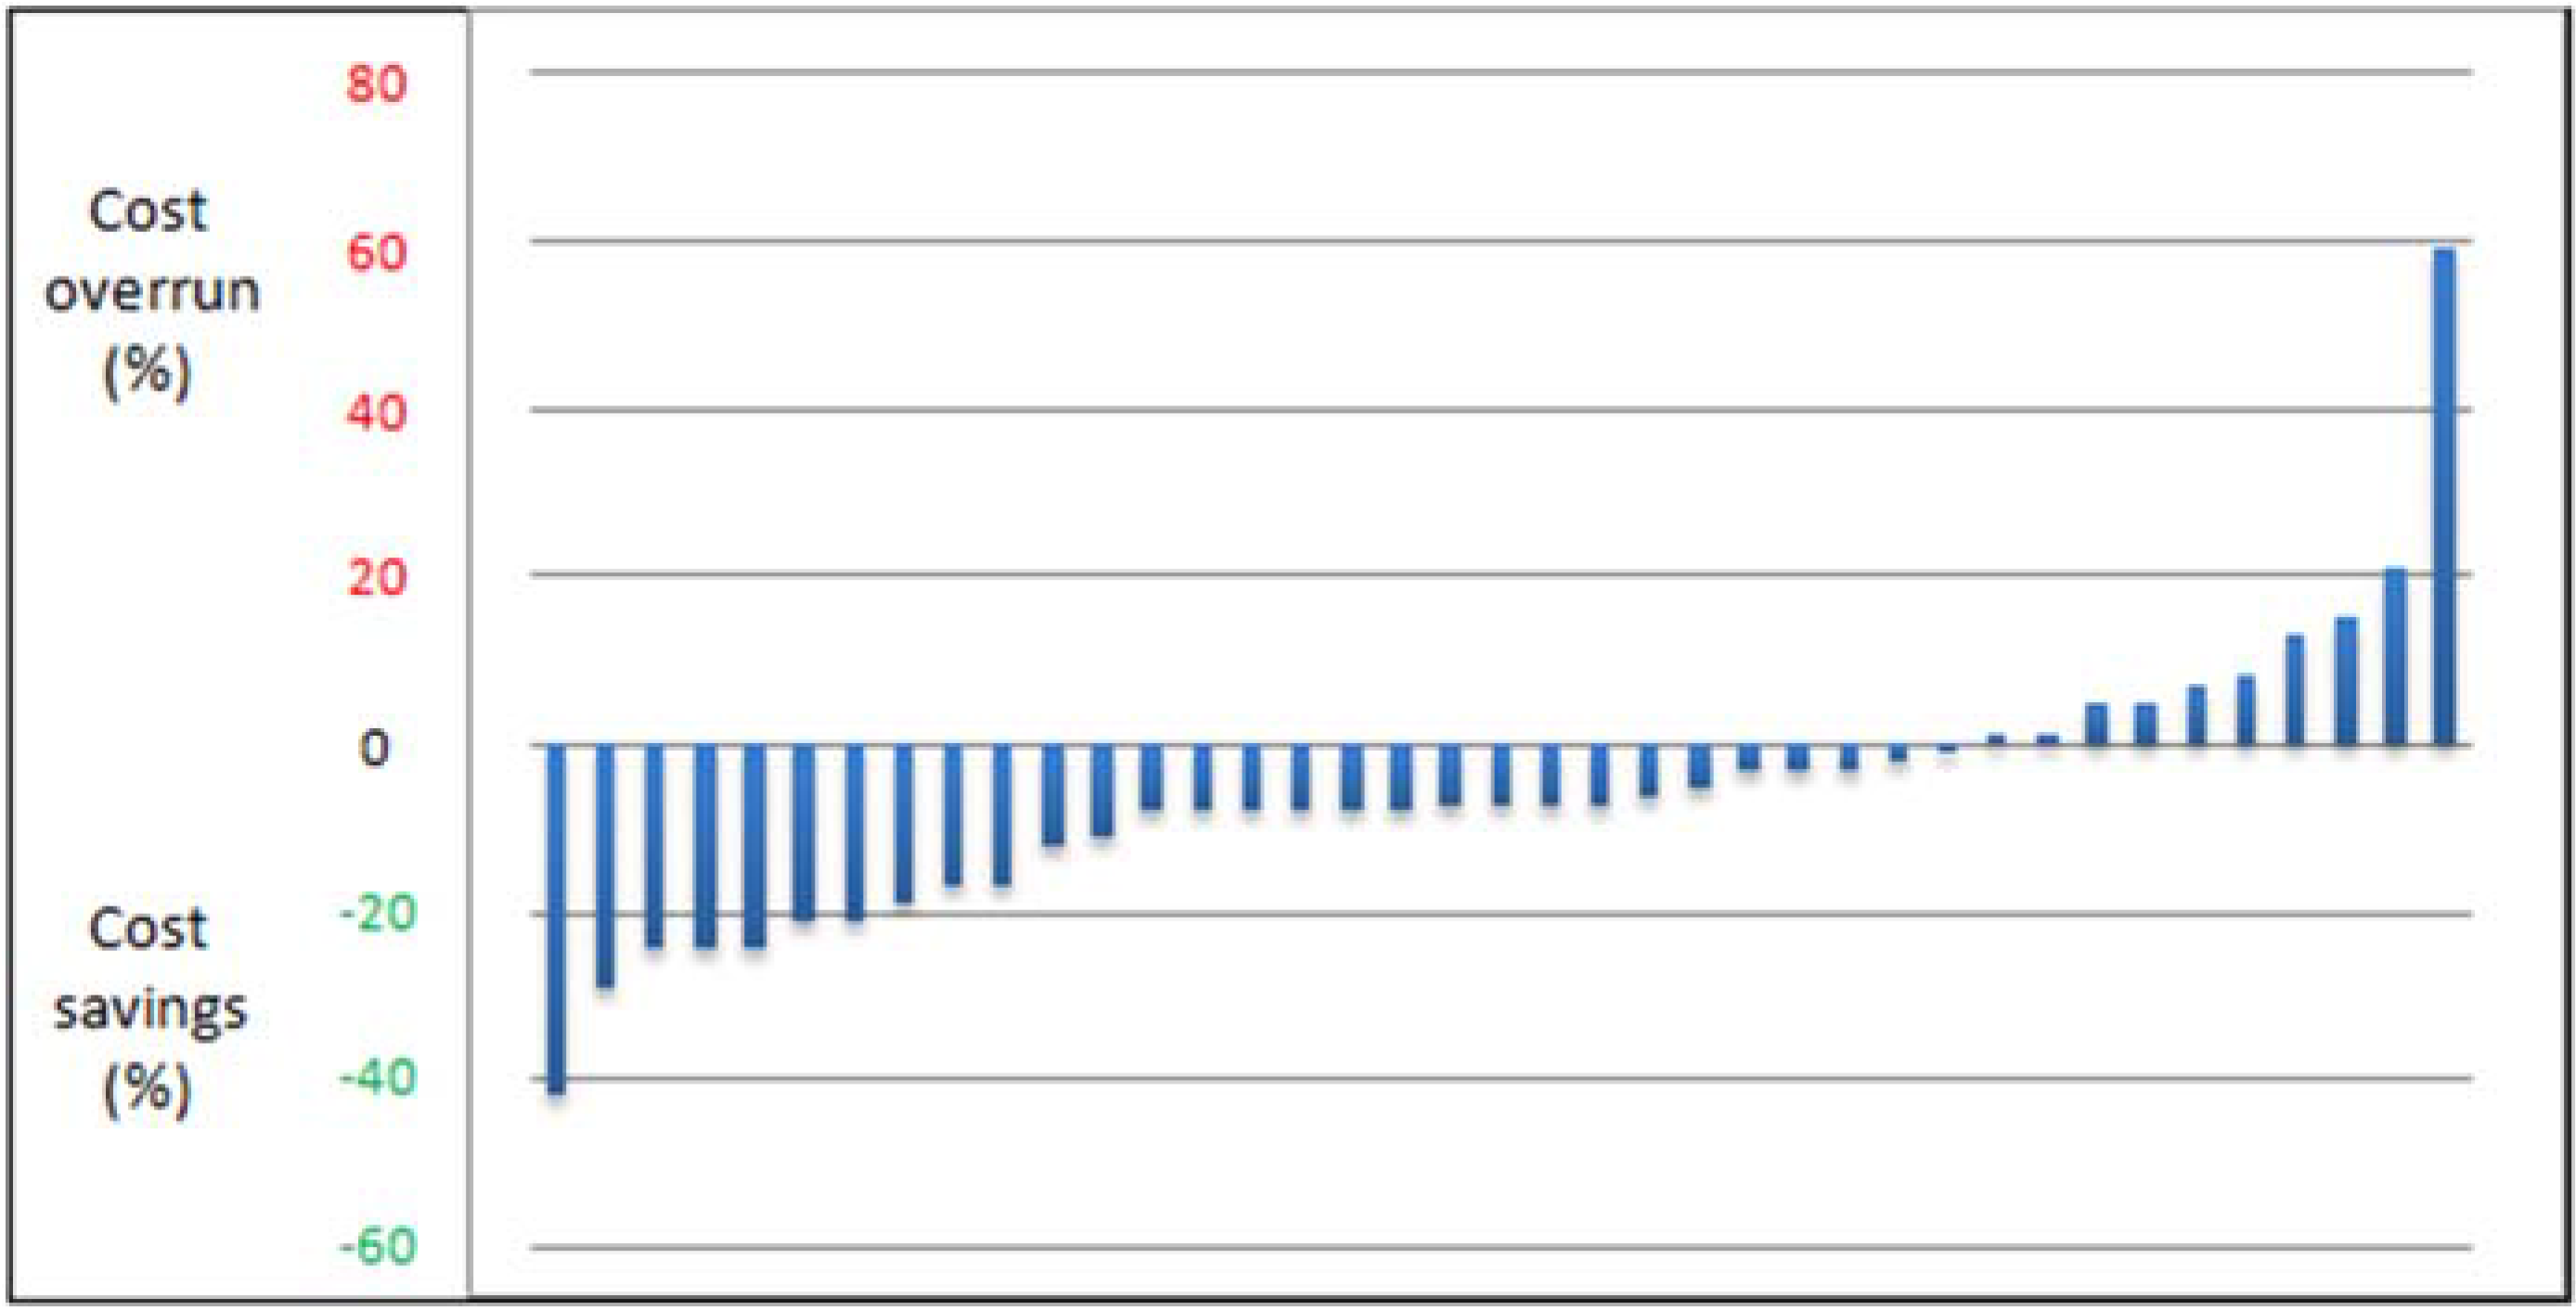
What about the ambition that about 80% of the projects should keep within the approved official budget? Actually, 32 of the 40 projects, or 80%, kept to budget! This is visualised in Figure 8 with figures from [19].
The results mean that the bulk of reserve money after 13 years was largely intact. For further information, see [19].
5. Practical Procedures and Applications
A number of specific variants of this procedure have been developed for a range of practical applications: cost estimates, schedule analyses, cost/benefit analyses, as well as for project optimization, obtaining consensus, and team building. Examples are given in [9,11,14,15,16,17,22,23],
To conclude, the Successive Principle has been used as an integrated approach for:
- *
- Quality assurance of budgets, schedules, profitability analyses and financial analyses.
- *
- Identification and ranking of financial risks and opportunities.
- *
- Action planning for improvements of productivity, safety and/or competitiveness
- *
- Ranking of alternative solutions.
- *
- Team building and consensus support.
Applied towards scheduling tasks, we witness a sharp contrast to the many details in related conventional estimates and schedules. Surprisingly few issues dominate the total result. This is accepted by the users as a most exiting matter.
The Norwegian Gardemoen airport, as an example, was delayed less than a year before the deadline. An analysis according to the Successive Principle confirmed this. The final Uncertainty Profile, or top ten list, identified that only three essential aspects or problems responded for 90% of the total uncertainty, and thus for possibilities for accelerating. They were settled a few days later at a meeting with the relevant top managers and specialists. This accelerated the schedule sufficiently and the new airport opened at the planned day.
The procedure has even been successful towards severe uncertainty. A Norwegian gas pipe line project from an offshore construction had a very tough and important deadline. The task included building a tunnel from shore and out into the open sea. This had never been tried before, and the uncertainties were of course large. A schedule analysis indicated that the mean of the duration equaled the time to the deadline. Even a mean value—as told—includes a fair part of potential delaying problems as well as possibilities to expedite the task. It proved to be enough, as the task successfully met the deadline.
6. Critical Discussion on Theory and Practice
6.1. Some Positive Experiences
Several managers, project managers, estimators and planners during decennias have changed their conventional procedures and implemented these principles and related procedures. They are typically expressing surprise at how close the prognoses were to the actual results. This has been most obvious in the analysis of project schedules, because the finalization of large physical projects is often an event visible in the media. Even large Swedish IT projects have kept to the estimated schedule, when analysed according to the Successive Principle.
An example illustrates that the principle has even been instrumental in bringing delayed IT projects back on track. One such strategically important project was delayed half-way through by approx. six months. At this juncture, an analysis process was conducted using the Successive Principle, which confirmed that, as it stood, the project had to be expected to be late by six months. However, as part of the analysis result, the following three acceleration initiatives were identified:
- (1)
- Earlier and closer contact with the future users;
- (2)
- Allocation of a key individual to be at the disposal of the project;
- (3)
- Acceptance by senior management of higher priority for this project.
A supplementary alternative analysis showed that these steps would accelerate the project sufficiently to finalize it on time. Senior management authorised these interventions, and they were implemented and the project did actually meet the scheduled time.
The main reason for the successful results most likely is the successful attempts to eliminate the many psychological pitfalls. They tend to severely damage planning and estimating, which more and more depends on subjective evaluations, regardless of the model used. Another reason may be that the analysis group is carefully composed to be both competent and broad. This allows everybody to use all their creativity, intelligence and even intuition under control as a supplement to their concrete knowledge. This also assists in compensating the natural drive for engineers and economists to focus too much upon technical and financial matters, and too little upon the more “smooth” matters.
Important benefits have materialized during recent decades of practical applications. The primary strength lies partly in the fact that unpleasant surprises can be significantly reduced. In fact, largely eliminated, and partly in the new opportunities for project efficiency, competitiveness and increased teamwork that this method helps uncover. Appropriate questions are now asked before a project starts instead of in hindsight when it may be too late.
A large portfolio of public and private companies in Scandinavia and beyond consistently testify to the benefits of using the Successive Principle. Many users liken the Successive Principle to a pair of “future-glasses” or to an “ultra-sound scan” of plans, estimates, budgets, etc. This is partly because of the specific and realistic picture of how matters will progress in terms of the budget or schedule, and partly because of the ranked Uncertainty Profile or “top ten list” of the most important external and internal sources of uncertainty. It consists of specific threat factors, hidden opportunities or simply the key time or cost uncertainties. The value of this list lies in allowing the client to take timely preventive or protective actions against threats and to make the most of the positive opportunities in order to improve competitiveness or to achieve greater efficiency. Control and optimization of major project schedules have been a particularly successful sphere of application.
6.2. Limitations, Challenges and Need for Further Development
The use of the Bayesian statistical theory has been criticized from those statistical theorists, who did not accept this widely accepted theory. The old and basic statistical theory, which interprets probability as frequency or propensity of some phenomenon, is simply unable to handle uncertainty of future events. Thus, the use of the Bayesian statistical theory, simply, is necessary to use, and luckily it allows for handling subjective uncertainty or personal belief. The numerous positive results strongly indicate that this use is relevant.
A more essential criticism has focused upon the possible disturbing effect from the composition of the analysis group. This, however, does not seem to be a problem. An example indicates that. After an analysis, the project owner saw this as a problem and decided to repeat the analysis independently of the first with another group of participants. They, however, came out with the same result. However, it is still essential to follow the rules and criteria for the composition of the analysis group, and of course this constitutes an uncertainty. A similar methodical uncertainty stems from the fact that an analysis group may generally be somewhat too optimistic or too pessimistic. However, it is part of the procedure to let the participants make a final triple estimate that seeks to compensate such a risk. The final result thus includes this methodical uncertainty.
The Successive Principle deals with uncertainties, not proper risks, like catastrophes. However, the possibilities to use the principle in actual Risk Analyses have been tested with some success. However, this area still needs further development.
The limitations in the approach largely lie in having to comply properly with “the rules of the game”—some of them untraditional and, for some participants, provoking. It can, for example, only be useful in organizations with a modern management attitude, and a policy of internal openness. It requires courage and genuine will to meet the “naked truth” of the task, whether it concerns schedules, budget proposals, financial analyses, etc. This is described in [15,24,25].
Because of the innovative character of the Successive Principle and the weight given to both qualitative and quantitative evaluation processes, a considerable and demanding preparation period is also needed prior to the workshop, and not least together with the full, unequivocal backing of senior management. Even if this is obtainable, the process must be guided by a facilitator who has a good grasp of group dynamics, statistics and the use of the Successive Principle. Such people may be hard to find.
An observed weakness is to focus solely on the physical items without sufficient regard to the overall general effects from the project environment, management, client, the current project situation, future developments, etc. (refer to Figure 2).
Another typical weakness lies in not handling the triple estimates correctly. Unfortunately, the well-documented problem of underestimating the range between maximum and minimum values still occur as a problem in Norway. This can be compensated for by using the most extreme values in the whole analysis group, and via the use of secret triple estimates by each individual.
In [23], Norwegian researchers observe the following further challenges with today’s practice that still need more attention:
- *
- expressing the real uncertainty in very early phases of a project;
- *
- avoid digging too deep in details;
- *
- getting the standard deviation right (expressing the realistic uncertainty) in all phases of the project;
- *
- handling the human error and team effects (heuristics and group think) and understanding their effects;
- *
- avoid neglecting opportunities during the risk and uncertainty analysis (we seem to have a blind spot for opportunities).
The Successive Principle addresses to some degree all these challenges, but even more improvements in practice are called for. We applaud such initiatives and suggest one specific improvement in the concluding part. The potential is huge, but it does not come for free. Significant investment in education of key individuals and training of facilitators is needed. So too is the development and implementation of organizational procedures to support and utilize the method.
7. Conclusions
Cost Engineering and Project Management have made serious advances, but projects are nevertheless often delivered too late and with severe cost overruns. This paper describes how former research results have successfully challenged the traditional way of thinking about project planning, cost estimation and risk analysis. The results have been surprisingly promising since the introduction in the 90s, but they have often been explained away by referring to luck or other situational factors. Then, finally, in 2013 and 2014, has come credible research that confirmed there is more than coincidence behind these results. The results are presented above: by using the Successive Principle, good control over the cost of large projects has finally been established in Scandinavia, first of all in Norway and to some degree in Sweden and Denmark besides sporadically in other countries. In the two latter countries, the principles have been used more ad hoc in industry and in some public agencies, except that the Swedish rail agency has implemented the principle.
Supplementary Materials
The Supplementary Materials are available online at www.mdpi.com/2076-3387/6/3/8/s1.
Acknowledgments
This research was supported by the Technical University of Denmark, DTU, and the Technical University of Norway, NTNU. The author thanks the colleagues from these two institutions, who have contributed over the years with insight and expertise so that the research, in fact, is a common team result, although they may not agree with all of the interpretations/conclusions of this paper. The author is grateful to the numerous colleagues and partners in various consultancies for inspiration and assistance in connection with the practical experiences of using the resulting new principles. First of all, the dedicated consultants in the International Futuraone group, today represented by Erling Hjallen, senior consultant, Kongsberg, Norway. The author is also deeply grateful to Peter Adlington, senior consultant, Adlington Associates, Cambridge, partner in the Futuraone group, for his wise comments and valuable linguistic assistance to this paper.
Conflicts of Interest
The author declares no conflict of interest.
References
- Anonymous. CHAOS Report; Standish Group: West Yarmouth, MA, USA, 2004. [Google Scholar]
- Flyvbjerg, B.; Holm, M.S.; Buhl, S. Underestimating Costs in Public Works Projects: Error or Lie? J. Am. Plan. Assoc. 2002, 68, 279–295. [Google Scholar] [CrossRef]
- Flyvbjerg, B.; Holm, M.S.; Buhl, S. How common and how large are cost overruns in transport infrastructure projects. Transp. Rev. 2003, 23, 71–88. [Google Scholar] [CrossRef]
- Merrow, E.W. Industrial Megaprojects: Concepts, Strategies and Practices for Success; John Wiley and Sons: Hoboken, NJ, USA, 2011. [Google Scholar]
- Odeck, J. Cost overruns in road construction—What are their sizes and determinants? Transp. Policy 2004, 11, 43–53. [Google Scholar] [CrossRef]
- Klakegg, O.J. (Ed.) Northern Europe Group of Consultants Specialized in Application of the Successive Principle; Futura One: Kongsberg, Norway, 2002.
- Kahneman, D. Thinking, Fast and Slow; Penguin Books: London, UK, 2011. [Google Scholar]
- Lange, N. Sikker Vurdering af Usikkerhed (Accurate Evaluation of Uncertainty). Master’s Thesis, Technical University of Denmark, Lyngby, Denmark, 1985. [Google Scholar]
- Lichtenberg, S. Successiv Kalkulation (Successive Estimating); Research report; Technical University of Denmark: Lyngby, Denmark, 1971; (In Danish, unpublished work). [Google Scholar]
- Lichtenberg, S. Proactive Management of Uncertainty—Using the Successive Principle; Lichtenberg & Partners: Vedbæk, Denmark, 2000; p. 345. [Google Scholar]
- Lichtenberg, S. The Successive Principle. In Proceedings of the PMI International Symposium, Project Management Institute, Washington, DC, USA, 1974; pp. 570–578.
- Teigen, K.H. The language of uncertainty. Acta Psychol. 1988, 68, 27–38. [Google Scholar] [CrossRef]
- Brun, W.; Teigen, K.H. Verbal probabilities: Ambiguous, context-dependent, or both? Organ. Behav. Hum. Decis. Process. 1988, 41, 390–404. [Google Scholar] [CrossRef]
- Klakegg, O.J. Trinnvis-Prosessen (the Handbook on the Stepwise Procedure); NTH Technical University of Norway: Trondheim, Norway, 1993. (In Norwegian) [Google Scholar]
- Aass, T.; Jermstad, O.; Aanes Johansen, K.; Klakegg, O.J. Governance of Norwegian Government Projects. In Proceedings of the International Project Management Association, IPMA World Congress, Istanbul, Turkey, 1 November 2010.
- Lichtenberg, S.; Møller, L.B. Three Types of Biases in Scheduling and solutions Applicable in Practice. In Proceedings of the International Project Management Association, IPMA World Congress, Garmisch-Patenkirchen, Germany, 26–27 September 1979.
- Archibald, R.D.; Lichtenberg, S. Experiences using Next Generation Management Practices. In Proceedings of the International Project Management Association, IPMA World Congress, Florence, Italy, 16–19 June 1992.
- Lichtenberg, S. Great News: New evidence of the Accuracy of Cost Prognoses. Lichtenberg & Partners. 2014. Available online: http://www.lichtenberg.org/great-2014-news (accessed on 1 June 2014).
- Samset, K.; Volden, G.H. Investing for Impact. Lessons with the Norwegian State Project Model and the First Investment Projects that Have Been Subject to External Quality Assurance; Norwegian Technical University: Trondheim, Norway, 2013. [Google Scholar]
- Berg, P. (Ed.) Styring av Statlige Investeringer (Controlling Governmental Investments); Norwegian Ministry of Finance: Oslo, Norway, 1999. (In Norwegian)
- Anonymous. Research Program, on Optimizing Large Public Projects; Norwegian University of Science and Technology: Trondheim, Norway, 2002. [Google Scholar]
- Anonymous. Anslagmetoden (Stepwise Method), Handbook R764f; Statens Vegvesen (National Road Authority): Oslo, Norway, 2014. [Google Scholar]
- Johansen, A.; Sandvin, B.; Torp, O.; Økland, A. Uncertainty analysis—5 Challenges with today’s practice. Procedia Soc. Behav. Sci. 2014, 119, 591–600. [Google Scholar] [CrossRef]
- Klakegg, O.J.; Lichtenberg, S. Bedre Kontrol Med Usikkerheden i Projektplanlægning (Better Control of Uncertainty in Project Management); Projektledelse: Allerød, Denmark, 2014. (In Danish) [Google Scholar]
- Klakegg, O.J.; Lichtenberg, S. Successive Cost Estimation—Successful Budgeting of Major Projects. In Proceedings of the IPMA 29th World Congress, Panama City, Panama, 28–30 September 2015.
- 1A summary in English appears in [9].
Figure 1.
“The figures I have given are wrong. That is because I don’t have the right figures” (unknown source).
Figure 1.
“The figures I have given are wrong. That is because I don’t have the right figures” (unknown source).

Figure 2.
There is a wide range of influences in the “world” that a project will be executed in—some positive, some negative. Since the potential effects of these overall influences cannot be calculated by conventional methods, they are often not sufficiently considered and handled.
Figure 2.
There is a wide range of influences in the “world” that a project will be executed in—some positive, some negative. Since the potential effects of these overall influences cannot be calculated by conventional methods, they are often not sufficiently considered and handled.

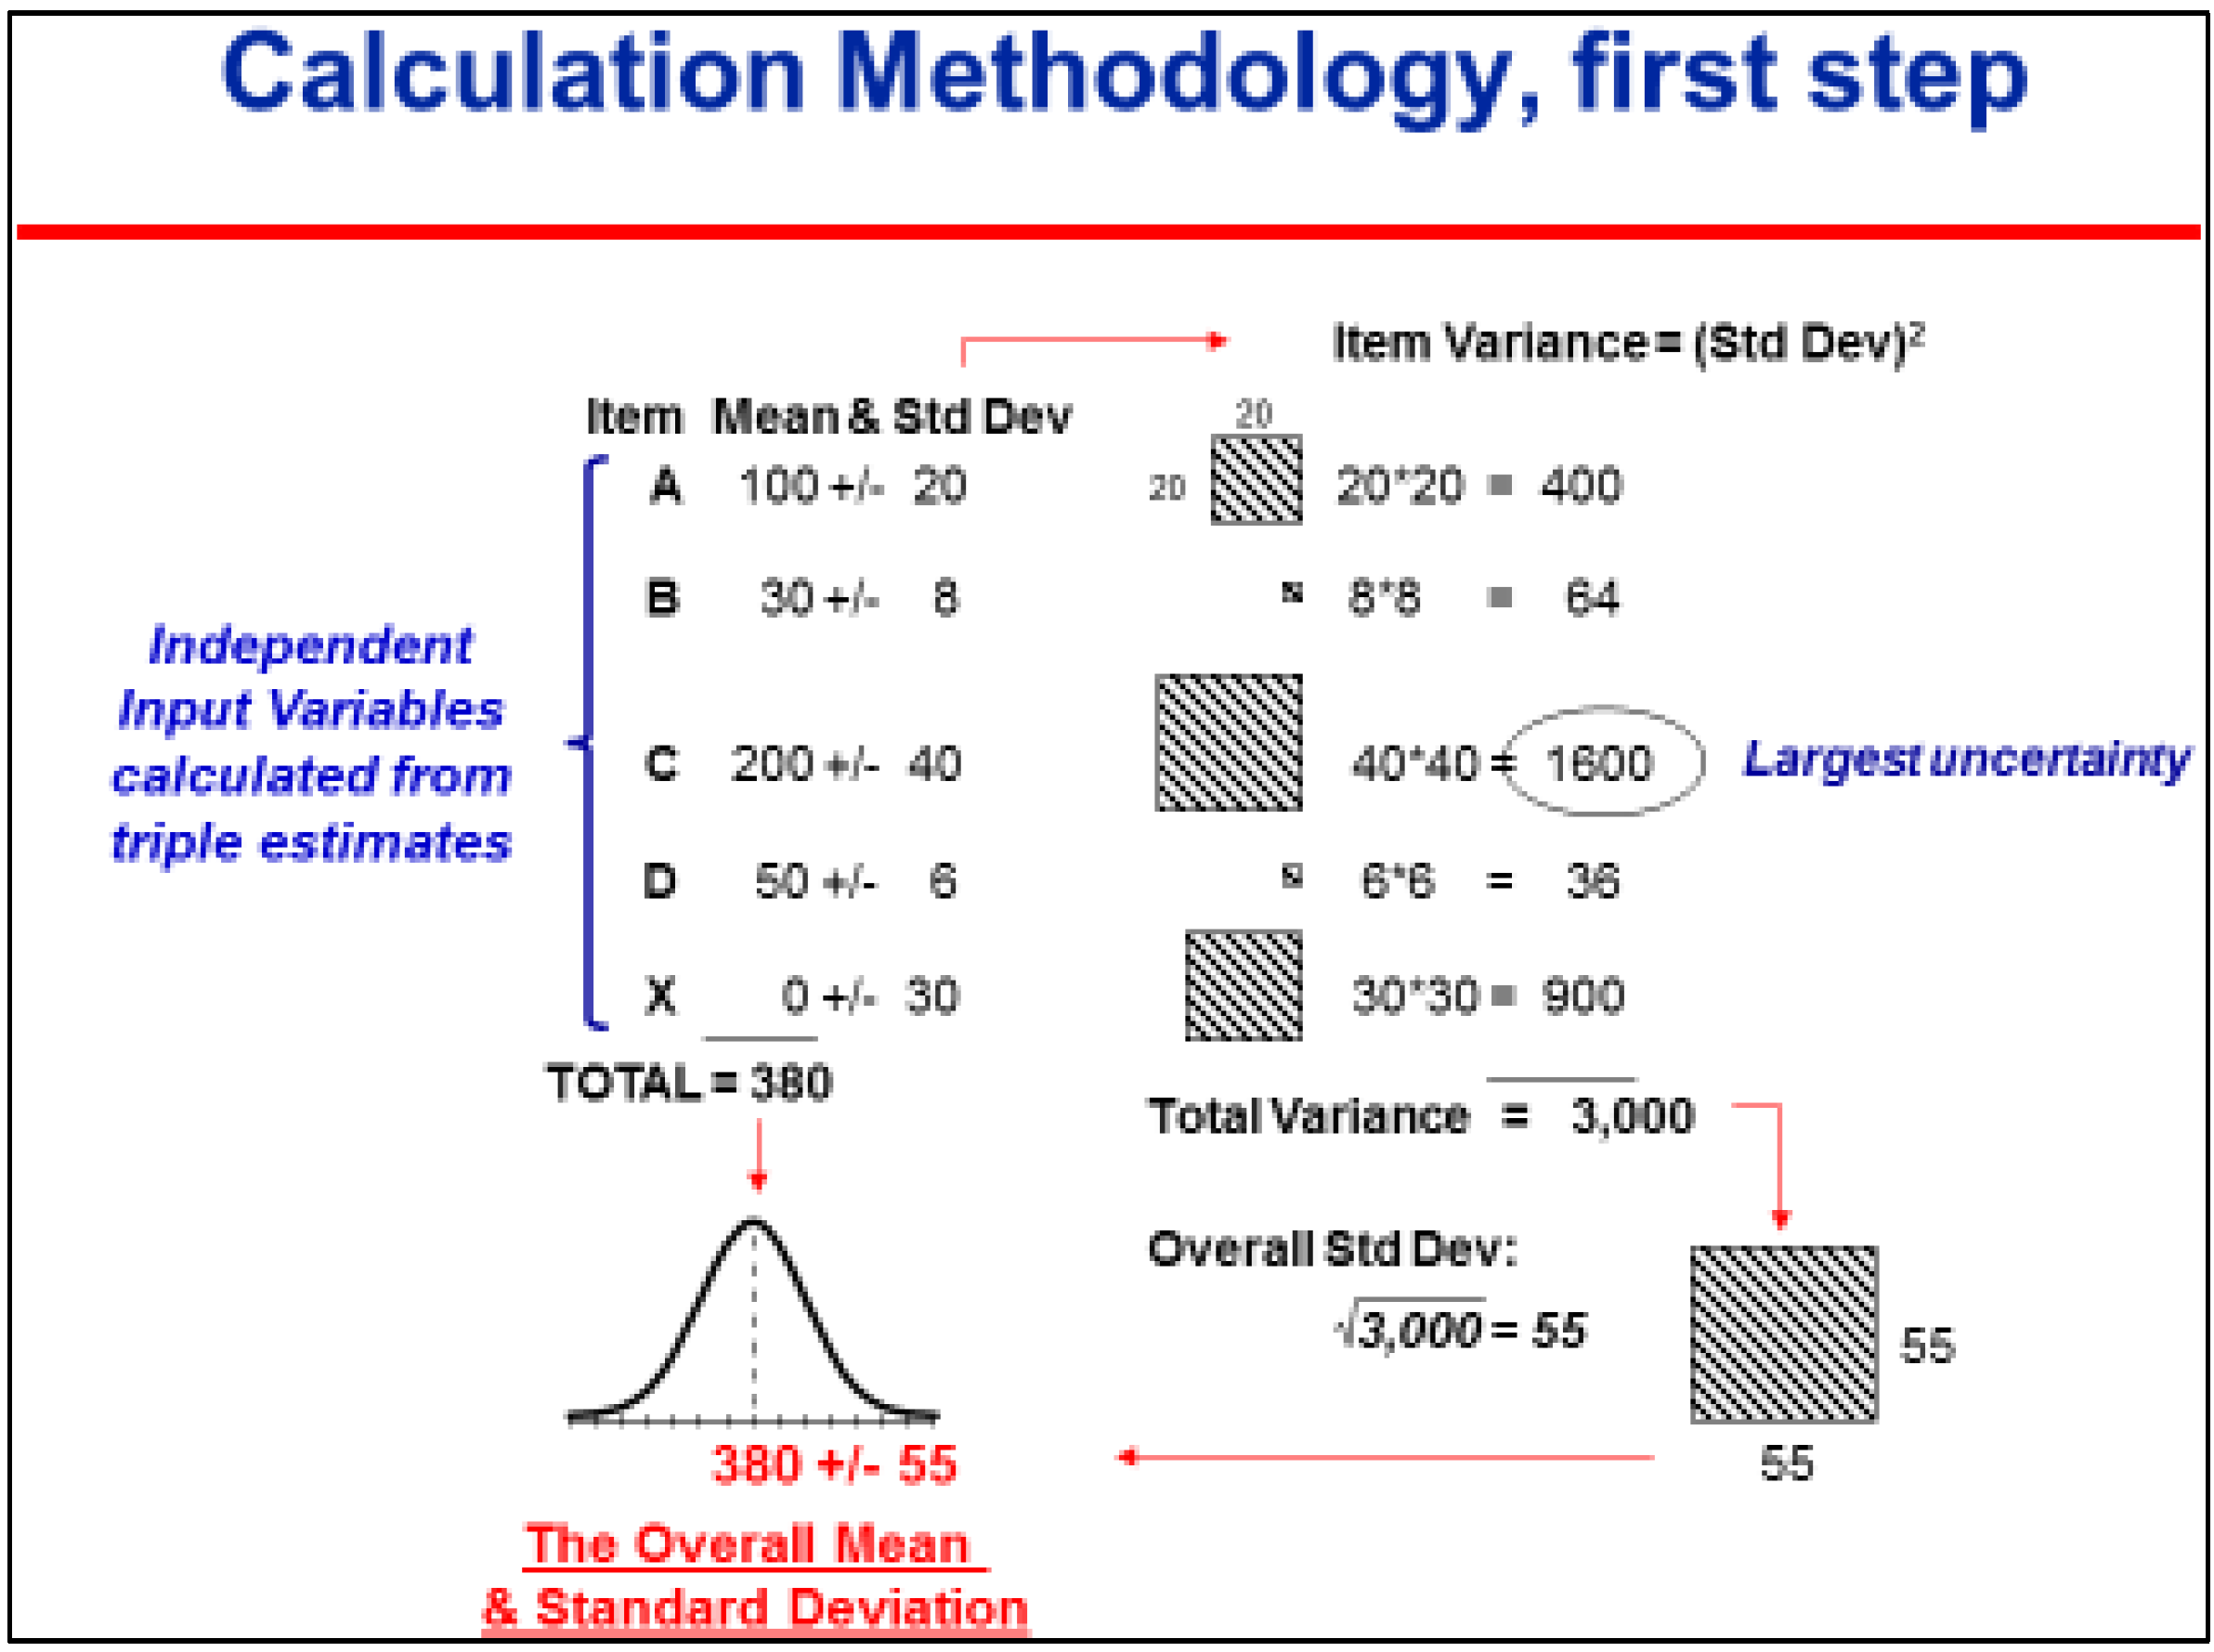
Figure 3.
Main items (A) to (D) are evaluated while using triple estimates under firm normalized calculation assumptions, while (X) represents all potential external supplementary cost effects—so-called Overall Influences. From the triple estimates, mean and standard deviation are calculated according to normal rules. The hatched squares illustrate the standard deviation in second order—the variance. They represent the relative criticality, because the variance of the total equals the sum of all local variances. Item C, being the most critical uncertainty, is further specified. This is shown in Figure 4.

Figure 4.
As illustrated in Figure 3, (C), being the most critical, is now specified into sub items. A triple estimate is made of each of these. The calculation is updated with these new estimates. The next step will be a specification of (X), now being the most critical, into a set of independent external potential effects—the Overall Influences. Refer to the examples in Figure 2. When all dominating uncertainties are handled in the following steps, the calculation procedure is finalized.
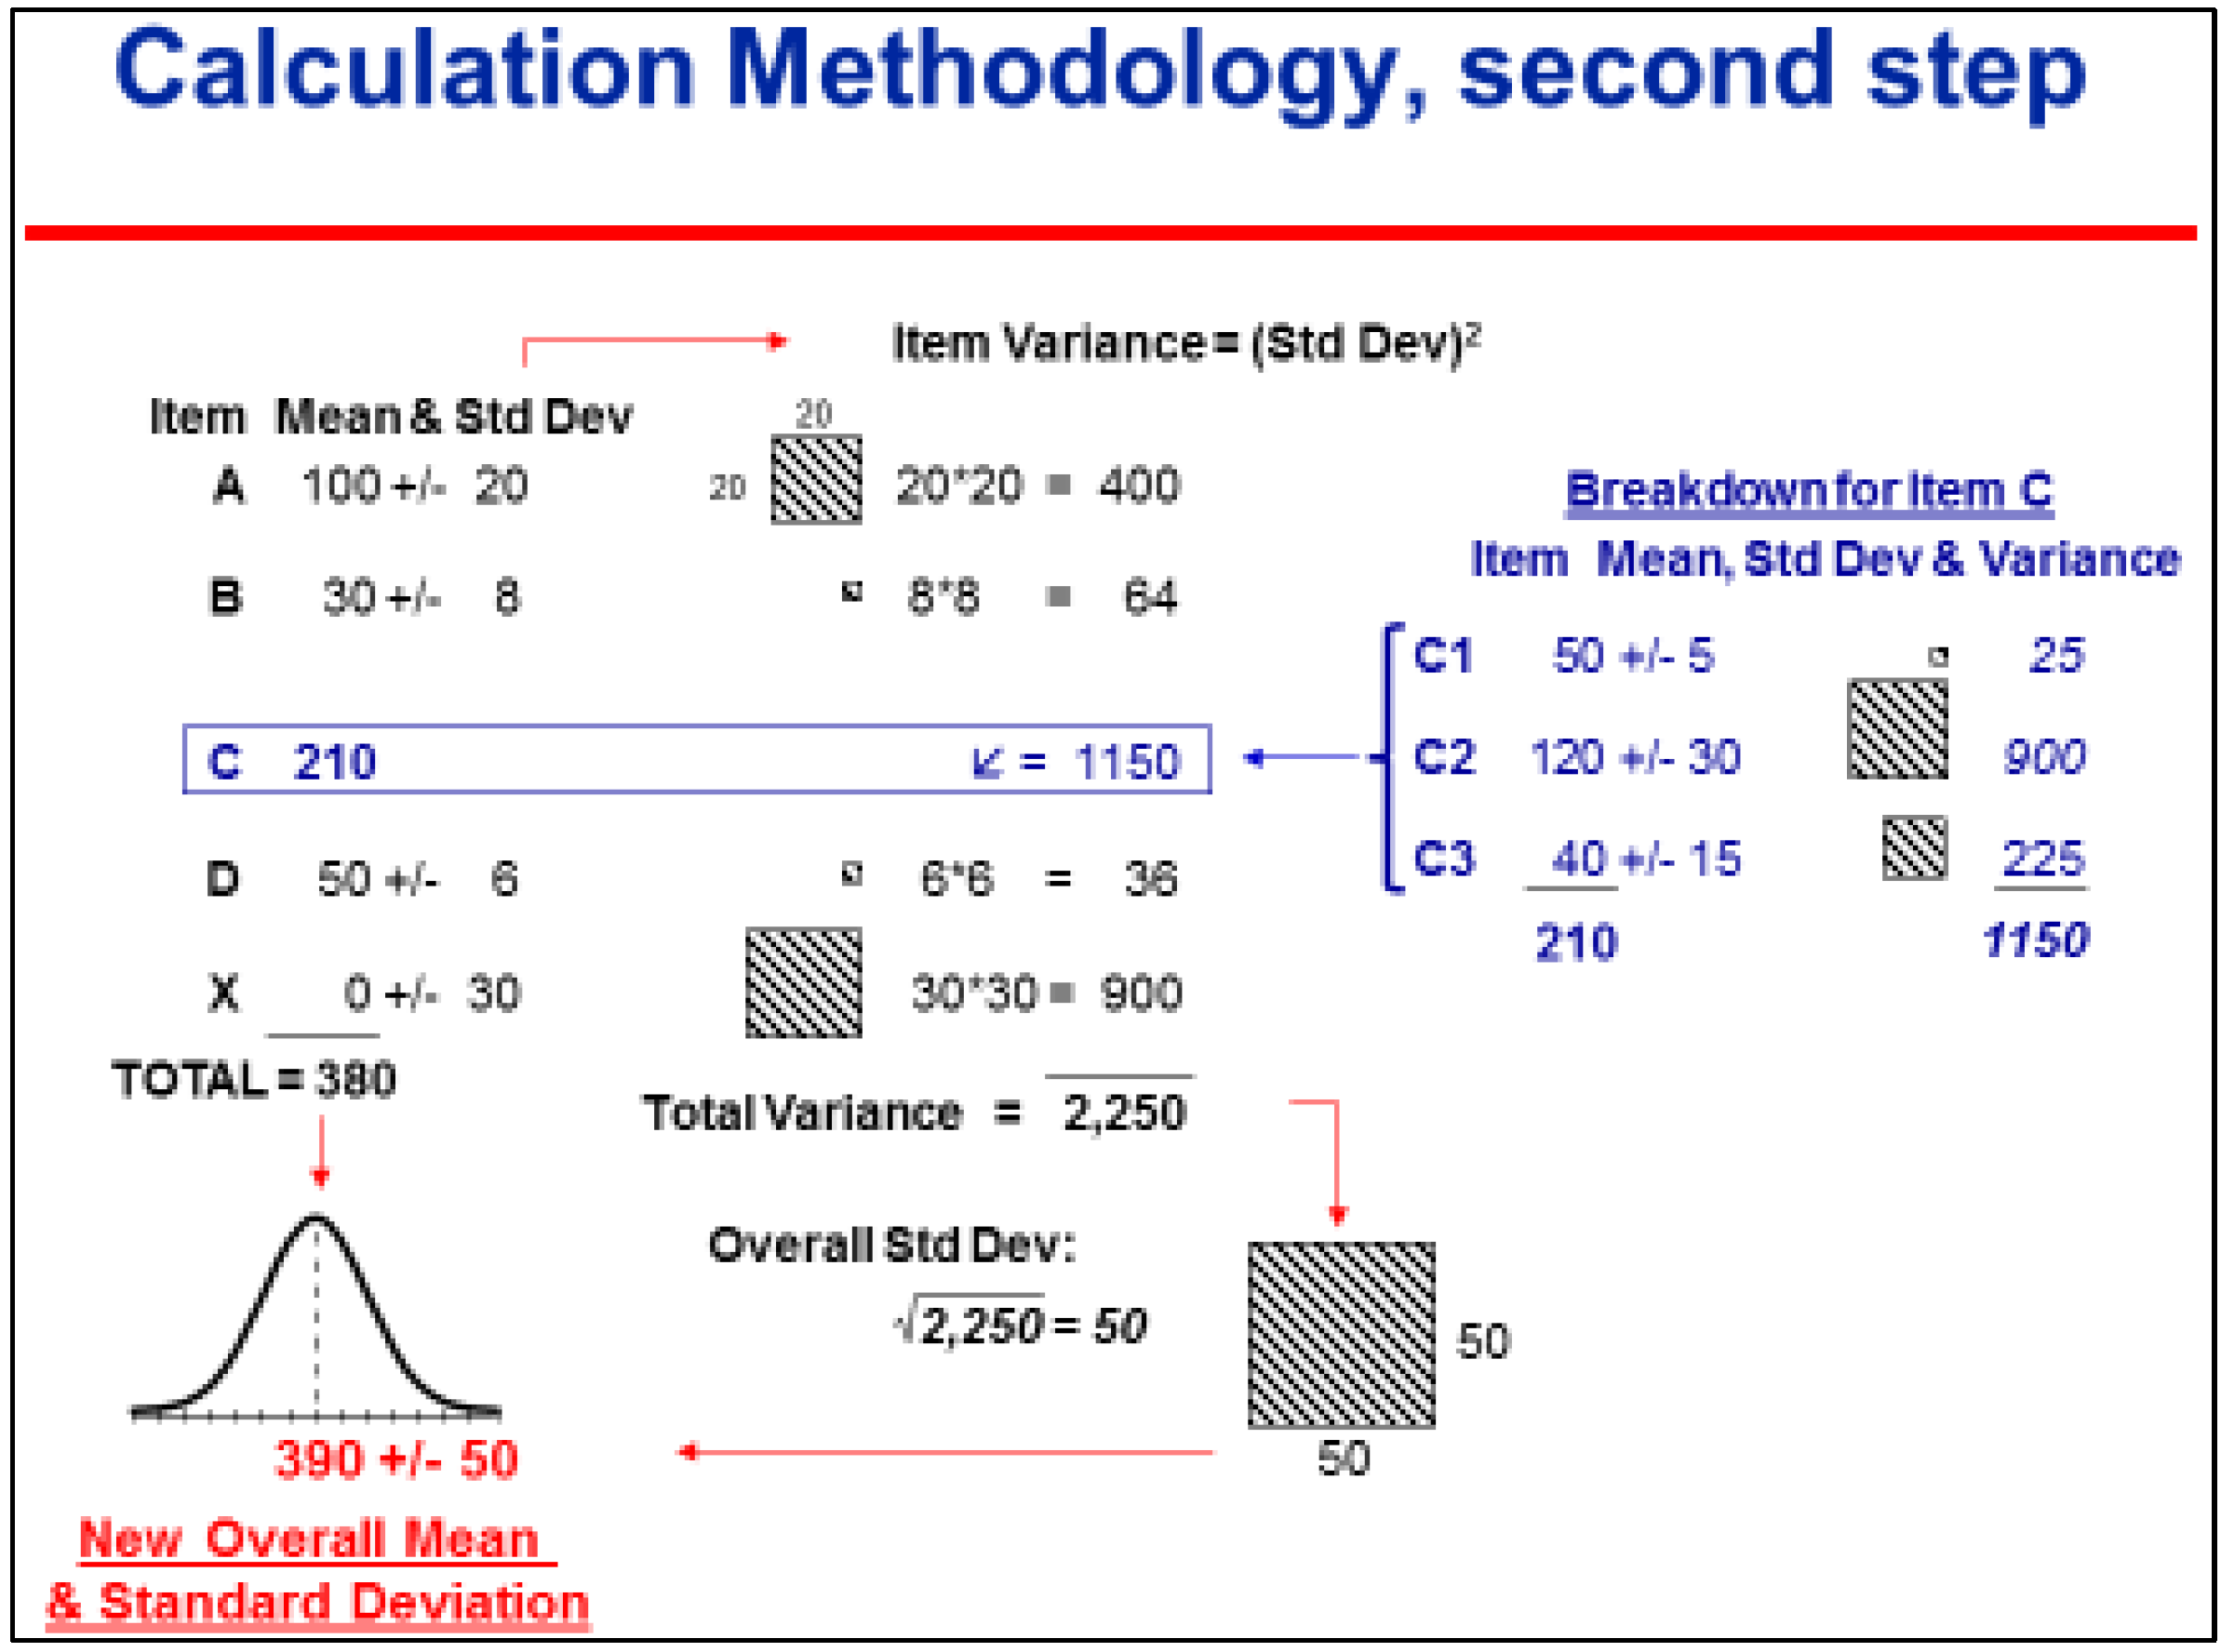
Figure 5.
Illustration of a typical analysis process. During the main analysis, the project costs are gradually evaluated and the uncertainties reduced during some successive steps. The individual steps may go both up and down. The number of successive steps is typically only four to seven before all decisive uncertainties are handled. During the following period of time, the identified optimization options are examined, and realized or decided if relevant. The former analysis result is then updated as a result of the optimization work. The end result is a neutral and optimal mean value and related minimized uncertainty, ready for decision makers to define a working budget and a reserve.
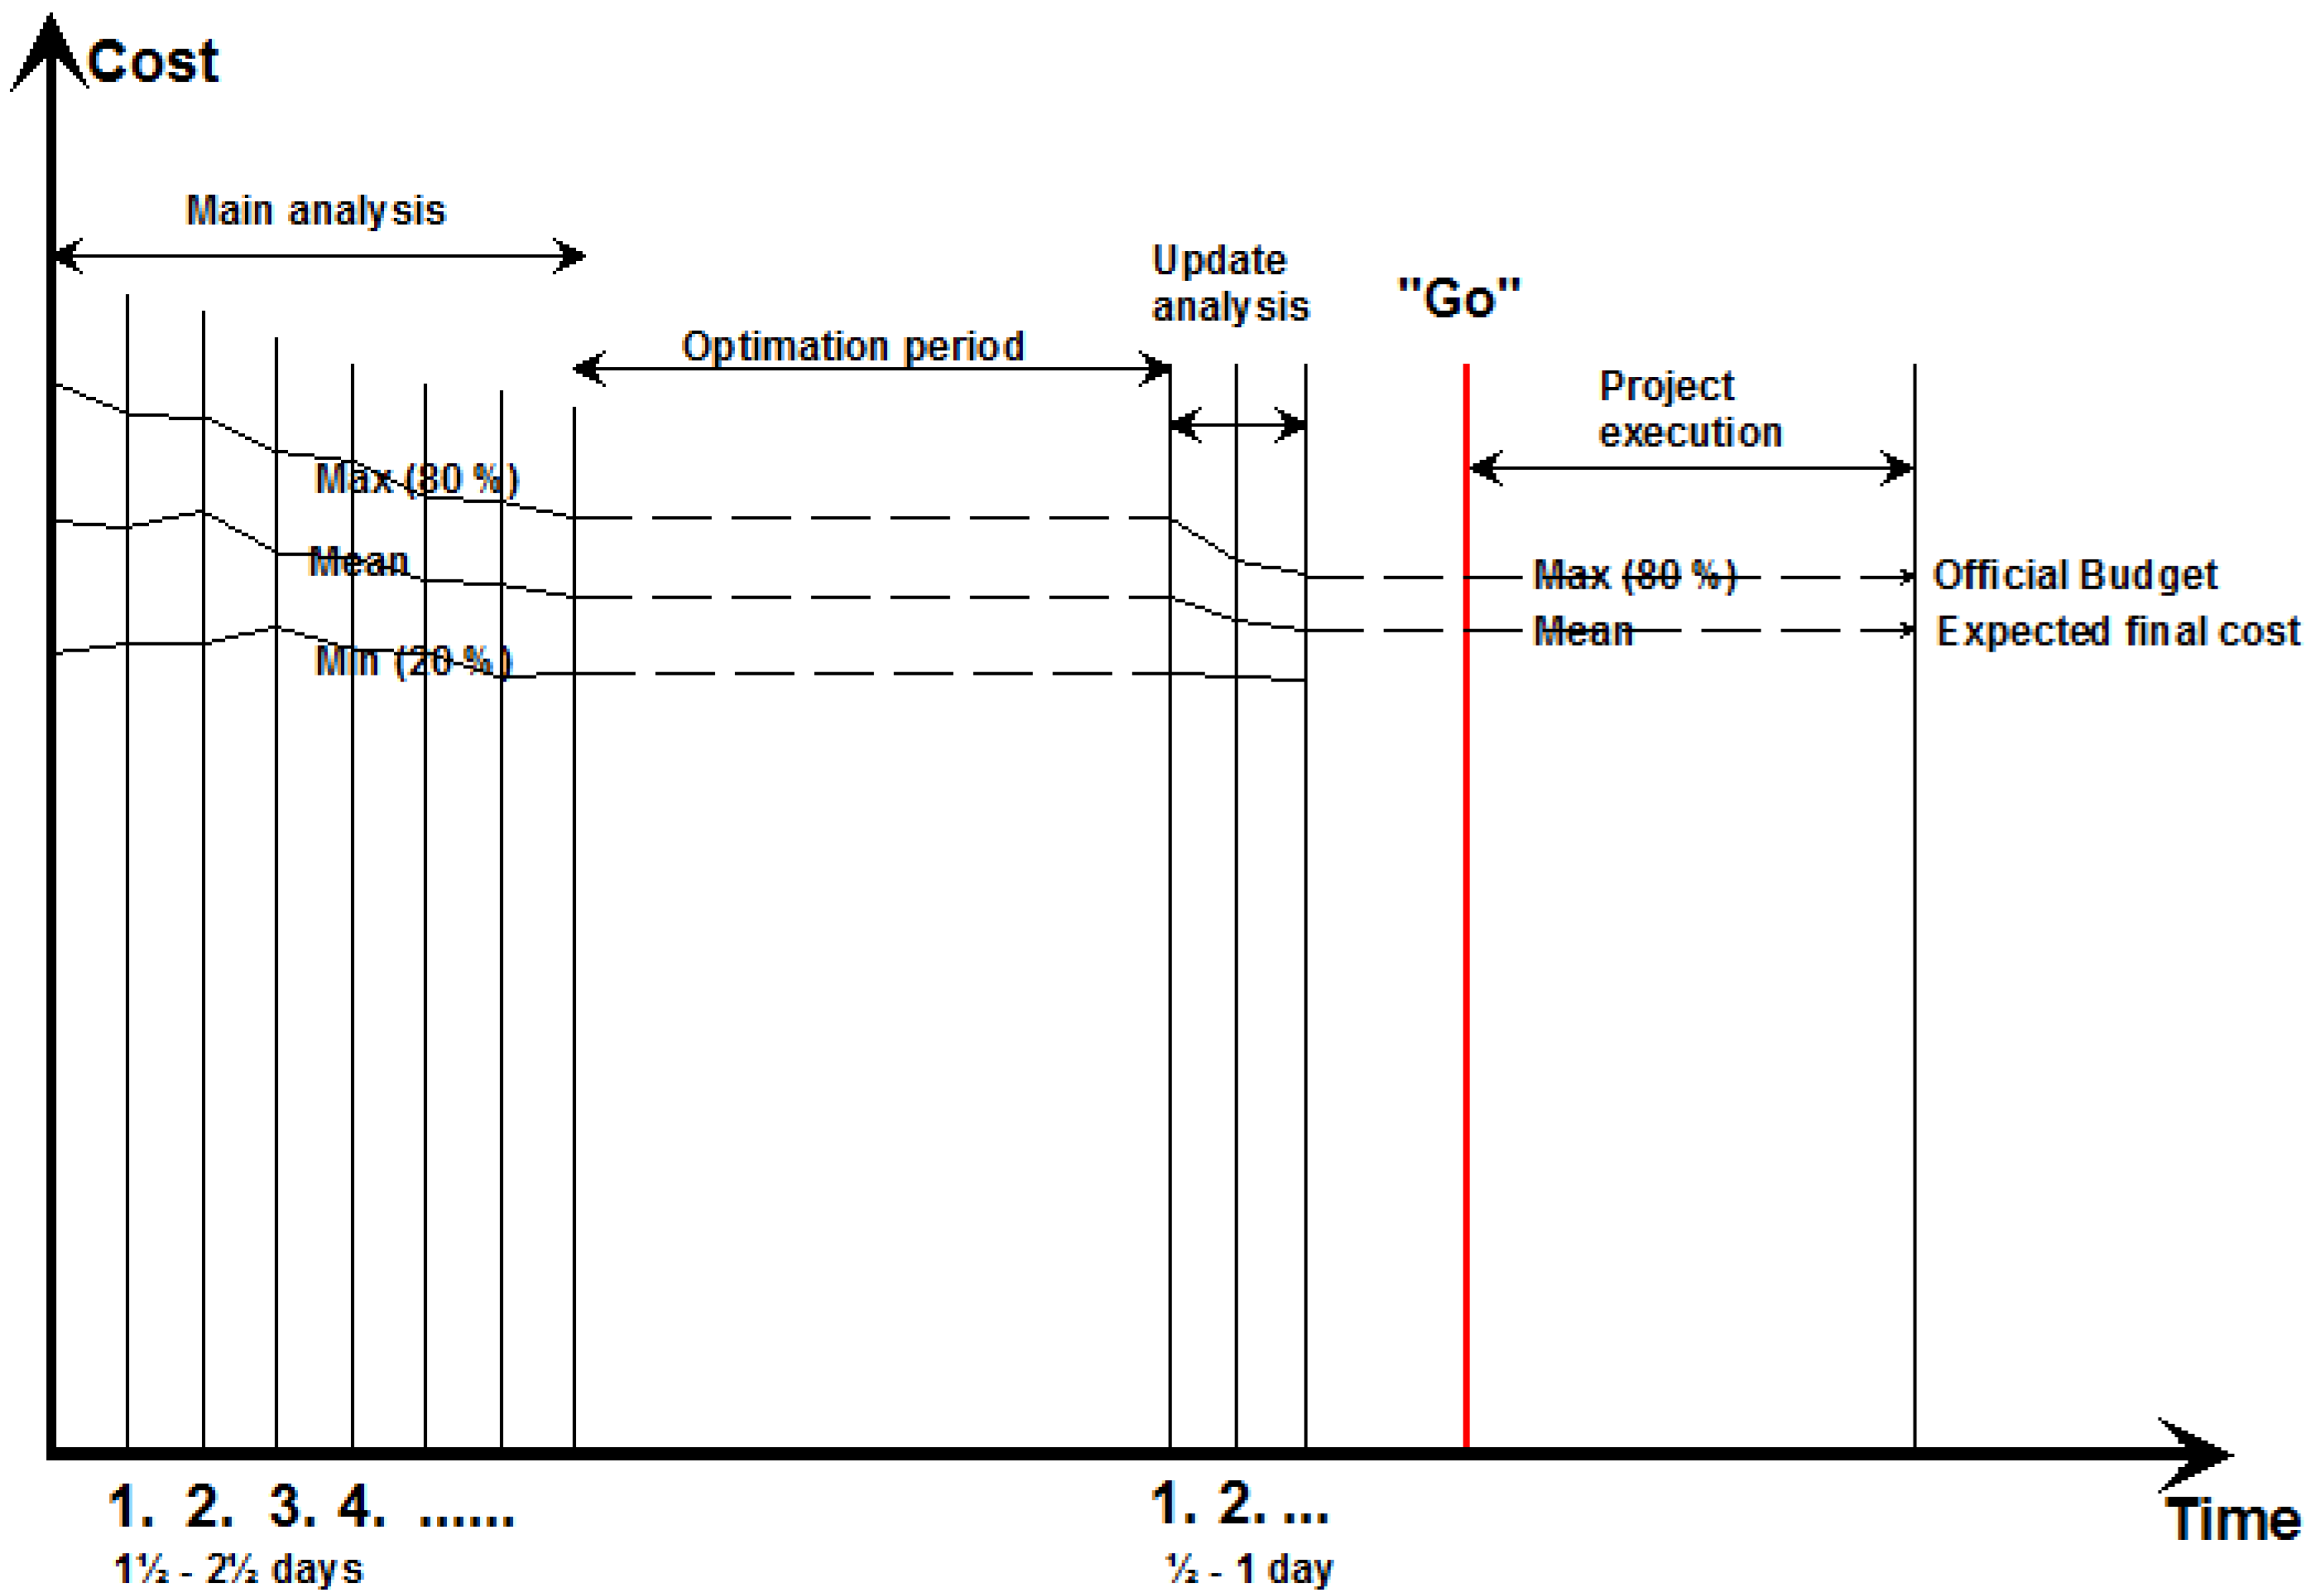
Figure 6.
Result from a series of test prognoses of the final costs of Danish motor road projects. The figure illustrates the actual project costs in proportion to the expected project cost (the mean value) from the analyses. The downward bars are savings compared with the predicted mean value, while the upward bars are overruns compared with the predicted mean value. For example, less than 10% means that the final cost was 10% lower than the analyzed mean value. The likely reason for the majority of savings is explained in the text (from Lichtenberg [18]).
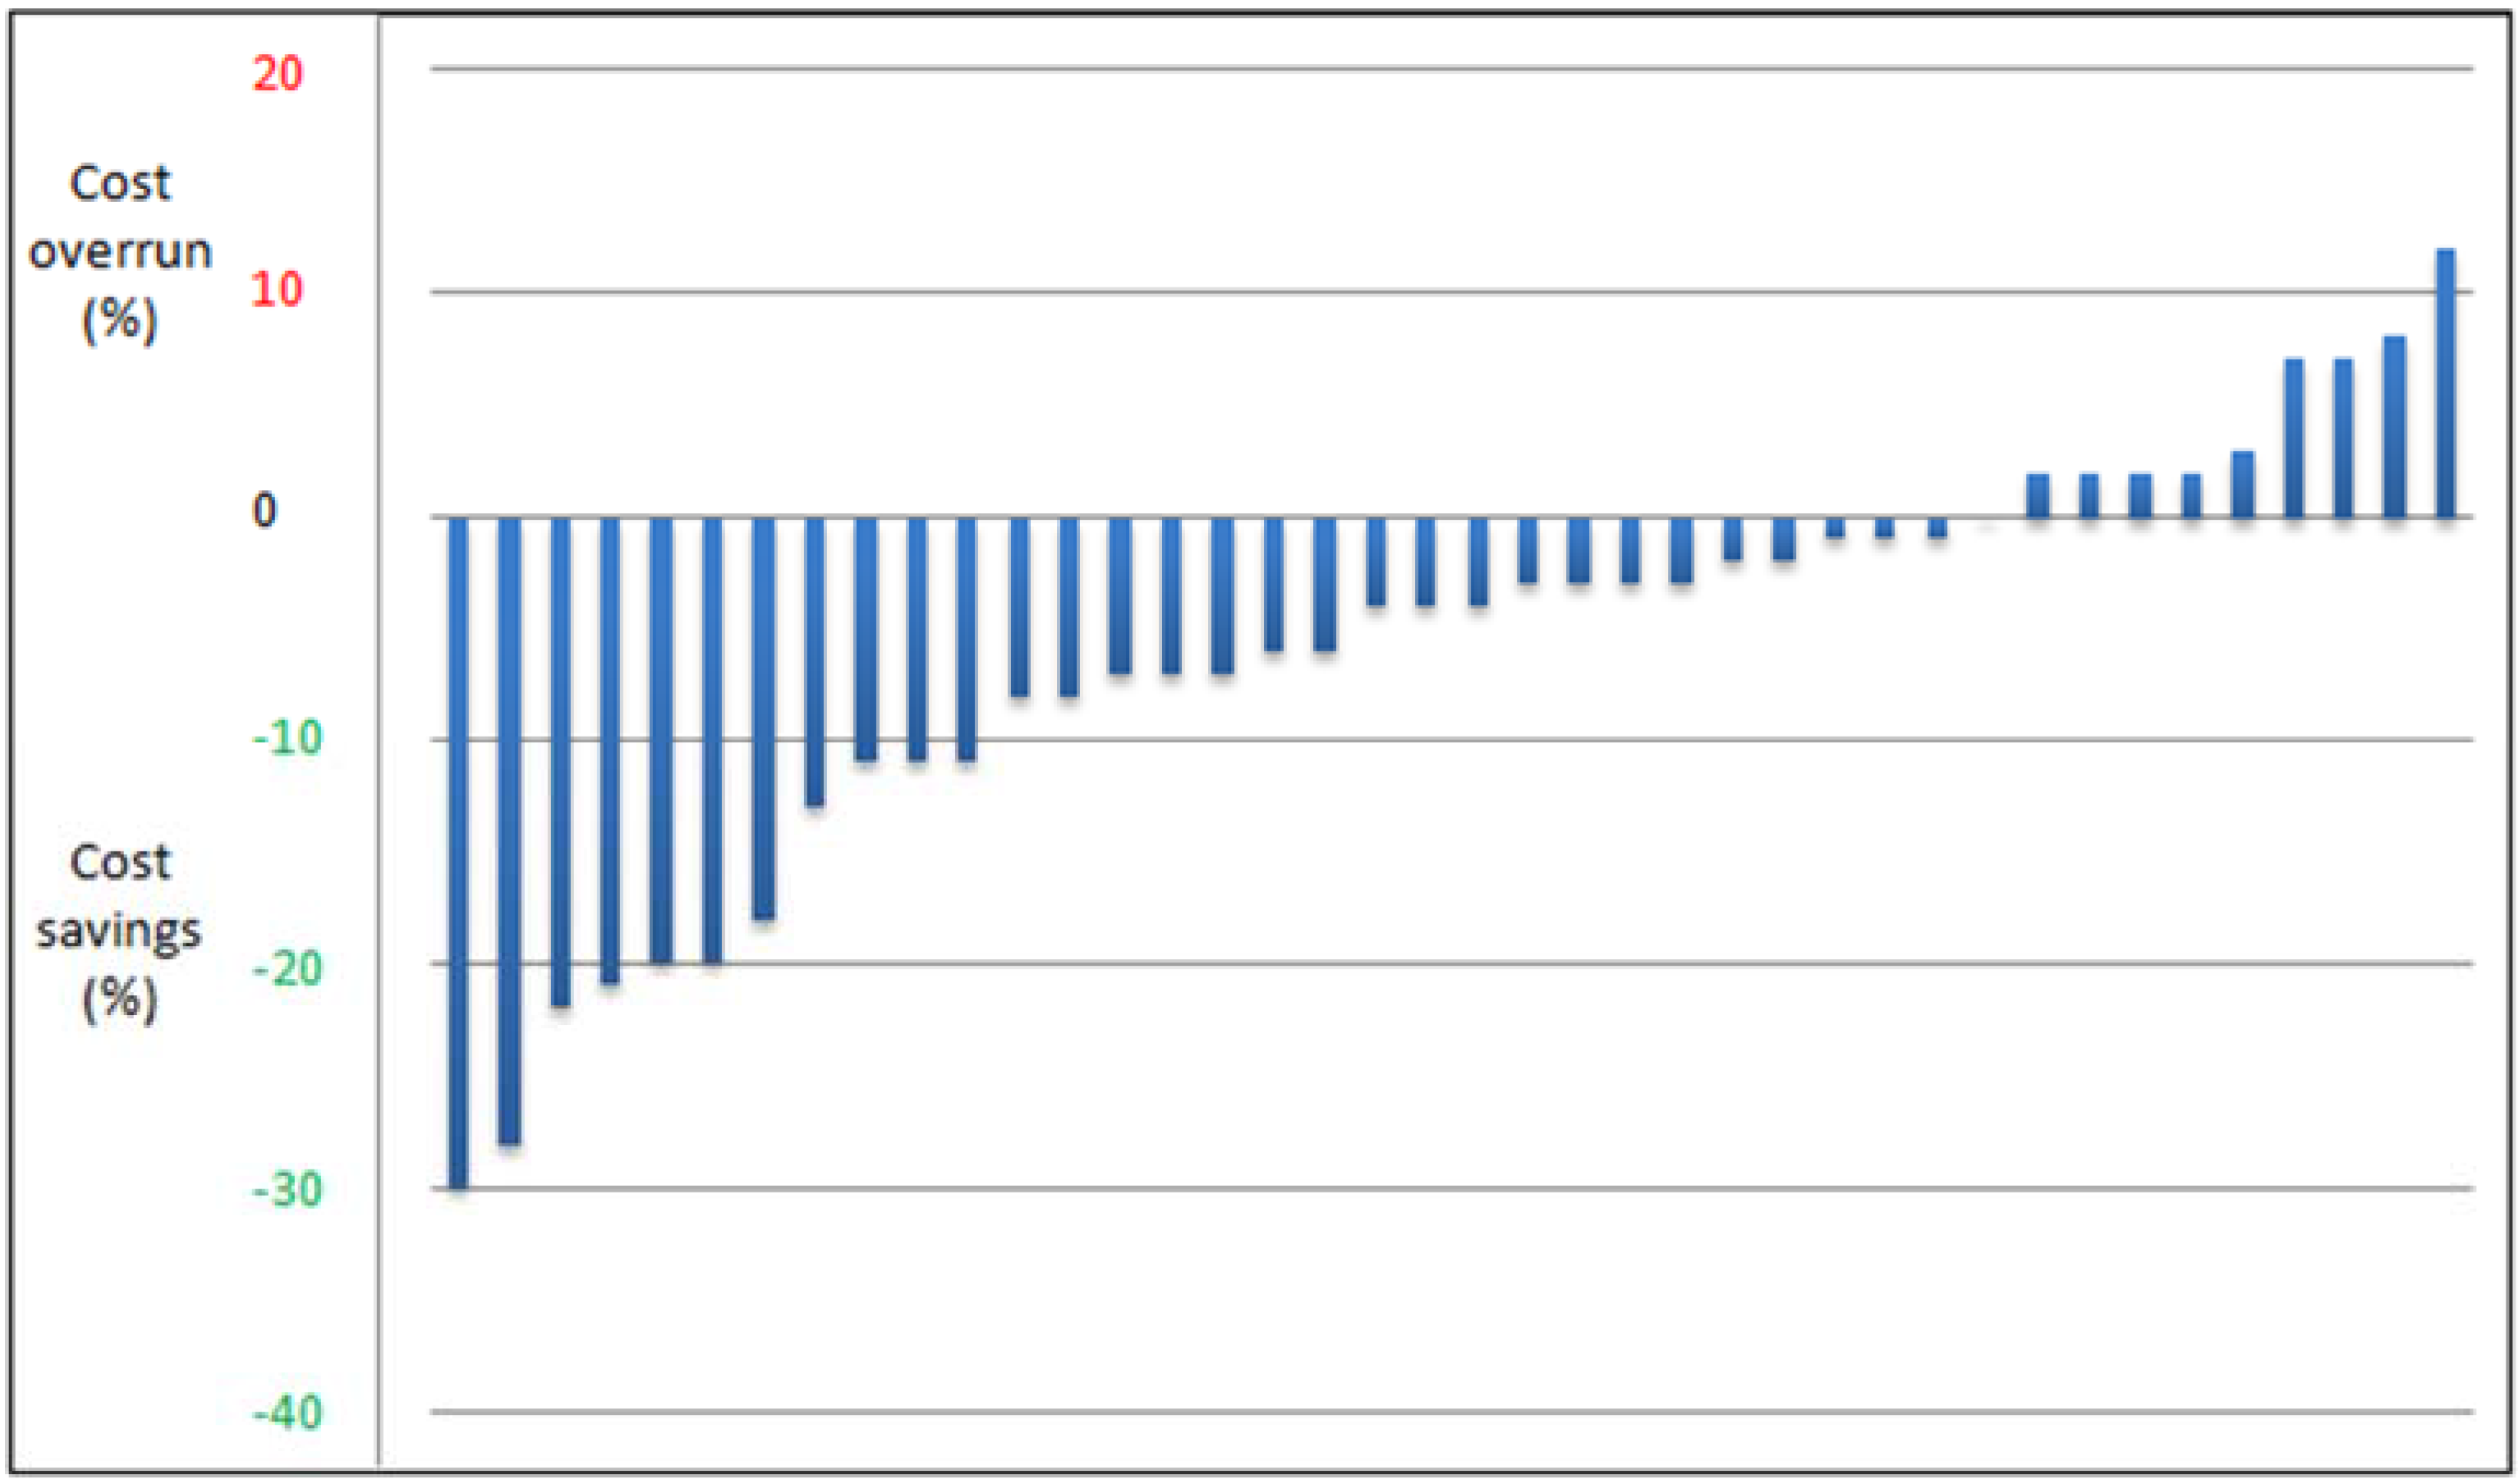
Figure 7.
The result of the budget quality audits of all large Norwegian finalized governmental projects qualified while using the Successive Principle from 2000 to 2013. The actual outcomes are compared with the agreed working budgets before execution started (as percent of actual cost). These budgets were typically close to the expected cost. The figures are taken from [19].
Figure 8.
The same large Norwegian projects as shown in Figure 7 illustrate here the actual final total project cost compared with the approved official budget. It is seen that 80% of these projects kept to the budget. This is well in agreement with the ambition for these Norwegian projects, but it is very different to international experiences, where cost overruns are commonplace. The figures are from [19].
© 2016 by the author; licensee MDPI, Basel, Switzerland. This article is an open access article distributed under the terms and conditions of the Creative Commons Attribution (CC-BY) license ( http://creativecommons.org/licenses/by/4.0/).
Share and Cite
MDPI and ACS Style
Lichtenberg, S. Successful Control of Major Project Budgets. Adm. Sci. 2016, 6, 8. https://doi.org/10.3390/admsci6030008
AMA Style
Lichtenberg S. Successful Control of Major Project Budgets. Administrative Sciences. 2016; 6(3):8. https://doi.org/10.3390/admsci6030008
Chicago/Turabian StyleLichtenberg, Steen. 2016. "Successful Control of Major Project Budgets" Administrative Sciences 6, no. 3: 8. https://doi.org/10.3390/admsci6030008
Note that from the first issue of 2016, this journal uses article numbers instead of page numbers. See further details here.