
Applying Biodiversity Metrics as Surrogates to a Habitat Conservation Plan


1
Center for Applied Spatial Ecology, Department of Fish, Wildlife, and Conservation Ecology, New Mexico Cooperative Fish and Wildlife Research Unit, New Mexico State University, Las Cruces, NM 88005, USA
2
Office of Research and Development, U.S. Environmental Protection Agency (Retired), Las Vegas, NV 89129, USA
3
Core Science Systems, U.S. Geological Survey, Raleigh, NC 27695, USA
*
Author to whom correspondence should be addressed.
Environments 2021, 8(8), 69; https://doi.org/10.3390/environments8080069
Submission received: 25 March 2021
/
Revised: 10 July 2021
/
Accepted: 20 July 2021
/
Published: 23 July 2021
Abstract
:Unabated urbanization has led to environmental degradation and subsequent biodiversity loss across the globe. As an outcome of unmitigated land use, multi-jurisdictional agencies have developed land use plans that attempt to protect threatened or endangered species across selected areas by which some trade-offs between harm to species and additional conservation approaches are allowed among the partnering organizations. Typical conservation plans can be created to focus on single or multiple species, and although they may protect a species or groups of species, they may not account for biodiversity or its protection across the given area. We applied an approach that clustered deductive habitat models for terrestrial vertebrates into metrics that serve as surrogates for biodiversity and relate to ecosystem services. In order to evaluate this process, we collaborated with the partnering agencies who are creating a Multi-Species Habitat Conservation Plan in southern California and compared it to the entire Mojave Desert Ecoregion. We focused on total terrestrial vertebrate species richness and taxon groupings representing amphibians, birds, mammals, and reptiles, and two special status species using the Normalized Index of Biodiversity (NIB). The conservation planning area had a lower NIB and was less species rich than the Mojave Desert Ecoregion, but the Mojave River riparian corridor had a higher NIB and was more species-rich, and while taxon analysis varied across the geographies, this pattern generally held. Additionally, we analyzed desert tortoise (Gopherus agassizii) and desert kit fox (Vulpes macrotis arsipus) as umbrella species and determined that both species are associated with increased NIB and large numbers of species for the conservation area. Our process provided the ability to incorporate value-added surrogate information into a formal land use planning process and used a metric, NIB, which allowed comparison of the various planning areas and geographic units. Although this process has been applied to Apple Valley, CA, and other geographies within the U.S., the approach has practical application for other global biodiversity initiatives.
1. Introduction
Unabated urbanization has led to environmental degradation and subsequent biodiversity loss across the globe [1]. Conservation biology began as a reaction to these emerging environmental challenges, using ecological principals and applying them to address species, communities, and ecosystems modified by human activities or natural causes [2,3]. The move to a more proactive, rather than reactive, effort has been a goal of the conservation community. There have been several notable conservation successes such as species removed from listing on the United States Endangered Species Act (ESA) and planning to inform habitat conservation versus development [4,5,6].
The ESA was enacted in 1973; the purpose of the ESA is to provide a means whereby the ecosystems upon which endangered and threatened species depend may be conserved. Moreover, it specifically prohibited the “take” of endangered species [7]. Congress added a provision (ESA Section 10(a)1(B)) in 1982 to recognize that take was not always counter to conservation. This provision allowed the agencies responsible for enforcing the ESA, i.e., Department of Interior’s (DOI) US Fish and Wildlife Services (USFWS) and National Oceanic and Atmospheric Administration’s (NOAA) National Marine Fisheries Service (NMFS), to issue permits for the incidental take of listed species in certain circumstances. Incidental take can occur during a lawful action when a take is attendant to that action [8]. To receive an incidental take permit, applicants must submit and have approved a habitat conservation plan (HCP) based on guidelines provided by USFWS and NMFS [9,10]. As a result, multi-jurisdictional agencies have developed land use plans that attempt to protect threatened or endangered species across a project area by which some trade-offs between harm to species and additional conservation approaches are allowed among the partnering organizations. HCPs have been created to focus on single or multiple species, i.e., Multiple Species Habitat Conservation Plan (MSHCP), and although they may protect a species or groups of species they typically do not account for biodiversity or its protection across the given area [11].
In 2000, the United Nation’s (UN) Secretary-General initiated the Millennium Ecosystem Assessment (MEA) [12], engaging 1360 experts worldwide. Their findings provide a state-of-the art scientific appraisal of the condition and trends in the world’s ecosystems and the services they provide. Everything within the MEA paradigm is viewed in terms of human experience and values. Humans are regarded as the central element or factor. These ecosystem services represent the fundamental outputs of a biophysical function or process that contribute, directly or indirectly, to human well-being including economy, health, and a sense of security [13]. The central premise of the MEA ecosystem services framework is that all forms of “Life on Earth”, i.e., biodiversity, provide the core benefits that humans derive from their environment.
Biodiversity has been defined as “the variability among living organisms from all sources including terrestrial, marine, and other aquatic ecosystems and the ecological complexes of which they are part” [14]. The term includes diversity among multiple levels of organization from genetics to species, between species, and within ecosystems [15]. Because of the complexity of biodiversity, measuring it as a single metric is difficult. The measurement of surrogates such as indicator species and groups of species has been used assuming there are relationships with unmeasured species [16]. Other direct measures focus on subsets of species, but without those assumptions. One measure often used is species richness (the number of different species in a given area) such as all terrestrial vertebrates, amphibians, birds, mammals, and reptiles, which is informative and can provide a baseline to analyze the value these species provide to humans [13,17,18]. Additionally, in some conservation practices, management actions which rely on one umbrella species are assumed to benefit other species that co-occur within the same habitat and range [19,20]. Thus, the umbrella species concept has been used as a surrogate for multi-species management focused on size and type of habitat to conserve [20], whereby the minimum area required by the umbrella species is nearly as comprehensive as the remaining planning area [21].
The citizens of the United States place considerable economic value on wildlife, not only based on actual spending for recreational activities, but also through investments by state, tribal, and federal governments and non-governmental organizations for conservation planning and easements. As early as 2013, Southwick Associates estimated the conservation economy contributed $93 USD billion to economic output, $41 billion to income, and $59.7 billion to the U.S. Gross Domestic Product [22]. Further analysis in 2017 by Hohensee et al. [23] calculated the total estimated annual economic benefit of terrestrial wildlife in the U.S. to be $346 billion. Based on the U.S. Bureau of Economic Analysis’ (BEA) macroeconomic and industry statistics, wildlife economics related to food, materials, recreation, and cultural and aesthetic goods and activities are generally comparable to the activity generated by traditional economic sectors such as agriculture, oil and gas, utilities, and computer and electronics. This BEA effort did not include aesthetic values such as wildlife art, festivals, museum visitation, photography, film, magazines, and television [23].
The U.S. Environmental Protection Agency (EPA) along with other federal, state, and non-governmental organizations created the online EnviroAtlas tool by identifying, creating and serving datasets to help characterize ecosystem services [24]. EnviroAtlas gives users the ability to view, analyze, and download geospatial data and other resources. The basic design and purpose of the EnviroAtlas is to inform decision-making, education, and research. Data within the EnviroAtlas are organized into seven ecosystem service benefit categories: clean air; clean and plentiful water; biodiversity conservation; food, fuel, and materials; natural hazard mitigation; climate stabilization; and recreation, culture, and aesthetics. Data include geospatial indicators and indices of ecosystem goods and services. The EnviroAtlas has analytic and interpretive tools to allow users to conduct analyses for one point in time based on based on all or parts of the geospatial data. The EnviroAtlas also highlights the connections among the natural resources that provide ecosystem goods and services, the benefits or beneficiaries, and the stressors that affect their provision by measuring and mapping ecosystem services for the conterminous U.S. at the 12-digit Hydrologic Unit Code (HUC) [25] resolution (~104 km2 in size on average).
The U.S. Geological Survey’s (USGS) Gap Analysis Project (GAP) provides data for regional and national analyses of terrestrial vertebrate species and plant species conservation status [18]. GAP is a long-term project created under the U.S. DOI designed to identify gaps in representation of biological diversity using a national land cover map, a national protected areas database, and species-specific deductive habitat models [18,26,27]. The project created species-level habitat models for amphibians, birds, mammals, and reptiles across the conterminous U.S. These models identify habitat suitability within the known range of the species and can be combined to identify potential species habitat richness including within national protected areas [28]. Boykin et al. [13] used GAP species habitat data and the EnviroAtlas approach to identify and test a suite of metrics that serve as proxies for biodiversity and represent several wildlife related ecosystem service endpoints in the Southwest United States. The effort was expanded to the national level based on the 1590 individual GAP habitat species models and 26 national biodiversity metrics which were developed for the conterminous U.S. to reflect aspects of biodiversity conservation; food, fiber, and materials; and recreation, culture, and aesthetics, or their combination (Table 1). These data provide the ability to compare sites at multiple scales anywhere within the conterminous U.S. and to be used in decision-making processes.
The Town of Apple Valley and San Bernardino County, California, are preparing a MSHCP and Natural Community Conservation Plan (NCCP) to address impacts of local development to natural communities and federal and state listed species for the next 30 years. The NCCP is the state component of the overall plan and addresses the state requirements for take under the California Endangered Species Act (CESA) [29]. The process covering this planning is based on USFWS guidance [9], however the Apple Valley MSHCP has yet to be finalized [30]. The MSHCP intent is to protect natural resources while allowing economic growth and orderly build-out of the town and county. The MSHCP seeks to establish a landscape-scale conservation approach versus requiring project-by-project mitigation. Implementation of the MSCHP can minimize and mitigate for impacts to sensitive species and natural communities and provide one-stop assessment for project approval and receipt of environmental permits at the local level. MSHCPs are developed in collaboration with agencies such as the USFWS, California Department of Fish and Wildlife (CDFW), and U.S. Bureau of Land Management (BLM). The Apple Valley MSHCP includes a “Linkage Design” that will help connect the management of 6.5 million acres of state, private, and federal lands designated for conservation. The Apple Valley MSHCP proposes to conserve and manage the lands within this aggregate. The MSHCP purpose is to protect quality of life, including biodiversity, and environmental and scenic values for future generations. The delineated MHSCP area has four finer scale planning area zones (PAZs) including the Urban Core, Rural Development Area, the Desert Linkages, and the Mojave River Corridor.
Boykin et al. [13] developed an approach to produce quantitative biodiversity habitat metrics and maps from the USGS GAP deductive habitat models in collaboration with the EPA EnviroAtlas [13,18]. The purpose of the approach was to allow analysis for place-based (e.g., MSHCP), regional, and national assessments to measure and track changes in the environment and biodiversity. These biodiversity metrics provide indicators, such as species richness, that relate to ecosystem service categories of biodiversity, recreation, and food resource endpoints which are also listed as specific benefit categories in the EPA EnviroAtlas.
This case study was designed to test the efficacy and efficiency of incorporating biodiversity metrics with a real-world application of conservation planning. The objectives of this research were to determine the validity of using value-added biodiversity metrics to provide enhanced analysis for a known geography of key biodiversity interest, i.e., the Apple Valley MSHCP. The analysis was performed in two stages. First, by analyzing the Apple Valley MSHCP area and the Apple Valley PAZs, i.e., Urban Core and Rural Development Areas, Desert Linkages, and Mojave River Corridor, in comparison to the entire Mojave Desert Ecoregion (MDE) in terms of biodiversity metrics. The second objective was to compare biodiversity metrics to two potential umbrella species covered under the MSCHP (desert tortoise and desert kit fox) and evaluate the ability of these two species to provide full protection to the land-use planning area.

Table 1.
National biodiversity metrics that reflect (A) biodiversity conservation; (B) food, fiber, and materials; and (C) recreation, culture, and aesthetics [31]. Also see additional descriptive information about each metric in the associated EnviroAtlas Fact Sheet (https://www.epa.gov/enviroatlas/enviroatlas-fact-sheets accessed on 25 March 2021).
| Type | Metric | Description |
|---|---|---|
| Taxa Richness | Total Terrestrial Vertebrate Richness (A, C) | Total terrestrial vertebrate species (amphibians, birds, mammals, reptiles; n = 1590) as measured by modeled habitat present within a pixel in the conterminous U.S. |
| Total Mammal Richness (A) | All mammals (n = 365) as measured by modeled habitat present within a pixel in the conterminous U.S. | |
| Total Reptile Richness (A) | All reptiles (n = 322) as measured by modeled habitat present within a pixel in the conterminous U.S. | |
| Total Amphibian Richness (A) | All amphibians (n = 282) as measured by modeled habitat present within a pixel in the conterminous U.S. | |
| Total Bird Richness (A, C) | All birds (n = 621) as measured by modeled habitat present within a pixel in the conterminous U.S. | |
| Winter Bird Richness (A, C) | All bird (n = 621) as measured by modeled winter habitat present within a pixel in the conterminous U.S. | |
| Summer Bird Richness (A, C) | All birds (n = 621) as measured by modeled summer habitat present within a pixel in the conterminous U.S. | |
| Harvestable | Total Harvestable Species Richness (B, C) | All Species (n = 186) regulated by State Wildlife Agencies as measured by modeled habitat present within a pixel in the conterminous U.S. |
| Total Big Game Species Richness (B, C) | Big Game Species (n = 18) regulated by State Wildlife Agencies as measured by modeled habitat present within a pixel in the conterminous U.S. | |
| Total Small Game Species Richness (B, C) | Small Game (n = 121) and Upland Game Species regulated by State Wildlife Agencies as measured by modeled habitat present within a pixel in the conterminous U.S. | |
| Furbearer Species Richness (B, C) | Furbearing Species (n = 37) regulated by State Wildlife Agencies as measured by modeled habitat present within a pixel in the conterminous U.S. | |
| Waterfowl Species Richness (B, C) | Waterfowl Species (n = 48) regulated by Federal/State Wildlife Agencies as measured by modeled habitat present within a pixel in the conterminous U.S. | |
| Rare Species | Rarity Index; Total Terrestrial Vertebrates (A) | Number of terrestrial species (n = 399) with the lowest quartile of modeled habitat area within the conterminous U.S. |
| Rarity Index; Total Mammals (A) | Number of mammal species (n = 92) with the lowest quartile of modeled habitat area within the conterminous U.S. | |
| Rarity Index; Total Reptiles (A) | Number of reptile species (n = 82) with the lowest quartile of modeled habitat area within the conterminous U.S. | |
| Rarity Index; Total Amphibians (A) | Number of amphibian species (n = 72) with the lowest quartile of modeled habitat area within the conterminous U.S. | |
| Rarity Index; Total Birds (A) | Number of bird species (n = 156) with the lowest quartile of modeled habitat area within the conterminous U.S. | |
| Conservation Lists | T & E Terrestrial Vertebrate Richness (A, C) | Species (n = 52) listed as Federally Threatened or Endangered under the Endangered Species Act (7) as measured by modeled habitat present within a pixel in the conterminous U.S. |
| Global Rank Species Richness; G1, G2, and G3 (A) | Species listed G1, G2, G3 by NatureServe (n = 244) as measured by modeled habitat present within a pixel in the conterminous U.S. G1-critically imperiled; G2–imperiled; G3-vulnerable | |
| IUCN Threatened Terrestrial Vertebrate Species Richness (A) | Species listed as Endangered (n = 40) by the IUCN (International Union for Conservation of Nature) as measured by modeled habitat present within a pixel in the conterminous U.S. | |
| Audubon Climate-endangered Bird Species Richness (A) | Species listed as Climate-Endangered (n = 122) as referenced by Audubon and measured by modeled habitat present within a pixel in the conterminous U.S. | |
| Audubon Climate-threatened Bird Species Richness (A) | Species listed as Climate-Threatened (n = 182) as referenced by Audubon and measured by modeled habitat present within a pixel in the conterminous U.S. | |
| Partners in Flight Watch List Species Richness (A, C) | Species listed by Partners in Flight Watch List (n = 80) as measured by modeled habitat present within a pixel in the conterminous U.S. | |
| Birds of Conservation Concern Species Richness; State of the Birds 2016 (A, C) | Species listed as Conservation Concern in State of the Birds 2016 (n = 117) as measured by modeled habitat present within a pixel in the conterminous U.S. | |
| Common Birds in Steep Decline (A, C) | Species listed by Partners in Flight as common bird species in deep decline (n = 25) as measured by modeled habitat present within a pixel in the conterminous U.S. | |
| Partners in Amphibian and Reptile Conservation (PARC) Species Richness (A) | Species listed as either T&E, G1-G3 or IUCN (n = 167) as measured by modeled habitat present within a pixel in the conterminous U.S. |
2. Materials and Methods
2.1. Study Area
The Apple Valley MSHCP/NCCP (hereafter “Plan”) is a multi-jurisdictional area located within the high desert of San Bernardino County, the largest county in the United States. Stakeholders in the study area include federal (35,059 hectares), state (2973 hectares), county (32,068 hectares), private and town (19,084 hectares), and utilities and other special districts (1990 hectares). Additionally, the Plan provides landscape-level linkages that connect over 2.6 million hectares of existing conservation areas within the MDE (Figure 1).
2.2. Landscape-Level Linkages
The Town of Apple Valley has proposed a landscape-level linkage conservation strategy [30]. The purpose is to connect large open areas of natural habitat to adjacent open spaces or habitat areas. The effort delineated the overall Plan area comprised of the following PAZs: the urban core and rural development area (Development), a desert linkages zone (Linkages), and a Mojave River corridor zone (Corridor). The desert linkages identified connect the Plan Development Zone to the San Bernardino National Forest to the south and to three desert tortoise critical habitat units to the east and north. The Corridor is an important riparian area within the surrounding arid environment. The river area includes designated critical habitat for southwest willow flycatcher (Empidonax traillii extimus), one of the nine proposed covered species. The proposed covered species are not limited to the Plan area, so the Plan proposes to conserve and manage linkage areas that connect to the Plan’s boundaries. The intent of the MSHCP conservation strategy is to protect identified habitat within, and to maintain the functional values of, the Plan’s Linkage Design (i.e., its conservation areas). Additionally, the MSHCP/NCCP has identified Linkage Extension Areas outside of its Plan Boundaries for future conservation planning. Once fully conserved, the linkage system identified by the Plan will connect 6.5 million acres of federal lands designated for conservation. We obtained spatial data layers for the Plan boundaries, Corridor, and Linkages from the Town of Apple Valley.
2.3. Covered Species
The proposed species covered by the Apple Valley MSHCP include five birds, two mammals, one reptile, and one plant (Table 2). The federal status of species ranges from BLM-sensitive and status under review to endangered or protected under other federal legislation such as the Migratory Bird Treaty Act of 1918 [32]. The CDFW state status of these species ranged from species of special concern to endangered. One species (desert tortoise) was identified as vulnerable, and the other species were listed as least concern by the International Union of Conservation of Nature (IUCN) red list [33].
2.4. Biodiversity Metrics
GAP habitat models (1590 spp.) for the conterminous U.S. are top-down deductive models based on expert opinion, literature, and wildlife habitat relationships [18]. These data use predictive environmental variables (e.g., land cover, elevation, and distance to water) to derive habitat models for each species. These national models are in geotiff format and include 621 birds, 365 mammals, 322 reptiles, and 282 amphibians for the conterminous U.S. They were derived through a partnership between the USGS GAP, New Mexico State University, North Carolina State University, Boise State University, and EPA (EnviroAtlas). Previously, similar deductive habitat models were shown to have ≥60% concordance with actual habitat features on the ground [34]. In addition to habitat models, GAP created Land Ownership (PAD-US) and GAP Land Cover products [18,28,35,36].
Boykin et al. [13] used species richness, or number of species per pixel, to identify and create metrics that represent either biodiversity or some ecosystem service. These datasets spatially combined all 1590 species-level models or subsets of these datasets to create richness maps at a moderate spatial resolution (30 m). Derived datasets included total terrestrial vertebrate species and four major taxonomic classes: mammals, birds, reptiles, and amphibians. Additionally, species lists reflecting other important subsets were derived and metrics created that are associated with taxa richness (winter, summer birds), harvestable species, rare species, and conservation importance (Table 1). These datasets allow analysis across the conterminous U.S. As the GAP habitat models remove areas without suitable habitat (non-habitat) within known range of the species, the patterns of richness are more refined than coarse-resolution species habitat distribution models discussed in the literature [37]. These models are created from mapped datasets associated with suitable habitat; thus, these datasets provide for analysis of biodiversity, change at ecosystem and landscape scales, and alternative futures.
The 26 national biodiversity metrics (Table 1) are useful indicators of the potential for providing three broad classes of ecosystem services: biodiversity conservation; food, fiber, and materials; and recreation, culture, and aesthetics, or their combination [38]. The metrics were reviewed by peers from state, federal, county agencies, tribes, and non-governmental organizations. Reviews and comments were solicited from scientistic peers via numerous domestic and international meetings in addition to a peer reviewed National Biodiversity Metrics and Mapping Workshop before finalizing the final metrics [38].
2.5. Desert Tortoise and Desert Kit Fox
The desert tortoise (Gopherus agassizii) and desert kit fox (Vulpes macrotis arsipus) were identified by the MSHCP team as proposed covered species of conservation interest for further assessment. Both species are wide ranging species within the MDE and have been identified as being umbrella species [39,40]. We used the individual species models for both species developed by GAP [18] to evaluate their efficacy as a conservation tool in comparison to the biodiversity metrics for the designated Plan area.
2.6. Analysis
We computed biodiversity metric values for each of the major terrestrial vertebrate taxonomic groups for four conservation zones and two specific species. The four conservation zones were the Urban Core and the Rural Development Area (Development Zone), the Apple Valley Desert Linkages zone (Linkages), Mojave River corridor zone (Corridor), and the entire MDE. The two specific species were the desert tortoise and desert kit fox (habitat vs. non-habitat). We used the Mojave Basin and Range ecoregion dataset available from the EPA [41]. We conducted all spatial analyses using ArcGIS Pro 2.4 [42] and calculated statistics using the ArcGIS Zonal Statistics Tool for each zone including the mean, standard deviation, minimum, and maximum number of species. Zonal statistic calculations are based on all grid cell values within each zone. We also calculated the Normalized Index of Biodiversity (NIB) for the MDE [13]. The NIB provides a value to facilitate comparison of metric values between study areas. NIB normalizes the mean value for each metric for a given study geography relative to the maximum value among all pixels in a reference geography, in this case the MDE. Thus, the NIB metric values ranged from 0 to 1. We then calculated the Zone:MDE ratio by dividing the mean species for each zone by the mean species for the entire MDE. Values greater than 1 indicated the zones were more species rich than the MDE and values below 1 indicate the zone is less species rich.
3. Results
Habitat for 329 terrestrial vertebrate species was modeled in the Apple Valley study area, including 196 birds, 75 mammals, 51 reptiles, and 7 amphibians. The Plan area (134,161 hectares) represents 1% of the MDE (12,773,240 hectares). The three PAZs represent smaller proportions with the Development zone (45,343 hectares), the Linkages zone covering 44,101 hectares, and the Corridor zone the smallest at 560 hectares.
3.1. Apple Valley in Context
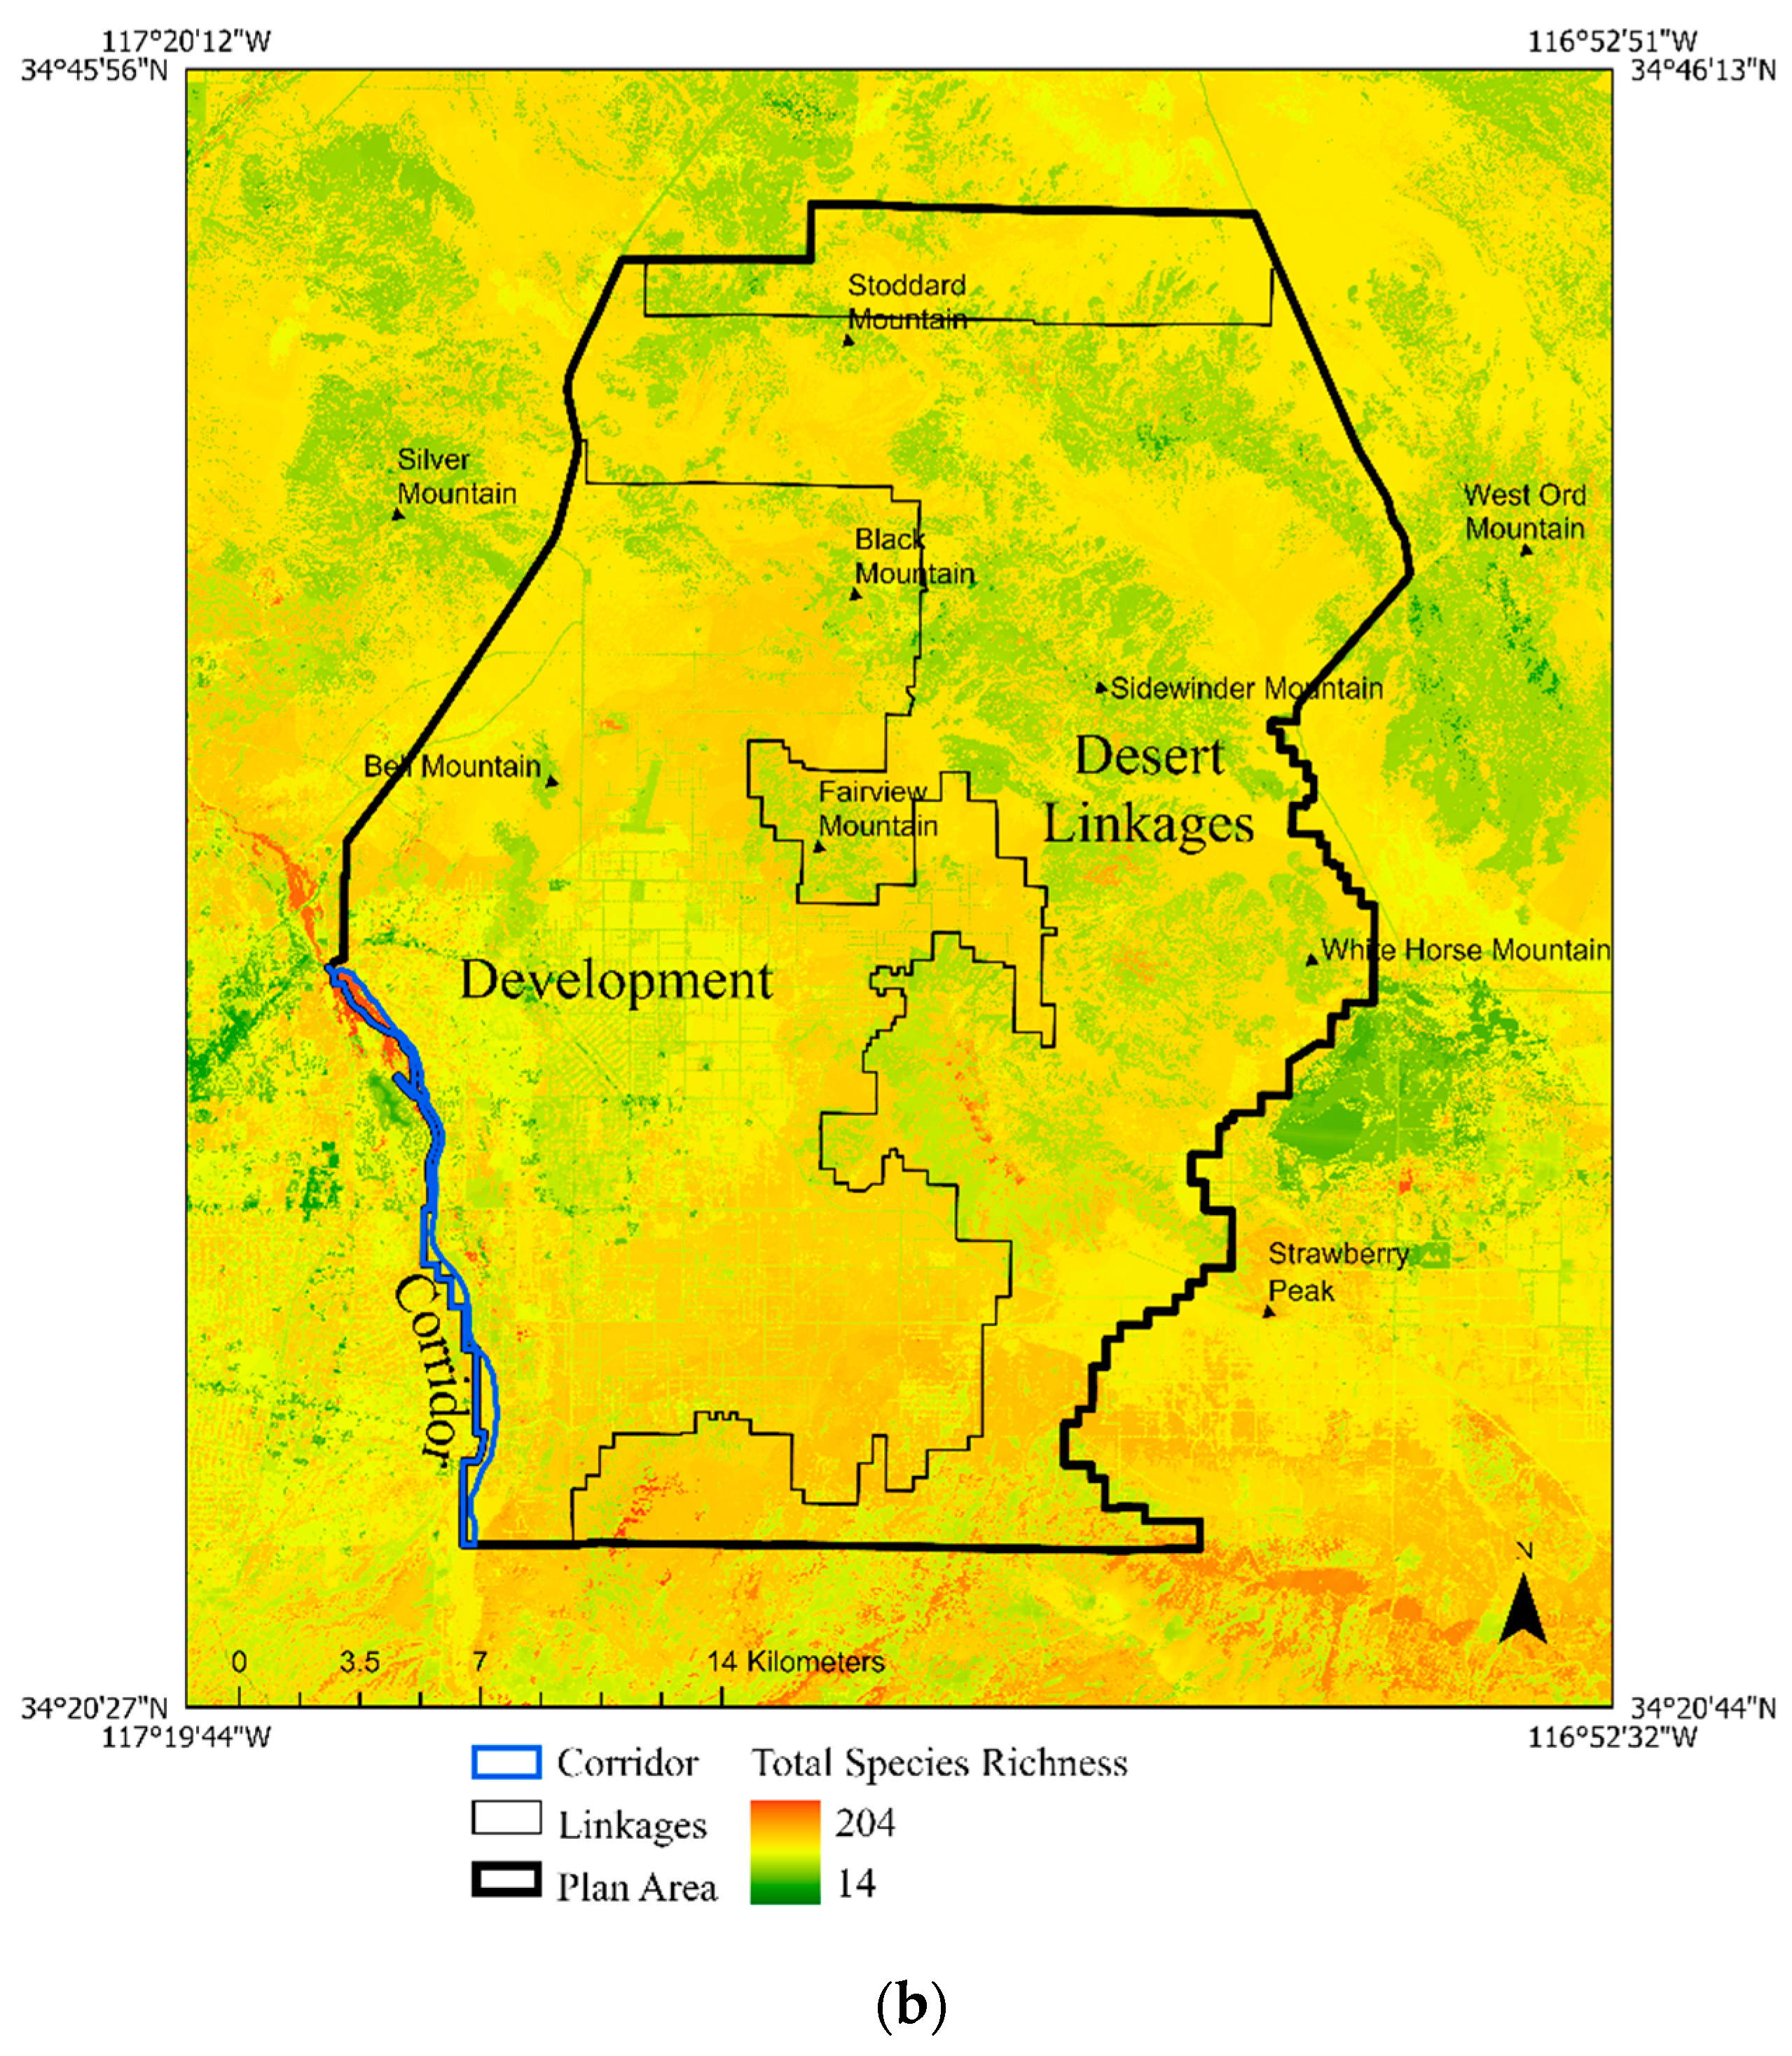
Total species richness is higher in the eastern part of San Bernardino County than the western area where the Plan area is located (Figure 2). Total vertebrate species richness had a high of 175 species/pixel within the Plan area and a high of 204 species/pixel within the entire MDE (Table 3). The NIBTotal provides values for the comparison between areas and identified that the Corridor (0.54) had a higher NIB than the MDE (0.48). The Development (0.47) and Linkages (0.45) were similar and slightly below the MDE. The Corridor zone is typical of species-rich riparian areas in the Southwest U.S. [43] and represents less than 1.0% of the Plan area. The Corridor has higher mean total species richness than the other two zones (mean 109.7; CorridorTotal: MDETotal = 1.12). The Development zone is slightly lower in mean richness than the MDE (DevelopmentTotal: MDETotal = 0.99; Table 3). The Linkages zone was the least rich (mean = 91.2; LinkageTotal: MDETotal = 0.93).
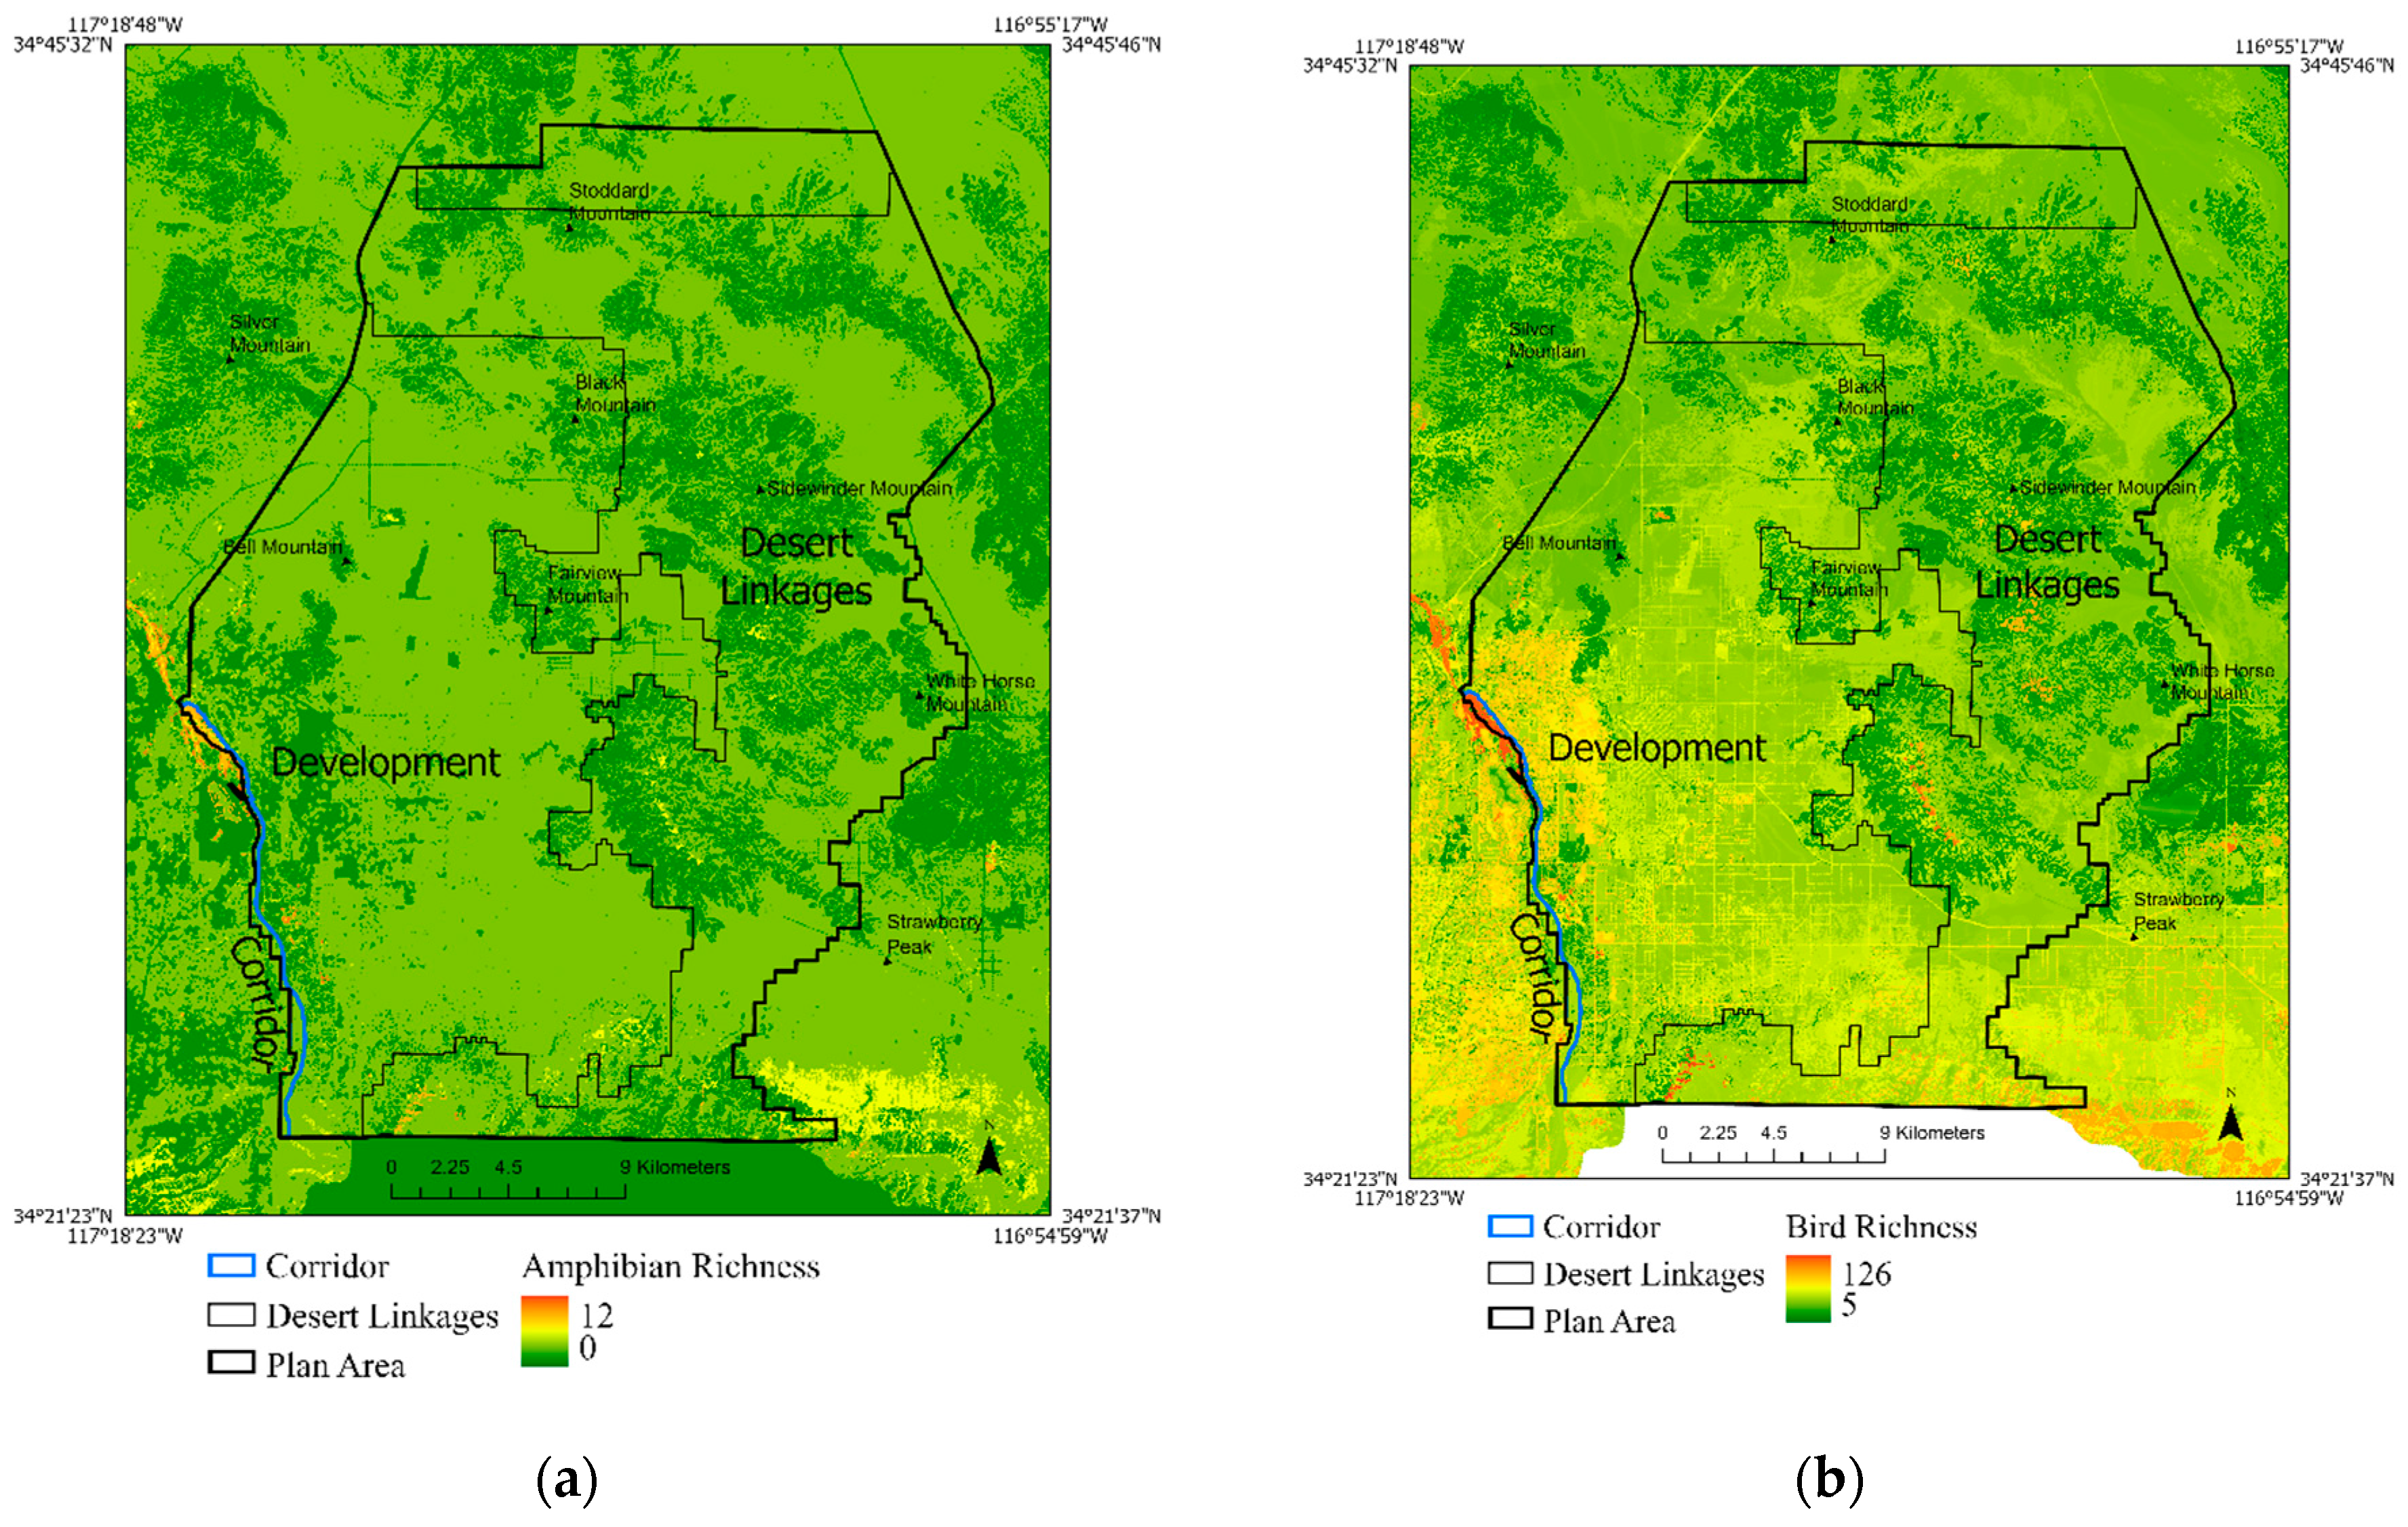
Birds were the most numerous taxa and ranged up to 95 species/pixel. Bird species richness (Figure 3b) was also highest along the Corridor and in the eastern Linkages area near mountain summits. NIBBird was the highest in the Corridor (0.40) with decreasing values in the MDE (0.32), Development (0.32), and Linkages (0.27). The MDE, Development, and Linkages zones were similar. The Corridor was the most species-rich zone (mean 50.5. CorridorBirds: MDEBirds = 1.26). The MDE was richer (mean = 40.2) than the Development zone, and the Development zone (mean = 40.1; DevelopmentBirds: MDEBirds = 1.0) was richer than the Linkages (mean = 34.5; Linkagebirds MDEBirds = 0.86).
All zones had similar means of mammal species (Development mean = 29.9; MDE mean = 31.0) with a high of 46 species/pixel (Table 3). NIBMammal was similar for all zones and the MDE with values ranging from 0.53 (Development) to 0.55 (Corridor and MDE). The highest mammal species richness (Figure 3c) was located directly north, east, and south of the Town of Apple Valley (Urban Core) in the Development area. The Zone:MDE index ranged from 0.96 (DevelopmentMammals) to 1.00 (MDEMammals).
For reptiles, means ranged from 25.1 (MDE) to 27.1 (Corridor). The highest reptile species richness (Figure 3d) was located in the lowland areas directly north, east, and south of the Town of Apple Valley (Urban Core) in the Development and Linkages zones. Small areas in the MDE had up to 44 species compared to 36 within the Development area. NIBReptile identified the highest value in the Corridor (0.62) with decreasing values in Linkages (0.59), Development (0.58), and MDE (0.57). All areas within the study area had higher Zone: MDE indices (CorridorReptiles = 1.08) than the MDE (1.00).
Amphibian species richness was low in each of the zones and MDE analyzed ranging from 0–4 species/pixel (Table 3). High amphibian species richness (Figure 3a) was along the perennial reaches of the Mojave River within the Corridor. NIBAmph was highest in MDE (0.13), with decreasing values in the Corridor (0.11), Development (0.07), and Linkages (0.05). The MDE is more species rich than just the Development zone (DevelopmentAmphib: MDEAmphib = 0.56). The Corridor had higher amphibian species richness when compared to the other Apple Valley geographic zones (mean 1.3. CorridorAmphib: MDEAmphib = 0.83). The Linkages area was the least rich (mean = 0.7; LinkageAmphib: MDEAmphib = 0.43).
3.2. Desert Tortoise and Desert Kit Fox
Modeled suitable habitat for the desert tortoise was identified on 66.1% (8,436,915 hectares) of the MDE compared to 33.9% (4,336,331 hectares) without habitat. Similarly, modeled habitat for the desert tortoise occurred on 68.4% (61,569 hectares) of the Plan Area compared to 31.6% (28,433 hectares) without habitat. The desert tortoise habitat covers almost the entire lowland area of the planning area apart from urban and agricultural areas and road conveyances. GAP Modeled habitat for the desert kit fox was identified on 72.2% (9,220,673 hectares) of the MDE compared to 27.8% (3,552,573 hectares) without modeled habitat. Modeled habitat for the desert kit fox was identified on 68.9% (62,047 hectares) of the Plan Area compared to 31.1% (27,956 hectares) without modeled habitat. The desert kit fox has similar overall coverage but can occupy different habitats throughout the study area and Linkages area.
The desert tortoise and desert kit fox have been identified as umbrella species [39,40]. Our analysis found their modeled habitat is pervasive across the Plan area and thus their habitat across the entire MDE nearly covers the co-existence of almost all other species associated with the study area (Figure 4).
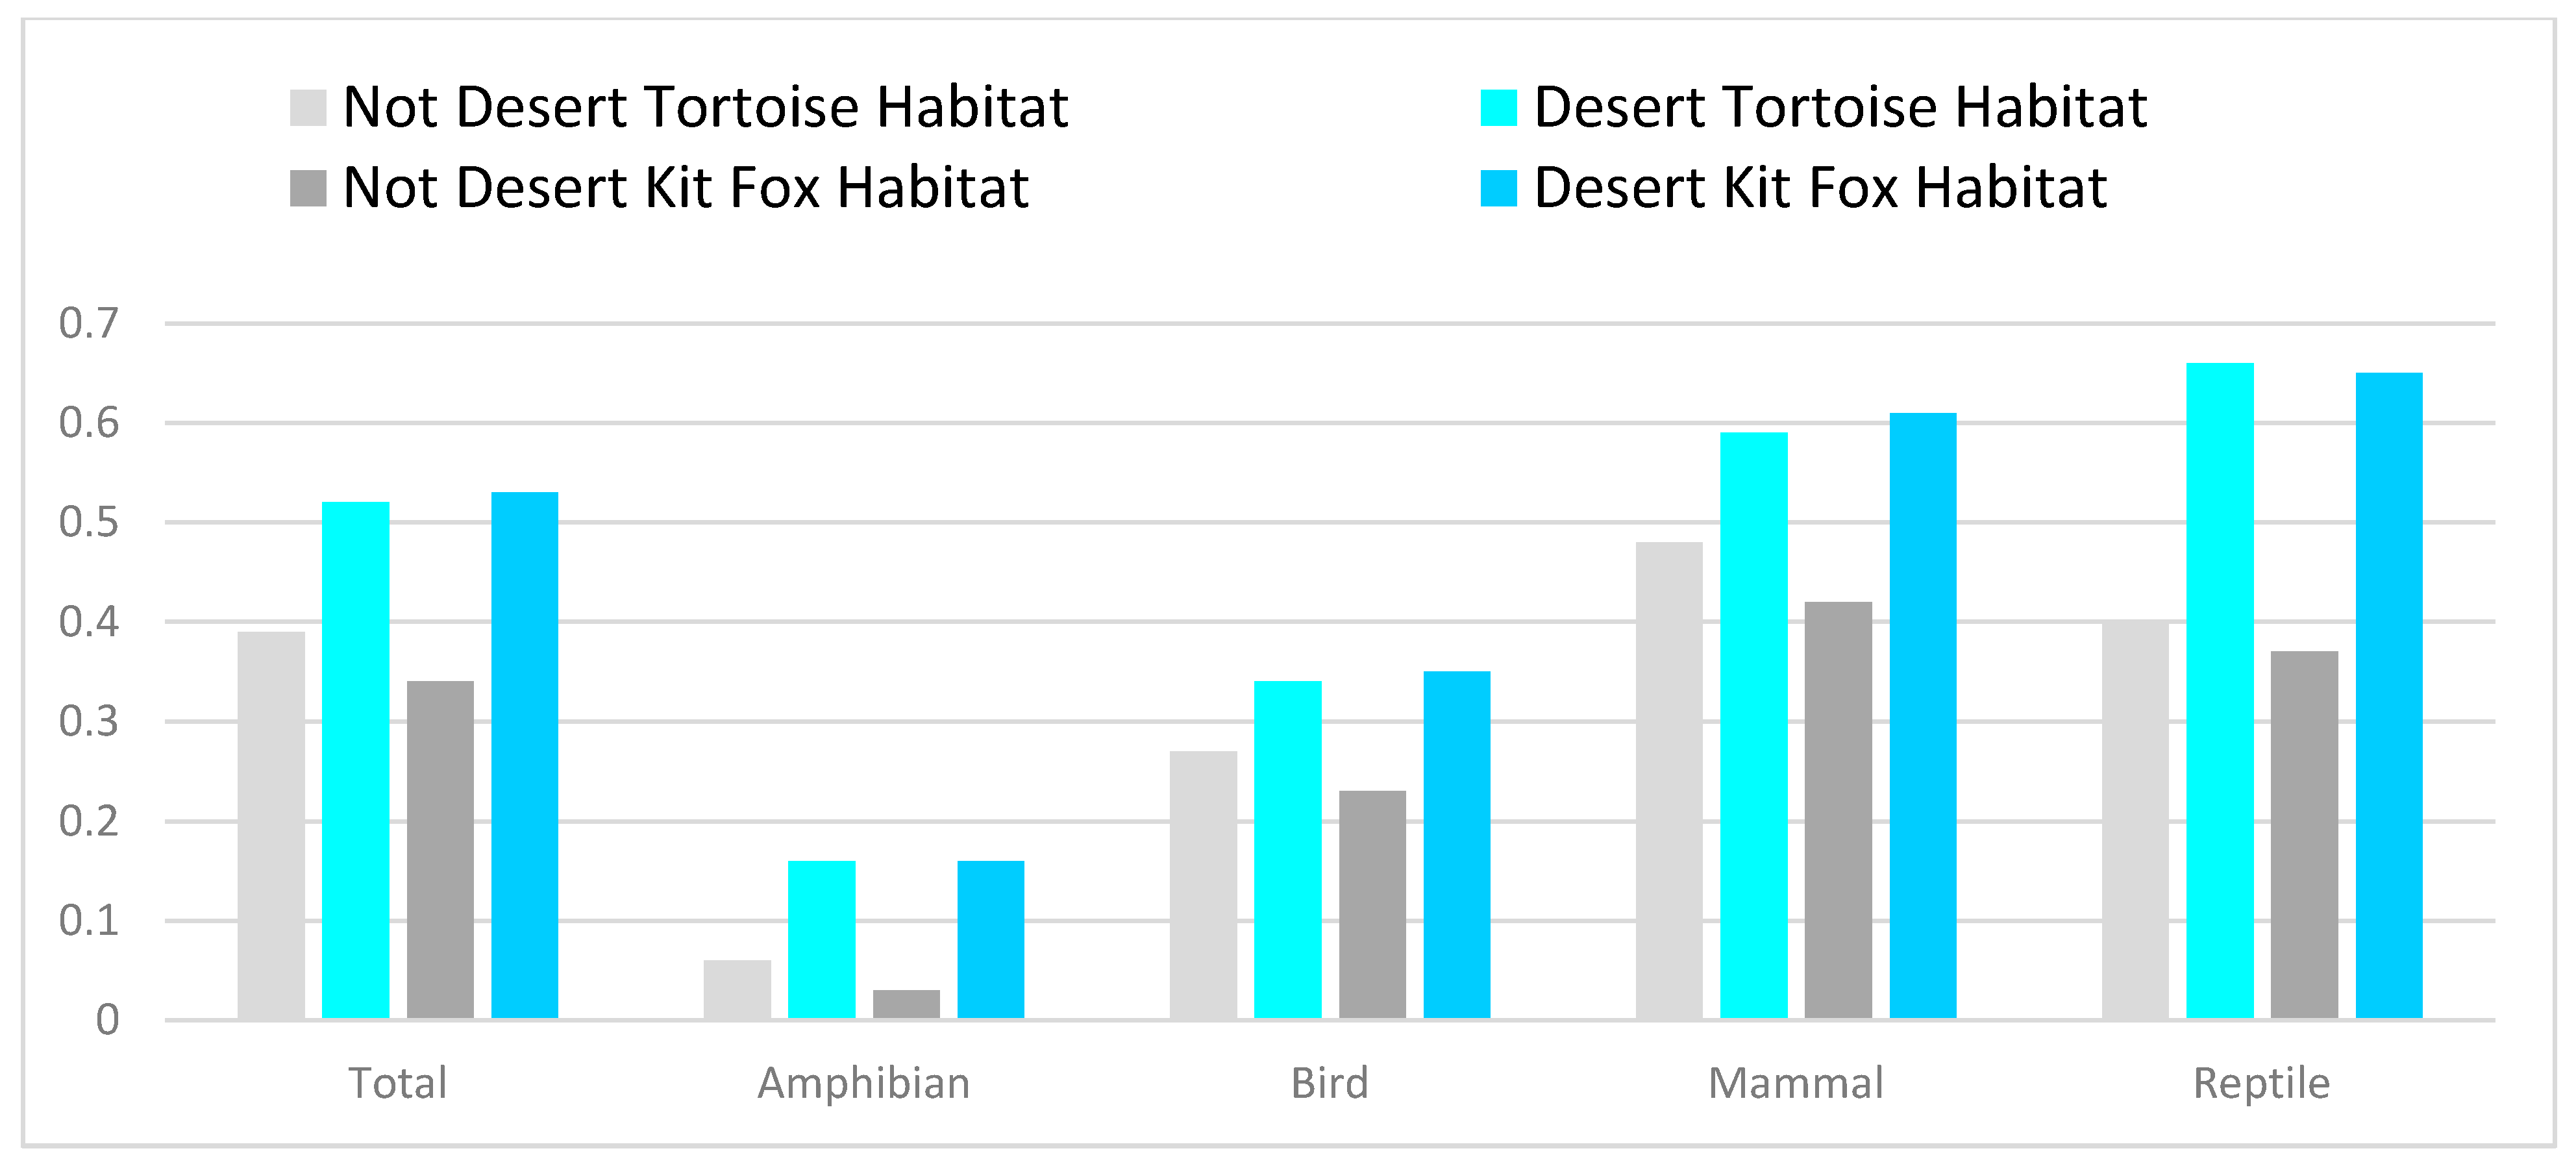
The Normalized Index of Biodiversity allows comparisons between areas and between metrics [13]. The NIB was higher in the areas with habitat for desert tortoise habitats and desert kit fox (Figure 5; Table 4). This pattern was observed with all the biodiversity metrics. Similar patterns were observed at both the MDE and Plan area (Table 4) with areas of desert tortoise or desert kit fox habitat having higher NIB than areas of non-habitat.
Comparison of species richness between desert tortoise habitat and non-habitat consistently yielded higher richness within desert tortoise habitat. For example, total species richness within the MDE averaged 107 species per pixel for desert tortoise habitat and 80 species per pixel without habitat (Table 4). Specific to the Apple Valley MSHCP Plan area, this comparison yielded higher richness in areas of desert tortoise habitat (mean = 104.8) than non-habitat (mean = 70.4) (Table 4). Similarly, for desert kit fox, total species richness averaged 108.9 species per pixel on desert kit fox habitat and 69.2 species without habitat. Within the Plan area, desert kit fox had an average of 104.6 species/pixel and non-habitat had 70.3 species/pixel. For desert kit fox, the habitat is similar to that of the desert tortoise, though a few different model variables are identified throughout the Plan area (Figure 4). Fox habitat included higher elevations and corresponding vegetation types such as woodlands and chaparral.
4. Discussion
This case study was designed to test the efficacy and efficiency of incorporating biodiversity metrics into conservation planning. We used biodiversity metrics previously created from the USGS Gap Analysis Project and the EPA’s EnviroAtlas [13] to test metric application specifically to the Apple Valley Multi-Species Habitat Conservation Plan. Using five biodiversity metrics, i.e., total terrestrial vertebrate, mammal, bird, reptile, and amphibian species richness, we analyzed the Apple Valley PAZs in relation to the entire MDE. We then compared these biodiversity metrics to habitat for two species (desert tortoise and desert kit fox) proposed to be covered within the MSHCP.
Comparison of biodiversity metrics in the Apple Valley PAZs including Development zone (Urban Core and Rural Development Areas), Linkages zone, and Corridor zone varied in relation to the entire MDE. NIB values for the Corridor were consistently higher than the MDE, while Development and Linkage areas were lower than the MDE. This analysis indicates that the Development and Linkage zones were less species-rich and biodiverse than the MDE as a whole and the Corridor was more species rich and biodiverse for total, bird, and amphibian metrics. This was not the case with the mammal and reptile metrics. NIB for each PAZ and MDE were similar for mammals. For reptiles, the PAZs were all higher in NIB than the MDE. Total richness was influenced by bird richness providing a high richness in the Corridor that is typical of southwestern riparian habitats even with the limited spatial representation [44].
Taxa specific outcomes varied. There was high bird species richness along the Corridor and greater richness in a few of the higher mountains (Black Mountain, and Sidewinder Mountain) in the eastern Linkages zone. Riparian areas are often focal areas as they provide water, structure, and cover [44]. Mammal species richness was similar across all zones, including the MDE. There was increased mammal species richness directly north, east, and south of the Town of Apple Valley in the Development zone. For reptiles, species richness was similar within the MSHCP geographies and slightly higher than the MDE as a whole. Increased reptile species richness was identified in the lowland areas directly north, east, and south of the Town of Apple Valley located in the Development and Linkages zones. Reptiles are well suited to the dry desert climate of the MDE. Amphibians are rare in desert regions because of the taxa’s life history requirements combined with ambient arid conditions. The MDE was slightly more species rich than the Development zone but numbers were low. The ranges of many amphibians within the MDE are peripheral to the Plan area. The few amphibians modeled in the Plan area were largely associated along the perennial reaches of the Mojave River (Corridor).
Only small differences were observed between metrics in the Development and Linkage zones and in some cases, the Development zone values were higher than the Linkage. These similarities are associated with similar habitats and the proximity of both zones. Except for the limited mountains, the habitat is largely associated with desert scrub. The differences, if any, between the zones may be associated with proximity of the Development zone to the more species rich corridor area.
The second objective was to compare biodiversity metrics to two species covered under the Plan (desert tortoise and desert kit fox) and evaluate their ability to provide full protection to the land use planning area. The desert tortoise and desert kit fox are wide ranging species within the MDE and are often identified as being umbrella species [39,40], a species with habitat requirements that are also important for many other species [20]. Desert tortoise use arid areas, particularly creosote bush shrublands with loamy soils while avoiding stony substrates and areas of low plant cover [45,46]. This is the only proposed covered species by the MSHCP listed as vulnerable on the IUCN list (Table 2). The desert kit fox uses open grassland, scrublands, deserts, and salt flats [40,46]. These habitat features are widespread across the study area and the MDE in general. Our analysis supports the umbrella concept for these species: areas with either tortoise or kit fox habitat were also associated with large numbers of species. This was not just limited to either taxon conspecifics for each species, but for richness across all taxa groups and total richness.
Previous mapping efforts of desert tortoise habitat have identified critical habitat [47] or modeled tortoise species distribution using inductive modeling [48]. Critical habitat was identified adjacent to the project area but was not identified within the area. The species distribution model identified similar areas as the GAP habitat model, though it was done at a much coarser resolution. These distribution models identify suitable habitat, both within and outside the Plan area, that could be protected to maintain species.
We used the Normalized Index of Biodiversity to compare areas and metrics [13]. Our findings are consistent with the intended purpose of the Plan’s Linkage Design to support biodiversity including the Corridor. Species richness was higher in the Corridor compared to the entire MDE and the Development and Linkages zones. Other studies [49,50] have used habitats or land cover types to indicate biodiversity, which could provide further context to our analysis. A focus on desert tortoise and/or desert kit fox, species with large area requirements, should benefit not only those species, but afford protection for a high number of other species that share the same habitat, thus allowing the Plan approach of using covered surrogate species for making conservation-related decisions and a simpler way to manage ecological communities [19,20,21]. Overall, the analysis is consistent with the intended purpose of the Plan for both covered species and common species.
A powerful aspect of GAP data is that it allows the ability to conduct analysis on all terrestrial vertebrate species within any geography within the conterminous U.S., and within habitat of other species such as umbrella species. Species can be selected that are identified by decision-makers and comparisons made between individual species or subsets of species. Additionally, the richness of individual land cover types can also be used as an analysis element [27]. Further, this provides the ability to assess species complementarity within study areas or geographic regions [51]. As in all models, errors can exist within the GAP habitat models [34]. Errors in individual models may be lessened because of the summation of multiple species models in creation of metrics. GAP data and mixed combinations of national biodiversity metrics have been used at multiple scales to inform decision-making from counties such as Clark County, Nevada [52] to watersheds including the South Platte, CO and Upper Rio Grande, NM [17,53] to nationwide [18,28]. The analysis can inform decisions, but care and thoughtful application is required at the implementation stage.
The ecosystem services paradigm is a useful organizing framework for characterizing and assessing biodiversity conservation. Along with the deductive modeling, it provides great utility for mapping and quantifying metrics of biodiversity conservation at multiple scales and within a reasonable timeframe [13,17,53]. In this effort, we characterized three specific conservation zones in regard to a habitat conservation plan. We worked with the decision-makers to focus our effort on layers that were deemed important to the specific effort. As the Plan is still in process, we only used our five basic richness layers in this case, but we have the ability to analyze an additional 21 metrics should the need arise (Table 1). The ability to focus on any specific species was also important in this specific case. The EnviroAtlas can allow users to quickly review similar information [24], though the analysis is better conducted in a Geographic Information Systems platform.
Historically, conservation focused on specific species or specific geographies, i.e., forest management plans, resource management plans, and habitat conservation plans. Data are now available to understand those species and their habitats in context of larger regions and with surrogates for biodiversity. These analyses provide a greater understanding of the overall system for the decision makers. These analyses with the understanding of the value of biodiversity, both in ecological and economic terms, can provide an important step forward in conservation in the context of urbanization [12,13,23,24].
5. Conclusions
Our analysis provides ecological context for the Apple Valley MSHCP. Decision-makers were interested in understanding how the five specific metrics (total vertebrate, amphibian, bird, mammal, and reptile species richness) used would reflect the importance of the area within the larger Mojave region. Our analysis provides the context for all three study area zones (Development, Linkages, and Corridor) within the larger Mojave Desert Ecoregion. Our approach incorporates built-in extensibility so that as other metrics are identified or if alternative plans are developed, they can be explored and added to the system. For the Apple Valley MSHCP, our analysis was able to efficiently identify how each of our biodiversity metrics were related to the proposed MSHCP landscapes and provide additional information beyond the few covered species within the Plan. This provides an expanded analysis to identify any further potential conflicts in species conservation within the area.
The analysis described in this paper provides baseline or reference condition for considering and comparing alternative future scenarios (e.g., climate change, urbanization, and trend analysis). It also establishes common sense indicators of ecosystem services for national, regional, tribal, and local end user and decision-maker needs. It is flexible enough to add and test new metrics as they are identified and can now be undertaken anywhere within the conterminous U.S.
Although this process has been applied to Apple Valley and other geographies within the U.S., the approach has practical application for other global biodiversity initiatives, such as the Intergovernmental Science-Policy Platform on Biodiversity and Ecosystem Services (IPBES). IPBES, for example, is designed to provide consistent indicators that can relate science and policy for the purpose of conducting periodic assessments of biodiversity and ecosystem services at global, regional, and subregional scales [54]. The approach and metrics (Table 1) utilized for the Apple Valley MSHCP could equally be applied to other non-U.S. geographies providing that common technology and spatial datasets (e.g., species distribution models and digital land cover), in addition to local expertise, are available to organize the data into relevant functional groups (biodiversity metrics) using stakeholder involvement.
Author Contributions
Conceptualization, K.G.B. and W.G.K.; methodology, K.G.B. and W.G.K.; software, K.G.B.; formal analysis, K.G.B., W.G.K. and A.J.M.; investigation, K.G.B., W.G.K. and A.J.M.; resources, K.G.B., W.G.K. and A.J.M.; data curation, K.G.B.; writing—original draft preparation, K.G.B. and W.G.K.; writing—review and editing, K.G.B., W.G.K. and A.J.M.; visualization, K.G.B. and W.G.K.; project administration, K.G.B., W.G.K. and A.J.M.; funding acquisition, K.G.B., W.G.K. and A.J.M. All authors have read and agreed to the published version of the manuscript.
Funding
This research was funded in part by the U.S. Geological Survey’s Science Synthesis, Analysis and Research Program through the New Mexico Cooperative Research Unit under Research Work Order (G14AC00104 and G19AC00374) and the U.S. Environmental Protection Agency (EPA) through its Office of Research and Development Interagency Agreement (DW-14 95827201). Additional financial assistance was provided by the USGS New Mexico Cooperative Fish and Wildlife Research Unit and the New Mexico State University, Agricultural Experiment Station.
Institutional Review Board Statement
Not Applicable.
Data Availability Statement
Publicly available datasets were analyzed in this study. The individual species models used to generate the richness for this manuscript are available at https://gapanalysis.usgs.gov/apps/species-data-download/ (accessed on 21 July 2021) and through the science base repository (https://doi.org/10.5066/F7V122T2) (accessed on 21 July 2021).
Acknowledgments
We would like to acknowledge the Town of Apple Valley and Solutions Strategies International, Inc. for input into this work and their work on the MSHCP, particularly Heidi Brannon and Lori Lamson. Any errors or misinterpretations remain the responsibility of the authors. We thank three anonymous reviewers for additional comments. We would like to acknowledge those individuals that worked on previous research efforts to create and compile the datasets used in the present study including personnel associated with the Southwest Regional Gap Analysis Project, Southeast Regional Gap Analysis Project, Northwest Regional Gap Analysis Project, EPA EnviroAtlas, and National Gap Analysis Project. Any use of trade, firm, or product names is for descriptive purposes only and does not imply endorsement by the U.S. Government.
Conflicts of Interest
The authors declare no conflict of interest. The funders had no role in the design of the study; in the collection, analyses, or interpretation of data; in the writing of the manuscript; or in the decision to publish the results.
References
- McDonald, R.I.; Marcotullio, P.J.; Güneralp, B. Urbanization and global trends in biodiversity and ecosystem services. In Urbanization, Biodiversity and Ecosystem Services: Challenges and Opportunities; Springer: Dordrecht, The Netherlands, 2013; pp. 31–52. [Google Scholar]
- Soulé, M.E. What Is Conservation Biology? BioScience 1985, 35, 727–734. [Google Scholar]
- National Research Council. Perspectives on Biodiversity: Valuing Its Role in an Everchanging World; National Academies Press: Cambridge, MA, USA, 1999; ISBN 0-309-06581-X.
- Rodgers, K.; Willcox, A.; Willcox, E. Common Influences on the Success of Habitat Conservation Planning under the Endangered Species Act. Hum. Dimens. Wildl. 2017, 22, 438–453. [Google Scholar] [CrossRef]
- Harris, J.B.C.; Reid, J.L.; Scheffers, B.R.; Wanger, T.C.; Sodhi, N.S.; Fordham, D.A.; Brook, B.W. Conserving Imperiled Species: A Comparison of the IUCN Red List and US Endangered Species Act. Conserv. Lett. 2012, 5, 64–72. [Google Scholar] [CrossRef]
- Kareiva, P.; Marvier, M. What Is Conservation Science? BioScience 2012, 62, 962–969. [Google Scholar] [CrossRef]
- Endangered Species Act. 16 United States Code, §§1534–1544. 1973.
- Underwood, J.G. Combining Landscape-Level Conservation Planning and Biodiversity Offset Programs: A Case Study. Environ. Manag. 2011, 47, 121–129. [Google Scholar] [CrossRef]
- US Fish and Wildlife Service. Habitat Conservation Planning and Incidental Take Permit Processing Handbook; USFWS and National Marine Fisheries Service: Washington, DC, USA, 1996.
- US Fish and Wildlife Service and National Marine Fisheries Service (NMFS). Habitat Conservation Planning and Incidental Take Permit Processing Handbook; US Fish and Wildlife Service and National Marine Fisheries Service: Washington, DC, USA, 2016.
- Rahn, M.E.; Doremus, H.; Diffendorfer, J. Species Coverage in Multispecies Habitat Conservation Plans: Where’s the Science? BioScience 2006, 56, 613–619. [Google Scholar] [CrossRef] [Green Version]
- Millennium Ecosystem Assessment (Program) (Ed.) Ecosystems and Human Well-Being: Synthesis; Island Press: Washington, DC, USA, 2005; ISBN 978-1-59726-040-4. [Google Scholar]
- Boykin, K.G.; Kepner, W.G.; Bradford, D.F.; Guy, R.K.; Kopp, D.A.; Leimer, A.K.; Samson, E.A.; East, N.F.; Neale, A.C.; Gergely, K.J. A National Approach for Mapping and Quantifying Habitat-Based Biodiversity Metrics across Multiple Spatial Scales. Ecol. Indic. 2013, 33, 139–147. [Google Scholar] [CrossRef]
- Secretariat, C.B.D. Strategic Plan for Biodiversity 2011–2020, Including Aichi Biodiversity Targets. In Proceedings of the Secretariat of the Convention on Biological Diversity, Nagoya, Japan, 29 October 2010. [Google Scholar]
- Secretariat, C.B.D. Convention on Biological Diversity. In Proceedings of the Convention on Biological Diversity, Rio de Janeiro, Brazil, 5–14 June 1992. [Google Scholar]
- Lindenmayer, D.B.; Likens, G.E. Direct Measurement Versus Surrogate Indicator Species for Evaluating Environmental Change and Biodiversity Loss. Ecosystems 2011, 14, 47–59. [Google Scholar] [CrossRef]
- Samson, E.; Boykin, K.; Kepner, W.; Andersen, M.; Fernald, A. Evaluating Biodiversity Metric Response to Forecasted Land Use Change in the Northern Rio Grande Basin. Environments 2018, 5, 91. [Google Scholar] [CrossRef] [Green Version]
- Gergely, K.J.; Boykin, K.G.; McKerrow, A.J.; Rubino, M.J.; Tarr, N.M.; Williams, S.G. Gap Analysis Project (GAP) Terrestrial Vertebrate Species Richness Maps for the Conterminous U.S.; U.S. Geological Survey: Reston, VA, USA, 2019; p. 99.
- Pilliod, D.S.; Jeffries, M.I.; Arkle, R.S.; Olson, D.H. Reptiles under the Conservation Umbrella of the Greater Sage-grouse. J. Wildl. Manag. 2020, 84, 478–491. [Google Scholar] [CrossRef]
- Caro, T.M.; O’Doherty, G. On the Use of Surrogate Species in Conservation Biology. Conserv. Biol. 1999, 13, 805–814. [Google Scholar] [CrossRef]
- Ozaki, K.; Isono, M.; Kawahara, T.; Iida, S.; Kudo, T.; Fukuyama, K. A Mechanistic Approach to Evaluation of Umbrella Species as Conservation Surrogates. Conserv. Biol. 2006, 20, 1507–1515. [Google Scholar] [CrossRef] [PubMed]
- Southwick Associates. The Conservation Economy in America: Direct Investments and Economic Contributions; Prepared for: The National Fish and Wildlife Foundation; Southwick Associates: Fernandina Beach, FL, USA, 2013; p. 26. [Google Scholar]
- Hohensee, P.; Samuel, M.; Drake, D. For What It’s Worth: Appreciating the Economic Value of Wildlife. Wildl. Prof. 2017, 11, 40–43. [Google Scholar]
- Pickard, B.R.; Daniel, J.; Mehaffey, M.; Jackson, L.E.; Neale, A. EnviroAtlas: A New Geospatial Tool to Foster Ecosystem Services Science and Resource Management. Ecosyst. Serv. 2015, 14, 45–55. [Google Scholar] [CrossRef] [Green Version]
- Seaber, P.R.; Kapinos, F.P.; Knapp, G.L. Hydrologic Unit Maps: US Geological Survey Water Supply Paper 2294; US Geological Survey: Denver, CO, USA, 1987.
- Scott, J.M.; Davis, F.; Csuti, B.; Noss, R.; Butterfield, B.; Groves, C.; Anderson, H.; Caicco, S.; D’Erchia, F.; Edwards, T.C., Jr. Gap Analysis: A Geographic Approach to Protection of Biological Diversity. Wildl. Monogr. 1993, 123, 3–41. [Google Scholar]
- Aycrigg, J.L.; Davidson, A.; Svancara, L.K.; Gergely, K.J.; McKerrow, A.; Scott, J.M. Representation of Ecological Systems within the Protected Areas Network of the Continental United States. PLoS ONE 2013, 8, e54689. [Google Scholar] [CrossRef] [PubMed] [Green Version]
- McKerrow, A.J.; Tarr, N.M.; Rubino, M.J.; Williams, S.G. Patterns of Species Richness Hotspots and Estimates of Their Protection Are Sensitive to Spatial Resolution. Divers. Distrib. 2018, 24, 1464–1477. [Google Scholar] [CrossRef] [Green Version]
- Natural Community Conservation Planning Act (NCCPA). California Fish and Game Code. Section 2800 et Seq., as Amended 2003; California Department of Fish and Wildlife: Sacramento, CA, USA, 1991.
- Town of Apple Valley. Town of Apple Valley NCCP (Natural Community Conservation Plan) Planning Agreement; Town of Apple Valley: Apple Valley, CA, USA, 2017; p. 62. [Google Scholar]
- Boykin, K.G.; Kepner, W.G. Mapping Biodiversity Metrics Representing Ecosystem Services at National Landscape Scales; Final Report 2019; Center for Applied Spatial Ecology, USGS New Mexico Cooperative Fish and Wildlife Research Unit, Department of Fish, Wildlife and Conservation Ecology, New Mexico State University: Las Cruces, NM, USA, 2019; p. 44. [Google Scholar]
- Migratory Bird Treaty Act. 16 United States Code, §§703–712. 1918.
- IUCN. The IUCN Red List of Threatened Species. Version 2021-1. Available online: https://www.iucnredlist.org (accessed on 25 May 2021).
- Boykin, K.G.; Thompson, B.C.; Propeck-Gray, S. Accuracy of Gap Analysis Habitat Models in Predicting Physical Features for Wildlife-Habitat Associations in the Southwest US. Ecol. Model. 2010, 221, 2769–2775. [Google Scholar] [CrossRef]
- Gergely, K.J.; McKerrow, A. PAD-US—National Inventory of Protected Areas (Ver. 1.1, August 2016): U.S. Geological Survey Fact Sheet 2013–3086 1.1, August 2016); US Geological Survey: Reston, VA, USA, 2016; p. 2.
- Gergely, K.J.; McKerrow, A. Terrestrial Ecosystems: National Inventory of Vegetation and Land Use; U.S. Geological Survey: Reston, VA, USA, 2013.
- Jenkins, C.N.; Van Houtan, K.S.; Pimm, S.L.; Sexton, J.O. US Protected Lands Mismatch Biodiversity Priorities. Proc. Natl. Acad. Sci. USA 2015, 112, 5081–5086. [Google Scholar] [CrossRef] [PubMed] [Green Version]
- Kepner, W.G.; Boykin, K.G.; Neale, A.C.; Gergely, K.J. National Biodiversity Metrics & Mapping Workshop. In Proceedings of the ACES 2016 Pre-Conference Workshop, Jacksonville, FL, USA, 5 December 2016. [Google Scholar]
- Walde, A.D.; Currylow, A. Gopherus Agassizii (Mojave Desert Tortoise) and Coleonyx Variegatus Variegatus (Desert Banded Gecko). Spring Burrow Cohabitation. Herpetol. Notes 2015, 8, 501–502. [Google Scholar]
- Gerrard, R.; Stine, P.; Church, R.; Gilpin, M. Habitat Evaluation Using GIS: A Case Study Applied to the San Joaquin Kit Fox. Landsc. Urban Plan. 2001, 52, 239–255. [Google Scholar] [CrossRef]
- Omernik, J.M.; Griffith, G.E. Ecoregions of the Conterminous United States: Evolution of a Hierarchical Spatial Framework. Environ. Manag. 2014, 54, 1249–1266. [Google Scholar] [CrossRef] [PubMed]
- ESRI. ArcGIS Pro: Release 2.4; Environmental Systems Research Institute: Redlands, CA, USA, 2019. [Google Scholar]
- Skagen, S.K.; Kelly, J.F.; van Riper, C.; Hutto, R.L.; Finch, D.M.; Krueper, D.J.; Melcher, C.P. Geography of Spring Landbird Migration through Riparian Habitats in Southwestern North America. Condor 2005, 107, 212. [Google Scholar] [CrossRef]
- Brand, L.A.; White, G.C.; Noon, B.R. Factors Influencing Species Richness and Community Composition of Breeding Birds in a Desert Riparian Corridor. Condor 2008, 110, 199–210. [Google Scholar] [CrossRef]
- Andersen, M.C.; Watts, J.M.; Freilich, J.E.; Yool, S.R.; Wakefield, G.I.; McCauley, J.F.; Fahnestock, P.B. Regression-tree Modeling of Desert Tortoise Habitat in the Central Mojave Desert. Ecol. Appl. 2000, 10, 890–900. [Google Scholar] [CrossRef]
- NatureServe. NatureServe Web Service. Available online: http://services.natureserve.org (accessed on 17 December 2020).
- US Fish and Wildlife Service. Status of the Desert Tortoise and Its Critical Habitat; US Fish and Wildlife Service: Reno, NV, USA, 2018; p. 25.
- Nussear, K.E.; Esque, T.C.; Inman, R.D.; Gass, L.; Thomas, K.A.; Wallace, C.S.; Blainey, J.B.; Miller, D.M.; Webb, R.H. Modeling Habitat of the Desert Tortoise (Gopherus Agassizii) in the Mojave and Parts of the Sonoran Deserts of California, Nevada, Utah, and Arizona; US Geological Survey: Reston, VA, USA, 2009.
- Bunce, R.G.H.; Bogers, M.M.B.; Evans, D.; Halada, L.; Jongman, R.H.G.; Mucher, C.A.; Bauch, B.; de Blust, G.; Parr, T.W.; Olsvig-Whittaker, L. The Significance of Habitats as Indicators of Biodiversity and Their Links to Species. Ecol. Indic. 2013, 33, 19–25. [Google Scholar] [CrossRef]
- Hamazaki, T.; Thompson, B.C.; Locke, B.A.; Boykin, K.G. Analysis of Ecological Context for Identifying Vegetation and Animal Conservation Planning Foci: An Example from the Arid South-Western USA. J. Environ. Plan. Manag. 2003, 46, 239–256. [Google Scholar] [CrossRef]
- Loreau, M.; Hector, A. Partitioning Selection and Complementarity in Biodiversity Experiments. Nature 2001, 412, 72–76. [Google Scholar] [CrossRef]
- Boykin, K.G.; Bradford, D.F.; Kepner, W.G. Habitat Distribution Models for 37 Vertebrate Species in the Mojave Desert Ecoregion of Nevada, Arizona, and Utah; US Environmental Protection Agency, Office of Research and Development: Washington, DC, USA, 2008; EPA/600/R-08/117.
- Samson, E.A.; Kepner, W.G.; Boykin, K.G.; Bradford, D.F.; Bierwagen, B.G.; Leimer, A.K.K.; Guy, R.K. Evaluating Biodiversity Response to a Forecasted Land Use Change: A Case Study in the South Platte River Basin, Colorado. In Proceedings of the Fourth Interagency Conference on Research in the Watersheds—Observing, Studying and Managing for Change; USGS Scientific Investigations Report 2011-5169; US Geological Survey: Reston, VA, USA, 2011; pp. 56–62. [Google Scholar]
- Intergovernmental Science-Policy Platform on Biodiversity and Ecosystem Services (IPBES). Available online: https://ipbes.net/regional-assessments (accessed on 7 July 2021).
Figure 1.
Location of the Apple Valley Multi-Species Habitat Conservation Plan Area in context with (a) the United States and the Mojave Desert Ecoregion (blue), (b) San Bernardino County, and (c) Plan area with the Development Zone (Rural Development Area (light blue) including the Urban Core (purple)), Desert Linkages Zone (yellow), and Mojave River Corridor (green).
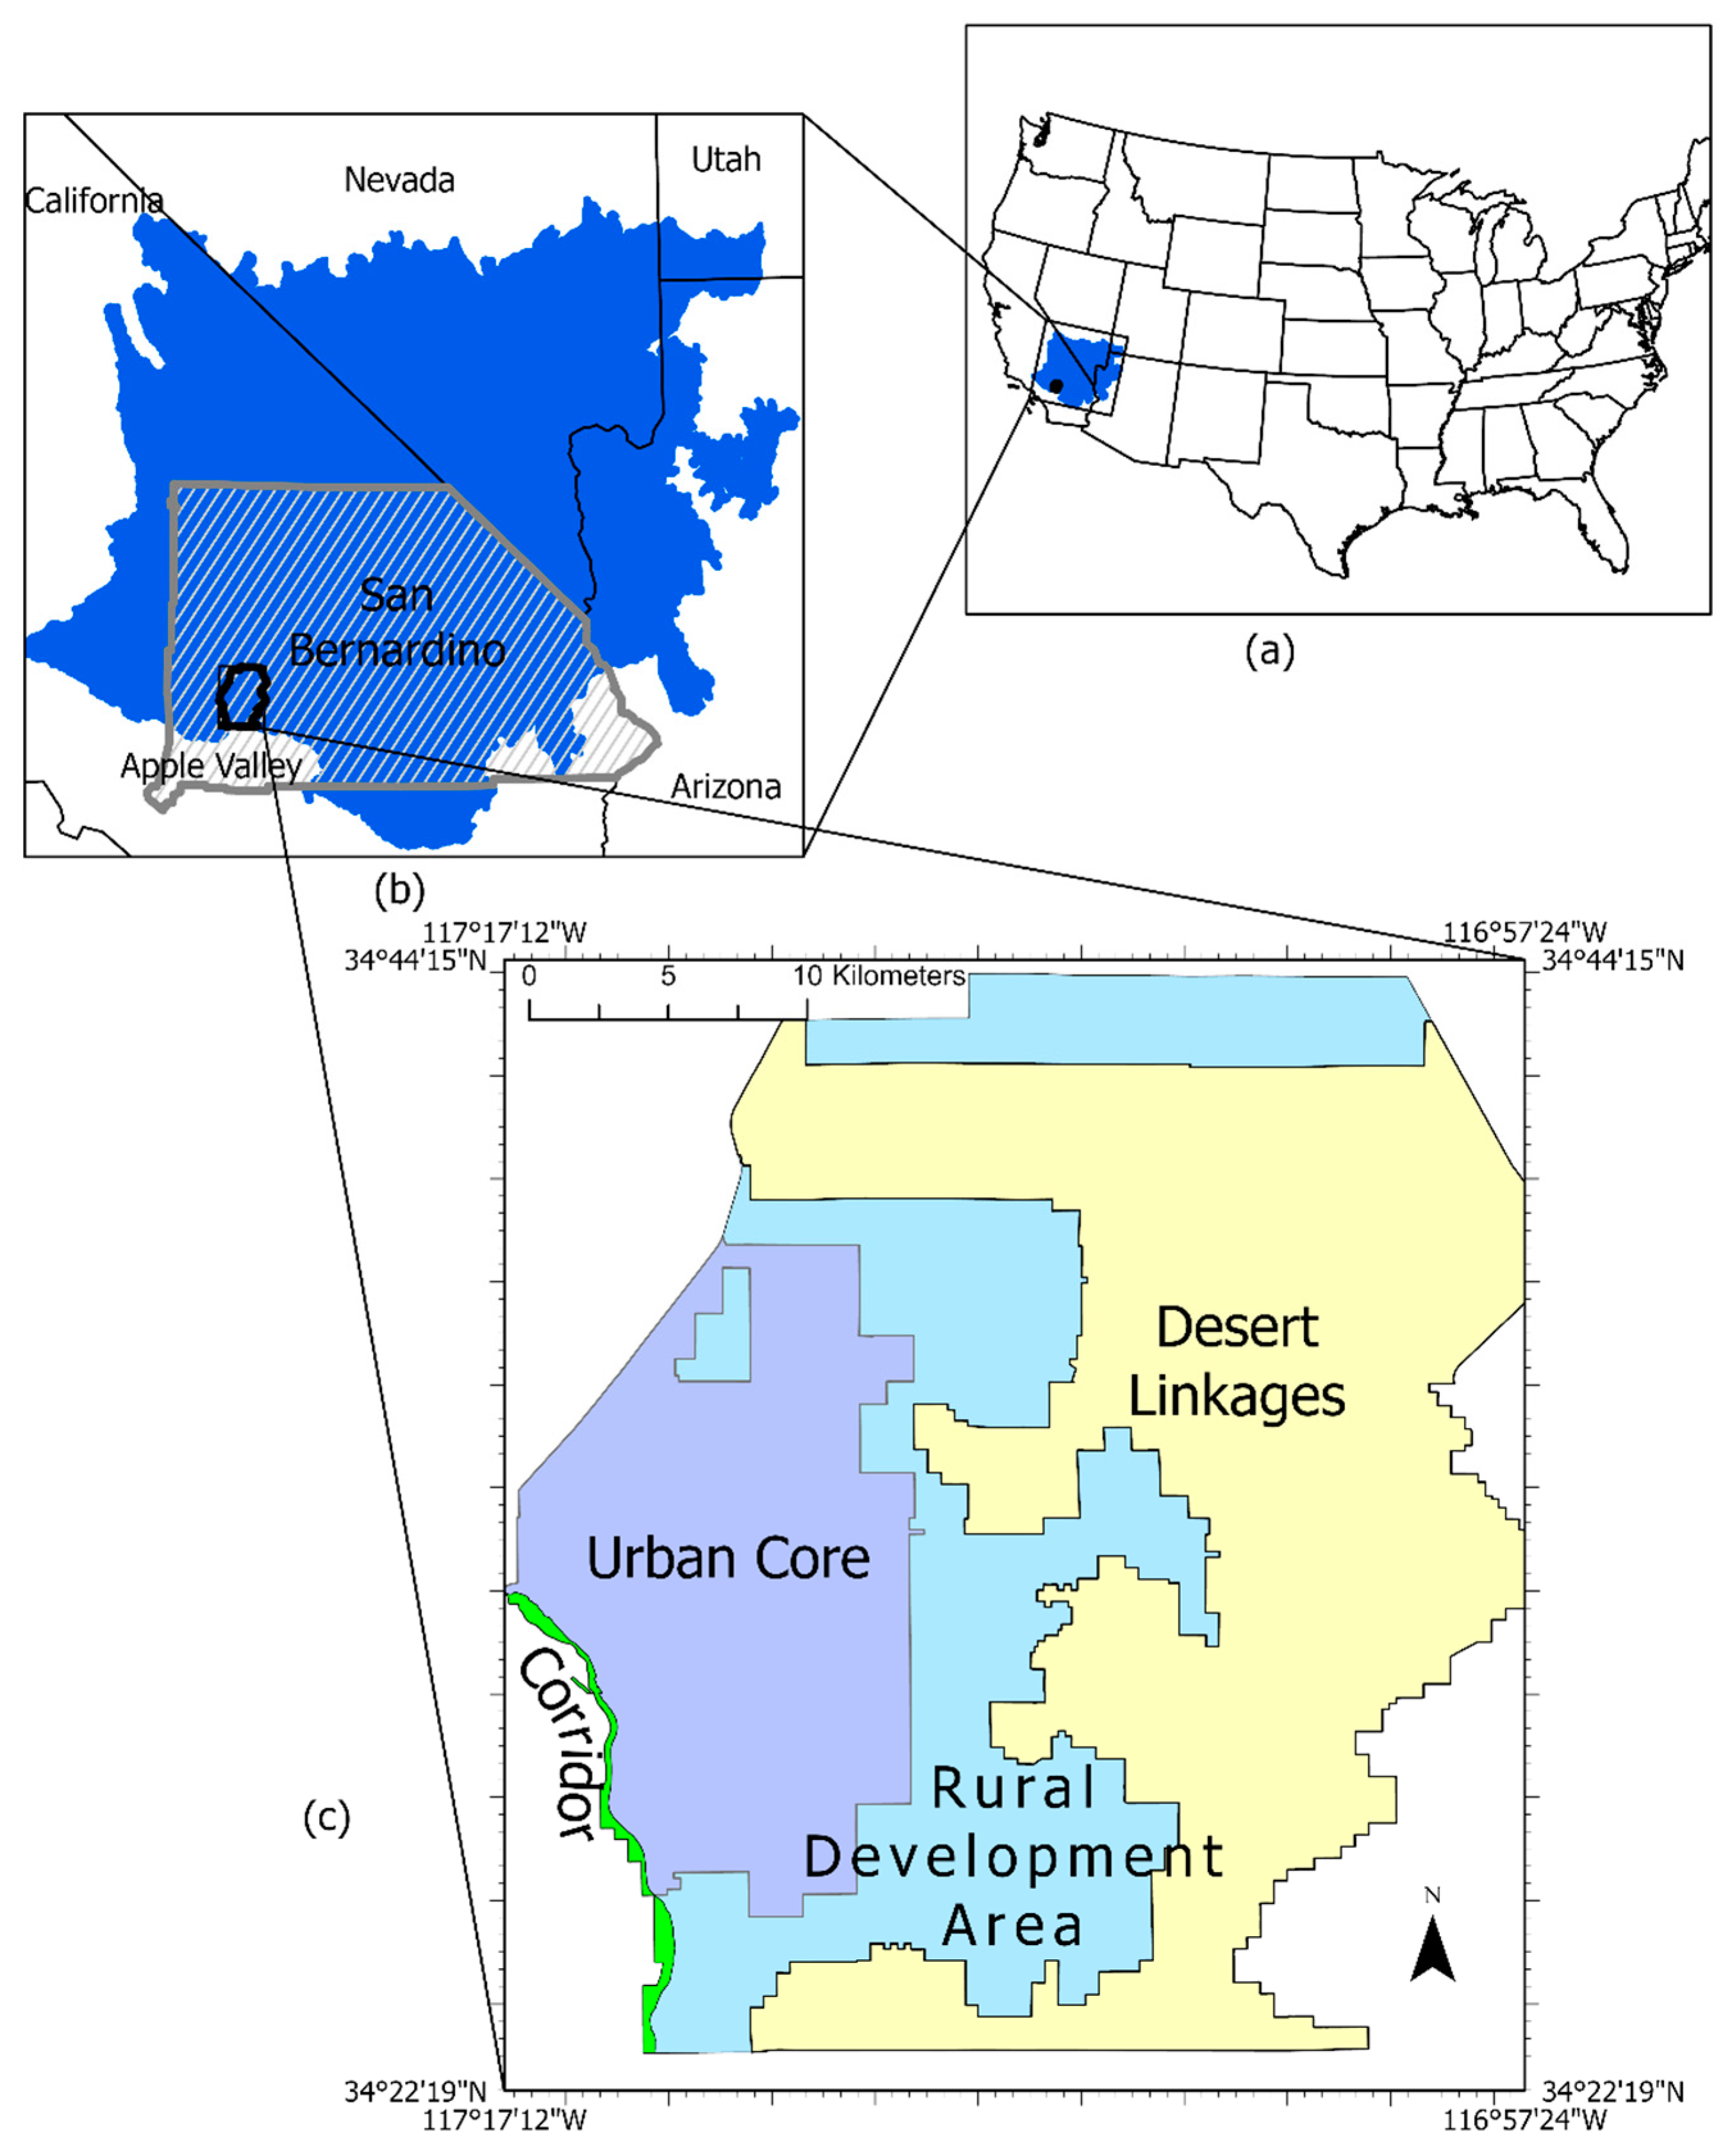
Figure 2.
Total Vertebrate Species Richness within (a) San Bernardino County and (b) the Apple Valley Multi-Species Habitat Conservation Development zone, Linkages, and Mojave River Corridor.
Figure 2.
Total Vertebrate Species Richness within (a) San Bernardino County and (b) the Apple Valley Multi-Species Habitat Conservation Development zone, Linkages, and Mojave River Corridor.
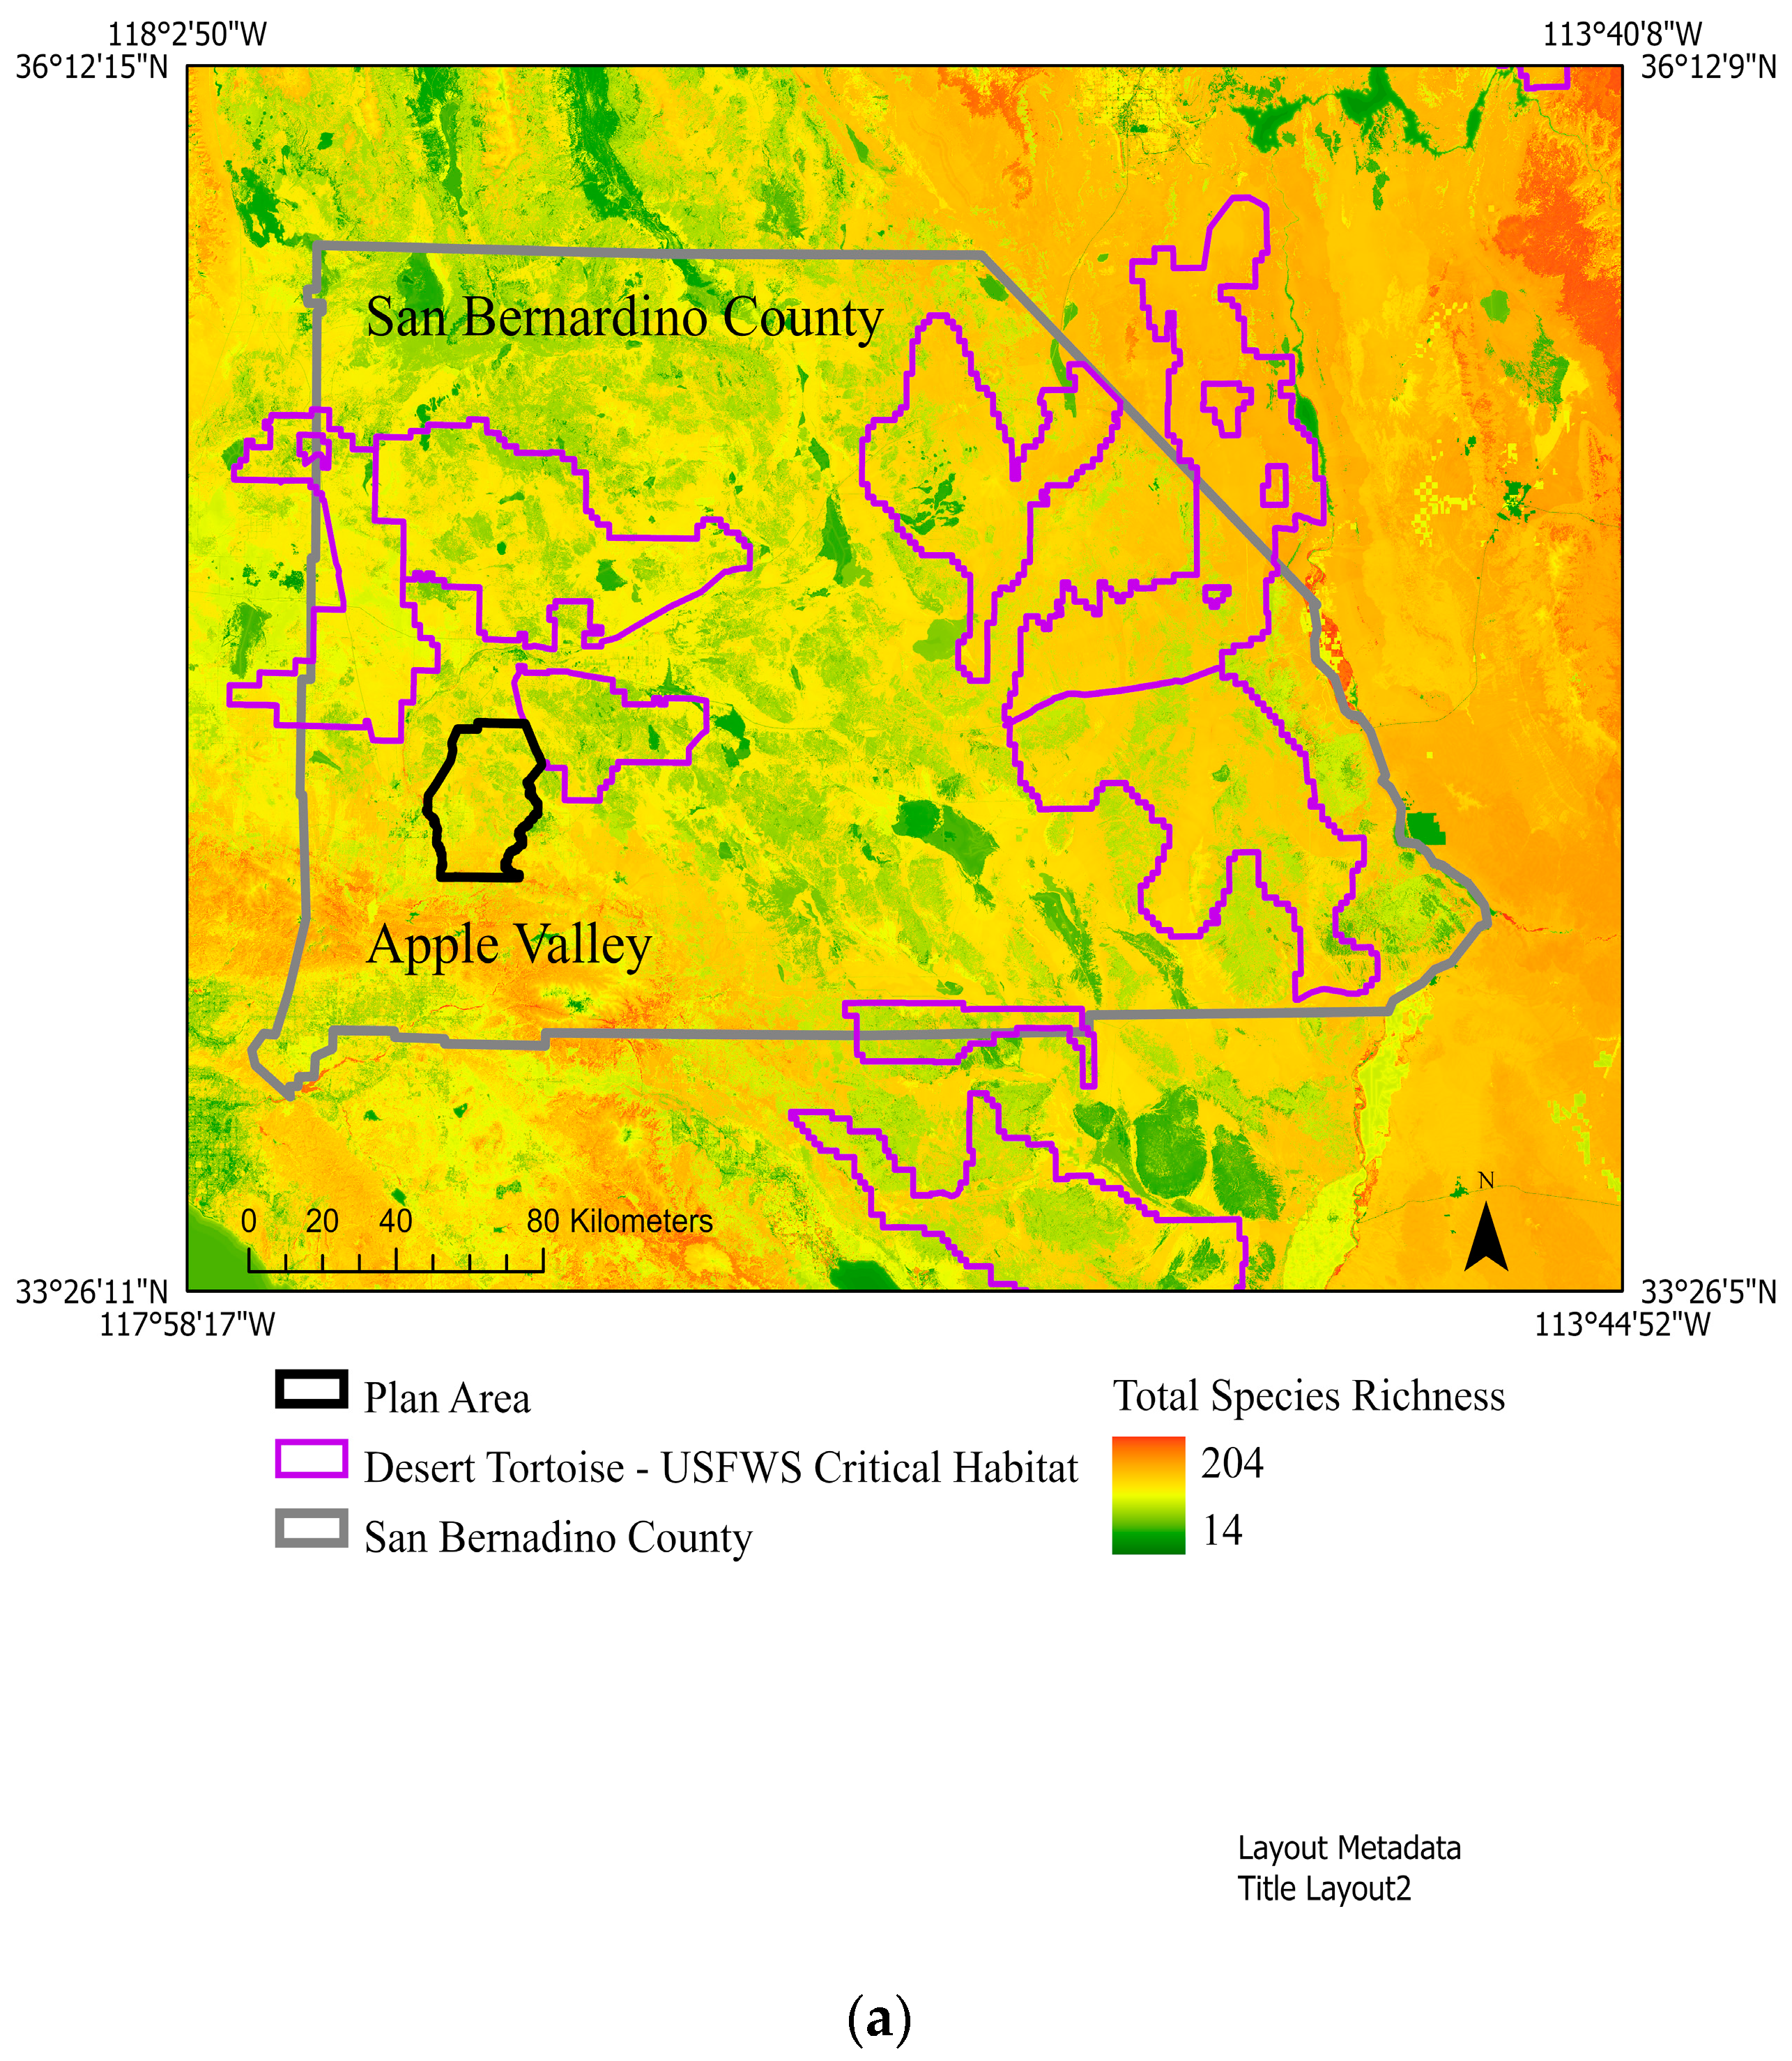

Figure 3.
Species Richness for the Apple Valley Multi-Species Habitat Conservation Plan (MSHCP) including (a) Amphibian Species Richness, (b) Bird Species Richness, (c) Mammal Species Richness, and (d) Reptile Species Richness.
Figure 3.
Species Richness for the Apple Valley Multi-Species Habitat Conservation Plan (MSHCP) including (a) Amphibian Species Richness, (b) Bird Species Richness, (c) Mammal Species Richness, and (d) Reptile Species Richness.


Figure 4.
Desert tortoise habitat model (a) and desert kit fox habitat model (b) within the Apple Valley Multi-Species Habitat Conservation Plan area.
Figure 4.
Desert tortoise habitat model (a) and desert kit fox habitat model (b) within the Apple Valley Multi-Species Habitat Conservation Plan area.
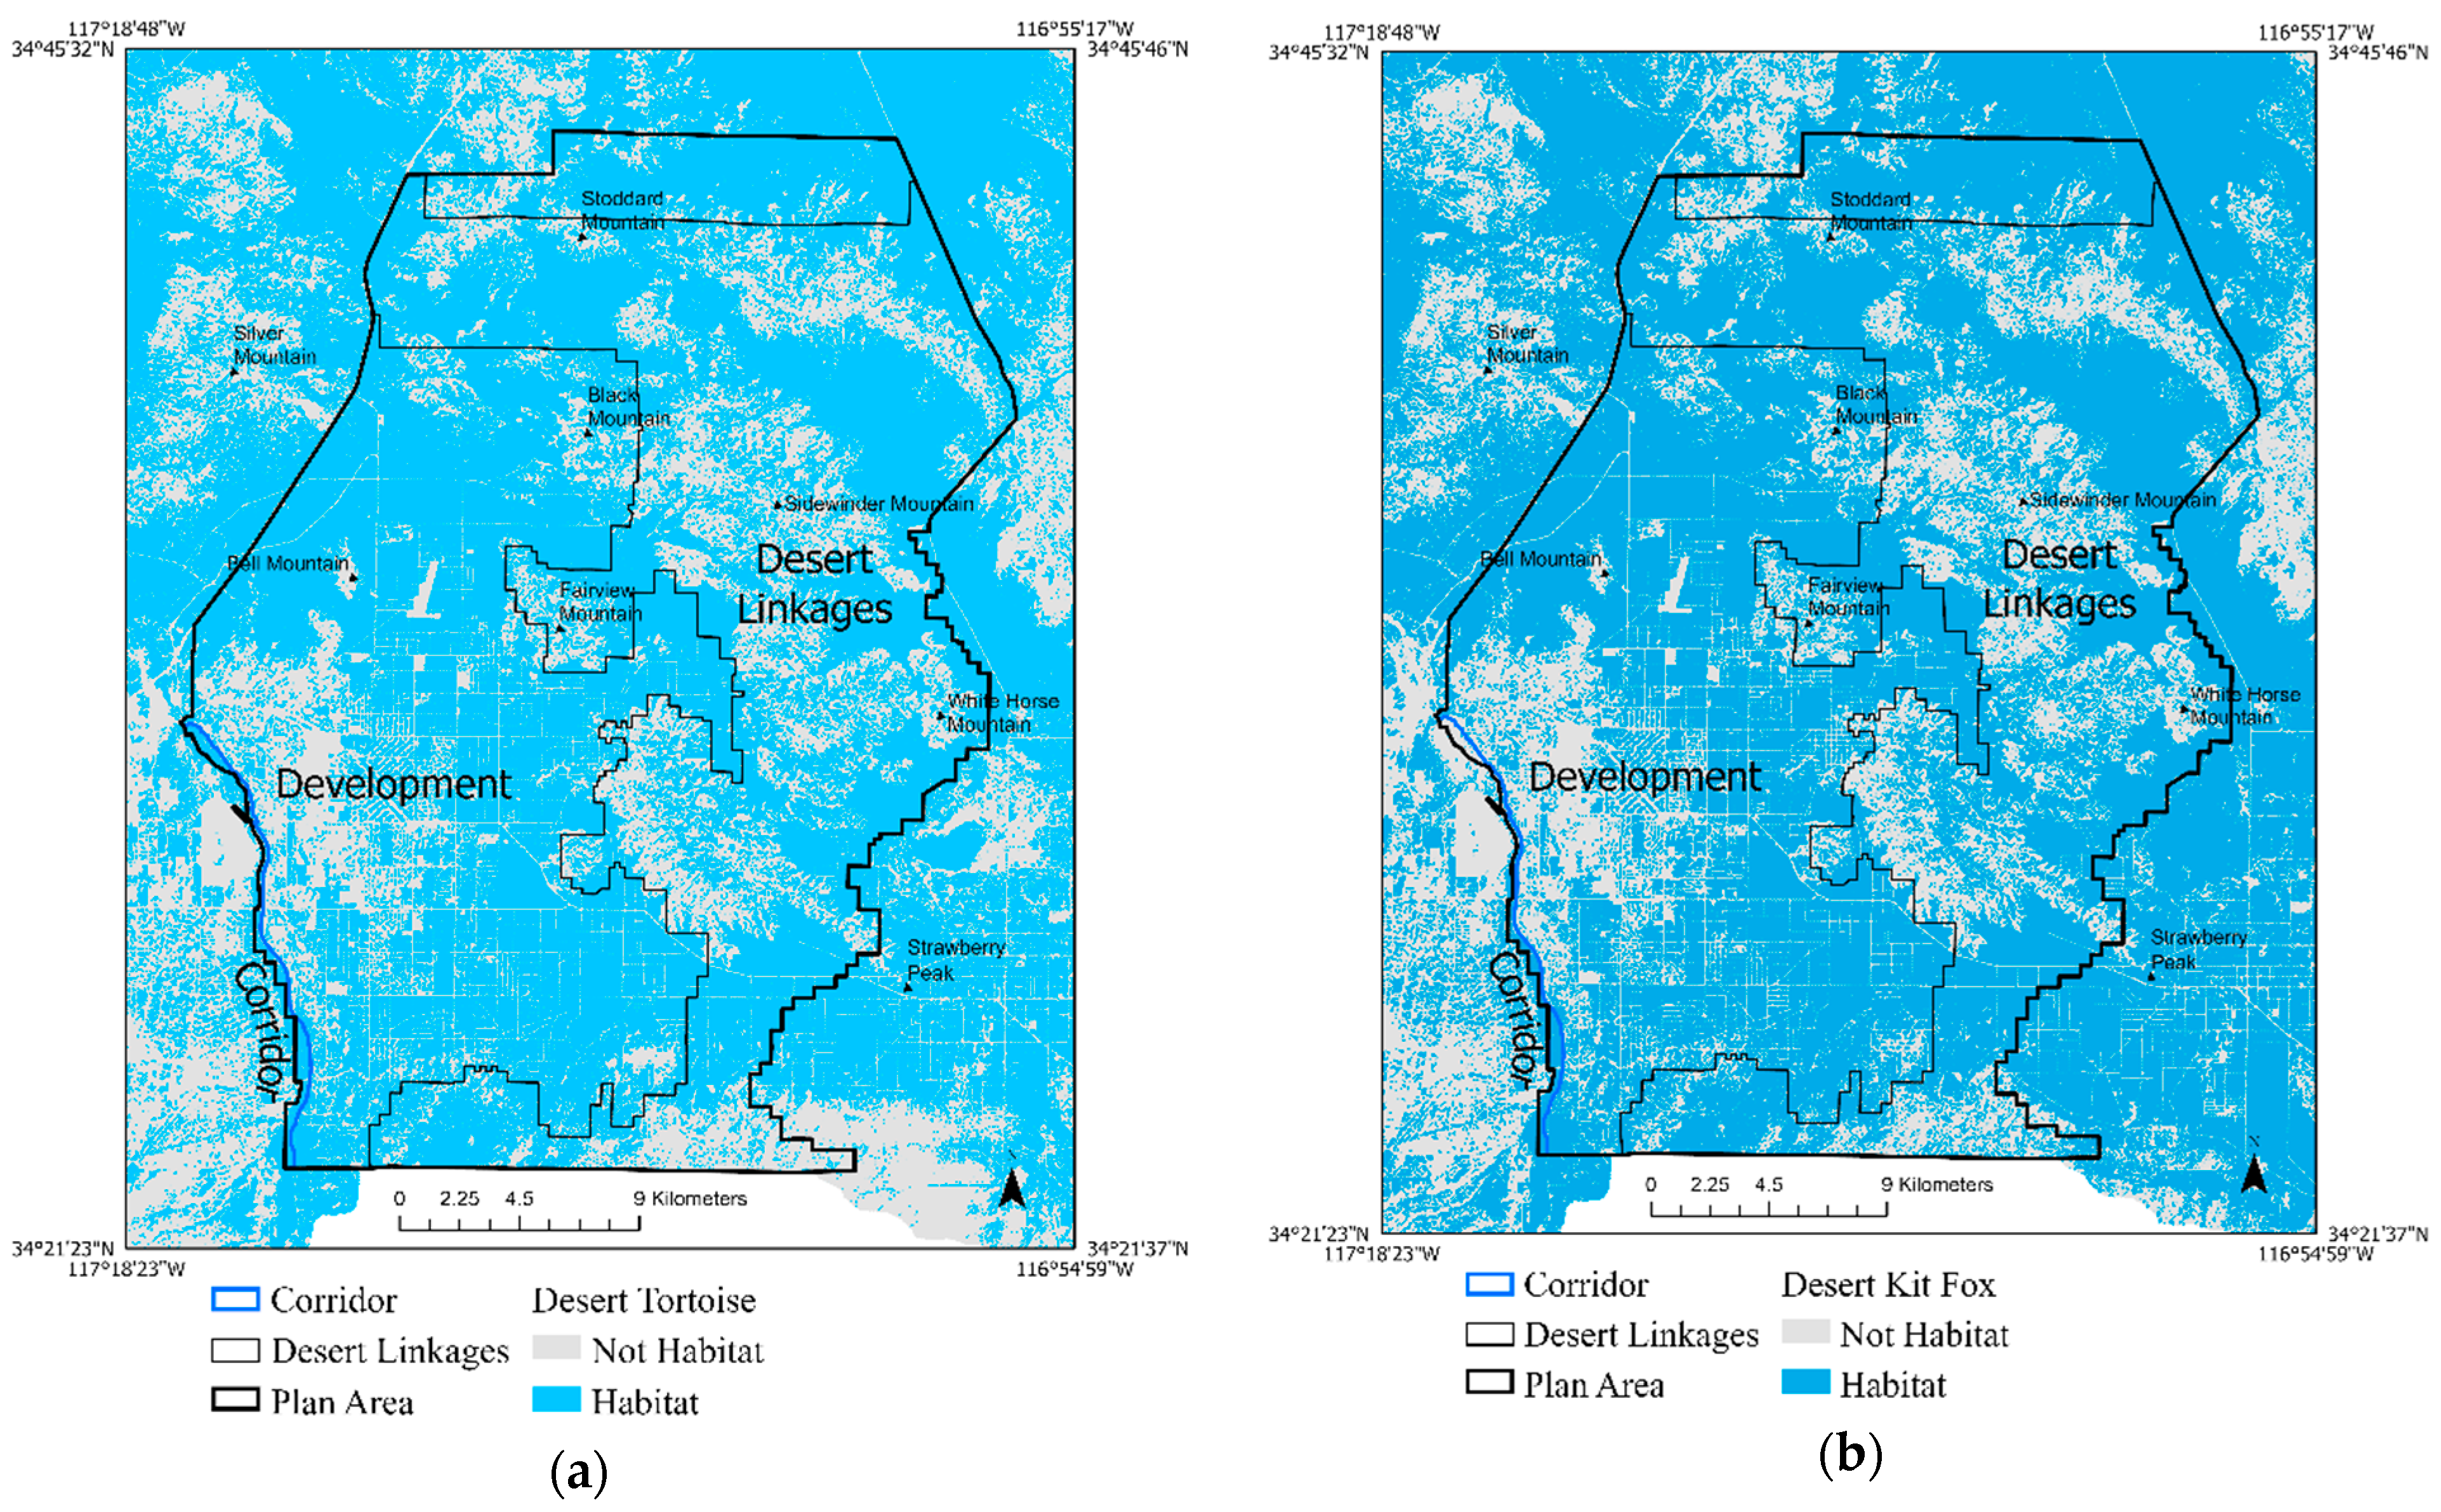
Figure 5.
Normalized Index of Biodiversity by taxa (total vertebrate, amphibian, bird, mammal, and reptiles) for the Mojave Desert Ecoregion for areas with and without desert tortoise habitat or desert kit fox habitat.
Figure 5.
Normalized Index of Biodiversity by taxa (total vertebrate, amphibian, bird, mammal, and reptiles) for the Mojave Desert Ecoregion for areas with and without desert tortoise habitat or desert kit fox habitat.

Table 2.
Proposed covered species for the Apple Valley Multi-Species Habitat Conservation Plan.
| Taxa | Common Name | Scientific Name | State Status | Federal Status | IUCN |
|---|---|---|---|---|---|
| Birds | Burrowing owl | Athene cunicularia | SSC 1 FGC 2 Sec. 3503.5 | BLM Sensitive and MBTA 4 | Least Concern |
| Golden eagle | Aquila chrysaetos | Fully Protected Watch List | Protected under BEGEP 3 Act and MBTA 4 BLM Sensitive | Least Concern | |
| Least Bell’s vireo | Vireo bellii pusillus | Endangered | Endangered and MBTA 4 | Least Concern | |
| Southwestern willow flycatcher | Empidonax traillii extimus | Endangered | Endangered and MBTA 4 | Least Concern | |
| Western yellow-billed cuckoo | Coccyzus americanus occidentalis | Endangered | Threatened BLM Sensitive and MBTA4 | Least Concern | |
| Mammals | Bighorn sheep | Ovis canadensis | Fully Protected | BLM Sensitive | Least Concern |
| Desert kit fox | Vulpes macrotis arsipus | Protected Furbearing Mammal | Least Concern | ||
| Reptiles | Agassiz’s desert tortoise | Gopherus agassizii | Threatened | Threatened | Vulnerable |
| Plants | Joshua tree | Yucca brevifolia | Under Status Review | Least Concern |
1 SSC = Species of Special Concern; 2 FGC = Fish and Game Code; 3 BEGEP = Bald Eagle and Golden Eagle Protection Act; 4 MBTA = Migratory Bird Treaty Act; IUCN = International Union for Conservation of Nature Red list of Threatened Species.
Table 3.
Biodiversity metric analysis within multiple management zones of the Apple Valley Multi-Species Habitat Conservation Plan area (MSHCP). Zones include Development, Mojave River Corridor, Linkages, and Mojave Desert Ecoregion (MDE). Zone: MDE is ratio of mean species for a zone to the mean species for the MDE. Normalized Index of Biodiversity (NIB) is mean species richness within the zone divided by the maximum number of species found within the MDE.
| Species Richness | ||||||
|---|---|---|---|---|---|---|
| Metric | Zone | Hectares | MEAN | MAX | Zone:MDE | NIB |
| Total Vertebrates | Development | 45,343 | 96.5 | 172 | 0.99 | 0.47 |
| Corridor | 560 | 109.7 | 173 | 1.12 | 0.54 | |
| Linkages | 44,101 | 91.2 | 175 | 0.93 | 0.45 | |
| MDE | 12,773,240 | 97.9 | 204 | 1.00 | 0.48 | |
| Amphibian | Development | 45,343 | 0.8 | 4 | 0.56 | 0.07 |
| Corridor | 560 | 1.3 | 4 | 0.83 | 0.11 | |
| Linkages | 44,101 | 0.7 | 4 | 0.43 | 0.05 | |
| MDE | 12,773,240 | 1.5 | 12 | 1.00 | 0.13 | |
| Bird | Development | 45,343 | 40.1 | 93 | 1.00 | 0.32 |
| Corridor | 560 | 50.5 | 94 | 1.26 | 0.40 | |
| Linkages | 44,101 | 34.5 | 95 | 0.86 | 0.27 | |
| MDE | 12,773,240 | 40.2 | 126 | 1.00 | 0.32 | |
| Mammal | Development | 45,343 | 29.9 | 46 | 0.96 | 0.53 |
| Corridor | 560 | 30.8 | 40 | 0.99 | 0.55 | |
| Linkages | 44,101 | 30.3 | 46 | 0.98 | 0.54 | |
| MDE | 12,773,240 | 31.0 | 56 | 1.00 | 0.55 | |
| Reptile | Development | 45,343 | 25.6 | 36 | 1.02 | 0.58 |
| Corridor | 560 | 27.1 | 36 | 1.08 | 0.62 | |
| Linkages | 44,101 | 25.7 | 36 | 1.02 | 0.59 | |
| MDE | 12,773,240 | 25.1 | 44 | 1.00 | 0.57 | |
Table 4.
Zonal statistics for umbrella species comparison to biodiversity metrics within the Apple Valley Multi-Species Habitat Conservation Plan Area and the Mojave Desert Ecoregion (MDE). Normalized Index of Biodiversity (NIB: mean species richness within the zone divided by the maximum number of species found within the MDE). Zone: MDE (ratio of mean species for zone to the mean species for the MDE).
| Mojave Desert Ecoregion | Plan Area | ||||||||
|---|---|---|---|---|---|---|---|---|---|
| Metric | Species | Modeled Habitat | MEAN | MAX | Zone: MDE | NIB | MEAN | MAX | NIB |
| Total Vertebrates | Desert Tortoise | No | 80 | 200 | 0.82 | 0.39 | 70.4 | 150 | 0.40 |
| Yes | 107 | 204 | 1.09 | 0.52 | 104.8 | 175 | 0.60 | ||
| Desert Kit Fox | No | 69.2 | 204 | 0.71 | 0.34 | 70.3 | 175 | 0.40 | |
| Yes | 108.9 | 187 | 1.11 | 0.53 | 104.6 | 150 | 0.60 | ||
| Amphibian | Desert Tortoise | No | 0.7 | 12 | 0.46 | 0.06 | 0.2 | 3 | 0.05 |
| Yes | 1.9 | 10 | 1.28 | 0.16 | 1.0 | 4 | 0.25 | ||
| Desert Kit Fox | No | 0.4 | 12 | 0.27 | 0.03 | 0.2 | 4 | 0.05 | |
| Yes | 2 | 8 | 1.28 | 0.16 | 1.0 | 3 | 0.25 | ||
| Bird | Desert Tortoise | No | 34.5 | 123 | 0.86 | 0.27 | 32.4 | 79 | 0.34 |
| Yes | 43.2 | 126 | 1.07 | 0.34 | 39.7 | 95 | 0.42 | ||
| Desert Kit Fox | No | 28.9 | 126 | 0.72 | 0.23 | 32.6 | 95 | 0.34 | |
| Yes | 44.6 | 111 | 1.11 | 0.35 | 39.6 | 77 | 0.42 | ||
| Mammal | Desert Tortoise | No | 27.1 | 56 | 0.87 | 0.48 | 22.1 | 46 | 0.48 |
| Yes | 33 | 49 | 1.07 | 0.59 | 33.8 | 44 | 0.73 | ||
| Desert Kit Fox | No | 23.4 | 56 | 0.76 | 0.42 | 21.8 | 44 | 0.48 | |
| Yes | 33.9 | 55 | 1.09 | 0.61 | 33.8 | 46 | 0.74 | ||
| Reptile | Desert Tortoise | No | 17.8 | 38 | 0.71 | 0.4 | 15.7 | 30 | 0.44 |
| Yes | 28.9 | 44 | 1.15 | 0.66 | 30.3 | 36 | 0.84 | ||
| Desert Kit Fox | No | 16.4 | 39 | 0.65 | 0.37 | 15.7 | 36 | 0.44 | |
| Yes | 28.5 | 44 | 1.13 | 0.65 | 30.2 | 36 | 0.84 | ||
Publisher’s Note: MDPI stays neutral with regard to jurisdictional claims in published maps and institutional affiliations. |
© 2021 by the authors. Licensee MDPI, Basel, Switzerland. This article is an open access article distributed under the terms and conditions of the Creative Commons Attribution (CC BY) license (https://creativecommons.org/licenses/by/4.0/).
Share and Cite
MDPI and ACS Style
Boykin, K.G.; Kepner, W.G.; McKerrow, A.J. Applying Biodiversity Metrics as Surrogates to a Habitat Conservation Plan. Environments 2021, 8, 69. https://doi.org/10.3390/environments8080069
AMA Style
Boykin KG, Kepner WG, McKerrow AJ. Applying Biodiversity Metrics as Surrogates to a Habitat Conservation Plan. Environments. 2021; 8(8):69. https://doi.org/10.3390/environments8080069
Chicago/Turabian StyleBoykin, Kenneth G., William G. Kepner, and Alexa J. McKerrow. 2021. "Applying Biodiversity Metrics as Surrogates to a Habitat Conservation Plan" Environments 8, no. 8: 69. https://doi.org/10.3390/environments8080069
Note that from the first issue of 2016, this journal uses article numbers instead of page numbers. See further details here.