Review

Assessment of Fecal Contamination in Oklahoma Water Systems through the Use of Sterol Fingerprints

1
ConocoPhillips School of Geology and Geophysics, University of Oklahoma, Norman, OK 73019, USA
2
Université de Lorraine, LIEC, UMR7360, Vandœuvre-lès-Nancy 54506, France
3
CNRS, LIEC, UMR7360, Vandœuvre-lès-Nancy 54506, France
*
Author to whom correspondence should be addressed.
Environments 2016, 3(4), 28; https://doi.org/10.3390/environments3040028
Submission received: 14 June 2016 / Revised: 21 October 2016 / Accepted: 24 October 2016 / Published: 2 November 2016

Abstract

:
Fecal contamination is a major concern for water quality management, since the fecal materials are associated with pathogens that can cause illness wherever water is used for recreational, drinking and aquaculture purposes. In order to monitor source(s) of fecal contamination in Oklahoma water systems, sterol profiles were previously examined in rural and urban samples collected from the Illinois River Basin and the Norman Wastewater Treatment Plant (WWTP), respectively. Two distinctive, qualitatively and quantitatively, sterol fingerprints were recognized. Despite the effective removal of organic material by the Norman WWTP, human-derived sterol fingerprints, characterized by a predominance of fecal stanols such as coprostanol, were still significant in the output from the plant. The source of fecal material in the Illinois River samples (rural) was defined as being characteristic of corn-feed chicken manure originating from surrounding feedlots through the principal component analysis (PCA) of the sterol distributions and carbon compound specific isotope analysis of selected sterols (CSIA, δ13C). Thiosteranes, formed during sludge treatments, were also shown to be useful tracers for monitoring sludge application in agriculture fields. The results obtained were used to provide water management authorities with qualitative insights into the source of fecal material inputs into the environment.

1. Introduction

Freshwater is one of the fundamental natural resources for terrestrial living organisms and especially for humans. Furthermore “around 1.2 billion people, or almost one-fifth of the world’s population, live in areas of physical scarcity, and 500 million people are approaching this situation. Another 1.6 billion people, or almost one quarter of the world’s population, face economic water shortage (where countries lack the necessary infrastructure to take water from rivers and aquifers)” [1]. Under the threat of the global climate change that aggravates the disparity of freshwater distribution and the growth of the world’s population that will exponentially increase the need for freshwater, water shortage is amplified and will be more notable in the next decades [2]. Decline of water quality, one of the outcomes of intensive use of water by expanded human activities, is another factor that moves us towards water shortages and becomes a major global concern for water management. Water quality deterioration from the presence of various types of pollutants, such as organic, inorganic and microbial, could put the food chain and public safety directly at risk through waterborne diseases.
Fecal contamination is considered as one of the major threats for the degradation of water quality, since it can directly endanger human health via exposure to pathogenic viruses and protozoa associated with feces, whenever water is used for recreational, drinking and aquaculture purposes [3,4,5]. Fecal contamination also promotes algal proliferation [6] that leads to eutrophication that destabilizes the equilibrium of aquatic systems [7].
In order to assess the fecal contamination, fecal indicator bacteria (FIB), which link the observed illness and level of the bacterial indicator (e.g., Escherichia coli and enterococci), were developed and applied globally for water quality monitoring [4]. FIB sources are multiple and widespread in the environment. Wildlife, domestic pets, defective septic tanks and sewage from human wastewater are the major potential sources of fecal contamination [8]. Moreover, human-sourced fecal contamination was estimated to be more related to health risk than non-human sources [9].
The concept of microbial source tracking (MST) was recently introduced for monitoring fecal contamination [5,10]. It offers the possibility of identifying, and in some cases, of quantifying nonpoint or multiple sources of pollution. MST combines multiple approaches for source identification. They were developed based on identification of numerous feces-related microbiological (e.g., Bifidobacterium spp.), molecular (e.g., DNA fingerprints) and biochemical (e.g., sterols) markers found in drinking, recreational, groundwater and aquatic wildlife habitat [5,10]. Specific MST markers for human, different livestock and wildlife are well defined and have been confirmed [11]. MST has been successfully applied for source identification in some fecal contamination case studies [12,13,14,15].
In order to help choose the most appropriate method for source tracking, several authors have reviewed and described the performance of existing MST approaches [3,5,10,11]. According to these authors, the microbiological method is easy to perform but some specific markers are not very abundant in the environment, and microbial survival rates are also variable, altering the reliability of results. The molecular approach is rapid and easy to perform, and markers also show high specificity. Human, pig and ruminants specific markers were well investigated and widely applied in some case studies [16]. However, due to the geographical and/or environmental dependence of some specific markers and an incomplete molecular database, the effectiveness of the molecular approach could be then limited [3,10]. Nevertheless, the biochemical markers, in particular sterols, bearing a degree of specificity are also valuable for source discrimination. Sterols are a group of organic compounds that are synthesized by a large range of living organisms like plants, animals, bacteria and fungi [17,18,19] and are found in various environmental matrices such as water, soil and sediments. A significant number of recent studies has shown that sterol distributions are capable of distinguishing human and non-human sources of fecal contamination [20,21,22]. Sterol distributions within these fingerprints may also be affected by climatic and geographic factors [23,24,25].
Leeming, et al. [21] pointed out that fecal sterol profiles could be specific for some warm-blooded animals based on diet and the presence of anaerobic bacteria in the gut. Sterol profiles will vary according to diet, and the major ingested sterols will vary for herbivores and carnivores as well. During the digestion process, through the help of intestinal microflora (if present), the ingested sterols are transformed into stanols with different isomeric structures and then released into the environment. However, in some warm-blooded animals, such as several avian herbivores, the intestinal microflora are not very abundant, or even absent in the gut, the ingested sterols are not significantly altered during digestion before being released. In the case of two or more organisms having similar qualitative fecal sterol distributions, the sterol concentrations may provide an additional tool to distinguish the different organisms. The quantity of produced fecal sterols can vary considerably depending on the animal sources. For instance, humans and pigs have similar fecal sterol fingerprints, but the sterol concentration is much higher in human feces than in pig feces. Nevertheless, in some receiving water, use of sterol concentration could be limited to distinguish human and pig feces due to the dilution effect. In this case, the molecular MST analysis would be more appropriate. In addition, some endogenous sterols, which are biosynthesized and discharged to the digestive tract, could also be specific to a particular host [21,26]. The combination of all the above factors is responsible for the specificity of the fecal “sterol fingerprints”, qualitatively and quantitatively, for most warm-blooded animals.
This paper aims to provide an overview on the application of sterol fingerprints as a source tracer for fecal contamination in water quality monitoring in different environmental backgrounds, such as urban and rural, within the state of Oklahoma (U.S.). In addition, it will provide water management authorities with a qualitative insight into the impact of human and non-human input of fecal material into the Oklahoma water systems.

2. Materials and Methods

2.1. Samples

Sterol fingerprints from urban and rural water samples from Oklahoma have been characterized over the past four years. Samples were collected from the Norman wastewater treatment plant (WWTP) and the Illinois River Basin (Figure 1). Samples collected included water, sediment and sludge.
The Illinois River Basin extends across the northeastern part of Oklahoma and northwestern part of Arkansas and about 54% (equivalent to 2299 km2) of the total surface area is in Oklahoma. Land-use of the Illinois River Basin is mainly distributed between forest and agricultural purposes with industrial and urban activities representing only a minor component [27]. Poultry farming is one of the major agricultural activities in the area, and poultry manure is commonly used as soil fertilizer in the surrounding crop fields [28]. In a previous study, surface sediment samples were collected from the mainstream and tributaries of the Illinois River as well as from Lake Tenkiller, located in the lower part of basin (Figure 1).
The Norman Waste Water Treatment Plant (WWTP), located in the southern part of the metropolitan area of Oklahoma City, serves a population of more than 118,000 (Figure 1). This plant utilizes a water purification procedure consisting of several clarification steps and biological treatment of the sludge. Sludge obtained after the clarification processes was successively subjected to anaerobic digestion and centrifugation. The dewatered sludge, called “cake”, is generally used for land fertilization in the surrounding area. In a previous study, sludge and water samples were collected at different treatment stages as well as from the influent to the plant.

2.2. Sample Treatments and Analysis

2.2.1. Pretreatments

Detailed sampling and pretreatment procedures are reported in previous studies [14,29]. Briefly, sediment and sludge (1 L) samples were frozen for 24 h after collection and being returned to the laboratory. Samples were then freeze-dried for at least 12 h (Freeze-dryer 5, Labconco, Kansas City, MO, USA). To improve extraction yield, dry samples, between 20 to 40 g of sediments and between 1.2 to 9.9 g of sludge, were sieved (2 mm), and the undersized particles were crushed to 250 μm.
After collection, pH of the water samples was adjusted to 1 or 2 using HCl solution (10%). Once the samples were returned to the laboratory, suspended fine particles were rapidly filtered from the water through pre-rinsed and pre-weighed glass fiber filters (Whatman GF/F, Ø = 47 mm, 0.7 μm pore size, Whatman, Maidstone, UK). Wet filters containing particles were frozen, freeze-dried, and the dry filters were weighed and stored in the freezer prior to extraction.

2.2.2. Extraction and Fractionation

Organic matter extraction procedures were described in previous papers by Biache and Philp [14]. Briefly, each solid sample (including sludge, sediment and filters) was extracted by sonication using methanol (MeOH), then a mixture of methanol-dichloromethane (v:v, 1:1) and dichloromethane (DCM), and the extracts were combined in one glass flask. For the filtered water, extraction of the organic matter was performed using solid phase extraction (SPE). Water was filtered through a pre-rinsed and pre-conditioned C18 embedded SPE disk (Supelco, Bellefonte, PA, USA), and the organic matter retained on the disk was recovered using a mixture of DCM-MeOH (v:v, 1:1). The extracts were separated into aliphatic, aromatic and polar fractions using liquid chromatography. Detailed separation procedures were previously described in Biache and Philp [14] and Biache, et al. [29].

2.3. Sterol Quantification and Compound Specific Isotope Analysis (CSIA)

The polar fractions containing the sterols were analyzed using gas chromatography (Agilent Technologies GC-7890A) coupled with mass spectrometry (Agilent Technologies 5975C XL MSD with triple-axis detector). Sterols were quantified using internal standards (cholestanol-d6), and the GC-MS was pre-calibrated using a mixture of 7 different sterols (coprostanol, epicoprostanol, cholesterol, stigmasterol, β-sitosterol, sitostanol, stigmastanol). The sterol mixture was injected at 6 different concentrations ranging from 1 to 100 μg/mL. Carbon isotope analysis (CSIA) of selected sterols was performed by using gas chromatography (Agilent Technologies 7890A GC) coupled with isotope ratio mass spectrometry (Thermo Finnigan MAT 253). Analytical conditions were given in Biache and Philp [14] and Biache, et al. [29].

2.4. Statistical Analysis

Sterols distributions were subjected to statistical analysis using principal component analysis (PCA) performed with XLSTAT software (Addinsoft 2012, Addinsoft, New York, NY, USA) using a covariance matrix.
PCA is a descriptive multivariate method based on a geometric model. In environmental sciences, it has been widely used to analyze the natural association between samples in a complex data set. The identified associations are able to highlight the presence of natural or anthropogenic influence for example, by showing participation of individual variables (e.g., chemicals) in several influential factors [30,31]. In this study, the PCA was performed by using 27 individuals (27 potential sources of fecal contamination, including animal feces and urban runoff [14,21]) and 13 variables {the relative proportion of 13 sterols (reported in Table 1) found in different “pure” fecal sources}. The samples collected and processed in this study, such as Illinois River basin samples, were analyzed as supplementary data in the PCA in order to illustrate similarity with potential fecal sources.

3. Results and Discussion

According to the sample types (water, sediment, or sludge), sterol concentrations were expressed in μg/L and in μg/g of dry weight (d.w.) for aqueous samples (water and sludge) and solids (sediments and dewatered sludge), respectively. Since the grain-size distribution could significantly affect the sterol concentrations from the sediments [32], concentrations of the total sterols in sediments were normalized to the total organic carbon, denoted as μg/mg of TOC. Urban samples from the Norman WWTP showed significantly higher amounts of sterols than rural samples from the Illinois River Basin, and the two sites showed distinctive sterol profiles.

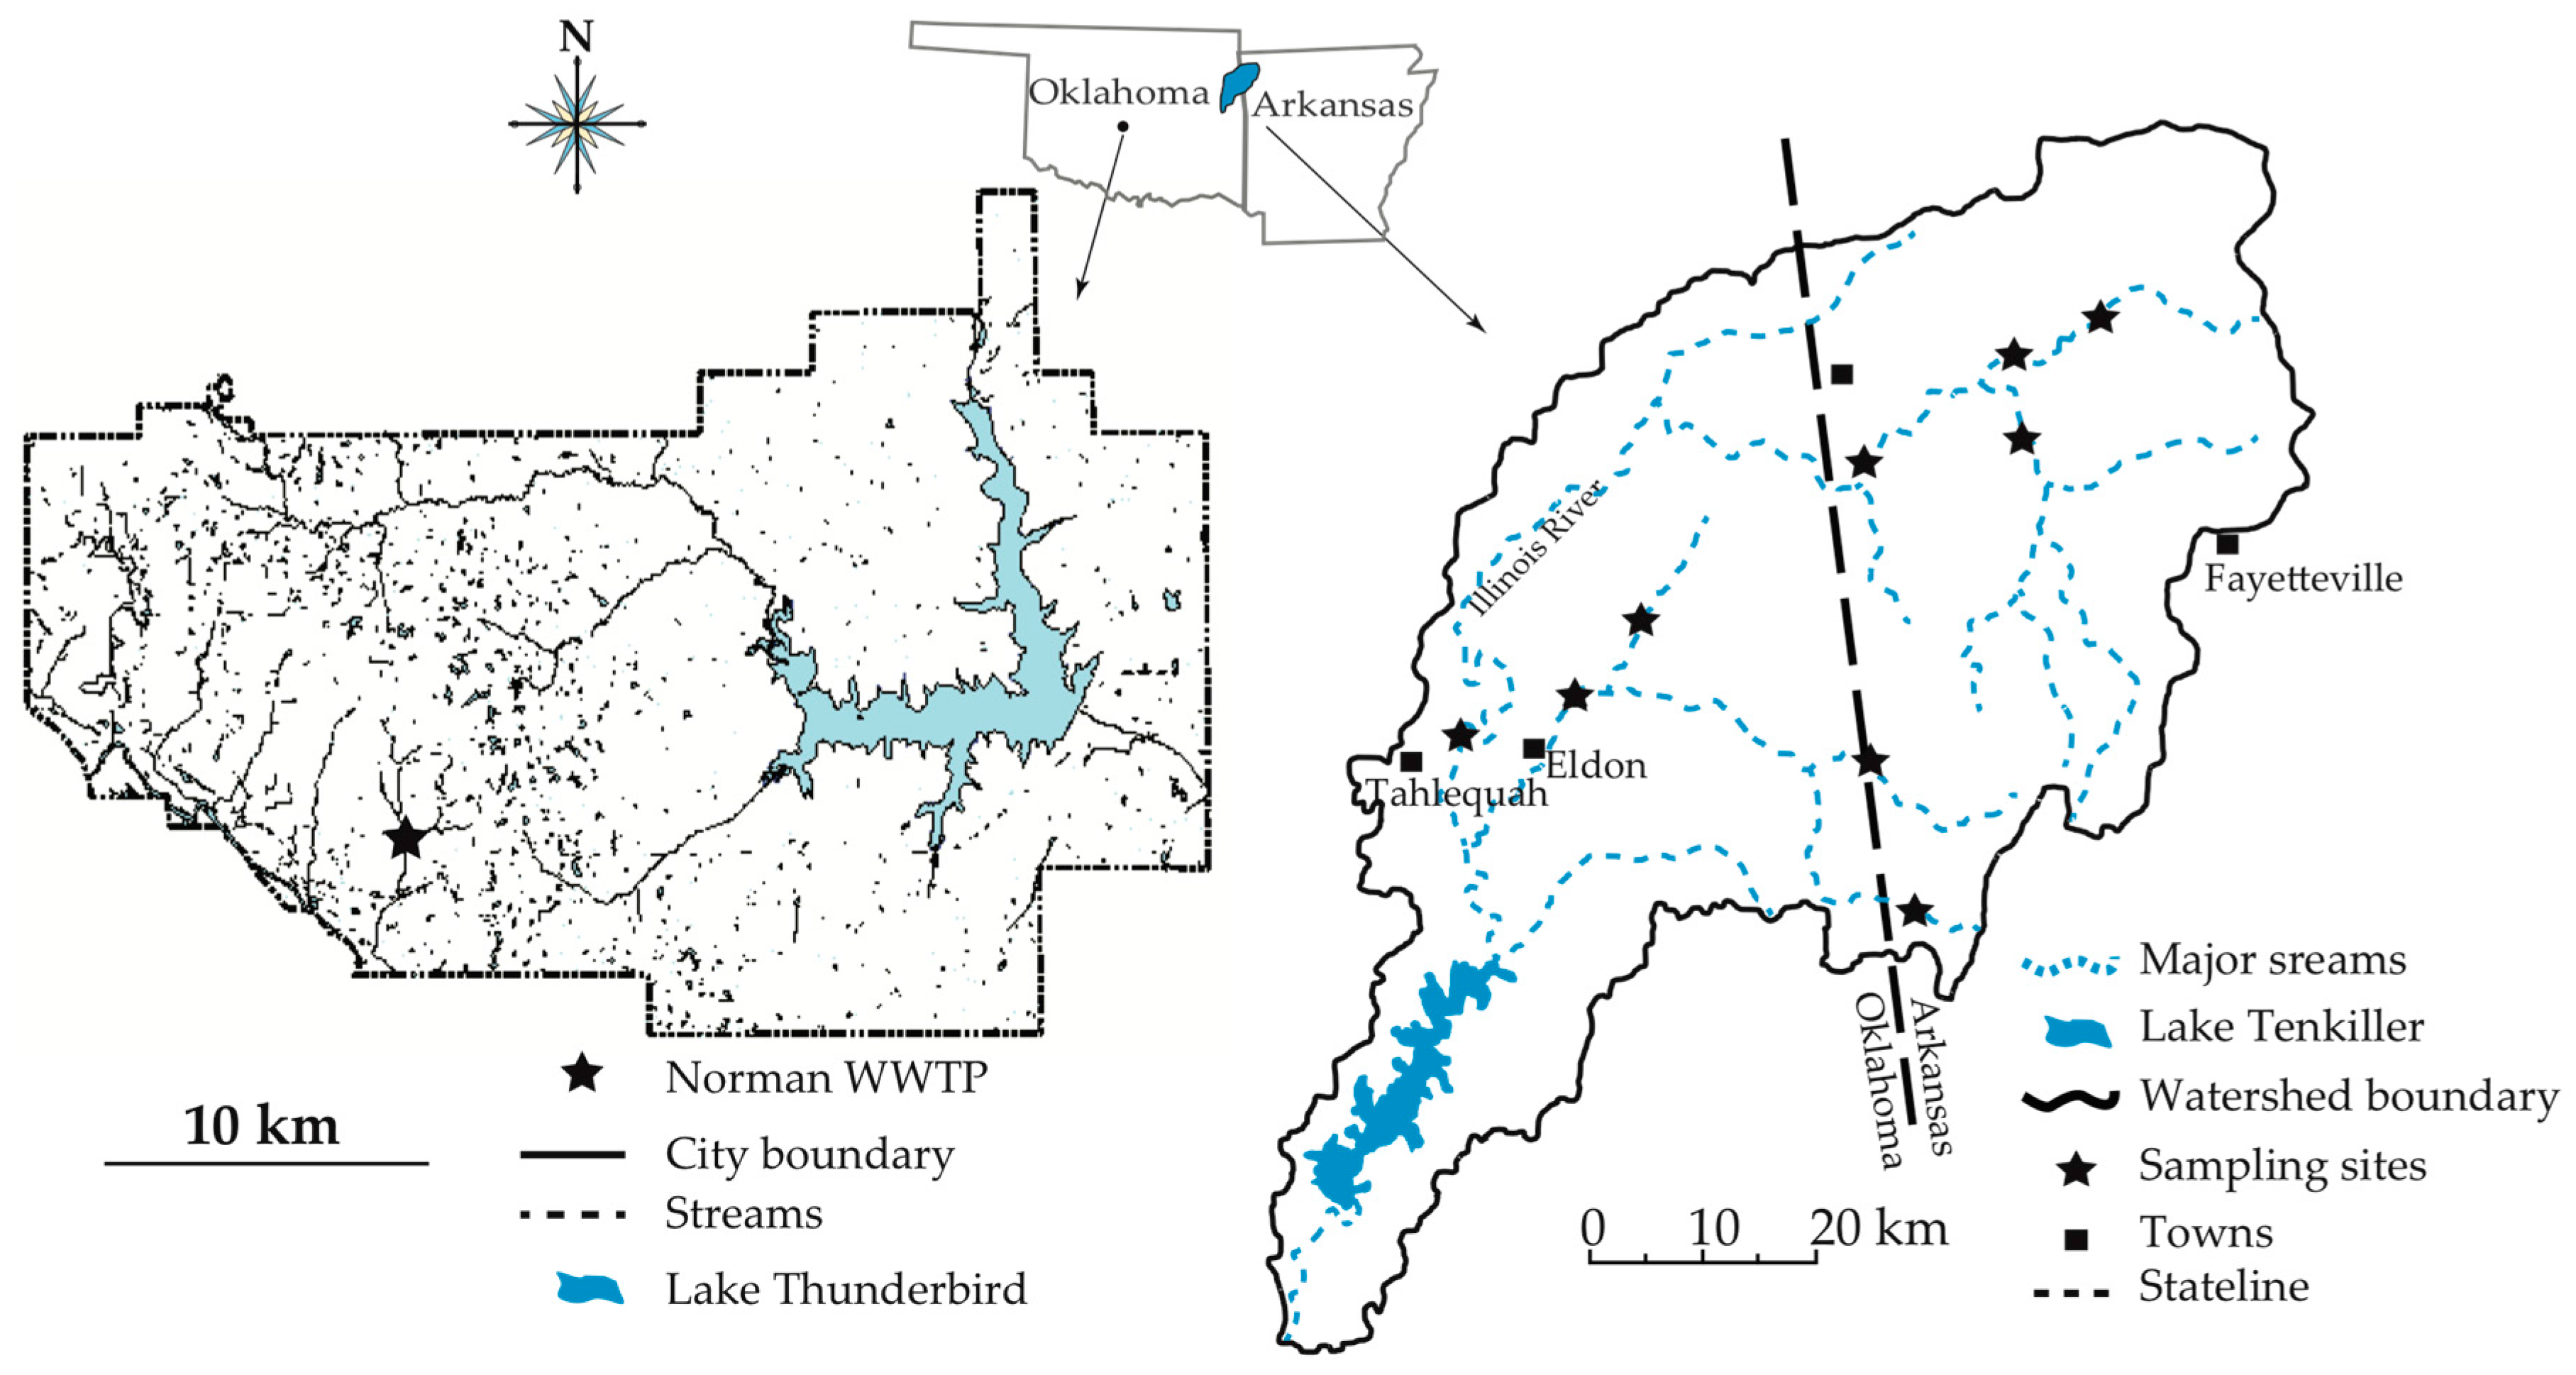
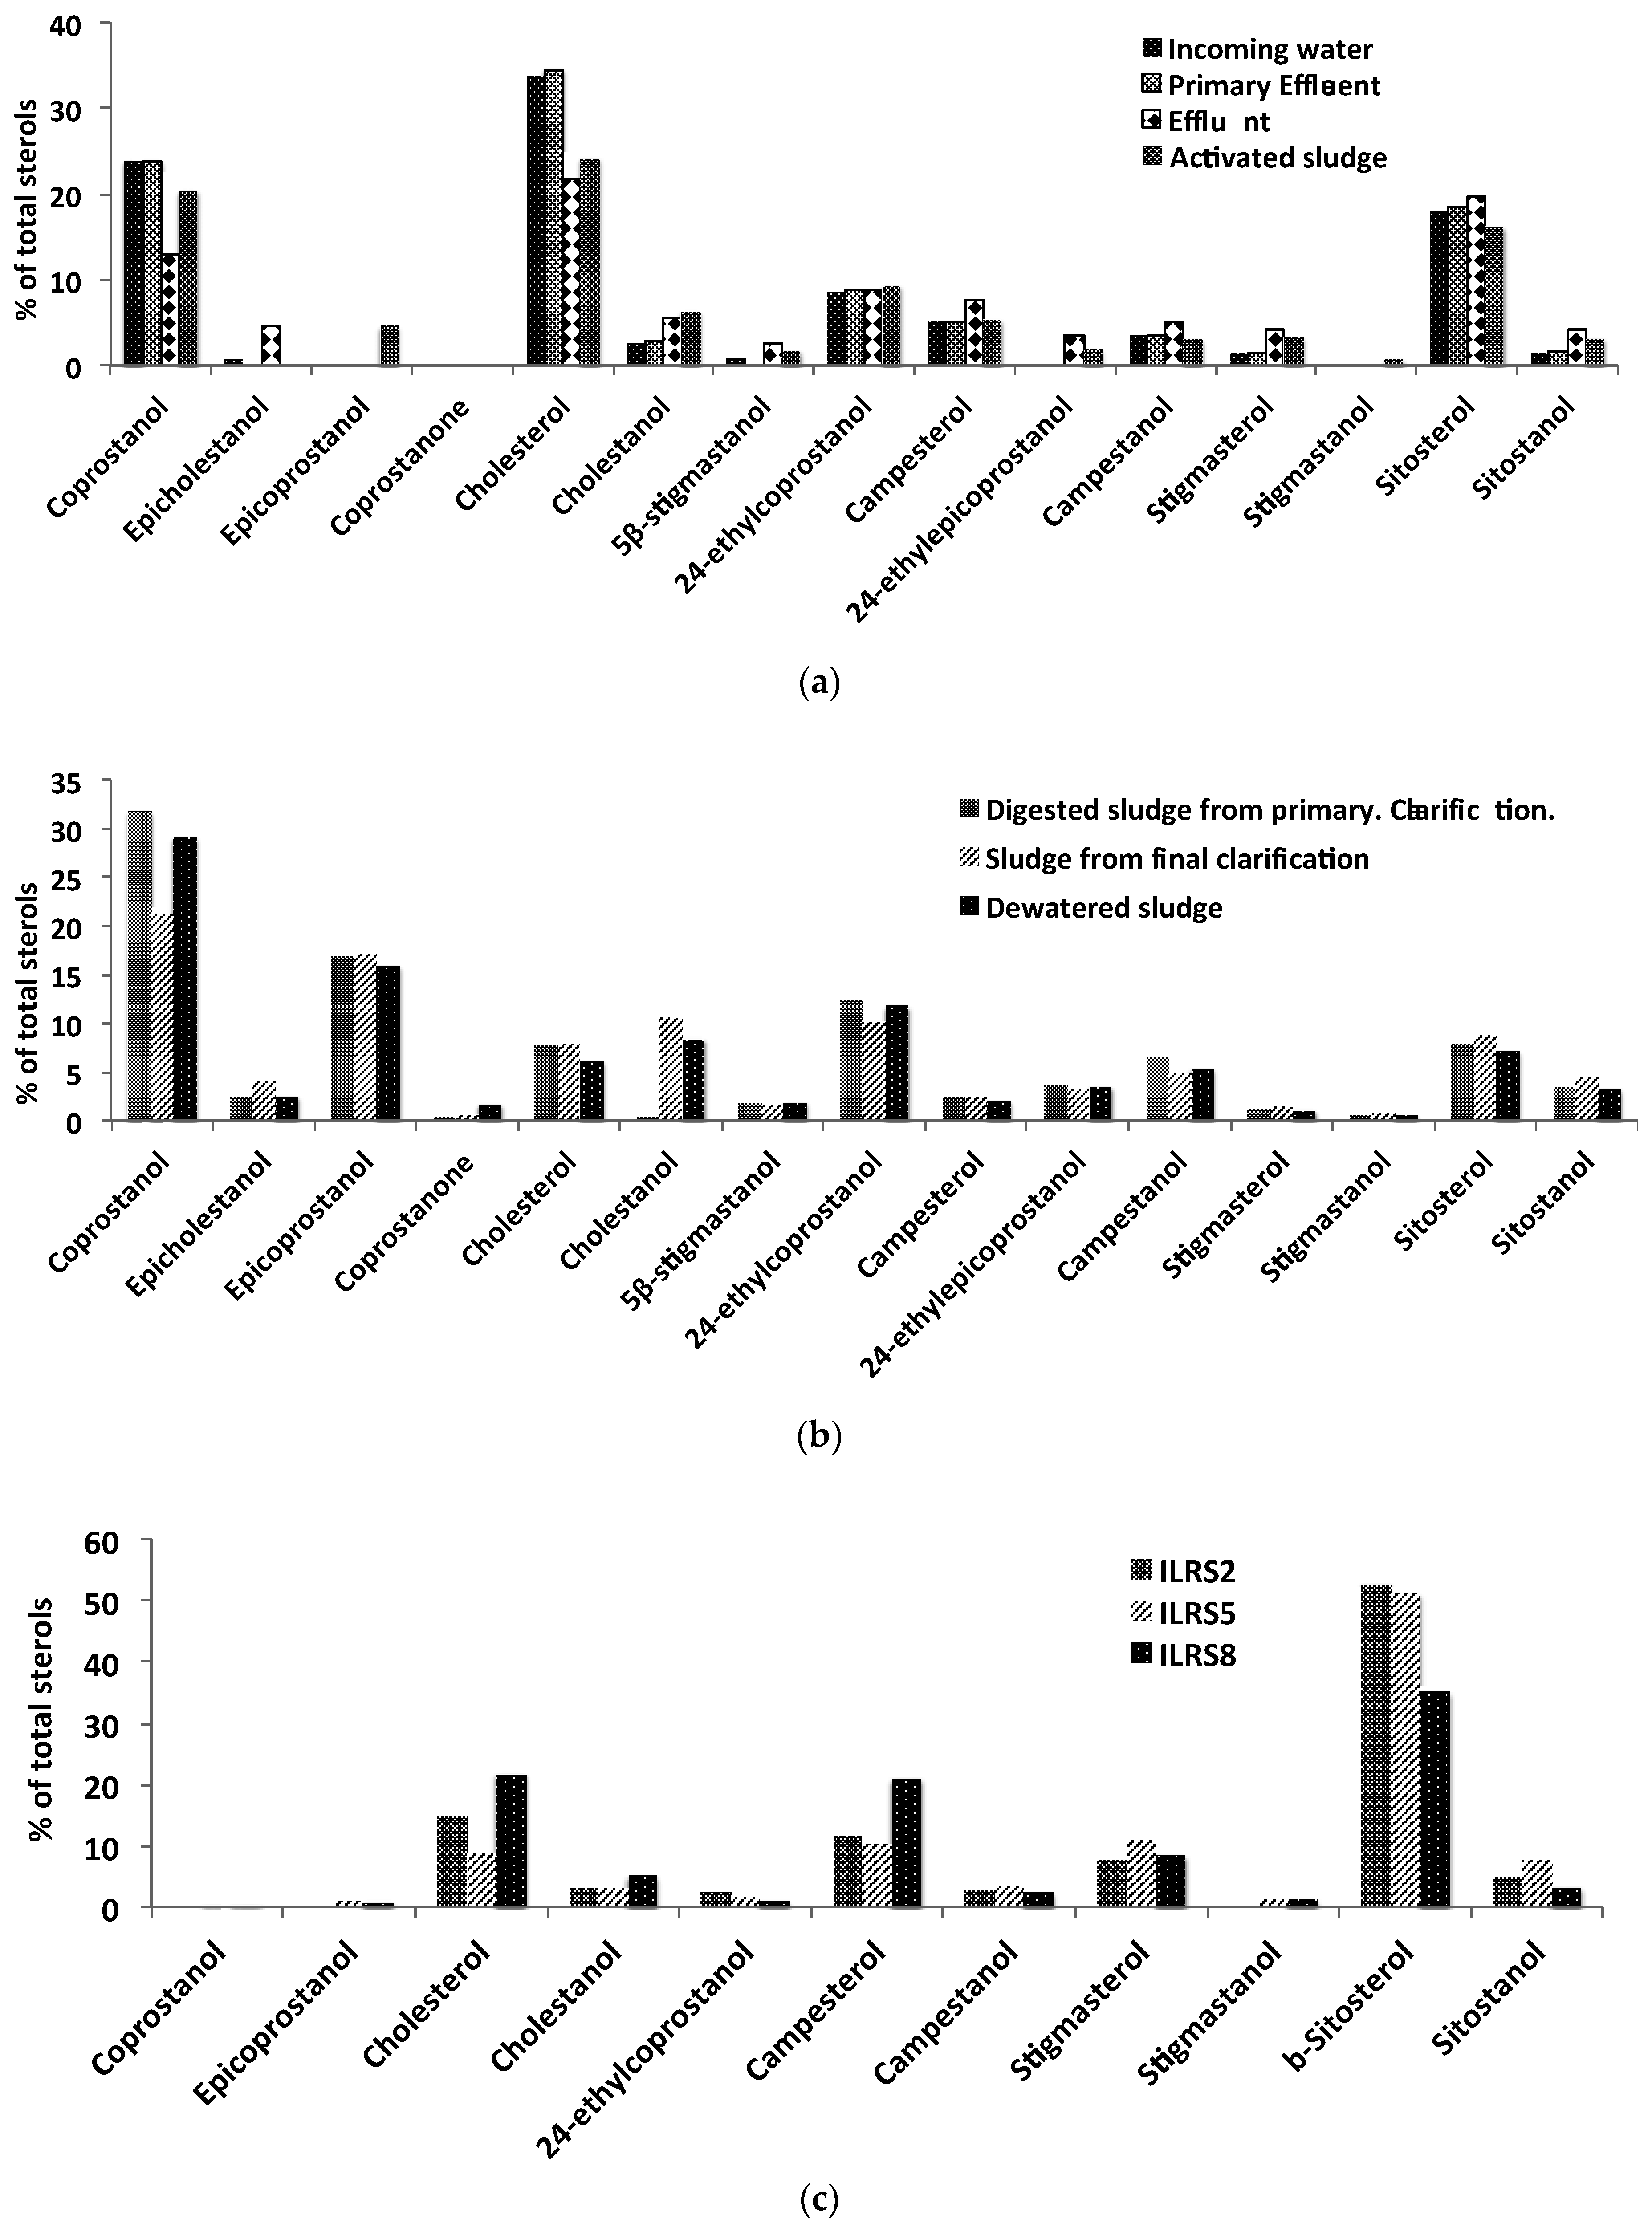
3.1. The Norman WWTP

Total sterol concentrations in the Norman WWTP samples ranged from 194 μg/L and 1625 μg/L for water and 12,724 μg/L and 74,099 μg/L for sludge. The difference in concentrations between the water and sludge could be explained by the hydrophobic nature of sterols. Due to their hydrophobic property, discharged sterols tend to associate with particulates and are progressively removed from the water during clarification that leads to a higher concentration of sterols in the sludge. The highest sterol concentration occurred in the primary sludge at 74,099 μg/L, where the solid material as well as domestic vegetable oil and grease accumulate. After undergoing anaerobic digestion, a large amount of organic matter was degraded and/or consumed by the anaerobic bacteria, and the concentration of total sterols was 5117 μg/g in the dewatered sludge of the Norman WWTP (Table 2).
Sterols were encountered in lower concentrations in the water than in the sludge. The influent and the primary effluent of the Norman WWTP exhibited similar sterol concentrations, namely 1615 μg/L and 1580 μg/L, respectively (Table 2). After undergoing the biological treatment and final clarification, the concentration of the total sterols was reduced by a factor of 8 and was 194 μg/L in the final effluent.
Despite the significant differences in sterol concentrations before and after treatments, all of the water, or all of the sludge, samples showed similar sterol distributions, but the water and sludge samples themselves were different (Figure 2). Water samples, including the activated sludge (high water content), were characterized by a predominance of cholesterol, coprostanol and sitosterol, representing more than 70% of the total sterols (Figure 2a). All of the sludge samples, excluding the activated sludge, exhibited high proportions of coprostanol, epicoprostanol, and 24-ethylcoprostanol, representing about 60% of the total sterols (Figure 2b).
Cholesterol is one of the vital components in the cell membranes of vertebrate organisms and some marine algae species [17,18]. It is also found, to a lesser extent, in some vascular plants [19]. Coprostanol is formed from the hydrogenation of cholesterol in the gut facilitated by reducing bacteria. It is found as one of the major sterols in the feces of numerous warm-blooded animals. The presence of high proportions of cholesterol and coprostanol are typical of omnivore feces signatures, such as human and porcine. Moreover, McCalley, et al. [33] pointed out that the conversion of cholesterol to coprostanol could also occur during sludge digestion, and a higher proportion of coprostanol relative to cholesterol would be found in digested sludge. This is consistent with that was observed in the Norman WWTP samples, where only the digested sludge showed higher amounts of coprostanol associated with relatively low amounts of cholesterol. During the wastewater treatment, concentrations of coprostanol and cholesterol were reduced from 385 μg/L and 547 μg/L in the influent to 25 μg/L and 42 μg/L, respectively, in the final effluent. Concentrations of coprostanol and cholesterol were still relatively high in the final dewatered sludge, i.e., 1489 μg/g and 313 μg/g, respectively (Table 2).
Epicoprostanol, an isomer of coprostanol, is another biodegradation product of cholesterol. It was found below the detection limit in all of the water samples but represented one of the major sterols in sludge samples. The differences in concentration between the water and sludge samples could be explained by the lipophilic property of epicoprostanol. However, according to McCalley, et al. [33], conversion of epicoprostanol does not occur extensively during intestinal digestion but is more effective under the sludge digestion process, due to the enforced and prolonged bacterial activity in the digestion tank. Epicoprostanol could be formed either by the dehydrogenation of cholesterol via coprostanone as an intermediate, or by epimerization of coprostanol during sludge digestion. Therefore, it has been proposed that epicoprostanol is more useful for distinguishing between contamination from treated and untreated waste. Consequently, in the Norman WWTP samples, the occurrence of epicoprostanol (below detection limit in water but high amounts in the sludge) is a result of the sludge treatment rather than human feces input.
β-Sitosterol is essentially synthesized by vascular plants and represents the major sterol in plant material. In the Norman WWTP water samples, it was present in relatively high proportions and represented about 20% of the total sterols. High proportions of β-sitosterol in urban wastewater could originate from domestic food products (cooking oil or vegetables), and/or from the washout of urban vegetation. Concentrations of β-sitosterol in water decreased after the wastewater treatment and were reduced by a factor of 7 compared to the influent.
24-Ethylcoprostanol, an anaerobic degradation product of β-sitosterol, represents one of the major sterols in the digested sludge but showed much lower concentrations in the water samples (Table 2). It is known as the major fecal sterol of ruminants, such as cow and sheep, but could also be present in relatively high concentrations in human feces, just slightly lower than coprostanol [21]. During the wastewater processes, about 88% of 24-ethylcoprostanol was removed from the water.
Besides the regular sterols, sulfur-containing steroids, like thiosteranes, were also identified in many of these samples. Two thiosteranes, cholestane-3β-thiol and 24-ethylcholestane-3β-thiol, were quantified in low concentrations in the final sludge products of the Norman WWTP (Table 2). A good correlation between the concentration of cholestane-3β-thiol and coprostanone was observed, which suggested the thiosteranes were possibly formed from stanones, such as coprostanone, in the presence of H2S and HS during anaerobic reduction process and are ultimately found in digested sludge. Due to the stability of these compounds under anoxic and suboxic conditions, it is proposed that these thiosteranes could be used as novel tracers for the environmental input of sewage products or land application of sewage sludge.

3.2. The Illinois River Basin

Because of their hydrophobic properties, sterols tend to associate with particulates in water and deposit on the surface of sediment layer. In the Illinois River Basin, only the uppermost surface sediment (of about 0.5 cm) was sampled; the results obtained from sediment were considered as comparable to those obtained from water.
In comparison to the urban samples, described above, samples from Illinois River Basin contained much lower concentrations of sterols varying between 1 and 7 μg/g d.w. sed. or 0.35 and 1.20 μg/mg of TOC. The Tenkiller Lake sample showed an exception, with sterol concentrations up to 37.98 μg/g d.w. sed. or 3.22 μg/mg of TOC. All of the Illinois River Basin samples showed similar sterol distributions (Figure 2c). β-Sitosterol was the major sterol with proportions varying between 32% and 53%. Cholesterol and campesterol were found as the second and third most abundant sterols, and their relative proportions varied between 15% and 28% and 10% and 21%, respectively. As previously mentioned, these sterols are synthesized by a large range of living organisms (including plants and animals), and are ubiquitous in the environment. Their occurrence in the Illinois River samples does not reveal any specific information on their source. Other sterols, in particular fecal stanols, like coprostanol, epicoprostanol and 24-ethylcoprostanol, which contain specific source information, were found in relatively low concentrations in the studied samples. However, high amounts of phytosterols (β-sitosterol and campesterol) and cholesterol in parallel with low amounts of the fecal stanols in the Illinois River samples do not necessarily indicate the absence of fecal contamination. As pointed out by Leeming, et al. [21], low amounts, or the absence, of intestinal microflora in the gut of several warm-blooded animals may result in low amounts of ingested sterols being transformed into stanols during the digestion process. The non-transformed sterols are discharged and found as the major sterols in these animal feces, whereas the fecal stanols are found as minor compounds. Related animals having low amounts of intestinal microflora are dogs and several avian herbivores like chicken [34,35].
In an attempt to refine the source of contamination, principal component analysis was performed on the sterol distributions of the Illinois River Basin samples and several ”pure” feces samples, such as pig, human, domestic pets, WWTP water, cow, chicken, horse. The latter were considered as potential sources of contamination in the study area. Statistical analysis was performed using the sterol distribution of different pure fecal sources. Different groups were discriminated based on the proportion of cholesterol (87%, F1 axis) and of β-sitosterol plus coprostanol (55% + 28%, F2 axis). Each group corresponds, a posteriori, to specific group of animals having similar diets and the ability to convert sterols into stanols (Figure 3). Indeed, herbivores, like cows, buffalo, sheep, horse, comprise the first group, and their feces are characterized by high proportions of C29-sterols and C29-stanols. The second herbivore group, comprising by avian herbivore such as chicken, swan, and rosella, differs from the others by the presence of a high proportion of C29-sterols and low amounts of C29-stanols. Several carnivore avian species (including magpie and seagull), as well as dogs, constituted the third group. The latter group showed higher proportion of C27-sterols and lower proportion of C29-sterols. Other omnivores, such as humans and pigs, differed from the others by having a relatively high proportion of C27-stanols and C29-stanols. The Illinois River samples showed similar fecal sterol distributions to those of the avian herbivore group. This similarity indicates a potential contribution from the fecal material of swan, rosella and chicken into the Illinois River Basin. However, due to the low amount of fecal stanols and the ability of stanol formation during the incorporation of sterols into the sediments [36], interpretation of PCA results should be undertaken with caution.
In order to confirm the interpretation obtained from PCA, compound specific isotope analysis (CSIA) was performed on several selected sterols, in particular phytosterols. CSIA applied to phytosterols is based on the differences in carbon isotope signatures between C3 and C4 plants [37]. Indeed, during plant photosynthesis, atmospheric 12C carbon dioxide is preferentially incorporated by plants, leading to the formation of sterols that are isotopically lighter than atmospheric carbon dioxide [38]. This fractionation is more important for C3 than C4 plants, due to the two different photosynthetic pathways employed by these plants, which is the Calvin cycle for C3 plants and the C4-dicarboxylic acid pathway for C4 plants. Therefore, C3 plants are generally more depleted in 13C (ranges −33‰–−22‰) than C4 plants (around −20‰–−10‰) [39,40,41]. Among the current terrestrial vegetation, C3 plants dominate and represent 85% of plant species including all trees and most temperate and cold species. C4 plants comprise a minority of terrestrial plant species, less than 4%, and are mostly concentrated in the tropical and subtropical areas [42]. The most common C4 plant species are corn, sorghum, millet and sugarcane. Hence, determination of the δ13C values of selected phytosterols is a reliable tool to discriminate between livestock feedlot sources (i.e., cattle) and wild animals (i.e., deer) as sources of fecal pollution, since in the former, the animals are mainly fed with corn (C4 plants) whereas the latter consume mainly grass (C3 plants).
Previously, Chikaraishi, et al. [43] defined the δ13C variation ranges of several selected phytosterols in C3 and C4 plants. By comparison with the data published by the authors, the phytosterols detected in the Illinois River Basin samples showed intermediate isotopic values between C3 and C4 plants. As the land in the Illinois River Basin is mainly covered by C3 plants, in which the δ13C is more depleted than C4 plants, the shift towards heavier δ13C values measured in Illinois samples should refer to the C4 plant contribution. As C4 plants were not cultivated in the study area, but corn is widely used as feed in the poultry farms, the shift towards heavier δ13C in Illinois River Basin samples was most likely the result of chicken manure input from surrounding chicken farms.

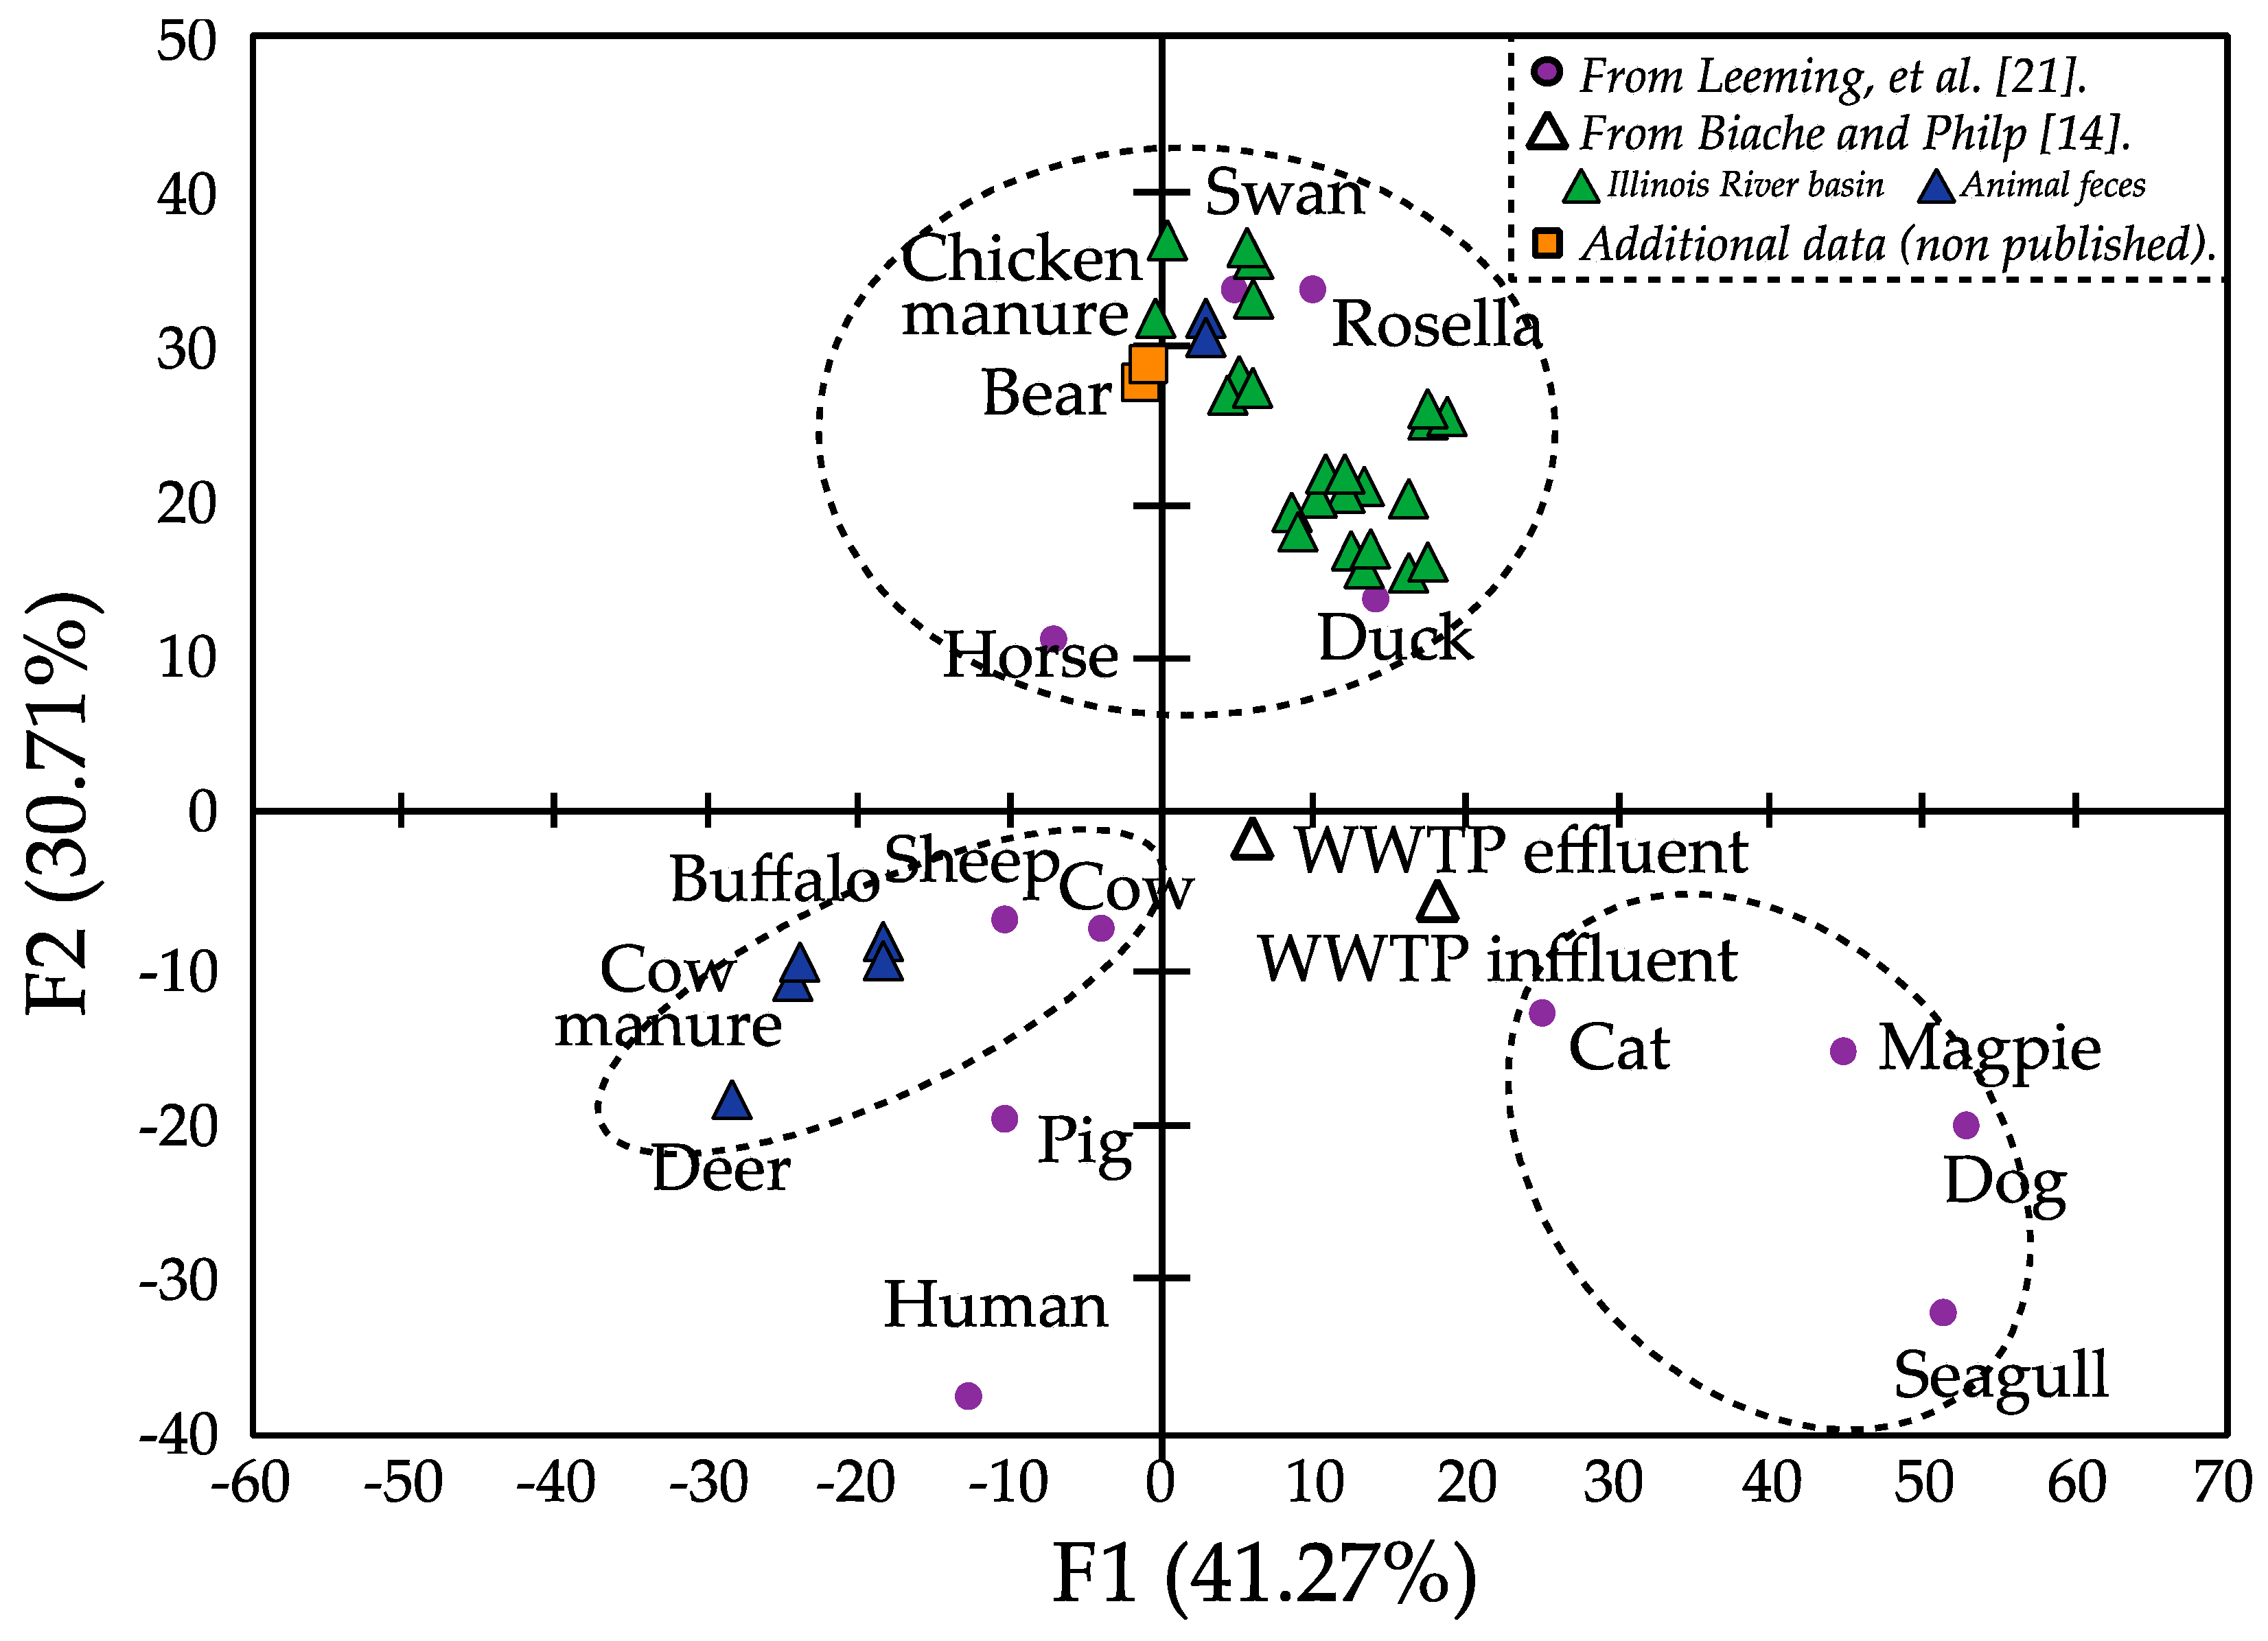
3.3. Sterol Fingerprint as Source of Fecal Contamination Indicator

The decrease in concentration and the change in distribution of the sterols, in particular coprostanol, cholesterol, epicoprostanol and thiosteranes, from input to output of the Norman WWTP indicate the effective removal of the fecal material at the Norman WWTP. However, human fecal signature could still be clearly recognized in the final products (including effluent and dewatered sludge), which is characterized by a predominance of coprostanol. As the final effluent is directly discharged into the Oklahoma river system after the plant, and the final sludge is generally used for agriculture field application, the sterol fingerprints obtained from the output of the WWTP can provide qualitative insights on the impacts of urban sewage on the regional environmental quality. Moreover, use of a combined approach of sterol fingerprint and the carbon CSIA also provides a powerful tool for source tracking in some non-point source pollution sites, such as the Illinois River Basin.
In addition to sterol concentrations and distributions, several sterol ratios were also useful for source discrimination. Examples given in Table 3 were previously determined to discriminate human feces contamination and were applicable to different sample matrices like water, sediment and/or sludge. Ratio calculations were performed, based on the results obtained by Biache, et al. [29], on the Norman WWTP samples. The results (ratios R1 to R7 reported in Table 3) confirmed that human feces contamination was dominant in the Norman WWTP samples, including the final effluent and dewatered sludge.
Sterol ratios could also be used to distinguish different animal feces, such as pig, cow, chicken, horse and deer from a cross-polluted water or sediment from rural sites. For instance, sitostanol/coprostanol was used by Derrien, et al. [48] to discriminate cow (1.5–3.3) and pig (0.2–1.0) feces. Coprostanol/(Coprostanol + 24-ethylcoprostanol) × 100 permits differentiation between human (>73), herbivore (<38) feces and mixtures of the same (38–73) [45,49]. The ratio of (coprostanol+epicoprostanol)/cholesterol was used by Standley, et al. [22] to discriminate human (<0.01) and cattle/horse/deer (>0.1) feces. Compared to CSIA, which provides relevant results but involves the use of highly precise and costly measurement by isotope ratio mass spectrometer (IRMS), calculation of sterol ratios is cheaper, faster, and can provide a rapid and relatively reliable preliminary interpretation on the source of fecal contamination.
Fecal material input to the environment is permanent, although the presence of fecal material does not necessarily have to be related to contamination. For a better environmental quality assessment, it is also necessary to associate the FIB interpretation, from which the presence and level of fecal contamination can be determined. Theoretically, for a known fecal source, the quantity of fecal sterols in water should reflect the quantity of fecal material released into the water. Hence, the sterol concentration could also be potentially used to indicate fecal contamination. Numerous studies have demonstrated a potential correlation between sterol fingerprints and FIBs [25,49,50,51,52,53]. For example, it has been shown that coprostanol concentrations of 60 and 400 ng/L seem to correspond to the defined primary and secondary contact limits for thermo-tolerant coliforms and entercococci [49,51]. However, Isobe, et al. [52] also pointed out that this correlation, in particular between coprostanol concentrations and E. coli density, could be affected by seasonal and geographic variation effects. Indeed, in the current environment, FIBs and molecular MST markers could degrade at different rates due to their differential fate and transport [54], and the half-life of coprostanol under aerobic conditions is <10 days [55]; therefore, a reliable correlation between coprostanol (or other fecal stanols) and FIBs should be expected under limited conditions such as the feces being fresh or recently released. The relationship between FIBs and sterol fingerprints seems very complex and need to be more thoroughly investigated in further monitoring programs.

4. Conclusions

Sterol fingerprints have been show to be an efficient tool for tracking sources of contamination in urban and rural areas of Oklahoma. Based on changes of sterol fingerprints, the removal efficiency of sterols by the wastewater treatment was evident. A qualitative insight, referring to sterol concentration and distribution in the final products of plant (effluent and dewatered sludge), into the release of urban sewage into the environment after the Norman WWTP was also given. The use of a combined approach of sterol fingerprints and compound specific isotopic ratios of several selected sterols allowed the determination of contamination sources in non-point pollution sites such as the Illinois River Basin. However, the performance of sterol fingerprints still needs to be improved, especially the use of sterol profiles, as an indicator of fecal contamination. The success of the application of sterol fingerprint in source tracking promotes our current monitoring project, which aims to trace the fecal contamination in different Oklahoma Watersheds through a one-year survey period. By tracing the sterol fingerprint variations, it should also be possible to monitor the changes of fecal contamination sources throughout seasons, special weather events (e.g., rainfall, drought) and changes in land-uses.

Author Contributions

Yueming Lu prepared a first of draft of this “review-type” manuscript based on discussions with R. Paul Philp. R. Paul Philp and Coralie Biache collaborated previously together on this subject and contributed to the research papers cited in this manuscript. They revised and improved the presentation the manuscript.

Conflicts of Interest

The authors declare no conflict of interest. The funding sponsors had no role in the design of the study; in the collection, analyses, or interpretation of data; in the writing of the manuscript, and in the decision to publish the results.

References

  1. UN-Water. Coping with water scarcity: Challenge of the twenty-first century. In 2007 World Water Day; FAO Publishing: Rome, Italy, 2007. [Google Scholar]
  2. World Water Assessment Programme. The United Nations World Water Development Report 2014: Water and Energy; United Nations Educational, Scientific and Cultural Organization: Paris, France, 2014. [Google Scholar]
  3. Field, K.G.; Samadpour, M. Fecal source tracking, the indicator paradigm, and managing water quality. Water Res. 2007, 41, 3517–3538. [Google Scholar] [CrossRef] [PubMed]
  4. World Health Organization. Health-Based Monitoring of Recreational Waters: The Feasibility of a New Approach; World Health Organization: Geneva, Switzerland, 1999. [Google Scholar]
  5. Simpson, J.M.; Santo Domingo, J.W.; Reasoner, D.J. Microbial source tracking: State of the science. Environ. Sci. Technol. 2002, 36, 5279–5288. [Google Scholar] [CrossRef] [PubMed]
  6. Mainstone, C.P.; Parr, W. Phosphorus in rivers—Ecology and management. Sci. Total Environ. 2002, 282, 25–47. [Google Scholar] [CrossRef]
  7. Glibert, P.; Burkholder, J. The complex relationships between increases in fertilization of the earth, coastal eutrophication and proliferation of harmful algal blooms. In Ecology of Harmful Algae; Springer: Berlin/Heidelberg, Germany, 2006; pp. 341–354. [Google Scholar]
  8. Gerba, C.P.; Smith, J.E. Sources of pathogenic microorganisms and their fate during land application of wastes. J. Environ. Qual. 2005, 34, 42–48. [Google Scholar] [PubMed]
  9. Soller, J.A.; Schoen, M.E.; Bartrand, T.; Ravenscroft, J.E.; Ashbolt, N.J. Estimated human health risks from exposure to recreational waters impacted by human and non-human sources of faecal contamination. Water Res. 2010, 44, 4674–4691. [Google Scholar] [CrossRef] [PubMed]
  10. Scott, T.M.; Rose, J.B.; Jenkins, T.M.; Farrah, S.R.; Lukasik, J. Microbial source tracking: Current methodology and future directions. Appl. Environ. Microbiol. 2002, 68, 5796–5803. [Google Scholar] [CrossRef] [PubMed]
  11. Boehm, A.B.; van de Werfhorst, L.C.; Griffith, J.F.; Holden, P.A.; Jay, J.A.; Shanks, O.C.; Wang, D.; Weisberg, S.B. Performance of forty-one microbial source tracking methods: A twenty-seven lab evaluation study. Water Res. 2013, 47, 6812–6828. [Google Scholar] [CrossRef] [PubMed]
  12. Gourmelon, M.; Caprais, M.-P.; Mieszkin, S.; Marti, R.; Wery, N.; Jardé, E.; Derrien, M.; Jadas-Hécart, A.; Communal, P.; Jaffrezic, A.; et al. Development of microbial and chemical mst tools to identify the origin of the faecal pollution in bathing and shellfish harvesting waters in France. Water Res. 2010, 44, 4812–4824. [Google Scholar] [CrossRef] [PubMed] [Green Version]
  13. Ervin, J.S.; van de Werfhorst, L.C.; Murray, J.L.; Holden, P.A. Microbial source tracking in a coastal california watershed reveals canines as controllable sources of fecal contamination. Environ. Sci. Technol. 2014, 48, 9043–9052. [Google Scholar] [CrossRef] [PubMed]
  14. Biache, C.; Philp, R.P. The use of sterol distributions combined with compound specific isotope analyses as a tool to identify the origin of fecal contamination in rivers. Water Res. 2013, 47, 1201–1208. [Google Scholar] [CrossRef] [PubMed]
  15. Sinigalliano, C.D.; Fleisher, J.M.; Gidley, M.L.; Solo-Gabriele, H.M.; Shibata, T.; Plano, L.R.; Elmir, S.M.; Wanless, D.; Bartkowiak, J.; Boiteau, R.; et al. Traditional and molecular analyses for fecal indicator bacteria in non-point source subtropical recreational marine waters. Water Res. 2010, 44, 3763–3772. [Google Scholar] [CrossRef] [PubMed]
  16. Griffith, J.F.; Layton, B.A.; Boehm, A.B.; Holden, P.A.; Jay, J.A.; Hagedorn, C.; McGee, C.D.; Weisberg, S.B. The California Microbial Source Identification Manual: A Tiered Approach to Identifying Fecal Pollution Sources to Beaches; Technical Report 804; Southern California Coastal Water Research Project: Costa Mesa, CA, USA, 2013. [Google Scholar]
  17. Volkman, J.K. A review of sterol markers for marine and terrigenous organic matter. Organ. Geochem. 1986, 9, 83–99. [Google Scholar] [CrossRef]
  18. Jardé, E.; Gruau, G.; Mansuy-Huault, L.; Peu, P.; Martinez, J. Using sterols to detect pig slurry contribution to soil organic matter. Water Air Soil Pollut. 2007, 178, 169–178. [Google Scholar] [CrossRef]
  19. Benveniste, P. Sterol biosynthesis. Annu. Rev. Plant Physiol. 1986, 37, 275–308. [Google Scholar] [CrossRef]
  20. Grimalt, J.O.; Fernandez, P.; Bayona, J.M.; Albaiges, J. Assessment of fecal sterols and ketones as indicators of urban sewage inputs to coastal waters. Environ. Sci. Technol. 1990, 24, 357–363. [Google Scholar] [CrossRef]
  21. Leeming, R.; Ball, A.; Ashbolt, N.; Nichols, P. Using faecal sterols from humans and animals to distinguish faecal pollution in receiving waters. Water Res. 1996, 30, 2893–2900. [Google Scholar] [CrossRef]
  22. Standley, L.J.; Kaplan, L.A.; Smith, D. Molecular tracers of organic matter sources to surface water resources. Environ. Sci. Technol. 2000, 34, 3124–3130. [Google Scholar] [CrossRef]
  23. Carreira, R.S.; Wagener, A.L.R.; Readman, J.W. Sterols as markers of sewage contamination in a tropical urban estuary (Guanabara Bay, Brazil): Space–time variations. Estuar. Coast. Shelf Sci 2004, 60, 587–598. [Google Scholar] [CrossRef]
  24. Leeming, R.; Stark, J.S.; Smith, J.J. Novel use of faecal sterols to assess human faecal contamination in antarctica: A likelihood assessment matrix for environmental monitoring. Antarct. Sci. 2015, 27, 31–43. [Google Scholar] [CrossRef]
  25. Isobe, K.O.; Tarao, M.; Zakaria, M.P.; Chiem, N.H.; Minh, L.Y.; Takada, H. Quantitative application of fecal sterols using gas chromatography-mass spectrometry to investigate fecal pollution in tropical waters: Western Malaysia and Mekong delta, Vietnam. Environ. Sci. Technol. 2002, 36, 4497–4507. [Google Scholar] [CrossRef] [PubMed]
  26. Ferezou, J.; Gouffier, E.; Coste, T.; Chevallier, F. Daily elimination of fecal neutral sterols by humans. Digestion 1978, 18, 201–212. [Google Scholar] [CrossRef] [PubMed]
  27. Fry, J.A.; Xian, G.; Jin, S.; Dewitz, J.A.; Homer, C.G.; Limin, Y.; Barnes, C.A.; Herold, N.D.; Wickham, J.D. Completion of the 2006 national land cover database for the conterminous United States. Photogramm. Eng. Remote Sens. 2011, 77, 858–864. [Google Scholar]
  28. Sims, J.T.; Wolf, D.C. Poultry waste management: Agricultural and environmental issues. In Advances in Agronomy; Academic Press: Cambridge, MA, USA, 1994; Volume 52, pp. 2–72. [Google Scholar]
  29. Biache, C.; Frómeta, A.E.N.; Czechowski, F.; Lu, Y.; Philp, R.P. Thiosteranes in samples impacted by fecal materials and their potential use as marker of sewage input. Environ. Pollut. 2015, 196, 268–275. [Google Scholar] [CrossRef] [PubMed]
  30. Vega, M.; Pardo, R.; Barrado, E.; Debán, L. Assessment of seasonal and polluting effects on the quality of river water by exploratory data analysis. Water Res. 1998, 32, 3581–3592. [Google Scholar] [CrossRef]
  31. Wenning, R.J.; Erickson, G.A. Interpretation and analysis of complex environmental data using chemometric methods. TrAC Trends Anal. Chem. 1994, 13, 446–457. [Google Scholar] [CrossRef]
  32. Badin, A.-L.; Faure, P.; Bedell, J.-P.; Delolme, C. Distribution of organic pollutants and natural organic matter in urban storm water sediments as a function of grain size. Sci. Total Environ. 2008, 403, 178–187. [Google Scholar] [CrossRef] [PubMed]
  33. McCalley, D.V.; Cooke, M.; Nickless, G. Effect of sewage treatment on faecal sterols. Water Res. 1981, 15, 1019–1025. [Google Scholar] [CrossRef]
  34. Subbiah, M.T.R.; Kottke, B.A.; Zollman, P.E. Fecal sterols of some avian species. Comp. Biochem. Physiol. Part B Comp. Biochem. 1972, 41, 695–704. [Google Scholar] [CrossRef]
  35. Burczak, J.D.; McNaughton, J.L.; Kellogg, T.F. Cholesterol metabolism in poultry, gallus domesticus: Fecal neutral sterol and bile acid excretion. Comp. Biochem. Physiol. Part B Comp. Biochem. 1980, 66, 385–389. [Google Scholar] [CrossRef]
  36. Meyers, P.A.; Ishiwatari, R. Lacustrine organic geochemistry—An overview of indicators of organic matter sources and diagenesis in lake sediments. Org. Geochem. 1993, 20, 867–900. [Google Scholar] [CrossRef]
  37. Philp, R.P. The emergence of stable isotopes in environmental and forensic geochemistry studies: A review. Environ. Chem. Lett. 2007, 5, 57–66. [Google Scholar] [CrossRef]
  38. Park, R.; Epstein, S. Carbon isotope fractionation during photosynthesis. Geochim. Cosmochim. Acta 1960, 21, 110–126. [Google Scholar] [CrossRef]
  39. Hobbie, E.A.; Werner, R.A. Intramolecular, compound-specific, and bulk carbon isotope patterns in C3 and C4 plants: A review and synthesis. New Phytol. 2004, 161, 371–385. [Google Scholar] [CrossRef]
  40. Ehleringer, J.R.; Cerling, T.E.; Helliker, B.R. C4 photosynthesis, atmospheric CO2, and climate. Oecologia 1997, 112, 285–299. [Google Scholar] [CrossRef]
  41. Bender, M.M. Variations in the 13C/12C ratios of plants in relation to the pathway of photosynthetic carbon dioxide fixation. Phytochemistry 1971, 10, 1239–1244. [Google Scholar] [CrossRef]
  42. Collatz, G.J.; Berry, J.A.; Clark, J.S. Effects of climate and atmospheric CO2 partial pressure on the global distribution of C4 grasses: Present, past, and future. Oecologia 1998, 114, 441–454. [Google Scholar] [CrossRef]
  43. Chikaraishi, Y.; Naraoka, H.; Poulson, S.R. Hydrogen and carbon isotopic fractionations of lipid biosynthesis among terrestrial (C3, C4 and CAM) and aquatic plants. Phytochemistry 2004, 65, 1369–1381. [Google Scholar] [CrossRef] [PubMed]
  44. Bull, I.D.; Lockheart, M.J.; Elhmmali, M.M.; Roberts, D.J.; Evershed, R.P. The origin of faeces by means of biomarker detection. Environ. Int. 2002, 27, 647–654. [Google Scholar] [CrossRef]
  45. Shah, V.G.; Hugh Dunstan, R.; Geary, P.M.; Coombes, P.; Roberts, T.K.; von Nagy-Felsobuki, E. Evaluating potential applications of faecal sterols in distinguishing sources of faecal contamination from mixed faecal samples. Water Res. 2007, 41, 3691–3700. [Google Scholar] [CrossRef] [PubMed]
  46. Chan, K.-H.; Lam, M.H.W.; Poon, K.-F.; Yeung, H.-Y.; Chiu, T.K.T. Application of sedimentary fecal stanols and sterols in tracing sewage pollution in coastal waters. Water Res. 1998, 32, 225–235. [Google Scholar] [CrossRef]
  47. Reeves, A.; Patton, D. Faecal sterols as indicators of sewage contamination in estuarine sediments of the Tay Estuary, Scotland: An extended baseline survey. Hydrolo. Earth Syst. Sci. 2005, 9, 81–94. [Google Scholar] [CrossRef]
  48. Derrien, M.; Jardé, E.; Gruau, G.; Pierson-Wickmann, A.-C. Extreme variability of steroid profiles in cow feces and pig slurries at the regional scale: Implications for the use of steroids to specify fecal pollution sources in waters. J. Agric. Food Chem. 2011, 59, 7294–7302. [Google Scholar] [CrossRef] [PubMed]
  49. Leeming, R.; Latham, V.; Rayner, M.; Nichols, P. Detecting and distinguishing sources of sewage pollution in australian inland and coastal waters and sediments. In Molecular Markers in Environmental Geochemistry; American Chemical Society: Washington, DC, USA, 1997; Volume 671, pp. 306–319. [Google Scholar]
  50. Dutka, B.J.; Chau, A.S.Y.; Coburn, J. Relationship between bacterial indicators of water pollution and fecal sterols. Water Res. 1974, 8, 1047–1055. [Google Scholar] [CrossRef]
  51. Leeming, R.; Nichols, P.D. Concentrations of coprostanol that correspond to existing bacterial indicator guideline limits. Water Res. 1996, 30, 2997–3006. [Google Scholar] [CrossRef]
  52. Isobe, K.O.; Tarao, M.; Chiem, N.H.; Minh, L.Y.; Takada, H. Effect of environmental factors on the relationship between concentrations of coprostanol and fecal indicator bacteria in tropical (Mekong delta) and temperate (Tokyo) freshwaters. Appl. Environ. Microbiol. 2004, 70, 814–821. [Google Scholar] [CrossRef] [PubMed]
  53. Savichtcheva, O.; Okabe, S. Alternative indicators of fecal pollution: Relations with pathogens and conventional indicators, current methodologies for direct pathogen monitoring and future application perspectives. Water Res. 2006, 40, 2463–2476. [Google Scholar] [CrossRef] [PubMed]
  54. Wang, D.; Farnleitner, A.H.; Field, K.G.; Green, H.C.; Shanks, O.C.; Boehm, A.B. Enterococcus and Escherichia coli fecal source apportionment with microbial source tracking genetic markers—Is it feasible? Water Res. 2013, 47, 6849–6861. [Google Scholar] [CrossRef] [PubMed]
  55. Ogura, K. Fate of coprostanol, an index of fecal pollution in Tokyo Bay. Geochemistry 1983, 17, 68–75. (In Japanese) [Google Scholar]
Figure 1. Map of the study area and sampling sites. (Left) The Norman WWTP, located in the center of Oklahoma; (Right) the Illinois River Basin, across the northeast of Oklahoma and northwest of Arkansas (Adapted from Biache and Philp [14]).
Environments 03 00028 g001
Figure 2. Sterol distribution of (a) the Norman WWTP water plus high water content, and (b) sludge samples, and of (c) the Illinois River samples. “ILR”: Illinois River.
Environments 03 00028 g002
Figure 3. Plot of the principal component analysis of the Illinois River sediments with some feces samples (Adapted from Biache and Philp [14]).
Environments 03 00028 g003
Table 1. Trivial and systematic names of the quantified sterols, their carbon number, molecular mass of their silylated counterparts (M.W.), the m/z and standard used for quantification.
Trivial NameSystematic NameNumber of CarbonM.W.m/z for Quantification and IdentificationStandard Used for Quantification
Cholestane-d6Cholestane-2.2.3.3.4.4-d627378223; 363; 115; 378Cholestane-d6
Coprostanol5β-cholestan-3β-ol27460370; 355; 75; 215; 95; 207Coprostanol
Epi-coprostanol5β-cholestan-3α-ol27460370; 215; 75; 355; 257Epicoprostanol
Cholesterol-d6Cholesterol-2.2.3.4.4.6-d627464333; 374; 131; 359; 73; 464Cholesterol-d6
CholesterolCholest-5-en-3β-ol27458129; 329; 368; 353; 458Cholesterol
Cholestanol5α-cholestan-3β-ol27460215; 75; 445; 355; 460; 405Cholestanol
Campesterol24-methylcholest-5-en-3β-ol28472129; 95; 82; 69; 343; 204; 109; 472β-Sitosterol
Campestanol24-methyl-5α-cholestan-3β-ol28474215; 75; 459; 369; 474; 305Sitostanol
Stigmasterol24-ethylcholesta-5,22(E)-dien-3β-ol29484129; 83; 484; 255; 394Stigmasterol
Stigmastanol24-ethyl-5α-cholesta-5,22(E)-dien-3β-ol29486257; 75; 55; 486; 353; 345Sitostanol
β-Sitosterol24-ethylcholest-5-en-3β-ol29486129; 357; 396; 73; 381; 486β-Sitosterol
Sitostanol24-ethyl-5α-cholestan-3β-ol29488215; 75; 473; 383; 488; 305Sitostanol
24-Ethylcoprostanol24-ethyl-5β-cholestan-3β-ol29488398; 383; 215; 75; 257Epicoprostanol
/5α-cholestane-3β-thiol27404249; 250; 389; 404Coprostanol
/24-ethyl-5α-cholestane-3β-thiol30432249; 250; 417; 432Coprostanol
Table 2. Steroid concentrations in the Norman WWTP samples (Reprinted from Biache, et al. [29]).
CompoundsIncoming Water (µg/L)Primary Effluent (µg/L)Effluent (µg/L)Digested Sludge from Primary Clarification (µg/L)Activated Sludge (µg/L)Sludge from Final Clarification (µg/L)Cake (µg/g)
Coprostanol3853762523,533259477341489
Epicholestanol a10<L.D.91872<L.D.1503129
Epicoprostanol b<L.D.<L.D.<L.D.12,4855816272813
Coprostanone c<L.D.<L.D.<L.D.369024687
Cholesterol54754542579730742896313
Cholestanol4043113488063859430
5β-stigmastanol d17<L.D.5131721462095
24-ethylcoprostanol14014017922611833695601
Campesterol8281151760681894102
24-ethylepicoprostanol e<L.D.<L.D.727552311161178
Campestanol55551048203821815271
Stigmasterol2423887541251754
Stigmastanol f<L.D.<L.D.<L.D.40610331427
β-Sitosterol29229338595320623227364
Sitostanol2325825824001648165
Sum steroids1615158019474,09912,72436,4015117
5α-cholestane-3β-thiol g<L.D.<L.D.<L.D.181<L.D.13818
24-ethyl-5α-cholestane-3β-thiol h<L.D.<L.D.<L.D.61<L.D.466
L.D.: Limit of Detection. Limit of detection for a 50 µg/L; b 50 µg/L; c 50 µg/L; d/e/f/g 50 µg/L; h 50 µg/L.
Table 3. Example of sterol ratios for identifying human fecal contamination and calculated ratios of Norman WWTP samples.
RatioSterol RatiosIncoming WaterDigested Sludge from Primary ClarificationPrimary EffluentActivated SludgeSludge from Final ClarificationEffluentCakeReference
R1Cpr/(Cpr + Chnl)0.91.00.90.80.70.70.8[20]
R2(Cpr + Epi)/(Cpr + Epi + Chnl)/1.0/0.80.8/0.8[44]
R3Cpr/Chtl0.74.10.70.82.70.64.8[23]
R4Cpr/Chnl9.667.68.73.22.02.33.5[45]
R5Cpr/(Chnl + Chtl)0.73.80.60.71.10.52.0[46]
R6Cprn/Cpr/0.0/0.00.0/0.1[20]
R7Cpr/Epi/1.9/4.51.2/1.8[47]
Human fecal contamination, if R1, R2 > 0.7, R3, R4 > 0.5, R5 > 0.2, R6 < 0.6, R7 > 1.5. Cpr: coprostanol; Chnl: Cholestanol; Epi: epicoprostanol; Chtl: cholesterol; Cprn: coprostanone.

