1. Introduction
Forests are of immense importance in the survival and development of human beings. Their enormous contributions range from air purification, to control of hydrological cycles, provision of ecosystem goods, and habitat for a great diversity of fauna [
1,
2]. In developing countries, forests play a significant role in supporting the livelihoods of communities living adjacent to them [
3]. For example, approximately 22% of the total income for rural communities in developing countries comes from forest products [
4]. A study conducted in Tigray, northern Ethiopia shows that forest products are the second largest source of income for local people after agriculture [
5]. Apart from income, forests are the main source of firewood for over 2.4 billion people worldwide [
3].
In the last 10 millenia, global forest-cover experienced a significant decline, going from about 6 billion ha to approximately 4 billion ha [
6], although the global annual rate of decline has shown a decreasing trend, from 0.2% between 1990 and 2000 to 0.12% and 0.14% in the periods from 2000 to 2005 and 2005 to 2010, respectively [
7]. Tropical regions have continued to experience rapid changes in forest-cover, with most regions recording high forest-cover loss compared to total forest gain [
8]. In Kenya, forests are estimated to cover about 6% of the total land-cover, which is below the 10% threshold recommended by the United Nations [
7]. Despite already being a low forest-cover country, Kenya has faced the additional challenge of forest-cover decline, losing approximately 241,000 ha of forest between 1990 and 2010 [
7]. The loss in forest-cover has been mostly attributed to deforestation fuelled by intense human activities [
9,
10,
11]. To address forest-cover decline, institutional and policy reforms were initiated to pave the way for involvement of all stakeholders in forest management.
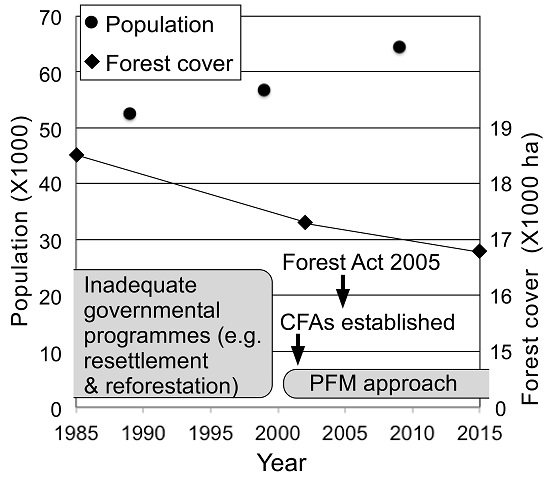
The Participatory Forest Management (PFM) approach was first introduced as a pilot project in the Arabuko Sokoke Forest in 1997 [
12,
13]. The enactment of the Forest Act in 2005 not only legalized the PFM approach but also led to the formation of the Kenya Forest Service (KFS), an institution mandated to oversee the management of all state forests. Article 46(1) of the Act decrees the formation of Community Forest Associations (CFAs). The roles of the CFAs include: protection, conservation, and management of designated forests as per forest management plan, developed in line with traditional user rights and assistance in enforcing the provisions of the forest act [
14].
Currently, over 325 registered CFAs are spread across the country [
15]. CFAs have faced a number of challenges, which include the slow implementation of PFM, the KFS ceding minimal forest legislative powers and control of forest resources to CFAs [
13,
16], weak organizational structure of CFAs, conflict of interest, issues around accountability, and lack of funding, among other factors [
17]. Nevertheless, a number of studies [
13,
18,
19,
20,
21] have reported an improvement in the livelihoods of CFA members as compared to non-CFA members. Few studies, however, have been conducted to document the contributions of CFAs in enhancing forest-cover, specifically in the Lembus Forest, a critical water catchment area. Meanwhile, PFM has been credited with improved forest protection and regeneration in Nepal [
22,
23], lower rates of deforestation in community-managed forests compared to protected areas in tropical regions [
24], and improved forest conservation in Mexico [
25].
Forest-cover monitoring helps in quantifying the impact of different approaches on forest management. Satellite remote sensing provides spatial and temporal charecteristics of land-cover change patterns; thus, it has been widely used to map forest-cover change [
8,
22,
24,
26,
27]. Therefore, this study applies satellite remote sensing, field observation, and a household questionnaire survey to: (1) analyse forest-cover change before and after the introduction of PFM; (2) identify factors driving the change; and (3) analyse the contribution of the CFAs in enhancing the Lembus Forest-cover.
2. Materials and Methods
2.1. Study Area
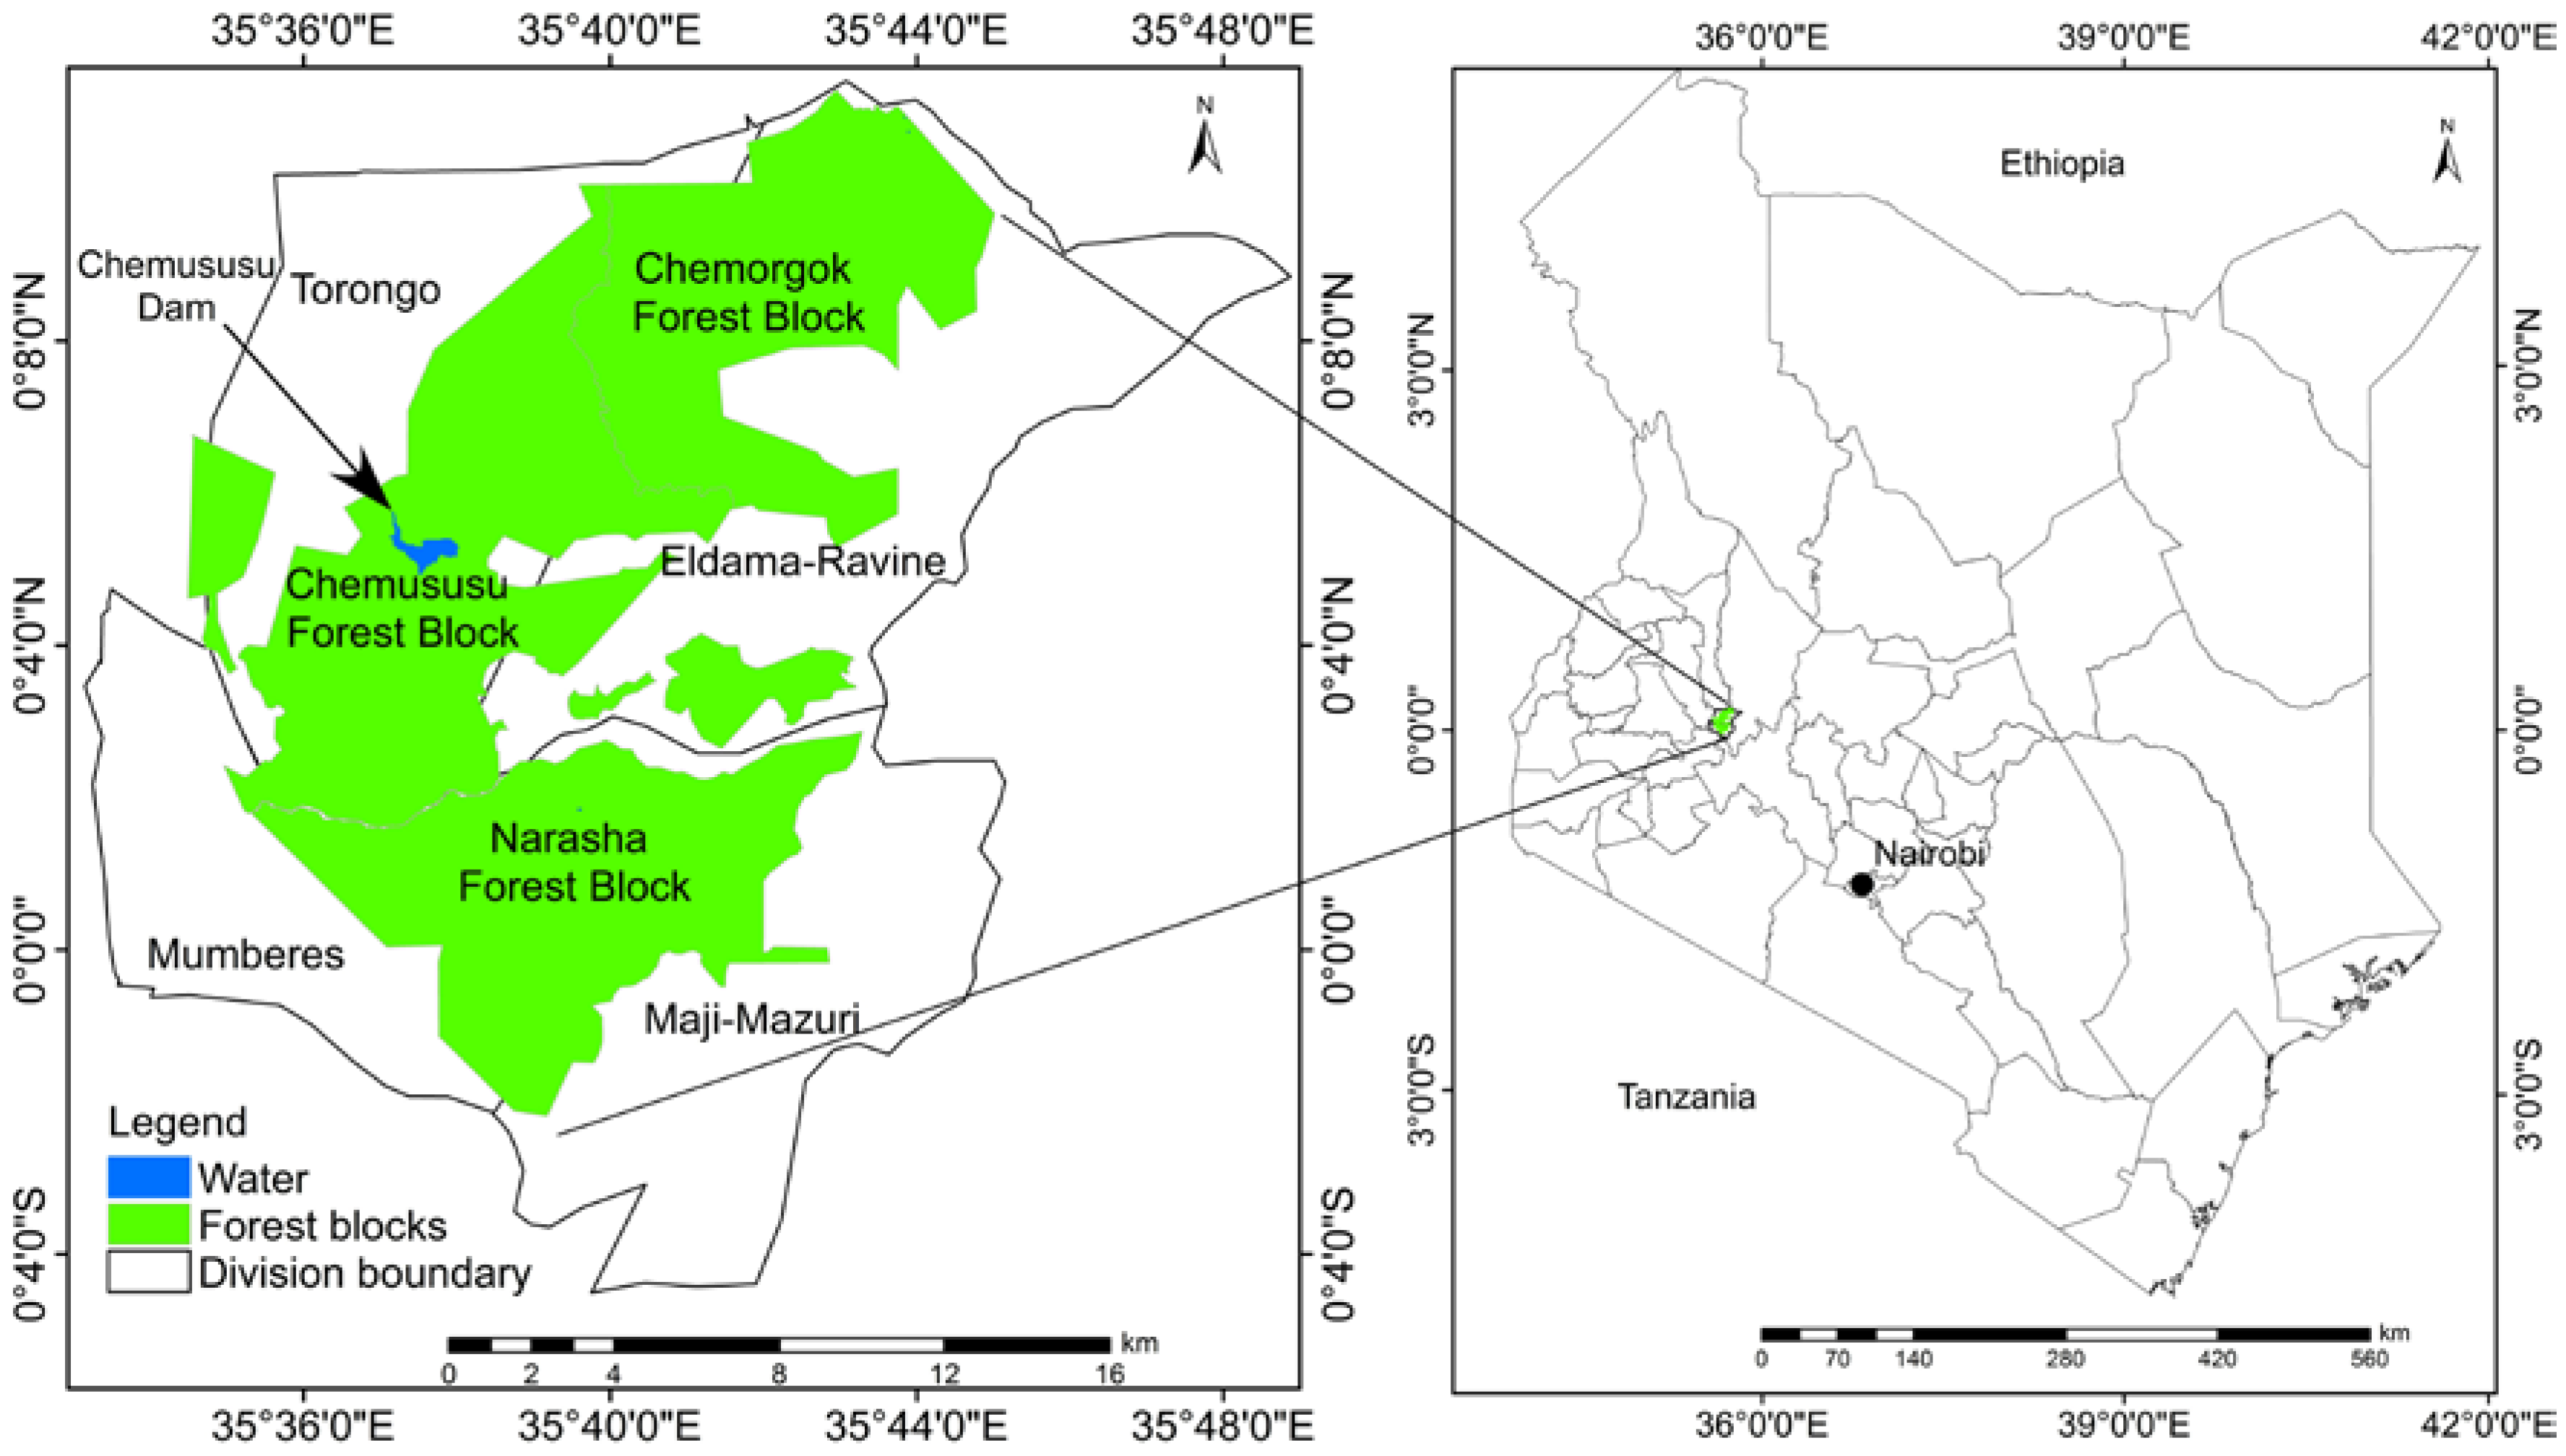
The Lembus Forest is located in the Eldama-Ravine sub-county, Baringo County in western Kenya (
Figure 1). It lies between latitudes 0°4’ S and 0°8’ N and longitudes 35°32’ E and 35°48’ E. The forest was “gazetted” (which means reserved for purposes other than forestry) in 1932 and is currently owned by the government. The forest is the main source of the Perkerra River, which supplies water to the Perkerra irrigation system. Additionally, recent construction of the Chemususu dam with the water capacity of 12 million m³ places this forest as a critical water catchment area.
The forest is made up of three major forest blocks; namely, Chemorgok, Chemususu, and Narasha Forest blocks, covering an area of approximately 21,232 ha in total. The forest is located at an altitude of 2391 m and receives a mean annual rainfall between 1200 mm and 1800 mm. The mean annual air temperature ranges from 10 °C to 24 °C. The Lembus Forest blocks form part of the Mau forest complex, the country’s largest closed canopy forest ecosystem, home to a great diversity of flora and fauna. The forest comprises both natural and plantation forest zones. The natural forest zones are dominated by indigenous tree species, which include Syzygium guinensis, Prunus africana, Podocarpus falcatus, Podocarpus latifolia, Olea africana, Albizia gumifera, Juniperus procera, Polysiscia kikuyensis, Dobeya torida, Olea capensis, and Viprous species. Plantation zones consist of exotic tree species such as Eucalyptus saligina, Cupressus lustanica, and Pinus patula.
2.2. Social Survey
The study utilised both primary and secondary data sets. The primary data included household questionnaire survey data. These questionnaires were administered to the respondents, who were mainly household heads living within the Torongo and Eldama-Ravine divisions (
Figure 1). The two divisions have about 1593 and 2986 households, respectively. Therefore, in total there are approximately 4559 households in the two divisions [
28]. The sample size was calculated using Cochran’s (1963:75) formula [
29] below:
where
n is the Sample size;
Z2 is a constant (Abscissa of normal curve that cuts off an area α at the tails, the value is found in statistical tables);
e2 is the level of precision, and
p is the estimated proportion of an attribute. From the formula, the sample size was found to be 385 respondents; however, 20% of the total questionnaires were added on top to take care of unreturned and invalid questionnaires. Thus, 500 households (170 and 330 households from Torongo and Eldama-Ravine, respectively) were sampled. We used a stratified sampling design, where each division was taken as a stratum and households within 5 km from the forest boundary were administered questionnaires at a systematic random sample rate of every 10th household (4559/500 = 10th periodic interval). Forest-adjacent communities living within 5 km of the forest boundary rely primarily on forest resources [
30]. The first household was randomly selected from the forest edge in each stratum, 10 households were skipped, and the 11th household sampled; the same process was repeated throughout the study area. In this study the respondents (i.e., “household heads”) refers to the person in charge or leading the family (man or woman). In the culture of the local community, men determine and influence the activities and decisions affecting the whole household. The questionnaire was structured to capture socio-economic attributes of the respondents, forest use, threats facing the forest, CFA membership, and their contributions in forest conservation and management. The study was limited with time constraints, thus it was difficult to organize or arrange focused group discussions. We were not able to organize meetings within our limited time frame due to the need for prior negotiations with community leaders. Nevertheless, key informants—namely, CFA leaders (the chairman, treasurer, and secretary), the deputy district forest officer, three forest managers and one officer in charge of enforcement and compliance, and lastly three elders per forest block were interviewed. The interviews were carried out with the view of obtaining information on the current and previous forest-cover, drivers of forest-cover change, and the roles and contributions of CFAs in forest conservation and management. Moreover, secondary data, such as forest crime data and the number of CFAs, were obtained from the Eldama-Ravine KFS station.
2.3. Satellite Remote Sensing
Cloud-free satellite images from1985, 2002, and 2015—all of which were acquired during the dry season (December to March)—were selected for the study. The images were obtained from the United States Geological Survey (USGS) Global Visualization Viewer website (
www.glovis.usgs.gov). A topographic map of 1972 and the Kenya forest-cover shapefiles were obtained from the Survey of Kenya and KFS, respectively. The main datasets used are summarized in
Table 1.
The spectral bands of the selected Landsat images were individually imported to ArcGIS 10.2. The spectral bands 1–5 and 7 were chosen for Landsat 5 and 7, while bands 2–7 were used for Landsat 8. These selected spectral bands were co-registered to Universal Transverse Mercator (UTM) zone 36N. Later, atmospheric correction was performed in order to minimize the effect of gain and bias upon the images [
31]. Atmospheric corrections involved conversion of the digital numbers (DN) to ”top of atmosphere” (TOA) or surface reflectance [
32,
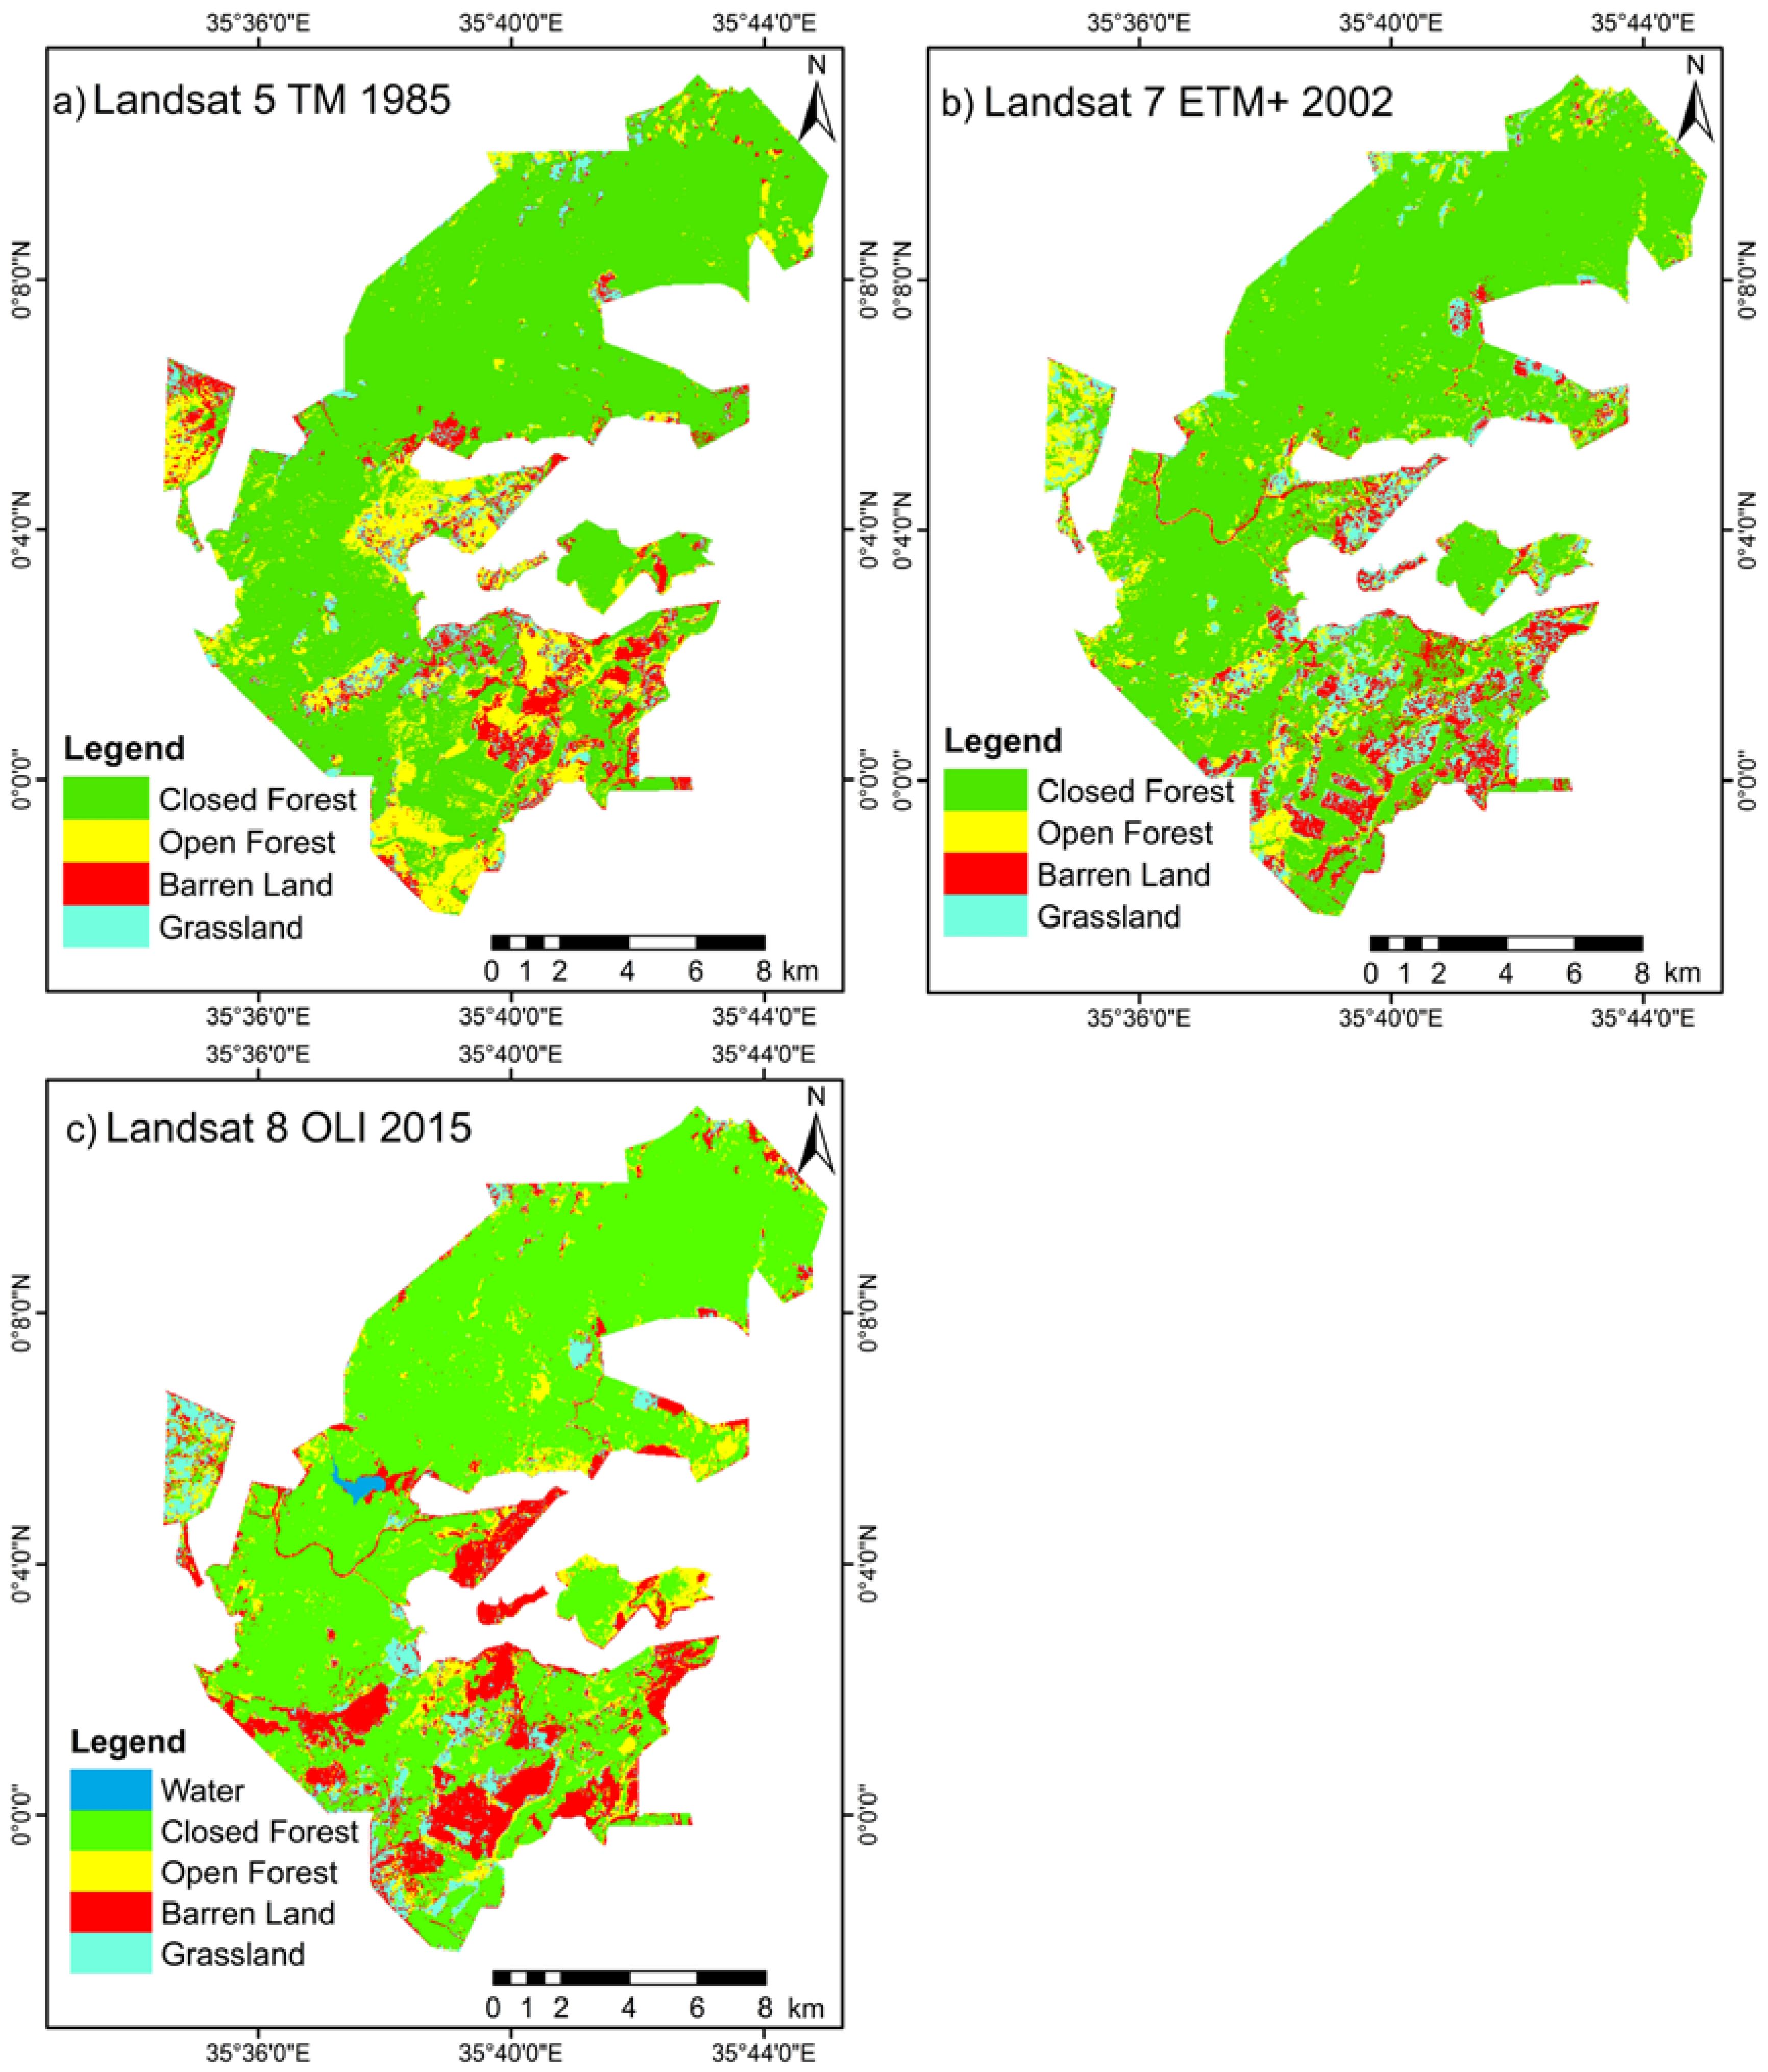
33]. The acquired forest shapefiles and the topographic map of 1972 were used to clip out the study area from the pre-processed Landsat imageries. To aid in identification of dominant land-cover types, unsupervised classification was performed in ArcGIS 10.2. Using the results of unsupervised classification, Google Earth imagery, and our familiarity of the study area, four land-cover classes (closed forest, open forest, grassland, and barren land) were identified for Landsat images from 1985 and 2002. For 2015 imagery, five land-cover classes (closed forest, open forest, grassland, barren land, and water) were used.
Vegetation indices, especially the Normalized Difference Vegetation Index (NDVI), have been extensively used to analyse and discriminate vegetation cover [
34,
35,
36,
37,
38]. To utilise this gain, NDVI analysis was performed, and the resulting NDVI maps were reclassified based on the NDVI threshold [
39,
40]. Furthermore, the resulting NDVI maps and high-resolution imagery (Google Earth) were utilised to develop spectral signatures for the land-cover types shown in
Table 2. Finally, supervised classification using the maximum likelihood classifier algorithm (MLC) contained in ArcGIS 10.2 was used to generate forest-cover maps. Then, post-classification analysis was carried out to establish land-cover change trajectories within the study area. To calculate the rate of the forest-cover changes, we reclassified the land-cover maps into two land cover types: (1) forest (comprising closed and open forests); and (2) non-forest (consisting of barren land, grassland, and water). To calculate the annual rate of change on the resulting land-cover classes, we applied the formula below [
41]:
where
A2 and
A1 refer to forest area at the end and beginning of the analysis period, respectively, and
t2 and
t1 correspond to the year in the end and beginning of the analysis.
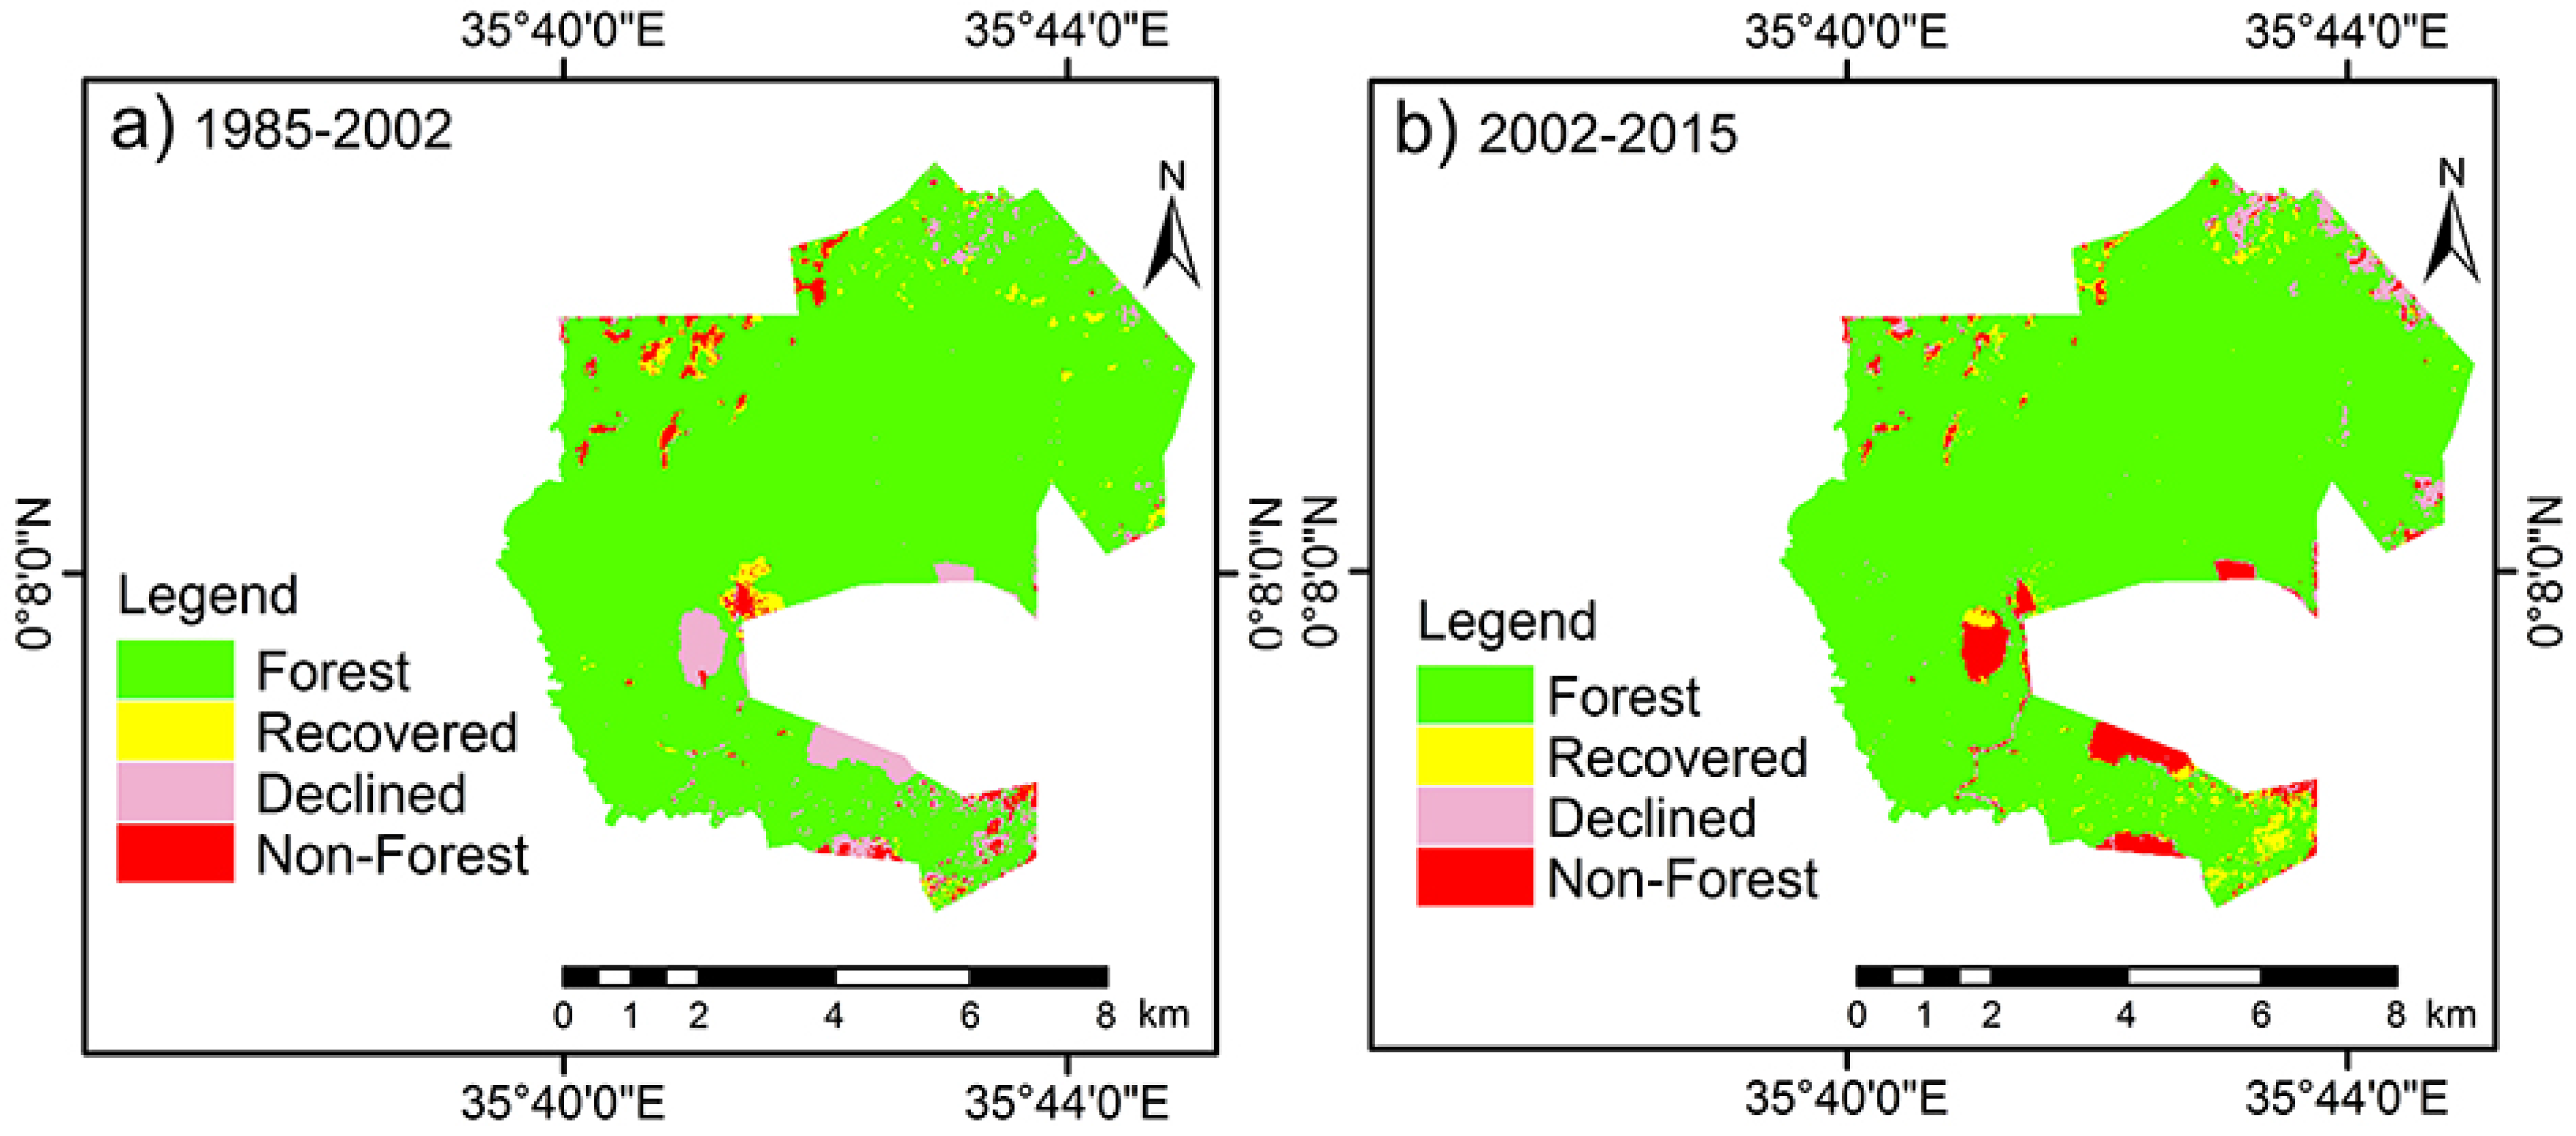
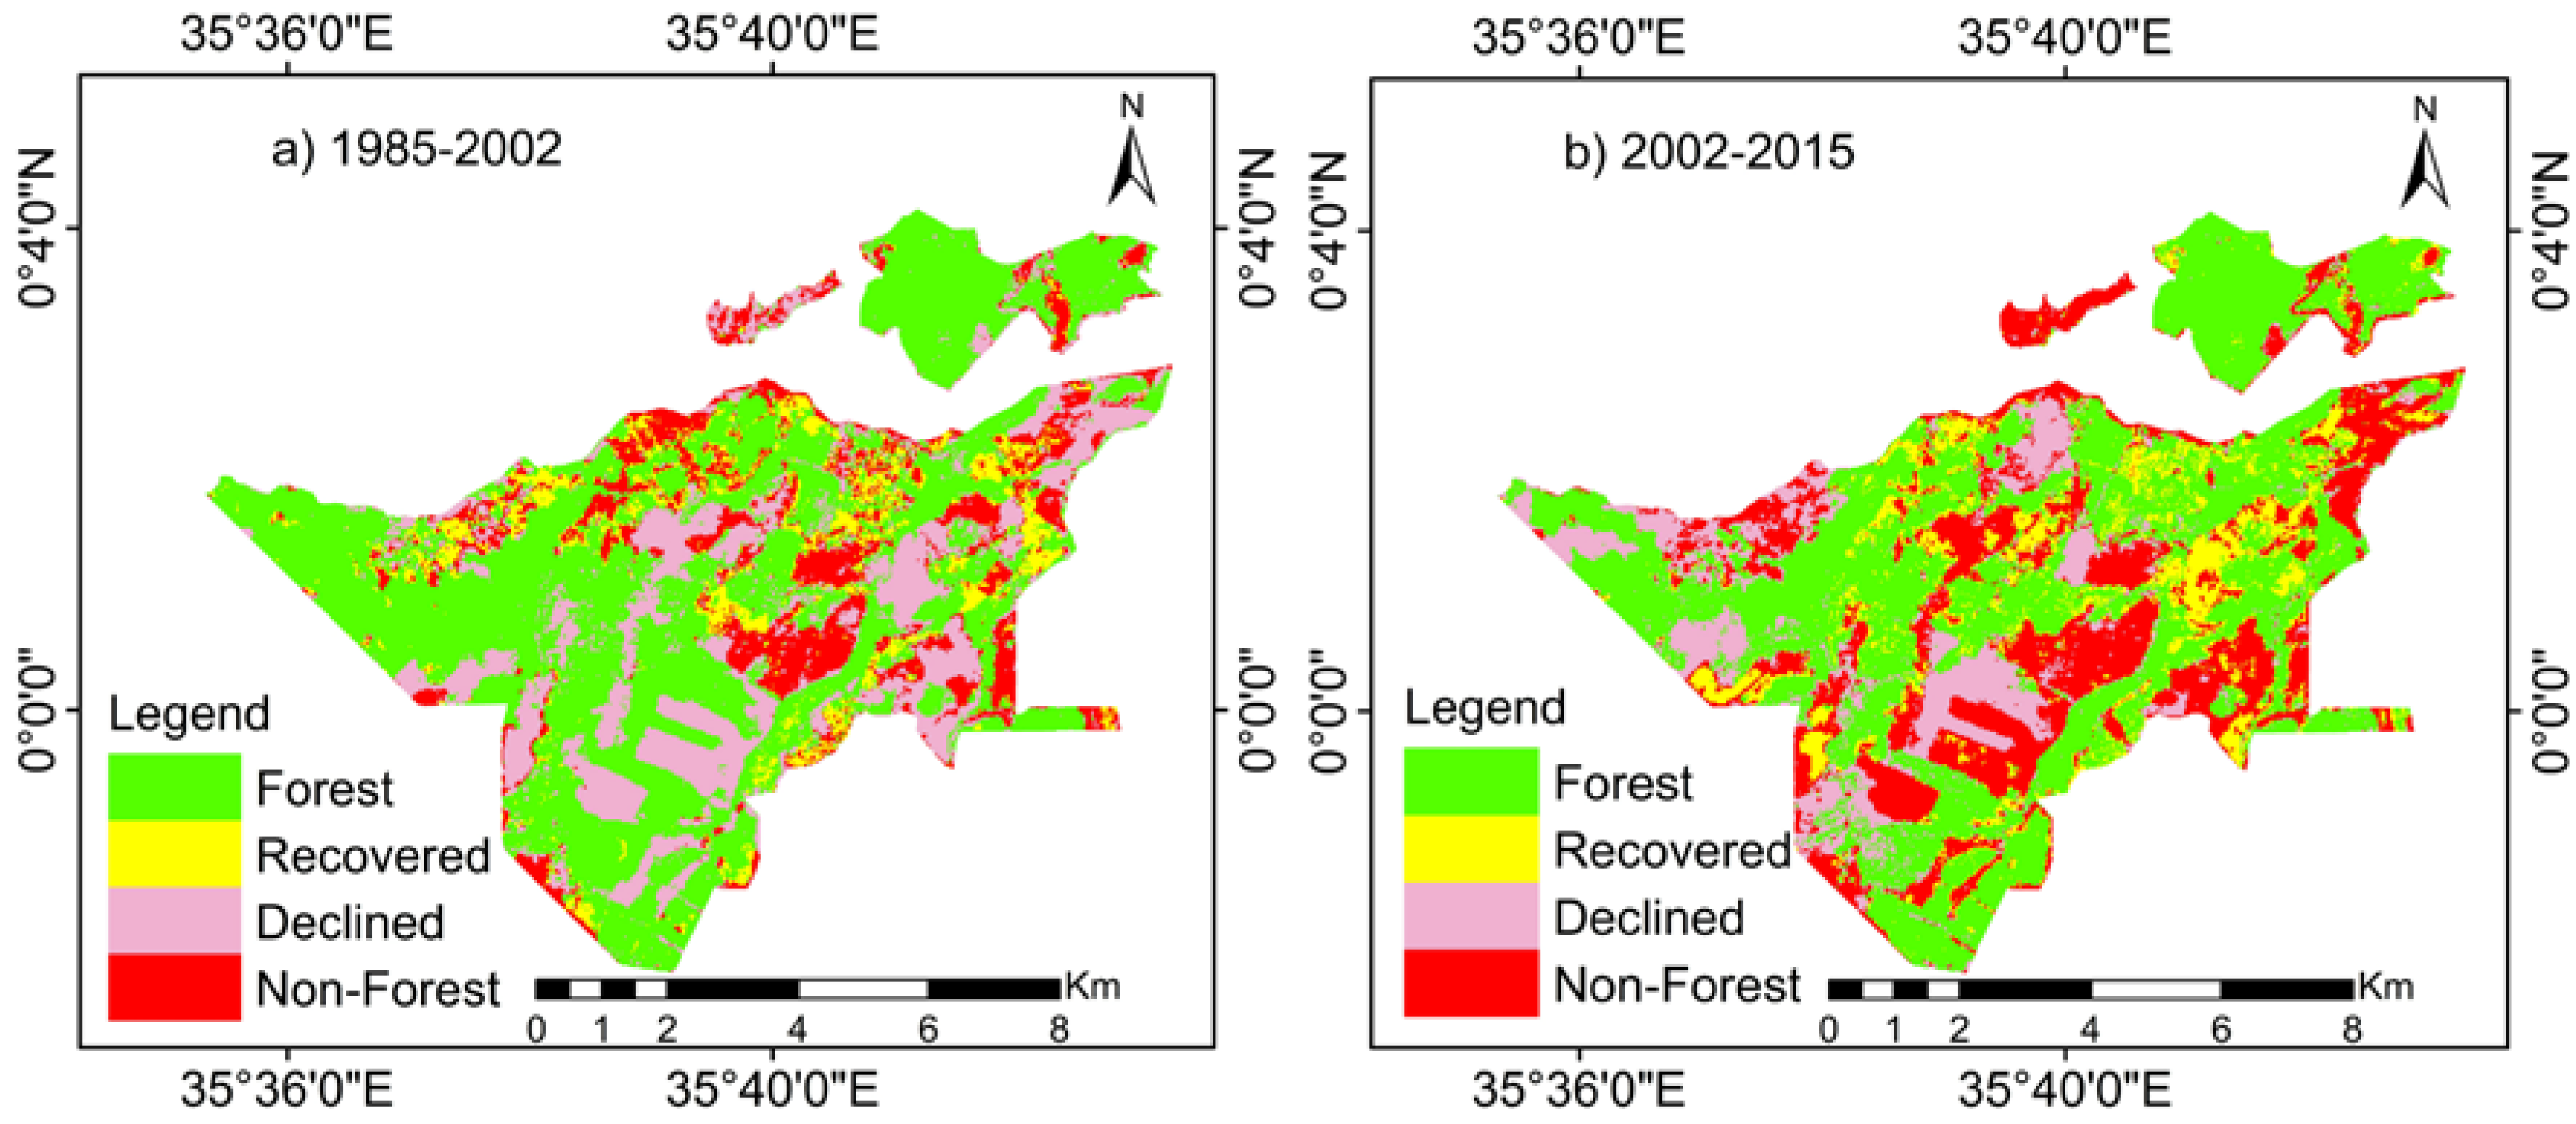
A change detection analysis was also performed on the forest and non-forest-cover types, and the resulting areas of change were categorized into two: (1) “recovered” which means areas that were non-forest in the previous image, but were later converted to forest in the subsequent image; and (2) “declined”, representing areas that were forest in the previous image, but later converted to non-forest in the later image.
4. Discussion
The forest-cover change analysis in the Lembus Forest revealed a decline in its cover in both the 1st and 2nd periods. The annual rates of forest-cover change varied greatly in both the 1st and 2nd periods. Forest-cover declined at an annual rate of 0.4% in the 1st period and 0.2% in the 2nd period. The loss in forest-cover in both periods resulted from dynamic interchanges among land-cover types (
Table 5). The interchanges were mainly attributed to increasing human activities within the forest. Although natural factors could also play a role in forest-cover change, the scope of this study mainly dwelt upon anthropogenic activities. Based on the interviews and field observations, it was evident that human activities were the main driver of forest-cover change.
In the 1st period, a significant amount of forest-cover (closed and open forests) was converted to barren land and grassland (
Table 5). The conversion resulted from a government action to excise nearly 3700 ha of forest through legal notice number 203 of 1988 [
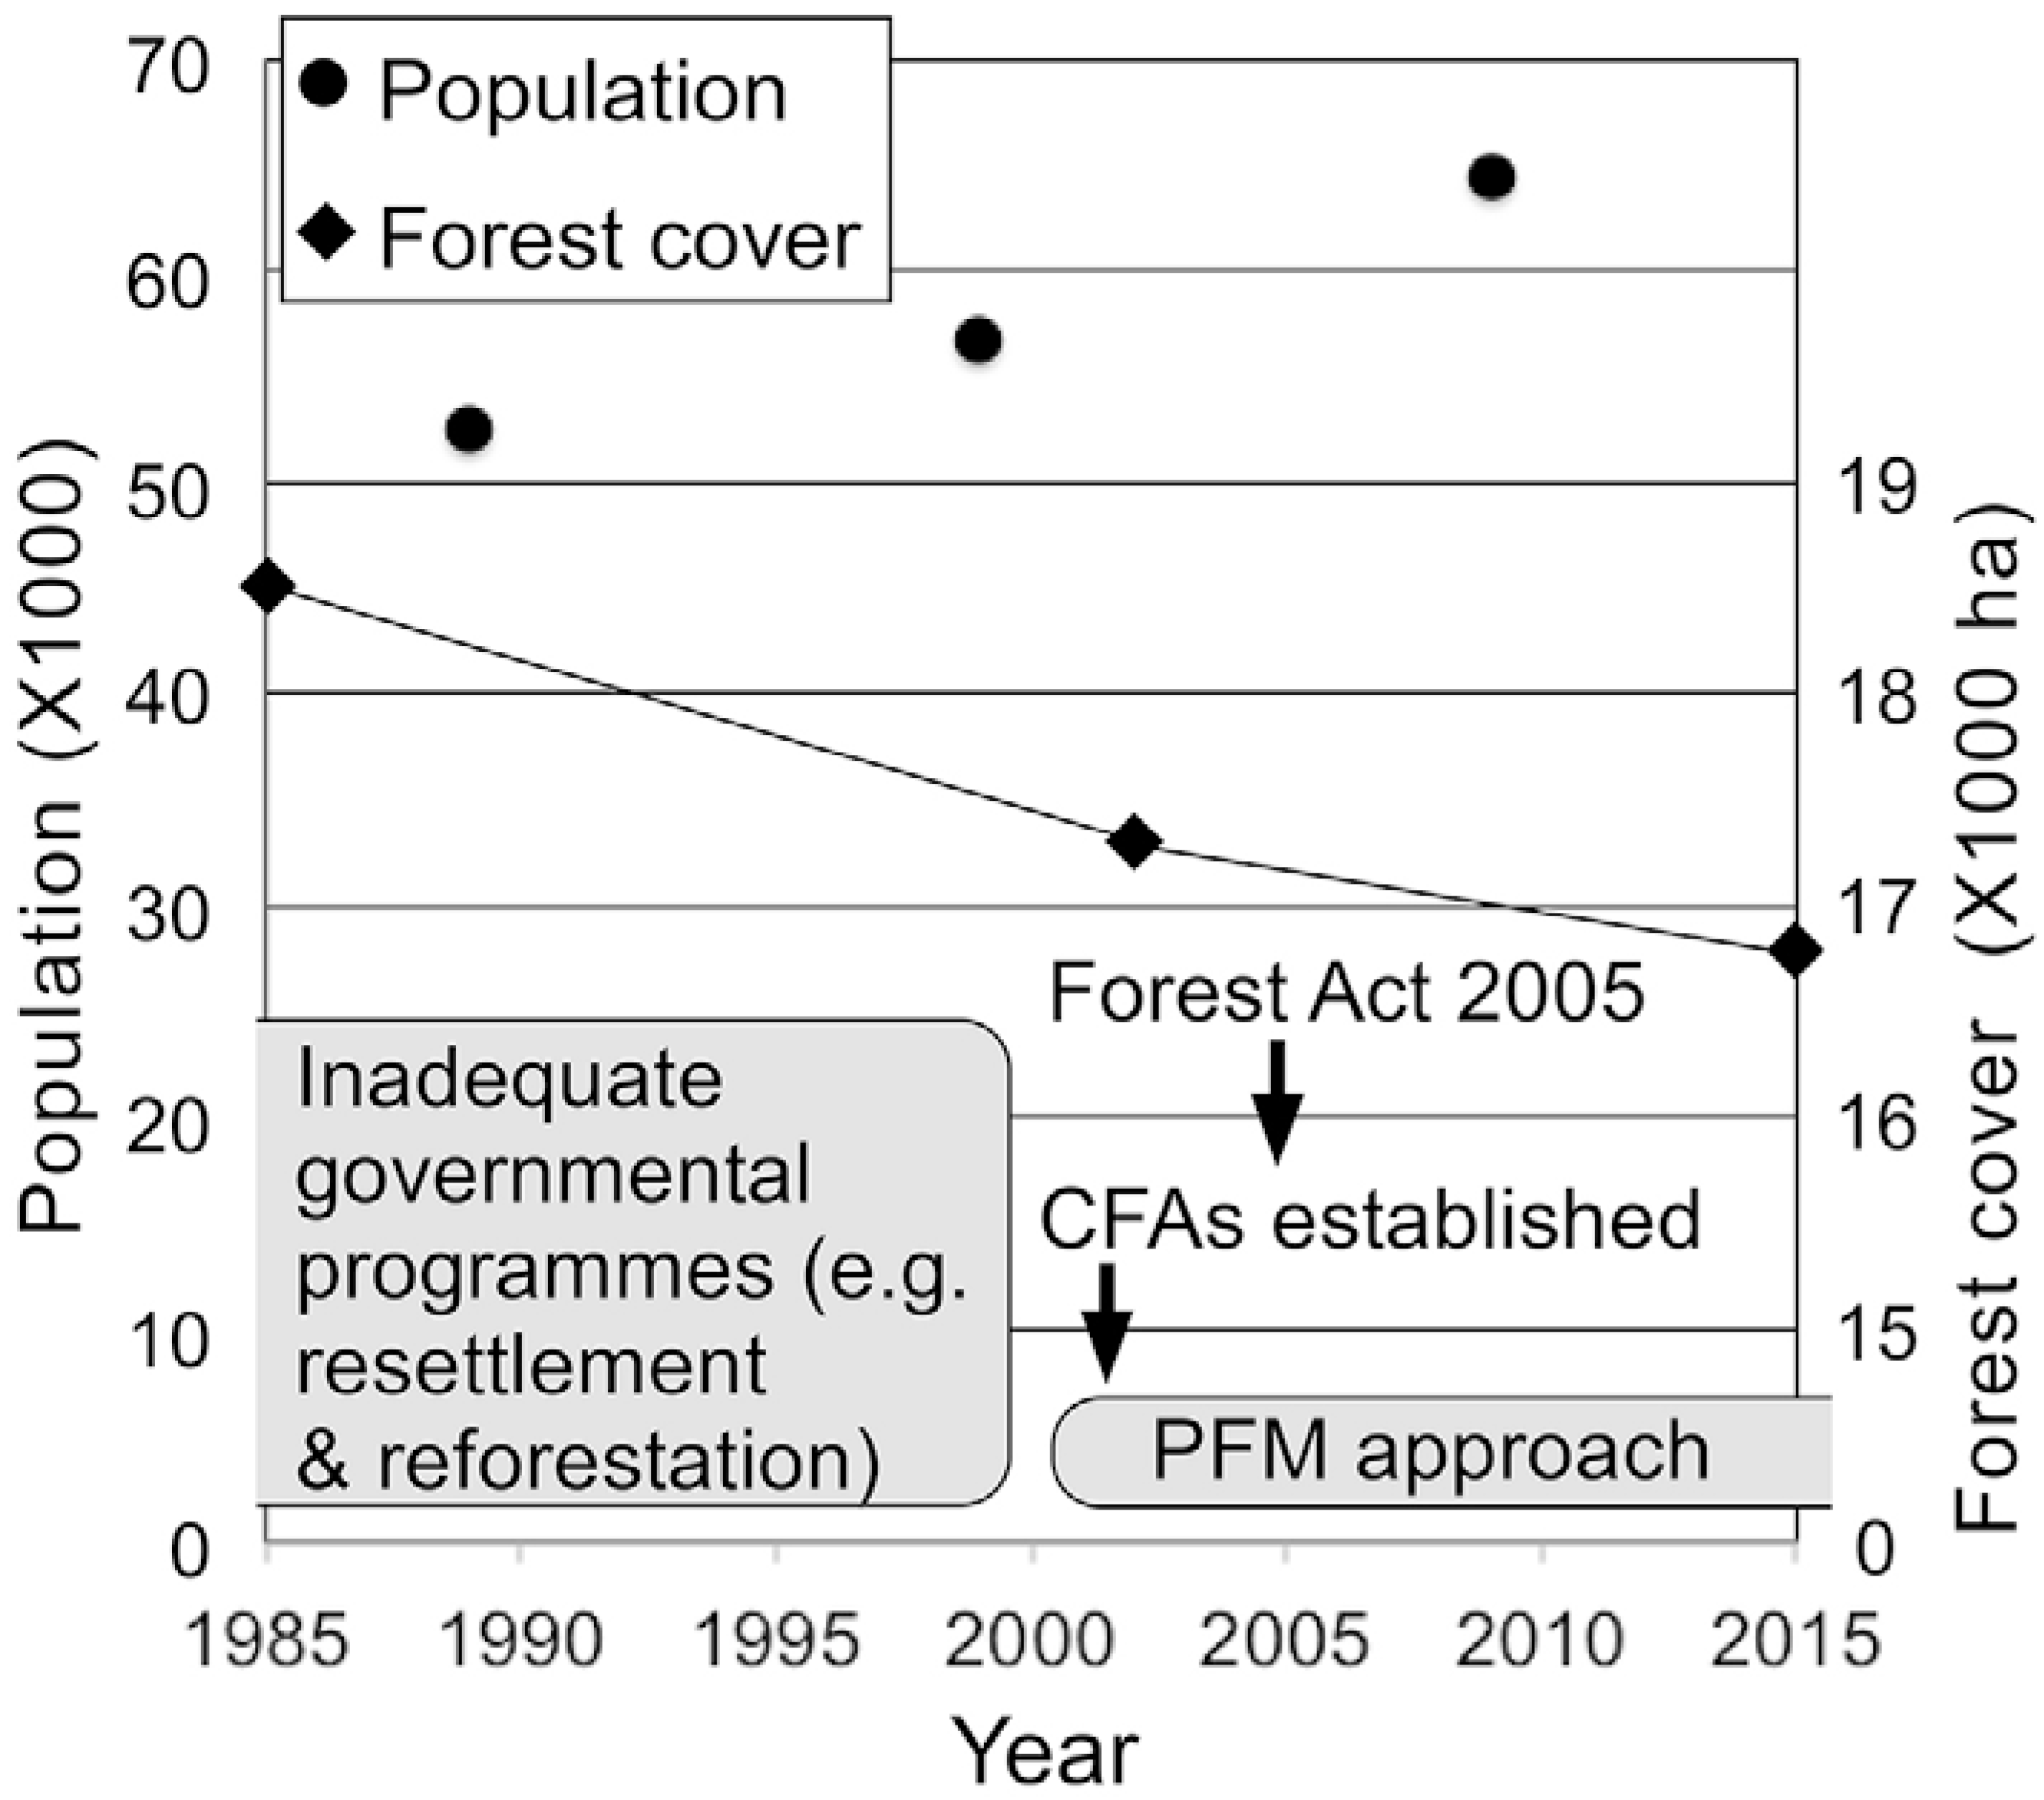
43]. The excision contributed to rapid forest-cover decline in the 1st period. Some regions still remain part of the forest, although most excised areas have been excluded from the current forest boundary. Forest decline was driven by a number of underlying factors, such as the increasing human population (
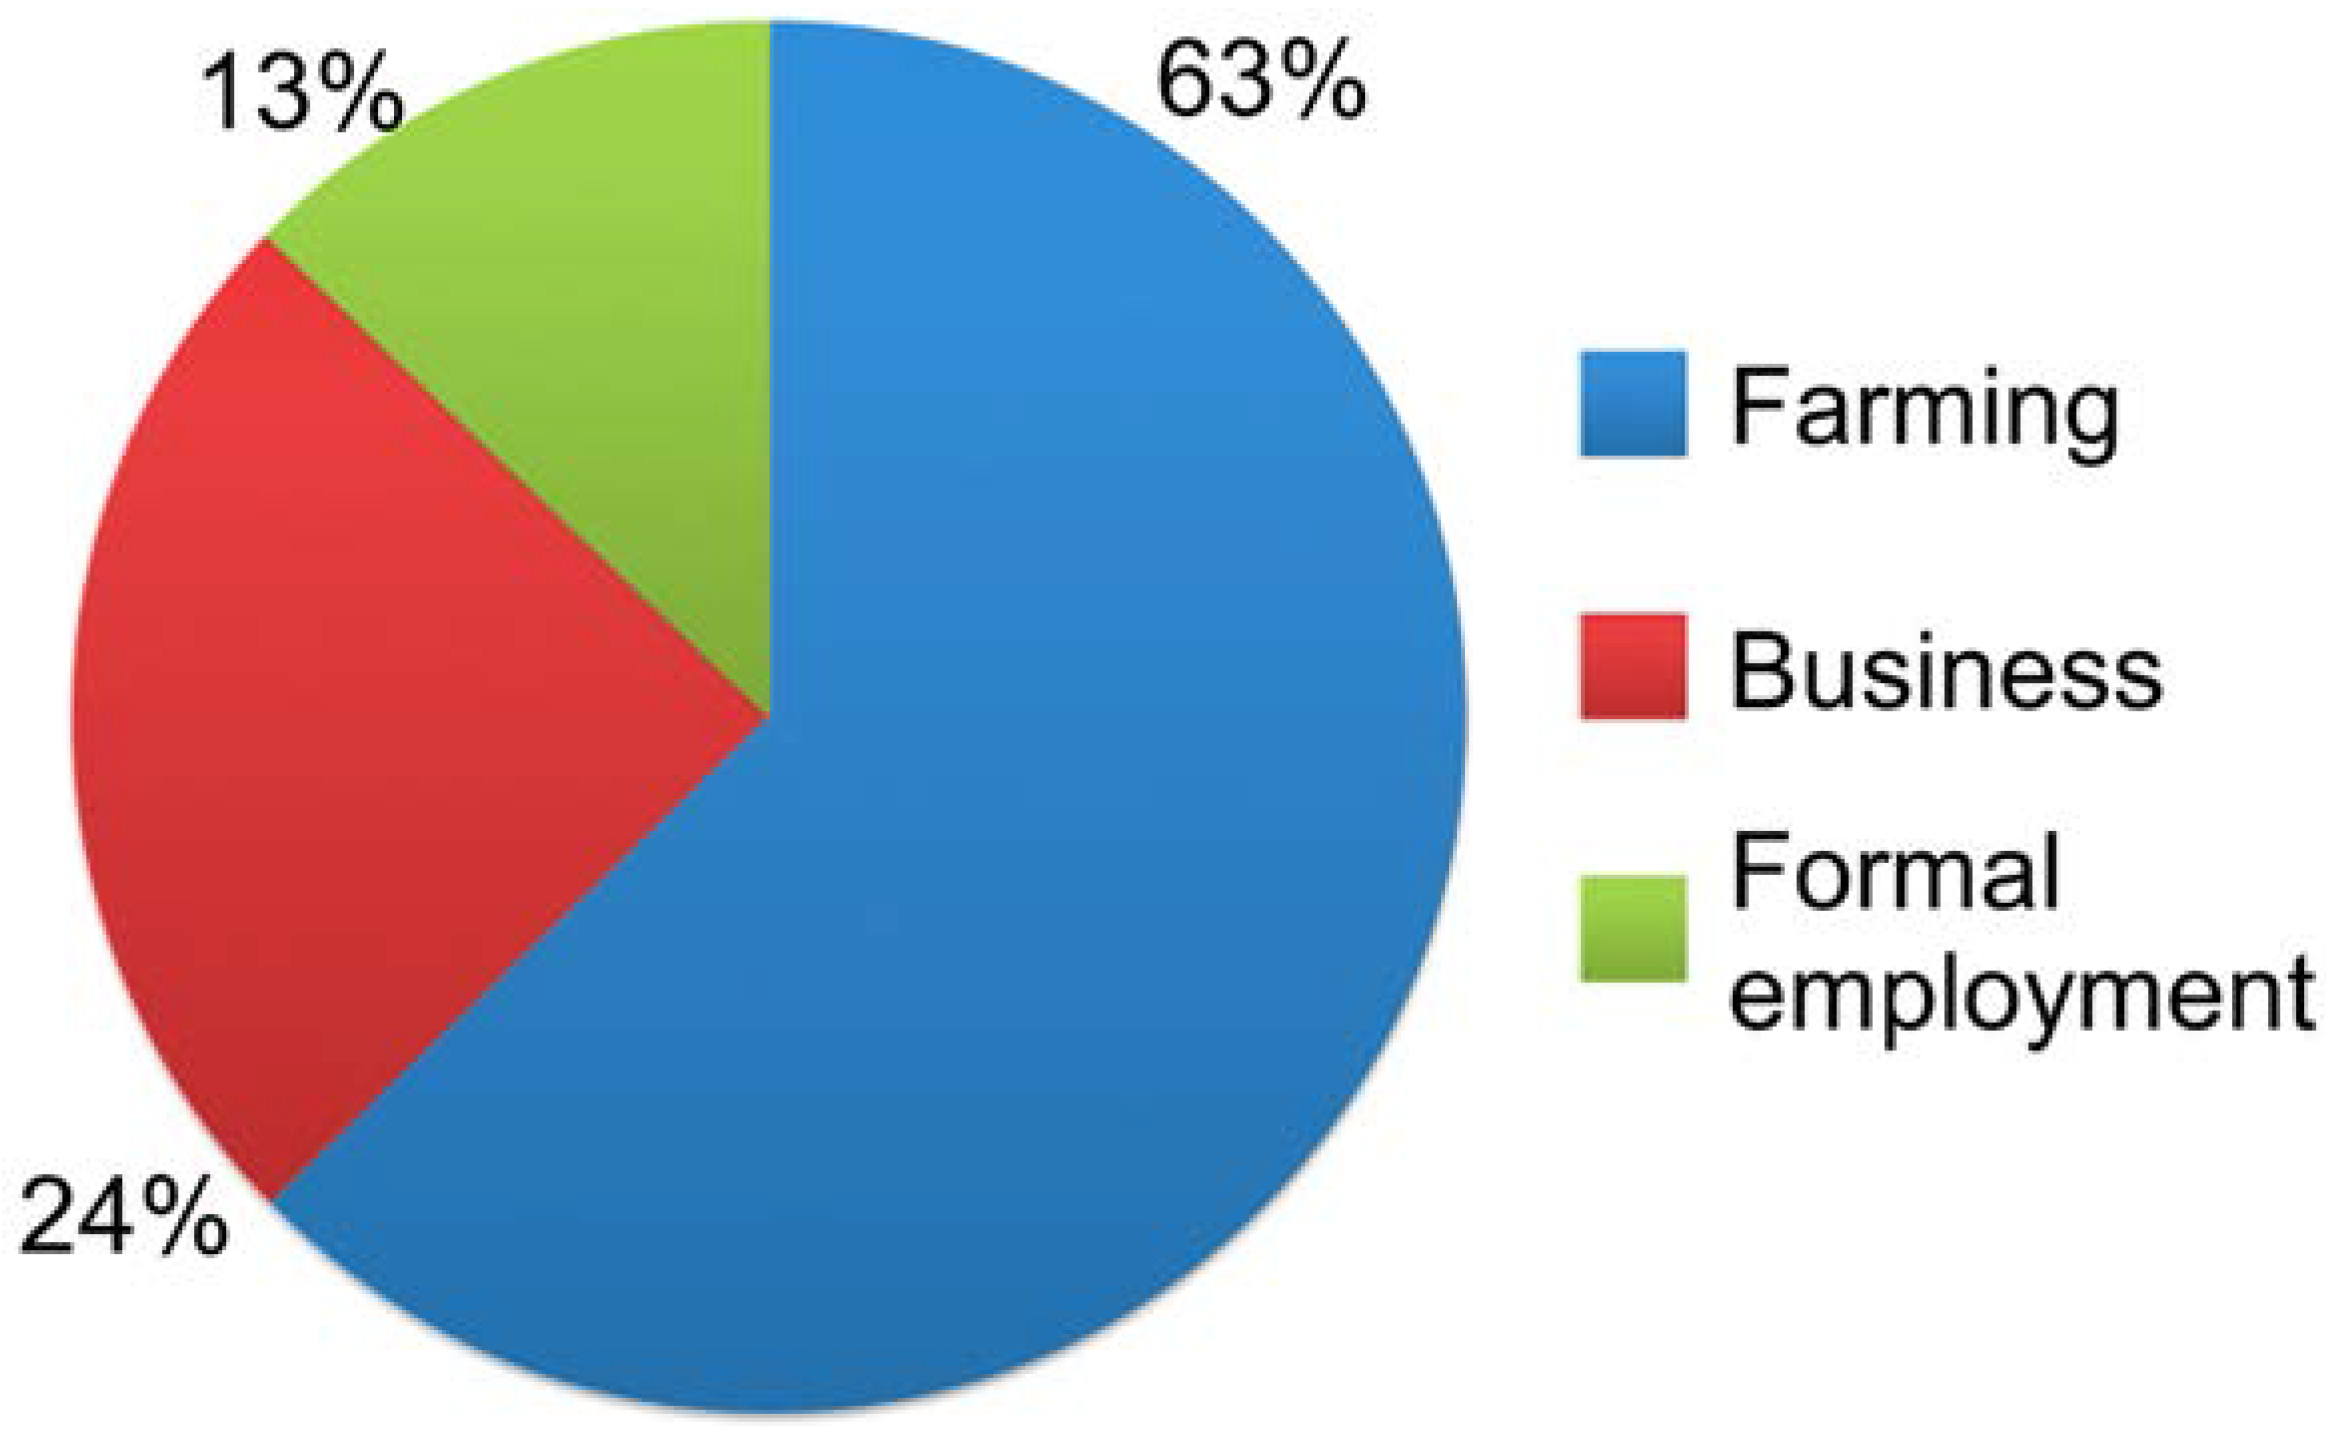
Figure 7), which exerted pressure on limited land resources, thus causing a shortage of land for settlement and cultivation. With the majority of respondents (63%) depending on farming as their main economic activity (
Figure 8), communities have encroached and cleared forests to create room for settlement and farming, thus contributing to forest-cover decline [
10]. Inadequate reforestation programmes as a result of inadequate funding and lack of adequate personnel hindered reforestation of areas that underwent clear-cutting in the 1st period (
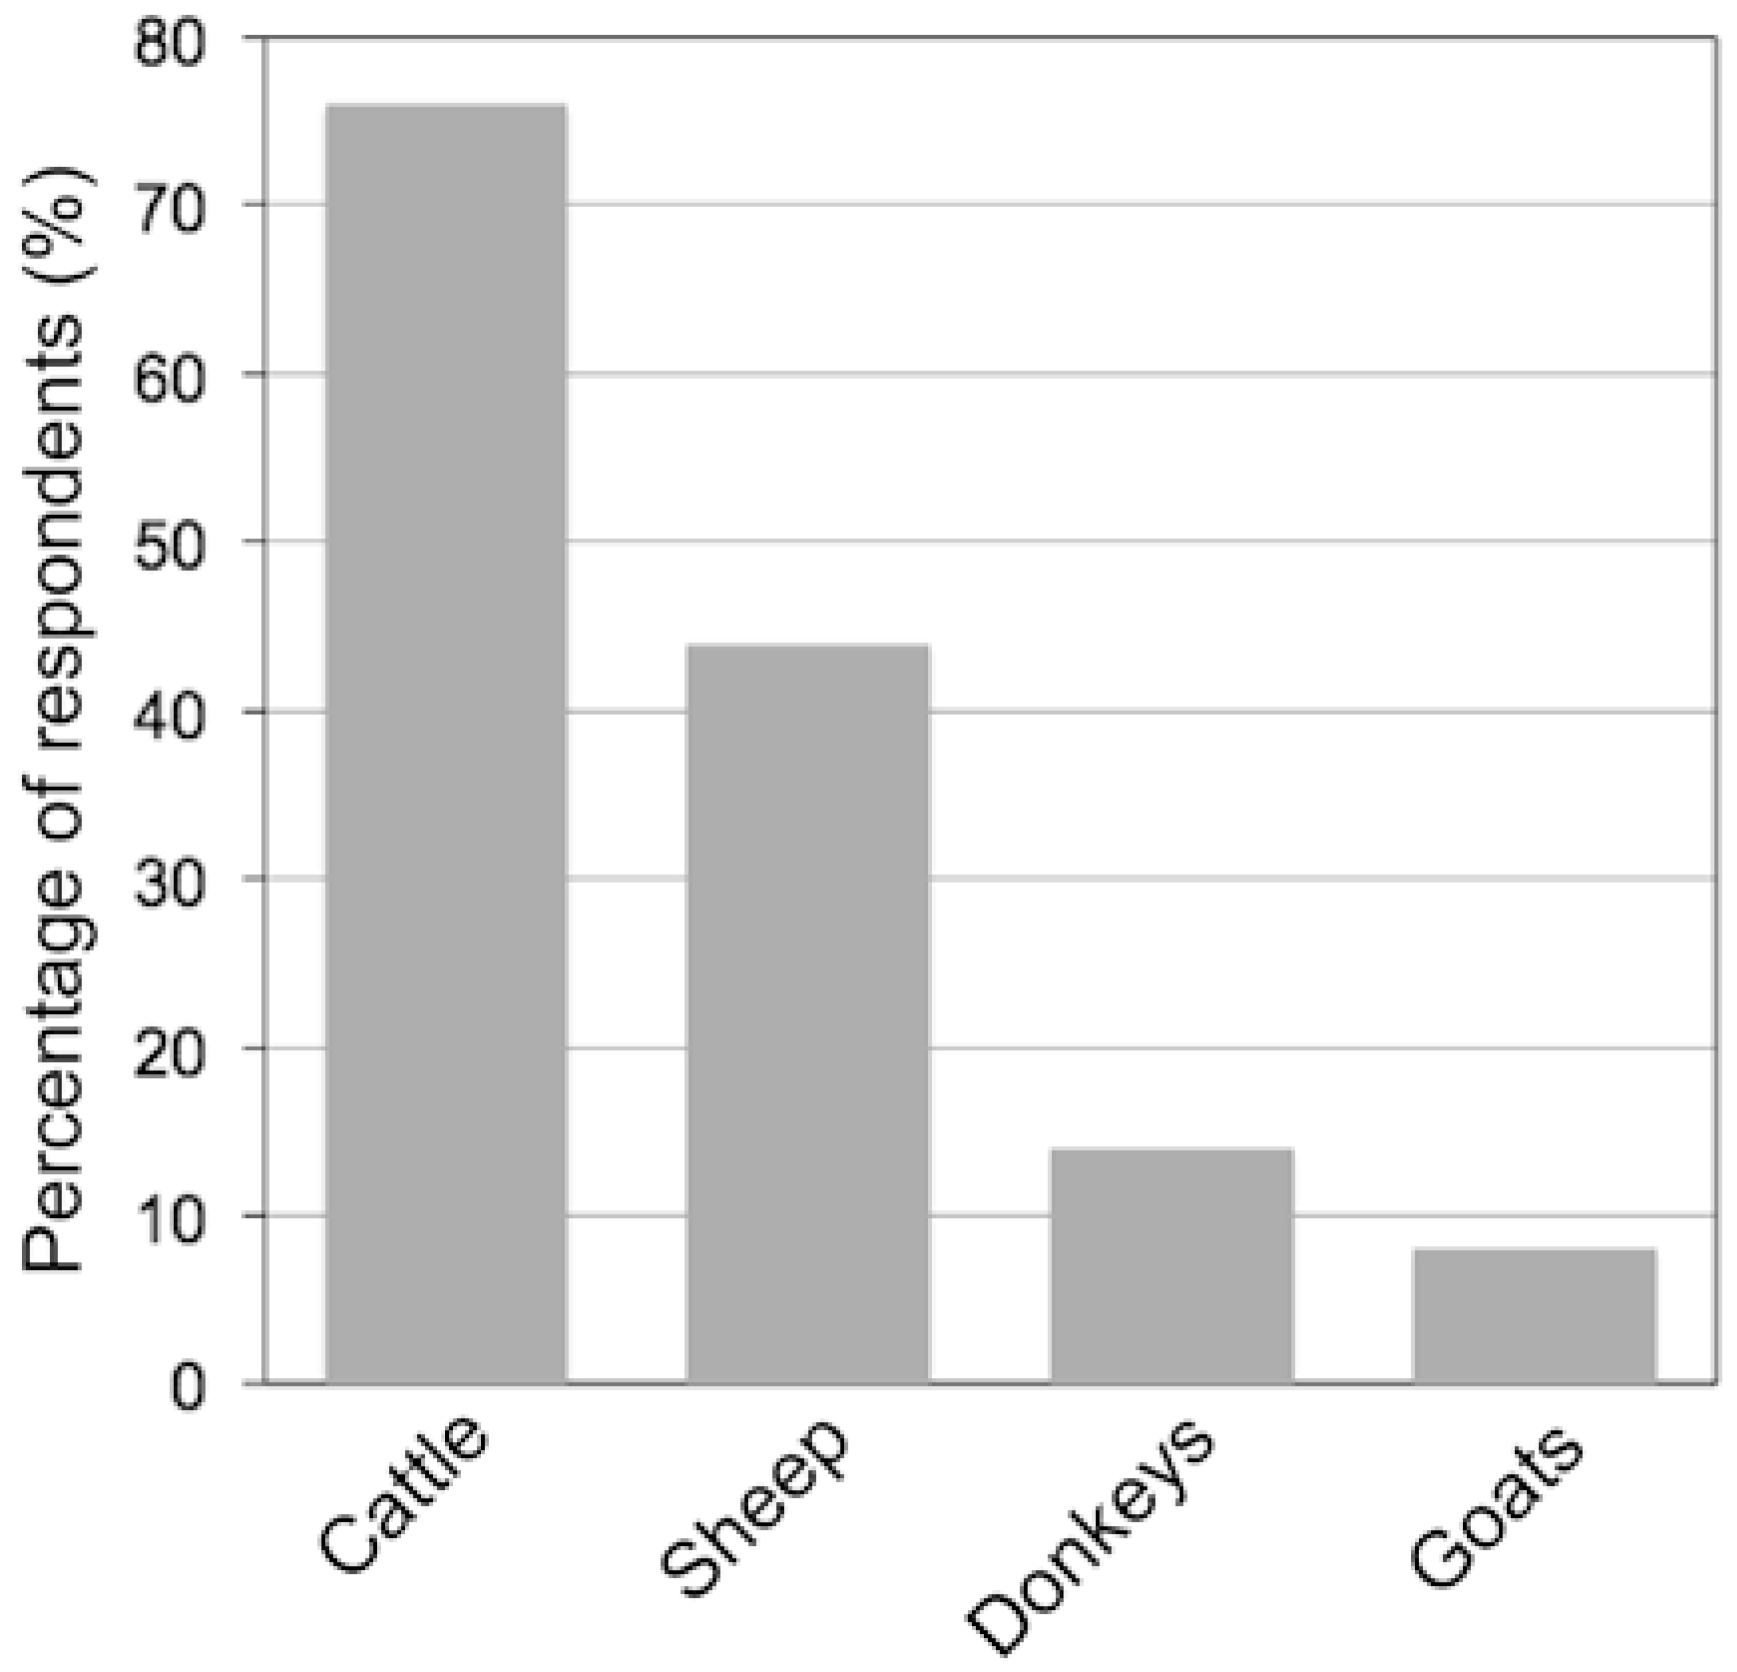
Figure 13). However, conflicts between PELIS user groups and grazers who rely mostly on the forest for grazing their livestock (
Figure 9) further slowed reforestation. Generally, forest recoveries experienced in the 1st period were attributed to natural regeneration.
In the 2nd period, the Lembus Forest-cover continued to experience conversion to other land-cover; nevertheless, the results in
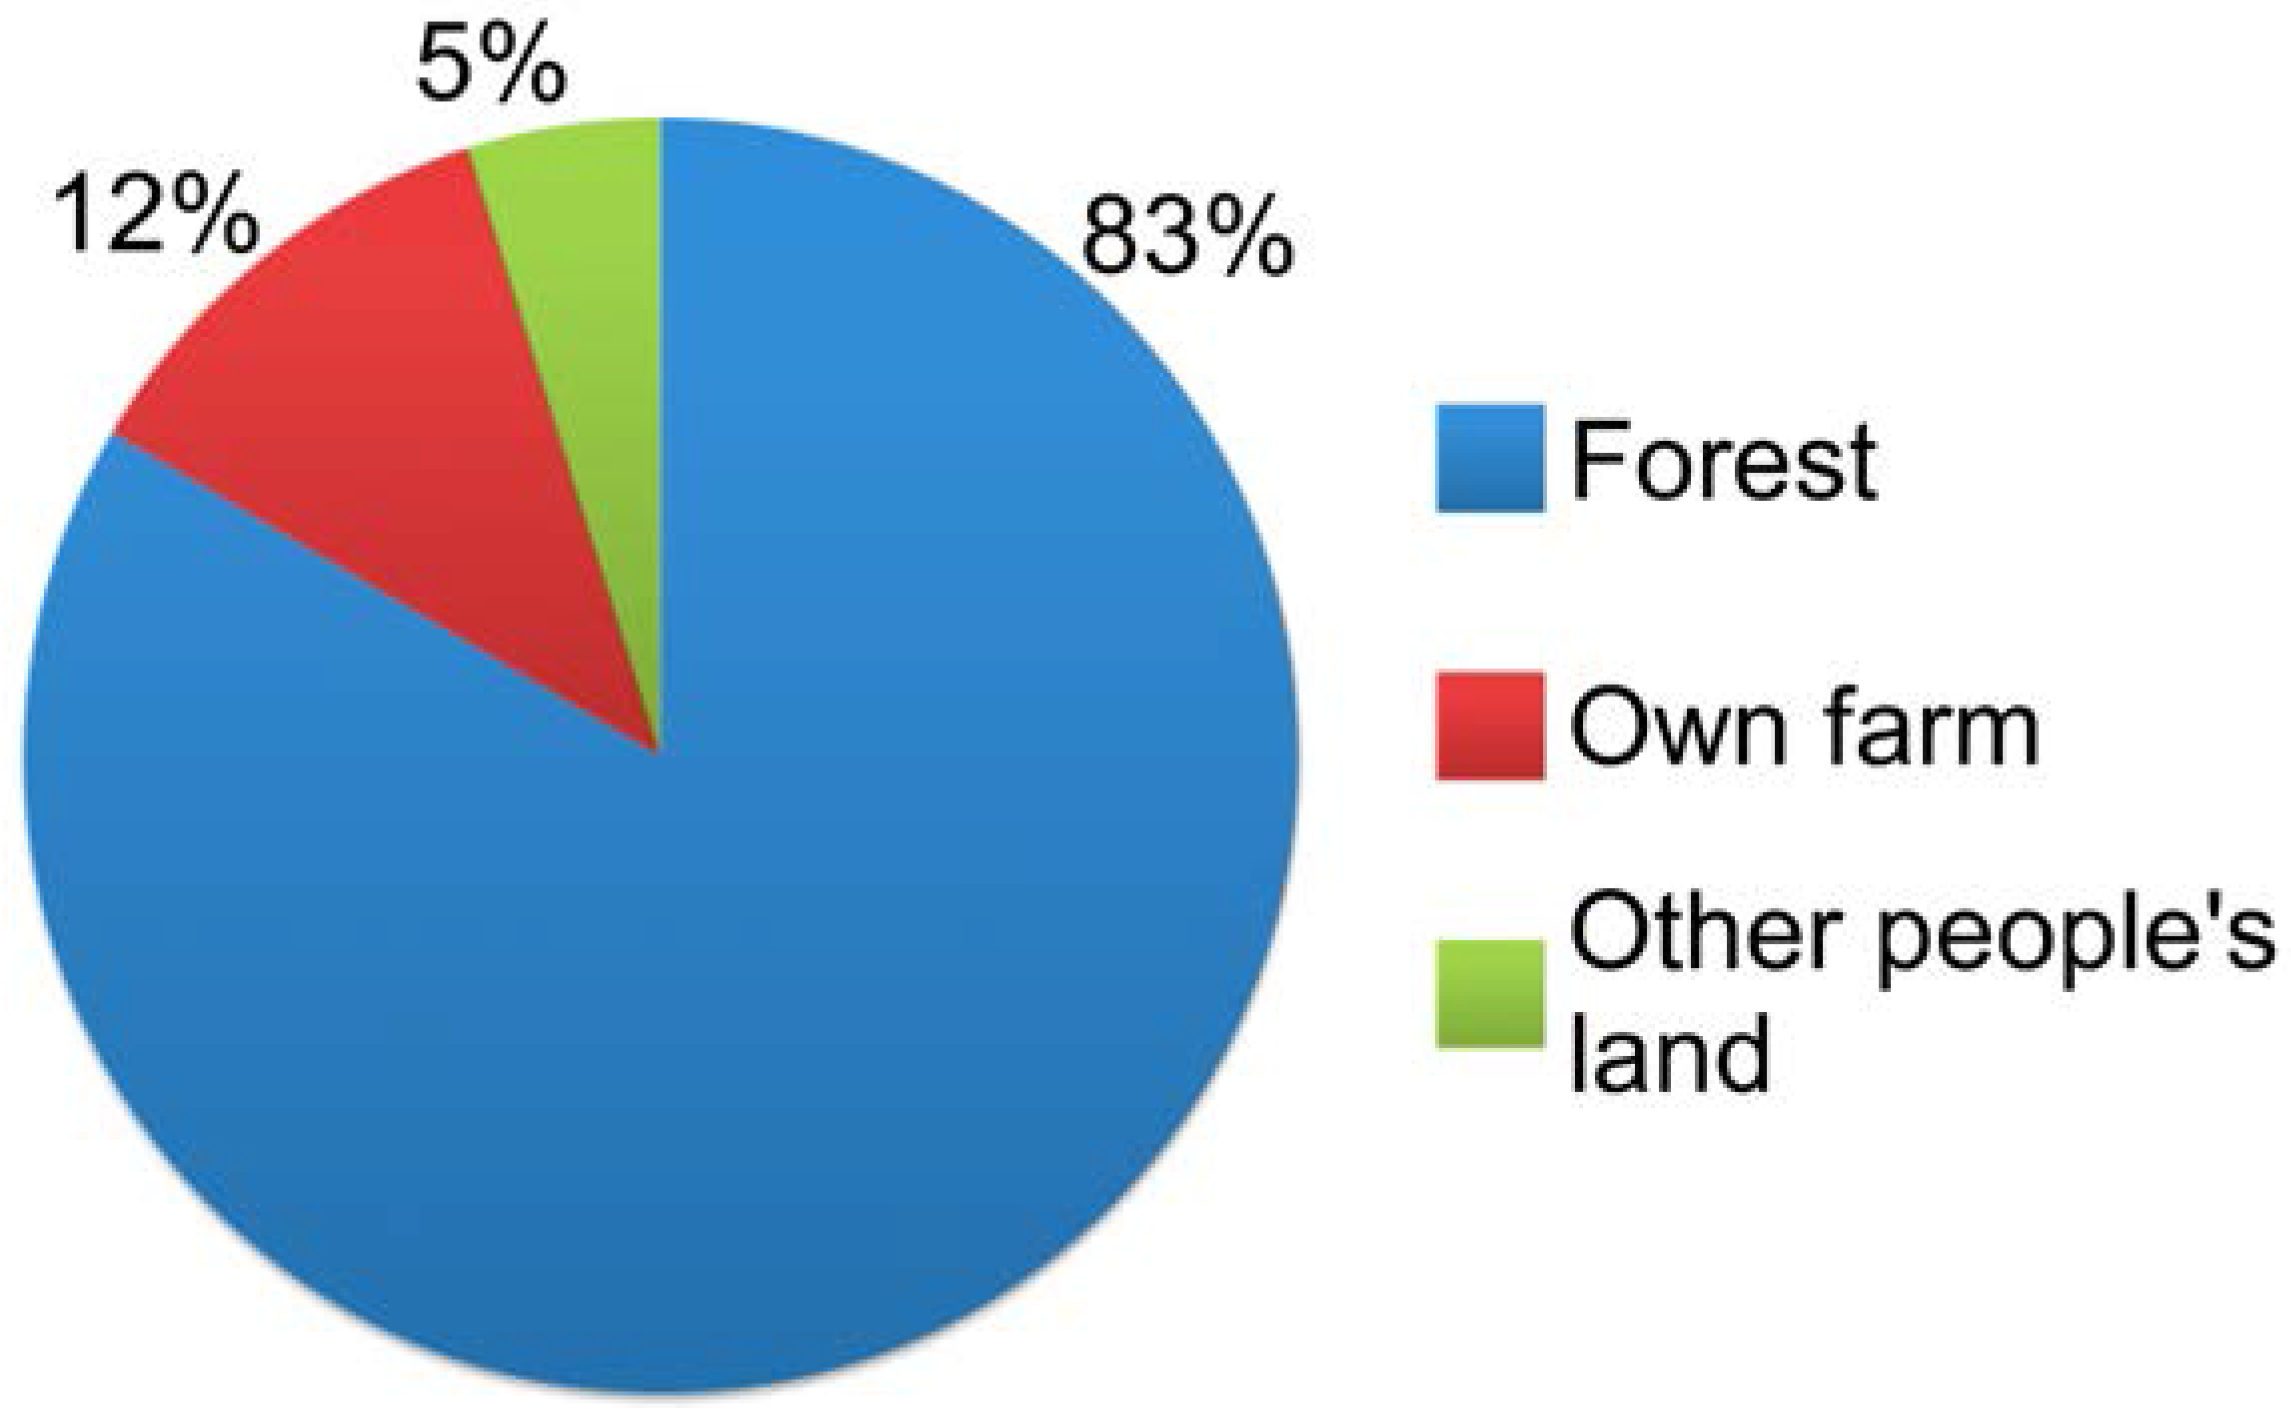
Table 4 clearly show that the rate of conversion was lower during this period than that during the 1st period. The main factors attributed to forest-cover decline during this period were logging, encroachment, and infrastructural development. Both legal and illegal logging occurred during this period, although the number of cases of legal logging (harvesting of trees by KFS) decreased marginally during the 2nd period. The decrease in the number of cases of legal logging was the result of the 1999 presidential ban on logging within all government forests. The ban on legal logging, however, was later lifted in early 2015. Yet, illegal logging continued to manifest in the forest (
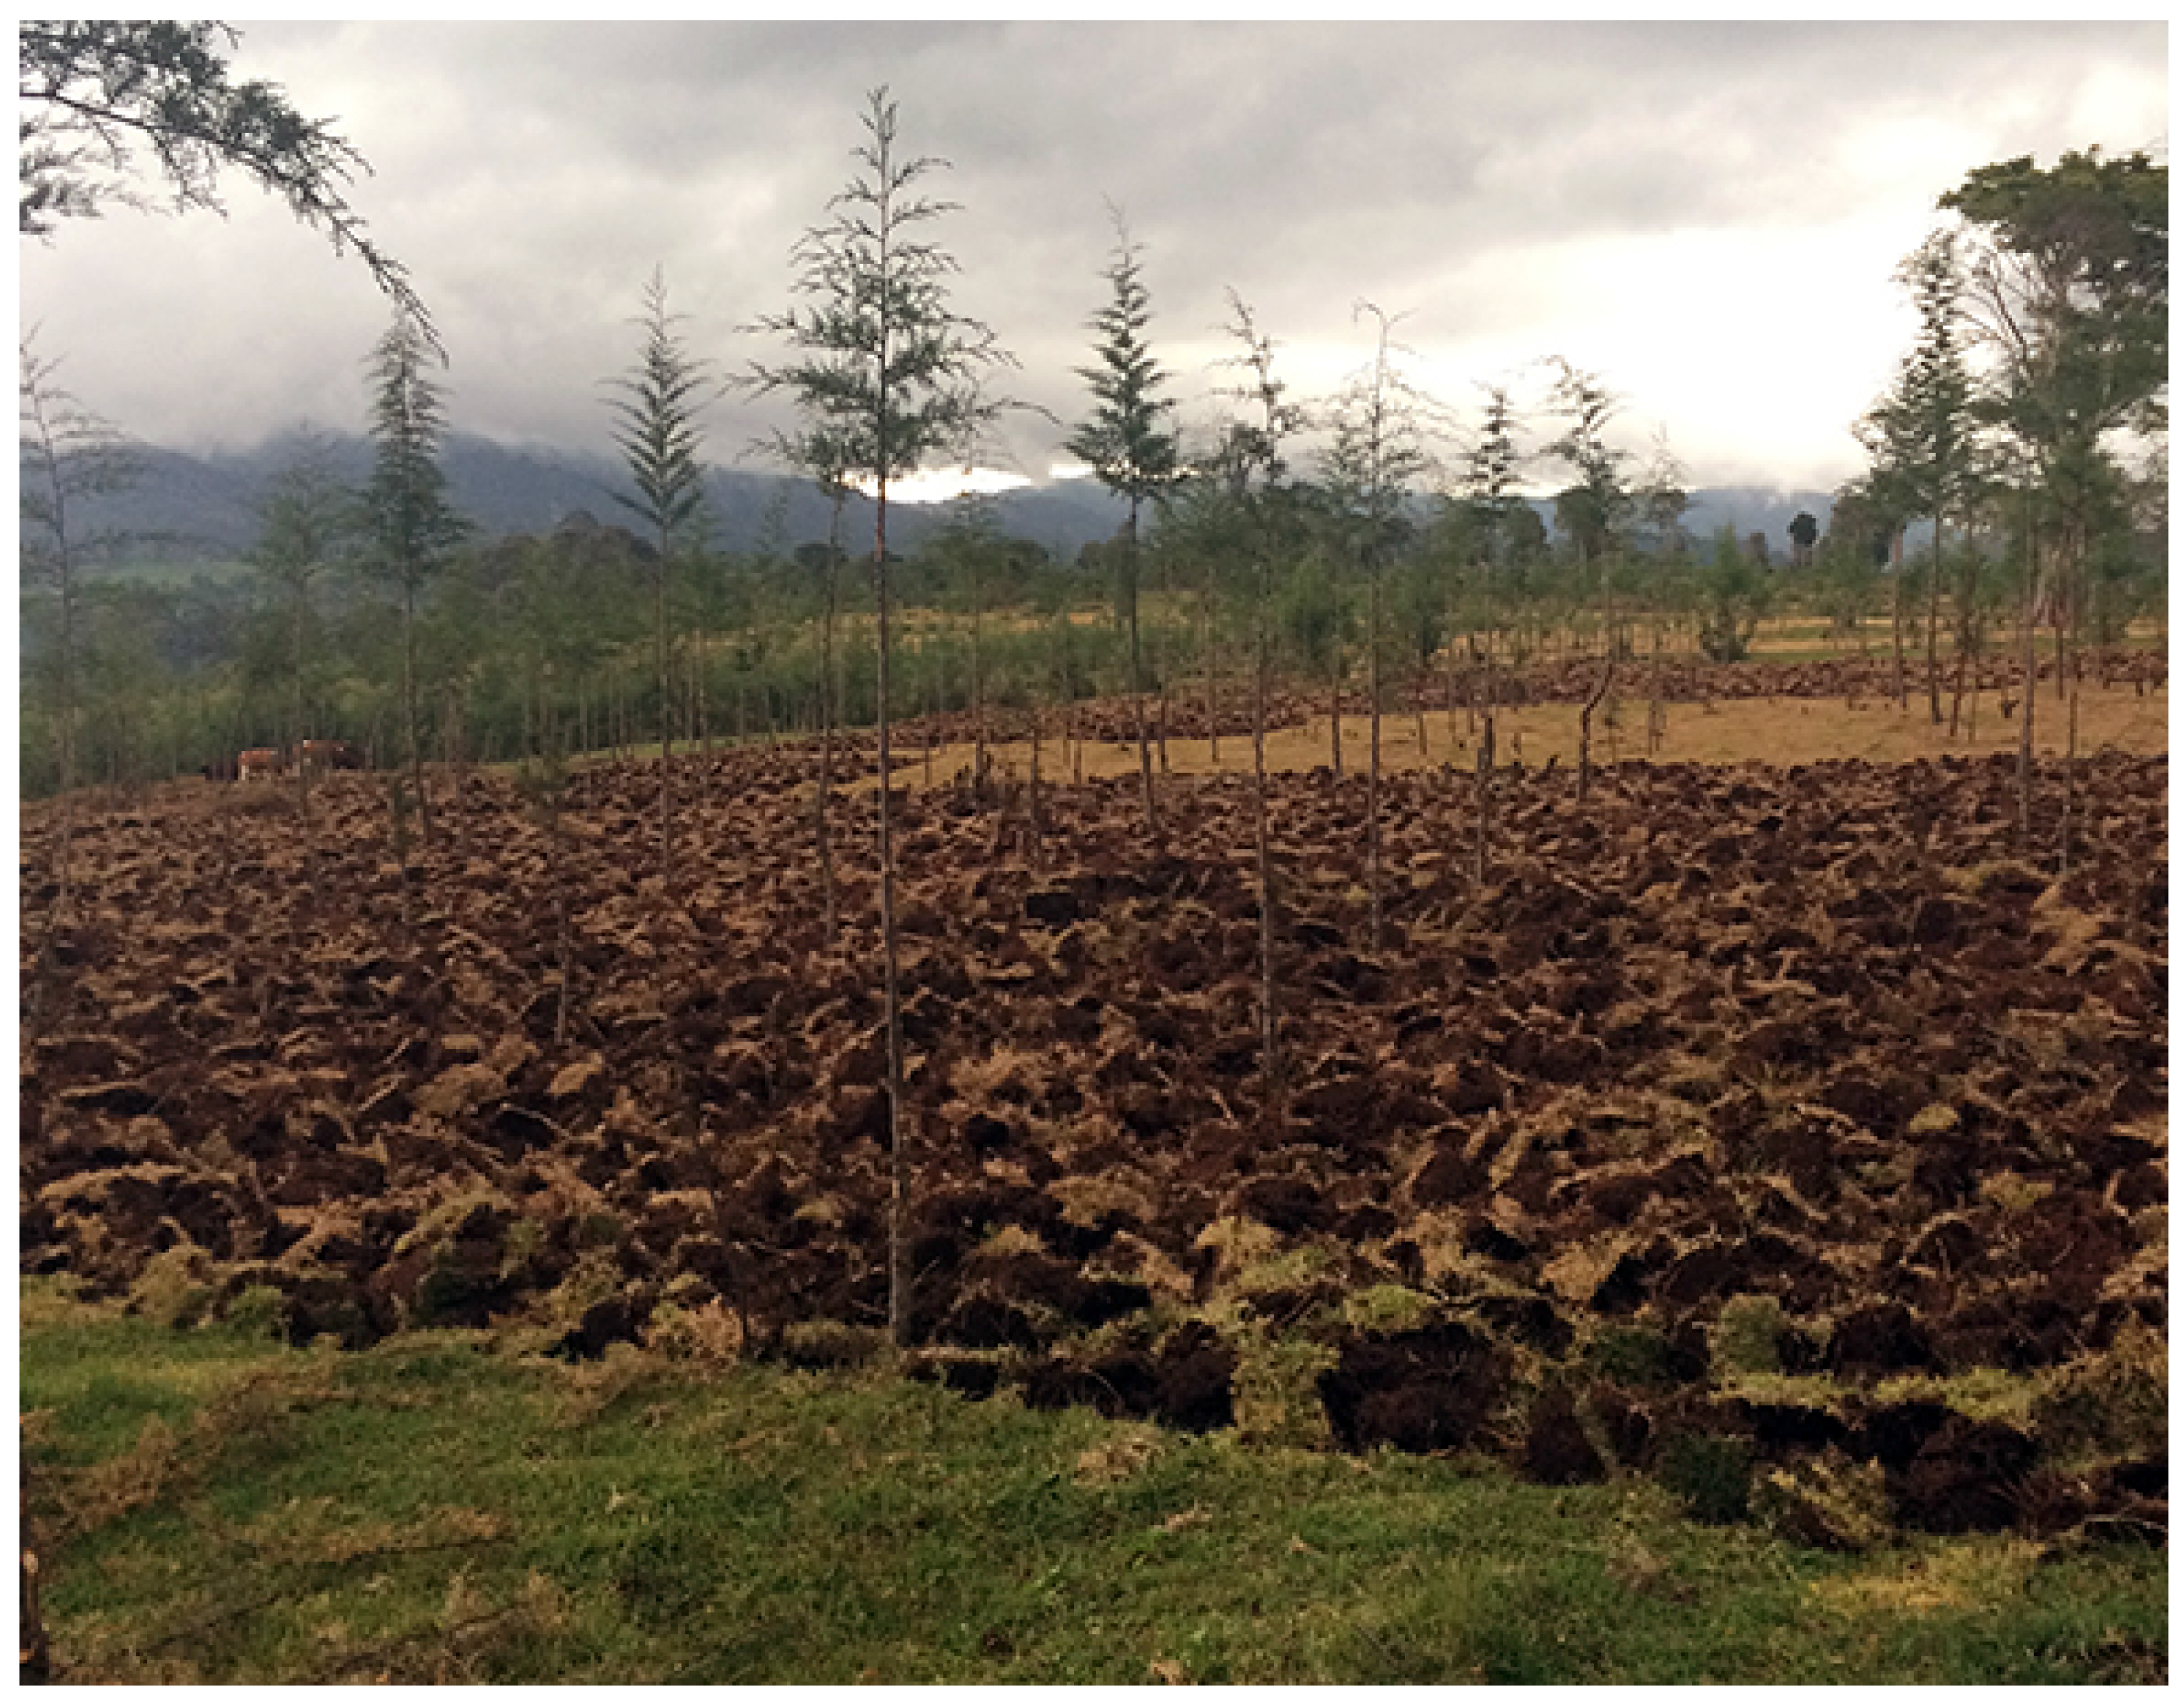
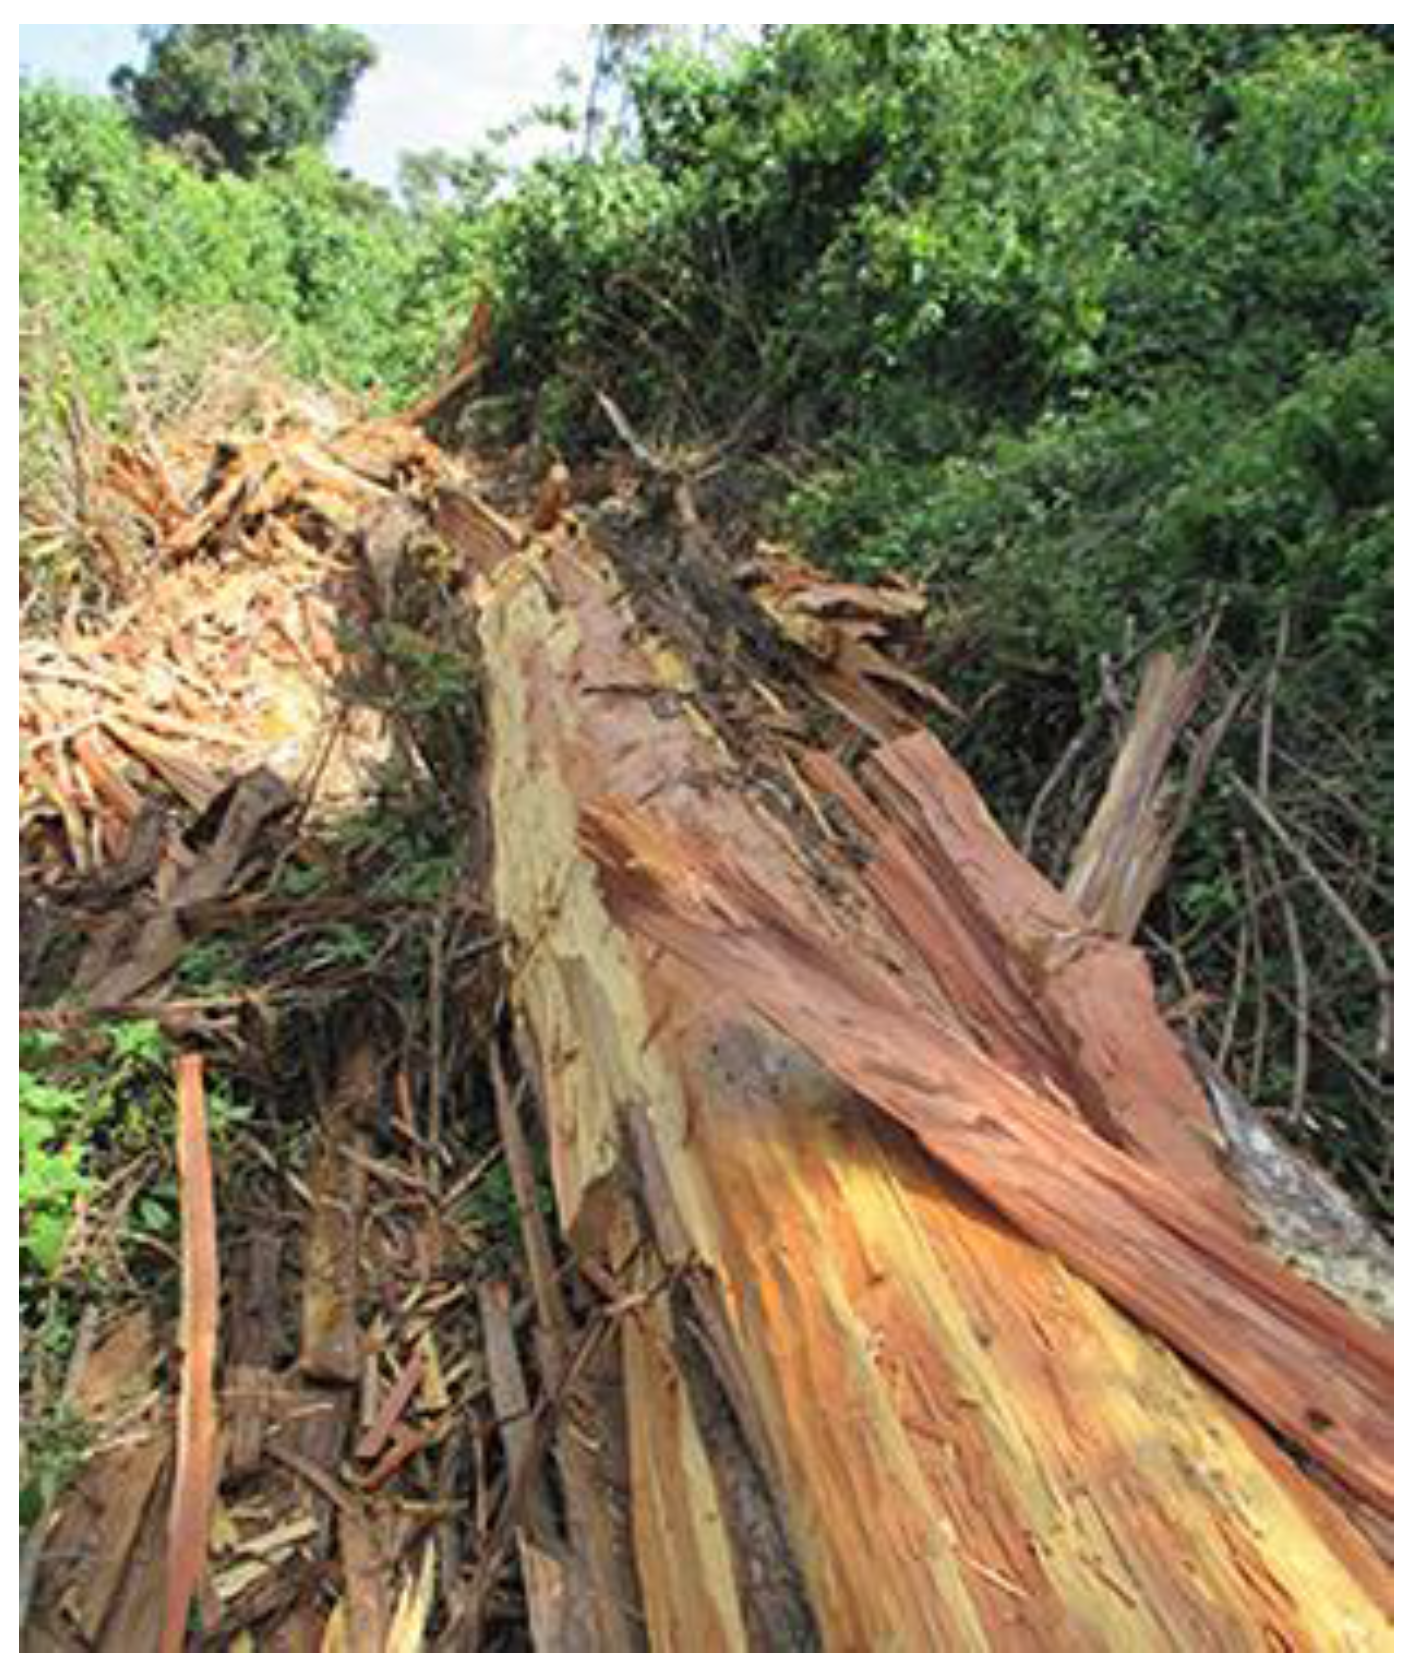
Table 10). The occurrence of illegal logging may be due to the local communities’ heavy dependence on the forest. Rampant illegal logging affects both indigenous and exotic tree species; however, cedar trees have been highly affected by illegal logging due to higher demand for cedar posts by local people. Cedar trees are felled (
Figure 14) and chopped into cedar posts, which local people use to construct both houses and fences.
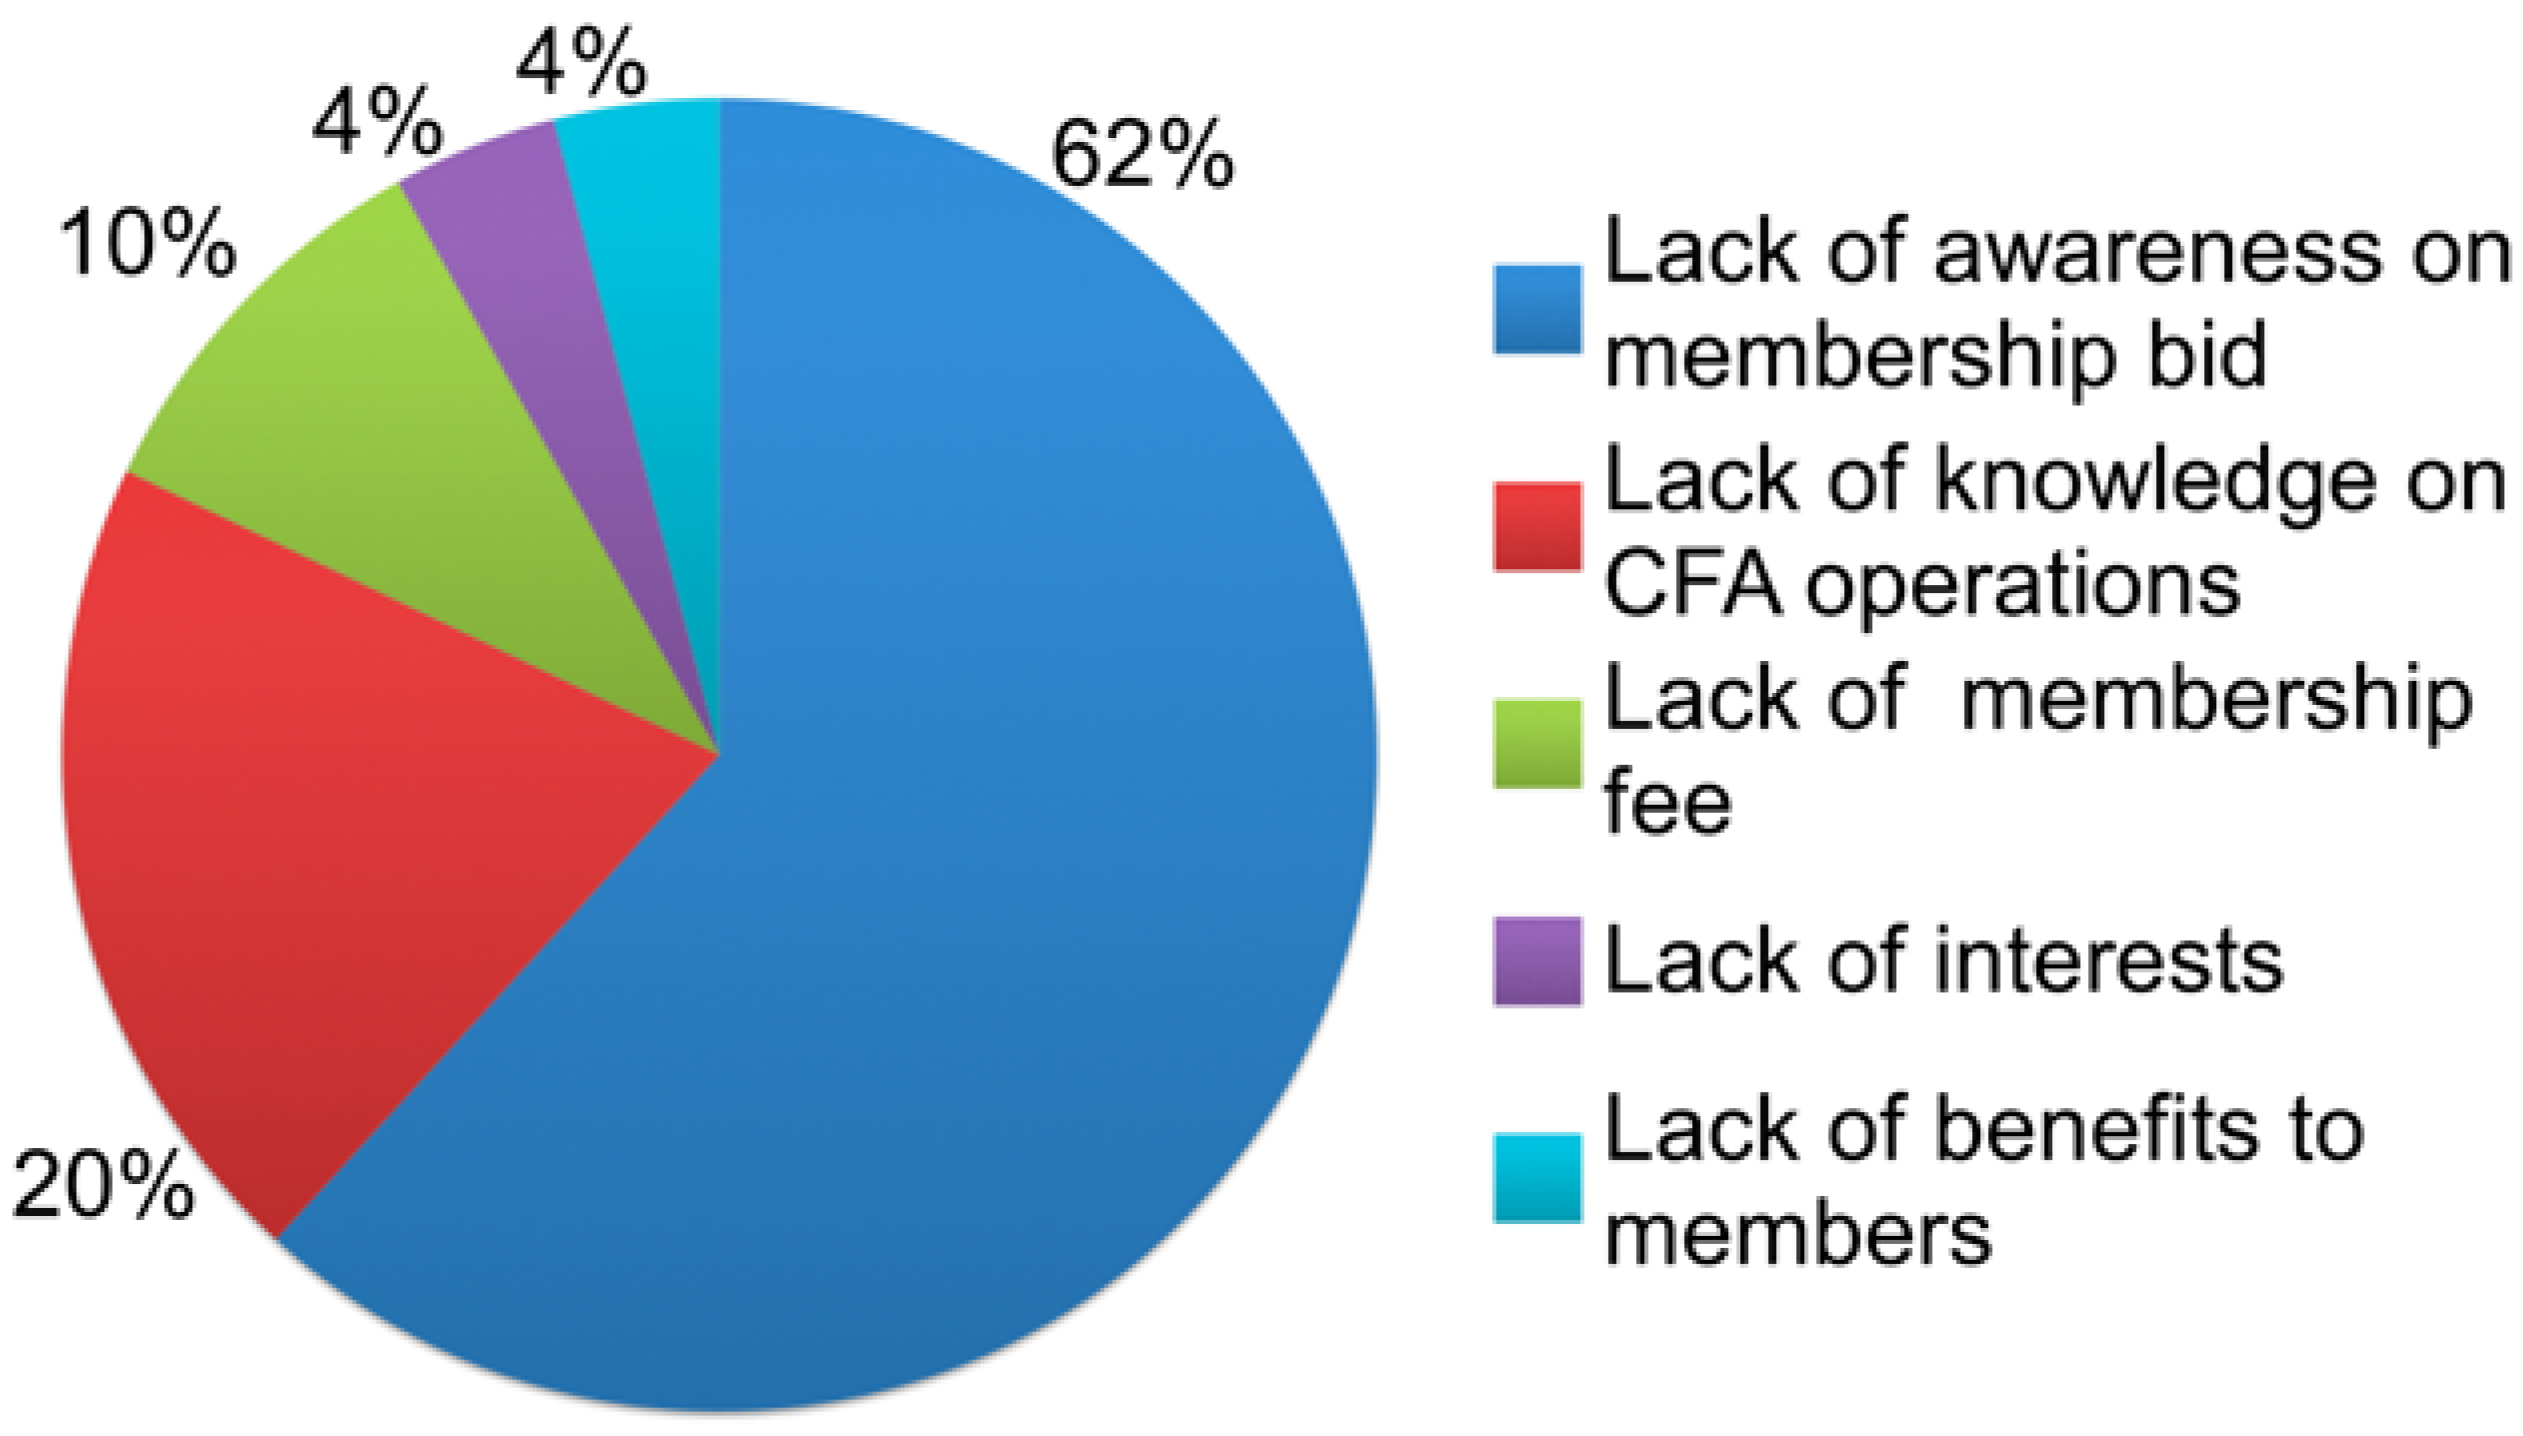
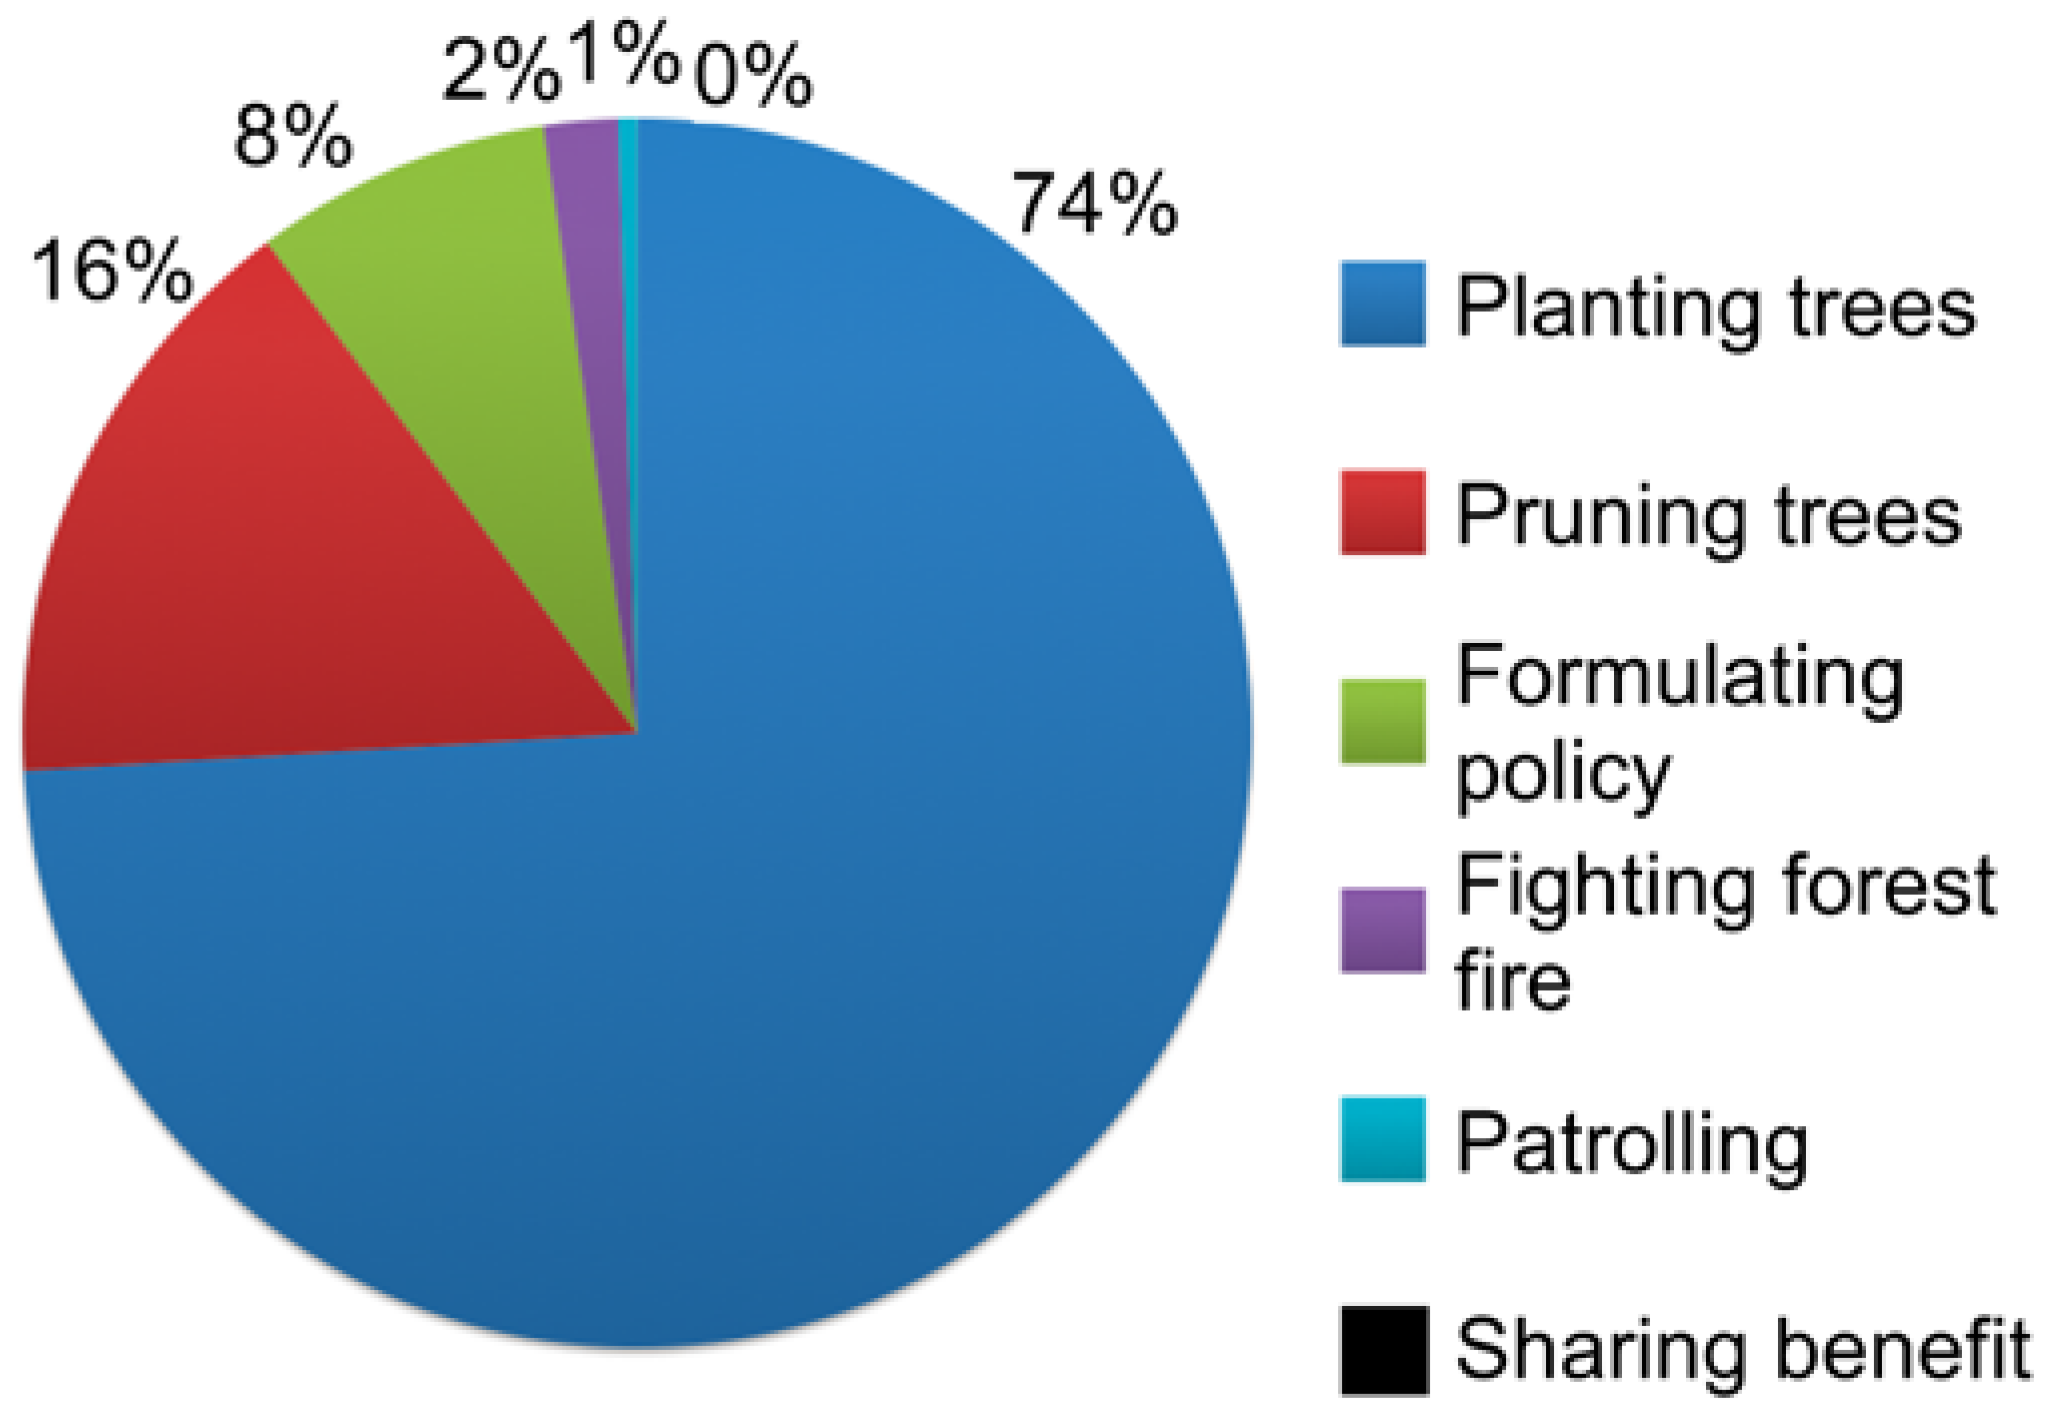
The fight against illegal logging has been hampered by the shortage of KFS personnel and the inability of CFAs to carry out all their mandates as stipulated in the 2005 Forest Act. Although the act empowers the CFAs to manage, protect, and conserve the forests, the members of the three CFAs have not yet participated in forest patrol, as shown in
Figure 11. The operations of the CFAs have been hindered by a number challenges, which include the delay in the signing of the forest agreement, lack of funding, poor leadership, and insufficient power to carry out their mandate. For example, though the CFAs have established user groups, the KFS does the collection of forest revenue from the user groups, thus denying CFAs any chance of accessing forest revenue. The three CFAs, therefore, rely solely on the annual membership fee of one hundred shillings per member and donations, the latter of which are often not forthcoming. Lack of reliable income has hampered CFA operations; for example, LENCOFA and LCCFA tree nurseries are poorly maintained due to lack of funding for hiring staff to manage and maintain the nurseries. Other challenges facing CFAs include leadership conflicts among CFA members and poor record keeping, as made evident by LENCOFA (
Table 9). Although the three CFAs have already developed their respective forest management plans, they have not been empowered to implement their forest management plan, which goes a long way in enhancing sustainable forest conservation and management. Our findings show that these obstacles are not peculiar to this area alone, but CFAs in other parts of the country face similar challenges [
16,
17,
19].
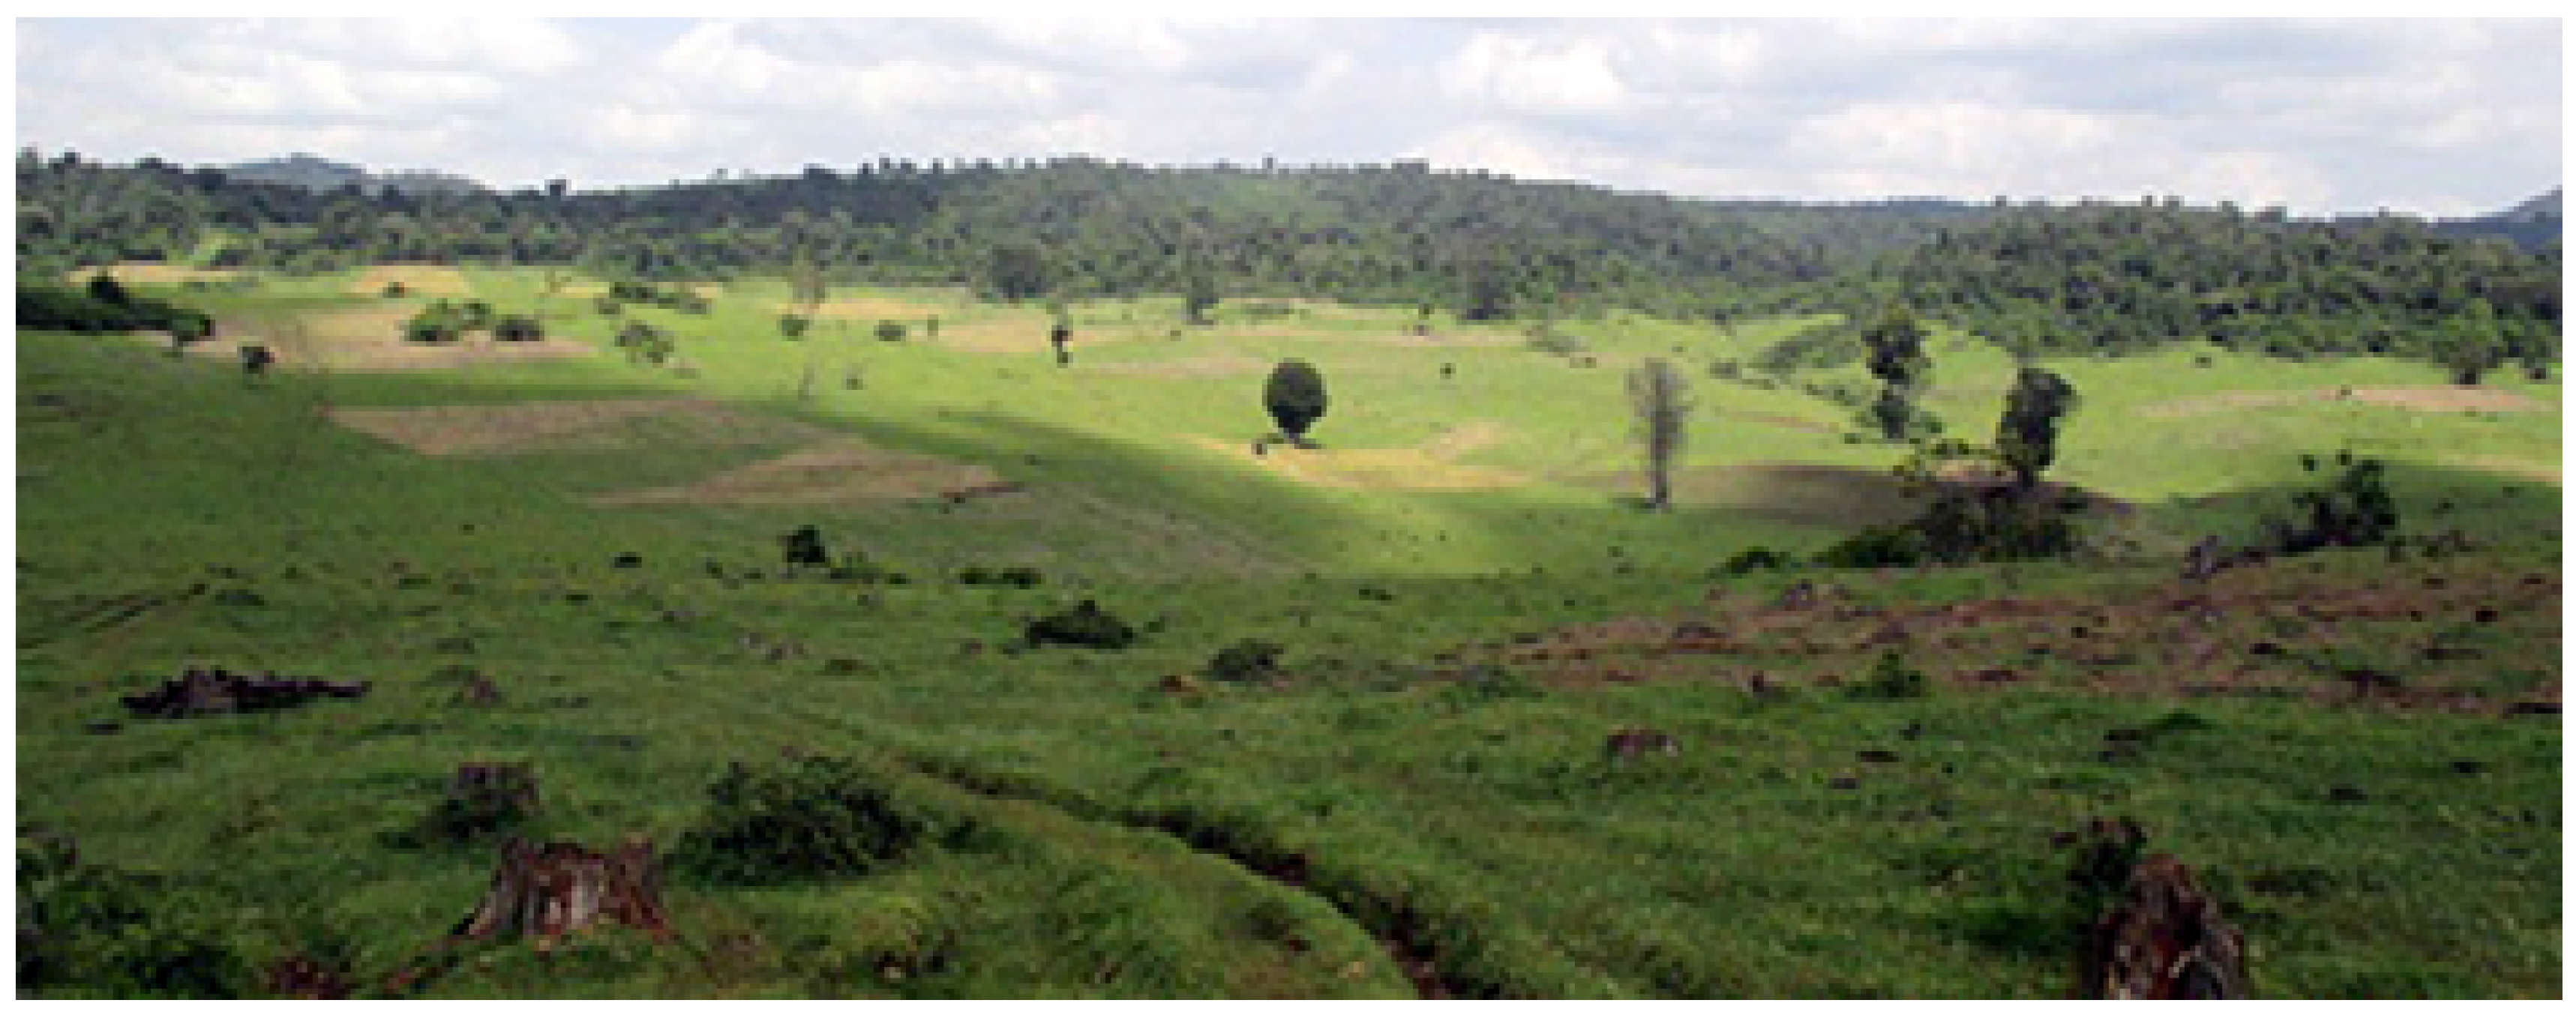
In spite of the challenges, the CFAs have made significant contributions to the development and management of tree plantations in their respective forest blocks. The reforestation programmes carried out by the CFAs received a boost following KFS’ introduction of the PELIS programme. Through the programme, non-forested regions are allocated to CFA members to cultivate and later plant trees. Thus, after CFA members have used the land for agriculture, they provide free labour for planting and maintaining trees within their respective plots. The result is an emergence of plantations in areas initially dominated by grassland (
Figure 12). These findings relate well with other studies that have acknowledged the significant role of CFAs in reforestation programmes [
13,
18,
19].
The three forest blocks of this study show the different changes in forest-cover in the 1st and 2nd periods.
Figure 3,
Figure 4 and
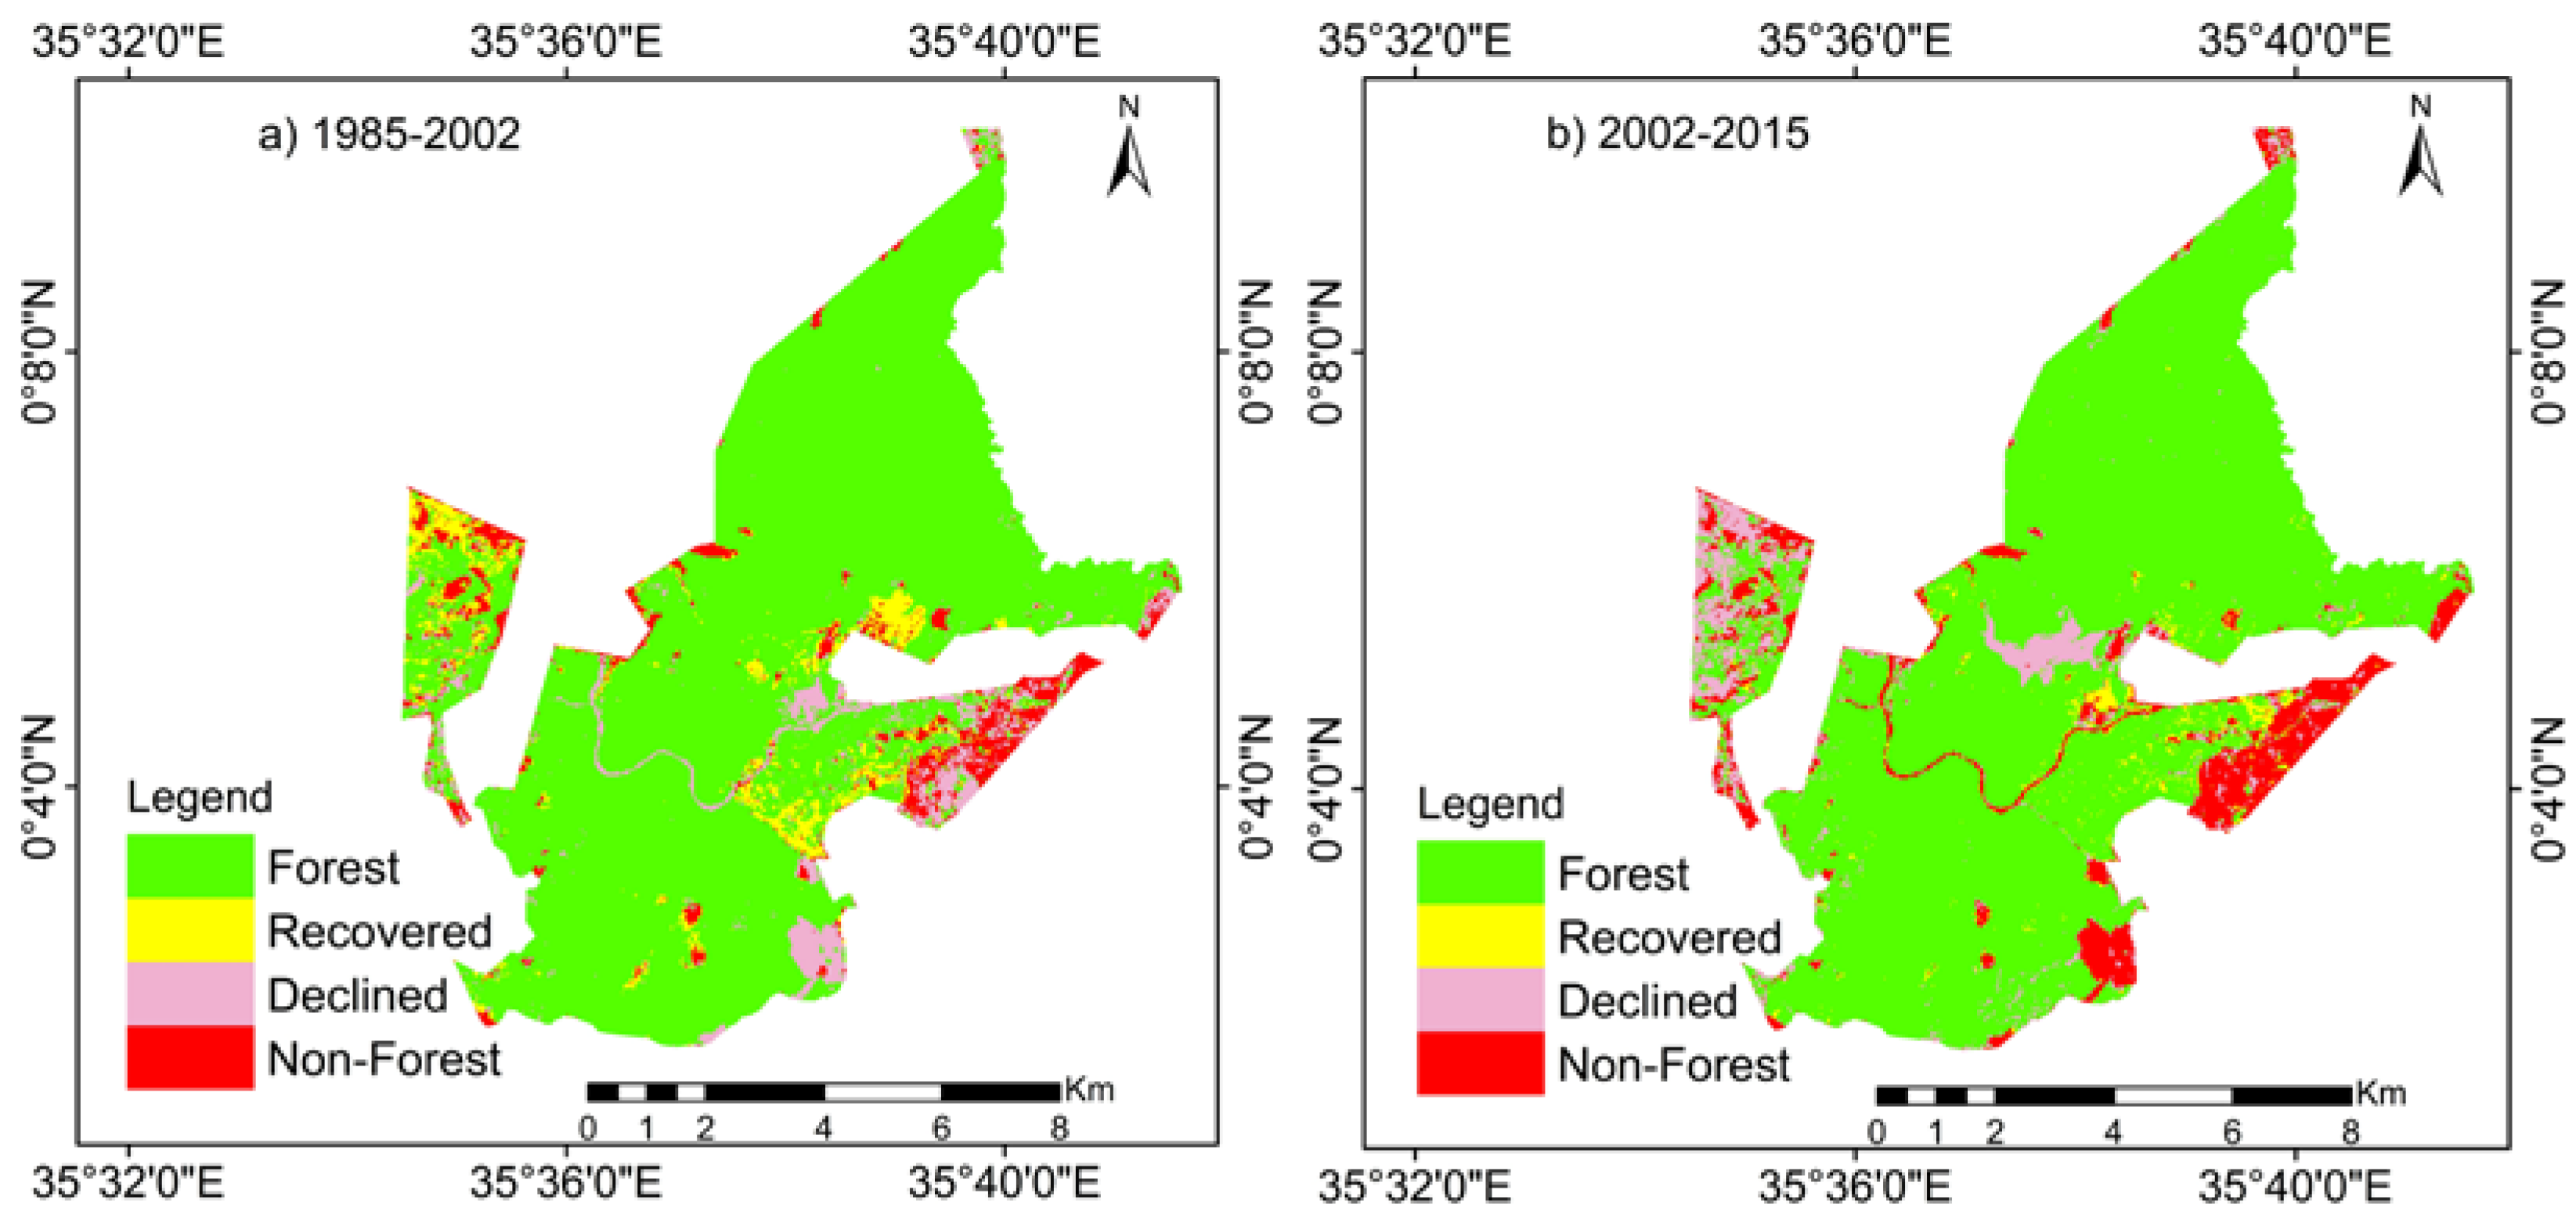
Figure 5 show that more non-forest areas exist in the margins of the blocks, suggesting the need to introduce different types of forestry stewardship measures. In addition,
Figure 5 shows that the Narasha Forest Block suffers from severe fragmentation, suggesting the need for urgent measures. Even though the Lembus Forest as a whole showed a significant decline in the rate of forest-cover, the three forest blocks forming the Lembus Forest have experienced certain variations in their forest-cover change dynamics. For example, forest-cover in the Chemorgok Forest Block has remained stable in both the 1st and 2nd periods, with slight forest recovery slowing the rate of the forest-cover decline in the 2nd period. The increase in the recovery was attributed to the reforestation programme by the CFA as well as natural regeneration. Moreover, the forest block has experienced a decrease in percentage of forest decline in the 2nd period, even with illegal logging and forest encroachments still occurring in the 2nd period. The Chemususu Forest Block, however, revealed a totally different pattern: despite forest-cover remaining dominant in both periods, the percentage of forest decline was higher in the 2nd period compared with that of the 1st period. The increase in the percentage of forest decline resulted from the clearance of forest-cover to pave the way for dam construction in the Chemususu Forest Block. Illegal logging may have also contributed to the decline. Furthermore, our results show that the highly fragmented Narasha Forest Block experienced forest-cover decline to less than 50% of the total land area. In comparison to the Chemorgok and Chemususu Forest blocks, the Narasha Forest Block had the lowest forest-cover and a high percentage of forest-cover decline. Although the percentage of forest decline showed a significant decrease, the percentage of non-forest plantation remains high. The higher rates of illegal logging and forest encroachment may have resulted from high population pressure.
5. Conclusions
The Lembus Forest’s land-cover has been shaped by human activity that includes logging, encroachment, excision, and infrastructural development. To comprehend the impacts resulting from human activity, this study estimated the changes of forest-cover, analysed them, and assessed the dynamics of forest-cover loss occurring in the 1st period (before operation of the PFM) and during the 2nd period (after operation of the PFM). The results clearly reveal a decline in the Lembus Forest-cover in both the 1st and 2nd periods. Nevertheless, the annual rate of forest-cover loss significantly decreased from the initial annual rate of 0.4% in the 1st period to 0.2% in the 2nd period. The drastic decline in the rate of forest-cover loss may have resulted from reforestation programmes carried out by CFA members in the 2nd period. Although CFA members have actively participated in reforestation programmes, other equally important CFA roles have not yet been fully implemented in all three forest blocks due to delays in signing forest management agreements between the CFAs and KFS. In addition, the CFAs face a number of challenges, including a lack of funding and leadership conflicts, both of which have hindered the effectiveness and efficiency of CFAs in the management and conservation of forests.


